Young people’s political participation: a comparative overview across Europe LLAKES Research...
53
Young people’s political participation: a comparative overview across Europe LLAKES Research Conference 2015 ‘The crisis for contemporary youth’ Gema M. García Albacete Universidad Carlos III de Madrid [email protected]
-
Upload
aubrey-warren -
Category
Documents
-
view
213 -
download
0
Transcript of Young people’s political participation: a comparative overview across Europe LLAKES Research...

Young people’s political participation: a comparative overview across Europe
LLAKES Research Conference 2015 ‘The crisis for contemporary youth’
Gema M. García AlbaceteUniversidad Carlos III de [email protected]

Research questions:
1) What’s distinctive of young people’s political participation at the beginning of the twenty-first century?
Apathy/cynicism vs. critical citizens
2) And if they participate differently, why?

Main conclusions:
YP participate less – and no longer participate more than adults in protest activities
Lower participation can be explained by a combination of cohort and life cycle effects in most countries
The transition to adulthood is a critical period …
… and thus the structural conditions in which young people come to age

Two tools to compare: participation and age across countries, life stages and time
Young people’s political participation in Europe
A new political generation?
- attitudes
- attitudes behavior
Structural conditions:
- the economic crisis

What’s distinctive of young people’s political participation at the beginning of the twenty-first century?
Limitations available research
• Emphasis in single modes of participation
• Lack of cross-national studies• Lack of longitudinal studies• Absence of comparisons to adults• Ambiguous usage of the concept
«age»
Propositions
1. Political participation measurement:Development of cross-national
and longitudinally valid instrument to measure political participationInstitutional and non-institutional participation
Equivalent measures of political participationIntroduction
Young people’s political participationExplanationsConclusions

What’s distinctive of young people’s political participation at the beginning of the twenty-first century?
Limitations available research
• Emphasis in single modes of participation
• Lack of cross-national studies• Lack of longitudinal studies• Absence of comparisons to adults• Ambiguous usage of the concept
«age»
Propositions
1. Political participation measurement:Development of cross-national
and longitudinally valid instrument to measure political participationInstitutional and non-institutional participation
2. What is “being young”?Development of meaningful
demarcation lines between youth and adulthood Major markers of the transition to adulthood and their changes across time, countries and gender
IntroductionYoung people’s political participation
ExplanationsConclusions
Youth and adulthood life stages

What’s distinctive of young people’s political participation at the beginning of the twenty-first century?
IntroductionYoung people’s political participation
ExplanationsConclusions
Results

IntroductionYoung people’s political participation
ExplanationsConclusions
Results

IntroductionYoung people’s political participation
ExplanationsConclusions
Results
0.0
0.1
0.2
0.3
0.4
0.5
0.0
0.1
0.2
0.3
0.4
0.5
0.0
0.1
0.2
0.3
0.4
0.5
0.0
0.1
0.2
0.3
0.4
0.5
Young Adult Young Adult Young Adult
Young Adult Young Adult
Austria Belgium Switzerland Germany Denmark
Spain Finland France United Kingdom Greece
Ireland Italy Luxembourg The Netherlands Norway
Portugal Sweden
Institu
tion
al pa
rtic
ipa
tio
n
Life stage
Error bars represent 95% CI

0.0
0.1
0.2
0.3
0.4
0.5
0.0
0.1
0.2
0.3
0.4
0.5
0.0
0.1
0.2
0.3
0.4
0.5
0.0
0.1
0.2
0.3
0.4
0.5
Young Adult Young Adult Young Adult
Young Adult Young Adult
Austria Belgium Switzerland Germany Denmark
Spain Finland France United Kingdom Greece
Ireland Italy Luxembourg The Netherlands Norway
Portugal Sweden
Non
-in
stitu
tio
na
l pa
rtic
ipation
Life stage
Error bars represent 95% CI
0.00.10.20.30.40.5
0.00.10.20.30.40.5
0.00.10.20.30.40.5
0.00.10.20.30.40.5
0.00.10.20.30.40.5
0.00.10.20.30.40.5
0.00.10.20.30.40.5
Young Adult
Young Adult Young Adult
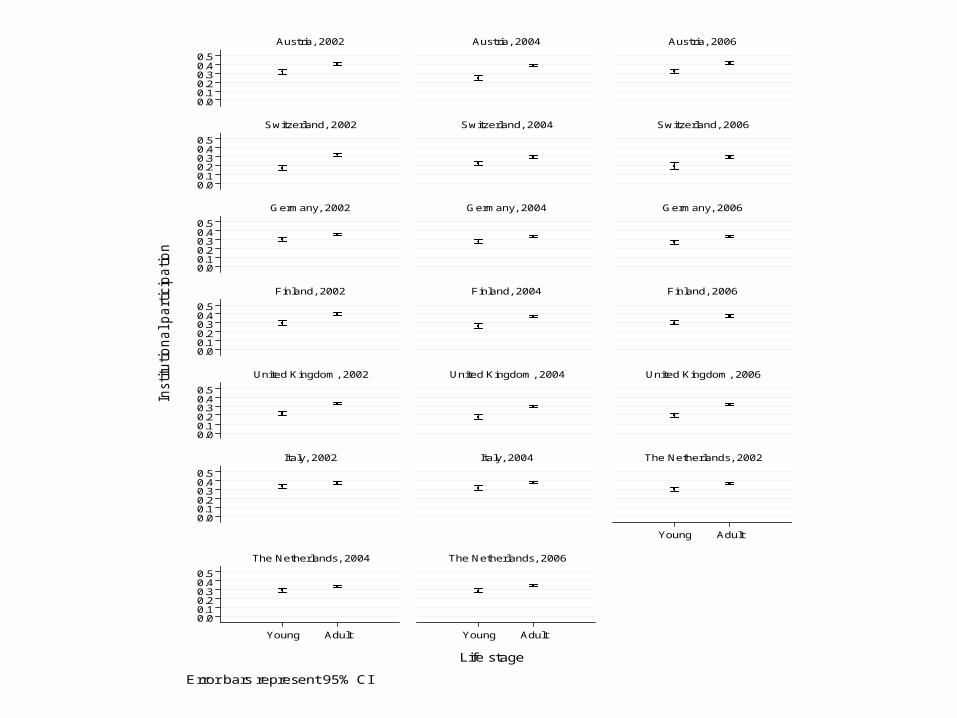
Austria, 2002 Austria, 2004 Austria, 2006
Switzerland, 2002 Switzerland, 2004 Switzerland, 2006
Germany, 2002 Germany, 2004 Germany, 2006
Finland, 2002 Finland, 2004 Finland, 2006
United Kingdom, 2002 United Kingdom, 2004 United Kingdom, 2006
Italy, 2002 Italy, 2004 The Netherlands, 2002
The Netherlands, 2004 The Netherlands, 2006
Institu
tio
na
l p
art
icip
atio
n
Life stage
Error bars represent 95% CI

0.00.10.20.30.40.5
0.00.10.20.30.40.5
0.00.10.20.30.40.5
0.00.10.20.30.40.5
0.00.10.20.30.40.5
0.00.10.20.30.40.5
0.00.10.20.30.40.5
Young Adult
Young Adult Young Adult
Austria, 2002 Austria, 2004 Austria, 2006
Switzerland, 2002 Switzerland, 2004 Switzerland, 2006
Germany, 2002 Germany, 2004 Germany, 2006
Finland, 2002 Finland, 2004 Finland, 2006
United Kingdom, 2002 United Kingdom, 2004 United Kingdom, 2006
Italy, 2002 Italy, 2004 The Netherlands, 2002
The Netherlands, 2004 The Netherlands, 2006
No
n-in
stitu
tio
na
l P
art
icip
atio
n
Life stage
Error bars represent 95% CI

Do young people participate less due to distinctive cohort characteristics or due to a delayed and more complicated transition to adulthood?
Age Young people participate less because…
Cohort … of distinctive cohort characteristics given the social and political context in which they were socialized
Generation … they constitute political generations shaped by the concrete political events taking place during their formative years
Life-cycle … of they life cycle stage in which they are
Age and political participationIntroduction
Young people’s political participationExplanations
Conclusions

Do young people participate less due to distinctive cohort characteristics or due to a delayed and more complicated transition to adulthood?
Age Societal transformations Expectations
Cohort
Education, media Sophisticated critical citizens
Money-driven politics, lack of attention from parties
Politically alienated
Professionalization of political parties
Lack mobilization networks
Life-style politics, welfare state recession, labor market Individualistic
Generation Country-specific events Diverse developments across countries
Political generations and cohortsIntroduction
Young people’s political participationExplanations
Conclusions

Do young people participate less due to distinctive cohort characteristics or due to a delayed and more complicated transition to adulthood?
Age Societal transformations Expectations Results
Cohort
Education, media Sophisticated critical citizens More continuity than change
Cohort characteristics
Remaining gap to explain
Money-driven politics, lack of attention from parties
Politically alienated
Professionalization of political parties
Lack mobilization networks
Life-style politics, welfare state recession, labor market Individualistic
Generation Country-specific events Diverse developments across countries
IntroductionYoung people’s political participation
ExplanationsConclusions
Political generations and cohorts

Interest in politics (1980-2008)
1973197719811985198919931997200120052009
1973197719811985198919931997200120052009
1973197719811985198919931997200120052009
-0.5 0.0 0.5 1.0
-0.5 0.0 0.5 1.0 -0.5 0.0 0.5 1.0 -0.5 0.0 0.5 1.0 -0.5 0.0 0.5 1.0 -0.5 0.0 0.5 1.0
Austria Belgium Switzerland Germany Denmark Spain
Finland France United Kingdom Greece Ireland Italy
Luxembourg The Netherlands Norway Portugal Sweden
Ye
ar
Young people's difference in political interest from adults

Political trust: confidence in political parties (1980-2008)
1980
1984
1988
1992
1996
2000
2004
2008
1980
1984
1988
1992
1996
2000
2004
2008
1980
1984
1988
1992
1996
2000
2004
2008
-0.5 0.0 0.5 1.0
-0.5 0.0 0.5 1.0 -0.5 0.0 0.5 1.0 -0.5 0.0 0.5 1.0 -0.5 0.0 0.5 1.0 -0.5 0.0 0.5 1.0
Austria Belgium Switzerland Germany Denmark Spain
Finland France United Kingdom Greece Ireland Italy
Luxembourg The Netherlands Norway Portugal Sweden
Ye
ar
Young people's difference in confidence in parliament from adults

Marginal effect of being young on institutional and non-institutional participation across levels of political interest in Denmark
-0.1
0.1
0.2
0
Mar
gina
l effe
ct o
f bei
ng y
oung
1 2 3 4
Interest in politics
Institutional participation
-0.1
0.1
0.2
0
Mar
gina
l effe
ct o
f bei
ng y
oung
1 2 3 4
Interest in politics
Non-institutional participation

Do young people participate less due to distinctive cohort characteristics or due to a delayed and more complicated transition to adulthood?
Age Societal transformations Expectations Results
Cohort
Education, media Sophisticated critical citizens More continuity than change
Cohort characteristics
Remaining gap to explain
Money-driven politics, lack of attention from parties
Politically alienated
Professionalization of political parties
Lack mobilization networks
Life-style politics, welfare state recession, labor market Individualistic
Generation Country-specific events Diverse developments across countries
Life-cycle Longer transition to adulthood Delay in political «start up»
Life stage
IntroductionYoung people’s political participation
ExplanationsConclusions

Do young people participate less due to distinctive cohort characteristics or due to a delayed and more complicated transition to adulthood?
Age Societal transformations Expectations Results
Cohort
Education, media Sophisticated critical citizens More continuity than change
Cohort characteristics
Remaining gap to explain
Money-driven politics, lack of attention from parties
Politically alienated
Professionalization of political parties
Lack mobilization networks
Life-style politics, welfare state recession, labor market Individualistic
Generation Country-specific events Diverse developments across countries
Life-cycle Longer transition to adulthood Delay in political «start up»
IntroductionYoung people’s political participation
ExplanationsConclusions
Changes in the transition to adulthood. Some results

Continuity or change?
Continuity or generational change?
Change:
- Lower levels of interest in politics and weaker relationship to political parties in some countries
- Structural conditions in which young people come to age
Continuity:
- Young people are not reinventing political activism
- Young people are not particularly critical or alienated from the political system
- Their levels and modes of participation are to a larger extent due to their stage in life
IntroductionYoung people’s political participation
ExplanationsConclusions
The effect of the economic crisis on young people’s political participation in Spain
LLAKES Research Conference 2015 ‘The crisis for contemporary youth’
Gema García- AlbaceteJavier LorenteIrene Martín

Conclusions
- Against our expectations, we find larger changes among those in the age group 25 to 36
- Potential explanations: - Life cycle- More aware of the impact of the crisis- Expectations

Satisfaction with democracy, average marginal effects, age and year, 2006 and 2012
3
4
5
6
7
18 to 25 26 to 35 36 to 45 46 to 55 56 to 65
Age
Germany
3
4
5
6
7
18 to 25 26 to 35 36 to 45 46 to 55 56 to 65
Age
Spain
3
4
5
6
7
18 to 25 26 to 35 36 to 45 46 to 55 56 to 65
Age
Italy
2006 2012

Institutional participation (electoral turnout), average marginal effects, age and year
.4
.6
.8
1
18 to 25 26 to 35 36 to 45 46 to 55 56 to 65
Age
Germany
.4
.6
.8
1
18 to 25 26 to 35 36 to 45 46 to 55 56 to 65
Age
Spain
.4
.6
.8
1
18 to 25 26 to 35 36 to 45 46 to 55 56 to 65
Age
Italy
2006 2012

.2
.3
.4
.5
18 to 25 26 to 35 36 to 45 46 to 55 56 to 65
Age
Germany
.2
.3
.4
.5
18 to 25 26 to 35 36 to 45 46 to 55 56 to 65
Age
Spain
.2
.3
.4
.5
18 to 25 26 to 35 36 to 45 46 to 55 56 to 65
Age
Italy
2006 2012
Non-institutional participation, average marginal effects, age and year

Trust in political parties across age and over time (2002-2011)

Conclusions- Against our expectations, we find larger changes among those
in the age group 25 to 36
- Potential explanations: - Life cycle- More aware of the impact of the crisis- Expectations
- In general, change seems positive, disaffection results in protest
- However, social inequalities (unemployment) are resulting in political inequalities
- New gap among young people according to their occupational status: apathy vs. critical citizens

Non-institutional participation, contrast unemployed across age and over time, Spain
-.5
0
.5
1
18-25 26 to 35 36 to 45 46- 55 56-6518 to 25 26 to 35 36 to 45 46 to 55 56 to 65
2006 2012
Cont
rast
s of
Pr(
Non
-insti
tutio
nal p
artic
ipati
on)
Age
Spain

-.5
0
.5
1
18-25 26 to 35 36 to 45 46 to 55 56-6518 to 25 26 to 35 36 to 45 46 to 55 56 to 65
2004 2012
Cont
rast
s of P
r(N
on-in
stitu
tiona
l par
ticip
ation
)
Age
Italy
Non-institutional participation, contrast unemployed across age and over time, Italy

-.5
0
.5
18 to 25 26 to 35 36 to 45 46 to 55 56 to 6518 to 25 26 to 35 36 to 45 46 to 55 56 to 65
Dissatisfied Satisfied
Co
ntr
asts
of
Pro
test
Age
Spain - 2012
Non-institutional participation, contrast unemployed across age by satisfaction, Spain

Conclusions- Against our expectations, we find larger changes among those
in the age group 25 to 36
- Potential explanations: - Life cycle- More aware of the impact of the crisis- Expectations
- In general, change seems positive, disaffection results in protest
- However, social inequalities (unemployment) are resulting in political inequalities
- New gap among young people according to their occupational status: apathy vs. critical citizens
- Relevance of the political supply: comparison between Italy and Spain, or changes in Spain 2012-2015

Final note:
Young people changing the political parties system?
2011
2015

Final note:
Young people changing the political parties system?
18-24 25-34 35-44 45-54 55-64 65+ Total0
10
20
30
40
50
60
70
80
Vote intention + support CIS3080 (april 2015)
PP PSOE IU Podemos Ciudadanos Ciudadanos

Thank you for your attention!

Participation in demonstrations across age and over time (2002-2011)

Changes in the transition to adulthood. Some results
IntroductionYoung people’s political participation
ExplanationsConclusions
-.2
-.1
0.1
.2
Europe Austria Belgium Germany
-.2
-.1
0.1
.2
Denmark Spain Finland France
-.2
-.1
0.1
.2
United Kingdom Greece Ireland
0 1 2 3 4 5
Italy
-.2
-.1
0.1
.2
0 1 2 3 4 5
TheNetherlands
0 1 2 3 4 5
Portugal
0 1 2 3 4 5
Sweden
Dashed lines give 95% confidence interval
Transition to adulthood as a process: Number of events completed
Marginal effects of being young on institutional political participation as respondents move forward in the transition to adulthood, 2002

1. Direct positive effect2. No effect3. Short term disruptive
effect and long term positive effect
4. Differences across gender
Transition to adulthood and institutional participation:
-.05
0
.05
.1
.15
Mar
gin
al e
ffec
t o
f w
ork
on
inst
itutio
nal p
art
icip
atio
n
20 30 40 50 60Age
Dashed lines give 95% confidence interval.
Austria
IntroductionYoung people’s political participation
ExplanationsConclusions
Changes in the transition to adulthood. Some results

1. Direct positive effect2. No effect3. Short term disruptive
effect and long term positive effect
4. Differences across gender
Transition to adulthood and institutional participation:
-.04
-.02
0
.02
.04
.06
Mar
gin
al e
ffec
t o
f w
ork
on
inst
itutio
nal p
art
icip
atio
n
20 30 40 50 60Age
Dashed lines give 95% confidence interval.
Netherlands
IntroductionYoung people’s political participation
ExplanationsConclusions
Changes in the transition to adulthood. Some results

1. Direct positive effect2. No effect3. Short term disruptive
effect and long term positive effect
4. Differences across gender
Transition to adulthood and institutional participation:
-.05
0
.05
.1
Mar
gin
al e
ffec
t o
f w
ork
on
inst
itutio
nal p
art
icip
atio
n
20 30 40 50 60Age
Dashed lines give 95% confidence interval.
Germany
IntroductionYoung people’s political participation
ExplanationsConclusions
Changes in the transition to adulthood. Some results
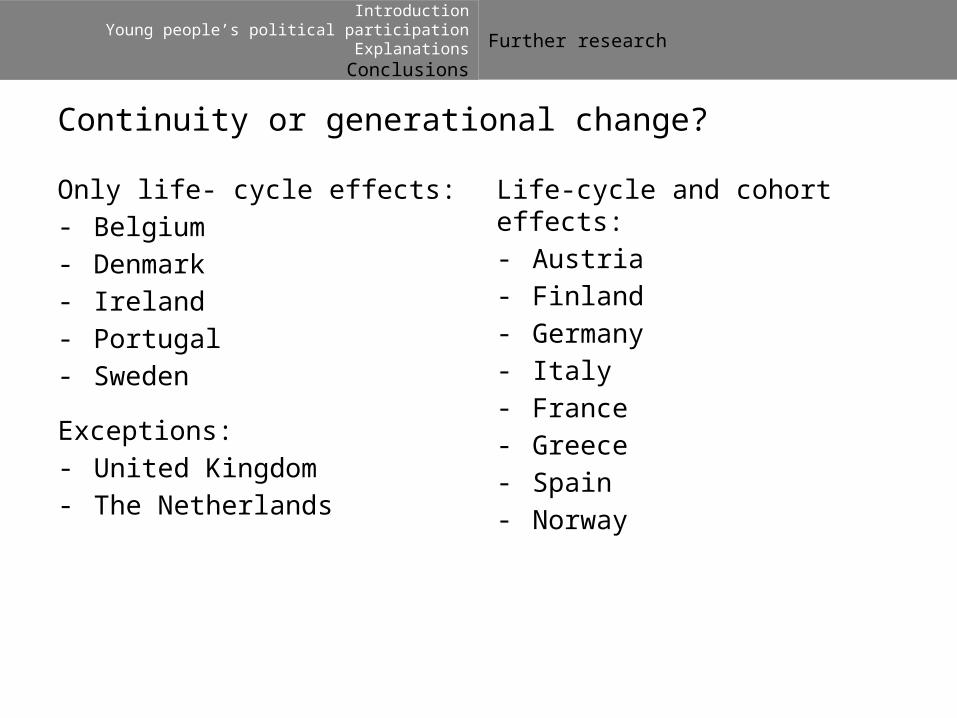
Further research
Continuity or generational change?
Only life- cycle effects:- Belgium- Denmark- Ireland- Portugal- Sweden
Life-cycle and cohort effects:- Austria- Finland- Germany- Italy- France- Greece - Spain- Norway
Exceptions:- United Kingdom- The Netherlands
IntroductionYoung people’s political participation
ExplanationsConclusions

0
.1
.2
.3
.4
.5
0
.1
.2
.3
.4
.5
0
.1
.2
.3
.4
.5
0
.1
.2
.3
.4
.5
Young Adult Young Adult Young Adult
Young Adult Young Adult
Austria Belgium Switzerland Germany Denmark
Spain Finland France United Kingdom Greece
Ireland Italy Luxembourg Netherlands Norway
Portugal Sweden
Inst
itutio
nal p
art
icip
atio
n
Life stage
Error bars represent 95% CI
IntroductionYoung people’s political participation
ExplanationsConclusions
Results

43 /
Institutional participation and age in seven European countries, 1974 and 2002

44 /
Non- institutional participation and age in seven European countries, 1974 and 2002

45 /
Woman
Woman work
Man
Man work
Woman
Woman work
Man
Man work
Woman
Woman work
Man
Man work
.1 .2 .3 .4
.1 .2 .3 .4 0.1 0.2 0.3 0.4 0.1 0.2 0.3 0.4 0.1 0.2 0.3 0.4 0.1 0.2 0.3 0.4
Austria Belgium Switzerland Germany Denmark Spain
Finland France United Kingdom Greece Ireland Italy
Luxembourg The Netherlands Norway Portugal Sweden
95% CI Simulated expected values
Institutional participation: Predicted values
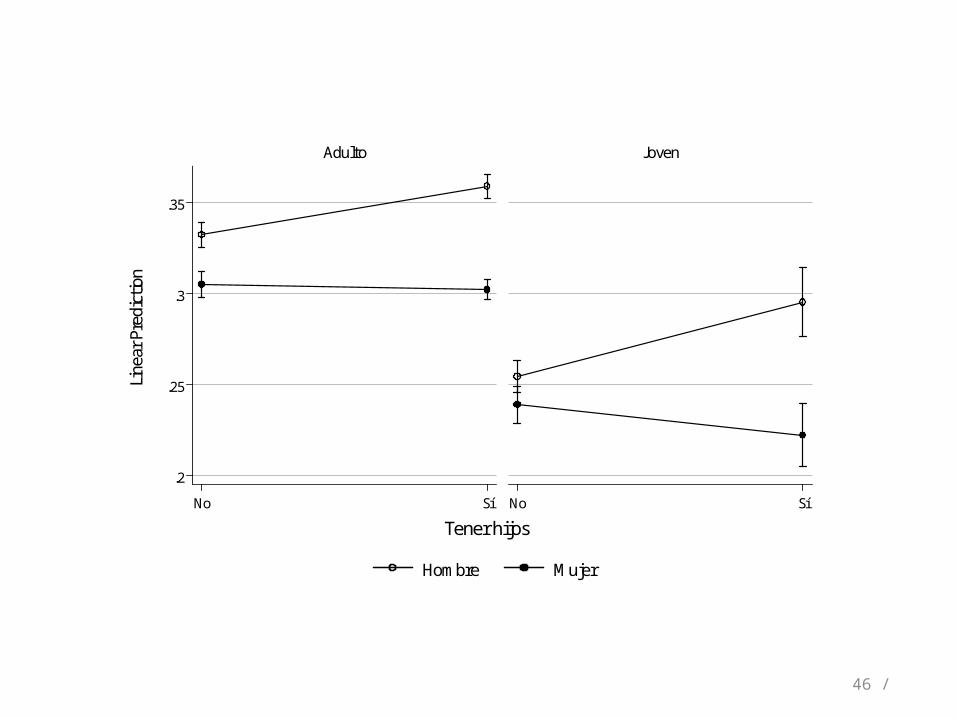
46 /
.2
.25
.3
.35
No Sí No Sí
Adulto Joven
Hombre Mujer
Line
ar P
redi
ction
Tener hijos

47 /
-.2
0
.2
.4
0 1 2 3 4 5 0 1 2 3 4 5
Adulto Joven
Hombre Mujer
Line
ar P
redi
ction
Número de eventos completados en la transición a la vida adulta

48 /
.4
.6
.8
1
1.2
1.4
No job 1 2-3 3-5 5-10 >10
Austria
.4
.6
.8
1
1.2
1.4
No job 1 2-3 3-5 5-10 >10
Belgium
.4
.6
.8
1
1.2
1.4
No job 1 2-3 3-5 5-10 >10
Switzerland
.4
.6
.8
1
1.2
1.4
No job 1 2-3 3-5 5-10 >10
Germany
.4
.6
.8
1
1.21.4
No job 1 2-3 3-5 5-10 >10
Denmark
.4
.6
.8
1
1.21.4
No job 1 2-3 3-5 5-10 >10
Spain
.4
.6
.8
1
1.21.4
No job 1 2-3 3-5 5-10 >10
Finland
.4
.6
.8
1
1.21.4
No job 1 2-3 3-5 5-10 >10
France
.4
.6
.8
11.2
1.4
No job 1 2-3 3-5 5-10 >10
United Kingdom
.4
.6
.8
11.2
1.4
No job 1 2-3 3-5 5-10 >10
Ireland
.4
.6
.8
11.2
1.4
No job 1 2-3 3-5 5-10 >10
TheNetherlands
.4
.6
.8
11.2
1.4
No job 1 2-3 3-5 5-10 >10
Norway
.4
.6
.81
1.2
1.4
No job 1 2-3 3-5 5-10 >10
Portugal
.4
.6
.81
1.2
1.4
No job 1 2-3 3-5 5-10 >10
Sweden

49 /
.5
1
1.5
2
No child 1 2-3 3-5 5-10 >10
Austria
.5
1
1.5
2
No child 1 2-3 3-5 5-10 >10
Belgium
.5
1
1.5
2
No child 1 2-3 3-5 5-10 >10
Switzerland
.5
1
1.5
2
No child 1 2-3 3-5 5-10 >10
Germany
.5
1
1.5
2
No child 1 2-3 3-5 5-10 >10
Denmark
.5
1
1.5
2
No child 1 2-3 3-5 5-10 >10
Spain
.5
1
1.5
2
No child 1 2-3 3-5 5-10 >10
Finland
.5
1
1.5
2
No child 1 2-3 3-5 5-10 >10
France
.5
1
1.5
2
No child 1 2-3 3-5 5-10 >10
United Kingdom
.5
1
1.5
2
No child 1 2-3 3-5 5-10 >10
Ireland
.5
1
1.5
2
No child 1 2-3 3-5 5-10 >10
TheNetherlands
.5
1
1.5
2
No child 1 2-3 3-5 5-10 >10
Norway
.5
1
1.5
2
No child 1 2-3 3-5 5-10 >10
Portugal
.5
1
1.5
2
No child 1 2-3 3-5 5-10 >10
Sweden
male female

Cambio en actitudes políticas y participación en función de la edad
3
3.2
3.4
3.6
3.8
4
LOW
ES
S C
onfia
nza
en p
artid
os p
olíti
cos
20 40 60 80 100Edad
20022007
2011
Los cambios son más pronunciados entre los jóvenes, pero no entre los más jóvenes.
Confirmación de que los cambios son mayores para el grupo de 25-36 años
-.1
0
.1
.2
.3
.4
LOW
ES
S F
irma
de p
etic
ione
s
20 40 60 80 100Edad
20022007
2011

Y, ¿los jóvenes desempleados?
Nueva brecha entre jóvenes empleados y no desempleados, que no surge para otros grupos de edad:
2.5
3
3.5
4
4.5
2.5
3
3.5
4
4.5
18-25 26-35 36-45 46-55 56-65
18-25 26-35 36-45 46-55 56-65
2002 2007
2011a
Other situations Unemployed
Line
ar P
redi
ction
. Tru
st in
pol
itica
l par
ties
Age groups

.2
.4
.6
.8
18-25 26-35 36-45 46-55 56-6518-25 26-35 36-45 46-55 56-65
2007 2011b
Other situations Unemployed
Pr(P
arty
iden
tifica
tion)
Age groups
Identificación partidista
Encontramos esta nueva brecha en actitudes y comportamientos políticos relacionados con partidos políticos y el proceso electoral: confianza en los partidos, identificación partidista, voto y firma de peticiones.

-0.1
0.1
0.2
0
Ma
rgin
al e
ffect of b
ein
g y
oun
g
1 2 3 4
Interest in politics
Institutional participation
-0.1
0.1
0.2
0
Ma
rgin
al e
ffect of b
ein
g y
oun
g
1 2 3 4
Interest in politics
Non-institutional participation