You should be able to: 1. Discuss the behavioral aspects of projects in terms of project personnel...
72
Chapter 17: Learning Objectives You should be able to: 1. Discuss the behavioral aspects of projects in terms of project personnel and the project manager 2. Explain the nature and importance of a work breakdown structure in project management 3. Give a general description of PERT/CPM techniques 4. Construct simple network diagrams 5. List the kinds of information that a PERT or CPM analysis can provide 6. Analyze networks with deterministic times 7. Analyze networks with probabilistic times 8. Describe activity ‘crashing’ and solve typical problems 17-1
-
Upload
kelvin-felice -
Category
Documents
-
view
214 -
download
0
Transcript of You should be able to: 1. Discuss the behavioral aspects of projects in terms of project personnel...
Chapter 17: Learning ObjectivesYou should be able to:
1. Discuss the behavioral aspects of projects in terms of project personnel and the project manager
2. Explain the nature and importance of a work breakdown structure in project management
3. Give a general description of PERT/CPM techniques4. Construct simple network diagrams5. List the kinds of information that a PERT or CPM analysis
can provide6. Analyze networks with deterministic times7. Analyze networks with probabilistic times8. Describe activity ‘crashing’ and solve typical problems
17-1
ProjectsProjects
Unique, one-time operations designed to accomplish a specific set of objectives in a limited time frame
Examples:The Olympic GamesProducing a movieSoftware developmentProduct developmentERP implementation
17-2
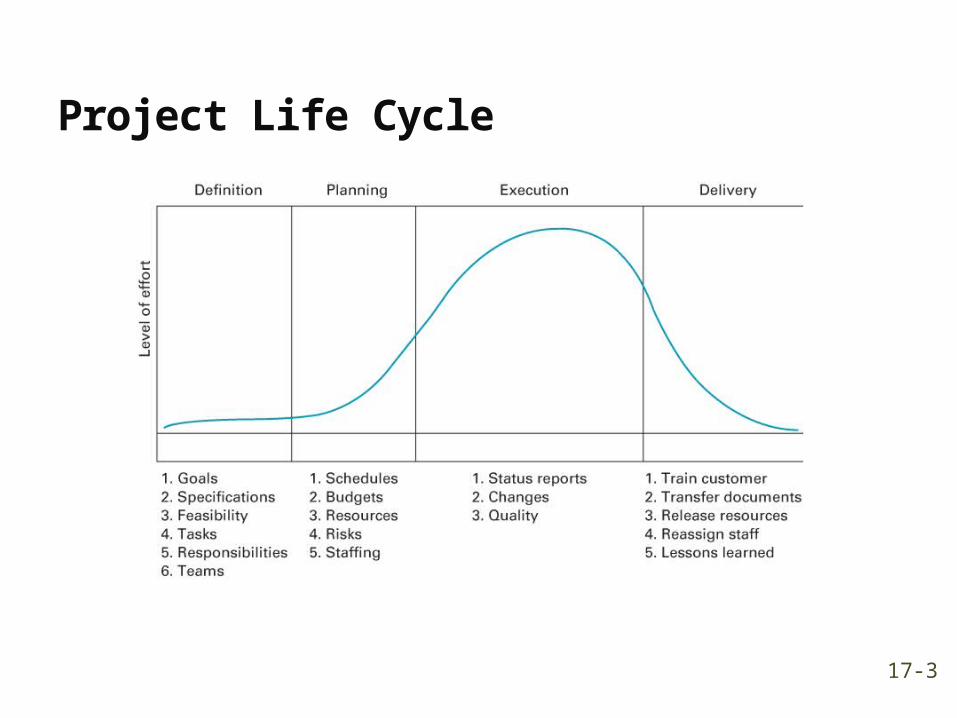
Project Life Cycle
17-3

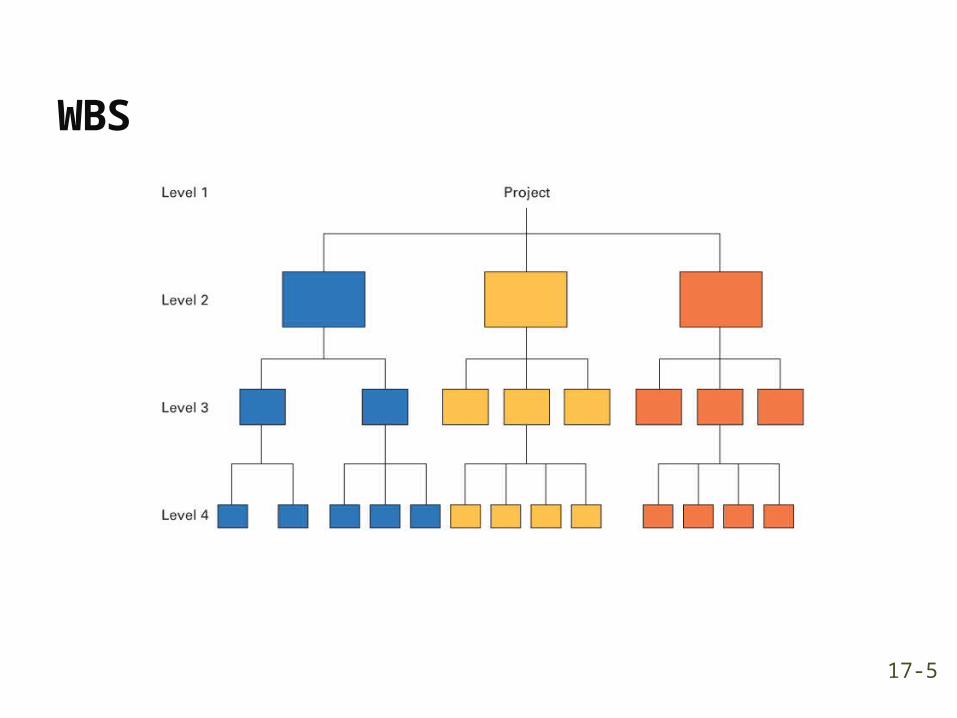
Work Breakdown Structure (WBS)WBS
A hierarchical listing of what must be done during a projectEstablishes a logical framework for identifying the
required activities for the project1. Identify the major elements of the project2. Identify the major supporting activities for each
of the major elements3. Break down each major supporting activity into a
list of the activities that will be needed to accomplish it
17-4
WBS
17-5
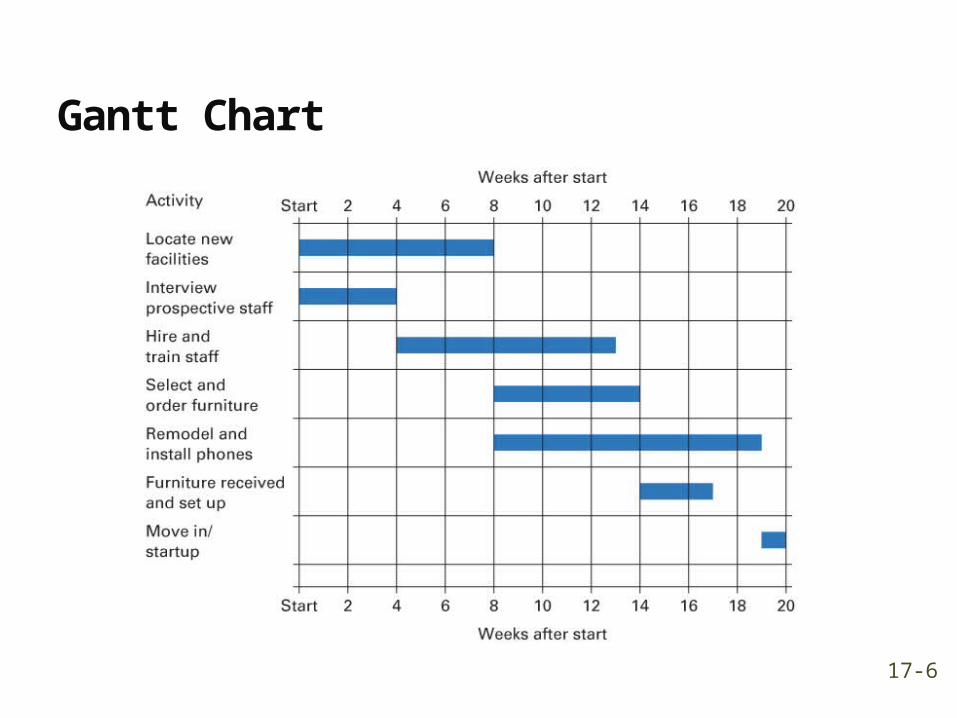
Gantt Chart
17-6

PERT and CPMPERT (program evaluation and review
technique) and CPM (critical path method) are two techniques used to manage large-scale projects
By using PERT or CPM Managers can obtain:1. A graphical display of project activities2. An estimate of how long the project will take3. An indication of which activities are most critical to
timely project completion4. An indication of how long any activity can be delayed
without delaying the project
17-7

Network DiagramNetwork diagram
Diagram of project activities that shows sequential relationships by use of arrows and nodes
Activity on arrow (AOA)Network diagram convention in which arrows designate
activities Activity on node (AON)
Network convention in which nodes designate activities Activities
Project steps that consume resources and/or time Events
The starting and finishing of activities
17-8

AON Convention
Activity on Activity Meaning Node (AON)
A comes before B, which comes before C.(a) A B C
A and B must both be completed before C can start.(b)
A
C
B
B and C cannot begin until A is completed.(c)
B
A
C 17-9

Activity on Activity Meaning Node (AON)
C and D cannot begin until both A and B are completed.
(d)A
B
C
D
C cannot begin until both A and B are completed; D cannot begin until B is completed. A dummy activity is introduced in AOA.
(e)A
B
C
D
AON Convention
17-10
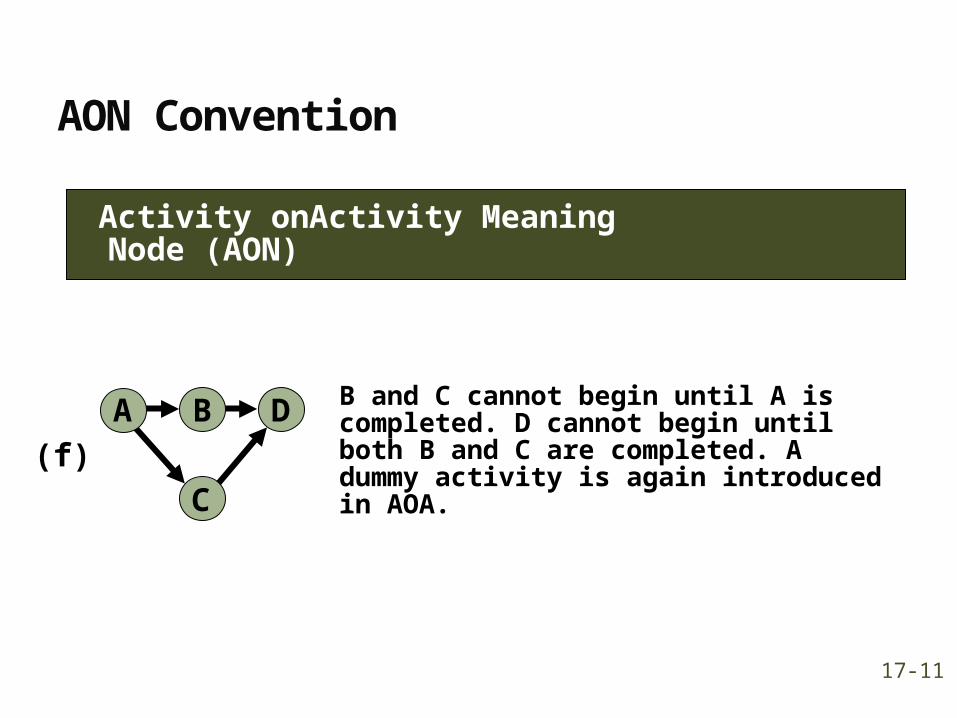
B and C cannot begin until A is completed. D cannot begin until both B and C are completed. A dummy activity is again introduced in AOA.
(f)
A
C
DB
Activity on Activity Meaning Node (AON)
AON Convention
17-11
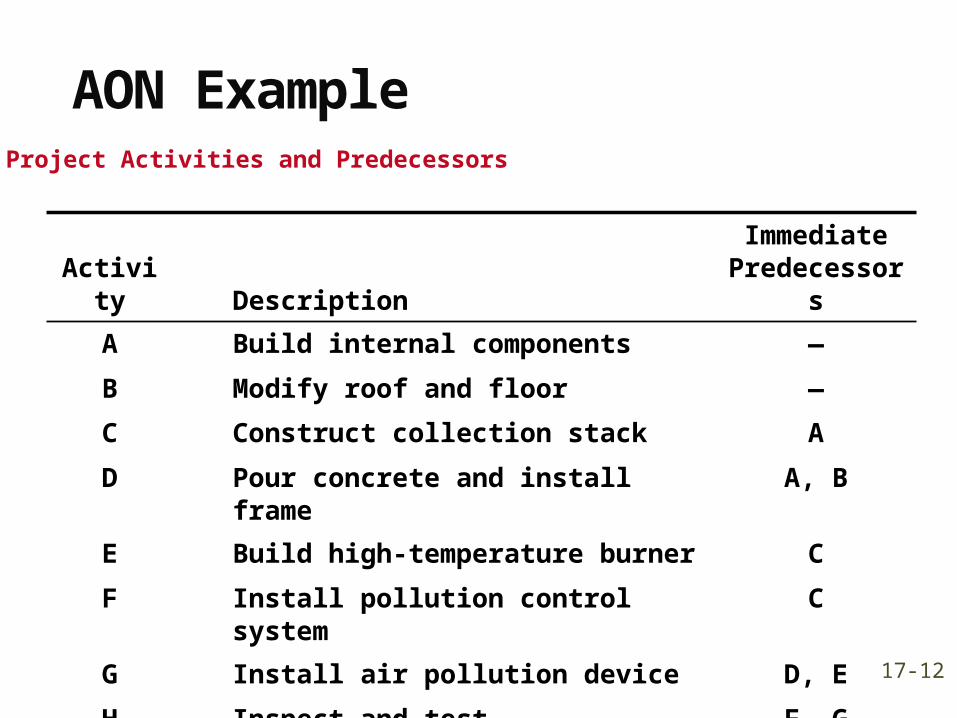
AON Example
Activity DescriptionImmediate
Predecessors
A Build internal components —
B Modify roof and floor —
C Construct collection stack A
D Pour concrete and install frame A, B
E Build high-temperature burner C
F Install pollution control system C
G Install air pollution device D, E
H Inspect and test F, G
Project Activities and Predecessors
17-12
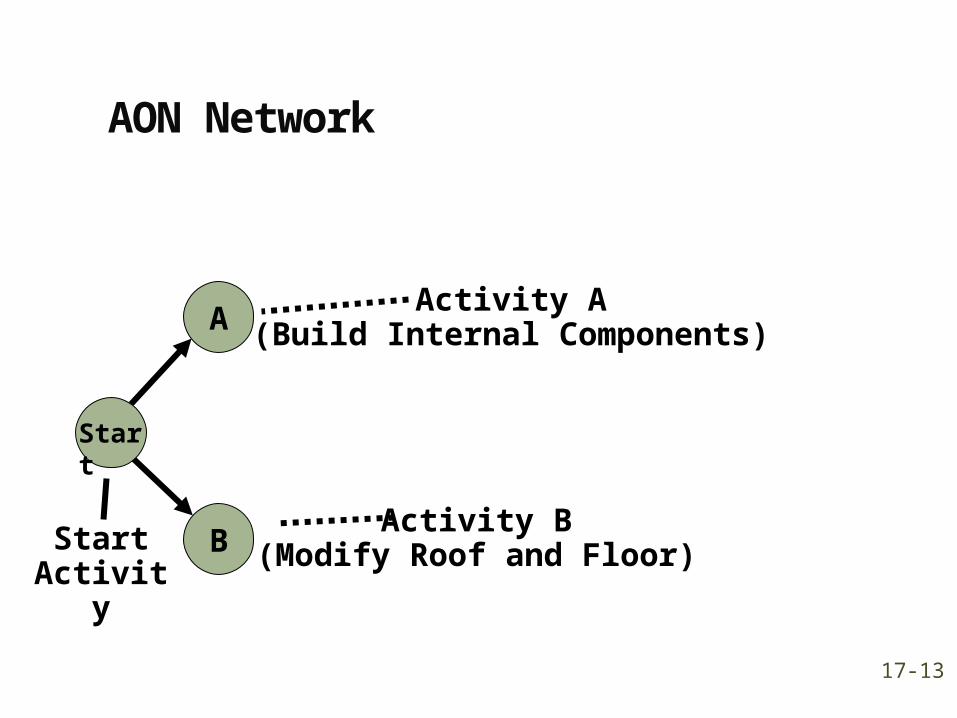
A
Start
BStart Activity
Activity A(Build Internal Components)
Activity B(Modify Roof and Floor)
AON Network
17-13

C
D
A
Start
B
Activity A Precedes Activity C
Activities A and B Precede Activity D
AON Network
17-14

G
E
F
H
CA
Start
DB
Arrows Show Precedence Relationships
AON Network
17-15

Deterministic Time EstimatesDeterministic
Time estimates that are fairly certainProbabilistic
Time estimates that allow for variation
17-16
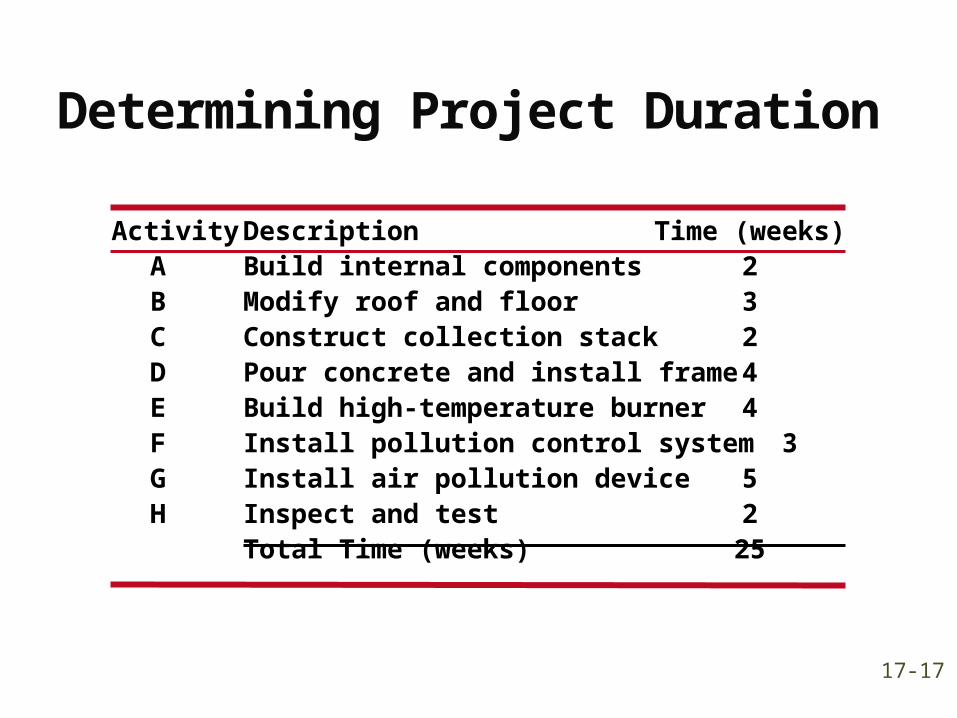
Determining Project Duration
Activity Description Time (weeks)A Build internal components 2B Modify roof and floor 3C Construct collection stack 2D Pour concrete and install frame 4E Build high-temperature burner 4F Install pollution control system 3G Install air pollution device 5H Inspect and test 2
Total Time (weeks) 25
17-17

Determining the Project Duration
Critical Path
Path Path duration
A-C-F-H 2 + 2 + 3 + 2 = 9
A-C-E-G-H 2 + 2 + 4 + 5 + 2 = 15
A-D-G-H 2 + 4 + 5 + 2 = 13
B-D-G-H 3 + 4 + 5 + 2 = 14
Critical path = Longest path A-C-E-G-HProject duration = 15 weeks
17-18
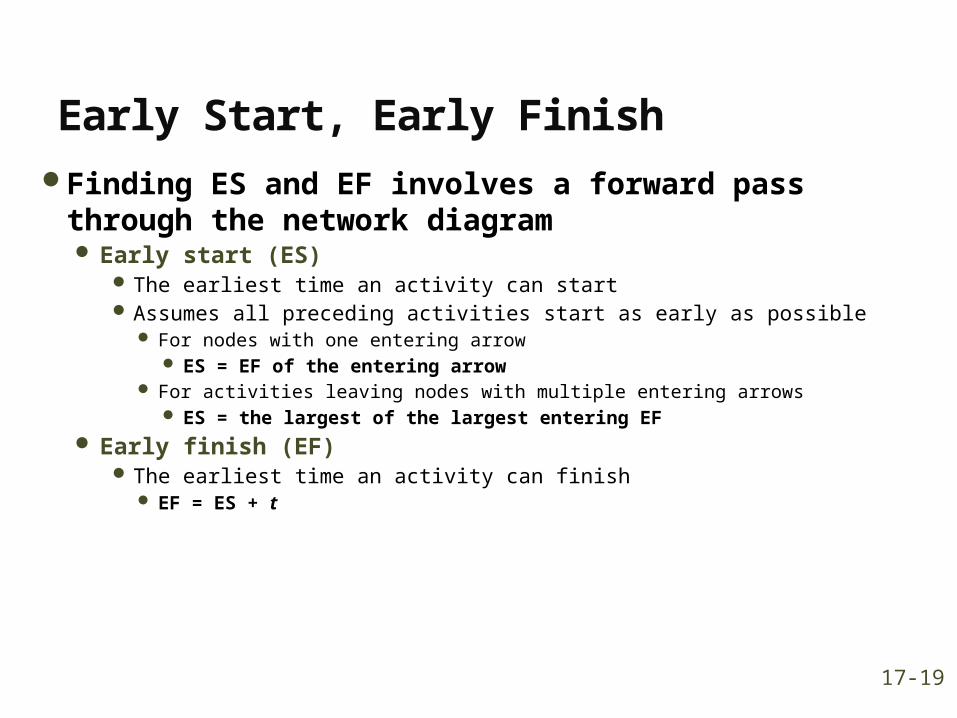
Early Start, Early FinishFinding ES and EF involves a forward pass
through the network diagram Early start (ES)
The earliest time an activity can start Assumes all preceding activities start as early as possible
For nodes with one entering arrow ES = EF of the entering arrow
For activities leaving nodes with multiple entering arrows ES = the largest of the largest entering EF
Early finish (EF) The earliest time an activity can finish
EF = ES + t
17-19

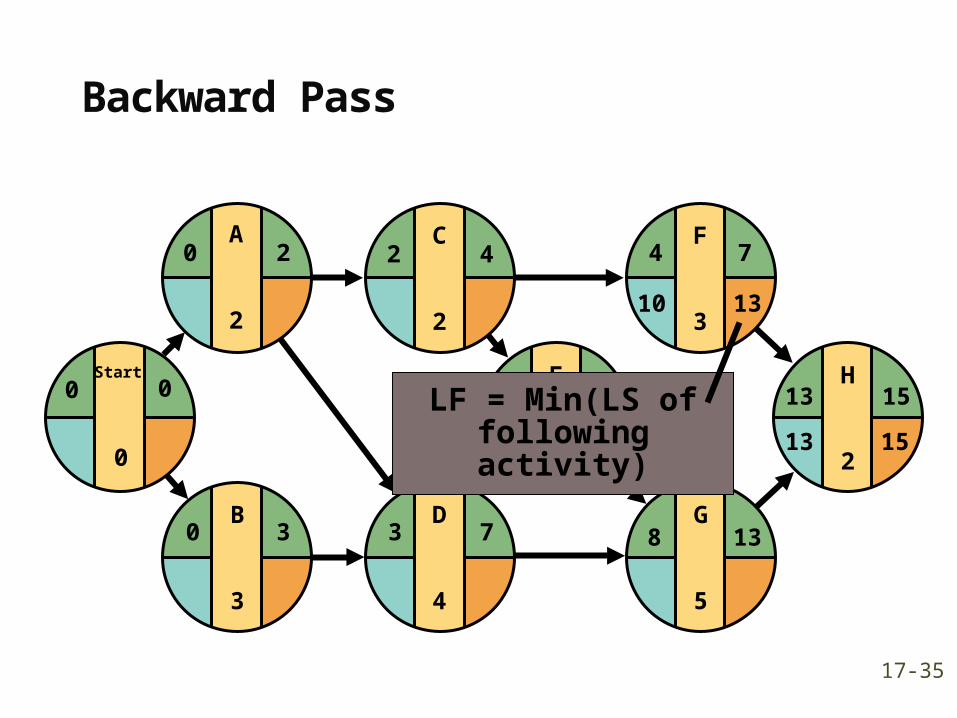
Late Start, Late FinishFinding LS and LF involves a backward pass
through the network diagram Late Start (LS)
The latest time the activity can start and not delay the project The latest starting time for each activity is equal to its latest finishing
time minus its expected duration: LS = LF - t
Late Finish (LF) The latest time the activity can finish and not delay the project
For nodes with one leaving arrow, LF for nodes entering that node equals the LS of the leaving arrow
For nodes with multiple leaving arrows, LF for arrows entering node equals the smallest of the leaving arrows
17-20
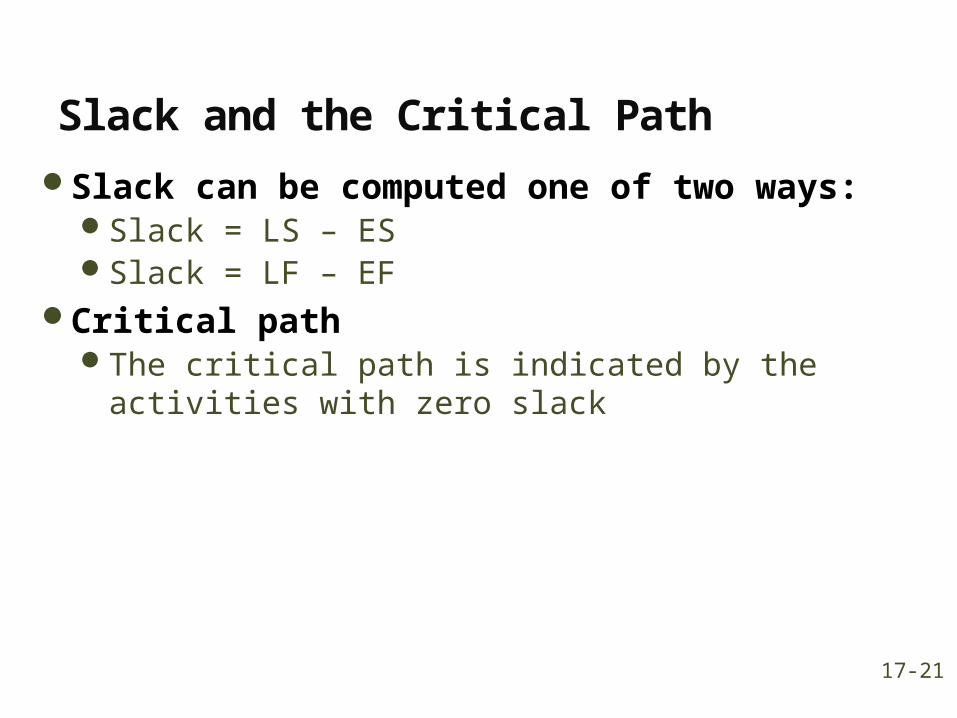
Slack and the Critical PathSlack can be computed one of two ways:
Slack = LS – ESSlack = LF – EF
Critical pathThe critical path is indicated by the activities
with zero slack
17-21

Determining the Project Schedule
Perform a Critical Path Analysis
A
Activity Name or Symbol
Earliest Start ES
Earliest FinishEF
Latest Start
LS Latest Finish
LF
Activity Duration
2
17-22

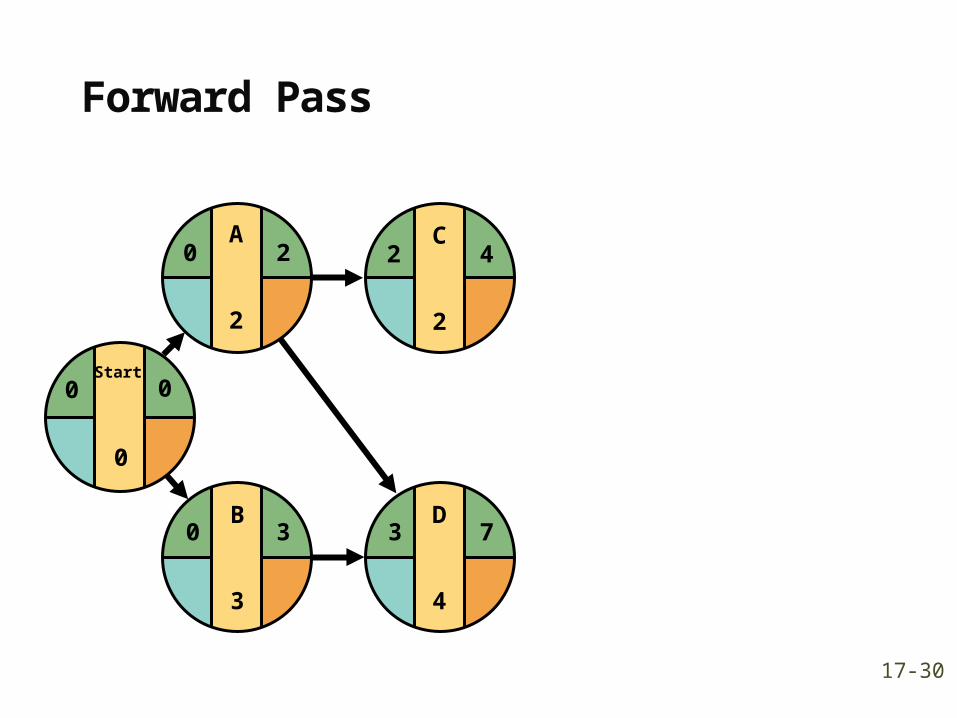
Forward Pass
Begin at starting event and work forward
Earliest Start Time Rule:
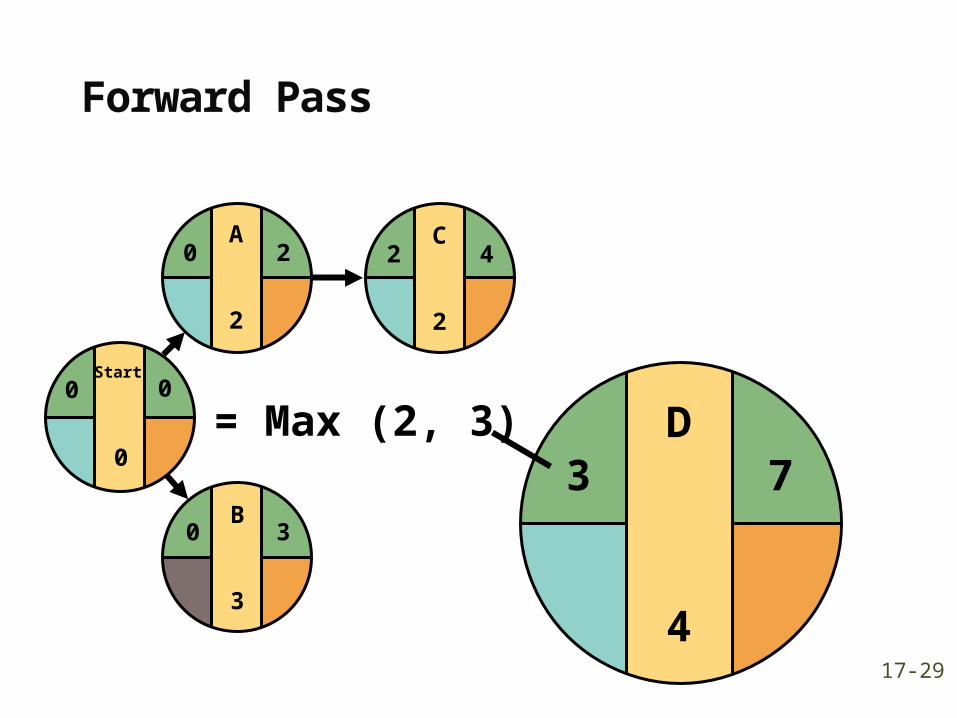
If an activity has only a single immediate predecessor, its ES equals the EF of the predecessor
If an activity has multiple immediate predecessors, its ES is the maximum of all the EF values of its predecessors
ES = Max {EF of all immediate predecessors}
17-23
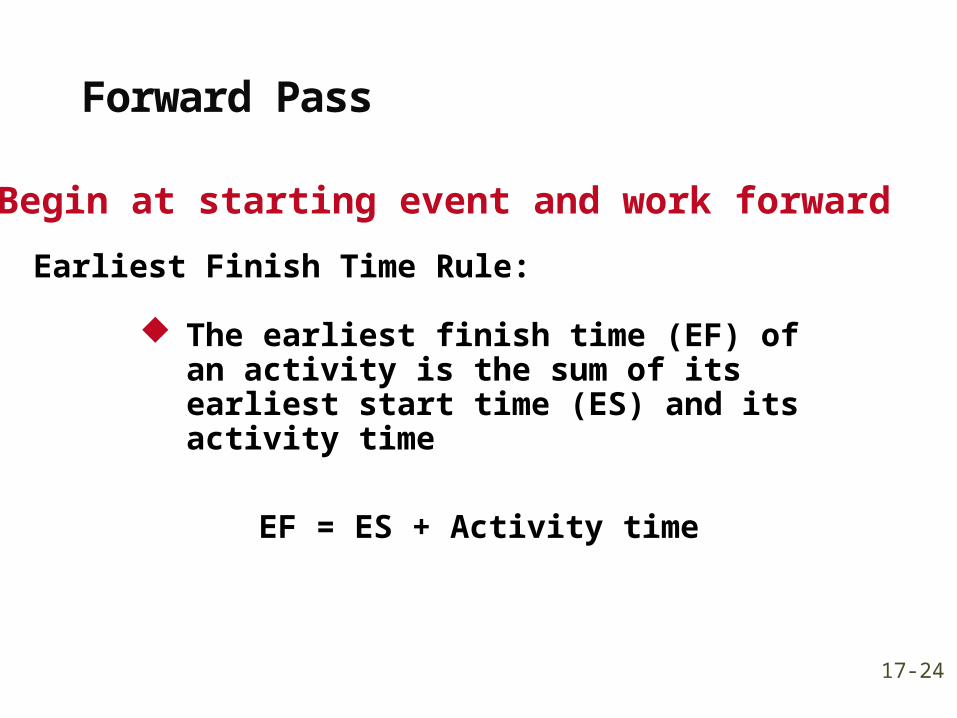
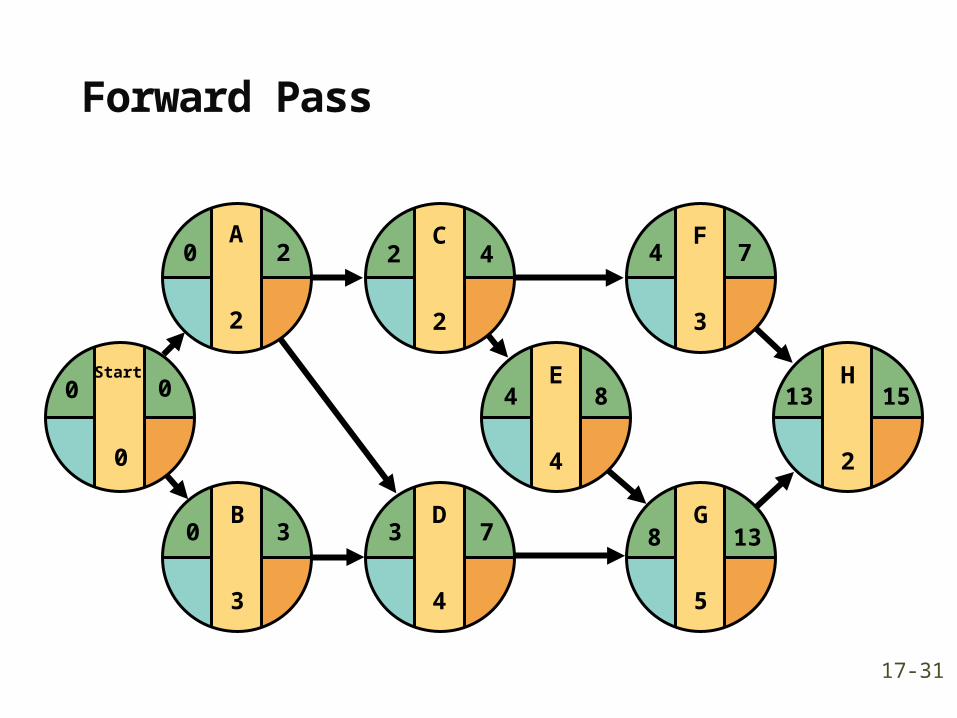
Forward Pass
Begin at starting event and work forward
Earliest Finish Time Rule:
The earliest finish time (EF) of an activity is the sum of its earliest start time (ES) and its activity time
EF = ES + Activity time
17-24
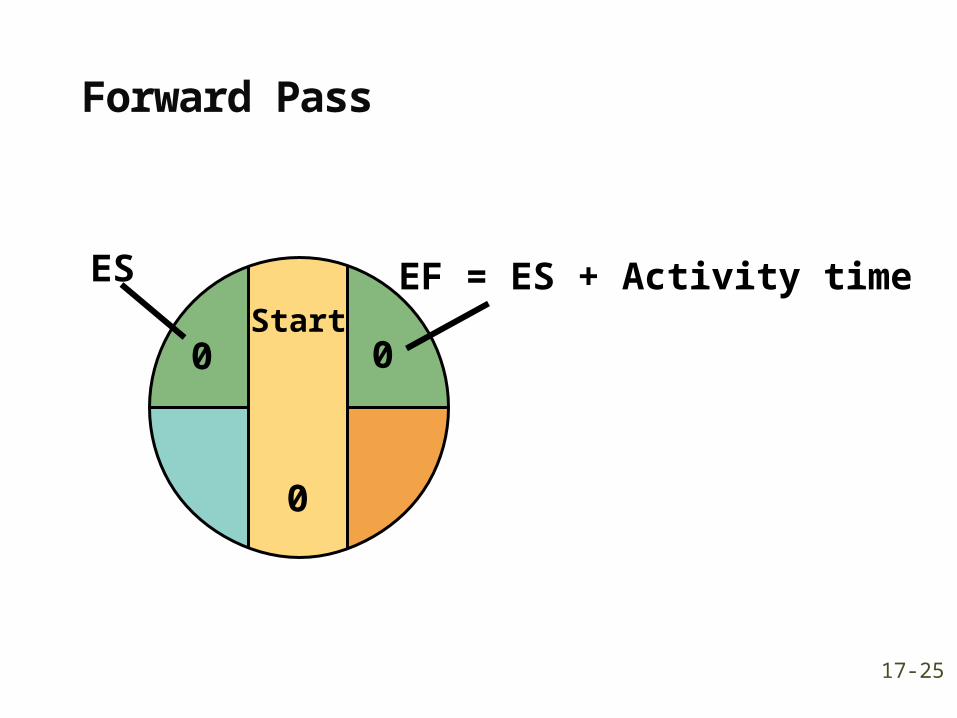
Start
0
0
ES
0
EF = ES + Activity time
Forward Pass
17-25
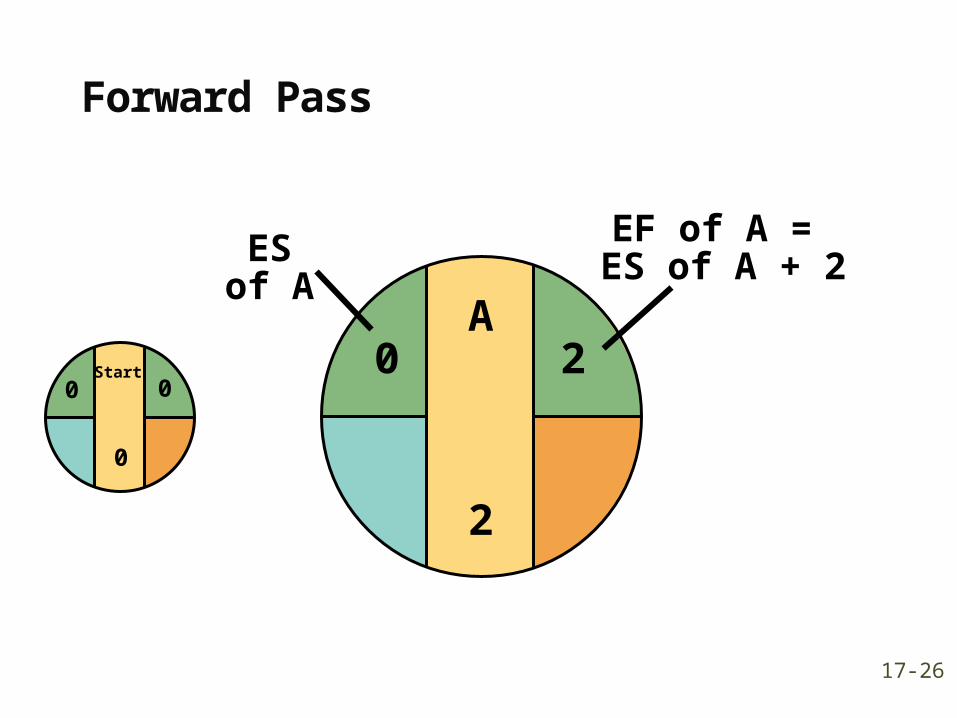
Start0
0
0
A
2
2
EF of A = ES of A + 2
0
ESof A
Forward Pass
17-26
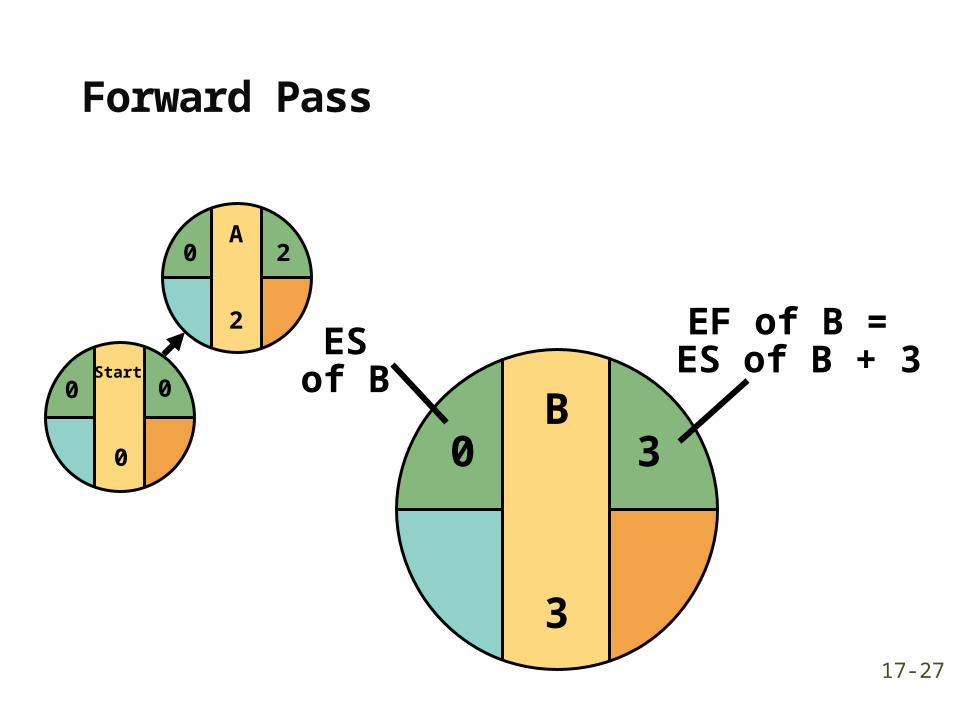
B
3
Start0
0
0
A
2
20
3
EF of B = ES of B + 3
0
ESof B
Forward Pass
17-27

C
2
2 4
B
3
0 3
Start0
0
0
A
2
20
Forward Pass
17-28
C
2
2 4
B
3
0 3
Start0
0
0
A
2
20
D
4
73= Max (2, 3)
Forward Pass
17-29
D
4
3 7
C
2
2 4
B
3
0 3
Start0
0
0
A
2
20
Forward Pass
17-30
E
4
F
3
G
5
H
2
4 8 13 15
4
8 13
7
D
4
3 7
C
2
2 4
B
3
0 3
Start0
0
0
A
2
20
Forward Pass
17-31
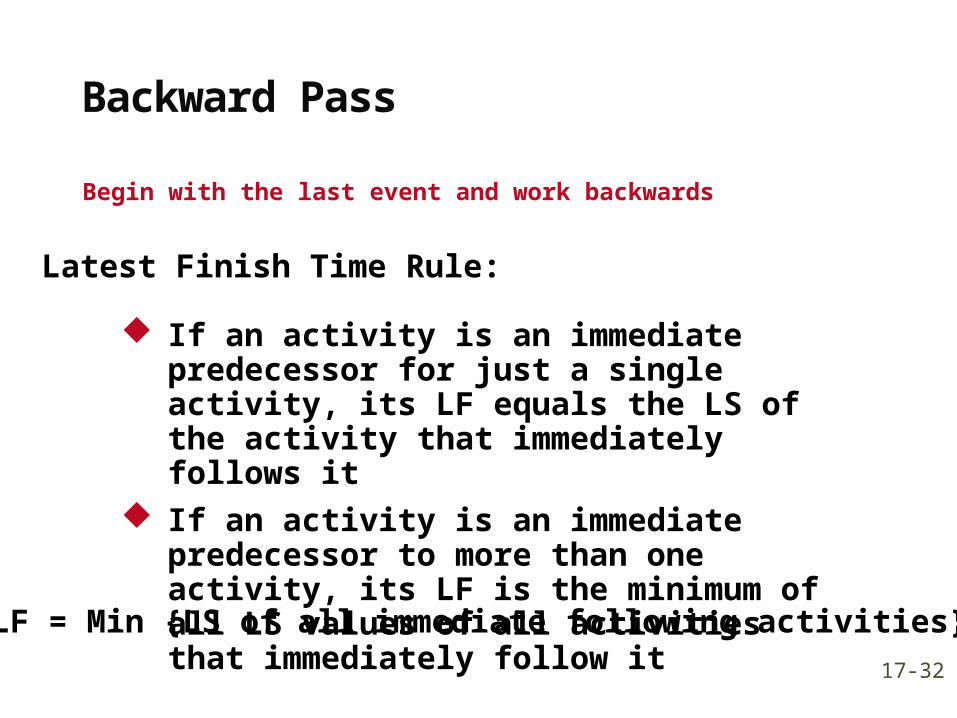
Backward Pass
Begin with the last event and work backwards
Latest Finish Time Rule:
If an activity is an immediate predecessor for just a single activity, its LF equals the LS of the activity that immediately follows it
If an activity is an immediate predecessor to more than one activity, its LF is the minimum of all LS values of all activities that immediately follow it
LF = Min {LS of all immediate following activities}
17-32
Backward Pass
Begin with the last event and work backwards
Latest Start Time Rule:
The latest start time (LS) of an activity is the difference of its latest finish time (LF) and its activity time
LS = LF – Activity time
17-33

E
4
F
3
G
5
H
2
4 8 13 15
4
8 13
7
D
4
3 7
C
2
2 4
B
3
0 3
Start0
0
0
A
2
20
LF = EF of Project
1513
LS = LF – Activity time
Backward Pass
17-34
E
4
F
3
G
5
H
2
4 8 13 15
4
8 13
7
13 15
D
4
3 7
C
2
2 4
B
3
0 3
Start0
0
0
A
2
20
LF = Min(LS of following activity)
10 13
Backward Pass
17-35

E
4
F
3
G
5
H
2
4 8 13 15
4
8 13
7
13 15
10 13
8 13
4 8
D
4
3 7
C
2
2 4
B
3
0 3
Start0
0
0
A
2
20
LF = Min(4, 10)
42
Backward Pass
17-36

E
4
F
3
G
5
H
2
4 8 13 15
4
8 13
7
13 15
10 13
8 13
4 8
D
4
3 7
C
2
2 4
B
3
0 3
Start0
0
0
A
2
20
42
84
20
41
00
Backward Pass
17-37

Computing Slack Time
After computing the ES, EF, LS, and LF times for all activities, compute the slack or free time for each activity
Slack is the length of time an activity can be delayed without delaying the entire project
Slack = LS – ES or Slack = LF – EF
17-38

Computing Slack Time
Earliest Earliest Latest Latest OnStart Finish Start Finish Slack Critical
Activity ES EF LS LF LS – ES Path
A 0 2 0 2 0 YesB 0 3 1 4 1 NoC 2 4 2 4 0 YesD 3 7 4 8 1 NoE 4 8 4 8 0 YesF 4 7 10 13 6 NoG 8 13 8 13 0 YesH 13 15 13 15 0 Yes
17-39

Using Slack TimesKnowledge of slack times provides
managers with information for planning allocation of scarce resources Control efforts will be directed toward those activities
that might be most susceptible to delaying the project
Activity slack times are based on the assumption that all of the activities on the same path will be started as early as possible and not exceed their expected time
If two activities are on the same path and have the same slack, this will be the total slack available to both
17-40

Probabilistic Time EstimatesThe beta distribution is generally used to
describe the inherent variability in time estimates
The probabilistic approach involves three time estimates: Optimistic time, (to)
The length of time required under optimal conditions Pessimistic time, (tp)
The length of time required under the worst conditions
Most likely time, (tm)The most probable length of time required
17-41

Probabilistic Time Estimates
The expected time, te ,for an activity is a weighted average of the three time estimates:
The expected duration of a path is equal to the sum of the expected times of the activities on that path:
6
4 pmoe
tttt
path on the activities of timesexpected ofmeanPath
17-42
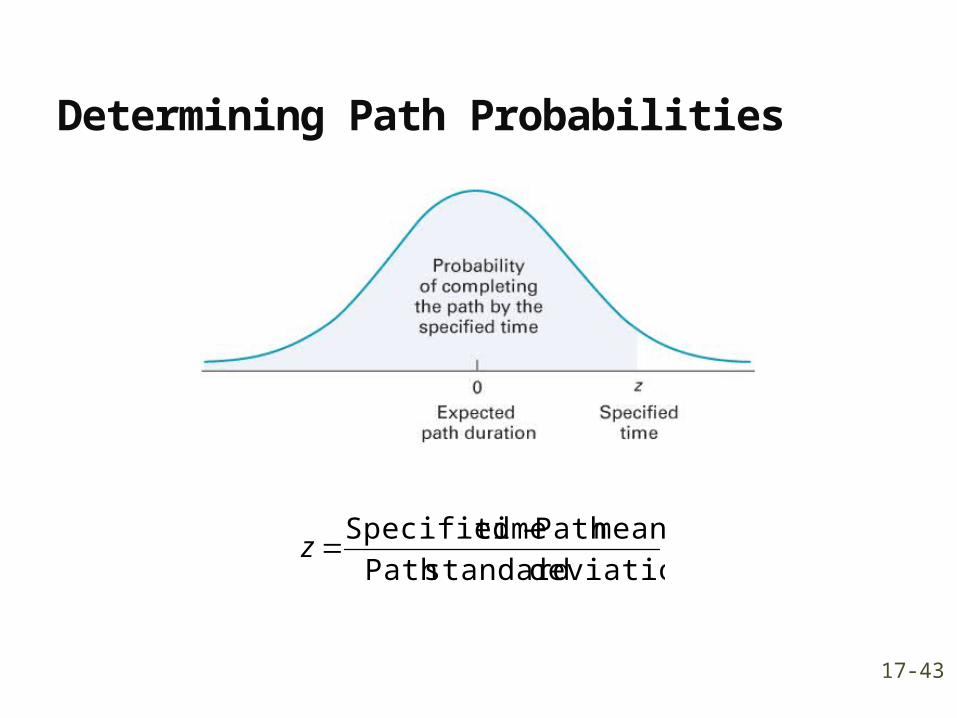
Determining Path Probabilities
deviation standardPath
meanPath - timeSpecifiedz
17-43

Project Completion Time A project is not complete until all project activities are
complete
It is risky to only consider the critical path when assessing the probability of completing a project within a specified time.
To determine the probability of completing the project within a particular time frame
Calculate the probability that each path in the project will be completed within the specified time
Multiply these probabilities
The result is the probability that the project will be completed within the specified time
17-44

Probabilistic Time EstimatesThe standard deviation of each activity’s time is
estimated as one-sixth of the difference between the pessimistic and optimistic time estimates. The variance is the square of the standard deviation:
Standard deviation of the expected time for the path
2
2
6
op tt
pathon activities of Variancespath
17-45
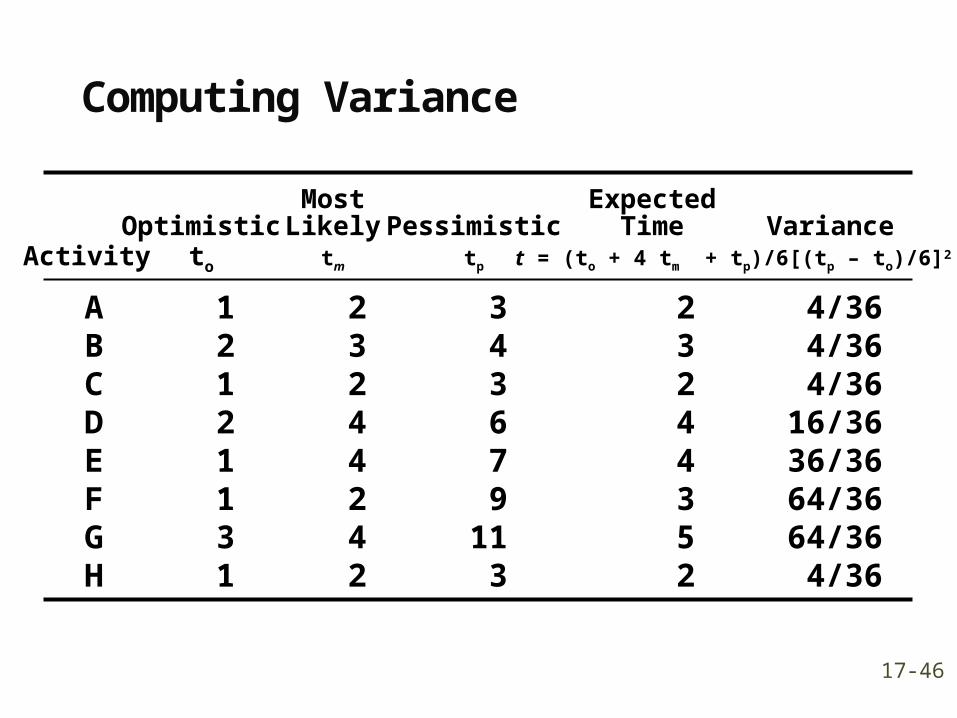
Computing Variance
Most ExpectedOptimistic Likely Pessimistic Time Variance
Activity to tm tp t = (to + 4 tm + tp)/6 [(tp – to)/6]2
A 1 2 3 2 4/36B 2 3 4 3 4/36C 1 2 3 2 4/36D 2 4 6 4 16/36E 1 4 7 4 36/36F 1 2 9 3 64/36G 3 4 11 5 64/36H 1 2 3 2 4/36
17-46

Knowledge of Path StatisticsKnowledge of expected path times and their
standard deviations enables managers to compute probabilistic estimates about project completion such as:The probability that the project will be
completed by a certain timeThe probability that the project will take
longer than its expected completion time
17-47

Path variance is computed by summing the variances of activities on the path
s2 = Project variance
= (variances of activities on the path)
p
Computing Variance
17-48
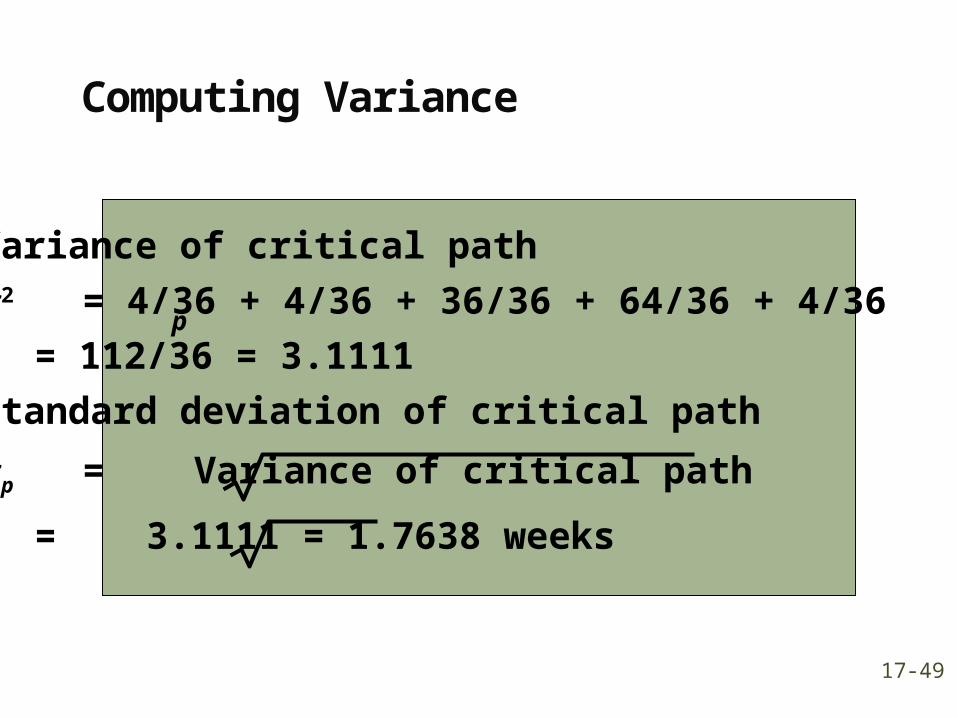
Variance of critical path
s2 = 4/36 + 4/36 + 36/36 + 64/36 + 4/36
= 112/36 = 3.1111
Standard deviation of critical path
sp = Variance of critical path
= 3.1111 = 1.7638 weeks
p
Computing Variance
17-49
Probability of Project Completion
Note:
Total project completion times follow a normal probability distribution
Activity times are statistically independent
17-50
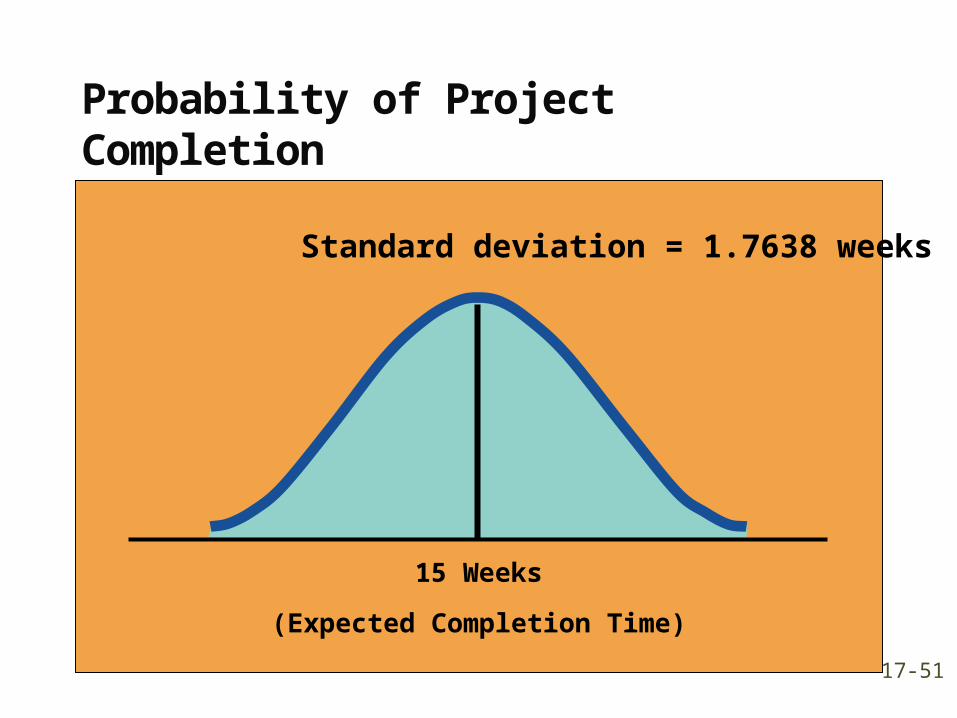
Probability of Project Completion
Standard deviation = 1.7638 weeks
15 Weeks
(Expected Completion Time)
17-51
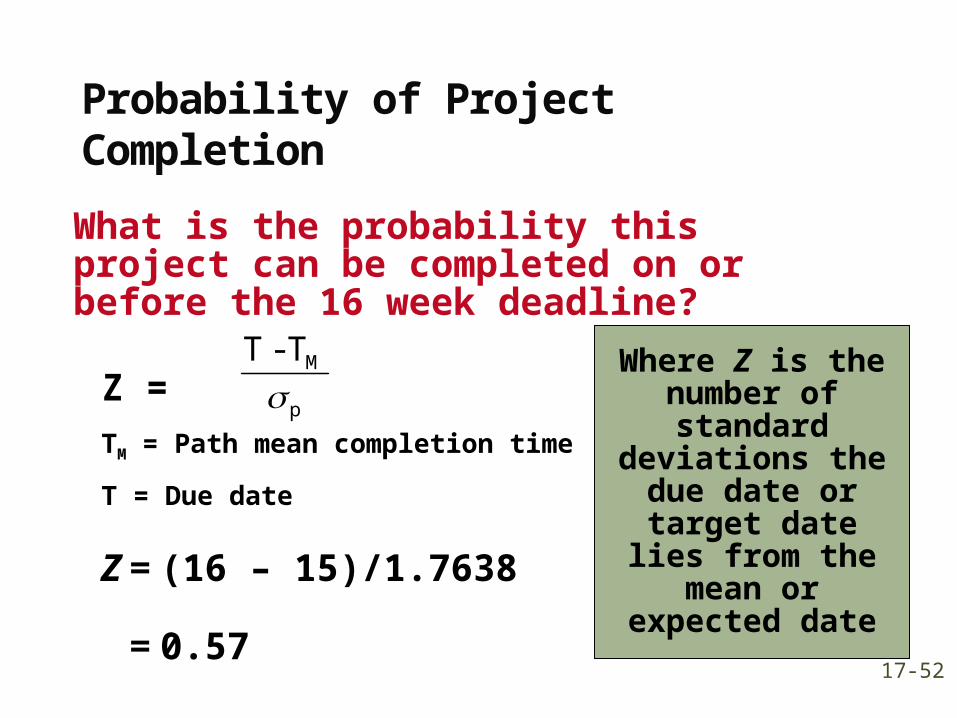
Probability of Project Completion
What is the probability this project can be completed on or before the 16 week deadline?
Z =
TM = Path mean completion time
T = Due date
Z = (16 – 15)/1.7638
= 0.57
Where Z is the number of standard
deviations the due date or target date lies from the mean or expected
date
p
MT - T
17-52

Probability of Project Completion
Time
Probability(T ≤ 16 weeks)is 0.7157
0.57 Standard deviations
15 16Weeks Weeks
Probability(T > 16 weeks)is 1 – 0.7157 = 0.2843
17-53

Project Completion for given confidence
Determine a due date for the project completion time that will have a 99% probability of meeting.
Due date = TE + Z sp
17-54
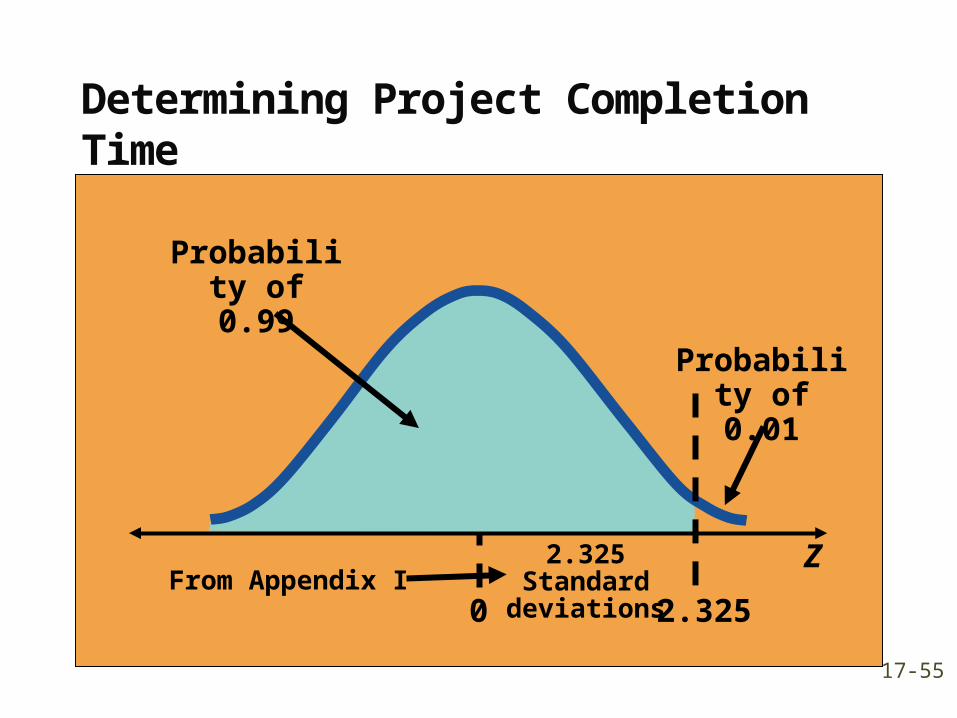
Determining Project Completion Time
Probability of 0.01
ZFrom Appendix I
Probability of 0.99
2.325 Standard deviations
0 2.325
17-55

Determining Project Completion Time
Probability of 0.01
ZFrom Appendix I
Probability of 0.99
2.325 Standard deviations
0 2.325
Due date (T) = TM + z sp
17-56
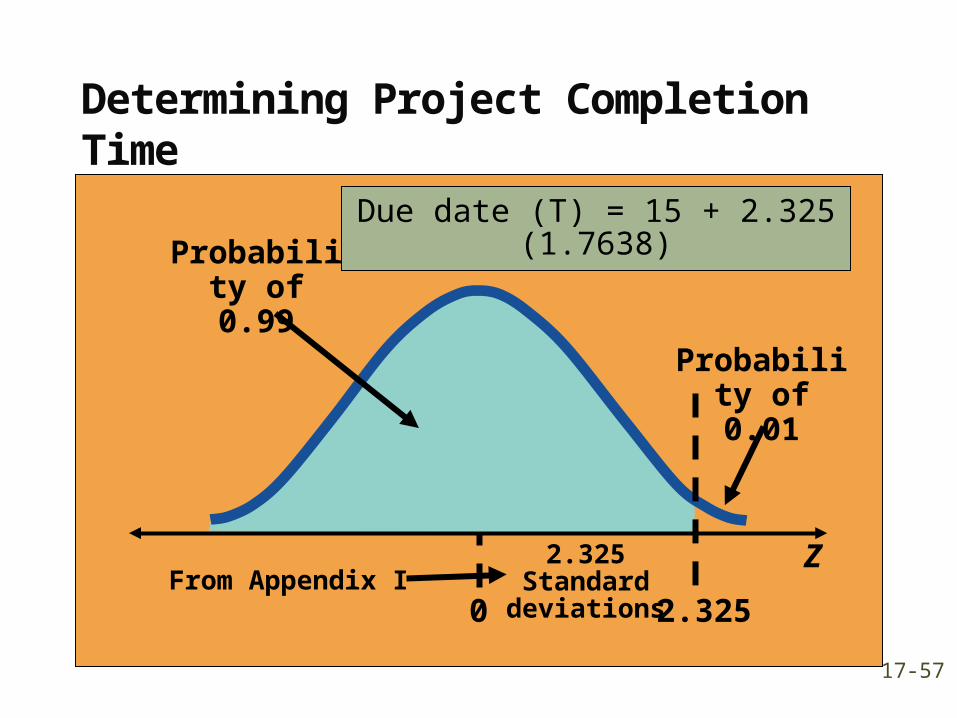
Determining Project Completion Time
Probability of 0.01
ZFrom Appendix I
Probability of 0.99
2.325 Standard deviations
0 2.325
Due date (T) = 15 + 2.325 (1.7638)
17-57

Determining Project Completion Time
Probability of 0.01
ZFrom Appendix I
Probability of 0.99
2.325 Standard deviations
0 2.325
Due date (T) = 19.1 weeks
17-58

Variability of Completion Time for Noncritical Paths
Variability of times for activities on noncritical paths must be considered when finding the probability of finishing in a specified time
Variation in noncritical activity may cause change in critical path
17-59

What Project Management Has Provided So Far
1. The project’s expected completion time is 15 weeks
2. There is a 71.57% chance the equipment will be in place by the 16 week deadline
3. Five activities (A, C, E, G, and H) are on the critical path
4. Three activities (B, D, F) are not on the critical path and have slack time
5. A detailed schedule is available17-60

Budget ControlBudget control is an important aspect of
project managementCosts can exceed budget
Overly optimistic time estimatesUnforeseen events
Unless corrective action is taken, serious cost overruns can occur
17-61

Time-Cost Trade-OffsActivity time estimates are made for some
given level of resourcesIt may be possible to reduce the duration of
a project by injecting additional resources Motivations:
To avoid late penaltiesMonetary incentivesFree resources for use on other projects
17-62

Time-Cost Trade-Offs: CrashingCrashing
Shortening activity durationsTypically, involves the use of additional funds to support
additional personnel or more efficient equipment, and the relaxing of some work specifications
The project duration may be shortened by increasing direct expenses, thereby realizing savings in indirect project costs
17-63
Crashing DecisionsTo make decisions concerning crashing
requires information about:
1. Regular time and crash time estimates for each activity
2. Regular cost and crash cost estimates for each activity
3. A list of activities that are on the critical pathCritical path activities are potential candidates for crashing
Crashing non-critical path activities would not have an impact on overall project duration
17-64
Crashing: ProcedureGeneral procedure:
1. Crash the project one period at a time
2. Crash the least expensive activity that is on the critical path
3. When there are multiple critical paths, find the sum of crashing the least expensive activity on each critical path
If two or more critical paths share common activities, compare the least expensive cost of crashing a common activity shared by critical paths with the sum for the separate critical paths
17-65
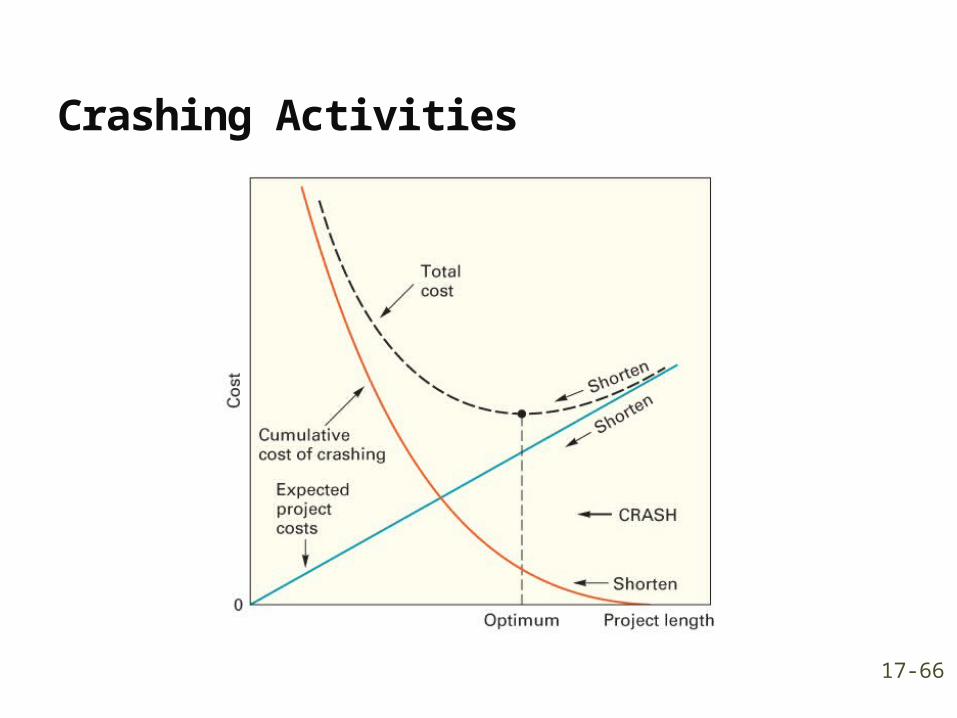
Crashing Activities
17-66

PERT: AdvantagesAmong the most useful features of
PERT:1.It forces the manager to organize and quantify
available information and to identify where additional information is needed
2.It provides the a graphic display of the project and its major activities
3.It identifiesa. Activities that should be closely watchedb. Activities that have slack time
17-67

Sources of ErrorPotential sources of error:
1. The project network may be incomplete2. Precedence relationships may not be correctly
expressed3. Time estimates may be inaccurate4. There may be a tendency to focus on critical path
activities to the exclusion of other important project activities
5. Major risk events may not be on the critical path
17-68

Project Management SoftwareTechnology has benefited project management
CADTo produce updated prototypes on construction and product-
development projects Communication software
Helps to keep project members in close contactFacilitates remote viewing of projects
Project management softwareSpecialized software used to help manage projects
Assign resources Compare project plan versions Evaluate changes Track performance
17-69

Project Management Software Advantages
Advantages include: Imposes a methodology and common project
management terminology Provides a logical planning structure May enhance communication among team members Can flag the occurrence of constraint violations Automatically formats reports Can generate multiple levels of summary and detail
reports Enables “what if” scenarios Can generate a variety of chart types
17-70
Risk ManagementRisks are an inherent part of project management
Risks relate to occurrence of events that have undesirable consequences such asDelays Increased costs Inability to meet technical specifications
Good risk management involves Identifying as many risks as possibleAnalyzing and assessing those risksWorking to minimize the probability of their occurrenceEstablishing contingency plans and budgets for dealing with
any that do occur
17-71
Operations Strategy Projects present both strategic opportunities and risks
It is critical to devote sufficient resources and attention to projects Projects are often employed in situations that are characterized by
significant uncertainties that demandCareful planningWise selection of project manager and teamMonitoring of the project
Project software can facilitate successful project completionBe careful to not focus on critical path activities
to the exclusion of other activities that may become critical
It is not uncommon for projects to fail When that happens, it can be beneficial to examine the probable
reasons for failure
17-72