You Are Included: The Effectiveness of Diversity and ...
35
Bridgewater State University Virtual Commons - Bridgewater State University Honors Program eses and Projects Undergraduate Honors Program 5-8-2018 You Are Included: e Effectiveness of Diversity and Representation of Ethnic Minorities in TV Advertising Eric DeBenedictis Follow this and additional works at: hp://vc.bridgew.edu/honors_proj Part of the Advertising and Promotion Management Commons is item is available as part of Virtual Commons, the open-access institutional repository of Bridgewater State University, Bridgewater, Massachuses. Recommended Citation DeBenedictis, Eric. (2018). You Are Included: e Effectiveness of Diversity and Representation of Ethnic Minorities in TV Advertising. In BSU Honors Program eses and Projects. Item 294. Available at: hp://vc.bridgew.edu/honors_proj/294 Copyright © 2018 Eric DeBenedictis
Transcript of You Are Included: The Effectiveness of Diversity and ...

Bridgewater State UniversityVirtual Commons - Bridgewater State University
Honors Program Theses and Projects Undergraduate Honors Program
5-8-2018
You Are Included: The Effectiveness of Diversityand Representation of Ethnic Minorities in TVAdvertisingEric DeBenedictis
Follow this and additional works at: http://vc.bridgew.edu/honors_proj
Part of the Advertising and Promotion Management Commons
This item is available as part of Virtual Commons, the open-access institutional repository of Bridgewater State University, Bridgewater, Massachusetts.
Recommended CitationDeBenedictis, Eric. (2018). You Are Included: The Effectiveness of Diversity and Representation of Ethnic Minorities in TVAdvertising. In BSU Honors Program Theses and Projects. Item 294. Available at: http://vc.bridgew.edu/honors_proj/294Copyright © 2018 Eric DeBenedictis

You Are Included: The Effectiveness of Diversity and Representation of Ethnic Minorities in TV Advertising
Eric DeBenedictis
Submitted in Partial Completion of the Requirements for Commonwealth Honors in Management
Bridgewater State University
May 8, 2018
Dr. Stephanie Jacobsen, Thesis Director Dr. Adriana Boveda-Lambie, Committee Member
Dr. Jakari Griffith, Committee Member

2
TABLE OF CONTENTS
ACKNOWLEDGEMENTS 3
ABSTRACT 4
INTRODUCTION 4
LITERATURE REVIEW AND HYPOTHESES 6 Ethnic Identification 6 Hypotheses Development 8
METHODOLOGY 10 Pre-Test 10
Pre-Test Results 10 Measures 12
Manipulation Check 12 Attention Check 12 Attitudes 12 Ethnic Identification 13
Procedure 14
RESULTS 16 Participants 16 Attitudes 16 Identification 19 Ethnic Identification and Behavioral Intentions 21
DISCUSSION, LIMITATIONS AND FUTURE RESEARCH 24
REFERENCES 26
3
ACKNOWLEDGEMENTS I would like to thank Dr. Stephanie Jacobsen for walking me through the research
process, and agreeing to mentor my honors thesis. As a new professor at Bridgewater State University, this is her first time mentoring an honors thesis, and I know she will be an excellent mentor to future honors students in the management department. At times, my topic seemed too broad or too narrow, but Dr. Jacobsen kept me focused by contributing ideas, forcing me to make decisions, and sharing her marketing research expertise. I appreciate the time she took to meet with me each week to keep me on track to complete the study.
I would also like to give a special thanks to my former supervisor at the Honors Center, Ms. Amy Couto for fostering my growth as an honors student. When working for the honors marketing team, Amy pushed me to develop my marketing skills, and asked thought-provoking questions. During my first semester as a Communications Assistant, I created a campaign called “Humans of Honors.” Amy noticed that most of the students I was featuring on our social media were white women - the dominant demographic for the program. Amy encouraged me to reach out and feature more diverse students. At first, I was uncomfortable with the idea of intentionally finding and featuring students of color, but after investigating underrepresented groups in the program, I realized how I could use my role to provide a voice to these underrepresented groups, and increase their involvement in the program. It was this realization that guided my work with the Honors Program for semesters to come, and made me interested in the topic of diversity, which became my honors thesis.
Thank you to the Honors Program, the Center for Transformative Learning, and the faculty and staff of Bridgewater State University for providing me with outstanding support and numerous opportunities to learn, explore, and achieve. I will be forever grateful for everything this university has given me.
4
YOU ARE INCLUDED: THE EFFECTIVENESS OF DIVERSITY AND REPRESENTATION OF ETHNIC MINORITIES IN TV ADVERTISING
STEPHANIE JACOBSEN AND ERIC DEBENEDICTIS
Bridgewater State University
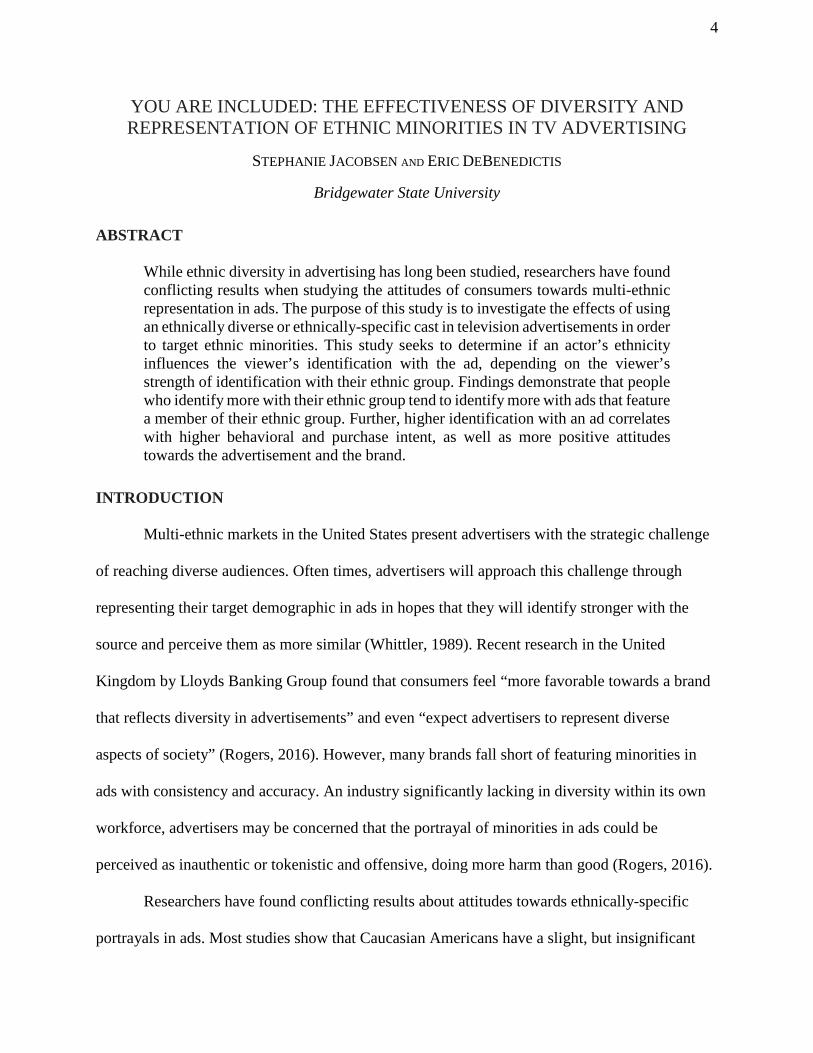
ABSTRACT
While ethnic diversity in advertising has long been studied, researchers have found conflicting results when studying the attitudes of consumers towards multi-ethnic representation in ads. The purpose of this study is to investigate the effects of using an ethnically diverse or ethnically-specific cast in television advertisements in order to target ethnic minorities. This study seeks to determine if an actor’s ethnicity influences the viewer’s identification with the ad, depending on the viewer’s strength of identification with their ethnic group. Findings demonstrate that people who identify more with their ethnic group tend to identify more with ads that feature a member of their ethnic group. Further, higher identification with an ad correlates with higher behavioral and purchase intent, as well as more positive attitudes towards the advertisement and the brand.
INTRODUCTION
Multi-ethnic markets in the United States present advertisers with the strategic challenge
of reaching diverse audiences. Often times, advertisers will approach this challenge through
representing their target demographic in ads in hopes that they will identify stronger with the
source and perceive them as more similar (Whittler, 1989). Recent research in the United
Kingdom by Lloyds Banking Group found that consumers feel “more favorable towards a brand
that reflects diversity in advertisements” and even “expect advertisers to represent diverse
aspects of society” (Rogers, 2016). However, many brands fall short of featuring minorities in
ads with consistency and accuracy. An industry significantly lacking in diversity within its own
workforce, advertisers may be concerned that the portrayal of minorities in ads could be
perceived as inauthentic or tokenistic and offensive, doing more harm than good (Rogers, 2016).
Researchers have found conflicting results about attitudes towards ethnically-specific
portrayals in ads. Most studies show that Caucasian Americans have a slight, but insignificant

5
affinity towards Caucasian actors or models, and African Americans have a stronger affinity
towards African American actors or models; perceiving them as more similar, better recalling
ads, and showing increased purchase intentions (Whittler, 1989). Alternatively, one study by
Lee, Edwards, and Ferle (2014) found implicit in-group biases in a time-constrained condition:
“African American participants reported more positive attitudes towards ads with Caucasian
American models than African American models.” In a time-unconstrained condition, the same
study revealed a dissonance with those biases, finding that both Caucasian and African American
participants were indifferent to ethnicity, demonstrating a clear difficulty for researchers in
understanding how diverse advertisements are really being perceived.
This research aims to more definitively find advertising inclusion preferences by
evaluating attitudes and purchase intentions for ethnic minorities when comparing ads which
represent a participant’s own ethnicity, other ethnicity, or multiple ethnicities. These results
contribute conceptually to the diversity in advertising literature as well as the ethnic
identification literature by demonstrating a link between consumer identification with their
ethnic group and overall attitude towards the advertisement. These results will also guide
practitioners by providing the advertising industry with guidance in authentically targeting and
including ethnic minorities in ad campaigns. The end goal is to provide more guidance for
advertisers to target multi-ethnic markets while being sensitive to the diverse needs and
perceptions of Americans.
First, this study begins with a review of the ethnic identification literature, as well as
source similarity, and motivation as part of the hypotheses development. Next, the methodology
and procedures for the pre-test and study are explained. The data analysis, results and discussion
are then followed by limitations, areas for future research and conclusions.

6
LITERATURE REVIEW AND HYPOTHESES
Ethnic Identification
To some, ethnicity is not as static and objective as one’s heritage or appearance.
According to a review on ethnic identity (Minor-Cooley and Brice, 2007), researchers suggest
that individuals have varying levels of identification with their ethnic group, “based on their
feelings of belongingness, how one feels in a particular situation, and one’s thinking and
behaviors based on that group membership” (Hirschman, 1981; Minor, 1992; Rossiter and Chan,
1998; Rotheram and Phinney, 1987; Stayman and Dephande, 1989). The strength of one’s ethnic
identification is important because it demonstrates an emotional connection with the ethnic group
(Deshpande and Stayman 1994; Broderick et al. 2011a; Kipnis et al. 2013). According to Zuniga
and Torres (2017) “the stronger an individual’s ethnic identification, the stronger the individual’s
sense of belonging and loyalty toward that ethnic group” (Demangeot et al. 2013; Zuniga and
Torres 2016a, 2016b). How strongly affiliated someone feels with their ethnic group impacts
their overall purchasing behavior as well as evaluative judgements of advertisements
(Deshpande, Hoyer, and Donthu 1986; Zuniga 2015; Broderick et al. 2011b).
As strength of ethnic identification can impact consumer behavior, there are many other
important factors related to ethnicity that can impact overall evaluations and purchase likelihood.
Because of this, researchers have frequently found disagreement in terms of how to best appeal
to diverse ethnic groups using advertising. For instance: research by Cooley, Brice, Becerra, and
Chappa (2015) finds that the influence of cosmopolitanism or the “acceptance of other cultures,
customs, and preferences in deference to one's own” may make ethnic-specific advertising less of
a necessity in diverse markets. The findings suggested the use of standardized multi-ethnic ads

7
for targeting cosmopolitan markets which desire diversity, and ethnic-specific ads can be used in
communities that are less diverse or ethnically dissimilar.
Lee, Edwards, and Ferle (2015) also argue that “society’s growing tolerance and
embracing nature of diversity would indicate that racial differences today may be less of a
consideration in evaluating ads, particularly for younger audiences.” However, other research
suggests that the representation of racial or ethnic differences in advertising is increasingly
important to younger audiences (Cooley, et. al, 2015). According to distinctiveness theory, one’s
environment can also affect how they identify with certain traits. For example, if someone is an
ethnic minority, then their ethnicity is a distinctive trait. Therefore, they may have a stronger
level of identification with their ethnicity than someone who belongs to the ethnic majority
(Grier and Deshpande, 2001).
Content of the ad can impact minority ethnic groups differently. For instance, Rößner,
Kämmerer, and Eisend (2017) found that using humor when portraying ethnic minorities
increased positive perceptions of advertisements and reduced views of stereotyping. Another
study suggests that showing ethnic minorities in a variety of contexts should decrease stereotypes
and increase the effectiveness of the advertisements (Taylor & Costello, 2017). Interestingly,
Hazzouri, Main and Carvalho (2017) found that ethnic minorities react negatively towards
advertisements that feature other ethnic minority groups. Due to the difficulty in determining
exactly how to successfully advertise to ethnic minorities, this study aims to investigate how
ethnic identification, identification with the advertisement and consumer perceptions of
advertiser motivations can lead to positive behavioral intentions.

8
Hypotheses Development
In the United States, the ethnic majority is Caucasian, accounting for approximately
76.9% of the population. Hispanic Americans account for approximately 17.8% of the
population, African Americans account for 13.3% of the population, and Asian Americans
account for 5.7% (U.S. Census Bureau). Caucasian Americans make up the majority in the US,
and research has shown that majority ethnic groups tend to not identify as strongly with their
ethnicity as minority ethnic groups (Verkuyten, 2005):
H1: On average, Caucasian Americans will identify less with their ethnicity than
minority groups of Hispanic, African, and Asian Americans.
A study by Johnson and Grier (2012) on race-stereotyping in advertising found that
attitudes, ranging from amusement to anger, varied among viewers depending the strength of
one’s identification with the ethnic group being portrayed. Identifying with your ethnicity is
important and can impact how consumers identify with the brand/ad itself. Consumers can
identify with brands, or with brand advertisements, and this can lead to positive behavioral
outcomes. Brands can positively benefit from and utilize consumer identification.Consumers
who identify with an ad will be more fully committed and loyal to the brand, are more likely to
repurchase from them, and generate more positive WOM (Tuskej, Golob & Podnar, 2011; Kim,
Han and Park, 2001; Kuenzel & Vaux Halliday, 2008). Hong and Yang (2009) found that
identification mediates the influence of organizational reputation on positive WOM. Keh and Xie
(2009) found that identification influences commitment and willingness to pay a price premium.
Therefore we expect:

9
H2: Participants who have a stronger level of identification with their ethnicity will have
positive behavioral intentions after viewing ads that feature members of their ethnic
group.
H3: Participants who have a stronger level of identification with their ethnicity will
identify more with advertisements that feature members of their ethnic group
Additionally, due to the fact that minorities tend to respond negatively to advertisements
featuring other ethnic groups (and not their own) we expect (Hazzouri et al., 2017):
H4: Minority groups will identify less with ads featuring ONLY other minority groups.
Researchers in advertising and sales have examined the influence of a source’s racial congruence
on the receiver’s purchase intent (e.g. Simpson et al., 2000; Whittler, 1989; Whittler & DiMeo,
1991; Kareklas & Polonsky, 2011), finding positive correlations. The present research seeks to
expand on these findings in order to understand if identifying with the overall advertisement,
based on the actors being a shared ethnicity, would lead to positive future behavioral intentions.
H5: Those who identify strongly with an ad will be more likely to have positive
behavioral intentions than those who do not identify strongly with the ad.
10
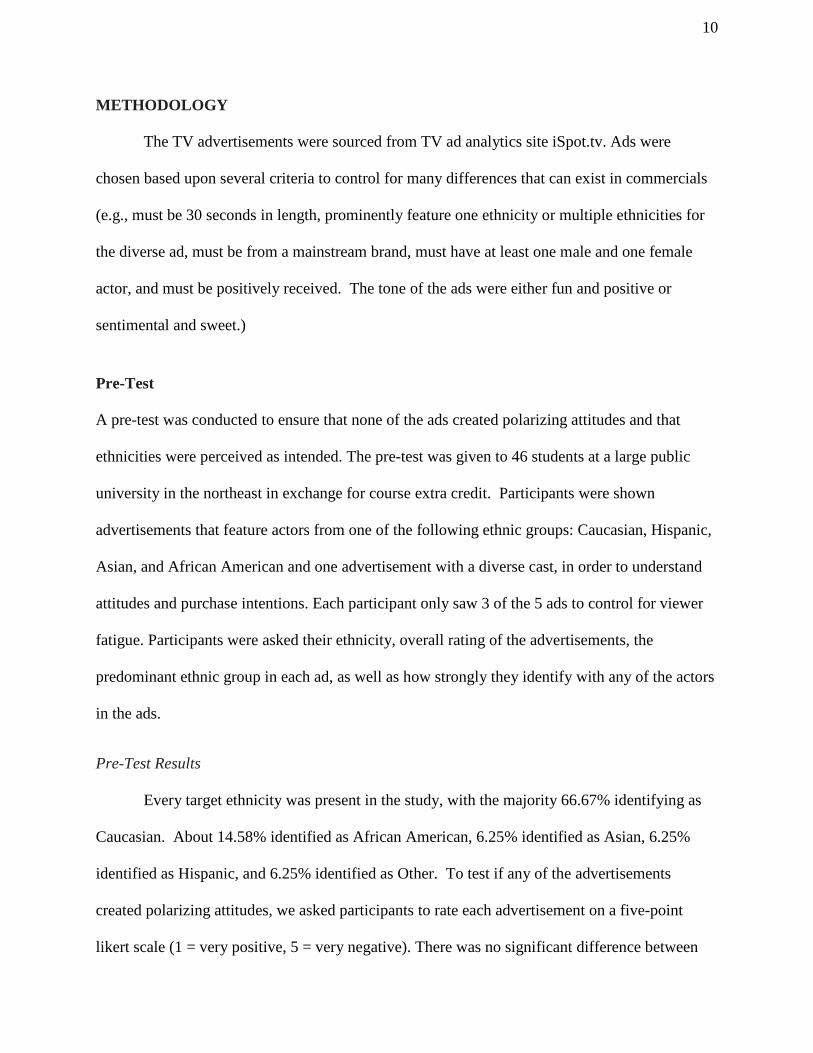
METHODOLOGY
The TV advertisements were sourced from TV ad analytics site iSpot.tv. Ads were
chosen based upon several criteria to control for many differences that can exist in commercials
(e.g., must be 30 seconds in length, prominently feature one ethnicity or multiple ethnicities for
the diverse ad, must be from a mainstream brand, must have at least one male and one female
actor, and must be positively received. The tone of the ads were either fun and positive or
sentimental and sweet.)
Pre-Test
A pre-test was conducted to ensure that none of the ads created polarizing attitudes and that
ethnicities were perceived as intended. The pre-test was given to 46 students at a large public
university in the northeast in exchange for course extra credit. Participants were shown
advertisements that feature actors from one of the following ethnic groups: Caucasian, Hispanic,
Asian, and African American and one advertisement with a diverse cast, in order to understand
attitudes and purchase intentions. Each participant only saw 3 of the 5 ads to control for viewer
fatigue. Participants were asked their ethnicity, overall rating of the advertisements, the
predominant ethnic group in each ad, as well as how strongly they identify with any of the actors
in the ads.
Pre-Test Results
Every target ethnicity was present in the study, with the majority 66.67% identifying as
Caucasian. About 14.58% identified as African American, 6.25% identified as Asian, 6.25%
identified as Hispanic, and 6.25% identified as Other. To test if any of the advertisements
created polarizing attitudes, we asked participants to rate each advertisement on a five-point
likert scale (1 = very positive, 5 = very negative). There was no significant difference between

11
the attitudes towards any of the ads (p>.692) with the exception of the fourth advertisement
which was significant (F(4)=.564, p=.039). However, when a test of homogeneity of variances
was run on the data, that advertisement was the only one that was significant (p=.40), thus the
uneven group sizes may have caused this result.
Next, we tested whether participants could correctly identify the ethnicity of the actors in
the ads. Ad 1 only had African American actors, which was correctly identified by 96% of
participants. Ad 3 only had an Asian American cast, which was correctly identified by 92% of
participants. Ad 4 only had a Caucasian cast, which was correctly identified by 100% of
participants. Ad 5 only had a Hispanic cast, but the results were mixed; 40% of participants
thought Asian actors were present in the ad, 12% thought African American actors were present,
68% thought Caucasian actors were present, and 72% correctly identified Hispanics as present in
the ad. All participants were also asked to rate the diversity of the advertisements on a five-point
semantic scale of Diverse to Not Diverse. Ad 2, which featured a diverse cast, was rated as
diverse by 80% of participants.
Participants were asked to identify the intended audience for each ad. The majority of
participants (85.6%) responded that each ad was intended for “Any audience” rather than for just
one ethnicity. Participants were also asked if they felt the advertisement was intended for people
like them, if the actors were an authentic representation of the target market and if they felt the
ad represented them, and of they identified with anyone in the ad. Despite recognizing that the
advertisements utilized actors from different ethnic groups, there was not a significant difference
between the ethnicity of the participants and their level of identification with any of the ads (ad
1: p>.183, ad 2:p>.530, ad 3:p>.264, ad 4:p>.495, ad 5:p>.403).

12
These results indicate that the advertisements did not create polarizing attitudes, and did
not create significant identification with any particular ethnicity, while still allowing for
participants to correctly identify the primary ethnicity, with the exception of the latino ad. Based
on these results, 3 other latino commercials were pretested by a different group of students from
the same university. The 25 participants were able to correctly identify the latino actors (85%)
for one of the advertisements, while still not having a significantly different overall assessment
of the ad, or a significant identification with it. Therefore, this ad was used for the main study.
Measures
Manipulation Check
Participants were asked what ethnicity was featured most in the advertisement to ensure
each ad was viewed as either diverse or only featuring one particular ethnicity. They also rated
the diversity of the ad on a scale from diverse to not diverse.
Attention Check
For pages showing the selected advertisements, participants were not allowed to move
onto the next page of the survey until 30 seconds (the time of each ad) has passed to ensure each
participant has viewed the selected advertisement.
Attitudes
At the beginning of the study, participants rated each of the brands on a five-point likert
scale (1 = very negative, 5 = very positive) to measure whether an ad had an effect on the
viewer’s attitude or if an attitude was pre-existing. After each ad was shown, participants rated
their feelings toward the advertisement and their feelings toward the brand.

13
Behavioral and Purchase Intent
An additional three item, four-point likert scale (1 = strongly disagree, 4 = strongly
agree) asked about behavioral intent (i.e., “I would like to try the brand advertised,” “I would
like to learn more about the brand advertised,” and “I would likely buy from the brand
advertised”).
Identification with the Advertisement
A four item, four-point likert scale (1 = strongly disagree, 4 = strongly agree) asked about
the participant’s level of identification with the advertisement with items adopted from Cooley et
al. (2015) and asked about the targeting of the ad (i.e., “I feel the advertisement was intended for
people like me”) (Johnson & Grier, 2012), authenticity of the actors (i.e., “The actors in the ad
are an authentic representation of the target market”), homophily (i.e., “I identify with one or
more of the actors in the ad”), and whether the participant felt represented in the ad (i.e., “I feel I
am represented in the ad”).
Ethnic Identification
A nine item, four-point likert scale (1 = strongly disagree, 4 = strongly agree), was
adopted from Phinney’s (1992) multigroup ethnic identity measure (MEIM) in order to measure
the participant’s strength of ethnic identification. Two additional items ask about the
participant’s attitude towards their ethnic group’s representation in advertising and media (i.e., “I
have a more positive attitude towards brands that feature members of my ethnic group in its
advertisements” and “Seeing my race/ethnicity represented in media is important to me”).
Open Response

14
Several open response questions were included in order to understand thought processes.
Questions included perception of advertiser motivations for the advertisements, and what about
the advertisement participants most identified with.
Procedure
This study utilized advertisements that feature actors from one of the following ethnic
groups: Caucasian, Hispanic, Asian, and African American. Additionally, there was an
advertisement with a diverse cast which featured all four ethnicities. Participants were instructed
to watch a series of television advertisements. There were 5 advertisements in total and each
participant watched 3, displayed in random order, for a total of at least 150 viewers of each ad.
All ads were 30 seconds in length to ensure standardization and each participant will only be
expected to view 3 ads for a total of 1.5 minutes of viewing time in order to avoid viewing
fatigue.
Figure 1 - Screenshot of Ad 1: Caramel M&M’s “Sticky & Square” (2017). Features an African American girl and African American man.

15
Figure 2 - Screenshot of Ad 2: General Mills “Genuine” (2017). Features a diverse cast in a montage.
Figure 3 - Screenshot of Ad 3: Amazon Prime “Lion” (2016). Features a young Asian couple, a baby, and their dog.
Figure 4 - Screenshot of Ad 4: State Farm “Never” (2014). Features a young Caucasian couple.

16
Figure 5 - Screenshot of Ad 5: Head & Shoulders “Mom Knows Best” (2015). Features a young Hispanic man and his mother, played by actress Sofia Vergara.
RESULTS
Participants
The survey was distributed through Amazon Mechanical Turk and received 439 total
responses, 307 of which were approved and compensated for their time. Twenty-one responses
were removed for various reasons, including rushing the survey and providing answers that
demonstrated a lack of attention, leaving 286 qualified participants.
A quota was set for the study in order to get a fairly equal number of participants for each
ethnicity in the study. Out of the 286 participants, 64 (22%) were Asian, 71 (25%) were African
American, 63 (22%) were Hispanic, 71 (25%) were Caucasian, and 17 (6%) were another
ethnicity. There were slightly more male participants (57%), and participants ranged from 18-65
years old.
Attitudes
While identification with an advertisement and ethnicity were strongly correlated,
attitudes towards the ad and the brand showed less correlation. Ad 5 was the least popular among
participants, with the exception of Hispanic American participants, and had the most variation

17
between ad and brand attitudes. Ad 3 for Amazon Prime was the most popular for all groups,
which may have been due to the product. Caucasian Americans also responded more favorably
to the Ad 4 in comparison to other groups.
Figure 6 - Ad attitudes (left) and brand attitudes (right) for each advertisement, grouped by ethnicity.
In response to the statement “Seeing my race/ethnicity represented in media is important
to me,” minority participants mostly agreed, averaging at 2.0, while Caucasian participants
disagreed, averaging at 3.0. A similar statement regarding the study’s topic, “I have a more
positive attitude towards brands that feature members of my ethnic group in its advertisements,”
followed the same trend.

18
Figure 7 - Box plot showing the average and range of responses to “Seeing my race/ethnicity represented in media is important to me,” grouped by ethnicity. This statement, which mostly pertains to the topic at hand, is included in the strength of identification measure.

19
Figure 8 - Box plot showing the average and range of responses to “I have a positive attitude towards brands that feature members of my ethnic group in its advertisements,” grouped by ethnicity. This statement asks participants to explicitly reflect on the topic of the study.
Identification
There was a significant difference in ethnic identification across ethnicities. Results were
reverse scored so the lower the score, the higher the identification. Hypothesis 1 was confirmed:
Caucasian participants identified least with their ethnic group, while Asian, African, and
Hispanic Americans identified more strongly with their respective groups (see figure 9).
Mean t Sig
Asian 1.86 36.183 .000
African American 1.92 33.011 .000
Hispanic 1.95 37.555 .000
Caucasian 2.42 41.703 .000
Figure 9 – With a lower score equaling a higher level of identification, this table shows the strength of identification each participating ethnicity has with their ethnic group.
Identification with all advertisements was significant for each ethnic group (p=.000).
Each ethnic group identified most with an advertisement that featured members of their ethnic
group, providing support for H3 and H4. The advertisement featuring a diverse cast had the least
variation among participants (variance = .455).

20
Figure 10 – This graph shows how strongly participants identified with each advertisement.
When looking at those who strongly identify with their respective ethnicities:
African American participants who strongly identify with their ethnicity responded
positively to the advertisements. The lowest (therefore best) rating was for ad 2 which featured a
diverse case (m=1.53) and this was significant (F(1)=16.156, p=.000). Ad 1, which featured an
African American cast, was closely rated (m=1.69), and also significant (F(1)=11.752, p=.001).
Asian participants who strongly identified with their ethnicity, identified with ad 3 which
featured an Asian cast most (m=1.46). An ANOVA shows these results are significant
(F(1)=11.955, p=.001). Hispanic participants who strongly identified with their ethnicity
identified most strongly with ad 5 which featured a Hispanic cast (m=1.63, F(1)=8.329, p=.007).
These results confirm H3 and H4, specifically that participants who have a stronger level of
identification with their ethnicity, identify more with an ad that features members of that
particular ethnic group as opposed to other ethnic groups.
21
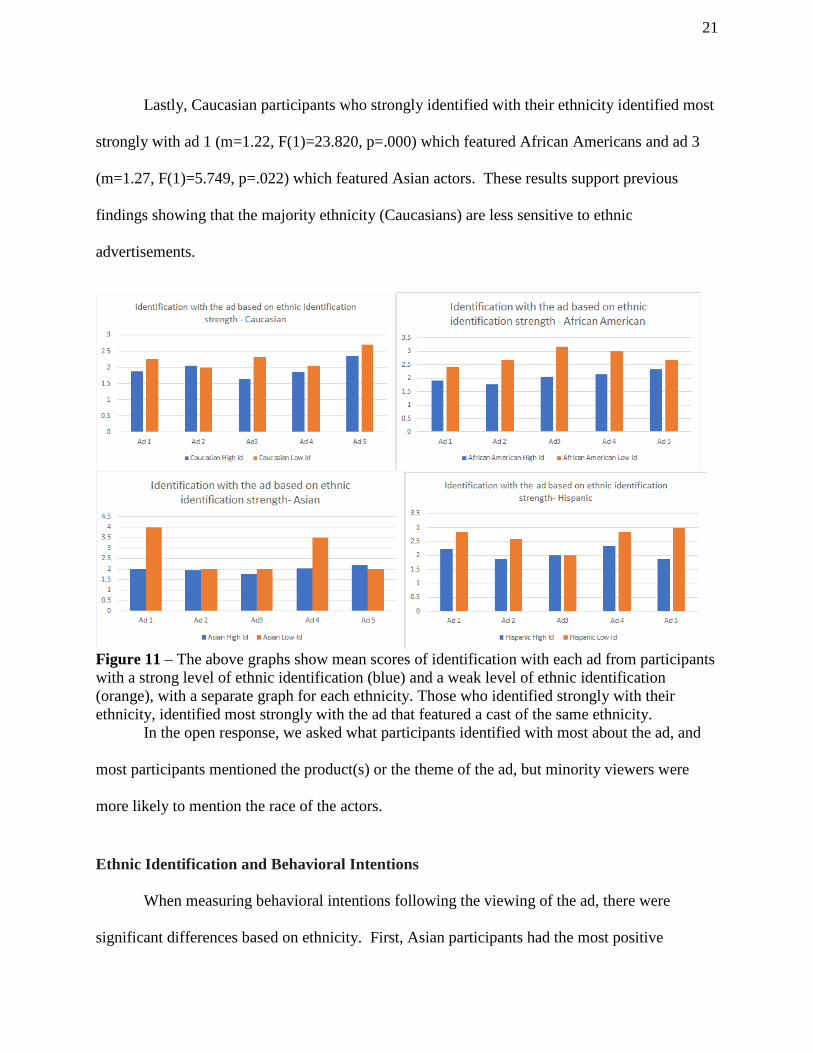
Lastly, Caucasian participants who strongly identified with their ethnicity identified most
strongly with ad 1 (m=1.22, F(1)=23.820, p=.000) which featured African Americans and ad 3
(m=1.27, F(1)=5.749, p=.022) which featured Asian actors. These results support previous
findings showing that the majority ethnicity (Caucasians) are less sensitive to ethnic
advertisements.
Figure 11 – The above graphs show mean scores of identification with each ad from participants with a strong level of ethnic identification (blue) and a weak level of ethnic identification (orange), with a separate graph for each ethnicity. Those who identified strongly with their ethnicity, identified most strongly with the ad that featured a cast of the same ethnicity. In the open response, we asked what participants identified with most about the ad, and
most participants mentioned the product(s) or the theme of the ad, but minority viewers were
more likely to mention the race of the actors.
Ethnic Identification and Behavioral Intentions
When measuring behavioral intentions following the viewing of the ad, there were
significant differences based on ethnicity. First, Asian participants had the most positive

22
behavioral intentions for ad 3 which featured their ethnic group (m=1.55), showing support for
H2. The same was not true for African Americans who, while being ethnically represented in ad
1, had the most positive behavioral intentions after viewing ads 2 (m=1.78) and 3 (1.83).
Hispanic participants had the most positive behavioral intentions for ad 3 (m-1.57) which
featured predominantly Asian actors. The same was true for Caucasian participants (ad 3 m=
1.75). This could be because of the brand featured in ad 3 (Amazon) despite there not being a
significant difference in overall brand awareness or preference specified by participants at the
beginning of the survey.
These results change when factoring in the level of ethnic identification:
Asian African American Hispanic Caucasian
Ad 1 1.383 1.680 1.824 1.111
Ad 2 1.579 1.500 1.783 1.571
Ad3 1.397 1.544 1.386 1.166
Ad 4 1.772 1.888 2.136 2.125
Ad 5 1.500 2.160 1.771 1.944
Figure 12 – Mean scores with strong ethnic identification: Those who identified strongly with their ethnicity, were more likely to have positive behavioral intentions after viewing an ad with a cast of the same ethnicity.
Asian participants scored lowest on ads 1 (which featured an African American cast) and
3 (which featured an Asian cast), yet only ad 1 showed a significant difference between the high
and low ethnic identification groups (F(1)=17.407, p=.000). African American participants
scored lowest on ads 2 (diverse cast, m=1.5), 3 (m=1.54) and 1 (1.68). All three ads showed
significant differences in behavioral intentions between those who strongly identified with their

23
ethnicity and those who did not (ad 1: F(1)=7, p=.007, ad 2: F(1)=10.559, p=.002, ad 3:
F(1)=14.201, p=.000). Hispanic participants scored lowest on ad 3 (which featured an Asian
cast, m=1.3) and 5 (which featured a Hispanic cast (m=1.77). Both were significant (ad 3:
F(1)=11.101, p=.002, ad 5: F(1)=4.214, p=.048). Caucasian participants scored lowest on ads 1
(which featured an African American cast, m=1.11) and 3 (which featured an Asian cast,
m=1.16). Both ads were significant and so was ad 2 which featured a diverse case (ad
1:F(1)=14.938, p=.000, ad 2: F(1)=6.025, p=.018, ad 3: F(1)=6.536, p=.015).
These results partially support H2, that participants who have a stronger level of
identification with their ethnicity will have positive behavioral intentions after viewing ads that
feature members of their ethnic group. African American, Asian and Hispanic participants who
strongly identify with their ethnicity did have positive behavioral intentions after viewing ads
that featured their ethnicity, however they had positive behavioral intentions to other
advertisements as well.
Due to this lack of effect, a mediation analysis was run using Process in SPSS to see if
identification with the ad mediates the relationship between ethnic identification and behavioral
intentions (Hayes, 2018). The findings were significant for all ads (ad 1: F(1)=25.6338, p=.000,
ad 2:F(1)=164.0415, p=.000, ad 3: F(1)=108.3705, p=.000, ad 4: F(1)=104.6797, p=.000, ad 5:
F(1)=168.3224, p=.000).

24
Figure 13 – Mean behavioral intentions for those who strongly identified with the ad.
Hypothesis 5 states that those who identify strongly with an ad will be more likely to
have positive behavioral intentions than those who do not identify strongly with the ad. Those
who identified strongly with the ad, did in fact have the lowest (and therefore) most positive
behavioral intentions (see figure 10). All 5 ANOVA’s for behavioral intentions for those who
identify strongly with the ad were significant and H5 was confirmed (Ad1: F(1)=64.951, p=.000,
Ad2: F(1)=71.291, p=.000, Ad3: F(1)=54.855, p=.000, Ad4: F(1)=63.585, p=.000, Ad5:
F(1)=122.467, p=.000).
DISCUSSION, LIMITATIONS AND FUTURE RESEARCH
Findings suggest that one’s behavior after seeing an advertisement is contingent on the
viewer’s strength of identification with advertisements featuring their ethnic group. The
advertisement with the diverse cast had the most neutral response, which suggests that
advertisers may benefit from using multi-ethnic ads to attract a broader audience, but may want
to use ethnically-specific ads if trying to expand reach to a particular underrepresented

25
demographic segment. These results demonstrate that while sometimes, ethnic identification
may impact overall positive behavioral intentions, identification with the ad itself is something
that needs to be given more attention. This is something that might have been demonstrated with
the identification with ad 3 by many participants. Despite the actors being Asian, many groups
identified with the ad and felt positively towards Amazon following viewing of the ad.
Especially for minority ethnicities, if companies can get consumers to identify with their brand
and its advertisements, they are more likely to be successful.
It is less important to Caucasian Americans that their ethnic group is represented in
media, which could be indicative of their current oversaturated status, but it also explained by the
weakness of their ethnic identity. For minorities, however, representation in the media matters,
because minorities tend have stronger ethnic identities. If representation matters to minorities, it
should also matter for brands.
This study did have some potential limitations. Previous studies on racial and ethnic
representation in advertisements have used custom-made print advertisements, with different
models in each version, but the same content. Since our study used existing television
advertisements, there was a risk that participants had already seen the advertisements and
formulated their own opinions prior to the study. Each advertisement featured a different brand
and product, so variations in attitude and purchase intent could have been influenced by the
product rather than the ethnicity of the actors. For example, Ad 3 was for Amazon Prime, and the
survey was distributed using Amazon’s survey distribution platform Mechanical Turk. So
participants were not only likely to have pre-formed opinions about the brand, but they were
likely to already be users of their products. On top of product variation, participants could have
been influenced by the many other differences in the advertisements that were difficult to

26
control: humor, tone, theme, music, age, gender, etc. The advertisement for Amazon included a
baby and a dog, so viewers could have identified with the adorable pairing instead of the
ethnicity of the actors in the ad.
To properly mimic the past studies that used print ads, future research should use custom-
made television ads with the same products and content, only swapping out the actors to
manipulate ethnicity. Future research should also further investigate the differences in attitudes
and expectations of seeing each ethnicity presented in advertising. Overall, it is more important
than ever for advertisers to make advertisements that people respond positively towards and that
motivate consumers to positively interact with the brand. By showing advertisements that ethnic
minorities can identify with, brands will be more successful in reaching these groups and making
them feel welcome.

27
REFERENCES
Avery, D. R. (2003). Reactions to diversity in recruitment advertising--are differences
black and white? Journal of Applied Psychology, 88(4), 672-679.
Becker-Olsen, K., Cudmore, A., & Hill, R. H. (2006). The impact of perceived corporate
social responsibility on consumer behavior. Journal of Business Research, 59, (1), 46-53
Belch, G., Belch, M. (2012). Advertising and promotion: an integrated marketing
communications perspective. - 9th ed.
Brock, T. C. (1965). Communicator - recipient similarity and decision change. Journal of
Personality & Social Psychology, 1, 650-654.
Broderick, A., C. Demangeot, N. Adkins, G. Henderson, G. Johnson, E. Kipnis, N.
Ferguson, et al. (2011). “Consumer Empowerment in Multicultural Marketplaces:
Navigating Multicultural Identities to Reduce Consumer Vulnerability.” Journal of
Research for Consumers 19: 1–13.
Broderick, A., C. Demangeot, E. Kipnis, M. A. Zúñiga, A. Roy, C. Pullig, R. D. Mueller,
et al. (2011). “No Harm Done? Culture-based Branding and its Impact on Consumer
Vulnerability: A Research Agenda.” Social Business 1 (3): 263–280.
Broussard, S. C., & Garrison, M. E. B. (2004). The relationship between classroom
motivation and academic achievement in elementary school-aged children. Family and
Consumer Sciences Research Journal, 33(2), 106–120.
Byrne, D. (1961). Interpersonal attraction and attitude similarity. Journal of Abnormal
and Social Psychology. 62, 713-715.
Byrne, D., & Nelson, D. (1965). Attraction as a linear function of the proportion of
positive reinforcements. Journal of Personality and Social Psychology. 1, 659-663.

28
Churchill, G. A., Collins, R. H., & Strang, W. A. (1975). Should retail salespersons be
similar to their customers? Journal of Retailing, 70, 383-393.
Cooley, D., Brice, J., Becerra, E., Chapa, S. (2015). The effect of cosmopolitanism on
multi-ethnic U.S. markets under varying conditions of diversity in advertising. Academy
of Marketing Studies Journal. Vol. 19, No. 3, 2015, p. 119+.
Deci, E. L., Koestner, R., & Ryan, R. M. (1999). A meta-analytic review of experiments
examining the effects of extrinsic rewards on intrinsic motivation. Psychological Bulletin,
125(6), 627–668.
Demangeot, C., R. D. Mueller, G. Henderson, N. Ferguson, J. Mandiberg, A. Roy, N.
Adkins, et al. (2013). Toward Intercultural Competency in Multicultural Marketplaces.
Journal of Public Policy & Marketing. 156–164.
Deshpandé, R., W. D. Hoyer, and N. Donthu. (1986). “The Intensity of Ethnic A liation:
A Study of the Sociology of Hispanic Consumption.” Journal of Consumer Research 13:
214–220.
Deshpandé, R., and D. M. Stayman. (1994). A Tale of Two Cities: Distinctiveness
Theory and Advertising E ectiveness. Journal of Marketing Research. 31: 57–64.
Evans, F. B. (1963). Selling as a dyadic relationship. American Behavioral Scientist, 6(9),
76-79.
Greenwald, A. G., McGhee, D. E., & Schwartz, J. L. K. (1998). Measuring individual
differences in implicit cognition: The implicit association test. Journal of Personality and
Social Psychology, 74(6), 1464-1480. http://dx.doi.org/10.1037/0022-3514.74.6.1464

29
Grier, S. and Deshpande, R. (2001). Social dimensions of consumer distinctiveness: the
influence of social status on group identity and advertising persuasion. Journal of
Marketing Research, Vol. 2, pp. 216-24.
Hazzouri, M., Main, K., Carvalho, S. (2017). Ethnic minority consumers reactions to
advertisements featuring members of other minority groups. International Journal of
Research in Marketing.
Hennessey, M. G. (1999). Probing the dimensions of metacognition: Implications for
conceptual change teaching-learning. National Association for Research in Science.
Hirschman, E. C. (1981). American Jewish Ethnicity, Its Relationships to Some Selected
Aspects of Consumer Behavior. Journal of Marketing, 45 (Summer): 102-110.
Hong, S. Y., & Yang, S. U. (2009). Effects of reputation, relational satisfaction, and
customer–company identification on positive word-of-mouth intentions. Journal of Public
Relations Research, 21(4), 381-403.
Jellison, J. M., & Mills, J. (1969). Effect on opinion change similarity between the
communicator and the audience he addresses. Journal of Personality and Social
Psychology 9, no. 2, pp. 153-156.
Jellison, J. M., & Mills, J. (1967). Effect of similarity and fortune of the other on
attraction. Journal of Personality and Social Psychology, 1967, 5, 459-463.
Jones, E. Davis, K. (1965). The attribution process in person perception. In: Berkowitz L
editor. Advances in Experimental Social Psychology, vol. 2. New York: Academic Press.
p220-66.

30
Johnson, G., Grier, S. (2012). “What about the intended consequences?” Examining the
effects of race-stereotyped portrayals on advertising effectiveness. Journal of
Advertising. Vol. 41, No. 3 p. 91+.
Kareklas, I., & Polonsky, M. (2011). Consumer response to spokesperson’s race: A
research synthesis of racial similarity effects in advertising, NA - Advances in Consumer
Research Volume 38, eds.
Keh, H. T., & Xie, Y. (2009). Corporate reputation and customer behavioral intentions:
The roles of trust, identification and commitment. Industrial Marketing Management,
38(7), 732-742.
Kelley H. H. (1967). Attribution theory in social psychology. In: Levine D editor.
Nebraska Symposium on Motivation, vol. 15. Lincoln: University of Nebraska Press;
1967.
Kelley H. H. (1971). Attribution theory in social interaction. In: Jones EE, Kanouse DE,
Kelley HH, Nisbett RE, Valins S, Weiner B, editors. Attribution: perceiving the causes of
behavior. Morristown (NJ): General Learning Press; 1972. p. 1-26
Khan, H., Lee, R., Lockshin, L. (2015). Do ethnic cues improve advertising effectiveness
for ethnic consumers? Australasian Marketing Journal. Vol. 23, Iss 3 pp. 218 - 226.
Kim, C. K., Han, D., & Park, S. B. (2001). The effect of brand personality and brand
identification on brand loyalty: Applying the theory of social identification. Japanese
Psychological Research, 43(4), 195-206.
King, O. (2017). The case for diversity in advertising. Think With Google.
Kipnis, E., A. Broderick, C. Demangeot, N. Adkins, N. S. Ferguson, G. Henderson, G.
Johnson, et al. (2013). “Branding Beyond Prejudice: Navigating Multicultural

31
Marketplaces for Consumer Well-being.” Journal of Business Research 66 (8): 1186–
1194.
Kuenzel, S., & Vaux Halliday, S. (2008). Investigating antecedents and consequences of
brand identification. Journal of Product & Brand Management, 17(5), 293-304.
Lai, E. (2011). Motivation: A literature review research report. Retrieved November 3,
2017. from
https://images.pearsonassessments.com/images/tmrs/Motivation_Review_final.pdf
Lee, E., Edwards, S., Ferle, C. (2014). Dual attitudes toward the model’s race in
advertising. Journal of Black Studies. Vol. 45, No. 6, pp. 479 - 506.
McPherson, M., Smith-Lovin, L., & Cook, J. (2001). Birds of a feather: Homophily in
social networks. Annual Review of Sociology, 27(1), 415-444.
doi:10.1146/annurev.soc.27.1.415
Minor, M. (1992). Comparing the Hispanic and non-Hispanic markets: How different are
they? Journal of Services Marketing, 6 (2): 29-32.
Minor-Cooley, D., & Brice, J. J. (2007). Please check the appropriate box: the problems
with ethnic identification and its potential in cross-cultural marketing. Academy of
Marketing Science Review. Retrieved from http://link.galegroup.com.libserv-
prd.bridgew.edu/apps/doc/A177719430/AONE?u=mlin_s_bridcoll&sid=AONE&xid=6b
b0e138
Phinney, J. (1992). The Multigroup Ethnic Identity Measure: A new scale for use with
adolescents and young adults from diverse groups. Journal of Adolescent Research, 7,
156-176.

32
Rößner, A., Kämmerer, M., & Eisend, M. (2017). Effects of ethnic advertising on
consumers of minority and majority groups: the moderating effect of
humor. International Journal of Advertising, 36(1), 190-205.
Rogers, C. (2016). Just 19% of people in ads are from minority groups, new research
finds. Marketing Week.
Rogers, E., & Bhowmik, D. P. (1970). Homophily-heterophily: Relational concepts for
communication research. Public Opinion Quarterly, 34, 523-538.
Rossiter, J., & Chan, A. (1998). "Ethnicity in business and consumer behavior." Journal
of Business Research, 42 (2): 127-134.
Rotheram, M., & and Phinney, J. (1987). Introduction: Definitions and perspectives in the
study of children's ethnic socialization. Children's Ethnic Socialization. Eds. Jean S.
Phinney and Mary J. Rotheram. Newbury park, CA: Sage, 10-28.
Ryan, R. M., Connell, J. P., & Plant, R. W. (1990). Emotions in nondirected text learning.
Learning and Individual Differences, 2(1), 1–17.
Simpson, E. M., Snuggs, T., Christiansen, T., & Simples, K. E. (2000). Race, homophily,
and purchase intentions and the black consumer. Psychology & Marketing, 17(10), 877-
889.
Smith, A. J. (1957). Similarity of values and its relation to acceptance and the projection
of similarity. Journal of Psychology. 43, 251-260.
Speed, R., Thompson, P. (2000), Determinants of Sports Sponsorship Response, Journal
of Academic Marketing Science, Vol. 28, pp. 226-238.
Stayman, D. M., and Deshpande, R. (1989). Situational ethnicity and consumer
behavior." Journal of Consumer Research, 16 (December): 361-371.

33
Szybillo, G., Jacoby, J. (1974). Effects of different levels of integration on advertising
preference and intention to purchase. Journal of Applied Psychology. Vol. 59, No. 3, pp.
274-280.
Taylor, C. R., Costello, J. P. (2017). Corporate Social Responsibility and the Portrayal of
Minority Groups in Advertising. In Handbook of Integrated CSR Communication (pp.
361-375). Springer, Cham.
Taylor, C., Murphy, J. (2017). Diversity is the new norm in super bowl advertising:
study. Forbes.
Tsai, W., Li, C. (2012). Bicultural advertising and Hispanic acculturation. Hispanic
Journal of Behavioral Sciences. Vol. 34, Iss 2 pp 305-322.
Tuškej, U., Golob, U., & Podnar, K. (2013). The role of consumer–brand identification in
building brand relationships. Journal of business research, 66(1), 53-59.
U.S. Census Bureau. 2010 Census of Population, P94-171 Redistricting Data File.
Updated every 10 years. American FactFinder. Retrieved from:
https://www.census.gov/quickfacts/fact/table/US/PST045216#viewtop
Verkuyten, M. (2005). Ethnic group identification and group evaluation among minority
and majority groups: testing the multiculturalism hypothesis. Journal of personality and
social psychology, 88(1), 121.
Webb, D. J., Mohr, L. A. (1998), A Typology of Consumer Responses to Cause-Related
Marketing: From Skeptics to Socially Concerned, Journal of Public Policy Marketing,
Vol. 17, pp. 226-238.
Whittler, T. (1989). The effects of actor’s race in commercial advertising: review and
extension. Journal of Advertising. Vol. 20 Iss 1 pp 54 - 60.

34
Whittler, T., DiMeo, J. (1991). Viewer’s reaction to racial cues in advertising stimuli.
Journal of Advertising Research. 31 (6): 37-46.
Woodside, A. G., & Davenport, J. W., Jr. (1974). The effect of salesman similarity and
expertise on consumer purchasing behavior. Journal of Marketing Research, 7, 151-175.
Zúñiga, M. A. (2015). African-American Consumers’ Evaluations of Ethnically Primed
Advertisements. Journal of Advertising 45 (1): 1–8.
Zúñiga, M. A. (2016a). Power Distance and Maximizing. Working Paper, Earl G. Graves
School of Business and Management, Morgan State University, Baltimore, MD.
Zúñiga, M. A. (2016b). Role of Ethical Ideology and Ethical Appraisals in Evaluations of
Sex Appeals in Advertising. Working Paper, Earl G. Graves School of Business and
Management, Morgan State University, Baltimore, MD.
Zúñiga, M. A., & Torres, I. M. (2017). Millennials’ ethical ideology effects on responses
to alcohol advertisements: The role of strength of ethnic identification and ethical
appraisal of the ad. Journal of Marketing Communications, 1-18.