Yorktown Survey
47
2955 Valmont Road Suite 300 777 North Capitol Street NE Suite 500 Boulder, Colorado 80301 Washington, DC 20002 n-r-c.com • 303-444-7863 icma.org • 800-745-8780 Yorktown, IN Technical Appendices 2015
-
Upload
lafjconline -
Category
Documents
-
view
324 -
download
0
description
Yorktown Survey
Transcript of Yorktown Survey
2955 Valmont Road Suite 300 777 North Capitol Street NE Suite 500 Boulder, Colorado 80301 Washington, DC 20002 n-r-c.com • 303-444-7863 icma.org • 800-745-8780
Yorktown, IN
Technical Appendices
2015
The National Citizen Survey™
The National Citizen Survey™ © 2001-2015 National Research Center, Inc.
The NCS™ is presented by NRC in collaboration with ICMA.
Contents Appendix A: Complete Survey Responses .......................................... 1
Appendix B: Benchmark Comparisons ............................................. 21
Appendix C: Detailed Survey Methods ............................................. 30
Appendix D: Survey Materials ......................................................... 35
The National Citizen Survey™
1
Appendix A: Complete Survey Responses
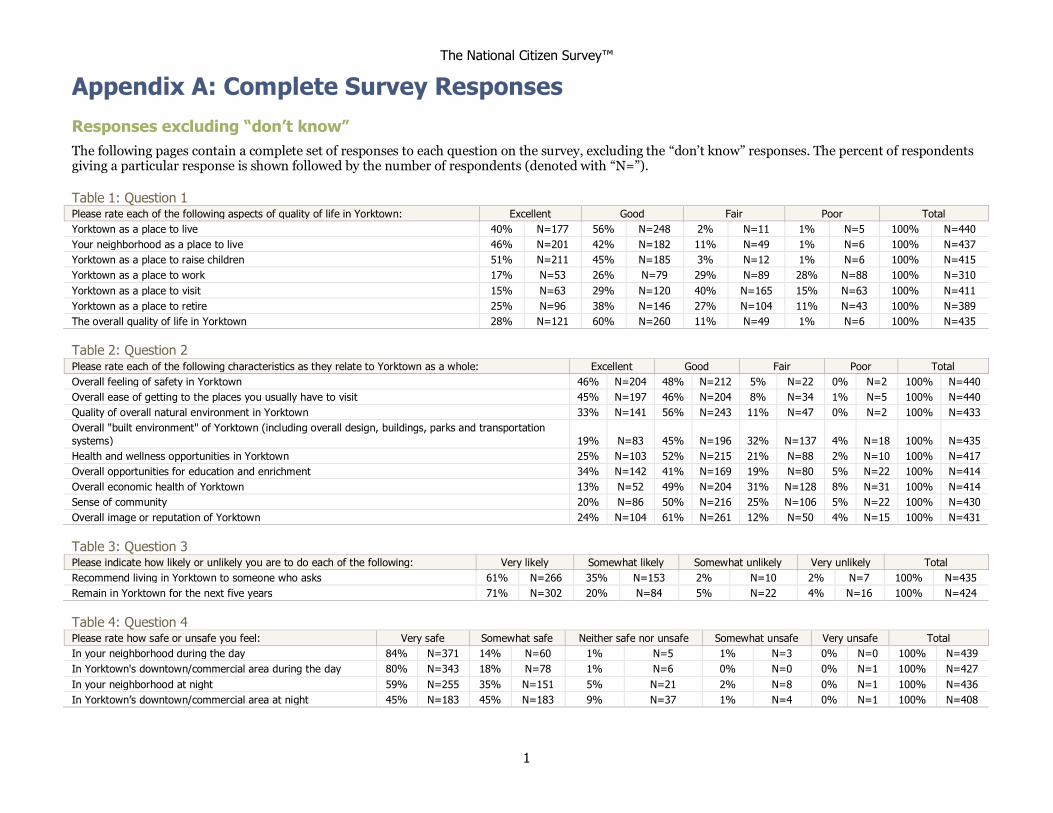
Responses excluding “don’t know”
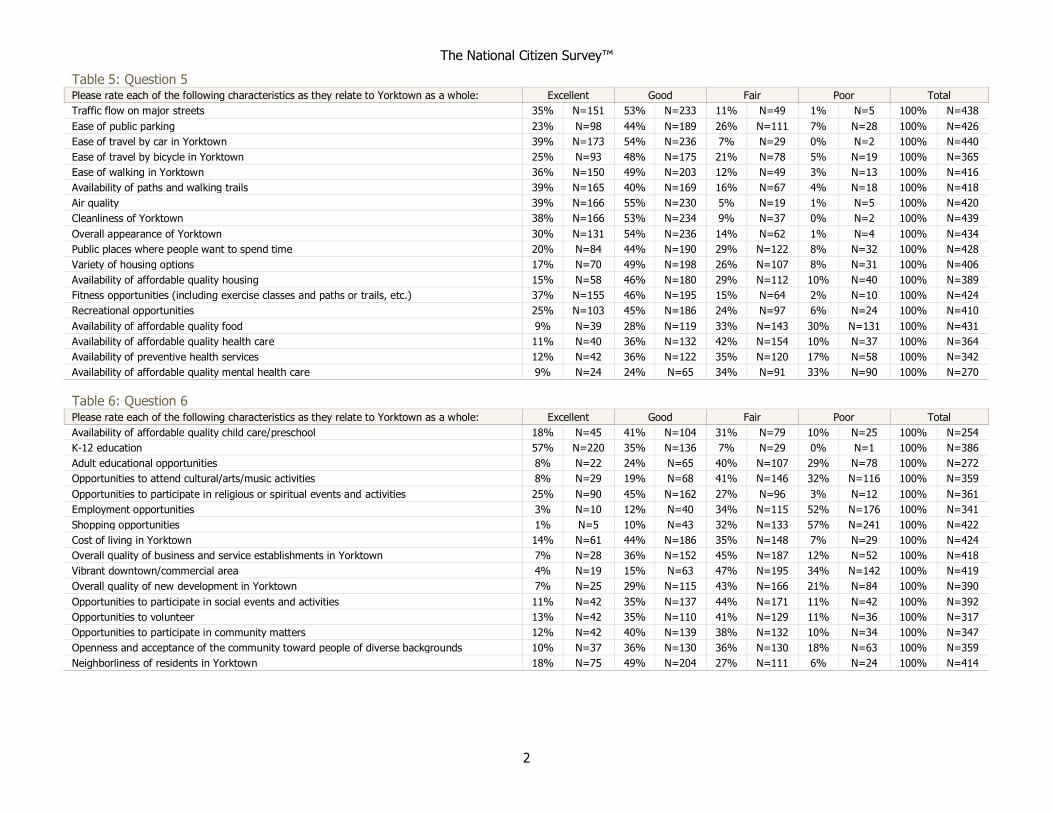
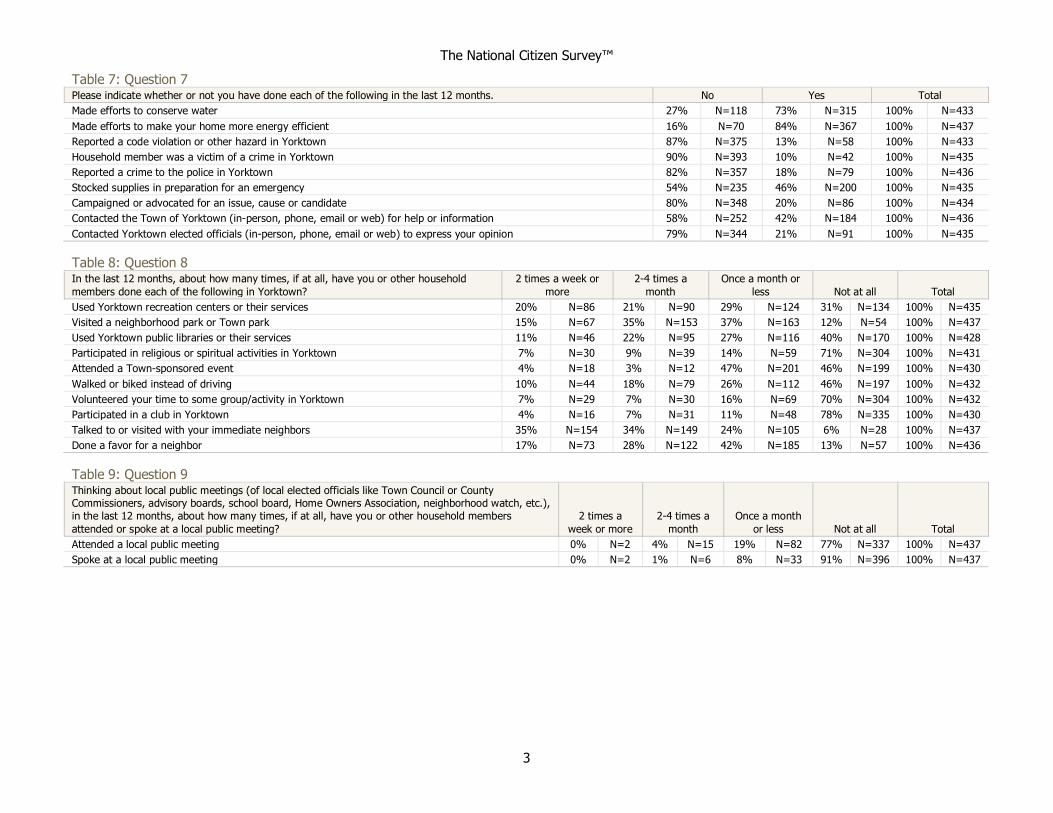
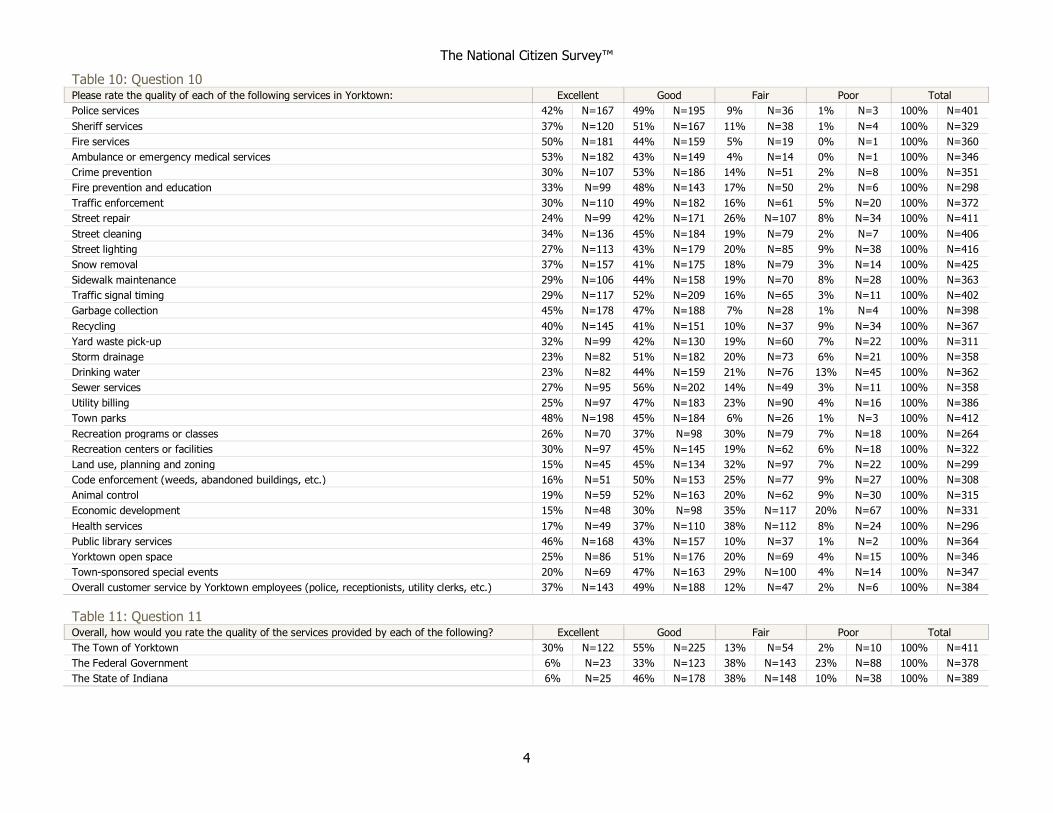
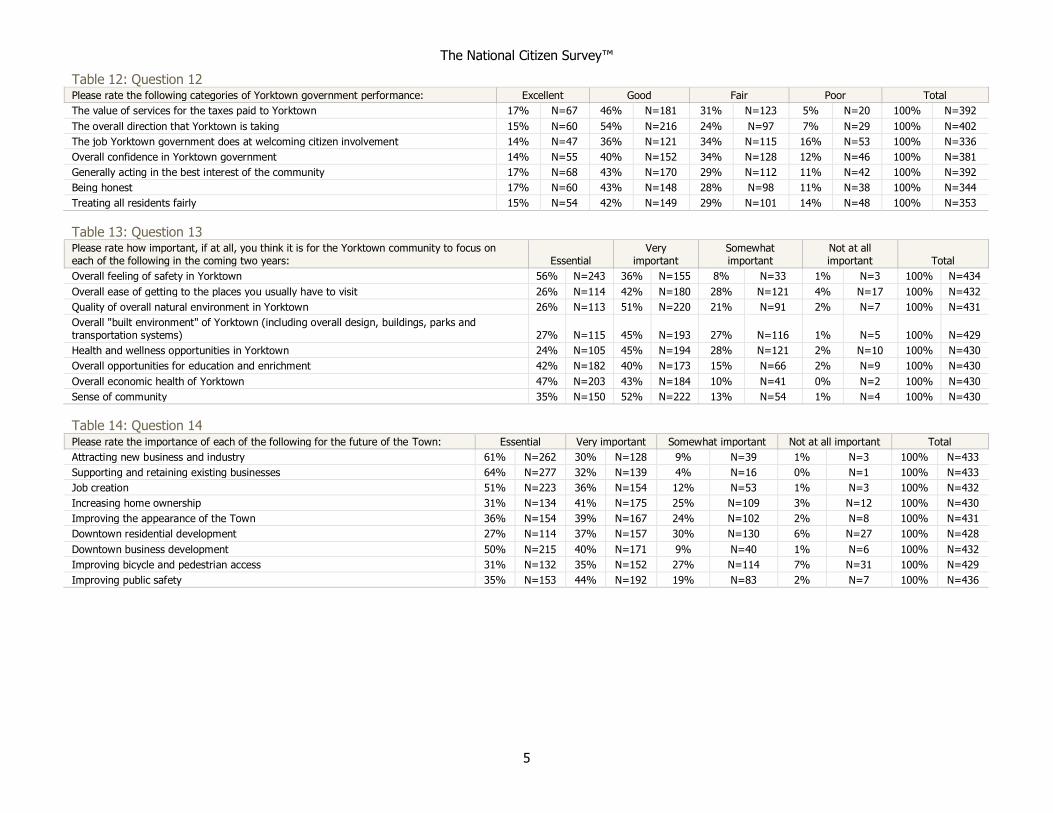
The following pages contain a complete set of responses to each question on the survey, excluding the “don’t know” responses. The percent of respondents giving a particular response is shown followed by the number of respondents (denoted with “N=”).
Table 1: Question 1 Please rate each of the following aspects of quality of life in Yorktown: Excellent Good Fair Poor Total
Yorktown as a place to live 40% N=177 56% N=248 2% N=11 1% N=5 100% N=440
Your neighborhood as a place to live 46% N=201 42% N=182 11% N=49 1% N=6 100% N=437
Yorktown as a place to raise children 51% N=211 45% N=185 3% N=12 1% N=6 100% N=415
Yorktown as a place to work 17% N=53 26% N=79 29% N=89 28% N=88 100% N=310
Yorktown as a place to visit 15% N=63 29% N=120 40% N=165 15% N=63 100% N=411
Yorktown as a place to retire 25% N=96 38% N=146 27% N=104 11% N=43 100% N=389
The overall quality of life in Yorktown 28% N=121 60% N=260 11% N=49 1% N=6 100% N=435
Table 2: Question 2 Please rate each of the following characteristics as they relate to Yorktown as a whole: Excellent Good Fair Poor Total
Overall feeling of safety in Yorktown 46% N=204 48% N=212 5% N=22 0% N=2 100% N=440
Overall ease of getting to the places you usually have to visit 45% N=197 46% N=204 8% N=34 1% N=5 100% N=440
Quality of overall natural environment in Yorktown 33% N=141 56% N=243 11% N=47 0% N=2 100% N=433
Overall "built environment" of Yorktown (including overall design, buildings, parks and transportation
systems) 19% N=83 45% N=196 32% N=137 4% N=18 100% N=435
Health and wellness opportunities in Yorktown 25% N=103 52% N=215 21% N=88 2% N=10 100% N=417
Overall opportunities for education and enrichment 34% N=142 41% N=169 19% N=80 5% N=22 100% N=414
Overall economic health of Yorktown 13% N=52 49% N=204 31% N=128 8% N=31 100% N=414
Sense of community 20% N=86 50% N=216 25% N=106 5% N=22 100% N=430
Overall image or reputation of Yorktown 24% N=104 61% N=261 12% N=50 4% N=15 100% N=431
Table 3: Question 3 Please indicate how likely or unlikely you are to do each of the following: Very likely Somewhat likely Somewhat unlikely Very unlikely Total
Recommend living in Yorktown to someone who asks 61% N=266 35% N=153 2% N=10 2% N=7 100% N=435
Remain in Yorktown for the next five years 71% N=302 20% N=84 5% N=22 4% N=16 100% N=424
Table 4: Question 4 Please rate how safe or unsafe you feel: Very safe Somewhat safe Neither safe nor unsafe Somewhat unsafe Very unsafe Total
In your neighborhood during the day 84% N=371 14% N=60 1% N=5 1% N=3 0% N=0 100% N=439
In Yorktown's downtown/commercial area during the day 80% N=343 18% N=78 1% N=6 0% N=0 0% N=1 100% N=427
In your neighborhood at night 59% N=255 35% N=151 5% N=21 2% N=8 0% N=1 100% N=436
In Yorktown’s downtown/commercial area at night 45% N=183 45% N=183 9% N=37 1% N=4 0% N=1 100% N=408
The National Citizen Survey™
2
Table 5: Question 5 Please rate each of the following characteristics as they relate to Yorktown as a whole: Excellent Good Fair Poor Total
Traffic flow on major streets 35% N=151 53% N=233 11% N=49 1% N=5 100% N=438
Ease of public parking 23% N=98 44% N=189 26% N=111 7% N=28 100% N=426
Ease of travel by car in Yorktown 39% N=173 54% N=236 7% N=29 0% N=2 100% N=440
Ease of travel by bicycle in Yorktown 25% N=93 48% N=175 21% N=78 5% N=19 100% N=365
Ease of walking in Yorktown 36% N=150 49% N=203 12% N=49 3% N=13 100% N=416
Availability of paths and walking trails 39% N=165 40% N=169 16% N=67 4% N=18 100% N=418
Air quality 39% N=166 55% N=230 5% N=19 1% N=5 100% N=420
Cleanliness of Yorktown 38% N=166 53% N=234 9% N=37 0% N=2 100% N=439
Overall appearance of Yorktown 30% N=131 54% N=236 14% N=62 1% N=4 100% N=434
Public places where people want to spend time 20% N=84 44% N=190 29% N=122 8% N=32 100% N=428
Variety of housing options 17% N=70 49% N=198 26% N=107 8% N=31 100% N=406
Availability of affordable quality housing 15% N=58 46% N=180 29% N=112 10% N=40 100% N=389
Fitness opportunities (including exercise classes and paths or trails, etc.) 37% N=155 46% N=195 15% N=64 2% N=10 100% N=424
Recreational opportunities 25% N=103 45% N=186 24% N=97 6% N=24 100% N=410
Availability of affordable quality food 9% N=39 28% N=119 33% N=143 30% N=131 100% N=431
Availability of affordable quality health care 11% N=40 36% N=132 42% N=154 10% N=37 100% N=364
Availability of preventive health services 12% N=42 36% N=122 35% N=120 17% N=58 100% N=342
Availability of affordable quality mental health care 9% N=24 24% N=65 34% N=91 33% N=90 100% N=270
Table 6: Question 6 Please rate each of the following characteristics as they relate to Yorktown as a whole: Excellent Good Fair Poor Total
Availability of affordable quality child care/preschool 18% N=45 41% N=104 31% N=79 10% N=25 100% N=254
K-12 education 57% N=220 35% N=136 7% N=29 0% N=1 100% N=386
Adult educational opportunities 8% N=22 24% N=65 40% N=107 29% N=78 100% N=272
Opportunities to attend cultural/arts/music activities 8% N=29 19% N=68 41% N=146 32% N=116 100% N=359
Opportunities to participate in religious or spiritual events and activities 25% N=90 45% N=162 27% N=96 3% N=12 100% N=361
Employment opportunities 3% N=10 12% N=40 34% N=115 52% N=176 100% N=341
Shopping opportunities 1% N=5 10% N=43 32% N=133 57% N=241 100% N=422
Cost of living in Yorktown 14% N=61 44% N=186 35% N=148 7% N=29 100% N=424
Overall quality of business and service establishments in Yorktown 7% N=28 36% N=152 45% N=187 12% N=52 100% N=418
Vibrant downtown/commercial area 4% N=19 15% N=63 47% N=195 34% N=142 100% N=419
Overall quality of new development in Yorktown 7% N=25 29% N=115 43% N=166 21% N=84 100% N=390
Opportunities to participate in social events and activities 11% N=42 35% N=137 44% N=171 11% N=42 100% N=392
Opportunities to volunteer 13% N=42 35% N=110 41% N=129 11% N=36 100% N=317
Opportunities to participate in community matters 12% N=42 40% N=139 38% N=132 10% N=34 100% N=347
Openness and acceptance of the community toward people of diverse backgrounds 10% N=37 36% N=130 36% N=130 18% N=63 100% N=359
Neighborliness of residents in Yorktown 18% N=75 49% N=204 27% N=111 6% N=24 100% N=414
The National Citizen Survey™
3
Table 7: Question 7 Please indicate whether or not you have done each of the following in the last 12 months. No Yes Total
Made efforts to conserve water 27% N=118 73% N=315 100% N=433
Made efforts to make your home more energy efficient 16% N=70 84% N=367 100% N=437
Reported a code violation or other hazard in Yorktown 87% N=375 13% N=58 100% N=433
Household member was a victim of a crime in Yorktown 90% N=393 10% N=42 100% N=435
Reported a crime to the police in Yorktown 82% N=357 18% N=79 100% N=436
Stocked supplies in preparation for an emergency 54% N=235 46% N=200 100% N=435
Campaigned or advocated for an issue, cause or candidate 80% N=348 20% N=86 100% N=434
Contacted the Town of Yorktown (in-person, phone, email or web) for help or information 58% N=252 42% N=184 100% N=436
Contacted Yorktown elected officials (in-person, phone, email or web) to express your opinion 79% N=344 21% N=91 100% N=435
Table 8: Question 8 In the last 12 months, about how many times, if at all, have you or other household
members done each of the following in Yorktown?
2 times a week or
more
2-4 times a
month
Once a month or
less Not at all Total
Used Yorktown recreation centers or their services 20% N=86 21% N=90 29% N=124 31% N=134 100% N=435
Visited a neighborhood park or Town park 15% N=67 35% N=153 37% N=163 12% N=54 100% N=437
Used Yorktown public libraries or their services 11% N=46 22% N=95 27% N=116 40% N=170 100% N=428
Participated in religious or spiritual activities in Yorktown 7% N=30 9% N=39 14% N=59 71% N=304 100% N=431
Attended a Town-sponsored event 4% N=18 3% N=12 47% N=201 46% N=199 100% N=430
Walked or biked instead of driving 10% N=44 18% N=79 26% N=112 46% N=197 100% N=432
Volunteered your time to some group/activity in Yorktown 7% N=29 7% N=30 16% N=69 70% N=304 100% N=432
Participated in a club in Yorktown 4% N=16 7% N=31 11% N=48 78% N=335 100% N=430
Talked to or visited with your immediate neighbors 35% N=154 34% N=149 24% N=105 6% N=28 100% N=437
Done a favor for a neighbor 17% N=73 28% N=122 42% N=185 13% N=57 100% N=436
Table 9: Question 9 Thinking about local public meetings (of local elected officials like Town Council or County Commissioners, advisory boards, school board, Home Owners Association, neighborhood watch, etc.),
in the last 12 months, about how many times, if at all, have you or other household members
attended or spoke at a local public meeting?
2 times a
week or more
2-4 times a
month
Once a month
or less Not at all Total
Attended a local public meeting 0% N=2 4% N=15 19% N=82 77% N=337 100% N=437
Spoke at a local public meeting 0% N=2 1% N=6 8% N=33 91% N=396 100% N=437
The National Citizen Survey™
4
Table 10: Question 10 Please rate the quality of each of the following services in Yorktown: Excellent Good Fair Poor Total
Police services 42% N=167 49% N=195 9% N=36 1% N=3 100% N=401
Sheriff services 37% N=120 51% N=167 11% N=38 1% N=4 100% N=329
Fire services 50% N=181 44% N=159 5% N=19 0% N=1 100% N=360
Ambulance or emergency medical services 53% N=182 43% N=149 4% N=14 0% N=1 100% N=346
Crime prevention 30% N=107 53% N=186 14% N=51 2% N=8 100% N=351
Fire prevention and education 33% N=99 48% N=143 17% N=50 2% N=6 100% N=298
Traffic enforcement 30% N=110 49% N=182 16% N=61 5% N=20 100% N=372
Street repair 24% N=99 42% N=171 26% N=107 8% N=34 100% N=411
Street cleaning 34% N=136 45% N=184 19% N=79 2% N=7 100% N=406
Street lighting 27% N=113 43% N=179 20% N=85 9% N=38 100% N=416
Snow removal 37% N=157 41% N=175 18% N=79 3% N=14 100% N=425
Sidewalk maintenance 29% N=106 44% N=158 19% N=70 8% N=28 100% N=363
Traffic signal timing 29% N=117 52% N=209 16% N=65 3% N=11 100% N=402
Garbage collection 45% N=178 47% N=188 7% N=28 1% N=4 100% N=398
Recycling 40% N=145 41% N=151 10% N=37 9% N=34 100% N=367
Yard waste pick-up 32% N=99 42% N=130 19% N=60 7% N=22 100% N=311
Storm drainage 23% N=82 51% N=182 20% N=73 6% N=21 100% N=358
Drinking water 23% N=82 44% N=159 21% N=76 13% N=45 100% N=362
Sewer services 27% N=95 56% N=202 14% N=49 3% N=11 100% N=358
Utility billing 25% N=97 47% N=183 23% N=90 4% N=16 100% N=386
Town parks 48% N=198 45% N=184 6% N=26 1% N=3 100% N=412
Recreation programs or classes 26% N=70 37% N=98 30% N=79 7% N=18 100% N=264
Recreation centers or facilities 30% N=97 45% N=145 19% N=62 6% N=18 100% N=322
Land use, planning and zoning 15% N=45 45% N=134 32% N=97 7% N=22 100% N=299
Code enforcement (weeds, abandoned buildings, etc.) 16% N=51 50% N=153 25% N=77 9% N=27 100% N=308
Animal control 19% N=59 52% N=163 20% N=62 9% N=30 100% N=315
Economic development 15% N=48 30% N=98 35% N=117 20% N=67 100% N=331
Health services 17% N=49 37% N=110 38% N=112 8% N=24 100% N=296
Public library services 46% N=168 43% N=157 10% N=37 1% N=2 100% N=364
Yorktown open space 25% N=86 51% N=176 20% N=69 4% N=15 100% N=346
Town-sponsored special events 20% N=69 47% N=163 29% N=100 4% N=14 100% N=347
Overall customer service by Yorktown employees (police, receptionists, utility clerks, etc.) 37% N=143 49% N=188 12% N=47 2% N=6 100% N=384
Table 11: Question 11 Overall, how would you rate the quality of the services provided by each of the following? Excellent Good Fair Poor Total
The Town of Yorktown 30% N=122 55% N=225 13% N=54 2% N=10 100% N=411
The Federal Government 6% N=23 33% N=123 38% N=143 23% N=88 100% N=378
The State of Indiana 6% N=25 46% N=178 38% N=148 10% N=38 100% N=389
The National Citizen Survey™
5
Table 12: Question 12 Please rate the following categories of Yorktown government performance: Excellent Good Fair Poor Total
The value of services for the taxes paid to Yorktown 17% N=67 46% N=181 31% N=123 5% N=20 100% N=392
The overall direction that Yorktown is taking 15% N=60 54% N=216 24% N=97 7% N=29 100% N=402
The job Yorktown government does at welcoming citizen involvement 14% N=47 36% N=121 34% N=115 16% N=53 100% N=336
Overall confidence in Yorktown government 14% N=55 40% N=152 34% N=128 12% N=46 100% N=381
Generally acting in the best interest of the community 17% N=68 43% N=170 29% N=112 11% N=42 100% N=392
Being honest 17% N=60 43% N=148 28% N=98 11% N=38 100% N=344
Treating all residents fairly 15% N=54 42% N=149 29% N=101 14% N=48 100% N=353
Table 13: Question 13 Please rate how important, if at all, you think it is for the Yorktown community to focus on each of the following in the coming two years: Essential
Very important
Somewhat important
Not at all important Total
Overall feeling of safety in Yorktown 56% N=243 36% N=155 8% N=33 1% N=3 100% N=434
Overall ease of getting to the places you usually have to visit 26% N=114 42% N=180 28% N=121 4% N=17 100% N=432
Quality of overall natural environment in Yorktown 26% N=113 51% N=220 21% N=91 2% N=7 100% N=431
Overall "built environment" of Yorktown (including overall design, buildings, parks and transportation systems) 27% N=115 45% N=193 27% N=116 1% N=5 100% N=429
Health and wellness opportunities in Yorktown 24% N=105 45% N=194 28% N=121 2% N=10 100% N=430
Overall opportunities for education and enrichment 42% N=182 40% N=173 15% N=66 2% N=9 100% N=430
Overall economic health of Yorktown 47% N=203 43% N=184 10% N=41 0% N=2 100% N=430
Sense of community 35% N=150 52% N=222 13% N=54 1% N=4 100% N=430
Table 14: Question 14 Please rate the importance of each of the following for the future of the Town: Essential Very important Somewhat important Not at all important Total
Attracting new business and industry 61% N=262 30% N=128 9% N=39 1% N=3 100% N=433
Supporting and retaining existing businesses 64% N=277 32% N=139 4% N=16 0% N=1 100% N=433
Job creation 51% N=223 36% N=154 12% N=53 1% N=3 100% N=432
Increasing home ownership 31% N=134 41% N=175 25% N=109 3% N=12 100% N=430
Improving the appearance of the Town 36% N=154 39% N=167 24% N=102 2% N=8 100% N=431
Downtown residential development 27% N=114 37% N=157 30% N=130 6% N=27 100% N=428
Downtown business development 50% N=215 40% N=171 9% N=40 1% N=6 100% N=432
Improving bicycle and pedestrian access 31% N=132 35% N=152 27% N=114 7% N=31 100% N=429
Improving public safety 35% N=153 44% N=192 19% N=83 2% N=7 100% N=436
The National Citizen Survey™
6
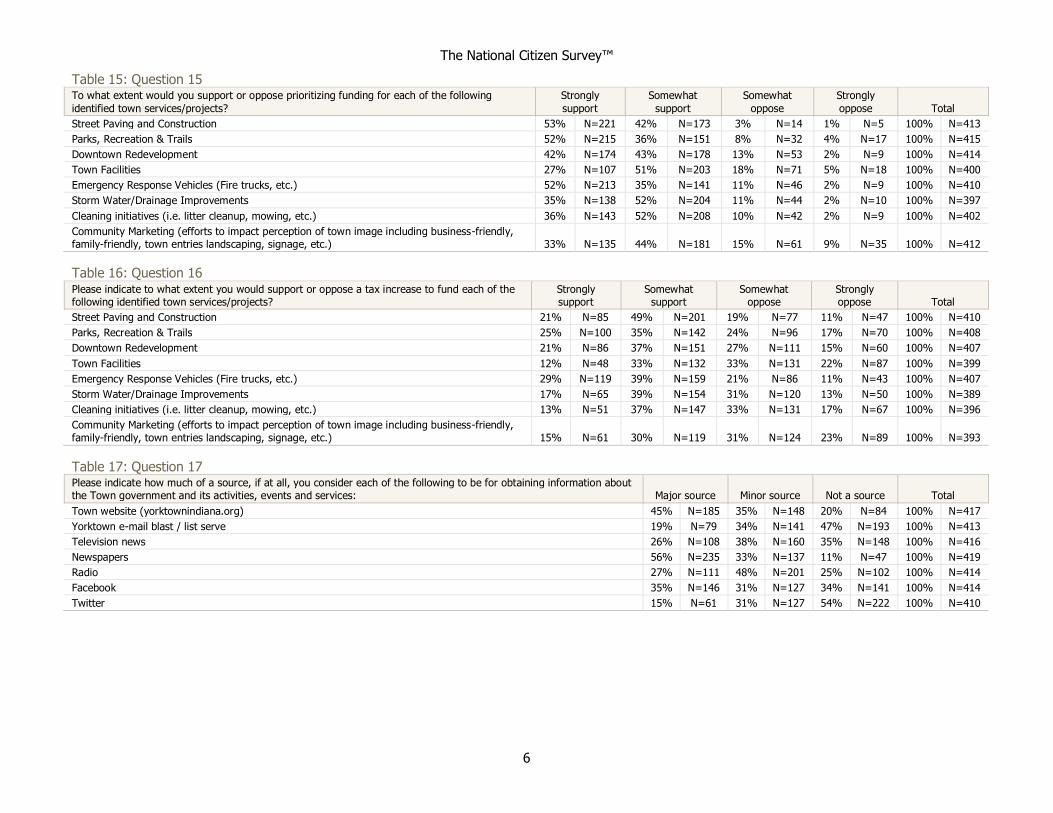
Table 15: Question 15 To what extent would you support or oppose prioritizing funding for each of the following
identified town services/projects?
Strongly
support
Somewhat
support
Somewhat
oppose
Strongly
oppose Total
Street Paving and Construction 53% N=221 42% N=173 3% N=14 1% N=5 100% N=413
Parks, Recreation & Trails 52% N=215 36% N=151 8% N=32 4% N=17 100% N=415
Downtown Redevelopment 42% N=174 43% N=178 13% N=53 2% N=9 100% N=414
Town Facilities 27% N=107 51% N=203 18% N=71 5% N=18 100% N=400
Emergency Response Vehicles (Fire trucks, etc.) 52% N=213 35% N=141 11% N=46 2% N=9 100% N=410
Storm Water/Drainage Improvements 35% N=138 52% N=204 11% N=44 2% N=10 100% N=397
Cleaning initiatives (i.e. litter cleanup, mowing, etc.) 36% N=143 52% N=208 10% N=42 2% N=9 100% N=402
Community Marketing (efforts to impact perception of town image including business-friendly, family-friendly, town entries landscaping, signage, etc.) 33% N=135 44% N=181 15% N=61 9% N=35 100% N=412
Table 16: Question 16 Please indicate to what extent you would support or oppose a tax increase to fund each of the following identified town services/projects?
Strongly support
Somewhat support
Somewhat oppose
Strongly oppose Total
Street Paving and Construction 21% N=85 49% N=201 19% N=77 11% N=47 100% N=410
Parks, Recreation & Trails 25% N=100 35% N=142 24% N=96 17% N=70 100% N=408
Downtown Redevelopment 21% N=86 37% N=151 27% N=111 15% N=60 100% N=407
Town Facilities 12% N=48 33% N=132 33% N=131 22% N=87 100% N=399
Emergency Response Vehicles (Fire trucks, etc.) 29% N=119 39% N=159 21% N=86 11% N=43 100% N=407
Storm Water/Drainage Improvements 17% N=65 39% N=154 31% N=120 13% N=50 100% N=389
Cleaning initiatives (i.e. litter cleanup, mowing, etc.) 13% N=51 37% N=147 33% N=131 17% N=67 100% N=396
Community Marketing (efforts to impact perception of town image including business-friendly, family-friendly, town entries landscaping, signage, etc.) 15% N=61 30% N=119 31% N=124 23% N=89 100% N=393
Table 17: Question 17 Please indicate how much of a source, if at all, you consider each of the following to be for obtaining information about the Town government and its activities, events and services: Major source Minor source Not a source Total
Town website (yorktownindiana.org) 45% N=185 35% N=148 20% N=84 100% N=417
Yorktown e-mail blast / list serve 19% N=79 34% N=141 47% N=193 100% N=413
Television news 26% N=108 38% N=160 35% N=148 100% N=416
Newspapers 56% N=235 33% N=137 11% N=47 100% N=419
Radio 27% N=111 48% N=201 25% N=102 100% N=414
Facebook 35% N=146 31% N=127 34% N=141 100% N=414
Twitter 15% N=61 31% N=127 54% N=222 100% N=410

The National Citizen Survey™
7
Table 18: Question D1 How often, if at all, do you do each of the following, considering all of the times you
could? Never Rarely Sometimes Usually Always Total
Recycle at home 16% N=69 7% N=29 17% N=73 18% N=78 43% N=190 100% N=439
Purchase goods or services from a business located in Yorktown 2% N=9 18% N=77 52% N=226 23% N=100 6% N=26 100% N=438
Eat at least 5 portions of fruits and vegetables a day 4% N=19 19% N=82 44% N=193 22% N=97 10% N=43 100% N=434
Participate in moderate or vigorous physical activity 3% N=12 14% N=62 39% N=171 29% N=126 15% N=64 100% N=434
Read or watch local news (via television, paper, computer, etc.) 1% N=3 9% N=37 12% N=54 35% N=151 44% N=192 100% N=436
Vote in local elections 7% N=28 7% N=30 9% N=39 20% N=89 57% N=248 100% N=435
Table 19: Question D2 Would you say that in general your health is: Percent Number
Excellent 15% N=66
Very good 44% N=190
Good 32% N=140
Fair 6% N=28
Poor 3% N=11
Total 100% N=436
Table 20: Question D3 What impact, if any, do you think the economy will have on your family income in the next 6 months? Do you think the impact will be: Percent Number
Very positive 4% N=19
Somewhat positive 27% N=116
Neutral 52% N=226
Somewhat negative 15% N=66
Very negative 2% N=7
Total 100% N=434
Table 21: Question D4 What is your employment status? Percent Number
Working full time for pay 60% N=259
Working part time for pay 11% N=48
Unemployed, looking for paid work 2% N=8
Unemployed, not looking for paid work 3% N=15
Fully retired 24% N=105
Total 100% N=435
Table 22: Question D5 Do you work inside the boundaries of Yorktown? Percent Number
Yes, outside the home 19% N=78
Yes, from home 6% N=25
No 76% N=320
Total 100% N=423
The National Citizen Survey™
8
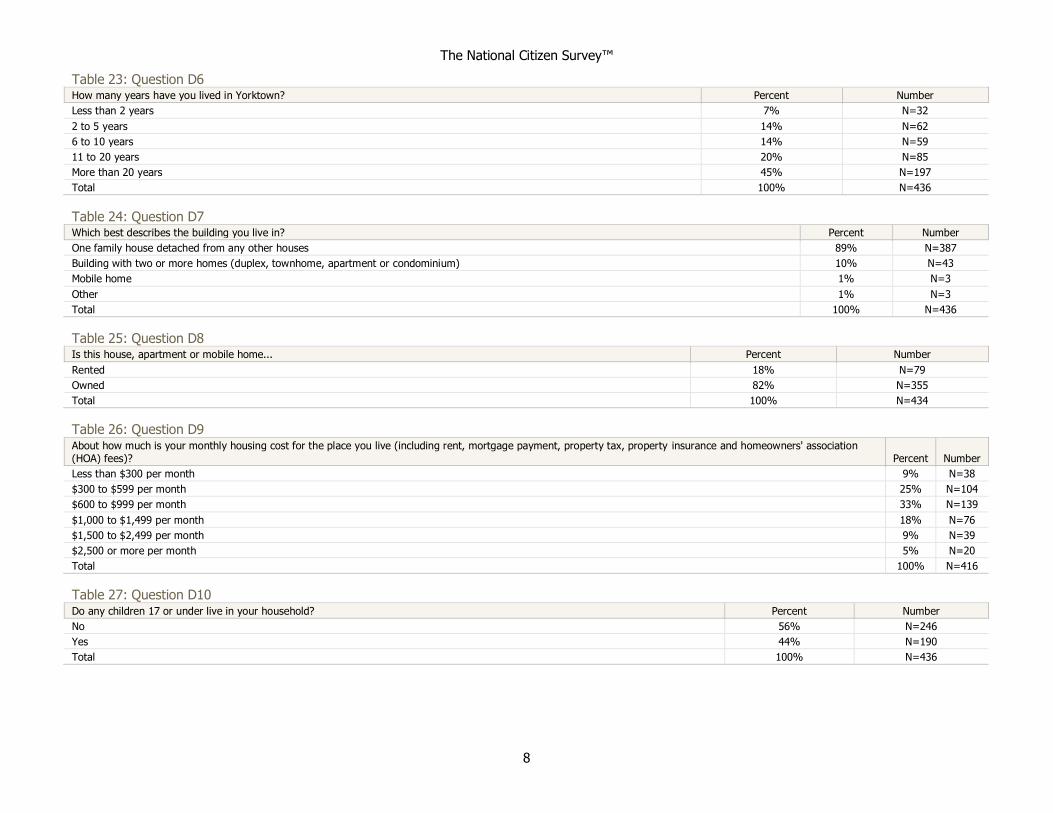
Table 23: Question D6 How many years have you lived in Yorktown? Percent Number
Less than 2 years 7% N=32
2 to 5 years 14% N=62
6 to 10 years 14% N=59
11 to 20 years 20% N=85
More than 20 years 45% N=197
Total 100% N=436
Table 24: Question D7 Which best describes the building you live in? Percent Number
One family house detached from any other houses 89% N=387
Building with two or more homes (duplex, townhome, apartment or condominium) 10% N=43
Mobile home 1% N=3
Other 1% N=3
Total 100% N=436
Table 25: Question D8 Is this house, apartment or mobile home... Percent Number
Rented 18% N=79
Owned 82% N=355
Total 100% N=434
Table 26: Question D9 About how much is your monthly housing cost for the place you live (including rent, mortgage payment, property tax, property insurance and homeowners' association (HOA) fees)? Percent Number
Less than $300 per month 9% N=38
$300 to $599 per month 25% N=104
$600 to $999 per month 33% N=139
$1,000 to $1,499 per month 18% N=76
$1,500 to $2,499 per month 9% N=39
$2,500 or more per month 5% N=20
Total 100% N=416
Table 27: Question D10 Do any children 17 or under live in your household? Percent Number
No 56% N=246
Yes 44% N=190
Total 100% N=436
The National Citizen Survey™
9
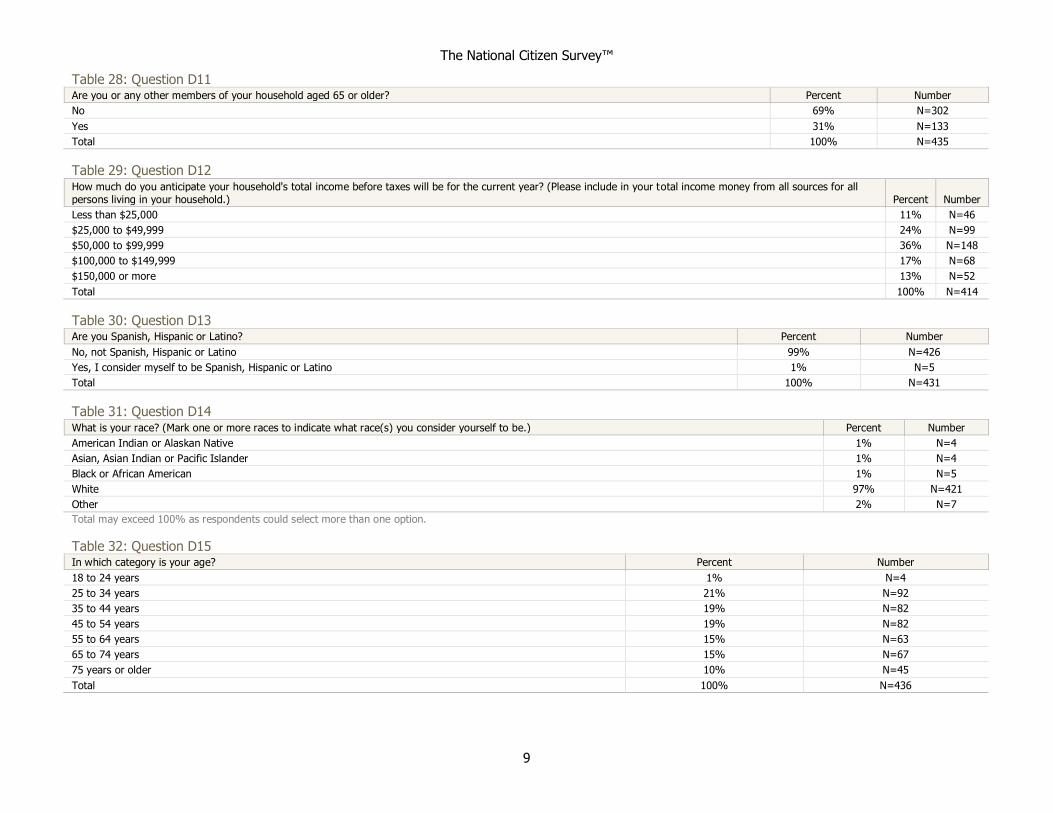
Table 28: Question D11 Are you or any other members of your household aged 65 or older? Percent Number
No 69% N=302
Yes 31% N=133
Total 100% N=435
Table 29: Question D12 How much do you anticipate your household's total income before taxes will be for the current year? (Please include in your total income money from all sources for all persons living in your household.) Percent Number
Less than $25,000 11% N=46
$25,000 to $49,999 24% N=99
$50,000 to $99,999 36% N=148
$100,000 to $149,999 17% N=68
$150,000 or more 13% N=52
Total 100% N=414
Table 30: Question D13 Are you Spanish, Hispanic or Latino? Percent Number
No, not Spanish, Hispanic or Latino 99% N=426
Yes, I consider myself to be Spanish, Hispanic or Latino 1% N=5
Total 100% N=431
Table 31: Question D14 What is your race? (Mark one or more races to indicate what race(s) you consider yourself to be.) Percent Number
American Indian or Alaskan Native 1% N=4
Asian, Asian Indian or Pacific Islander 1% N=4
Black or African American 1% N=5
White 97% N=421
Other 2% N=7
Total may exceed 100% as respondents could select more than one option.
Table 32: Question D15 In which category is your age? Percent Number
18 to 24 years 1% N=4
25 to 34 years 21% N=92
35 to 44 years 19% N=82
45 to 54 years 19% N=82
55 to 64 years 15% N=63
65 to 74 years 15% N=67
75 years or older 10% N=45
Total 100% N=436

The National Citizen Survey™
10
Table 33: Question D16 What is your sex? Percent Number
Female 53% N=230
Male 47% N=201
Total 100% N=430
Table 34: Question D17 Do you consider a cell phone or landline your primary telephone number? Percent Number
Cell 61% N=266
Land line 19% N=83
Both 20% N=89
Total 100% N=437
The National Citizen Survey™
11
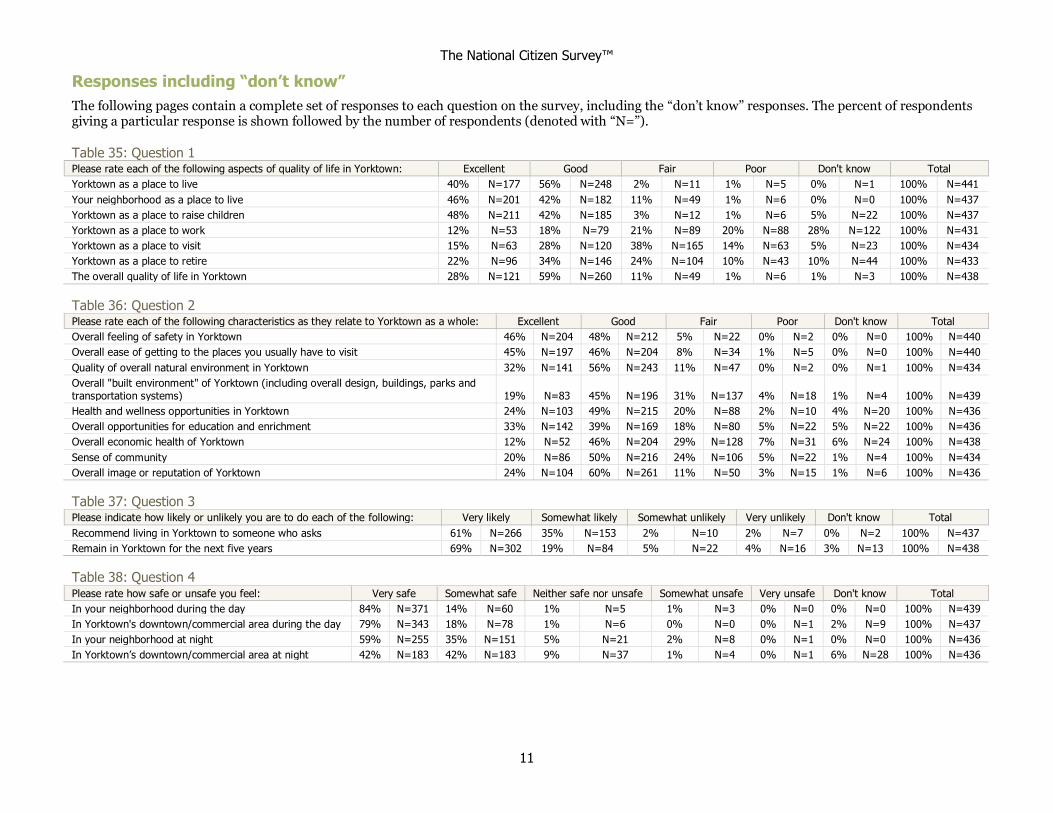
Responses including “don’t know”
The following pages contain a complete set of responses to each question on the survey, including the “don’t know” responses. The percent of respondents giving a particular response is shown followed by the number of respondents (denoted with “N=”).
Table 35: Question 1 Please rate each of the following aspects of quality of life in Yorktown: Excellent Good Fair Poor Don't know Total
Yorktown as a place to live 40% N=177 56% N=248 2% N=11 1% N=5 0% N=1 100% N=441
Your neighborhood as a place to live 46% N=201 42% N=182 11% N=49 1% N=6 0% N=0 100% N=437
Yorktown as a place to raise children 48% N=211 42% N=185 3% N=12 1% N=6 5% N=22 100% N=437
Yorktown as a place to work 12% N=53 18% N=79 21% N=89 20% N=88 28% N=122 100% N=431
Yorktown as a place to visit 15% N=63 28% N=120 38% N=165 14% N=63 5% N=23 100% N=434
Yorktown as a place to retire 22% N=96 34% N=146 24% N=104 10% N=43 10% N=44 100% N=433
The overall quality of life in Yorktown 28% N=121 59% N=260 11% N=49 1% N=6 1% N=3 100% N=438
Table 36: Question 2 Please rate each of the following characteristics as they relate to Yorktown as a whole: Excellent Good Fair Poor Don't know Total
Overall feeling of safety in Yorktown 46% N=204 48% N=212 5% N=22 0% N=2 0% N=0 100% N=440
Overall ease of getting to the places you usually have to visit 45% N=197 46% N=204 8% N=34 1% N=5 0% N=0 100% N=440
Quality of overall natural environment in Yorktown 32% N=141 56% N=243 11% N=47 0% N=2 0% N=1 100% N=434
Overall "built environment" of Yorktown (including overall design, buildings, parks and transportation systems) 19% N=83 45% N=196 31% N=137 4% N=18 1% N=4 100% N=439
Health and wellness opportunities in Yorktown 24% N=103 49% N=215 20% N=88 2% N=10 4% N=20 100% N=436
Overall opportunities for education and enrichment 33% N=142 39% N=169 18% N=80 5% N=22 5% N=22 100% N=436
Overall economic health of Yorktown 12% N=52 46% N=204 29% N=128 7% N=31 6% N=24 100% N=438
Sense of community 20% N=86 50% N=216 24% N=106 5% N=22 1% N=4 100% N=434
Overall image or reputation of Yorktown 24% N=104 60% N=261 11% N=50 3% N=15 1% N=6 100% N=436
Table 37: Question 3 Please indicate how likely or unlikely you are to do each of the following: Very likely Somewhat likely Somewhat unlikely Very unlikely Don't know Total
Recommend living in Yorktown to someone who asks 61% N=266 35% N=153 2% N=10 2% N=7 0% N=2 100% N=437
Remain in Yorktown for the next five years 69% N=302 19% N=84 5% N=22 4% N=16 3% N=13 100% N=438
Table 38: Question 4 Please rate how safe or unsafe you feel: Very safe Somewhat safe Neither safe nor unsafe Somewhat unsafe Very unsafe Don't know Total
In your neighborhood during the day 84% N=371 14% N=60 1% N=5 1% N=3 0% N=0 0% N=0 100% N=439
In Yorktown's downtown/commercial area during the day 79% N=343 18% N=78 1% N=6 0% N=0 0% N=1 2% N=9 100% N=437
In your neighborhood at night 59% N=255 35% N=151 5% N=21 2% N=8 0% N=1 0% N=0 100% N=436
In Yorktown’s downtown/commercial area at night 42% N=183 42% N=183 9% N=37 1% N=4 0% N=1 6% N=28 100% N=436
The National Citizen Survey™
12
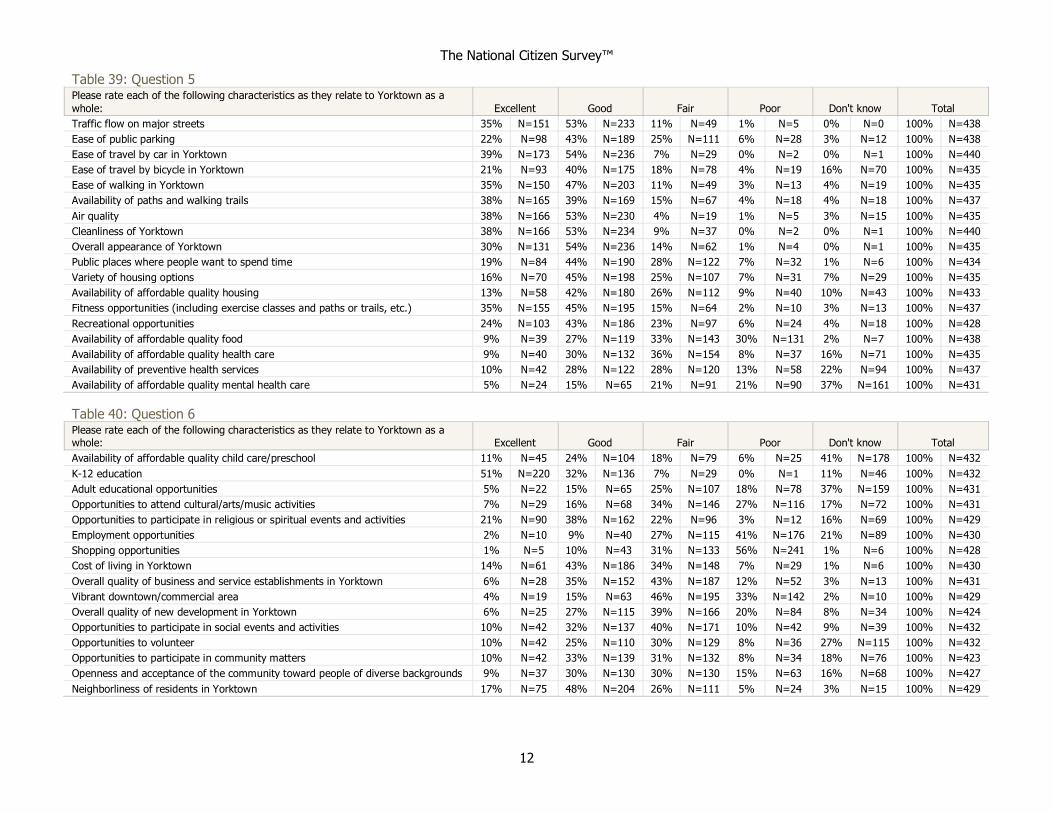
Table 39: Question 5 Please rate each of the following characteristics as they relate to Yorktown as a
whole: Excellent Good Fair Poor Don't know Total
Traffic flow on major streets 35% N=151 53% N=233 11% N=49 1% N=5 0% N=0 100% N=438
Ease of public parking 22% N=98 43% N=189 25% N=111 6% N=28 3% N=12 100% N=438
Ease of travel by car in Yorktown 39% N=173 54% N=236 7% N=29 0% N=2 0% N=1 100% N=440
Ease of travel by bicycle in Yorktown 21% N=93 40% N=175 18% N=78 4% N=19 16% N=70 100% N=435
Ease of walking in Yorktown 35% N=150 47% N=203 11% N=49 3% N=13 4% N=19 100% N=435
Availability of paths and walking trails 38% N=165 39% N=169 15% N=67 4% N=18 4% N=18 100% N=437
Air quality 38% N=166 53% N=230 4% N=19 1% N=5 3% N=15 100% N=435
Cleanliness of Yorktown 38% N=166 53% N=234 9% N=37 0% N=2 0% N=1 100% N=440
Overall appearance of Yorktown 30% N=131 54% N=236 14% N=62 1% N=4 0% N=1 100% N=435
Public places where people want to spend time 19% N=84 44% N=190 28% N=122 7% N=32 1% N=6 100% N=434
Variety of housing options 16% N=70 45% N=198 25% N=107 7% N=31 7% N=29 100% N=435
Availability of affordable quality housing 13% N=58 42% N=180 26% N=112 9% N=40 10% N=43 100% N=433
Fitness opportunities (including exercise classes and paths or trails, etc.) 35% N=155 45% N=195 15% N=64 2% N=10 3% N=13 100% N=437
Recreational opportunities 24% N=103 43% N=186 23% N=97 6% N=24 4% N=18 100% N=428
Availability of affordable quality food 9% N=39 27% N=119 33% N=143 30% N=131 2% N=7 100% N=438
Availability of affordable quality health care 9% N=40 30% N=132 36% N=154 8% N=37 16% N=71 100% N=435
Availability of preventive health services 10% N=42 28% N=122 28% N=120 13% N=58 22% N=94 100% N=437
Availability of affordable quality mental health care 5% N=24 15% N=65 21% N=91 21% N=90 37% N=161 100% N=431
Table 40: Question 6 Please rate each of the following characteristics as they relate to Yorktown as a whole: Excellent Good Fair Poor Don't know Total
Availability of affordable quality child care/preschool 11% N=45 24% N=104 18% N=79 6% N=25 41% N=178 100% N=432
K-12 education 51% N=220 32% N=136 7% N=29 0% N=1 11% N=46 100% N=432
Adult educational opportunities 5% N=22 15% N=65 25% N=107 18% N=78 37% N=159 100% N=431
Opportunities to attend cultural/arts/music activities 7% N=29 16% N=68 34% N=146 27% N=116 17% N=72 100% N=431
Opportunities to participate in religious or spiritual events and activities 21% N=90 38% N=162 22% N=96 3% N=12 16% N=69 100% N=429
Employment opportunities 2% N=10 9% N=40 27% N=115 41% N=176 21% N=89 100% N=430
Shopping opportunities 1% N=5 10% N=43 31% N=133 56% N=241 1% N=6 100% N=428
Cost of living in Yorktown 14% N=61 43% N=186 34% N=148 7% N=29 1% N=6 100% N=430
Overall quality of business and service establishments in Yorktown 6% N=28 35% N=152 43% N=187 12% N=52 3% N=13 100% N=431
Vibrant downtown/commercial area 4% N=19 15% N=63 46% N=195 33% N=142 2% N=10 100% N=429
Overall quality of new development in Yorktown 6% N=25 27% N=115 39% N=166 20% N=84 8% N=34 100% N=424
Opportunities to participate in social events and activities 10% N=42 32% N=137 40% N=171 10% N=42 9% N=39 100% N=432
Opportunities to volunteer 10% N=42 25% N=110 30% N=129 8% N=36 27% N=115 100% N=432
Opportunities to participate in community matters 10% N=42 33% N=139 31% N=132 8% N=34 18% N=76 100% N=423
Openness and acceptance of the community toward people of diverse backgrounds 9% N=37 30% N=130 30% N=130 15% N=63 16% N=68 100% N=427
Neighborliness of residents in Yorktown 17% N=75 48% N=204 26% N=111 5% N=24 3% N=15 100% N=429

The National Citizen Survey™
13
Table 41: Question 7 Please indicate whether or not you have done each of the following in the last 12 months. No Yes Total
Made efforts to conserve water 27% N=118 73% N=315 100% N=433
Made efforts to make your home more energy efficient 16% N=70 84% N=367 100% N=437
Reported a code violation or other hazard in Yorktown 87% N=375 13% N=58 100% N=433
Household member was a victim of a crime in Yorktown 90% N=393 10% N=42 100% N=435
Reported a crime to the police in Yorktown 82% N=357 18% N=79 100% N=436
Stocked supplies in preparation for an emergency 54% N=235 46% N=200 100% N=435
Campaigned or advocated for an issue, cause or candidate 80% N=348 20% N=86 100% N=434
Contacted the Town of Yorktown (in-person, phone, email or web) for help or information 58% N=252 42% N=184 100% N=436
Contacted Yorktown elected officials (in-person, phone, email or web) to express your opinion 79% N=344 21% N=91 100% N=435
Table 42: Question 8 In the last 12 months, about how many times, if at all, have you or other household
members done each of the following in Yorktown?
2 times a week or
more
2-4 times a
month
Once a month or
less Not at all Total
Used Yorktown recreation centers or their services 20% N=86 21% N=90 29% N=124 31% N=134 100% N=435
Visited a neighborhood park or Town park 15% N=67 35% N=153 37% N=163 12% N=54 100% N=437
Used Yorktown public libraries or their services 11% N=46 22% N=95 27% N=116 40% N=170 100% N=428
Participated in religious or spiritual activities in Yorktown 7% N=30 9% N=39 14% N=59 71% N=304 100% N=431
Attended a Town-sponsored event 4% N=18 3% N=12 47% N=201 46% N=199 100% N=430
Walked or biked instead of driving 10% N=44 18% N=79 26% N=112 46% N=197 100% N=432
Volunteered your time to some group/activity in Yorktown 7% N=29 7% N=30 16% N=69 70% N=304 100% N=432
Participated in a club in Yorktown 4% N=16 7% N=31 11% N=48 78% N=335 100% N=430
Talked to or visited with your immediate neighbors 35% N=154 34% N=149 24% N=105 6% N=28 100% N=437
Done a favor for a neighbor 17% N=73 28% N=122 42% N=185 13% N=57 100% N=436
Table 43: Question 9 Thinking about local public meetings (of local elected officials like Town Council or County Commissioners, advisory boards, town halls, HOA, neighborhood watch, etc.), in the last 12 months,
about how many times, if at all, have you or other household members attended or watched a local
public meeting?
2 times a
week or more
2-4 times a
month
Once a month
or less Not at all Total
Attended a local public meeting 0% N=2 4% N=15 19% N=82 77% N=337 100% N=437
Spoke at a local public meeting 0% N=2 1% N=6 8% N=33 91% N=396 100% N=437

The National Citizen Survey™
14
Table 44: Question 10 Please rate the quality of each of the following services in Yorktown: Excellent Good Fair Poor Don't know Total
Police services 39% N=167 45% N=195 8% N=36 1% N=3 7% N=29 100% N=430
Sheriff services 28% N=120 39% N=167 9% N=38 1% N=4 22% N=95 100% N=424
Fire services 42% N=181 37% N=159 4% N=19 0% N=1 16% N=70 100% N=431
Ambulance or emergency medical services 42% N=182 35% N=149 3% N=14 0% N=1 20% N=85 100% N=431
Crime prevention 25% N=107 43% N=186 12% N=51 2% N=8 18% N=76 100% N=428
Fire prevention and education 23% N=99 34% N=143 12% N=50 1% N=6 30% N=127 100% N=425
Traffic enforcement 26% N=110 43% N=182 14% N=61 5% N=20 12% N=53 100% N=425
Street repair 23% N=99 40% N=171 25% N=107 8% N=34 3% N=14 100% N=425
Street cleaning 32% N=136 43% N=184 19% N=79 2% N=7 5% N=20 100% N=427
Street lighting 27% N=113 42% N=179 20% N=85 9% N=38 2% N=10 100% N=425
Snow removal 37% N=157 41% N=175 18% N=79 3% N=14 1% N=3 100% N=428
Sidewalk maintenance 25% N=106 37% N=158 16% N=70 7% N=28 15% N=64 100% N=427
Traffic signal timing 28% N=117 49% N=209 15% N=65 3% N=11 5% N=22 100% N=424
Garbage collection 42% N=178 44% N=188 7% N=28 1% N=4 7% N=28 100% N=427
Recycling 34% N=145 35% N=151 9% N=37 8% N=34 15% N=62 100% N=430
Yard waste pick-up 23% N=99 31% N=130 14% N=60 5% N=22 26% N=112 100% N=423
Storm drainage 19% N=82 43% N=182 17% N=73 5% N=21 15% N=65 100% N=423
Drinking water 19% N=82 38% N=159 18% N=76 11% N=45 15% N=62 100% N=424
Sewer services 23% N=95 48% N=202 12% N=49 3% N=11 15% N=65 100% N=423
Utility billing 23% N=97 43% N=183 21% N=90 4% N=16 9% N=36 100% N=422
Town parks 47% N=198 43% N=184 6% N=26 1% N=3 3% N=12 100% N=424
Recreation programs or classes 17% N=70 23% N=98 19% N=79 4% N=18 37% N=158 100% N=422
Recreation centers or facilities 23% N=97 34% N=145 15% N=62 4% N=18 24% N=100 100% N=423
Land use, planning and zoning 11% N=45 32% N=134 23% N=97 5% N=22 28% N=119 100% N=418
Code enforcement (weeds, abandoned buildings, etc.) 12% N=51 36% N=153 18% N=77 6% N=27 27% N=115 100% N=423
Animal control 14% N=59 39% N=163 15% N=62 7% N=30 25% N=107 100% N=422
Economic development 11% N=48 23% N=98 28% N=117 16% N=67 21% N=89 100% N=420
Health services 12% N=49 27% N=110 27% N=112 6% N=24 29% N=119 100% N=415
Public library services 40% N=168 37% N=157 9% N=37 0% N=2 14% N=60 100% N=424
Yorktown open space 20% N=86 42% N=176 16% N=69 3% N=15 18% N=76 100% N=422
Town-sponsored special events 17% N=69 39% N=163 24% N=100 3% N=14 17% N=69 100% N=416
Overall customer service by Yorktown employees (police, receptionists, utility clerks, etc.) 34% N=143 45% N=188 11% N=47 2% N=6 8% N=32 100% N=416
Table 45: Question 11 Overall, how would you rate the quality of the services provided by each of the following? Excellent Good Fair Poor Don't know Total
The Town of Yorktown 28% N=122 52% N=225 13% N=54 2% N=10 4% N=18 100% N=429
The Federal Government 5% N=23 29% N=123 34% N=143 21% N=88 11% N=47 100% N=425
The State of Indiana 6% N=25 42% N=178 35% N=148 9% N=38 8% N=36 100% N=425
The National Citizen Survey™
15
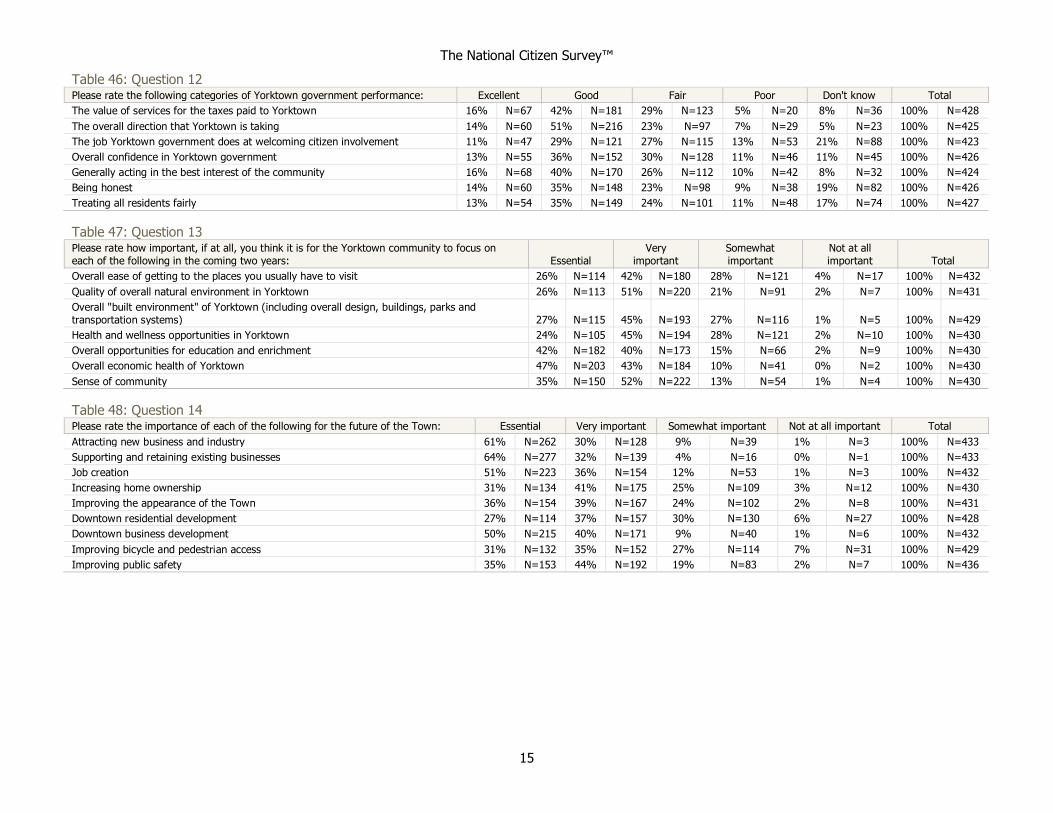
Table 46: Question 12 Please rate the following categories of Yorktown government performance: Excellent Good Fair Poor Don't know Total
The value of services for the taxes paid to Yorktown 16% N=67 42% N=181 29% N=123 5% N=20 8% N=36 100% N=428
The overall direction that Yorktown is taking 14% N=60 51% N=216 23% N=97 7% N=29 5% N=23 100% N=425
The job Yorktown government does at welcoming citizen involvement 11% N=47 29% N=121 27% N=115 13% N=53 21% N=88 100% N=423
Overall confidence in Yorktown government 13% N=55 36% N=152 30% N=128 11% N=46 11% N=45 100% N=426
Generally acting in the best interest of the community 16% N=68 40% N=170 26% N=112 10% N=42 8% N=32 100% N=424
Being honest 14% N=60 35% N=148 23% N=98 9% N=38 19% N=82 100% N=426
Treating all residents fairly 13% N=54 35% N=149 24% N=101 11% N=48 17% N=74 100% N=427
Table 47: Question 13 Please rate how important, if at all, you think it is for the Yorktown community to focus on each of the following in the coming two years: Essential
Very important
Somewhat important
Not at all important Total
Overall ease of getting to the places you usually have to visit 26% N=114 42% N=180 28% N=121 4% N=17 100% N=432
Quality of overall natural environment in Yorktown 26% N=113 51% N=220 21% N=91 2% N=7 100% N=431
Overall "built environment" of Yorktown (including overall design, buildings, parks and transportation systems) 27% N=115 45% N=193 27% N=116 1% N=5 100% N=429
Health and wellness opportunities in Yorktown 24% N=105 45% N=194 28% N=121 2% N=10 100% N=430
Overall opportunities for education and enrichment 42% N=182 40% N=173 15% N=66 2% N=9 100% N=430
Overall economic health of Yorktown 47% N=203 43% N=184 10% N=41 0% N=2 100% N=430
Sense of community 35% N=150 52% N=222 13% N=54 1% N=4 100% N=430
Table 48: Question 14 Please rate the importance of each of the following for the future of the Town: Essential Very important Somewhat important Not at all important Total
Attracting new business and industry 61% N=262 30% N=128 9% N=39 1% N=3 100% N=433
Supporting and retaining existing businesses 64% N=277 32% N=139 4% N=16 0% N=1 100% N=433
Job creation 51% N=223 36% N=154 12% N=53 1% N=3 100% N=432
Increasing home ownership 31% N=134 41% N=175 25% N=109 3% N=12 100% N=430
Improving the appearance of the Town 36% N=154 39% N=167 24% N=102 2% N=8 100% N=431
Downtown residential development 27% N=114 37% N=157 30% N=130 6% N=27 100% N=428
Downtown business development 50% N=215 40% N=171 9% N=40 1% N=6 100% N=432
Improving bicycle and pedestrian access 31% N=132 35% N=152 27% N=114 7% N=31 100% N=429
Improving public safety 35% N=153 44% N=192 19% N=83 2% N=7 100% N=436
The National Citizen Survey™
16
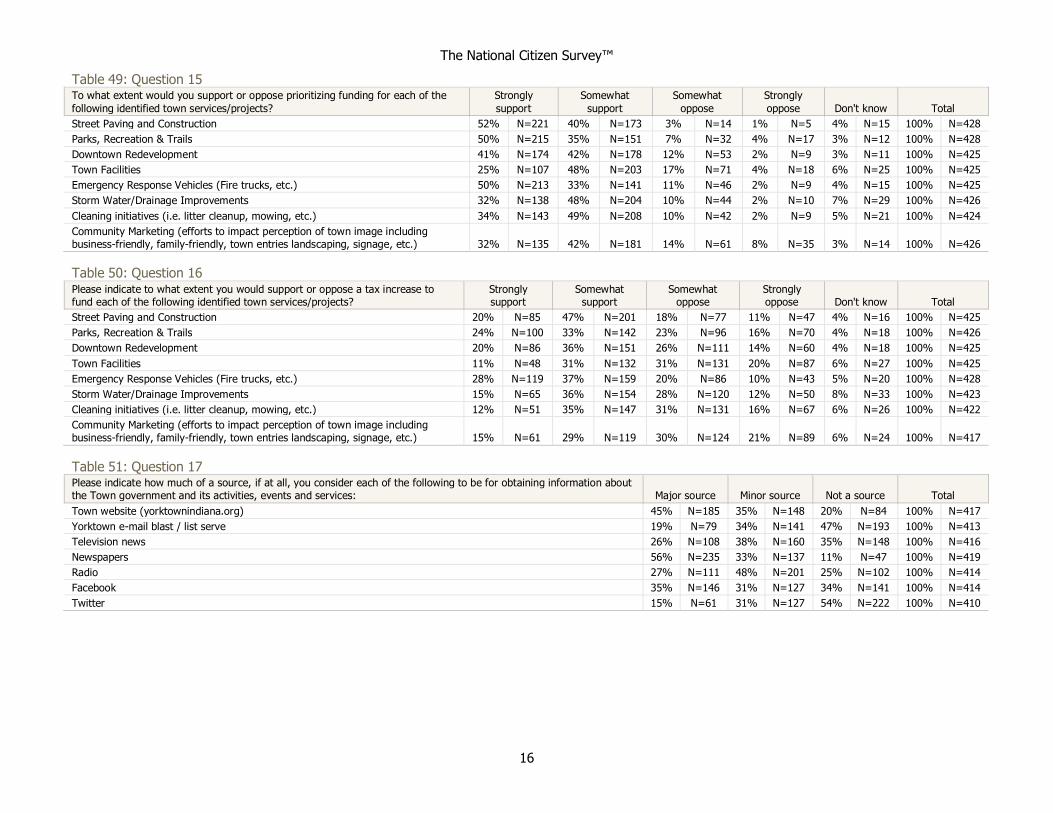
Table 49: Question 15 To what extent would you support or oppose prioritizing funding for each of the
following identified town services/projects?
Strongly
support
Somewhat
support
Somewhat
oppose
Strongly
oppose Don't know Total
Street Paving and Construction 52% N=221 40% N=173 3% N=14 1% N=5 4% N=15 100% N=428
Parks, Recreation & Trails 50% N=215 35% N=151 7% N=32 4% N=17 3% N=12 100% N=428
Downtown Redevelopment 41% N=174 42% N=178 12% N=53 2% N=9 3% N=11 100% N=425
Town Facilities 25% N=107 48% N=203 17% N=71 4% N=18 6% N=25 100% N=425
Emergency Response Vehicles (Fire trucks, etc.) 50% N=213 33% N=141 11% N=46 2% N=9 4% N=15 100% N=425
Storm Water/Drainage Improvements 32% N=138 48% N=204 10% N=44 2% N=10 7% N=29 100% N=426
Cleaning initiatives (i.e. litter cleanup, mowing, etc.) 34% N=143 49% N=208 10% N=42 2% N=9 5% N=21 100% N=424
Community Marketing (efforts to impact perception of town image including business-friendly, family-friendly, town entries landscaping, signage, etc.) 32% N=135 42% N=181 14% N=61 8% N=35 3% N=14 100% N=426
Table 50: Question 16 Please indicate to what extent you would support or oppose a tax increase to fund each of the following identified town services/projects?
Strongly support
Somewhat support
Somewhat oppose
Strongly oppose Don't know Total
Street Paving and Construction 20% N=85 47% N=201 18% N=77 11% N=47 4% N=16 100% N=425
Parks, Recreation & Trails 24% N=100 33% N=142 23% N=96 16% N=70 4% N=18 100% N=426
Downtown Redevelopment 20% N=86 36% N=151 26% N=111 14% N=60 4% N=18 100% N=425
Town Facilities 11% N=48 31% N=132 31% N=131 20% N=87 6% N=27 100% N=425
Emergency Response Vehicles (Fire trucks, etc.) 28% N=119 37% N=159 20% N=86 10% N=43 5% N=20 100% N=428
Storm Water/Drainage Improvements 15% N=65 36% N=154 28% N=120 12% N=50 8% N=33 100% N=423
Cleaning initiatives (i.e. litter cleanup, mowing, etc.) 12% N=51 35% N=147 31% N=131 16% N=67 6% N=26 100% N=422
Community Marketing (efforts to impact perception of town image including business-friendly, family-friendly, town entries landscaping, signage, etc.) 15% N=61 29% N=119 30% N=124 21% N=89 6% N=24 100% N=417
Table 51: Question 17 Please indicate how much of a source, if at all, you consider each of the following to be for obtaining information about the Town government and its activities, events and services: Major source Minor source Not a source Total
Town website (yorktownindiana.org) 45% N=185 35% N=148 20% N=84 100% N=417
Yorktown e-mail blast / list serve 19% N=79 34% N=141 47% N=193 100% N=413
Television news 26% N=108 38% N=160 35% N=148 100% N=416
Newspapers 56% N=235 33% N=137 11% N=47 100% N=419
Radio 27% N=111 48% N=201 25% N=102 100% N=414
Facebook 35% N=146 31% N=127 34% N=141 100% N=414
Twitter 15% N=61 31% N=127 54% N=222 100% N=410
The National Citizen Survey™
17
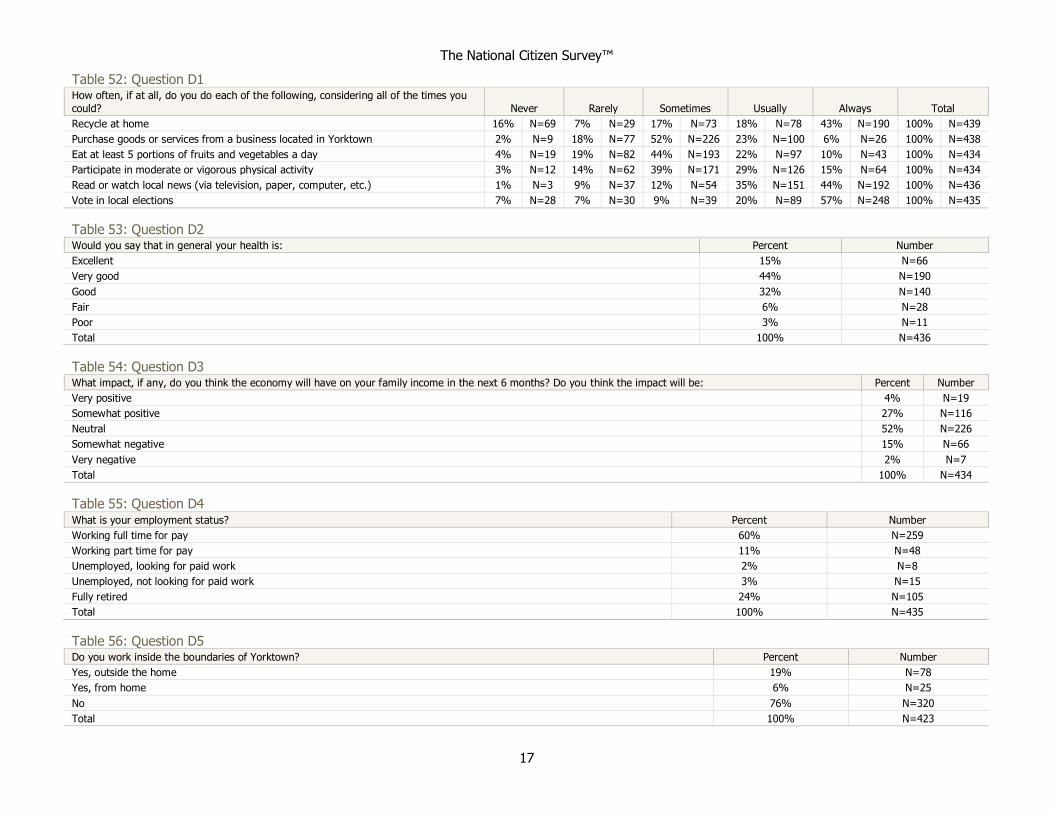
Table 52: Question D1 How often, if at all, do you do each of the following, considering all of the times you
could? Never Rarely Sometimes Usually Always Total
Recycle at home 16% N=69 7% N=29 17% N=73 18% N=78 43% N=190 100% N=439
Purchase goods or services from a business located in Yorktown 2% N=9 18% N=77 52% N=226 23% N=100 6% N=26 100% N=438
Eat at least 5 portions of fruits and vegetables a day 4% N=19 19% N=82 44% N=193 22% N=97 10% N=43 100% N=434
Participate in moderate or vigorous physical activity 3% N=12 14% N=62 39% N=171 29% N=126 15% N=64 100% N=434
Read or watch local news (via television, paper, computer, etc.) 1% N=3 9% N=37 12% N=54 35% N=151 44% N=192 100% N=436
Vote in local elections 7% N=28 7% N=30 9% N=39 20% N=89 57% N=248 100% N=435
Table 53: Question D2 Would you say that in general your health is: Percent Number
Excellent 15% N=66
Very good 44% N=190
Good 32% N=140
Fair 6% N=28
Poor 3% N=11
Total 100% N=436
Table 54: Question D3 What impact, if any, do you think the economy will have on your family income in the next 6 months? Do you think the impact will be: Percent Number
Very positive 4% N=19
Somewhat positive 27% N=116
Neutral 52% N=226
Somewhat negative 15% N=66
Very negative 2% N=7
Total 100% N=434
Table 55: Question D4 What is your employment status? Percent Number
Working full time for pay 60% N=259
Working part time for pay 11% N=48
Unemployed, looking for paid work 2% N=8
Unemployed, not looking for paid work 3% N=15
Fully retired 24% N=105
Total 100% N=435
Table 56: Question D5 Do you work inside the boundaries of Yorktown? Percent Number
Yes, outside the home 19% N=78
Yes, from home 6% N=25
No 76% N=320
Total 100% N=423
The National Citizen Survey™
18
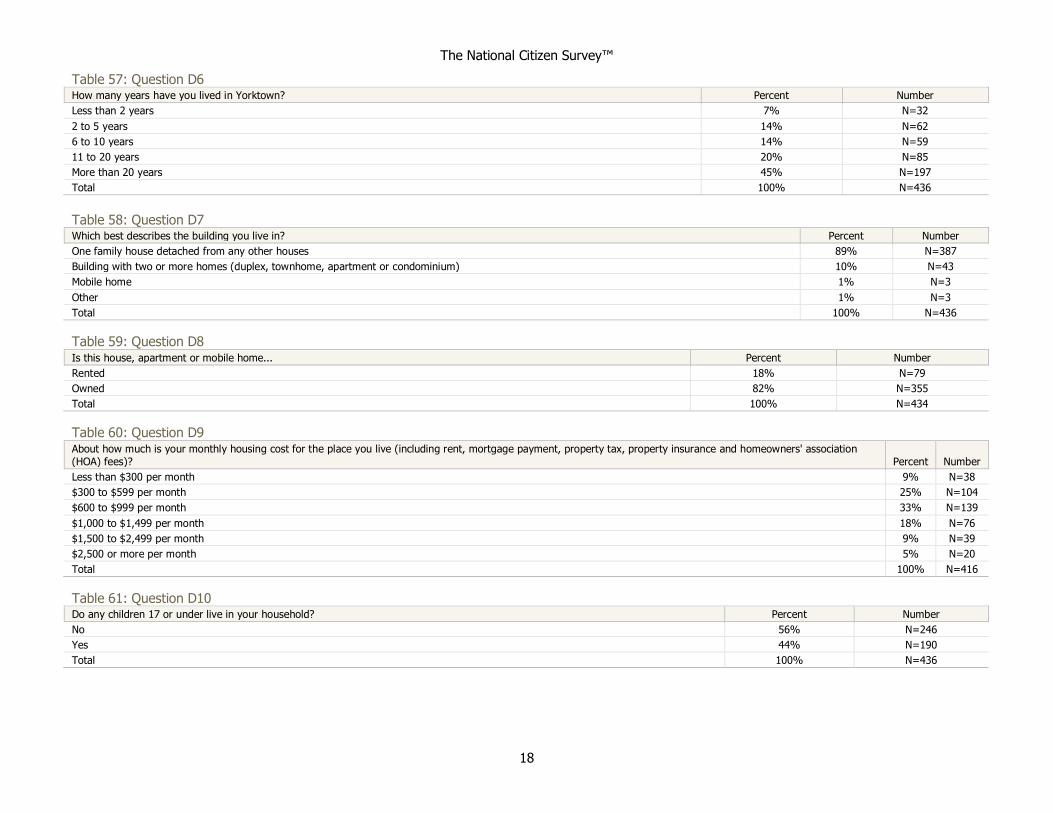
Table 57: Question D6 How many years have you lived in Yorktown? Percent Number
Less than 2 years 7% N=32
2 to 5 years 14% N=62
6 to 10 years 14% N=59
11 to 20 years 20% N=85
More than 20 years 45% N=197
Total 100% N=436
Table 58: Question D7 Which best describes the building you live in? Percent Number
One family house detached from any other houses 89% N=387
Building with two or more homes (duplex, townhome, apartment or condominium) 10% N=43
Mobile home 1% N=3
Other 1% N=3
Total 100% N=436
Table 59: Question D8 Is this house, apartment or mobile home... Percent Number
Rented 18% N=79
Owned 82% N=355
Total 100% N=434
Table 60: Question D9 About how much is your monthly housing cost for the place you live (including rent, mortgage payment, property tax, property insurance and homeowners' association (HOA) fees)? Percent Number
Less than $300 per month 9% N=38
$300 to $599 per month 25% N=104
$600 to $999 per month 33% N=139
$1,000 to $1,499 per month 18% N=76
$1,500 to $2,499 per month 9% N=39
$2,500 or more per month 5% N=20
Total 100% N=416
Table 61: Question D10 Do any children 17 or under live in your household? Percent Number
No 56% N=246
Yes 44% N=190
Total 100% N=436

The National Citizen Survey™
19
Table 62: Question D11 Are you or any other members of your household aged 65 or older? Percent Number
No 69% N=302
Yes 31% N=133
Total 100% N=435
Table 63: Question D12 How much do you anticipate your household's total income before taxes will be for the current year? (Please include in your total income money from all sources for all persons living in your household.) Percent Number
Less than $25,000 11% N=46
$25,000 to $49,999 24% N=99
$50,000 to $99,999 36% N=148
$100,000 to $149,999 17% N=68
$150,000 or more 13% N=52
Total 100% N=414
Table 64: Question D13 Are you Spanish, Hispanic or Latino? Percent Number
No, not Spanish, Hispanic or Latino 99% N=426
Yes, I consider myself to be Spanish, Hispanic or Latino 1% N=5
Total 100% N=431
Table 65: Question D14 What is your race? (Mark one or more races to indicate what race(s) you consider yourself to be.) Percent Number
American Indian or Alaskan Native 1% N=4
Asian, Asian Indian or Pacific Islander 1% N=4
Black or African American 1% N=5
White 97% N=421
Other 2% N=7
Total may exceed 100% as respondents could select more than one option.
Table 66: Question D15 In which category is your age? Percent Number
18 to 24 years 1% N=4
25 to 34 years 21% N=92
35 to 44 years 19% N=82
45 to 54 years 19% N=82
55 to 64 years 15% N=63
65 to 74 years 15% N=67
75 years or older 10% N=45
Total 100% N=436

The National Citizen Survey™
20
Table 67: Question D16 What is your sex? Percent Number
Female 53% N=230
Male 47% N=201
Total 100% N=430
Table 68: Question D17 Do you consider a cell phone or landline your primary telephone number? Percent Number
Cell 61% N=266
Land line 19% N=83
Both 20% N=89
Total 100% N=437
The National Citizen Survey™
21
Appendix B: Benchmark Comparisons
Comparison Data
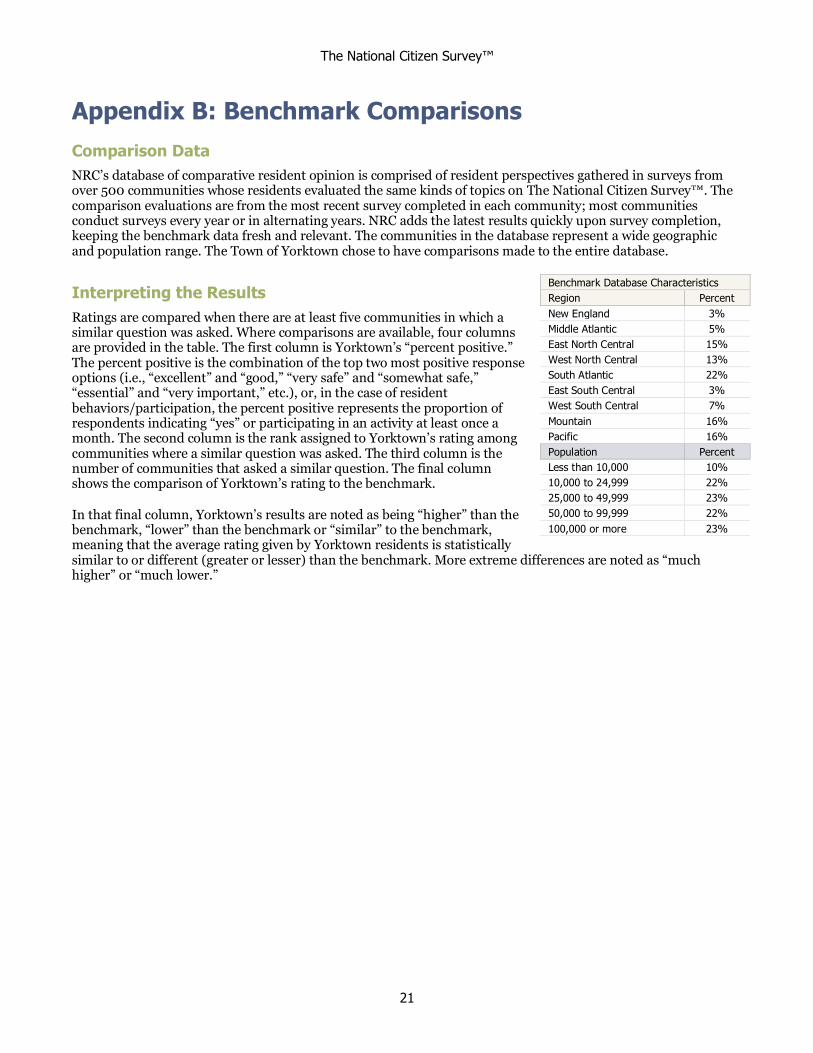
NRC’s database of comparative resident opinion is comprised of resident perspectives gathered in surveys from over 500 communities whose residents evaluated the same kinds of topics on The National Citizen Survey™. The comparison evaluations are from the most recent survey completed in each community; most communities conduct surveys every year or in alternating years. NRC adds the latest results quickly upon survey completion, keeping the benchmark data fresh and relevant. The communities in the database represent a wide geographic and population range. The Town of Yorktown chose to have comparisons made to the entire database.
Interpreting the Results
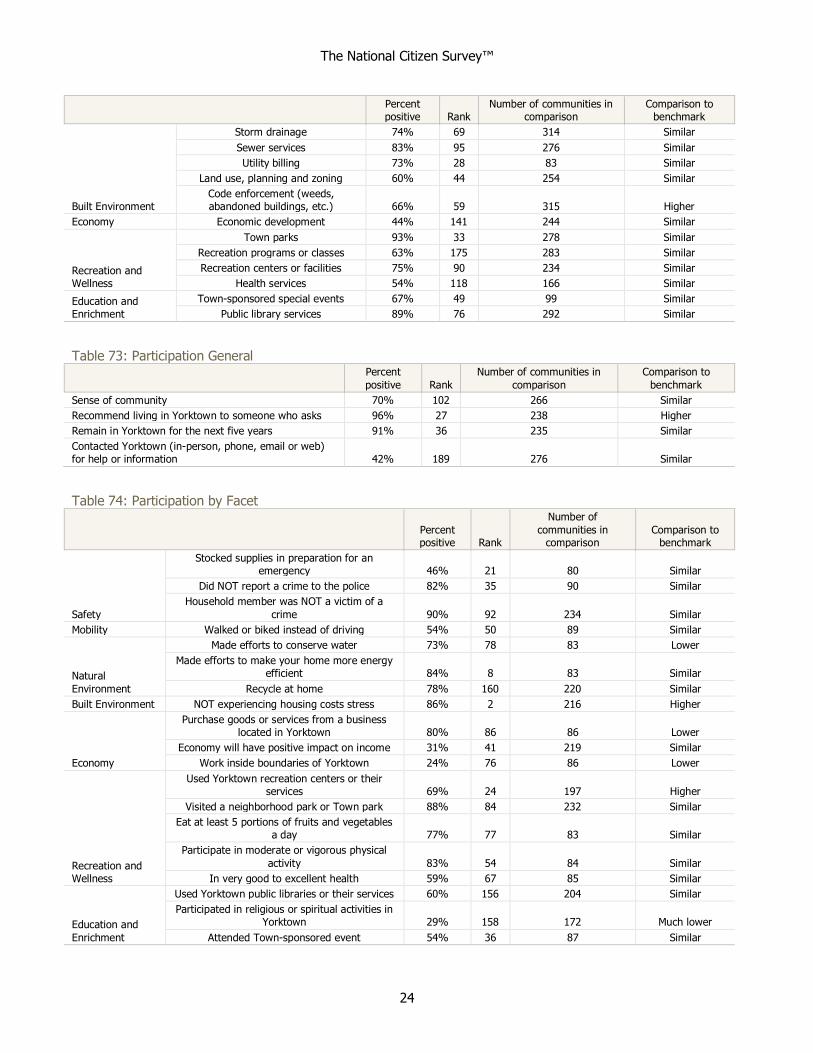
Ratings are compared when there are at least five communities in which a similar question was asked. Where comparisons are available, four columns are provided in the table. The first column is Yorktown’s “percent positive.” The percent positive is the combination of the top two most positive response options (i.e., “excellent” and “good,” “very safe” and “somewhat safe,” “essential” and “very important,” etc.), or, in the case of resident behaviors/participation, the percent positive represents the proportion of respondents indicating “yes” or participating in an activity at least once a month. The second column is the rank assigned to Yorktown’s rating among communities where a similar question was asked. The third column is the number of communities that asked a similar question. The final column shows the comparison of Yorktown’s rating to the benchmark.
In that final column, Yorktown’s results are noted as being “higher” than the benchmark, “lower” than the benchmark or “similar” to the benchmark, meaning that the average rating given by Yorktown residents is statistically similar to or different (greater or lesser) than the benchmark. More extreme differences are noted as “much higher” or “much lower.”
Benchmark Database Characteristics
Region Percent
New England 3%
Middle Atlantic 5%
East North Central 15%
West North Central 13%
South Atlantic 22%
East South Central 3%
West South Central 7%
Mountain 16%
Pacific 16%
Population Percent
Less than 10,000 10%
10,000 to 24,999 22%
25,000 to 49,999 23%
50,000 to 99,999 22%
100,000 or more 23%
The National Citizen Survey™
22
National Benchmark Comparisons
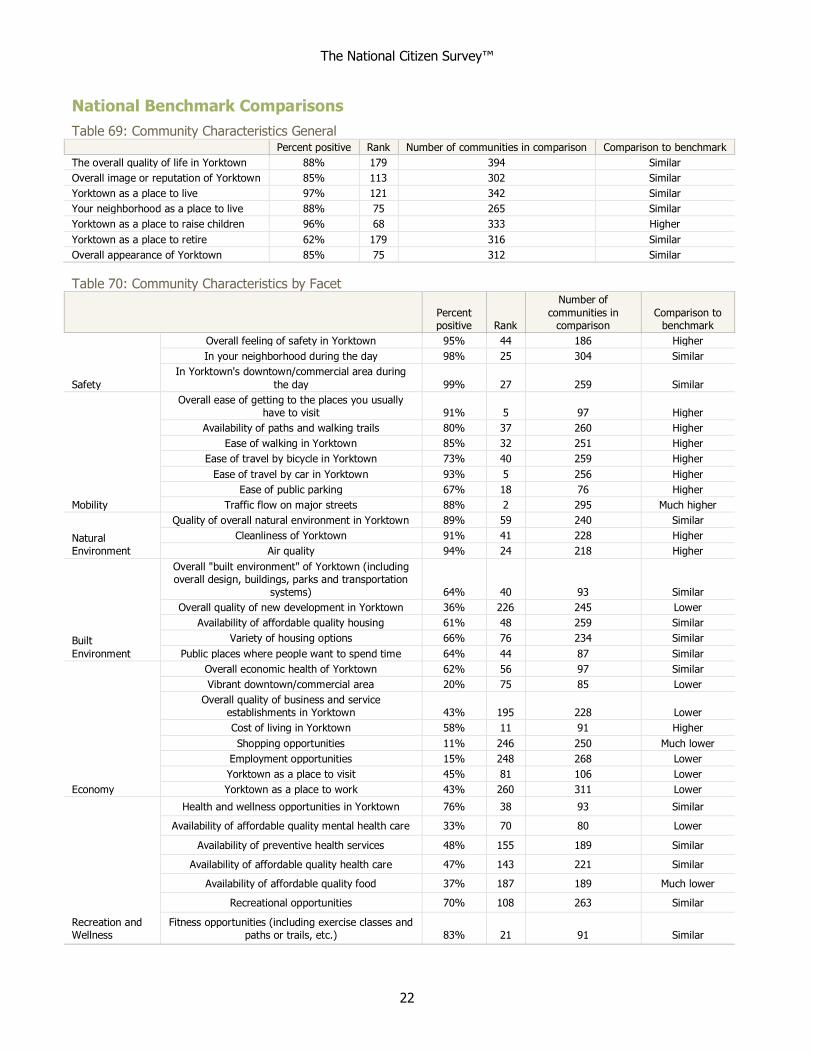
Table 69: Community Characteristics General Percent positive Rank Number of communities in comparison Comparison to benchmark
The overall quality of life in Yorktown 88% 179 394 Similar
Overall image or reputation of Yorktown 85% 113 302 Similar
Yorktown as a place to live 97% 121 342 Similar
Your neighborhood as a place to live 88% 75 265 Similar
Yorktown as a place to raise children 96% 68 333 Higher
Yorktown as a place to retire 62% 179 316 Similar
Overall appearance of Yorktown 85% 75 312 Similar
Table 70: Community Characteristics by Facet
Percent positive Rank
Number of
communities in comparison
Comparison to benchmark
Safety
Overall feeling of safety in Yorktown 95% 44 186 Higher
In your neighborhood during the day 98% 25 304 Similar
In Yorktown's downtown/commercial area during
the day 99% 27 259 Similar
Mobility
Overall ease of getting to the places you usually have to visit 91% 5 97 Higher
Availability of paths and walking trails 80% 37 260 Higher
Ease of walking in Yorktown 85% 32 251 Higher
Ease of travel by bicycle in Yorktown 73% 40 259 Higher
Ease of travel by car in Yorktown 93% 5 256 Higher
Ease of public parking 67% 18 76 Higher
Traffic flow on major streets 88% 2 295 Much higher
Natural Environment
Quality of overall natural environment in Yorktown 89% 59 240 Similar
Cleanliness of Yorktown 91% 41 228 Higher
Air quality 94% 24 218 Higher
Built
Environment
Overall "built environment" of Yorktown (including overall design, buildings, parks and transportation
systems) 64% 40 93 Similar
Overall quality of new development in Yorktown 36% 226 245 Lower
Availability of affordable quality housing 61% 48 259 Similar
Variety of housing options 66% 76 234 Similar
Public places where people want to spend time 64% 44 87 Similar
Economy
Overall economic health of Yorktown 62% 56 97 Similar
Vibrant downtown/commercial area 20% 75 85 Lower
Overall quality of business and service establishments in Yorktown 43% 195 228 Lower
Cost of living in Yorktown 58% 11 91 Higher
Shopping opportunities 11% 246 250 Much lower
Employment opportunities 15% 248 268 Lower
Yorktown as a place to visit 45% 81 106 Lower
Yorktown as a place to work 43% 260 311 Lower
Recreation and Wellness
Health and wellness opportunities in Yorktown 76% 38 93 Similar
Availability of affordable quality mental health care 33% 70 80 Lower
Availability of preventive health services 48% 155 189 Similar
Availability of affordable quality health care 47% 143 221 Similar
Availability of affordable quality food 37% 187 189 Much lower
Recreational opportunities 70% 108 263 Similar
Fitness opportunities (including exercise classes and paths or trails, etc.) 83% 21 91 Similar
The National Citizen Survey™
23
Percent positive Rank
Number of communities in
comparison Comparison to
benchmark
Education and
Enrichment
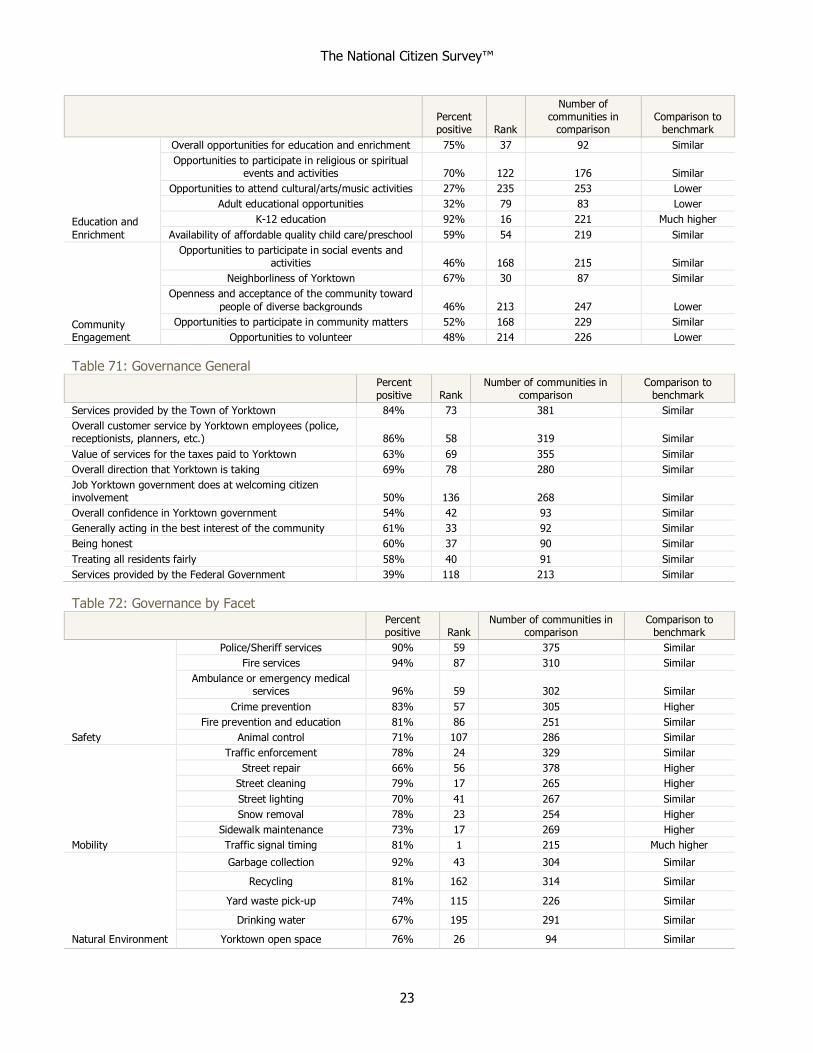
Overall opportunities for education and enrichment 75% 37 92 Similar
Opportunities to participate in religious or spiritual events and activities 70% 122 176 Similar
Opportunities to attend cultural/arts/music activities 27% 235 253 Lower
Adult educational opportunities 32% 79 83 Lower
K-12 education 92% 16 221 Much higher
Availability of affordable quality child care/preschool 59% 54 219 Similar
Community Engagement
Opportunities to participate in social events and activities 46% 168 215 Similar
Neighborliness of Yorktown 67% 30 87 Similar
Openness and acceptance of the community toward
people of diverse backgrounds 46% 213 247 Lower
Opportunities to participate in community matters 52% 168 229 Similar
Opportunities to volunteer 48% 214 226 Lower
Table 71: Governance General
Percent positive Rank
Number of communities in comparison
Comparison to benchmark
Services provided by the Town of Yorktown 84% 73 381 Similar
Overall customer service by Yorktown employees (police, receptionists, planners, etc.) 86% 58 319 Similar
Value of services for the taxes paid to Yorktown 63% 69 355 Similar
Overall direction that Yorktown is taking 69% 78 280 Similar
Job Yorktown government does at welcoming citizen involvement 50% 136 268 Similar
Overall confidence in Yorktown government 54% 42 93 Similar
Generally acting in the best interest of the community 61% 33 92 Similar
Being honest 60% 37 90 Similar
Treating all residents fairly 58% 40 91 Similar
Services provided by the Federal Government 39% 118 213 Similar
Table 72: Governance by Facet
Percent positive Rank
Number of communities in comparison
Comparison to benchmark
Safety
Police/Sheriff services 90% 59 375 Similar
Fire services 94% 87 310 Similar
Ambulance or emergency medical services 96% 59 302 Similar
Crime prevention 83% 57 305 Higher
Fire prevention and education 81% 86 251 Similar
Animal control 71% 107 286 Similar
Mobility
Traffic enforcement 78% 24 329 Similar
Street repair 66% 56 378 Higher
Street cleaning 79% 17 265 Higher
Street lighting 70% 41 267 Similar
Snow removal 78% 23 254 Higher
Sidewalk maintenance 73% 17 269 Higher
Traffic signal timing 81% 1 215 Much higher
Natural Environment
Garbage collection 92% 43 304 Similar
Recycling 81% 162 314 Similar
Yard waste pick-up 74% 115 226 Similar
Drinking water 67% 195 291 Similar
Yorktown open space 76% 26 94 Similar
The National Citizen Survey™
24
Percent positive Rank
Number of communities in comparison
Comparison to benchmark
Built Environment
Storm drainage 74% 69 314 Similar
Sewer services 83% 95 276 Similar
Utility billing 73% 28 83 Similar
Land use, planning and zoning 60% 44 254 Similar
Code enforcement (weeds, abandoned buildings, etc.) 66% 59 315 Higher
Economy Economic development 44% 141 244 Similar
Recreation and Wellness
Town parks 93% 33 278 Similar
Recreation programs or classes 63% 175 283 Similar
Recreation centers or facilities 75% 90 234 Similar
Health services 54% 118 166 Similar
Education and Enrichment
Town-sponsored special events 67% 49 99 Similar
Public library services 89% 76 292 Similar
Table 73: Participation General
Percent
positive Rank
Number of communities in
comparison
Comparison to
benchmark
Sense of community 70% 102 266 Similar
Recommend living in Yorktown to someone who asks 96% 27 238 Higher
Remain in Yorktown for the next five years 91% 36 235 Similar
Contacted Yorktown (in-person, phone, email or web) for help or information 42% 189 276 Similar
Table 74: Participation by Facet
Percent positive Rank
Number of
communities in comparison
Comparison to benchmark
Safety
Stocked supplies in preparation for an emergency 46% 21 80 Similar
Did NOT report a crime to the police 82% 35 90 Similar
Household member was NOT a victim of a
crime 90% 92 234 Similar
Mobility Walked or biked instead of driving 54% 50 89 Similar
Natural
Environment
Made efforts to conserve water 73% 78 83 Lower
Made efforts to make your home more energy efficient 84% 8 83 Similar
Recycle at home 78% 160 220 Similar
Built Environment NOT experiencing housing costs stress 86% 2 216 Higher
Economy
Purchase goods or services from a business located in Yorktown 80% 86 86 Lower
Economy will have positive impact on income 31% 41 219 Similar
Work inside boundaries of Yorktown 24% 76 86 Lower
Recreation and Wellness
Used Yorktown recreation centers or their services 69% 24 197 Higher
Visited a neighborhood park or Town park 88% 84 232 Similar
Eat at least 5 portions of fruits and vegetables a day 77% 77 83 Similar
Participate in moderate or vigorous physical
activity 83% 54 84 Similar
In very good to excellent health 59% 67 85 Similar
Education and
Enrichment
Used Yorktown public libraries or their services 60% 156 204 Similar
Participated in religious or spiritual activities in Yorktown 29% 158 172 Much lower
Attended Town-sponsored event 54% 36 87 Similar
The National Citizen Survey™
25
Percent positive Rank
Number of communities in
comparison Comparison to
benchmark
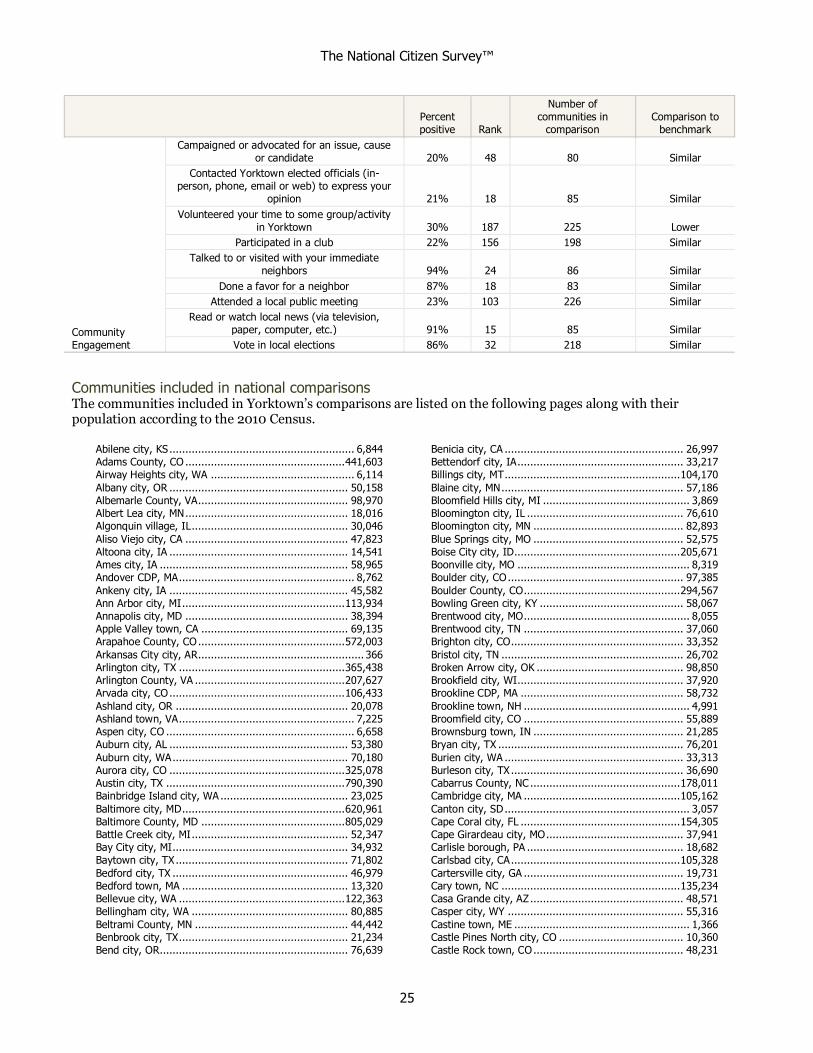
Community Engagement
Campaigned or advocated for an issue, cause
or candidate 20% 48 80 Similar
Contacted Yorktown elected officials (in-person, phone, email or web) to express your
opinion 21% 18 85 Similar
Volunteered your time to some group/activity in Yorktown 30% 187 225 Lower
Participated in a club 22% 156 198 Similar
Talked to or visited with your immediate neighbors 94% 24 86 Similar
Done a favor for a neighbor 87% 18 83 Similar
Attended a local public meeting 23% 103 226 Similar
Read or watch local news (via television, paper, computer, etc.) 91% 15 85 Similar
Vote in local elections 86% 32 218 Similar
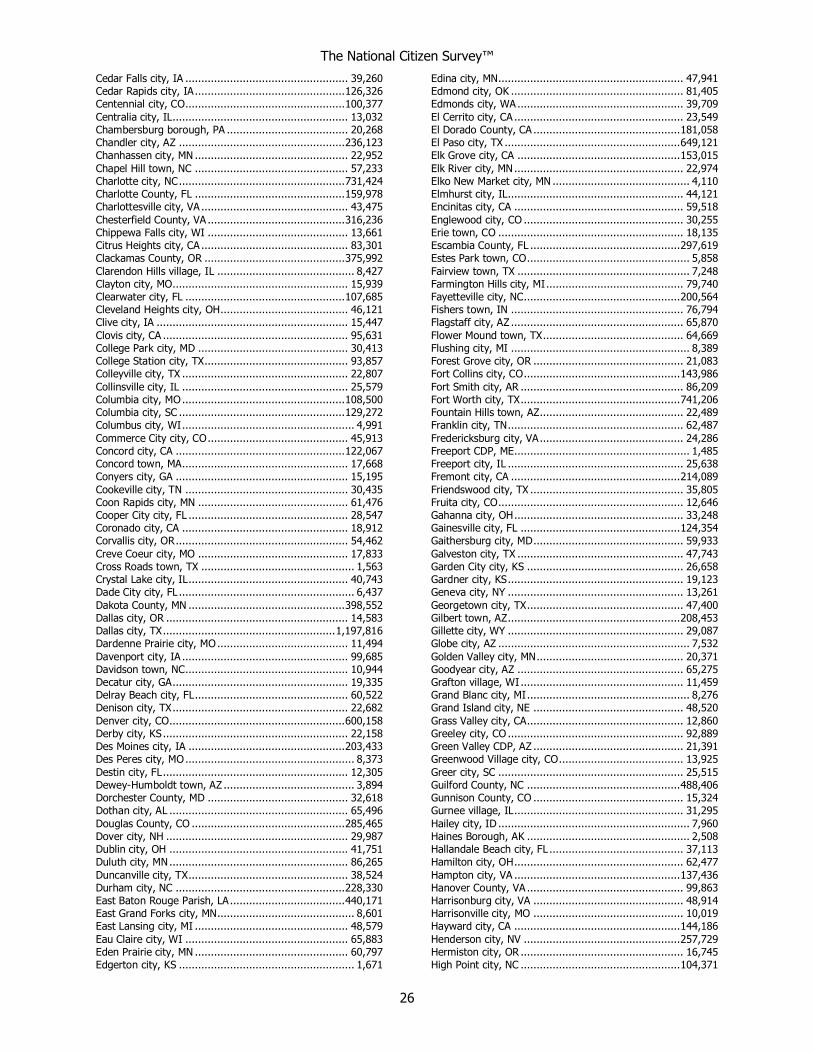
Communities included in national comparisons The communities included in Yorktown’s comparisons are listed on the following pages along with their population according to the 2010 Census.
Abilene city, KS .......................................................... 6,844 Adams County, CO .................................................. 441,603 Airway Heights city, WA ............................................. 6,114
Albany city, OR ........................................................ 50,158 Albemarle County, VA............................................... 98,970 Albert Lea city, MN ................................................... 18,016 Algonquin village, IL ................................................. 30,046
Aliso Viejo city, CA ................................................... 47,823 Altoona city, IA ........................................................ 14,541 Ames city, IA ........................................................... 58,965 Andover CDP, MA ....................................................... 8,762
Ankeny city, IA ........................................................ 45,582 Ann Arbor city, MI ................................................... 113,934 Annapolis city, MD ................................................... 38,394 Apple Valley town, CA .............................................. 69,135 Arapahoe County, CO .............................................. 572,003
Arkansas City city, AR.................................................... 366 Arlington city, TX .................................................... 365,438 Arlington County, VA ............................................... 207,627 Arvada city, CO ....................................................... 106,433
Ashland city, OR ...................................................... 20,078 Ashland town, VA ....................................................... 7,225 Aspen city, CO ........................................................... 6,658 Auburn city, AL ........................................................ 53,380
Auburn city, WA ....................................................... 70,180 Aurora city, CO ....................................................... 325,078 Austin city, TX ........................................................ 790,390 Bainbridge Island city, WA ........................................ 23,025
Baltimore city, MD ................................................... 620,961 Baltimore County, MD ............................................. 805,029 Battle Creek city, MI ................................................. 52,347 Bay City city, MI ....................................................... 34,932
Baytown city, TX ...................................................... 71,802
Bedford city, TX ....................................................... 46,979 Bedford town, MA .................................................... 13,320 Bellevue city, WA .................................................... 122,363 Bellingham city, WA ................................................. 80,885
Beltrami County, MN ................................................ 44,442 Benbrook city, TX ..................................................... 21,234 Bend city, OR........................................................... 76,639
Benicia city, CA ........................................................ 26,997 Bettendorf city, IA .................................................... 33,217 Billings city, MT ....................................................... 104,170
Blaine city, MN ......................................................... 57,186 Bloomfield Hills city, MI .............................................. 3,869 Bloomington city, IL ................................................. 76,610 Bloomington city, MN ............................................... 82,893
Blue Springs city, MO ............................................... 52,575 Boise City city, ID.................................................... 205,671 Boonville city, MO ...................................................... 8,319 Boulder city, CO ....................................................... 97,385
Boulder County, CO ................................................. 294,567 Bowling Green city, KY ............................................. 58,067 Brentwood city, MO .................................................... 8,055 Brentwood city, TN .................................................. 37,060 Brighton city, CO ...................................................... 33,352
Bristol city, TN ......................................................... 26,702 Broken Arrow city, OK .............................................. 98,850 Brookfield city, WI.................................................... 37,920 Brookline CDP, MA ................................................... 58,732
Brookline town, NH .................................................... 4,991 Broomfield city, CO .................................................. 55,889 Brownsburg town, IN ............................................... 21,285 Bryan city, TX .......................................................... 76,201
Burien city, WA ........................................................ 33,313 Burleson city, TX ...................................................... 36,690 Cabarrus County, NC ............................................... 178,011 Cambridge city, MA ................................................. 105,162
Canton city, SD .......................................................... 3,057 Cape Coral city, FL .................................................. 154,305 Cape Girardeau city, MO ........................................... 37,941 Carlisle borough, PA ................................................. 18,682
Carlsbad city, CA ..................................................... 105,328
Cartersville city, GA .................................................. 19,731 Cary town, NC ........................................................ 135,234 Casa Grande city, AZ ................................................ 48,571 Casper city, WY ....................................................... 55,316
Castine town, ME ....................................................... 1,366 Castle Pines North city, CO ....................................... 10,360 Castle Rock town, CO ............................................... 48,231
The National Citizen Survey™
26
Cedar Falls city, IA ................................................... 39,260 Cedar Rapids city, IA ............................................... 126,326 Centennial city, CO.................................................. 100,377
Centralia city, IL....................................................... 13,032 Chambersburg borough, PA ...................................... 20,268 Chandler city, AZ .................................................... 236,123
Chanhassen city, MN ................................................ 22,952
Chapel Hill town, NC ................................................ 57,233 Charlotte city, NC .................................................... 731,424 Charlotte County, FL ............................................... 159,978 Charlottesville city, VA .............................................. 43,475
Chesterfield County, VA ........................................... 316,236 Chippewa Falls city, WI ............................................ 13,661 Citrus Heights city, CA .............................................. 83,301 Clackamas County, OR ............................................ 375,992
Clarendon Hills village, IL ........................................... 8,427 Clayton city, MO....................................................... 15,939 Clearwater city, FL .................................................. 107,685 Cleveland Heights city, OH........................................ 46,121 Clive city, IA ............................................................ 15,447
Clovis city, CA .......................................................... 95,631 College Park city, MD ............................................... 30,413
College Station city, TX............................................. 93,857 Colleyville city, TX .................................................... 22,807
Collinsville city, IL .................................................... 25,579 Columbia city, MO ................................................... 108,500 Columbia city, SC .................................................... 129,272 Columbus city, WI ...................................................... 4,991
Commerce City city, CO ............................................ 45,913 Concord city, CA ..................................................... 122,067 Concord town, MA.................................................... 17,668 Conyers city, GA ...................................................... 15,195
Cookeville city, TN ................................................... 30,435 Coon Rapids city, MN ............................................... 61,476 Cooper City city, FL .................................................. 28,547 Coronado city, CA .................................................... 18,912 Corvallis city, OR ...................................................... 54,462
Creve Coeur city, MO ............................................... 17,833 Cross Roads town, TX ................................................ 1,563 Crystal Lake city, IL .................................................. 40,743 Dade City city, FL ....................................................... 6,437
Dakota County, MN ................................................. 398,552 Dallas city, OR ......................................................... 14,583 Dallas city, TX ...................................................... 1,197,816 Dardenne Prairie city, MO ......................................... 11,494
Davenport city, IA .................................................... 99,685 Davidson town, NC................................................... 10,944 Decatur city, GA ....................................................... 19,335 Delray Beach city, FL ................................................ 60,522 Denison city, TX ....................................................... 22,682
Denver city, CO....................................................... 600,158 Derby city, KS .......................................................... 22,158 Des Moines city, IA ................................................. 203,433 Des Peres city, MO ..................................................... 8,373
Destin city, FL .......................................................... 12,305 Dewey-Humboldt town, AZ ......................................... 3,894 Dorchester County, MD ............................................ 32,618 Dothan city, AL ........................................................ 65,496
Douglas County, CO ................................................ 285,465 Dover city, NH ......................................................... 29,987 Dublin city, OH ........................................................ 41,751
Duluth city, MN ........................................................ 86,265
Duncanville city, TX .................................................. 38,524 Durham city, NC ..................................................... 228,330 East Baton Rouge Parish, LA .................................... 440,171 East Grand Forks city, MN........................................... 8,601 East Lansing city, MI ................................................ 48,579
Eau Claire city, WI ................................................... 65,883 Eden Prairie city, MN ................................................ 60,797
Edgerton city, KS ....................................................... 1,671
Edina city, MN.......................................................... 47,941 Edmond city, OK ...................................................... 81,405 Edmonds city, WA .................................................... 39,709
El Cerrito city, CA ..................................................... 23,549 El Dorado County, CA .............................................. 181,058 El Paso city, TX ....................................................... 649,121
Elk Grove city, CA ................................................... 153,015
Elk River city, MN ..................................................... 22,974 Elko New Market city, MN ........................................... 4,110 Elmhurst city, IL....................................................... 44,121 Encinitas city, CA ..................................................... 59,518
Englewood city, CO .................................................. 30,255 Erie town, CO .......................................................... 18,135 Escambia County, FL ............................................... 297,619 Estes Park town, CO ................................................... 5,858
Fairview town, TX ...................................................... 7,248 Farmington Hills city, MI ........................................... 79,740 Fayetteville city, NC................................................. 200,564 Fishers town, IN ...................................................... 76,794 Flagstaff city, AZ ...................................................... 65,870
Flower Mound town, TX ............................................ 64,669 Flushing city, MI ........................................................ 8,389
Forest Grove city, OR ............................................... 21,083 Fort Collins city, CO ................................................. 143,986
Fort Smith city, AR ................................................... 86,209 Fort Worth city, TX .................................................. 741,206 Fountain Hills town, AZ............................................. 22,489 Franklin city, TN ....................................................... 62,487
Fredericksburg city, VA ............................................. 24,286 Freeport CDP, ME....................................................... 1,485 Freeport city, IL ....................................................... 25,638 Fremont city, CA ..................................................... 214,089
Friendswood city, TX ................................................ 35,805 Fruita city, CO .......................................................... 12,646 Gahanna city, OH ..................................................... 33,248 Gainesville city, FL .................................................. 124,354 Gaithersburg city, MD ............................................... 59,933
Galveston city, TX .................................................... 47,743 Garden City city, KS ................................................. 26,658 Gardner city, KS ....................................................... 19,123 Geneva city, NY ....................................................... 13,261
Georgetown city, TX ................................................. 47,400 Gilbert town, AZ ...................................................... 208,453 Gillette city, WY ....................................................... 29,087 Globe city, AZ ............................................................ 7,532
Golden Valley city, MN .............................................. 20,371 Goodyear city, AZ .................................................... 65,275 Grafton village, WI ................................................... 11,459 Grand Blanc city, MI ................................................... 8,276 Grand Island city, NE ............................................... 48,520
Grass Valley city, CA................................................. 12,860 Greeley city, CO ....................................................... 92,889 Green Valley CDP, AZ ............................................... 21,391 Greenwood Village city, CO ....................................... 13,925
Greer city, SC .......................................................... 25,515 Guilford County, NC ................................................ 488,406 Gunnison County, CO ............................................... 15,324 Gurnee village, IL ..................................................... 31,295
Hailey city, ID ............................................................ 7,960 Haines Borough, AK ................................................... 2,508 Hallandale Beach city, FL .......................................... 37,113
Hamilton city, OH ..................................................... 62,477
Hampton city, VA .................................................... 137,436 Hanover County, VA ................................................. 99,863 Harrisonburg city, VA ............................................... 48,914 Harrisonville city, MO ............................................... 10,019 Hayward city, CA .................................................... 144,186
Henderson city, NV ................................................. 257,729 Hermiston city, OR ................................................... 16,745
High Point city, NC .................................................. 104,371

The National Citizen Survey™
27
Highland Park city, IL ............................................... 29,763 Highlands Ranch CDP, CO ........................................ 96,713 Hillsborough town, NC ................................................ 6,087
Holden town, MA ..................................................... 17,346 Holland city, MI........................................................ 33,051 Honolulu County, HI ................................................ 953,207
Hooksett town, NH ................................................... 13,451
Hopkins city, MN ...................................................... 17,591 Hopkinton town, MA ................................................. 14,925 Hoquiam city, WA ...................................................... 8,726 Houston city, TX .................................................. 2,099,451
Hudson city, OH ....................................................... 22,262 Hudson town, CO ....................................................... 2,356 Hudsonville city, MI .................................................... 7,116 Huntersville town, NC ............................................... 46,773
Hurst city, TX........................................................... 37,337 Hutchinson city, MN ................................................. 14,178 Hutto city, TX .......................................................... 14,698 Hyattsville city, MD .................................................. 17,557 Independence city, MO............................................ 116,830
Indian Trail town, NC ............................................... 33,518 Indianola city, IA...................................................... 14,782
Iowa City city, IA ..................................................... 67,862 Issaquah city, WA .................................................... 30,434
Jackson County, MI ................................................. 160,248 James City County, VA ............................................. 67,009 Jefferson City city, MO.............................................. 43,079 Jefferson County, CO .............................................. 534,543
Jefferson County, NY ............................................... 116,229 Jerome city, ID ........................................................ 10,890 Johnson City city, TN................................................ 63,152 Johnson County, KS ................................................ 544,179
Johnston city, IA ...................................................... 17,278 Jupiter town, FL ....................................................... 55,156 Kalamazoo city, MI ................................................... 74,262 Kansas City city, KS ................................................. 145,786 Kansas City city, MO................................................ 459,787
Keizer city, OR ......................................................... 36,478 Kenmore city, WA .................................................... 20,460 Kennedale city, TX ..................................................... 6,763 Kennett Square borough, PA ....................................... 6,072
Kirkland city, WA...................................................... 48,787 La Mesa city, CA ...................................................... 57,065 La Plata town, MD ...................................................... 8,753 La Porte city, TX ...................................................... 33,800
La Vista city, NE ....................................................... 15,758 Lafayette city, CO .................................................... 24,453 Laguna Beach city, CA .............................................. 22,723 Laguna Hills city, CA ................................................. 30,344 Laguna Niguel city, CA ............................................. 62,979
Lake Oswego city, OR .............................................. 36,619 Lake Zurich village, IL .............................................. 19,631 Lakeville city, MN ..................................................... 55,954 Lakewood city, CO .................................................. 142,980
Lane County, OR ..................................................... 351,715 Larimer County, CO ................................................. 299,630 Las Cruces city, NM .................................................. 97,618 Las Vegas city, NV .................................................. 583,756
Lawrence city, KS..................................................... 87,643 League City city, TX ................................................. 83,560 Lee County, FL........................................................ 618,754
Lee's Summit city, MO .............................................. 91,364
Lehi city, UT ............................................................ 47,407 Lenexa city, KS ........................................................ 48,190 Lewis County, NY ..................................................... 27,087 Lewiston city, ME ..................................................... 36,592 Lincoln city, NE ....................................................... 258,379
Lindsborg city, KS ...................................................... 3,458 Littleton city, CO ...................................................... 41,737
Livermore city, CA .................................................... 80,968
Lone Tree city, CO ................................................... 10,218 Longmont city, CO ................................................... 86,270 Longview city, TX ..................................................... 80,455
Los Alamos County, NM ............................................ 17,950 Louisville city, CO ..................................................... 18,376 Lynchburg city, VA ................................................... 75,568
Lynnwood city, WA .................................................. 35,836
Madison city, WI ..................................................... 233,209 Mankato city, MN ..................................................... 39,309 Maple Grove city, MN ............................................... 61,567 Maple Valley city, WA ............................................... 22,684
Maricopa County, AZ ............................................ 3,817,117 Marin County, CA .................................................... 252,409 Maryland Heights city, MO ........................................ 27,472 Matthews town, NC .................................................. 27,198
McAllen city, TX ...................................................... 129,877 McDonough city, GA ................................................. 22,084 McKinney city, TX.................................................... 131,117 McMinnville city, OR ................................................. 32,187 Mecklenburg County, NC ......................................... 919,628
Medford city, OR ...................................................... 74,907 Menlo Park city, CA .................................................. 32,026
Mercer Island city, WA ............................................. 22,699 Meridian charter township, MI .................................. 39,688
Meridian city, ID ...................................................... 75,092 Merriam city, KS....................................................... 11,003 Merrill city, WI ........................................................... 9,661 Mesa city, AZ .......................................................... 439,041
Mesa County, CO .................................................... 146,723 Miami Beach city, FL ................................................ 87,779 Miami city, FL ......................................................... 399,457 Midland city, MI ....................................................... 41,863
Milford city, DE .......................................................... 9,559 Milton city, GA ......................................................... 32,661 Minneapolis city, MN ............................................... 382,578 Mission Viejo city, CA ............................................... 93,305 Modesto city, CA ..................................................... 201,165
Monterey city, CA ..................................................... 27,810 Montgomery County, MD ......................................... 971,777 Montgomery County, VA ........................................... 94,392 Montpelier city, VT ..................................................... 7,855
Monument town, CO .................................................. 5,530 Mooresville town, NC ................................................ 32,711 Morristown city, TN .................................................. 29,137 Moscow city, ID ....................................................... 23,800
Mountain Village town, CO .......................................... 1,320 Mountlake Terrace city, WA ...................................... 19,909 Munster town, IN ..................................................... 23,603 Muscatine city, IA .................................................... 22,886 Naperville city, IL .................................................... 141,853
Needham CDP, MA ................................................... 28,886 New Braunfels city, TX ............................................. 57,740 New Brighton city, MN .............................................. 21,456 New Hanover County, NC ........................................ 202,667
New Orleans city, LA ............................................... 343,829 New Smyrna Beach city, FL ...................................... 22,464 Newberg city, OR ..................................................... 22,068 Newport Beach city, CA ............................................ 85,186
Newport city, RI ....................................................... 24,672 Newport News city, VA ............................................ 180,719 Newton city, IA ........................................................ 15,254
Noblesville city, IN ................................................... 51,969
Nogales city, AZ ....................................................... 20,837 Norfolk city, VA ....................................................... 242,803 Norman city, OK ..................................................... 110,925 North Las Vegas city, NV ......................................... 216,961 Northglenn city, CO .................................................. 35,789
Novato city, CA ........................................................ 51,904 Novi city, MI ............................................................ 55,224
O'Fallon city, IL ........................................................ 28,281
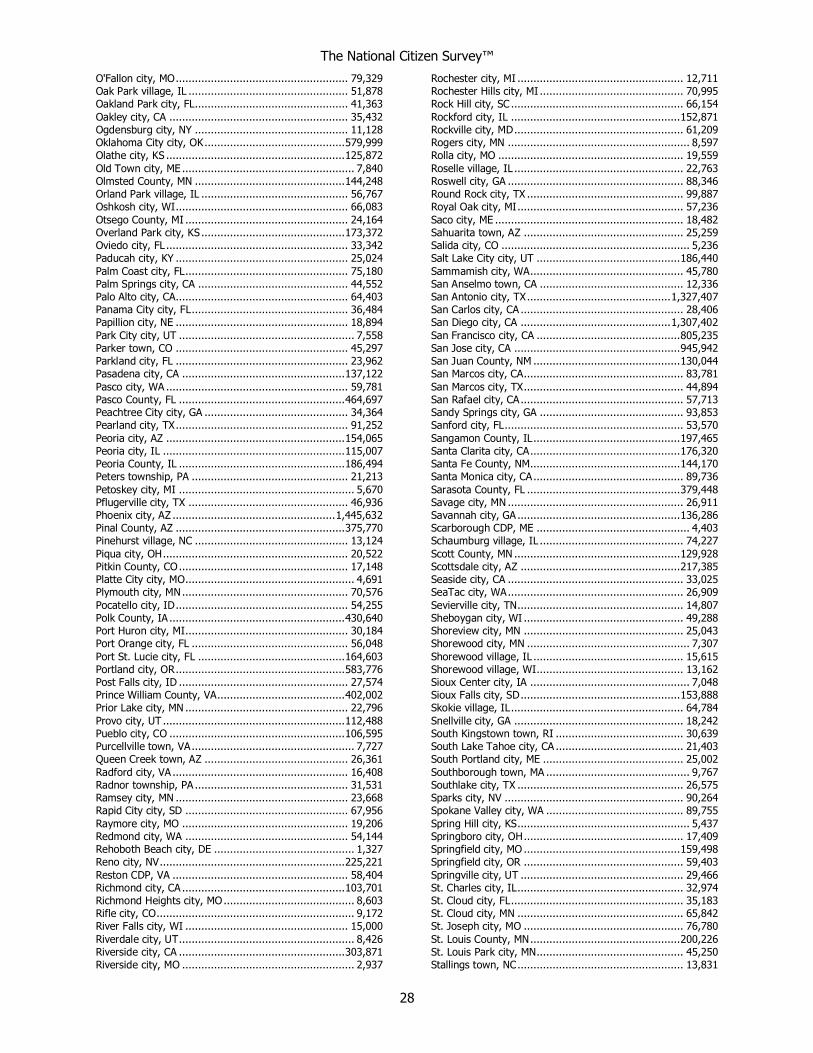
The National Citizen Survey™
28
O'Fallon city, MO ...................................................... 79,329 Oak Park village, IL .................................................. 51,878 Oakland Park city, FL................................................ 41,363
Oakley city, CA ........................................................ 35,432 Ogdensburg city, NY ................................................ 11,128 Oklahoma City city, OK ............................................ 579,999
Olathe city, KS ........................................................ 125,872
Old Town city, ME ...................................................... 7,840 Olmsted County, MN ............................................... 144,248 Orland Park village, IL .............................................. 56,767 Oshkosh city, WI ...................................................... 66,083
Otsego County, MI ................................................... 24,164 Overland Park city, KS ............................................. 173,372 Oviedo city, FL ......................................................... 33,342 Paducah city, KY ...................................................... 25,024
Palm Coast city, FL ................................................... 75,180 Palm Springs city, CA ............................................... 44,552 Palo Alto city, CA...................................................... 64,403 Panama City city, FL ................................................. 36,484 Papillion city, NE ...................................................... 18,894
Park City city, UT ....................................................... 7,558 Parker town, CO ...................................................... 45,297
Parkland city, FL ...................................................... 23,962 Pasadena city, CA ................................................... 137,122
Pasco city, WA ......................................................... 59,781 Pasco County, FL .................................................... 464,697 Peachtree City city, GA ............................................. 34,364 Pearland city, TX ...................................................... 91,252
Peoria city, AZ ........................................................ 154,065 Peoria city, IL ......................................................... 115,007 Peoria County, IL .................................................... 186,494 Peters township, PA ................................................. 21,213
Petoskey city, MI ....................................................... 5,670 Pflugerville city, TX .................................................. 46,936 Phoenix city, AZ ................................................... 1,445,632 Pinal County, AZ ..................................................... 375,770 Pinehurst village, NC ................................................ 13,124
Piqua city, OH .......................................................... 20,522 Pitkin County, CO ..................................................... 17,148 Platte City city, MO..................................................... 4,691 Plymouth city, MN .................................................... 70,576
Pocatello city, ID ...................................................... 54,255 Polk County, IA ....................................................... 430,640 Port Huron city, MI................................................... 30,184 Port Orange city, FL ................................................. 56,048
Port St. Lucie city, FL .............................................. 164,603 Portland city, OR ..................................................... 583,776 Post Falls city, ID ..................................................... 27,574 Prince William County, VA........................................ 402,002 Prior Lake city, MN ................................................... 22,796
Provo city, UT ......................................................... 112,488 Pueblo city, CO ....................................................... 106,595 Purcellville town, VA ................................................... 7,727 Queen Creek town, AZ ............................................. 26,361
Radford city, VA ....................................................... 16,408 Radnor township, PA ................................................ 31,531 Ramsey city, MN ...................................................... 23,668 Rapid City city, SD ................................................... 67,956
Raymore city, MO .................................................... 19,206 Redmond city, WA ................................................... 54,144 Rehoboth Beach city, DE ............................................ 1,327
Reno city, NV .......................................................... 225,221
Reston CDP, VA ....................................................... 58,404 Richmond city, CA ................................................... 103,701 Richmond Heights city, MO ......................................... 8,603 Rifle city, CO .............................................................. 9,172 River Falls city, WI ................................................... 15,000
Riverdale city, UT ....................................................... 8,426 Riverside city, CA .................................................... 303,871
Riverside city, MO ...................................................... 2,937
Rochester city, MI .................................................... 12,711 Rochester Hills city, MI ............................................. 70,995 Rock Hill city, SC ...................................................... 66,154
Rockford city, IL ..................................................... 152,871 Rockville city, MD ..................................................... 61,209 Rogers city, MN ......................................................... 8,597
Rolla city, MO .......................................................... 19,559
Roselle village, IL ..................................................... 22,763 Roswell city, GA ....................................................... 88,346 Round Rock city, TX ................................................. 99,887 Royal Oak city, MI .................................................... 57,236
Saco city, ME ........................................................... 18,482 Sahuarita town, AZ .................................................. 25,259 Salida city, CO ........................................................... 5,236 Salt Lake City city, UT ............................................. 186,440
Sammamish city, WA................................................ 45,780 San Anselmo town, CA ............................................. 12,336 San Antonio city, TX ............................................. 1,327,407 San Carlos city, CA ................................................... 28,406 San Diego city, CA ............................................... 1,307,402
San Francisco city, CA ............................................. 805,235 San Jose city, CA .................................................... 945,942
San Juan County, NM .............................................. 130,044 San Marcos city, CA.................................................. 83,781
San Marcos city, TX .................................................. 44,894 San Rafael city, CA ................................................... 57,713 Sandy Springs city, GA ............................................. 93,853 Sanford city, FL ........................................................ 53,570
Sangamon County, IL .............................................. 197,465 Santa Clarita city, CA ............................................... 176,320 Santa Fe County, NM............................................... 144,170 Santa Monica city, CA ............................................... 89,736
Sarasota County, FL ................................................ 379,448 Savage city, MN ....................................................... 26,911 Savannah city, GA ................................................... 136,286 Scarborough CDP, ME ................................................ 4,403 Schaumburg village, IL ............................................. 74,227
Scott County, MN .................................................... 129,928 Scottsdale city, AZ .................................................. 217,385 Seaside city, CA ....................................................... 33,025 SeaTac city, WA ....................................................... 26,909
Sevierville city, TN.................................................... 14,807 Sheboygan city, WI .................................................. 49,288 Shoreview city, MN .................................................. 25,043 Shorewood city, MN ................................................... 7,307
Shorewood village, IL ............................................... 15,615 Shorewood village, WI.............................................. 13,162 Sioux Center city, IA .................................................. 7,048 Sioux Falls city, SD .................................................. 153,888 Skokie village, IL ...................................................... 64,784
Snellville city, GA ..................................................... 18,242 South Kingstown town, RI ........................................ 30,639 South Lake Tahoe city, CA ........................................ 21,403 South Portland city, ME ............................................ 25,002
Southborough town, MA ............................................. 9,767 Southlake city, TX .................................................... 26,575 Sparks city, NV ........................................................ 90,264 Spokane Valley city, WA ........................................... 89,755
Spring Hill city, KS ...................................................... 5,437 Springboro city, OH .................................................. 17,409 Springfield city, MO ................................................. 159,498
Springfield city, OR .................................................. 59,403
Springville city, UT ................................................... 29,466 St. Charles city, IL .................................................... 32,974 St. Cloud city, FL ...................................................... 35,183 St. Cloud city, MN .................................................... 65,842 St. Joseph city, MO .................................................. 76,780
St. Louis County, MN ............................................... 200,226 St. Louis Park city, MN.............................................. 45,250
Stallings town, NC .................................................... 13,831
The National Citizen Survey™
29
State College borough, PA ........................................ 42,034 Sterling Heights city, MI .......................................... 129,699 Sugar Grove village, IL ............................................... 8,997
Sugar Land city, TX .................................................. 78,817 Summit city, NJ........................................................ 21,457 Summit County, UT .................................................. 36,324
Sunnyvale city, CA .................................................. 140,081
Surprise city, AZ...................................................... 117,517 Suwanee city, GA ..................................................... 15,355 Tacoma city, WA ..................................................... 198,397 Takoma Park city, MD .............................................. 16,715
Tamarac city, FL ...................................................... 60,427 Temecula city, CA ................................................... 100,097 Temple city, TX ........................................................ 66,102 The Woodlands CDP, TX ........................................... 93,847
Thornton city, CO.................................................... 118,772 Thousand Oaks city, CA ........................................... 126,683 Tracy city, CA .......................................................... 82,922 Tualatin city, OR ...................................................... 26,054 Tulsa city, OK ......................................................... 391,906
Twin Falls city, ID .................................................... 44,125 Tyler city, TX ........................................................... 96,900
Umatilla city, OR ........................................................ 6,906 Upper Arlington city, OH ........................................... 33,771
Urbandale city, IA .................................................... 39,463 Vail town, CO............................................................. 5,305 Vancouver city, WA ................................................. 161,791 Ventura CCD, CA ..................................................... 111,889
Vestavia Hills city, AL ............................................... 34,033 Virginia Beach city, VA............................................. 437,994 Wake Forest town, NC .............................................. 30,117 Walnut Creek city, CA ............................................... 64,173
Washington County, MN .......................................... 238,136 Washoe County, NV ................................................ 421,407 Watauga city, TX ..................................................... 23,497
Wauwatosa city, WI ................................................. 46,396 Waverly city, IA ......................................................... 9,874 Weddington town, NC ................................................ 9,459
Wentzville city, MO................................................... 29,070 West Carrollton city, OH ........................................... 13,143 West Chester borough, PA ........................................ 18,461
West Des Moines city, IA .......................................... 56,609
West Richland city, WA............................................. 11,811 Westerville city, OH .................................................. 36,120 Westlake town, TX ........................................................ 992 Westminster city, CO ............................................... 106,114
Weston town, MA ..................................................... 11,261 Wheat Ridge city, CO ............................................... 30,166 White House city, TN................................................ 10,255 Whitewater township, MI ............................................ 2,597
Wichita city, KS ....................................................... 382,368 Williamsburg city, VA................................................ 14,068 Wilmington city, NC................................................. 106,476 Wilsonville city, OR................................................... 19,509 Winchester city, VA .................................................. 26,203
Windsor town, CO .................................................... 18,644 Windsor town, CT .................................................... 29,044
Winnetka village, IL.................................................. 12,187 Winston-Salem city, NC ........................................... 229,617
Winter Garden city, FL .............................................. 34,568 Woodland city, CA .................................................... 55,468 Woodland city, WA ..................................................... 5,509 Wrentham town, MA ................................................ 10,955
Wyandotte city, MI ................................................... 25,883 Yakima city, WA ....................................................... 91,067 York County, VA....................................................... 65,464 Yorktown town, IN ..................................................... 9,405
Yuma city, AZ .......................................................... 93,064
The National Citizen Survey™
30
Appendix C: Detailed Survey Methods
The National Citizen Survey (The NCS™), conducted by National Research Center, Inc., was developed to provide communities an accurate, affordable and easy way to assess and interpret resident opinion about important local topics. Standardization of common questions and survey methods provide the rigor to assure valid results, and each community has enough flexibility to construct a customized version of The NCS.
Results offer insight into residents’ perspectives about the community as a whole, including local amenities, services, public trust, resident participation and other aspects of the community in order to support budgeting, land use and strategic planning and communication with residents. Resident demographic characteristics permit comparison to the Census as well as comparison of results for different subgroups of residents. The Town of Yorktown funded this research. Please contact Pete Olson of Yorktown at [email protected] if you have any questions about the survey.
Survey Validity
The question of survey validity has two parts: 1) how can a community be confident that the results from those who completed the questionnaire are representative of the results that would have been obtained had the survey been administered to the entire population? and 2) how closely do the perspectives recorded on the survey reflect what residents really believe or do?
To answer the first question, the best survey research practices were used for the resources spent to ensure that the results from the survey respondents reflect the opinions of residents in the entire community. These practices include:
Using a mail-out/mail-back methodology, which typically gets a higher response rate than phone for the same dollars spent. A higher response rate lessens the worry that those who did not respond are different than those who did respond.
Selecting households at random within the community to receive the survey to ensure that the households selected to receive the survey are representative of the larger community.
Over-sampling multi-family housing units to improve response from hard-to-reach, lower income or younger apartment dwellers.
Selecting the respondent within the household using an unbiased sampling procedure; in this case, the “birthday method.” The cover letter included an instruction requesting that the respondent in the household be the adult (18 years old or older) who most recently had a birthday, irrespective of year of birth.
Contacting potential respondents three times to encourage response from people who may have different opinions or habits than those who would respond with only a single prompt.
Inviting response in a compelling manner (using appropriate letterhead/logos and a signature of a visible leader) to appeal to recipients’ sense of civic responsibility.
Providing a pre-addressed, postage-paid return envelope. Offering the survey in Spanish or other language when requested by a given community. Weighting the results to reflect the demographics of the population.
The answer to the second question about how closely the perspectives recorded on the survey reflect what residents really believe or do is more complex. Resident responses to surveys are influenced by a variety of factors. For questions about service quality, residents’ expectations for service quality play a role as well as the “objective” quality of the service provided, the way the resident perceives the entire community (that is, the context in which the service is provided), the scale on which the resident is asked to record his or her opinion and, of course, the opinion, itself, that a resident holds about the service. Similarly a resident’s report of certain behaviors is colored by what he or she believes is the socially desirable response (e.g., reporting tolerant behaviors toward “oppressed groups,” likelihood of voting for a tax increase for services to poor people, use of alternative modes of travel to work besides the single occupancy vehicle), his or her memory of the actual behavior (if it is not a question speculating about future actions, like a vote), his or her confidence that he or she can be honest without suffering any negative consequences (thus the need for anonymity) as well as the actual behavior itself.
How closely survey results come to recording the way a person really feels or behaves often is measured by the coincidence of reported behavior with observed current behavior (e.g., driving habits), reported intentions to behave with observed future behavior (e.g., voting choices) or reported opinions about current community quality
The National Citizen Survey™
31
with objective characteristics of the community (e.g., feelings of safety correlated with rates of crime). There is a body of scientific literature that has investigated the relationship between reported behaviors and actual behaviors. Well-conducted surveys, by and large, do capture true respondent behaviors or intentions to act with great accuracy. Predictions of voting outcomes tend to be quite accurate using survey research, as do reported behaviors that are not about highly sensitive issues (e.g., family abuse or other illegal or morally sanctioned activities). For self-reports about highly sensitive issues, statistical adjustments can be made to correct for the respondents’ tendency to report what they think the “correct” response should be.
Research on the correlation of resident opinion about service quality and “objective” ratings of service quality vary, with some showing stronger relationships than others. NRC’s own research has demonstrated that residents who report the lowest ratings of street repair live in communities with objectively worse street conditions than those who report high ratings of street repair (based on road quality, delay in street repair, number of road repair employees). Similarly, the lowest rated fire services appear to be “objectively” worse than the highest rated fire services (expenditures per capita, response time, “professional” status of firefighters, breadth of services and training provided). Resident opinion commonly reflects objective performance data but is an important measure on its own. NRC principals have written, “If you collect trash three times a day but residents think that your trash haul is lousy, you still have a problem.”
Survey Sampling
“Sampling” refers to the method by which households were chosen to receive the survey. All households within the Town of Yorktown were eligible to participate in the survey. A list of all households within the zip codes serving Yorktown was purchased based on updated listings from the United States Postal Service. Since some of the zip codes that serve the Town of Yorktown households may also serve addresses that lie outside of the community, the exact geographic location of each housing unit was compared to community boundaries using the most current municipal boundary file (updated on a quarterly basis) and addresses located outside of the Town of Yorktown boundaries were removed from consideration. Each address identified as being within Town boundaries was further identified as being within the more rural or urban area of the town.
To choose the 1,200 survey recipients, a systematic sampling method was applied to the list of households previously screened for geographic location. Systematic sampling is a procedure whereby a complete list of all possible households is culled, selecting every Nth one, giving each eligible household a known probability of selection, until the appropriate number of households is selected. Multi-family housing units were over sampled as residents of this type of housing typically respond at lower rates to surveys than do those in single-family housing units. Figure 1 displays a map of the households selected to receive the survey. In general, because of the random sampling techniques used, the displayed sampling density will closely mirror the overall housing unit density (which may be different from the population density). While the theory of probability assumes no bias in selection, there may be some minor variations in practice (meaning, an area with only 15% of the housing units might be sampled at an actual rate that is slightly above or below that).
An individual within each household was selected using the birthday method. The birthday method selects a person within the household by asking the “person whose birthday has most recently passed” to complete the questionnaire. The underlying assumption in this method is that day of birth has no relationship to the way people respond to surveys. This instruction was contained in the cover letter accompanying the questionnaire.
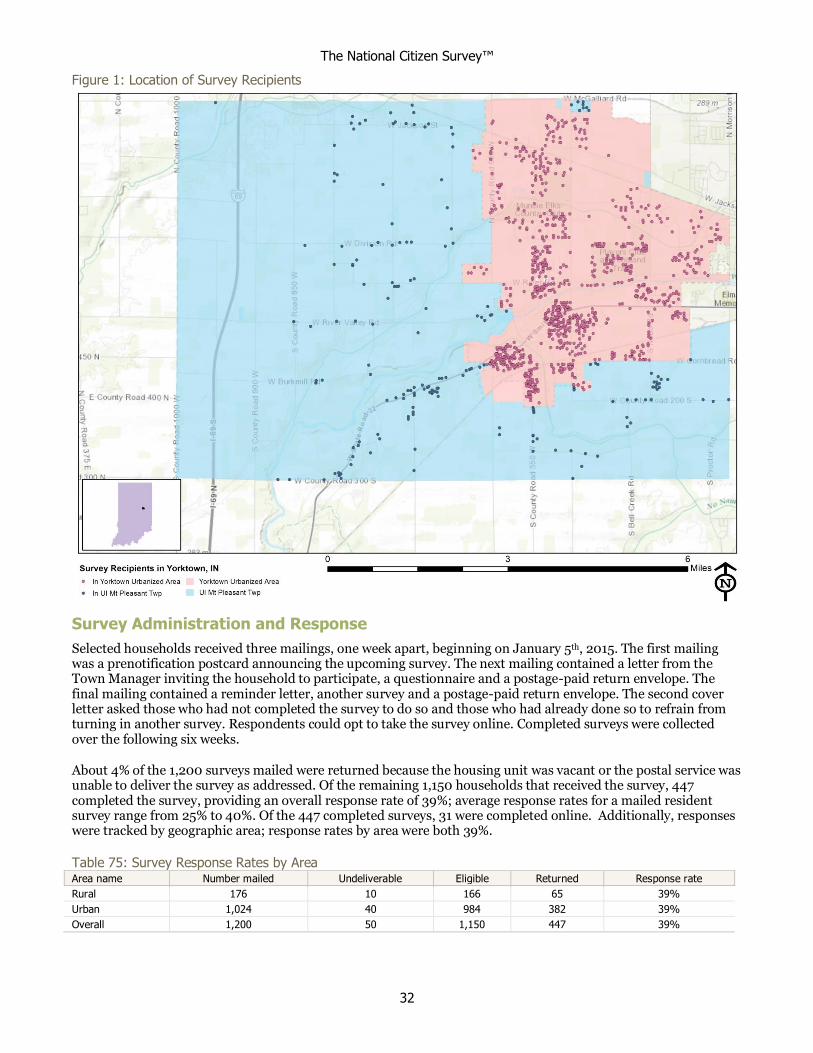
The National Citizen Survey™
32
Figure 1: Location of Survey Recipients
Survey Administration and Response
Selected households received three mailings, one week apart, beginning on January 5th, 2015. The first mailing was a prenotification postcard announcing the upcoming survey. The next mailing contained a letter from the Town Manager inviting the household to participate, a questionnaire and a postage-paid return envelope. The final mailing contained a reminder letter, another survey and a postage-paid return envelope. The second cover letter asked those who had not completed the survey to do so and those who had already done so to refrain from turning in another survey. Respondents could opt to take the survey online. Completed surveys were collected over the following six weeks.
About 4% of the 1,200 surveys mailed were returned because the housing unit was vacant or the postal service was unable to deliver the survey as addressed. Of the remaining 1,150 households that received the survey, 447 completed the survey, providing an overall response rate of 39%; average response rates for a mailed resident survey range from 25% to 40%. Of the 447 completed surveys, 31 were completed online. Additionally, responses were tracked by geographic area; response rates by area were both 39%.
Table 75: Survey Response Rates by Area Area name Number mailed Undeliverable Eligible Returned Response rate
Rural 176 10 166 65 39%
Urban 1,024 40 984 382 39%
Overall 1,200 50 1,150 447 39%
The National Citizen Survey™
33
Confidence Intervals
It is customary to describe the precision of estimates made from surveys by a “level of confidence” and accompanying “confidence interval” (or margin of error). A traditional level of confidence, and the one used here, is 95%. The 95% confidence interval can be any size and quantifies the sampling error or imprecision of the survey results because some residents’ opinions are relied on to estimate all residents’ opinions.1
The margin of error for the Town of Yorktown survey is no greater than plus or minus five percentage points around any given percent reported for the entire sample (447 completed surveys).
For subgroups of responses, the margin of error increases because the sample size for the subgroup is smaller. For subgroups of approximately 100 respondents, the margin of error is plus or minus 10 percentage points.
Survey Processing (Data Entry)
Upon receipt, completed surveys were assigned a unique identification number. Additionally, each survey was reviewed and “cleaned” as necessary. For example, a question may have asked a respondent to pick two items out of a list of five, but the respondent checked three; in this case, NRC would use protocols to randomly choose two of the three selected items for inclusion in the dataset.
All surveys then were entered twice into an electronic dataset; any discrepancies were resolved in comparison to the original survey form. Range checks as well as other forms of quality control were also performed.
Survey Data Weighting
The demographic characteristics of the survey sample were compared to those found in the 2010 Census and American Community Survey estimates for adults in the Town of Yorktown. The primary objective of weighting survey data is to make the survey sample reflective of the larger population of the community. The characteristics used for weighting were housing unit type, housing tenure, gender and age. The results of the weighting scheme are presented in the following table.
1 A 95% confidence interval indicates that for every 100 random samples of this many residents, 95 of the confidence intervals created will
include the “true” population response. This theory is applied in practice to mean that the “true” perspective of the target population lies within the confidence interval created for a single survey. For example, if 75% of residents rate a service as “excellent” or “good,” then the 4% margin of error (for the 95% confidence interval) indicates that the range of likely responses for the entire community is between 71% and 79%. This source of uncertainty is called sampling error. In addition to sampling error, other sources of error may affect any survey,
including the non-response of residents with opinions different from survey responders. Though standardized on The NCS, on other surveys, differences in question wording, order, translation and data entry, as examples, can lead to somewhat varying results.

The National Citizen Survey™
34
Table 76: Yorktown, IN 2015 Weighting Table Characteristic Population Norm Unweighted Data Weighted Data
Housing
Rent home 19% 8% 18%
Own home 81% 92% 82%
Detached unit 90% 90% 89%
Attached unit 10% 10% 11%
Race and Ethnicity
White 97% 96% 95%
Not white 3% 4% 5%
Not Hispanic 99% 100% 99%
Hispanic 1% 0% 1%
Sex and Age
Female 53% 54% 53%
Male 47% 46% 47%
18-34 years of age 23% 7% 22%
35-54 years of age 38% 32% 38%
55+ years of age 39% 61% 40%
Females 18-34 12% 5% 14%
Females 35-54 20% 18% 20%
Females 55+ 22% 31% 19%
Males 18-34 11% 2% 8%
Males 35-54 18% 15% 18%
Males 55+ 18% 29% 20%
Survey Data Analysis and Reporting
The survey dataset was analyzed using the Statistical Package for the Social Sciences (SPSS). For the most part, the percentages presented in the reports represent the “percent positive.” The percent positive is the combination of the top two most positive response options (i.e., “excellent” and “good,” “very safe” and “somewhat safe,” “essential” and “very important,” etc.), or, in the case of resident behaviors/participation, the percent positive represents the proportion of respondents indicating “yes” or participating in an activity at least once a month.
On many of the questions in the survey respondents may answer “don’t know.” The proportion of respondents giving this reply is shown in the full set of responses included in Appendix A. However, these responses have been removed from the analyses presented in the reports. In other words, the tables and graphs display the responses from respondents who had an opinion about a specific item.

The National Citizen Survey™
35
Appendix D: Survey Materials
Dear Yorktown Resident,
It won’t take much of your time to make a big difference!
Your household has been randomly selected to participate in a survey
about your community. Your survey will arrive in a few days.
Thank you for helping create a better town!
Sincerely,
Pete Olson Town Manager
Dear Yorktown Resident,
It won’t take much of your time to make a big difference!
Your household has been randomly selected to participate in a survey
about your community. Your survey will arrive in a few days.
Thank you for helping create a better town!
Sincerely,
Pete Olson Town Manager
Dear Yorktown Resident,
It won’t take much of your time to make a big difference!
Your household has been randomly selected to participate in a survey
about your community. Your survey will arrive in a few days.
Thank you for helping create a better town!
Sincerely,
Pete Olson Town Manager
Dear Yorktown Resident,
It won’t take much of your time to make a big difference!
Your household has been randomly selected to participate in a survey
about your community. Your survey will arrive in a few days.
Thank you for helping create a better town!
Sincerely,
Pete Olson Town Manager
Presorted
First Class Mail
US Postage
PAID
Boulder, CO
Permit NO. 94
Town of Yorktown 9800 W Smith St PO Box 518 Yorktown, IN 47396
Presorted
First Class Mail
US Postage
PAID
Boulder, CO
Permit NO. 94
Town of Yorktown 9800 W Smith St PO Box 518 Yorktown, IN 47396
Presorted
First Class Mail
US Postage
PAID
Boulder, CO
Permit NO. 94
Town of Yorktown 9800 W Smith St PO Box 518 Yorktown, IN 47396
Presorted
First Class Mail
US Postage
PAID
Boulder, CO
Permit NO. 94
Town of Yorktown 9800 W Smith St PO Box 518 Yorktown, IN 47396
January 2015 Dear Town of Yorktown Resident: Please help us shape the future of Yorktown! You have been selected at random to participate in the 2015 Yorktown Citizen Survey. Please take a few minutes to fill out the enclosed survey. Your participation in this survey is very important – especially since your household is one of only a small number of households being surveyed. Your feedback will help Yorktown make decisions that affect our town. A few things to remember:
Your responses are completely anonymous.
In order to hear from a diverse group of residents, the adult 18 years or older in your household who most recently had a birthday should complete this survey.
You may return the survey by mail in the enclosed postage-paid envelope, or you can complete the survey online at: www.n-r-c.com/survey/yorktown2015.htm
If you have any questions about the survey please call 765-759-4003. Thank you for your time and participation! Sincerely,
Pete Olson Town Manager
Town of Yorktown 9800 W Smith St • PO Box 518
Yorktown, IN 47396
765-759-4003p • 765-759-4016f
www.yorktownindiana.org
January 2015 Dear Town of Yorktown Resident: Here’s a second chance if you haven’t already responded to the 2015 Yorktown Citizen Survey! (If you completed it and sent it back, we thank you for your time and ask you to recycle this survey. Please do not respond twice.) Please help us shape the future of Yorktown! You have been selected at random to participate in the 2015 Yorktown Citizen Survey. Please take a few minutes to fill out the enclosed survey. Your participation in this survey is very important – especially since your household is one of only a small number of households being surveyed. Your feedback will help Yorktown make decisions that affect our town. A few things to remember:
Your responses are completely anonymous.
In order to hear from a diverse group of residents, the adult 18 years or older in your household who most recently had a birthday should complete this survey.
You may return the survey by mail in the enclosed postage-paid envelope, or you can complete the survey online at: www.n-r-c.com/survey/yorktown2015.htm
If you have any questions about the survey please call 765-759-4003. Thank you for your time and participation! Sincerely,
Pete Olson Town Manager
Town of Yorktown 9800 W Smith St • PO Box 518
Yorktown, IN 47396
765-759-4003p • 765-759-4016f
www.yorktownindiana.org
The Town of Yorktown 2015 Citizen Survey
Page 1 of 5
Please complete this questionnaire if you are the adult (age 18 or older) in the household who most recently had a birthday. The adult’s year of birth does not matter. Please select the response (by circling the number or checking the box) that most closely represents your opinion for each question. Your responses are anonymous and will be reported in group form only.
1. Please rate each of the following aspects of quality of life in Yorktown: Excellent Good Fair Poor Don’t know
Yorktown as a place to live ............................................................................ 1 2 3 4 5 Your neighborhood as a place to live ............................................................. 1 2 3 4 5 Yorktown as a place to raise children ............................................................. 1 2 3 4 5 Yorktown as a place to work .......................................................................... 1 2 3 4 5 Yorktown as a place to visit ........................................................................... 1 2 3 4 5 Yorktown as a place to retire ......................................................................... 1 2 3 4 5 The overall quality of life in Yorktown ........................................................... 1 2 3 4 5
2. Please rate each of the following characteristics as they relate to Yorktown as a whole: Excellent Good Fair Poor Don’t know
Overall feeling of safety in Yorktown ............................................................. 1 2 3 4 5 Overall ease of getting to the places you usually have to visit .......................... 1 2 3 4 5 Quality of overall natural environment in Yorktown ...................................... 1 2 3 4 5 Overall “built environment” of Yorktown (including overall design,
buildings, parks and transportation systems) ............................................... 1 2 3 4 5 Health and wellness opportunities in Yorktown .............................................. 1 2 3 4 5 Overall opportunities for education and enrichment ...................................... 1 2 3 4 5 Overall economic health of Yorktown ............................................................ 1 2 3 4 5 Sense of community ...................................................................................... 1 2 3 4 5 Overall image or reputation of Yorktown....................................................... 1 2 3 4 5
3. Please indicate how likely or unlikely you are to do each of the following: Very Somewhat Somewhat Very Don’t likely likely unlikely unlikely know
Recommend living in Yorktown to someone who asks ......................... 1 2 3 4 5 Remain in Yorktown for the next five years ......................................... 1 2 3 4 5
4. Please rate how safe or unsafe you feel: Very Somewhat Neither safe Somewhat Very Don’t
safe safe nor unsafe unsafe unsafe know
In your neighborhood during the day ................................. 1 2 3 4 5 6 In Yorktown’s downtown/commercial area during the day.......................................................... 1 2 3 4 5 6 In your neighborhood at night ............................................ 1 2 3 4 5 6 In Yorktown’s downtown/commercial area at night ........... 1 2 3 4 5 6
5. Please rate each of the following characteristics as they relate to Yorktown as a whole: Excellent Good Fair Poor Don’t know
Traffic flow on major streets .......................................................................... 1 2 3 4 5 Ease of public parking ................................................................................... 1 2 3 4 5 Ease of travel by car in Yorktown .................................................................. 1 2 3 4 5 Ease of travel by bicycle in Yorktown............................................................. 1 2 3 4 5 Ease of walking in Yorktown ......................................................................... 1 2 3 4 5 Availability of paths and walking trails ........................................................... 1 2 3 4 5 Air quality ..................................................................................................... 1 2 3 4 5 Cleanliness of Yorktown ................................................................................ 1 2 3 4 5 Overall appearance of Yorktown ................................................................... 1 2 3 4 5 Public places where people want to spend time .............................................. 1 2 3 4 5 Variety of housing options ............................................................................. 1 2 3 4 5 Availability of affordable quality housing ....................................................... 1 2 3 4 5 Fitness opportunities (including exercise classes and paths or trails, etc.).......... 1 2 3 4 5 Recreational opportunities............................................................................. 1 2 3 4 5 Availability of affordable quality food ............................................................ 1 2 3 4 5 Availability of affordable quality health care .................................................. 1 2 3 4 5 Availability of preventive health services ........................................................ 1 2 3 4 5 Availability of affordable quality mental health care ....................................... 1 2 3 4 5

Th
e N
ati
on
al C
itiz
en S
urv
ey™
•
© 2
00
1-2
01
5 N
ati
on
al R
esea
rch
Cen
ter,
In
c.
Page 2 of 5
The National Citizen Survey™
6. Please rate each of the following characteristics as they relate to Yorktown as a whole: Excellent Good Fair Poor Don’t know
Availability of affordable quality child care/preschool .................................... 1 2 3 4 5 K-12 education ............................................................................................. 1 2 3 4 5 Adult educational opportunities ..................................................................... 1 2 3 4 5 Opportunities to attend cultural/arts/music activities .................................... 1 2 3 4 5 Opportunities to participate in religious or spiritual events and activities ........ 1 2 3 4 5 Employment opportunities ............................................................................ 1 2 3 4 5 Shopping opportunities ................................................................................. 1 2 3 4 5
Cost of living in Yorktown ............................................................................. 1 2 3 4 5 Overall quality of business and service establishments in Yorktown ................ 1 2 3 4 5 Vibrant downtown/commercial area ............................................................. 1 2 3 4 5 Overall quality of new development in Yorktown ........................................... 1 2 3 4 5 Opportunities to participate in social events and activities .............................. 1 2 3 4 5 Opportunities to volunteer............................................................................. 1 2 3 4 5 Opportunities to participate in community matters ........................................ 1 2 3 4 5 Openness and acceptance of the community toward people of
diverse backgrounds ................................................................................... 1 2 3 4 5 Neighborliness of residents in Yorktown ........................................................ 1 2 3 4 5
7. Please indicate whether or not you have done each of the following in the last 12 months. No Yes
Made efforts to conserve water ..........................................................................................................................1 2 Made efforts to make your home more energy efficient ......................................................................................1 2 Reported a code violation or other hazard in Yorktown (weeds, abandoned buildings, etc.) ................................1 2 Household member was a victim of a crime in Yorktown ...................................................................................1 2 Reported a crime to the police in Yorktown .......................................................................................................1 2 Stocked supplies in preparation for an emergency ..............................................................................................1 2 Campaigned or advocated for an issue, cause or candidate.................................................................................1 2 Contacted the Town of Yorktown (in-person, phone, email or web) for help or information ...............................1 2 Contacted Yorktown elected officials (in-person, phone, email or web) to express your opinion ...........................1 2
8. In the last 12 months, about how many times, if at all, have you or other household members done each of the following in Yorktown? 2 times a 2-4 times Once a month Not week or more a month or less at all
Used Yorktown recreation centers or their services ........................................................ 1 2 3 4 Visited a neighborhood park or Town park ................................................................... 1 2 3 4 Used Yorktown public libraries or their services ............................................................. 1 2 3 4 Participated in religious or spiritual activities in Yorktown .............................................. 1 2 3 4 Attended a Town-sponsored event ................................................................................. 1 2 3 4 Walked or biked instead of driving ................................................................................. 1 2 3 4 Volunteered your time to some group/activity in Yorktown ........................................... 1 2 3 4 Participated in a club in Yorktown ................................................................................. 1 2 3 4 Talked to or visited with your immediate neighbors ....................................................... 1 2 3 4 Done a favor for a neighbor ........................................................................................... 1 2 3 4
9. Thinking about local public meetings (of local elected officials like Town Council or County Commissioners, advisory boards, school board, Home Owners Association, neighborhood watch, etc.), in the last 12 months, about how many times, if at all, have you or other household members attended or spoke at a local public meeting? 2 times a 2-4 times Once a month Not
week or more a month or less at all
Attended a local public meeting .................................................................................... 1 2 3 4 Spoke at a local public meeting ..................................................................................... 1 2 3 4
The Town of Yorktown 2015 Citizen Survey
Page 3 of 5
10. Please rate the quality of each of the following services in Yorktown: Excellent Good Fair Poor Don’t know
Police services ............................................................................................... 1 2 3 4 5 Sheriff services............................................................................................... 1 2 3 4 5 Fire services................................................................................................... 1 2 3 4 5 Ambulance or emergency medical services..................................................... 1 2 3 4 5 Crime prevention .......................................................................................... 1 2 3 4 5 Fire prevention and education ....................................................................... 1 2 3 4 5 Traffic enforcement ....................................................................................... 1 2 3 4 5
Street repair .................................................................................................. 1 2 3 4 5 Street cleaning .............................................................................................. 1 2 3 4 5 Street lighting ................................................................................................ 1 2 3 4 5 Snow removal ............................................................................................... 1 2 3 4 5 Sidewalk maintenance ................................................................................... 1 2 3 4 5 Traffic signal timing ...................................................................................... 1 2 3 4 5 Garbage collection ........................................................................................ 1 2 3 4 5 Recycling ...................................................................................................... 1 2 3 4 5 Yard waste pick-up ........................................................................................ 1 2 3 4 5 Storm drainage ............................................................................................. 1 2 3 4 5 Drinking water .............................................................................................. 1 2 3 4 5 Sewer services ............................................................................................... 1 2 3 4 5 Utility billing ................................................................................................. 1 2 3 4 5 Town parks ................................................................................................... 1 2 3 4 5 Recreation programs or classes ...................................................................... 1 2 3 4 5 Recreation centers or facilities ....................................................................... 1 2 3 4 5 Land use, planning and zoning ...................................................................... 1 2 3 4 5 Code enforcement (weeds, abandoned buildings, etc.) .................................... 1 2 3 4 5 Animal control .............................................................................................. 1 2 3 4 5 Economic development ................................................................................. 1 2 3 4 5 Health services .............................................................................................. 1 2 3 4 5 Public library services .................................................................................... 1 2 3 4 5 Yorktown open space .................................................................................... 1 2 3 4 5 Town-sponsored special events ...................................................................... 1 2 3 4 5 Overall customer service by Yorktown employees (police,
receptionists, utility clerks, etc.) ..................................................................... 1 2 3 4 5
11. Overall, how would you rate the quality of the services provided by each of the following? Excellent Good Fair Poor Don’t know
The Town of Yorktown ................................................................................. 1 2 3 4 5 The Federal Government .............................................................................. 1 2 3 4 5 The State of Indiana ..................................................................................... 1 2 3 4 5
12. Please rate the following categories of Yorktown government performance: Excellent Good Fair Poor Don’t know
The value of services for the taxes paid to Yorktown ...................................... 1 2 3 4 5 The overall direction that Yorktown is taking ................................................. 1 2 3 4 5 The job Yorktown government does at welcoming citizen involvement .......... 1 2 3 4 5 Overall confidence in Yorktown government ................................................. 1 2 3 4 5 Generally acting in the best interest of the community ................................... 1 2 3 4 5 Being honest ................................................................................................. 1 2 3 4 5 Treating all residents fairly ............................................................................ 1 2 3 4 5
Th
e N
ati
on
al C
itiz
en S
urv
ey™
•
© 2
00
1-2
01
5 N
ati
on
al R
esea
rch
Cen
ter,
In
c.
Page 4 of 5
The National Citizen Survey™
13. Please rate how important, if at all, you think it is for the Yorktown community to focus on each of the following in the coming two years: Very Somewhat Not at all Essential important important important
Overall feeling of safety in Yorktown ............................................................................. 1 2 3 4 Overall ease of getting to the places you usually have to visit .......................................... 1 2 3 4 Quality of overall natural environment in Yorktown ...................................................... 1 2 3 4 Overall “built environment” of Yorktown (including overall design,
buildings, parks and transportation systems) .............................................................. 1 2 3 4 Health and wellness opportunities in Yorktown .............................................................. 1 2 3 4 Overall opportunities for education and enrichment ...................................................... 1 2 3 4 Overall economic health of Yorktown ............................................................................ 1 2 3 4 Sense of community ...................................................................................................... 1 2 3 4
14. Please rate the importance of each of the following for the future of the Town: Very Somewhat Not at all Essential important important important
Attracting new business and industry ............................................................................. 1 2 3 4 Supporting and retaining existing businesses .................................................................. 1 2 3 4 Job creation................................................................................................................... 1 2 3 4 Increasing home ownership ........................................................................................... 1 2 3 4 Improving the appearance of the Town ............................................................................... 1 2 3 4 Downtown residential development ............................................................................... 1 2 3 4 Downtown business development .................................................................................. 1 2 3 4 Improving bicycle and pedestrian access ........................................................................ 1 2 3 4 Improving public safety ................................................................................................. 1 2 3 4
15. To what extent would you support or oppose prioritizing funding for each of the following identified town
services/projects? Strongly Somewhat Somewhat Strongly Don’t support support oppose oppose know
Street Paving and Construction ..................................................................... 1 2 3 4 5 Parks, Recreation & Trails ............................................................................. 1 2 3 4 5
Downtown Redevelopment ........................................................................... 1 2 3 4 5 Town Facilities .............................................................................................. 1 2 3 4 5 Emergency Response Vehicles (Fire trucks, etc.)............................................. 1 2 3 4 5 Storm Water/Drainage Improvements .......................................................... 1 2 3 4 5 Cleaning initiatives (i.e. litter cleanup, mowing, etc.) ...................................... 1 2 3 4 5 Community Marketing (efforts to impact perception of town image including business-friendly, family-friendly, town entries landscaping, signage, etc.) .... 1 2 3 4 5
16. Please indicate to what extent would you support or oppose a tax increase to fund each of the following identified town services/projects? Strongly Somewhat Somewhat Strongly Don’t
support support oppose oppose know
Street Paving and Construction ..................................................................... 1 2 3 4 5 Parks, Recreation & Trails ............................................................................. 1 2 3 4 5 Downtown Redevelopment ........................................................................... 1 2 3 4 5 Town Facilities .............................................................................................. 1 2 3 4 5 Emergency Response Vehicles (Fire trucks, etc.)............................................. 1 2 3 4 5 Storm Water/Drainage Improvements .......................................................... 1 2 3 4 5 Cleaning initiatives (i.e. litter cleanup, mowing, etc.) ...................................... 1 2 3 4 5 Community Marketing (efforts to impact perception of town image including business-friendly, family-friendly, town entries landscaping, signage, etc.) .... 1 2 3 4 5
17. Please indicate how much of a source, if at all, you consider each of the following to be for obtaining
information about the Town government and its activities, events and services: Major Minor Not a source source source
Town website (yorktownindiana.org) ................................................................................................1 2 3 Yorktown e-mail blast / list serve ......................................................................................................1 2 3 Television news ................................................................................................................................1 2 3 Newspapers ......................................................................................................................................1 2 3 Radio ...............................................................................................................................................1 2 3 Facebook .........................................................................................................................................1 2 3 Twitter .............................................................................................................................................1 2 3

The Town of Yorktown 2015 Citizen Survey
Page 5 of 5
Our last questions are about you and your household. Again, all of your responses to this survey are completely anonymous and will be reported in group form only.
D1. How often, if at all, do you do each of the following, considering all of the times you could? Never Rarely Sometimes Usually Always
Recycle at home ........................................................................................ 1 2 3 4 5 Purchase goods or services from a business located in Yorktown ................. 1 2 3 4 5 Eat at least 5 portions of fruits and vegetables a day .................................... 1 2 3 4 5 Participate in moderate or vigorous physical activity ................................... 1 2 3 4 5 Read or watch local news (via television, paper, computer, etc.) .................. 1 2 3 4 5 Vote in local elections ................................................................................ 1 2 3 4 5
D2. Would you say that in general your health is:
Excellent Very good Good Fair Poor
D3. What impact, if any, do you think the economy will have on your family income in the next 6 months? Do you
think the impact will be: Very positive Somewhat positive Neutral Somewhat negative Very negative
D4. What is your employment status?
Working full time for pay Working part time for pay Unemployed, looking for paid work Unemployed, not looking for paid work Fully retired
D5. Do you work inside the boundaries of Yorktown?
Yes, outside the home Yes, from home No
D6. How many years have you lived in Yorktown?
Less than 2 years 11-20 years 2-5 years More than 20 years 6-10 years
D7. Which best describes the building you live in?
One family house detached from any other houses Building with two or more homes (duplex, townhome,
apartment or condominium) Mobile home Other
D8. Is this house, apartment or mobile home...
Rented Owned
D9. About how much is your monthly housing cost
for the place you live (including rent, mortgage payment, property tax, property insurance and homeowners’ association (HOA) fees)? Less than $300 per month $300 to $599 per month $600 to $999 per month $1,000 to $1,499 per month $1,500 to $2,499 per month $2,500 or more per month
D10. Do any children 17 or under live in your
household? No Yes
D11. Are you or any other members of your household
aged 65 or older? No Yes
D12. How much do you anticipate your household’s
total income before taxes will be for the current year? (Please include in your total income money from all sources for all persons living in your household.) Less than $25,000 $25,000 to $49,999 $50,000 to $99,999 $100,000 to $149,999 $150,000 or more
Please respond to both questions D13 and D14:
D13. Are you Spanish, Hispanic or Latino? No, not Spanish, Hispanic or Latino Yes, I consider myself to be Spanish, Hispanic
or Latino
D14. What is your race? (Mark one or more races to indicate what race you consider yourself to be.) American Indian or Alaskan Native Asian, Asian Indian or Pacific Islander Black or African American White
Other
D15. In which category is your age?
18-24 years 55-64 years 25-34 years 65-74 years 35-44 years 75 years or older 45-54 years
D16. What is your sex?
Female Male
D17. Do you consider a cell phone or land line your
primary telephone number? Cell Land line Both
Thank you for completing this survey. Please return the completed survey in the postage-paid envelope to: National Research Center, Inc., PO Box 549, Belle Mead, NJ 08502
Presorted
First Class Mail US Postage
PAID Boulder, CO
Permit NO.94
Town of Yorktown 9800 W Smith St PO Box 518 Yorktown, IN 47396