Yondo Belle Serge Hermann EFFECTS OF MERGERS ...jultika.oulu.fi/files/nbnfioulu-201606072440.pdf ·...
57
OULU BUSINESS SCHOOL Yondo Belle Serge Hermann EFFECTS OF MERGERS & ACQUISITIONS ON FINANCIAL PERFORMANCE OF USA ACQUIROR BANKS Master’s Thesis Department of Finance September 2015
Transcript of Yondo Belle Serge Hermann EFFECTS OF MERGERS ...jultika.oulu.fi/files/nbnfioulu-201606072440.pdf ·...
OULU BUSINESS SCHOOL
Yondo Belle Serge Hermann
EFFECTS OF MERGERS & ACQUISITIONS ON FINANCIAL PERFORMANCE OF USA
ACQUIROR BANKS
Master’s Thesis
Department of Finance
September 2015
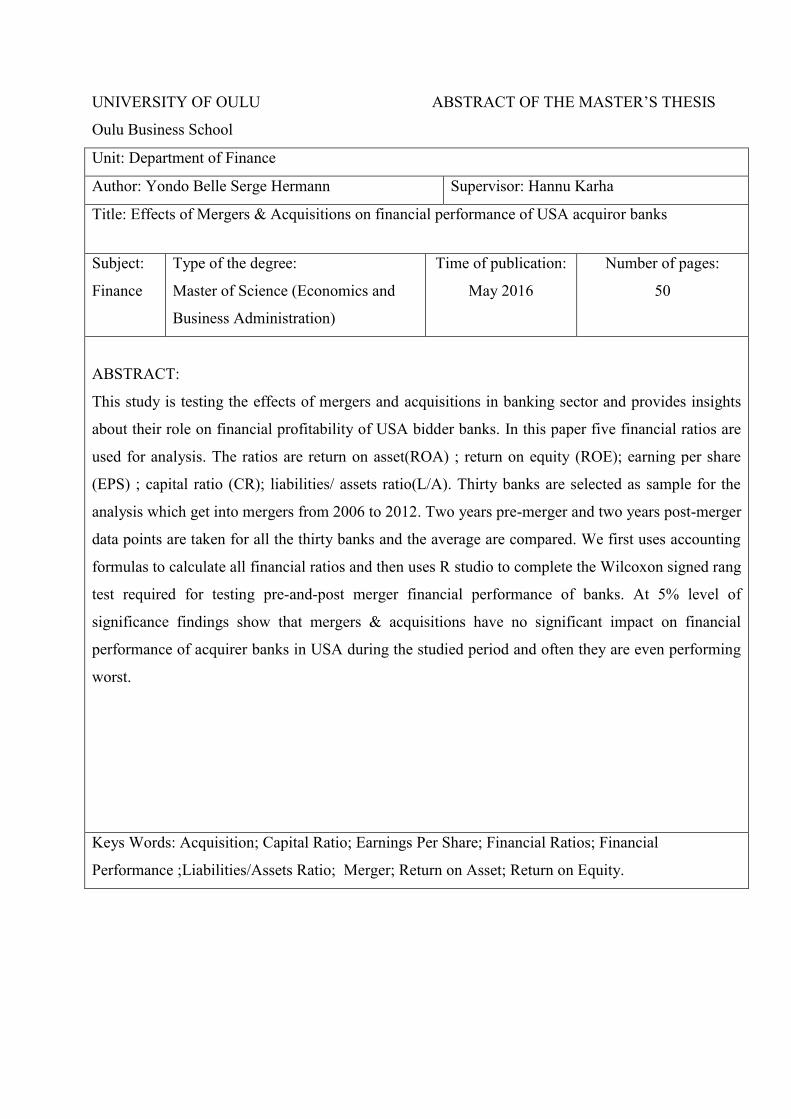
UNIVERSITY OF OULU ABSTRACT OF THE MASTER’S THESIS
Oulu Business School
Unit: Department of Finance
Author: Yondo Belle Serge Hermann Supervisor: Hannu Karha
Title: Effects of Mergers & Acquisitions on financial performance of USA acquiror banks
Subject:
Finance
Type of the degree:
Master of Science (Economics and
Business Administration)
Time of publication:
May 2016
Number of pages:
50
ABSTRACT:
This study is testing the effects of mergers and acquisitions in banking sector and provides insights
about their role on financial profitability of USA bidder banks. In this paper five financial ratios are
used for analysis. The ratios are return on asset(ROA) ; return on equity (ROE); earning per share
(EPS) ; capital ratio (CR); liabilities/ assets ratio(L/A). Thirty banks are selected as sample for the
analysis which get into mergers from 2006 to 2012. Two years pre-merger and two years post-merger
data points are taken for all the thirty banks and the average are compared. We first uses accounting
formulas to calculate all financial ratios and then uses R studio to complete the Wilcoxon signed rang
test required for testing pre-and-post merger financial performance of banks. At 5% level of
significance findings show that mergers & acquisitions have no significant impact on financial
performance of acquirer banks in USA during the studied period and often they are even performing
worst.
Keys Words: Acquisition; Capital Ratio; Earnings Per Share; Financial Ratios; Financial
Performance ;Liabilities/Assets Ratio; Merger; Return on Asset; Return on Equity.

ACKNOWLEDGEMENTS
Writing this thesis has been a personal learning process for me. However this process
was made possible with assistance of other people who in one way or the other, were
involved in and made writing this possible.
First and foremost, I would like to give all thanks and glory to the almighty God. From
the deepest part of my heart I want to thank my lovely daughter Andrée Yondo
Kameni, and words cannot express my sincere gratitude for the joy, motivation and
willingness you provide me every single day.
I’m forever indebted to my parents Marcel Yondo and Engele Julienne for the
incessant and unconditional, emotional, moral, physical, spiritual support and
encouragements. With all profound love and gratitude I will like to thank all my
brothers Raul Yondo, Kolko Yondo, Geraldin Yondo and Marcel Jordy Yondo.
Special thanks goes to my grand mum Charlotte Kingue Belle, my uncles & Aunt
Justin Bejedi, Albert Behle, and David Din Belle, Alice Mbah. I’m sincerely appreciate
and thankful to my adoptive families Anicet Samba and Celestin Fenkoun.
I’m particularly grateful to my supervisor Hannu Karha for his advice and assistance
and all my friends for the unconditional support.
I will finally end up by expanding my love and gratitude to my late sister Christelle
Yondo and late partner Norbert Djeufo “Woungail”, may your souls rest in peace.
Oulu, Finland. April 2016
Yondo Belle Serge


CONTENTS
Acknowledgements
1 Introduction...…………………………………………………………………......8
2 Theoretical Frame work………………………………………………………....11
2.1 Mergers and Acquisitions…………………………………………………...11
2.1.1 Merger and Acquisition Motives……………………………………....12
2.1.2 Merger and Acquisition Strategies...……………………………….…..13
2.1.3 Merger and Acquisition Process…………………………………….....15
2.1.4 Success Factors in Mergers and Acquisitions……..…………….….…16
2.1.5 Merger and Acquisition costs…………………..………………………17
2.1.6 Reasons for Merger and Acquisition failures…..………………………18
2.2 Bank Performance…………………………………………………….…......21
2.2.1 Traditional Measure of Performance…………………….…………......21
2.2.2 Economic Measure of Performance..................................................…...22
2.2.3 Market Based Measures of Performance……….....................................23
2.3 Merger and Acquisition in US Banking Sector…...………………………23
3 Research Problem and Previous Related literature……...……………………26
4 Data and Methods………………………………………………………….…...29
5 Results and Discussion..................................................................................…...36
5.1 Sample Test of Normality……………..…………………………………….36
5.2 Variables testing......................................................................................…...40
6 Conclusion……………………………………………………………………......47
References………………………………………………………………………......48
Appendices………………………………………………………………………….53
FIGURES
Figure 1. Change in capital ratio ………………………………………………….37
Figure 2. Change in Total Liabilities/ Total assets……………………………….38
Figure 3. Change in Earning Per Share…………………………………………..38
Figure 4. Change in Return on Equity…………………………………………....39
Figure 5. Change in Return on Assets…………………………………………….39
Figure 6. Capital ratio variations………………………………………………….41
Figure 7. Return on equity variations…………………………………………….42
Figure 8. Return on asset variations……………………………………………...43
Figure 9. Total Liabilities/Total Assets variations……………………………....44

Figure 10. Earnings per share variations………………………………………....45
TABLES
Table 1. Merger and Acquisition motives………………………………………..13
Table 2. Merger and Acquisition process………………………………………...16
Table 3. Sample of selected banks………………………………………………...30
Table 4. Financial ratio formulas…………………………………………………34
Table 5. Shapiro-Wilk test results…………………………………………..…….36
Table 6. Wilcoxon test results………………………………………………..……40
8
1 INTRODUCTION
Mergers and acquisitions have become the driving force of the world economy and
have played a significant role in the strategy of many banks in the last decades.
Banking reforms since 1980s have been a continuous process around the world but it
is more intensified in recent time due to globalization which is precipitated by the trend
of integration on the world market and economies. The main reason that can explain
mergers and acquisitions in banking sector is the risk management. Bank in every
country are committed to make a proper risk analysis in other to balance the deposit
and credit portfolios. Mergers and Acquisitions in this case can diversify those risks to
a significant extend. A significant increase in market competition, innovation of new
financial products and consolidation of national (regional) financial systems are other
reasons explaining why banks are opting for mergers and acquisitions around the
world. Mergers and Acquisitions can be proved really useful against market
competition as they have the capability to generate economy of scale and this economy
of scale can help banks in lowering their costs and provide a competitive edge and
enhance their revenues. The USA banking sector has experienced this rapid process of
mergers & acquisitions during 1980s.Beside deregulation, technological and financial
motivation, the imperative of efficiency, value creation and market power boosted the
process. The structure of US banking industry has changed considerably with over
10.000 mergers involving more than $7 trillion in acquired assets taking place. There
were 19069 banks and thrifts operating in the US in 1980 and 7,011 in 2010, a decline
of over 60%. Houston et AL. (2001) found that the post-merger performance of bank
has been improved in US. In the same range Lin et AL. (2006) showed that in US
banking sector the firm’s performance increased after mergers and acquisitions
regarding their productivity, profitability and shareholder’s value. Some studies,
however have found that mergers and acquisitions are far from having proved their
economic effectiveness and, there is no increase in the financial performance of
organization after mergers and acquisitions. (Robert M. Adams, 2012.)
Financial performance of banks under mergers and acquisitions can be measured
through financial ratios using accounting and financial data. The study empirically
assesses the effect of mergers and acquisitions on financial performance of USA bidder
banks by comparing pre-and-post financial performance using their accounting
9
indicators and financial ratios. The paper’s goal is to prove that mergers and
acquisitions if used in appropriate way are financially profitable for bidder banks. The
first steps focus on selecting and calculating financial indicators of each bidder bank
for pre-and-post merger and acquisition period. After calculating those ratios a mean
average of each ratio of each bidder bank is deducted and analyzed.
Motivated by the ambiguity in the profitability of mergers and acquisitions and
inspired by papers such as Brighman and Ehrhardt (2005), we are seeking to examine
the profitability of the merged banks base on their financial performance and by using
a statistical approach.
The thesis is relatively similar with previous research. In comparison to previous
works the differences lead on the size of the studied sample and the financial ratios
used. In term of evaluation of the method, the normality of the distribution as well as
the Wilcoxon Test (Shapiro Wild Test) has been examined in the same process as
Gjirja (2001) .Furthermore, a graphical approach to evaluate and compare performance
between pre-and-post merger and acquisition is introduced.
The data is chosen to be annual from SCD Platinium in the period 2004 to 2014. We
selected 30 banks to banks mergers and acquisitions from the basket of all mergers and
acquisitions that occurred in USA from 2004 to 2014. The same as Gjirja (2001) we
focus on annual financial performance for each chosen bidder bank.
The methodology used is suitable for the procedure of estimation of financial ratios.
The method is straightforward and clear. The point that should be highlighted is that
we were unable to gather all information necessary to calculate all existing financial
ratios.
The results showed no changes in financial performance leading to no improvements
in financial efficiency. The purpose of merger and acquisition in improving
performance is not achieved in the studied banks.
We started with the literature review of related subjects that support our statements.
The second chapter provides an overview of mergers and acquisitions, merger and

10
acquisition definitions, reasons, motives, success factors and reasons of failure. The
chapter also highlight the concept financial performance, financial performance
definition and measures and a general overview of mergers and acquisitions in banking
industry in USA. The chapter 3 and 4 defines the research problem, provides an
overview of previous literature related to the research, data gathering, methodology
and a comprehensive discussion on profitability of mergers and acquisitions. The
chapter 5 and 6 presents empirical results and conclusion of the research.
11
2 THEORETICAL FRAMEWORK
This chapter reviews existing literature in two folds. The first part covers mergers and
acquisitions concepts, motives, process, strategies and costs. The second part reviews
bank performance and mergers and acquisitions in domestic USA banking sector.
2.1 Mergers and acquisitions
Mergers and Acquisitions occurs when two or more organizations join together all or
part of their operations. The difference between merger and acquisition relate mainly
on the relative size of the individual companies in the business combination, on
ownership of the combined business and on management control of the combined
business. (Coyle and Brian, 2000.)
Mergers can be defined in a broad as well as a narrow term. In broadest a merger refers
to any takeover of one company by another, when the businesses of each company are
brought as one. A more narrow definition is the coming together of two companies of
roughly equal size, pooling their resources into a single business. The stockholders or
owners of both pre-merger companies have a share in the ownership of the merged
business and the top management of both companies continues to hold senior
management position after the merger (Coyle and Brian, 2000).
The narrow definition point out couple of conditions for the existence of a merger:
Neither company is portrayed as the acquirer or the acquired
Both parties participate in establishing the management structure of the combined
business
Both companies are sufficiently similar in size that one does not dominate the other
when combined
All or most of the consideration involves a share swap rather than a cash payment
An acquisition in contrast, is the takeover of the ownership and management control
of one company by another. The control is the key test of distinction between a merger
and an acquisition. Acquisition, or take over, occurs when one company acquires from

12
another company either a controlling interest in company stock or a business operation
and its assets. The purchase consideration could take the form of stocks in the
acquiring company. Stockholders in company that is taken over exchange their stocks
for stocks in the acquiring company, thus becoming stockholders in the enlarged
company post-acquisition. However, often, the purchase consideration for an
acquisition is paid largely or entirely in cash. The process of acquisition, buying
company or buying its assets could be a matter for negotiation .By purchasing a
company, the buyer acquires its liabilities as well as its assets; the buyer also acquire
any tax losses that the purchased company might have accumulated to set off against
future profits. Acquisitions can be either full or partial. In a full acquisition the acquirer
buy all the stock capital of the purchased company. In a partial acquisition, the acquirer
obtains a controlling interest, normally over 50% of the equity stocks, but less than
100 %.( Coyle and Bryan, 2000.)
2.1.1 Merger and Acquisition Motives
The main reason for the growing number of cross-border takeovers, mergers and joint
ventures is the desire to compete or survive in new world. Motives may vary from deal
to deal. It can be the rationales of adoptive or offensive, versus proactive or offensive
(Gugler &Yurtoglu, 2008).
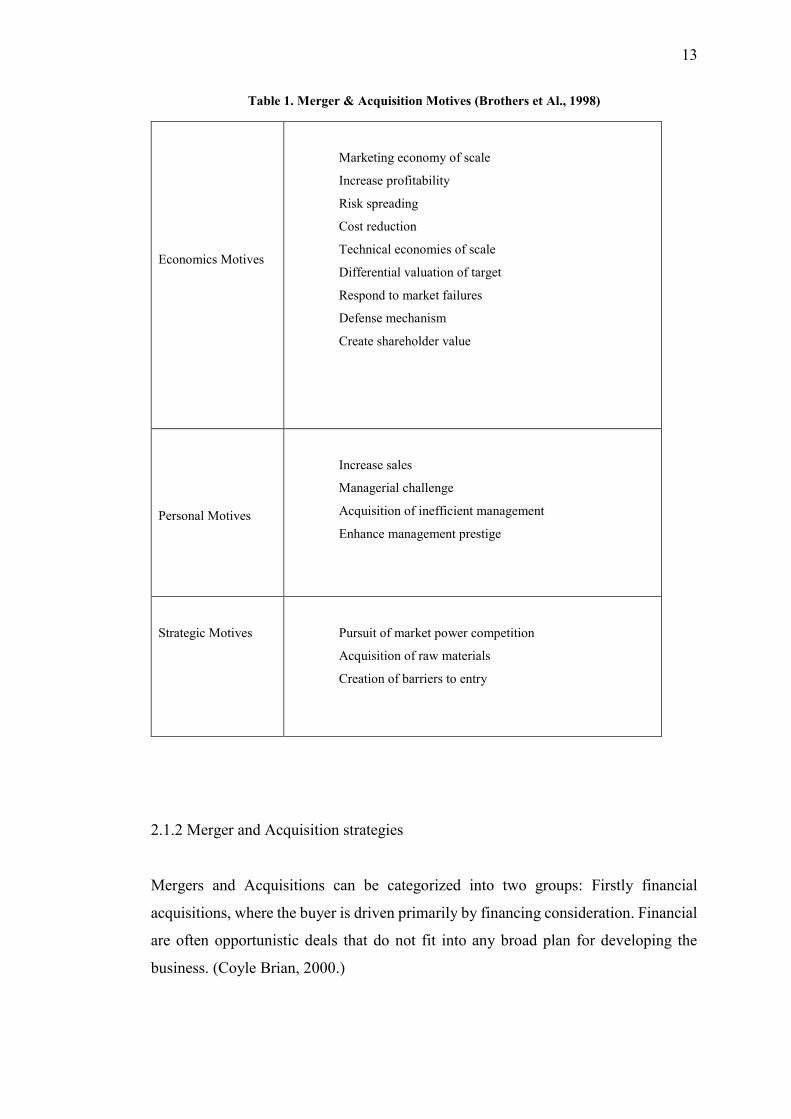
Over all there are three commonly accepted categories of mergers and acquisitions
motives. The first group is economic motives, which include profit maximization, cost
reduction, spreading risks, achieving economies of scale, taking advantages of market
valuation differentials, taking a defensive position, and react to market failures
(Brouthers et Al., 1998).The second group of motives occur from personal vision of
manager in merger and acquisition in term of increased prestige or payment through
increased sales or profitability and firm growth (Brouthers et Al., 1998; Schweizer,
2005). The third group involves strategic motives. In this case mergers and acquisitions
activities aims to achieve synergy, expansion of global market, pursuing market power,
acquiring new resources such as managerial skills and raw materials, increasing
competitiveness. (Brouthers et Al., 1998.)
13
Table 1. Merger & Acquisition Motives (Brothers et Al., 1998)
Economics Motives
Marketing economy of scale
Increase profitability
Risk spreading
Cost reduction
Technical economies of scale
Differential valuation of target
Respond to market failures
Defense mechanism
Create shareholder value
Personal Motives
Increase sales
Managerial challenge
Acquisition of inefficient management
Enhance management prestige
Strategic Motives Pursuit of market power competition
Acquisition of raw materials
Creation of barriers to entry
2.1.2 Merger and Acquisition strategies
Mergers and Acquisitions can be categorized into two groups: Firstly financial
acquisitions, where the buyer is driven primarily by financing consideration. Financial
are often opportunistic deals that do not fit into any broad plan for developing the
business. (Coyle Brian, 2000.)
14
Secondly strategic merger and acquisition where the buyer is driven primarily by
commercial consideration. Acquisition based growth and organic growth should be
twin platform of a large company’s strategic approach to developing its business.
Additionally, companies needing to concentrate their resources on core activities in
growing industries should consider a strategy for divestment of non-core activities.
(Coyle Brian, 2000.)
A) Strategic approach requires a set of elements
- Identifying corporate objectives.
- Developing strategies to achieve objectives and deciding between acquisitions and
organic development as the more appropriate option in each case.
-Selecting candidate for acquisition.
- Deciding the value of the acquisition and making a bid.
-Making the acquisition.
Acquisitions can be the best method of achieving strategic aims. The choice between
acquisition and organic growth for new product/market development depends on a
number of key factors such as timescale, cost, business risks, barriers to entry, stage
of market development. (Coyle Brian, 2000.)
B) Synergy
In mergers and takeover, synergy is the additional benefit that can be derived from
combining the resources of the bidding and target companies. When synergy exists,
the total returns from the combined organization exceed the total returns of the two
companies before the merger or acquisition. However, synergy does not always occur
in a merger or acquisition, and all too often, hoped-for synergies fail to materialize.
(Coyle Brian, 2000.)
C) Aggressive / defensive strategies
Mergers and Acquisitions can be the outcome of either an aggressive or a defensive
strategy. When using aggressive strategy company seek to improve its market position
.Mergers and Acquisitions intended to create a bigger company with larger market for
its products and with the resources to produce on a bigger scale and more cheaply
through economies of scale target companies for takeover bids are commonly existing
15
competitors, or similar companies operating in different market. Mergers and
Acquisitions are common in industries and markets that are in the process of becoming
more global. Major suppliers to growing markets need to expand in order to remain
competitive (Coyle Brian, 2000).
Defensive strategy for mergers and acquisitions are made in order to survive in a
changing industry. A major acquisition by one company prompts a similar response
from others. Recently, the number of major competitors in many industries has reduced
because of mergers, acquisitions and strategic alliances. At the same time, their
markets have become international. (Coyle Brian, 2000.)
D) Growth Strategy
Mergers and Acquisitions strategy is based on a growth objective. An acquisition
strategy for growth can seek to develop products and markets in any of four ways:
- By market penetration including cross-border acquisitions, including developing new
and larger markets for a company’s existing products.
- Horizontal diversification: expands into market for products that it has made before,
but which are similar to its existing products range.
- Vertical integration: combination of a company’s business with the business of a
supplier or a customer.
- Conglomerate diversification: group of companies that operates in a widely diverse
industry. (Coyle Brian, 2000).
2.1.3 Merger and Acquisition process
Mergers and Acquisitions deal is generally conducted through three phases: planning,
implementation and integration. (Picot, 2002.)
Massoudi (2006) propose a deal process model which includes five steps:
(1) Definition of vision and strategy for growth.
(2) Target selection.
(3) Deal discussion.
(4) Due diligence and integration planning.
(5) Integration of new entity and synergy realization.
The figure below provides a better picture of the full process:

16
Table 2: Merger and Acquisition process (www.safaribooksonline.com)
2.1.4 Success factors in Merger and Acquisition
Several factors have been identified by different mergers and acquisitions disciplines
as important impact on mergers and acquisitions performance. Cording, Christman,
and Bourgeois (2002) review eight schools of thoughts emerging from mergers and
acquisitions literature regarding the influential issues that contributed strategic
acquisition success in terms of financial performance. These schools include
Strategy Phase
(Buyer)
•Refine business plan
•Organize Merger & Acquisition team
•Establish Merger & Acquisition plan
•Determine target criteria
• Identify candidates
•Analyze targets
•Rank targets
Negociation and Investigation Phase
(Buyer)
•Finalize negotiating strategyContact Targets•Negociate preliminary
transaction structure•Write letter for intent•Perform due deligence
Finalization and Integration phase
(Buyer)
• Integration phase
•Establish final transaction structure
•Secure approval
•Finalize financing
•Complete transaction
• Integrate entities
Strategy Phase
(seller)
•Refine Business Plan
•Analyze own Bank
•Establish Franchise value
•Enhance value
•Develop selling document
• Identify potential buyers
Negociation and Investigation Phase(Seller)
•Finalize negotiating strategies
•Assess offer
•Review tax consequences
•Assist with due deligence
Finalization and Integration Phase(Seller)
•Review final agreement
•Complete Transaction
17
overpayment, agency problem, top management complementarities, experience,
employee distress, and conflicting culture.
Gomes et Al. (2012) point out success factors through extensive literature review.
Mergers and Acquisitions success factors are presented according to phases (pre-
merger phase/post-merger phase).
Firstly during the pre- merger phase success factors depend on:
- Choice and evaluation of the strategic partner.
- Paying the correct prize
- Size mismatches and organization
- Overall strategy and accumulated experience on merger and acquisition
- Communication before the merger
- Future compensation policy
The second phase is the post-merger encompasses:
- Integration strategies
- Post-acquisition leadership
- Speed of implementation
- Post-integration team and disregard of day-to-day business activities
- Communication during implementation
- Managing cultural differences
- Human resources management
2.1.5 Merger and Acquisition Costs
European central bank (2010) provides and overall view of merger and acquisition
costs. It is obvious that a target company will try to project its value to a high level but
the firm who want to take over the target company wants the deal to be settled at a low
price. Costs are calculated in order to check the viability and profitability of a specific
deal. A company will finalize a merger only after calculating the cost of the merger,
and in case of acquisition after determining how beneficial will be the takeover. Three
methods appear as popular in cost calculation of merger and acquisition. (Scott
Hempling, 2001.)
A) Replacement cost method: The acquisition in this case is based on the cost of
replacing the target company. The replacement cost method is rarely uses because of
18
its limitations especially in service industry where key assets are people, knowledge
and ideas. (Scott Hempling, 2001.)
B) Discounted Cash Flow method
Determine the company’s current value according to estimated future cash flow.
Comparative Ratio:
Involves two points. Firstly the price earnings ratio (P/E ratio) where the acquiring
company uses P/E ratio to make an offer that is a multiple of the earning of the target
company. Secondly the enterprise value-to-sales-ratio (EV/sales) where the acquiring
company uses EV /sales ratio to make an offer as a multiple of the revenue while being
aware of the price-to-sale ratio of other companies in the industry.(Scott
Hempling,2001.)
The European central bank (2010) defines a basic classification of merger and
acquisition costs:
(1) Transaction Costs
Are the costs of bringing the merging firm into agreement and obtaining approval for
the merger.These costs may include legal, regulatory and investment banking fees.
(2) Transition Costs
Are costs incurred to implement the consolidation .Transition costs include employee
relocation, early retirement and payment to departing executive.
(3) Acquisition Premium
It is a special form of transaction cost. It is the amount by which the purchase price for
the asset exceeds its new book value.
(4) Others Costs
Encompasses costs related to pension fund and different taxes.
2.1.6 Reasons of Merger and Acquisition failure
Many studies research indicate that more than 70% of companies fail to show positive
results when it comes to merger and acquisition. The ultimately do not add value to
companies and even end up causing serious damages. The reasons behind those
failures are diverse and the fact that the environment is changing all the time, in
addition to the interdependency of factors increase the complexity of merger and

19
acquisition .Ulrich Steger (2007) provided an approach describing the failure of
merger and acquisition base on 4 points: unrealistic expectations, overconfidence,
promoters and external advice, distrust and group dynamics.
(a) Unrealistic expectations
Is the main cause for merger and acquisition failure. Mergers and Acquisitions task is
complex and often underestimate by managers who deals with unrealistic. Resistance
shows up and with resistance comes delay. Integration takes time and it is painstaking.
This is where the success can be spoiled .It is often predicted that change will be faster
and easier than what is realistic. The profound changes needed for success are more
difficult and take much longer than originally thought. The changes implemented
during post-merger integration projects usually only scratch the surface .As the
integration progresses more difficult obstacles surface, synergies and the like become
harder to realize. In brief merger and acquisition efforts are often doomed to fail from
the very beginning due to unrealistic expectations, especially concerning amount
spent, speed, ease and the effects, as well as the rewards of charges. These issues are
pushed especially hard by the promoters of merger and acquisition who promise fast,
easy, dramatic and successful change. (Steger, 2007.)
(b) Overconfidence
Every entrepreneurial decisions aiming for returns bear certain risks. This is also the
case for merger and acquisition .Confidence in the success for merger and acquisition
deal ,and the achievement of its goals, are crucial ingredients for a potential success if
the was not the case ,managers would hardly make the necessary efforts for merger
and acquisition projects. Confident managers who try are more likely to succeed than
are managers lacking confidence who also make the same attempt .Confidence can
then make the critical difference between a make and a break situation. Management
overconfidence may lead to an illusion of control and hence to premature solutions
with less thorough evaluation of acquisition candidates and little consideration of
integration issues. The enormous difficulties of merger and acquisition tend not to
become fully apparent until the integration phase, otherwise most people might restrain
themselves from making the necessary efforts to do merger and acquisition. The
successfully mastered first phase of merger and acquisition faster the illusion that
people are competent enough to succeed in the following phases as well, i.e. the initial

20
success contributes to overconfidence .Incompetent people seem not to recognize their
own inability. They are more prone to engage in projects and persist in efforts that are
likely to fail. Thus people who should be especially concerned about overconfidence
do not seem to care. (Steger, 2007.)
(c) Promoters and external advice
Managers rely heavily on promoters to initiate structure and carry out the merger and
acquisition transaction. Promoters have a vested interest in merger and acquisition and
push companies into merger and acquisition deals in order to offer their services.
Promoters play a signaling role and convince managers that they can succeed.
Promoters can fulfill a useful function by fostering confidence, restoring hope and
providing motivation .But the problem occurs when success becomes less likely, when
the same qualities are unjustified and totally unwarranted. Overconfidence can also be
founded on promoters. The self-assured candidates and those with dominant
personalities are hired. Very often promoters hire graduate students base on their
personality and academic performance. However there can be a huge gap between
recruits grade and their capabilities to perform in merger and acquisition strategies.
This recruitment bias might be true in few cases and self-selection by applicants might
already have taken place. Promoters believe in their personal success that is often
based on false self-evaluation. Promoters see fees and projects sold as criteria for
success. The important goal is that their integration services are needed and follow-up
projects are sold. Promoters may prefer complicated merger and acquisition projects
where, in the end, blame cannot be attributed. (Steger, 2007.)
(d) Distrust
The attitude and mood of the employees are often quite the opposite of overconfidence.
This might contribute to the failure because, as previously mentioned, an appropriate
amount of confidence is a crucial ingredient for success .The uncertainty about what
will happen in the future often affect employee’s attitude and mood. A lot of questions
arise, is there a danger of losing their jobs? How will jobs and tasks be changed? These
uncertainties can last quite some time and deeply affect the working atmosphere.
Another point is that merger and acquisition will probably produce restructuration but
not really bring the desire outcome. (Steger, 2007.)
21
Group Dynamics: merger and acquisition transactions involves different group of
people. There is tendency to get carried away by a group dynamics. In merger and
acquisition decisions are made by the board of directors and management team. In case
of failure the responsible manager will have to leave. Blame is often put on those who
carry out the post-merger integration and not on those who decide to initiate the
transaction as such. Participants in merger and acquisition negotiations often become
committed to the deal regardless of its logics or benefits of the company. (Steger,
2007.)
2.2 Bank Performance
The capacity to generate sustainable profitability is a bank’s first line of defense
against unexpected losses, as it strengthens its capital position and improves future
profitability through the investment of retained earnings. Since the ultimate purpose
of any profit-seeking organization is to preserve and create wealth for its owners, the
bank’s return on equity (ROE) needs to be greater than its cost of equity in order to
create shareholder value. Although banking institutions have become increasingly
complex, the key drivers of their performance remain earnings, efficiency, leverage
and risk-taking. Efficiency refers to the bank’s ability to generate revenues from a
given amount of assets and to make profit from a given source of income.
Risk-taking is reflected in the necessary adjustments to earnings for the undertaken
risks to generate them. Leverage might improve results in the upswing in the way it
functions as a multiplier but conversely it can also make it more likely for a bank to
fail, due to rare, unexpected losses (European central bank, 2010).
Academics and practitioners defined three categories of performance measures for
banks:
2.2.1 Traditional Measure of Performance
They are similar to those applied in the industries with the return on assets(ROA), the
return on equity(ROE) or cost-to-income ratio are the most widely used.(European
central bank,2010).
The return on assets (ROA) is the net income for the year divided by the total assets,
usually the average value over the year. ROA= 𝑁𝑒𝑡 𝑖𝑛𝑐𝑜𝑚𝑒
𝐴𝑣𝑒𝑟𝑎𝑔𝑒 𝑡𝑜𝑡𝑎𝑙 𝑎𝑠𝑠𝑒𝑡𝑠

22
The return on equity (ROE) is an internal performance measure of shareholder value,
and it is by far the most popular measure of performance. ROE= 𝑂𝑝𝑒𝑟𝑎𝑡𝑖𝑛𝑔 𝐸𝑥𝑝𝑒𝑛𝑠𝑒𝑠
𝑂𝑝𝑒𝑟𝑎𝑡𝑖𝑛𝑔 𝑟𝑒𝑣𝑒𝑛𝑢𝑒𝑠
The cost-to-cost income ratio shows the utility of the institution to generate profits
from a given revenue stream .Impairment charges are not included in the numerator.
Cost-to-cost income ratio = 𝑂𝑝𝑒𝑟𝑎𝑡𝑖𝑛𝑔 𝑒𝑥𝑝𝑒𝑛𝑠𝑒𝑠
𝑂𝑝𝑒𝑟𝑎𝑡𝑖𝑛𝑔 𝑟𝑒𝑣𝑒𝑛𝑢𝑒𝑠
Net interest margin is a proxy for the income generation capacity of intermediation
function of bank.
Net interest margin = 𝑛𝑒𝑡 𝑖𝑛𝑡𝑒𝑟𝑒𝑠𝑡 𝑖𝑛𝑐𝑜𝑚𝑒
𝑎𝑠𝑠𝑒𝑡𝑠(𝑜𝑟 𝑖𝑛𝑒𝑡𝑟𝑒𝑠𝑡−𝑏𝑒𝑎𝑟𝑖𝑛𝑔 𝑎𝑠𝑠𝑒𝑡𝑠)
2.2.2 Economic Measure of Performance
This measure take in account the development of shareholder value creation and aim
at assessing ,for any given fiscal year, the economic results generated by a company
from it economic assets. Economic measures mainly focus on efficiency as a central
element of performance, but generally have high levels of information requirements.
Two sets of indicators can be identified amongst economic measures of performance
(European central bank, 2010).
Indicators related to the total return of an investment, based on the concept of an
“opportunity cost”. The most popular is the economic value added (EVA). The EVA
takes into account the opportunity cost for stockholders to hold equity in a bank,
measuring whether a company generates an economic rate of return higher than the
cost of invested capital in order to increase the market value of the company (European
central bank, 2010).
EVA = 𝑟𝑒𝑡𝑢𝑟𝑛 𝑜𝑛 𝑖𝑛𝑣𝑒𝑠𝑡𝑒𝑑 𝑓𝑢𝑛𝑑𝑠 − (𝑤𝑒𝑖𝑔ℎ𝑡𝑒𝑑 𝑎𝑣𝑒𝑟𝑎𝑔𝑒 𝑐𝑜𝑠𝑡 𝑜𝑓 𝑐𝑎𝑝𝑖𝑡𝑎𝑙 ∗
𝑖𝑛𝑣𝑒𝑠𝑡𝑒𝑑 𝑐𝑎𝑝𝑖𝑡𝑎𝑙) − (𝑤𝑒𝑖𝑔ℎ𝑡𝑒𝑑 𝑎𝑣𝑒𝑟𝑎𝑔𝑒 𝑐𝑜𝑠𝑡 𝑜𝑓 𝑑𝑒𝑏𝑡 ∗ 𝑛𝑒𝑡 𝑑𝑒𝑏𝑡)
Indicators related to the underlying level of the risk associate with bank activity. Risk
adjusted return on capital (RAROC) allows banks to allocate capital to individual
business units according to their individual business risk. As a performance evaluation
tool, the RAROC is the assigns capital to business unit based on the anticipated
economic value added. Theoretically the RAROC can be extracted from the one-factor
23
CAPM as the excess return on the market per unit of market risk. However, the
literature is quite critical of this measure as a tool to analyze performance essentially
due to its thorough accounting basis, while it is difficult to calculate RAROC without
having access to internal data. (European central bank, 2010.)
2.2.3 Market-Based Measures of performance
Market-based measures of performance characterize the way the capital market value
the activities of any given company, compared with its estimated accounting or
economic value (European central bank, 2010). The most commonly used metric
include:
(1)The total share returns (TSR), the ratio of dividends and increase of the stock value
over the market stock price.
(2)The price earnings ratio (P/E), a ratio of the financial results of the company over
its share price.
(3)The price-to-book value (P/B) which relates the market value of the stockholders
equity to its book values.
(4)The credit default swap (CDS) which is the cost of insuring an unsecured bond of
the institution for a given time period. (European central bank, 2010.)
2.3 Mergers and Acquisitions in Banking Sector
Mergers and Acquisitions represents together with the internal growth and together
with partnership creating, a method of developing a bank. They are part of the
strategies of internationalization and of strategic re expanding of the groups, when the
fast action of external growth can bring the competitive advantage compared to the
competition or when new information has to be achieved, for the technology, research-
development, marketing or management. (Bleoju, 2010.)
One advantage of bank merger and acquisition is the diversification, the banks that
merge are summing up the financial potential and are created resources for the
approach of another type of operations and their accelerated expansion. Gomes et Al.
(2013) The volume and speed with which the merging was made follow the growth of
the market share, the increase of the business, the quality and efficiency in serving the
clients, reduction of costs, the creation of additional profits for the shareholders and
promoting more efficient procedures of management. Thus with a strong management
24
can be harmonized some aspects related to the obstacles presented in organization
structure, language differences, preparing and development of the business lines.
(Berea, 2001.)
Mergers and Acquisitions increases the development rhythm of the bank by taking
over some existent shares with visible, immediate efficiency, are reduced the risk by
the increase of the economic force of the bank, also the cost of acquisition are usually
underestimated. Mergers and Acquisitions especially those horizontal are a certain
method of penetrating and controlling new markets and increasing market share for
the newly created bank group (Berea, 2001).The economic reality showed that merger
and acquisition hide the negative secondary effects that can lead to the slowing of the
rhythm of growth of the company, can lead to employee’s dismissal while trying to
readjust the cost, to the decreasing of the innovation due to the focusing on the growth
generated by acquisitions. The study of merger and acquisition gives the possibility to
the bank to obtain the fastest and increase the volume of activities by conquering new
markets but also the strategy that has the great effect on the national and regional
economies. (Dobocan, 2010.)
Previous research suggests that many banks engage in mergers for the purpose of
improving efficiency. For instance, Berger and Humphrey (1992) study fifty-seven US
banking mega merger from 1981 to 1989.they estimate a neo-classical cost function
that allows them to show that mergers were not successful on average in improving
cost efficiency because of diseconomies of scale .the combined firms actually
performed slightly worse on average after the mergers, although this effect was small
and often not statistically significant. Although the majority of researches has focused
on cost efficiency a few studies have tried to cover additional effect of mergers by
using a profit function. Studies of profit efficiency usually point a more favorable
picture of mergers. Such studies of profit from the 1980s and early 1990s found that
mergers improved profit efficiency, and that this improvement could be linked to an
increased diversification of risk and improved risk-expected return tradeoff.
(Akhavein, Berger and Humphrey, 1997, and Berger, 1998.)
Despite their popularity many of the mergers and acquisitions do not succeed to
produce financial benefits that are expected. In fact past studies include that almost
70% of mergers and acquisitions don’t succeed to improve the performance of the
25
banks involved. The failure of merger and acquisition, most of the time, is due to either
illusory synergy, to the vain of high management or to a slow integration. (Drucker,
2001.)
Today the nature of the bank was changed, the progresses registered in the technology
created the interdependencies from the economy, the speed of financial transactions
would reach to a high level so that it would feel the needs of renouncing to the old
geographical limitations in favor of some banks from Europe and USA which
determined the appearance of some great banks created new gigantic structures .the
justification for performance of these mega transactions is the large market.(Drucker,
2001.)
26
3 RESEARCH PROBLEM AND PREVIOUS RELATED LITERATURES
The outbreak of bank merger and acquisition in USA is attracting much attention,
partly because of the heightened interest in what motivates firms to merge and how
merger and acquisition affect performance or efficiency. This research investigates
effects of merger and acquisition on the performance of (bidder) banks. It is motivates
by the ambiguity of the empirical evidence on the impacts of merger and acquisition
involving US banks. Overall, the handful of studies on mergers and acquisitions
activities in US banking industry provides mixed results.
For instance, Altunbas and Ibanez (2004) report that bank mergers taking place in the
banking industry to lead on average to improve accounting and profitability. Vander
(2002) reports a limited improvement in profit efficiency but not in cost efficiency
with reference to cross border deals only.
According to Pilloff and Santomero (1997), there is little empirical evidence of
mergers achieving growth or other important performance gains. Towards this, Beitel
et Al (2003) found no gains effect due to mergers and acquisitions .Overall of all these
studies provide mixed evidence and many fails to show a clear relationship between
mergers &acquisitions and performance (Pilloff and Santomero,1997).
Rym Ayadi and Georges Pujals (2005) provide a complete picture of banking mergers
and acquisitions in Europe during the 1990s and at offering economic evaluation and
strategic analysis of the process. They examine the impact of mergers and acquisitions
in European banking on profitability and efficiency. They found that domestic mergers
contribute to cut costs for both partners, the impact on profitability is insignificant but
a clear trend to diversify the resources of the revenues was apparent. The cost and
profit efficiency analysis based on 33 bank-to-bank mergers ,confirmed an
improvement of cost efficiency and little improvement of profit efficiency for
domestic transactions, whereas no improvement of profit efficiency for domestic
transactions; whereas, no improvement of cost efficiency and little improvement of
profit efficiency for cross-border.(Rym Ayadi & Georges Pujals,2005.)
A similar study on the impact of mergers and acquisitions on financial performance of
bank has been conducted in Pakistan.Tajalli Fatima & Amir Shehzad (2014) have

27
tested the impact of mergers and acquisitions on banks and provides insights about
their role after merger on banks profitability. They uses six financial ratios(ROA,
ROE, Profit after tax, Debt to equity ratio, EPS, deposit to equity) and compares three
years pre-mergers and three years post mergers data points for ten banks and their and
their average are compared. Findings shows that at 5% level of significance only ROE
is affected by the merger and acquisition and other ratios have no impact from this
strategy. (Tajalli Fatima & Amir Shehzad, 2014.)
Onaolapo & Ajala (2012) have examined the effects of merger and acquisition on the
performance of the commercial banks in Nigeria with a greater emphasis on gross
earnings, profit after tax and deposit profile as financial efficiency parameters. The
results showed that post-merger and acquisition period was more financially improved
than the pre-merger and acquisition period. Also the study found that the point
consolidation periods has a higher performance in gross earning; deposit has a better
performance while profit after tax is comparatively has low but improved performance
than the pre-consolidation period. This study recommended that banks should be more
proactive in driving for profit for enhanced financial performance to reap the benefits
of mergers and acquisitions bid in banking sector. (Onaolapo & Ajala, 2012.)
Abbas et Al (2014) have studied the strategy of mergers and acquisitions on corporate
sector in Pakistan .The study was conducted in a small scale. Hence the study
accomplished the declared gap in the area of Mergers and acquisitions. The purpose
of this study is to assess the impact of merger and acquisition on the performance of
banks, ratios analysis has been used between pre and post-merger and acquisition. The
results showed that there are no improvements in the financial performance of banks
after merger and acquisition. There is a decrease in profitability, efficiency, liquidity,
and leverage ratio in the most of the banks after merger and acquisition. In the
dimension of liquidity and leverage there is no much improvement in financial
performance of banks in Pakistan after merger and acquisition. (Abbas et Al, 2014.)
The aim of the paper is to use an empirical approach in order to directly assess whether
merger and acquisition involving US banks lead to improvements in performance .In
the light of above, the following research question where raised:
28
(1) Does merger and acquisition have any effects on the financial performance of
bidder banks?
(2) Did the financial performance of bidder bank improve after merger and
acquisition?
Accounting and statistics methodologies are the base of this study where financial
indicators were used to measure the performance. To answer the above stated research
question the research had developed following hypothesis:
(1) 𝐻0: Merger and Acquisition has no significant effect on financial performance of
bidder bank.
(2) 𝐻1: Merger and Acquisition has significant effect on financial of bidder bank.
To perform this task it is important to form a mathematical hypothesis for testing each
variable independently.
(3) 𝐻0: µPost - µPre = 0 →µPost = µPre
(4) 𝐻1:µPost - µPre ≠ 0 →µPost ≠ µPre
The analysis of the financial performance is done by comparing pre-and-post financial
ratios. All the ratios are calculated for two years before merger and acquisition and
two years after the merger and acquisition of bidder banks.

29
4 DATAS AND METHODS
Different methods and techniques have been used in previously conducted studies
regarding merger and acquisition performance. The analysis of this research relies on
accounting and statistical analysis of financial ratio. Brighman and Ehrhardt (2005)
examined that the financial statement analysis is a better approach to evaluate the firm
strength. Moreover they emphasized the importance of financial statement to
accurately analyze improvements in financial performance. Pre-and-post performance
has been studied through operating performance approach using accounting data
(Gjirja, 2001).
This research is undertaken to assess the financial performance of bidder/acquirer bank
in USA after merger and acquisition. A comparison between pre-and-post ratio of
selected banks is use to achieve the task. The statistics regarding merger and
acquisition in banking sector in USA were available on the website of SDC platinum
and CRSP according to this information there were more than 500 mergers and
acquisitions in banking sector. Data were collected from secondary source through
compilation and extraction from published data including published audited financial
statement, income statement and balance sheet from 2004 to 2013. The present
research measure the financial performance of thirty (30) acquiror banks during the
period of 2004 to 2013.The were 105 deals of mergers and acquisitions in USA
banking sector during the selected period but the analysis focus on 30 due to the
availability of financial and accounting data, on transactions occurred on domestic
level in USA banking sector and, on a single operation between one bank to another.
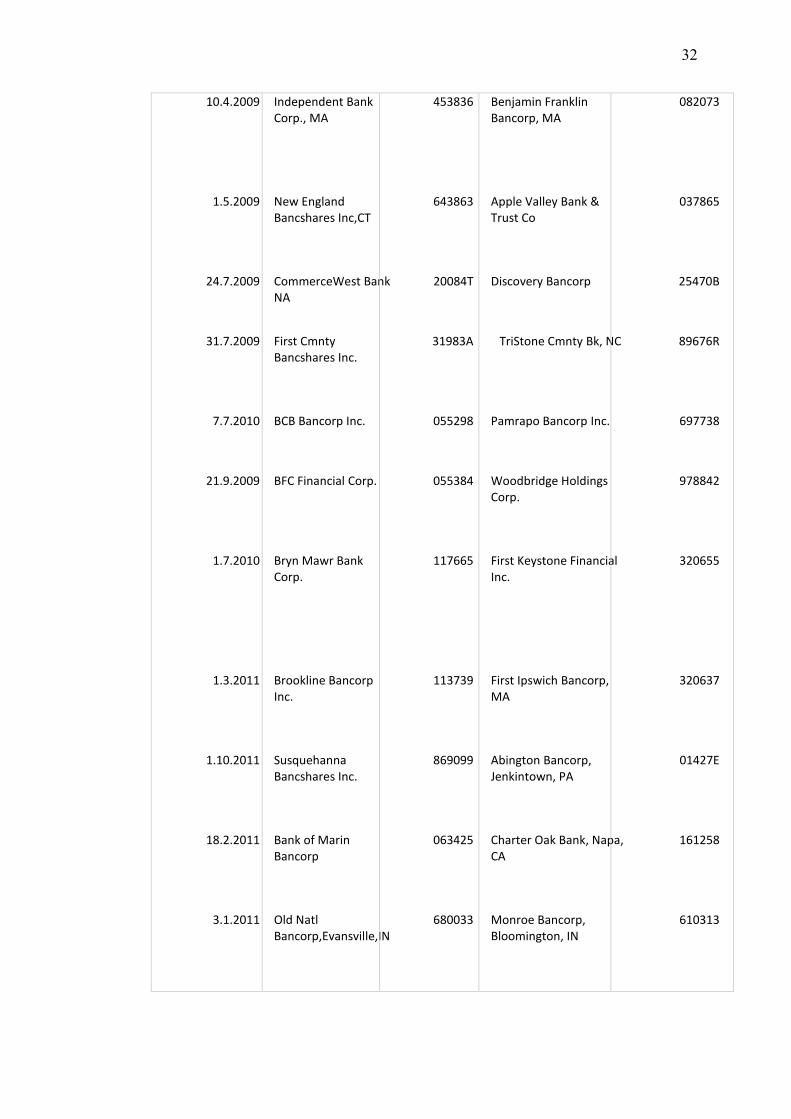
The table below shows our studied sample, the effective date of the transaction, bank’s
name and identification code according to USA regulation.

30
Table 3: Sample of Selected of Banks (SCD Platinium)
Date
Acquiror Acquiror Cusip Target Target Cusip
13.11.2006
14.10.2006
15.11.2006
8.12.2006
13.3.2007
16.3.2007
2.1.2007
31.1.2007
Mercantile Bancorp Inc.
Community Bancorp NV
Union Bancorp Inc, Ottawa, IL
Cullen/Frost Bankers Inc.
National Mercantile Bancorp
Sterling Banks Inc.
Citizens Banking Corp,Flint,MI
Prosperity Bancshares Inc., TX
58734P
20343T
908908
229899
636912
85915B
174420
743606
Royal Palm Bancorp Inc,Naples,
Valley Bancorp
Centrue Financial Corp., IL
Summit Bancshares Inc.
FCB Bancorp, Camarillo, CA
Farnsworth Bancorp Inc.
Republic Bancorp Inc, Owosso, MI
Texas United Bancshares, TX
78064Y
91929R
15641R
866010
30247A
31163N
760282
882838

31
2.2.2007
2.4.2007
1.4.2008
6.6.2008
31.1.2008
1.5.2008
1.7.2008
31.10.2008
1.1.2009
30.1.2009
IBERIABANK Corp.
Cmnty Banks Inc,Harrisburg,PA
First Bancorp, Troy, NC
Fifth Third Bancorp, OH
First National Bancshares Inc.
SunTrust Banks Inc,Atlanta,GA
Valley National Bancorp, NJ
CSB Bancorp Inc,Millersburg,OH
Bank of America Corp.
Banco Santander SA
450828
203628
318910
316773
32111B
867914
919794
12628R
060505
05964H
Pocahontas Bancorp, AR
BUCS Financial Corp.
Great Pee Dee Bancorp Inc,SC
First Charter Corp., Charlotte
Carolina National Corp.
GB&T Bancshares Inc,Georgia
Greater Community Bancorp
Indian Village Bancorp Inc, OH
Merrill Lynch & Co.Inc.
Sovereign Bancorp Inc.
730234
118724
39115R
319439
144060
361462
39167M
454533
590188
845905
32
10.4.2009
1.5.2009
24.7.2009
31.7.2009
7.7.2010
21.9.2009
1.7.2010
1.3.2011
1.10.2011
18.2.2011
3.1.2011
Independent Bank Corp., MA
New England Bancshares Inc,CT
CommerceWest Bank NA
First Cmnty Bancshares Inc.
BCB Bancorp Inc.
BFC Financial Corp.
Bryn Mawr Bank Corp.
Brookline Bancorp Inc.
Susquehanna Bancshares Inc.
Bank of Marin Bancorp
Old Natl Bancorp,Evansville,IN
453836
643863
20084T
31983A
055298
055384
117665
113739
869099
063425
680033
Benjamin Franklin Bancorp, MA
Apple Valley Bank & Trust Co
Discovery Bancorp
TriStone Cmnty Bk, NC
Pamrapo Bancorp Inc.
Woodbridge Holdings Corp.
First Keystone Financial Inc.
First Ipswich Bancorp, MA
Abington Bancorp, Jenkintown, PA
Charter Oak Bank, Napa, CA
Monroe Bancorp, Bloomington, IN
082073
037865
25470B
89676R
697738
978842
320655
320637
01427E
161258
610313
33
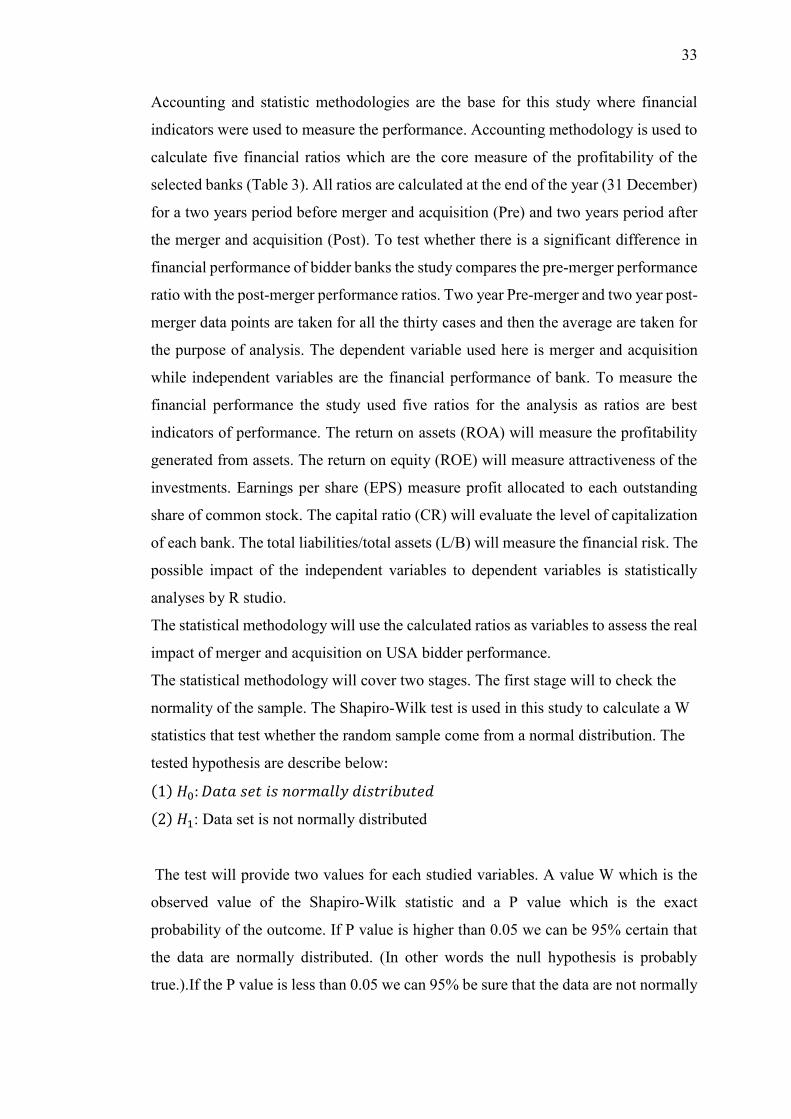
Accounting and statistic methodologies are the base for this study where financial
indicators were used to measure the performance. Accounting methodology is used to
calculate five financial ratios which are the core measure of the profitability of the
selected banks (Table 3). All ratios are calculated at the end of the year (31 December)
for a two years period before merger and acquisition (Pre) and two years period after
the merger and acquisition (Post). To test whether there is a significant difference in
financial performance of bidder banks the study compares the pre-merger performance
ratio with the post-merger performance ratios. Two year Pre-merger and two year post-
merger data points are taken for all the thirty cases and then the average are taken for
the purpose of analysis. The dependent variable used here is merger and acquisition
while independent variables are the financial performance of bank. To measure the
financial performance the study used five ratios for the analysis as ratios are best
indicators of performance. The return on assets (ROA) will measure the profitability
generated from assets. The return on equity (ROE) will measure attractiveness of the
investments. Earnings per share (EPS) measure profit allocated to each outstanding
share of common stock. The capital ratio (CR) will evaluate the level of capitalization
of each bank. The total liabilities/total assets (L/B) will measure the financial risk. The
possible impact of the independent variables to dependent variables is statistically
analyses by R studio.
The statistical methodology will use the calculated ratios as variables to assess the real
impact of merger and acquisition on USA bidder performance.
The statistical methodology will cover two stages. The first stage will to check the
normality of the sample. The Shapiro-Wilk test is used in this study to calculate a W
statistics that test whether the random sample come from a normal distribution. The
tested hypothesis are describe below:
(1) 𝐻0: 𝐷𝑎𝑡𝑎 𝑠𝑒𝑡 𝑖𝑠 𝑛𝑜𝑟𝑚𝑎𝑙𝑙𝑦 𝑑𝑖𝑠𝑡𝑟𝑖𝑏𝑢𝑡𝑒𝑑
(2) 𝐻1: Data set is not normally distributed
The test will provide two values for each studied variables. A value W which is the
observed value of the Shapiro-Wilk statistic and a P value which is the exact
probability of the outcome. If P value is higher than 0.05 we can be 95% certain that
the data are normally distributed. (In other words the null hypothesis is probably
true.).If the P value is less than 0.05 we can 95% be sure that the data are not normally

34
distributed. (In other words there are not enough evidences to accept the null
hypothesis).
The pre and post-merger performance is efficiently assessed with the T paired test
which focus on the mean difference between post and pre observations.
(3) 𝐻0: µPost -µPre = 0
(4) 𝐻1:µPost - µPre ≠ 0
When running the test we will obtain a mean difference, the standard deviation error
of the mean difference and the t-statistic .If the t calculated is higher than the table
value (significance level is 5%) then there are not enough evidences to accept null
hypothesis. If the calculated t calculated is lower than the table value then the null
hypothesis is accepted. However to be valid the T paired test need to be approximately
normally distributed.
In case of violation of normality the alternative option is to conduct a Wilcoxon sign
rank test which does not assume normality in data. The Wilcoxon test uses the same
hypothesis as the T paired test but provide two results. A value V which is the observed
value of the Wilcoxon sign rank test and P value which are the exact probability of the
outcome. If the P value is higher than 0.05 we will accept the null hypothesis.
Reversely if the P value is less than 0.05 then we do not have enough evidences to
accept the null hypothesis.
Table 4. Financial Ratio Formulas (Juha-Pekka Advance Firm valuation 2015)
Financial Ratios
Formulas
Return on Asset ( ROA)
𝑁𝑒𝑡 𝑂𝑝𝑒𝑟𝑎𝑡𝑖𝑛𝑔 𝑝𝑟𝑜𝑓𝑖𝑡 𝐴𝑓𝑡𝑒𝑟 𝑡𝑎𝑥
𝑇𝑜𝑡𝑎𝑙 𝐴𝑠𝑠𝑒𝑡𝑠

35
Return on Equity (ROE)
𝑁𝑒𝑡 𝑂𝑝𝑒𝑟𝑎𝑡𝑖𝑛𝑔 𝑃𝑟𝑜𝑓𝑖𝑡 𝐴𝑓𝑡𝑒𝑟 𝑇𝑎𝑥
𝑇𝑜𝑡𝑎𝑙 𝐴𝑠𝑠𝑒𝑡𝑠
Earnings Per Share (EPS)
𝑁𝑒𝑡 𝑂𝑝𝑒𝑟𝑎𝑡𝑖𝑛𝑔 𝑃𝑟𝑜𝑓𝑖𝑡 𝐴𝑓𝑡𝑒𝑟 𝑇𝑎𝑥
𝑁𝑢𝑚𝑏𝑒𝑟 𝑜𝑓 𝑂𝑟𝑑𝑖𝑛𝑎𝑟𝑦 𝑆ℎ𝑎𝑟𝑒𝑠
Capital Ratio (CR)
𝑇𝑜𝑡𝑎𝑙 𝐸𝑞𝑢𝑖𝑡𝑦
𝑇𝑜𝑡𝑎𝑙 𝐴𝑠𝑠𝑒𝑡𝑠
Total liabilities/Total Assets (L/A)
𝑇𝑜𝑡𝑎𝑙 𝑙𝑖𝑎𝑏𝑖𝑙𝑖𝑡𝑖𝑒𝑠
𝑇𝑜𝑡𝑎𝑙 𝑎𝑠𝑠𝑒𝑡𝑠

36
5 RESULTS AND DISCUSSION
The study uses the mean between pre and post-merger values as core of the analysis.
The paired T test is appropriate to compare pre and post-merger performance for
studied banks. The difference between pre and post-merger performance for each ratio
and the mean of difference are used to test hypothesis:
(1) 𝐻0: µPost = µPre
(2) 𝐻1:µPost ≠ µPre
Under the null hypothesis, the statistic follows a t distribution with n-1 degrees of
freedom.
However the T paired test is valid only if the sample has normally distributed variables.
Therefore a Shapiro-Wilk test is used to test if the sample is normally distributed. A
value P=0.05 is used as cutoff. When the calculated p value is lower than 0.05 we can
conclude that the sample deviate from normality.
In case of non-normally distributed variable a Wilcoxon sign rank test will be applied.
5.1 Sample test of Normality
Two hypotheses will be tested:
(3) 𝐻0: 𝐷𝑎𝑡𝑎 𝑠𝑒𝑡 𝑖𝑠 𝑛𝑜𝑟𝑚𝑎𝑙𝑙𝑦 𝑑𝑖𝑠𝑡𝑟𝑖𝑏𝑢𝑡𝑒𝑑
(4) 𝐻1: Data set is not normally distributed
A cutoff value P=0.05 is applied. If P< 0.05 there are not enough evidences to accept
the null hypothesis and the population failed to be normally distributed.
Table 5. Shapiro – Wilk test results
Variables
ROA
ROE
EPS
CR
L/A
W
0.66371
0.58947
0.928
0.32786
0.376

37
P value
4.82𝑒−0,7
5.442𝑒−0,8
0.04347
1.22𝑒−10
3.10𝑒−10
By using a cutoff value P=0.05 we can see that the P values of all the variables are
lower than 0.05 .By referring to the results there are not enough evidences to accept
the null hypothesis 𝐻0 therefore at 5% level of significance the sample is not normally
distributed. As the assumption of normality in data has been violated the T-test is no
longer valid. The Wilcoxon signed-rank test will be appropriate to compare pre and
post-merger performance in this case.
Figure 1. Change in Capital Ratio
38
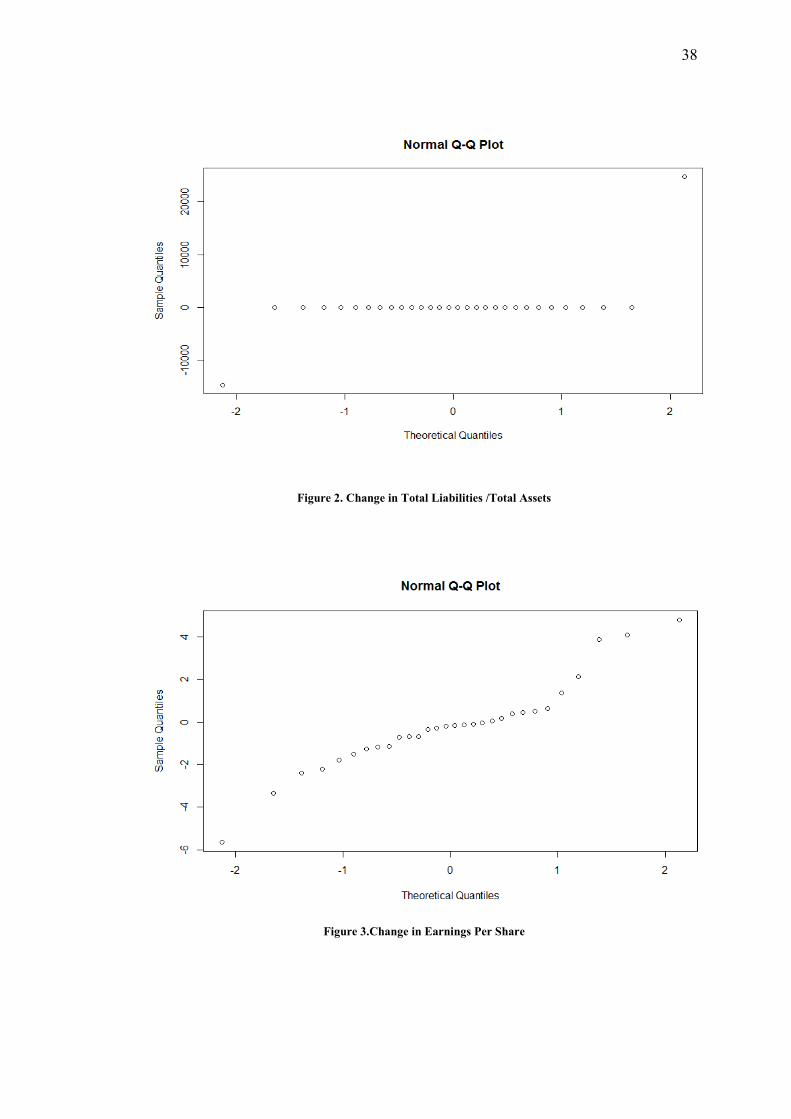
Figure 2. Change in Total Liabilities /Total Assets
Figure 3.Change in Earnings Per Share

39
Figure 4. Change in Return on Equity
Figure 5. Change in Return on Assets

40
The quantiles-quantiles plot (Q-Q plot) of each variable compares pre and post-merger
measure. All points follow a strongly nonlinear pattern suggesting that the data set are
not normal distributed.
5.2 Variables testing
The Wilcoxon signed-rank test is used to test hypothesis of the studied model
(1) 𝐻0: µPost = µPre
(2) 𝐻1:µPost ≠ µPre
Relatively a cutoff value of P= 0.05 is used as standard. If P>0.05 we will accept the
null hypothesis and conclude that the means have remained essentially unchanged.
V correspond to the sum of ranks assigned to the differences with positive sign.
Table 6. Wilcoxon test Results
Variables
ROA
ROE
EPS
CR
L/A
V
200
208
181
151
219
P value
0.5104
0.6263
0.2988
0.0961
0.7892
The P values of all studied variables are higher than 0.05. The calculated probabilities
point out the fact there are not enough evidences to accept the alternative hypothesis
therefore, at 5% level of significance the null hypothesis is accepted assuming that
there is no difference between pre and post-merger performance for USA bidder bank.
The core indicators of investment attractiveness, the profit allocated to each
outstanding share of common stock, the level of capitalization of each bank and the
financial risk are globally the same for USA bidder banks during the pre and post-
merger period.
41
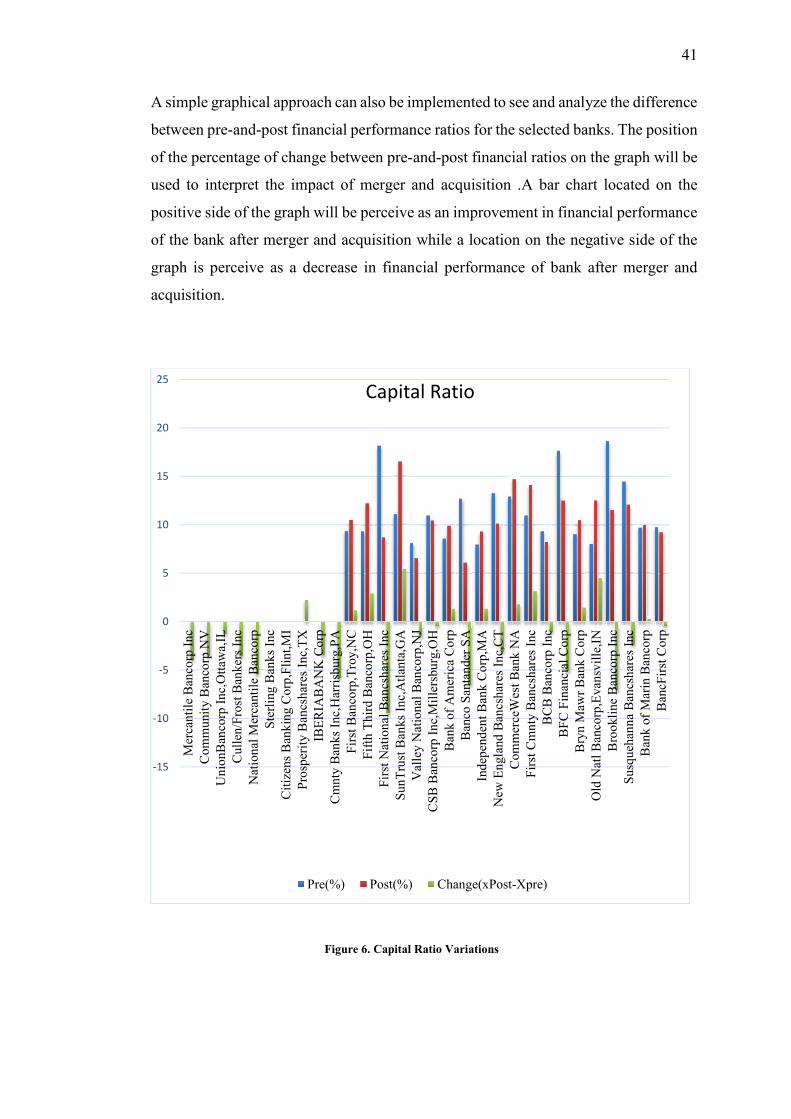
A simple graphical approach can also be implemented to see and analyze the difference
between pre-and-post financial performance ratios for the selected banks. The position
of the percentage of change between pre-and-post financial ratios on the graph will be
used to interpret the impact of merger and acquisition .A bar chart located on the
positive side of the graph will be perceive as an improvement in financial performance
of the bank after merger and acquisition while a location on the negative side of the
graph is perceive as a decrease in financial performance of bank after merger and
acquisition.
Figure 6. Capital Ratio Variations
-15
-10
-5
0
5
10
15
20
25
Mer
can
tile
Ban
corp
Inc
Com
mu
nit
y B
anco
rp N
V
Un
ionB
anco
rp I
nc,
Ott
awa,
IL
Cull
en/F
rost
Ban
ker
s In
c
Nat
ion
al M
erca
nti
le B
anco
rp
Ste
rlin
g B
ank
s In
c
Cit
izen
s B
ank
ing C
orp
,Fli
nt,
MI
Pro
sper
ity
Ban
csh
ares
Inc,
TX
IBE
RIA
BA
NK
Co
rp
Cm
nty
Ban
ks
Inc,
Har
risb
urg
,PA
Fir
st B
anco
rp,T
roy
,NC
Fif
th T
hir
d B
anco
rp,O
H
Fir
st N
atio
nal
Ban
csh
ares
Inc
Su
nT
rust
Ban
ks
Inc,
Atl
anta
,GA
Val
ley N
atio
nal
Ban
corp
,NJ
CS
B B
anco
rp I
nc,
Mil
lers
bu
rg,O
H
Ban
k o
f A
mer
ica
Co
rp
Ban
co S
anta
nder
SA
Ind
epen
den
t B
ank
Co
rp,M
A
New
En
gla
nd
Ban
csh
ares
In
c,C
T
Com
mer
ceW
est
Ban
k N
A
Fir
st C
mn
ty B
ancs
har
es I
nc
BC
B B
anco
rp I
nc
BF
C F
inan
cial
Co
rp
Bry
n M
awr
Ban
k C
orp
Old
Nat
l B
anco
rp,E
van
svil
le,I
N
Bro
okli
ne
Ban
corp
In
c
Su
squ
ehan
na
Ban
csh
ares
Inc
Ban
k o
f M
arin
Ban
corp
Ban
cFir
st C
orp
Capital Ratio
Pre(%) Post(%) Change(xPost-Xpre)
42
By referring on the Capital ratio:
Improvement in Capital Ratio Performance after merger and acquisition: 11 Banks
Decrease in Capital Ratio Performance after merger and acquisition: 17 Banks
No Changes in Capital Ratio performance after merger and acquisition: 2 Banks
11 banks have succeeded to improve their financial strength through but the majority
of banks (17) failed to achieve it.
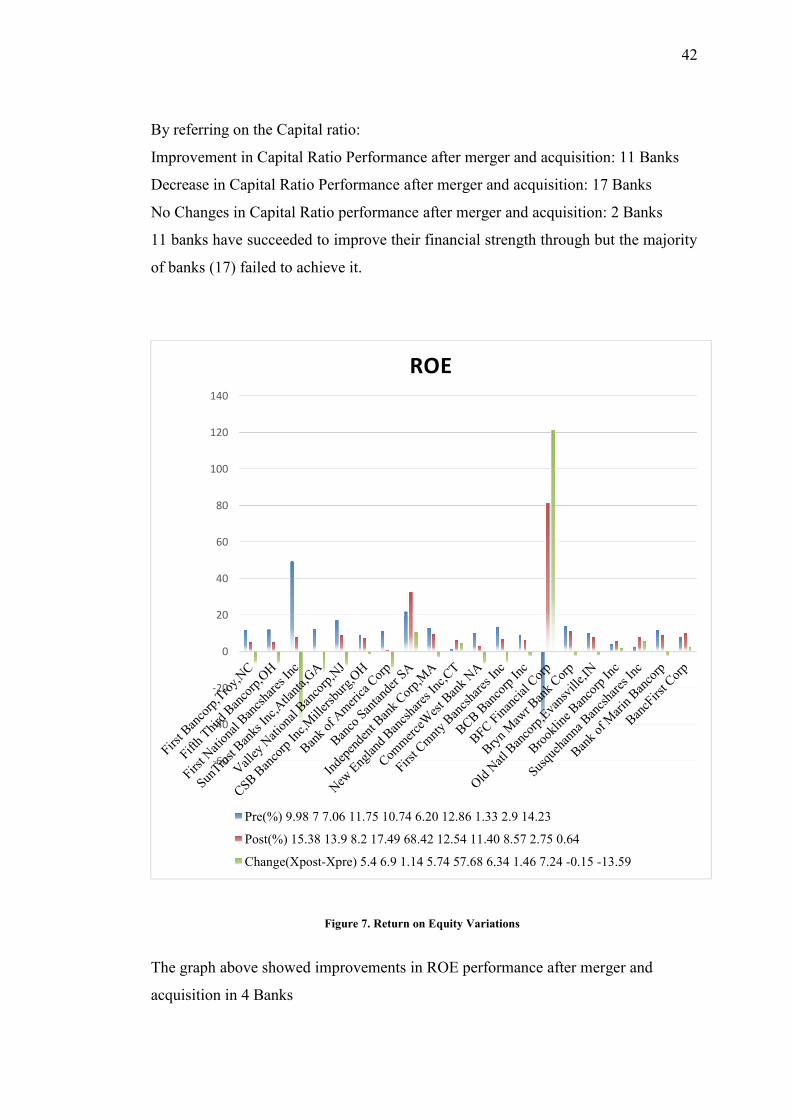
Figure 7. Return on Equity Variations
The graph above showed improvements in ROE performance after merger and
acquisition in 4 Banks
-60
-40
-20
0
20
40
60
80
100
120
140
ROE
Pre(%) 9.98 7 7.06 11.75 10.74 6.20 12.86 1.33 2.9 14.23
Post(%) 15.38 13.9 8.2 17.49 68.42 12.54 11.40 8.57 2.75 0.64
Change(Xpost-Xpre) 5.4 6.9 1.14 5.74 57.68 6.34 1.46 7.24 -0.15 -13.59
43
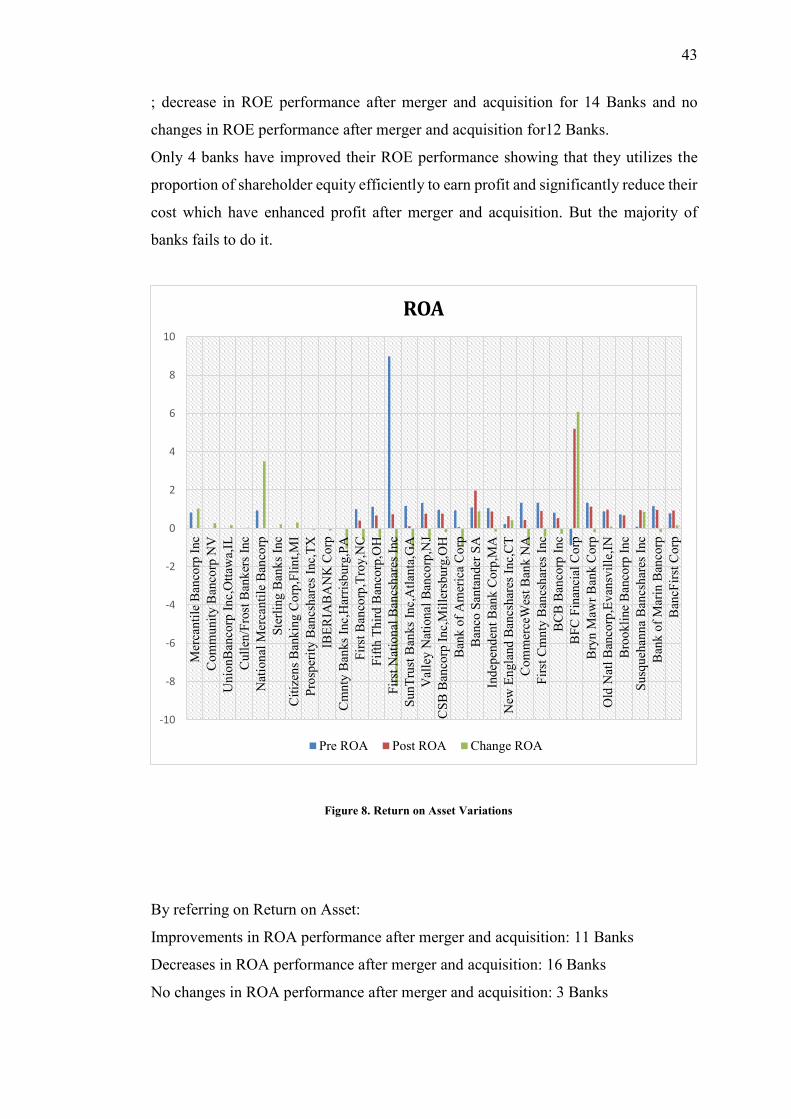
; decrease in ROE performance after merger and acquisition for 14 Banks and no
changes in ROE performance after merger and acquisition for12 Banks.
Only 4 banks have improved their ROE performance showing that they utilizes the
proportion of shareholder equity efficiently to earn profit and significantly reduce their
cost which have enhanced profit after merger and acquisition. But the majority of
banks fails to do it.
Figure 8. Return on Asset Variations
By referring on Return on Asset:
Improvements in ROA performance after merger and acquisition: 11 Banks
Decreases in ROA performance after merger and acquisition: 16 Banks
No changes in ROA performance after merger and acquisition: 3 Banks
-10
-8
-6
-4
-2
0
2
4
6
8
10
Mer
can
tile
Ban
corp
Inc
Com
mu
nit
y B
anco
rp N
V
Un
ionB
anco
rp I
nc,
Ott
awa,
IL
Cull
en/F
rost
Ban
ker
s In
c
Nat
ion
al M
erca
nti
le B
anco
rp
Ste
rlin
g B
ank
s In
c
Cit
izen
s B
ank
ing C
orp
,Fli
nt,
MI
Pro
sper
ity
Ban
csh
ares
Inc,
TX
IBE
RIA
BA
NK
Co
rp
Cm
nty
Ban
ks
Inc,
Har
risb
urg
,PA
Fir
st B
anco
rp,T
roy
,NC
Fif
th T
hir
d B
anco
rp,O
H
Fir
st N
atio
nal
Ban
csh
ares
Inc
Su
nT
rust
Ban
ks
Inc,
Atl
anta
,GA
Val
ley N
atio
nal
Ban
corp
,NJ
CS
B B
anco
rp I
nc,
Mil
lers
bu
rg,O
H
Ban
k o
f A
mer
ica
Co
rp
Ban
co S
anta
nder
SA
Ind
epen
den
t B
ank
Co
rp,M
A
New
En
gla
nd
Ban
csh
ares
In
c,C
T
Com
mer
ceW
est
Ban
k N
A
Fir
st C
mn
ty B
ancs
har
es I
nc
BC
B B
anco
rp I
nc
BF
C F
inan
cial
Co
rp
Bry
n M
awr
Ban
k C
orp
Old
Nat
l B
anco
rp,E
van
svil
le,I
N
Bro
okli
ne
Ban
corp
In
c
Su
squ
ehan
na
Ban
csh
ares
Inc
Ban
k o
f M
arin
Ban
corp
Ban
cFir
st C
orp
ROA
Pre ROA Post ROA Change ROA

44
11 Banks showed improvements in ROA. Those banks have used more assets to earn
profits. 16 banks need to acquire more assets from other organizations and utilize them
in an efficient way to earn more profits.
Figure 9. Total liabilities /Total assets variations
By referring on the Liabilities/Assets:
Improvements in L/A Performance after merger and acquisition: 11 Banks
Decreases in L/A performance after merger and acquisition: 12 Banks
No changes in L/A performance after merger and acquisition: 7 Banks
-100
-80
-60
-40
-20
0
20
40
60
80
100
120
Mer
can
tile
Ban
corp
Inc
Com
mu
nit
y B
anco
rp N
V
Un
ionB
anco
rp I
nc,
Ott
awa,
IL
Cull
en/F
rost
Ban
ker
s In
c
Nat
ion
al M
erca
nti
le B
anco
rp
Ste
rlin
g B
ank
s In
c
Cit
izen
s B
ank
ing C
orp
,Fli
nt,
MI
IBE
RIA
BA
NK
Co
rp
Pro
sper
ity
Ban
csh
ares
Inc,
TX
Cm
nty
Ban
ks
Inc,
Har
risb
urg
,PA
Fir
st B
anco
rp,T
roy
,NC
Fif
th T
hir
d B
anco
rp,O
H
Fir
st N
atio
nal
Ban
csh
ares
Inc
Su
nT
rust
Ban
ks
Inc,
Atl
anta
,GA
Val
ley N
atio
nal
Ban
corp
,NJ
CS
B B
anco
rp I
nc,
Mil
lers
bu
rg,O
H
Ban
k o
f A
mer
ica
Co
rp
Ban
co S
anta
nder
SA
Ind
epen
den
t B
ank
Co
rp,M
A
New
En
gla
nd
Ban
csh
ares
In
c,C
T
Com
mer
ceW
est
Ban
k N
A
Fir
st C
mn
ty B
ancs
har
es I
nc
BC
B B
anco
rp I
nc
BF
C F
inan
cial
Co
rp
Bry
n M
awr
Ban
k C
orp
Old
Nat
l B
anco
rp,E
van
svil
le,I
N
Bro
okli
ne
Ban
corp
In
c
Su
squ
ehan
na
Ban
csh
ares
Inc
Ban
k o
f M
arin
Ban
corp
Ban
cFir
st C
orp
Liabilities/Assets
Pre(%) Post(%) Change(Xpost-XPre)
45
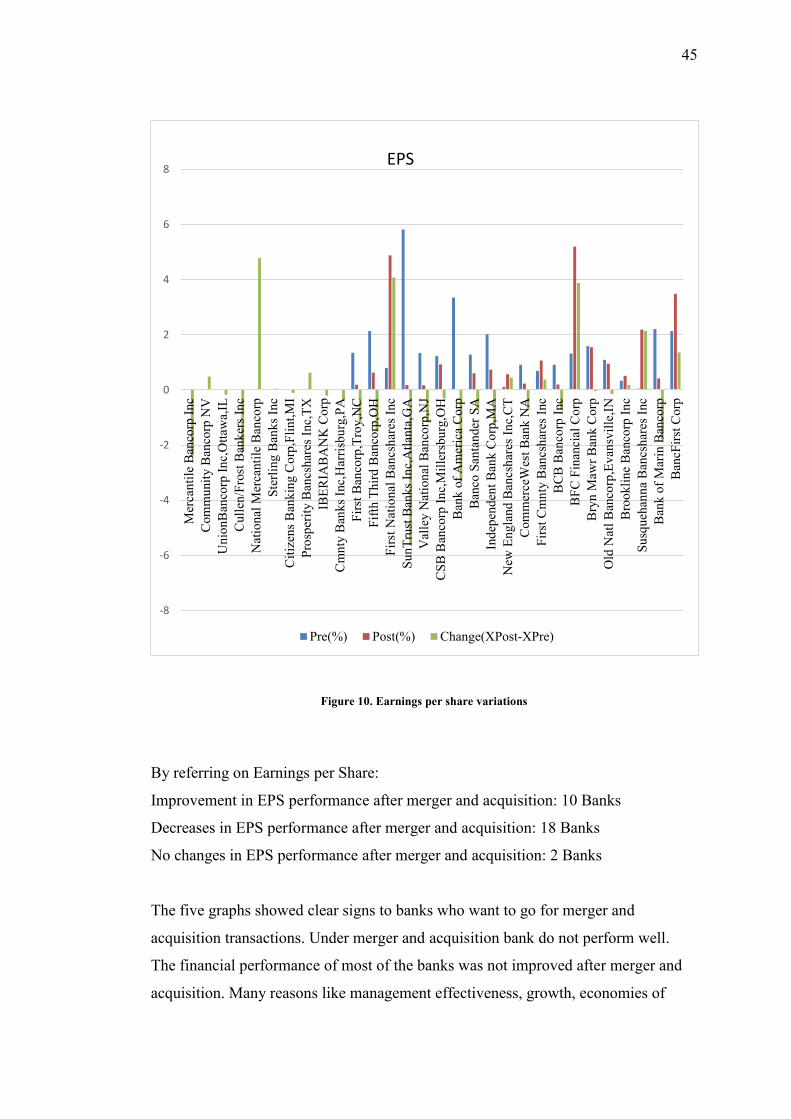
Figure 10. Earnings per share variations
By referring on Earnings per Share:
Improvement in EPS performance after merger and acquisition: 10 Banks
Decreases in EPS performance after merger and acquisition: 18 Banks
No changes in EPS performance after merger and acquisition: 2 Banks
The five graphs showed clear signs to banks who want to go for merger and
acquisition transactions. Under merger and acquisition bank do not perform well.
The financial performance of most of the banks was not improved after merger and
acquisition. Many reasons like management effectiveness, growth, economies of
-8
-6
-4
-2
0
2
4
6
8M
erca
nti
le B
anco
rp I
nc
Com
mu
nit
y B
anco
rp N
V
Un
ionB
anco
rp I
nc,
Ott
awa,
IL
Cull
en/F
rost
Ban
ker
s In
c
Nat
ion
al M
erca
nti
le B
anco
rp
Ste
rlin
g B
ank
s In
c
Cit
izen
s B
ank
ing C
orp
,Fli
nt,
MI
Pro
sper
ity
Ban
csh
ares
Inc,
TX
IBE
RIA
BA
NK
Co
rp
Cm
nty
Ban
ks
Inc,
Har
risb
urg
,PA
Fir
st B
anco
rp,T
roy
,NC
Fif
th T
hir
d B
anco
rp,O
H
Fir
st N
atio
nal
Ban
csh
ares
Inc
Su
nT
rust
Ban
ks
Inc,
Atl
anta
,GA
Val
ley N
atio
nal
Ban
corp
,NJ
CS
B B
anco
rp I
nc,
Mil
lers
bu
rg,O
H
Ban
k o
f A
mer
ica
Co
rp
Ban
co S
anta
nder
SA
Ind
epen
den
t B
ank
Co
rp,M
A
New
En
gla
nd
Ban
csh
ares
In
c,C
T
Com
mer
ceW
est
Ban
k N
A
Fir
st C
mn
ty B
ancs
har
es I
nc
BC
B B
anco
rp I
nc
BF
C F
inan
cial
Co
rp
Bry
n M
awr
Ban
k C
orp
Old
Nat
l B
anco
rp,E
van
svil
le,I
N
Bro
okli
ne
Ban
corp
In
c
Su
squ
ehan
na
Ban
csh
ares
Inc
Ban
k o
f M
arin
Ban
corp
Ban
cFir
st C
orp
EPS
Pre(%) Post(%) Change(XPost-XPre)

46
scale, diversification were quoted to support merger and acquisition proposals. Some
of those reasons showed to be reasonable and in favor of value creation. Some
reasons can be stated to explain the failure in merger and acquisition to improve the
financial performance of other banks. The failure to reduce the costs, financial crisis
or the fact that investors or other customers were unware about merger and
acquisition strategies.

47
6. Conclusion
Theoretically it is needed to adopt the strategy of mergers and acquisitions to compete
in a dynamical business environment. Many researchers worked on the mergers and
acquisitions to determine their impact on corporate sectors in USA. Houston et Al
(2001) showed that in USA banking sector the financial performance increased after
merger and acquisition regarding their productivity, profitability and shareholder’s
value. While other studies such as Robert M Adams (2012) found that mergers and
acquisitions are far from having proved their economics effectiveness and there is no
increase in financial performance of banks after mergers and acquisitions.
The study attempted to assess the effect of merger and acquisition on the performance
of selected bidder bank in USA. The result showed no changes in financial
performance leading to no improvements in financial efficiency. This was indent with
the Wilcoxon signed-rank test statistic results of the sewn selected banks as contained
in the R studio output depicted. On the given evidence of the studied variable we are
not in position to accept alternative hypothesis for return on assets, return on equity,
capital ratio, earnings per share and liabilities to assets ratio. So we have to accept the
null hypothesis because their P value are insignificant i.e. (0.5104; 0.6263; 0.0961;
0.2988; 0.7892) respectively. All these values are compared at 5% significance level.
From above analysis we infer that the purpose of the merger and acquisition in
improving performance is not properly achieved for those banks. The obtained results
tend to confirm opinion of Beitel et AL (2003) that there is little empirical evidence of
mergers and acquisitions to achieve growth or important performance gains.
Nevertheless the study must be carried in large scale and more financial ratios such as
net interest income, spread ratio, interest expenses to interest income, cash&cash
equivalent to total asset and debt ratio. The biggest limitation of the study is the
unavailability of all financial information required to calculate all financial ratios.

48
REFERENCES
Abbas et Al. (2014). Financial performance of banks in Pakistan after merger &
acquisition. Journal of Global Entrepreneurship Research 4(13), 2-13.
Akhavein J.D., A.N.Berger and D.B.Humphrey (1997). The effects of mega mergers
on the efficiency and prices: Evidence from a bank profit function. Review of Industrial
Organization Nº 12. New York University: USA.
Altunbas, Y.Ibanez DM (2004). Mergers and Acquisitions and bank performances in
Europe: The role of strategic similarities. Working Paper Series Nº 398. European
Central Bank: Frankfurt.
Beitel, P.Schiereck D, Wahrenbur, M. (2003). Explaining the M&A success in
European bank mergers and acquisitions. Center for Financial Studies Working Paper
Series. Johann Wolfgang Goethe University: Frankfurt
Berger, A.N. (2002). The integration of the financial service industry: Where are the
efficiencies? North American Actual Journal, Nº 4.
Berger, A.N. (2003). The efficiency effects of a single market for the financial service
in Europe. European Journal of Operational Research Nº 150.
B.Barry Massoudi (February 10, 2006). 35 Success Factors for Mergers and
Acquisitions. Continental Publishers LLC: SEATTLE.
Brighman, EF. & Ehrhardt, CM (2005). Financial Management: Theory and Practice (eleventh edition). South-western Cengage learning: USA.
Brouthers, K., P.Van Hastenburg, and J.Van Denven (1998). If most mergers fail why
are they so popular? Long Range Planning, 31, pp.137-152. Elsevier sciences Ltd:
Great Britain.
Bryan Coyle. (2000). Mergers and Acquisitions. New York: Glencake Publishing
Company.
Berea, A.O. (2001).Bank Strategy. Expert Publishing House: Ukraine.
Bleoju, G. (2010). Financial Bank Management: Notes of Course. Europlus
Publishing. House Galati: Romania
Cording, M., Christman, P.king, D.R. (2008). Reducing causal ambiguity in
acquisition integration: Intermediate goals as mediators of integration decisions and
acquisition performance. Academy of Management Journal.
Dobocan, C.R. (2010). Merger and Acquisition Strategies: Practical Study Regarding
the Measurement of their Impact in Romanian Economy. Babes-Balyai University
2010, Faculty of Economics and Business Administration, Cluj-Napoca, Romania.
Available at:

49
<http://doctorat.ubbcluj.ro/sustinerea_publica/rezumate/2010/management/Dobocan
_Ciprian_EN.pdf>.
Drucker P. (2001). Strategic Management. Teora Publishing House: Bucharest.
Gluger, K. and B Yurtoglu (2008). The effects of Mergers on company employment
in the USA and Europe, International Journal of Industrial Organization 22(4), 481-
502.
Gjirja, M (2001). Effects of deregulation and banking crisis on the labor of use
efficiency in the Swedish banking industry. European Workshop on Efficiency and
Productivity Analysis7EWEPA. Oviedo: Spain.
Gomes, E., Angwin, D.N. & Melahi,K (2012). HRM throughout the mergers and
acquisitions (M&A) process: A study of domestic deals in the Nigerian Banking
industry, International Journal of Human Resource Management,(Forth Coming).
Houston, JF James, CM. & Ryngaert, MD (2001).Where do mergers gains come from?
Bank mergers from the perspective of insider and outsider, Journal of Financial
Economics, 60,285-331.
Juha-Pekka Kallunki (2015). Analysis of Profitability, Leverage and Growth. Advance
Firm Valuation .Oulu University 2015, Oulu Business School: Finland.
Kemal, UM. (2011). Post merger profitability: A case of Royal Bank Scotland
(RBS). International Journal of Business and Social science, 5(2), 157-162.
Lin, BW, Hung, SC. & Li, Pc (2006). Mergers and acquisitions as a human resources
strategy. International Journal of Manpower, 27(2), 126-142.
Onaolapo Adekunle & Ajala Oladayo (2012). Effects of mergers and acquisitions on
the performance of selected commercial banks in Nigeria. International Journal of
Business and Social Research, Vol.2, Nº7.
Picot, G. (2002). Handbook of international mergers and acquisitions: Preparation,
implementation and integration. New York: Palgrave Macmillan.
Pilloff S-J.Santomero A.M. (1997). The value effects of bank mergers and
acquisitions. Work paper. Financial institution center. University of Pennyslovania,
pp.97-107.
Robert M Adams. (2012). Consolidation and Merger Activity in United States Banking
Industry from 2000 through 2010. Finance and Economics Discussion Series. Division
of Research & Statistics and Monetary Affairs. Federal Reserve Board, Washington,
D.C. Available at:
<https://www.federalreserve.gov/pubs/feds/2012/201251/201251pap.pdf>
Rym Ayidi & Georges Pujals. (2005). Banking mergers and acquisitions in the EU:
Overview, assessment and prospects. SUERF-The European money and Finance
forum 25(1), 11-18.

50
Scott Hempling. (February 2001). Mergers and Acquisitions: Competition and cost
benefits. Available at:
<http://www.scotthemplinglaw.com/files/pdf/ppr_mergers_and_acquisitions0201.pdf
Schweitzer, R. (2005). An Arranged marriage under institutional duality: The local
integration process between two globally merging MNC’s subsidiaries. Kungälv: Bas
Publishing.
Tajalli Fatima & Amir Shehzad. (2014). An analysis of the impact of merger and
acquisition of financial performance: A case of Pakistan. Journal of Poverty,
Investment and Development, Vol.5.
Ulrich Steger and Christopher kummer (2007). Why Merger and Acquisition (M&A)
waves reoccur: The vicious circle from pressure to fail. IMD International 11(3), 6-
14: Zurich.
Vander, V.R (2002). Cross-border mergers in European banking and bank efficiency.
Working paper Ghent University 152: Ghent.

51
APPENDIX. Pre and post-Performance (%)
Bank Pre ROA Pre ROE Pre EPS Pre L/A Pre CR
Mercantile Bancorp Inc. Community Bancorp NV UnionBancorp Inc, Ottawa, IL
Cullen/Frost Bankers Inc National Mercantile Bancorp
Sterling Banks Inc
Citizens Banking Corp,Flint,MI
Prosperity Bancshares Inc, TX
IBERIABANK Corp.
Cmnty Banks Inc,Harrisburg,PA
First Bancorp, Troy, NC
Fifth Third Bancorp, OH First National Bancshares Inc
SunTrust Banks Inc,Atlanta,GA
0.83
0.94
0.65
1.38 0.93
0.63
1.10
1.33
0.38
1.12
1
1.13
8.98
1.17
9.98
7
7.06
11.75
10.74
6.20
12.86
1.33
2.9
14.23
11.83
12.1
49.39
12.3
4.24
1.13
1.14
3.52
1.02
0.11
0.49
1.79
1.23
0.43
1.35
2.14
0.8
5.82
91.41
86.49
89.51
88.27
91.34
90
91.53
86.85
87.04
85.70
90.65
90.04
94.2
90.22
8.26
13.51
10.49
11.73
8.66
9.97
8.47
12.96
13.15
14.30
9.34
9.32
18.18
11,11

52
Valley National Bancorp, NJ
CSB Bancorp Inc,Millersburg,OH
Bank of America Corp.
Banco Santander SA
Independent Bank Corp, MA
New England Bancshares Inc,CT
CommerceWest Bank NA First Cmnty Bancshares Inc
BCB Bancorp Inc
BFC Financial Corp
Bryn Mawr Bank Corp Old Natl Bancorp,Evansville,IN
Brookline Bancorp Inc Susquehanna Bancshares Inc
Bank of Marin Bancorp
BancFirst Corp
1.33
0.97
0.94
1.09
1.05
0.22
1.34
1.34
0.82
– 0.88
1.34
0.89
0.73
0.09
1.16
0.78
17.24
8.95
11.08
21.91
12.93
1.4
10.2
13.31
8.82
– 40.18
13.73
10.1
3.94
2.19
11.46
7.7
1.34
1.23
3.35
1.28
2.02
0.12
0.92
0.69
0.92
1.32
1.59
1.09
0.33
0.05
2.21
2.13
89.08
89.28
91.44
95.29
92.03
86.73
87.29
89.9
90.68
93.96
90.98
91.97
81.37
85.53
90.28
90.24
8.1
10.96
8.56
12.7
7.96
13.26
12.92
10.98
9.32
17.65
9.02
8.03
18.63
14.47
9.7
9.75
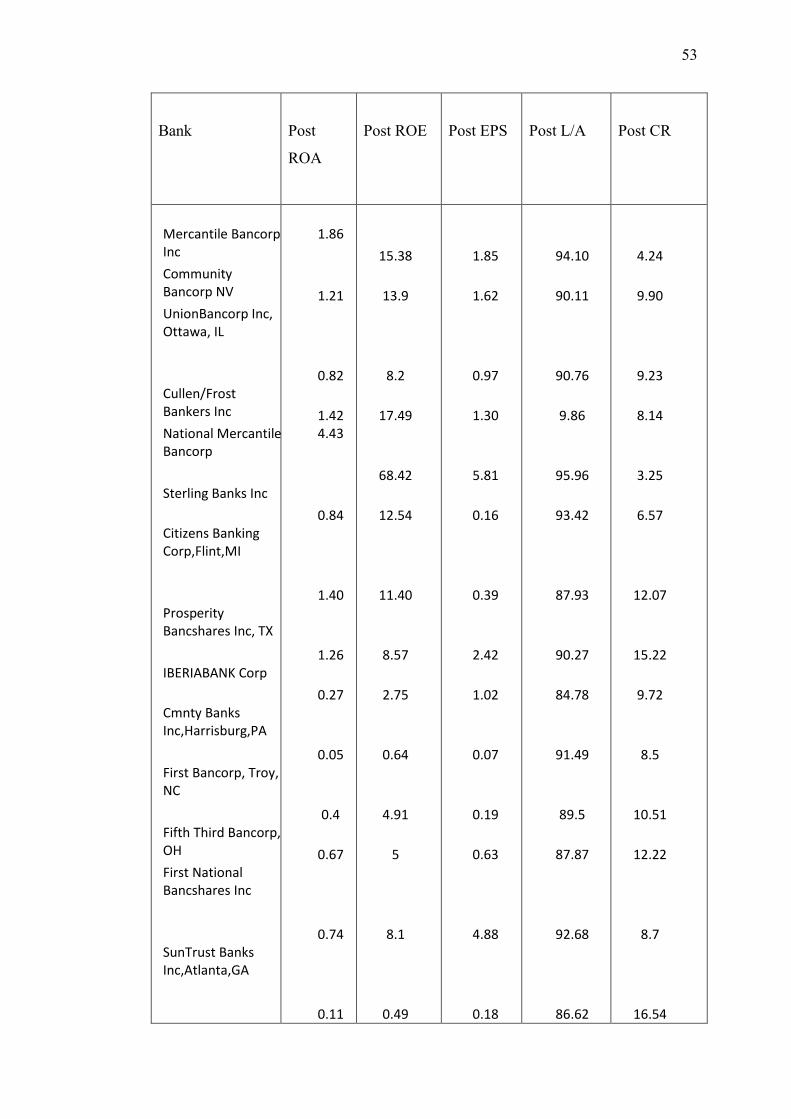
53
Bank Post
ROA
Post ROE Post EPS Post L/A Post CR
Mercantile Bancorp Inc Community Bancorp NV UnionBancorp Inc, Ottawa, IL
Cullen/Frost Bankers Inc National Mercantile Bancorp
Sterling Banks Inc
Citizens Banking Corp,Flint,MI
Prosperity Bancshares Inc, TX
IBERIABANK Corp
Cmnty Banks Inc,Harrisburg,PA
First Bancorp, Troy, NC
Fifth Third Bancorp, OH First National Bancshares Inc
SunTrust Banks Inc,Atlanta,GA
1.86
1.21
0.82
1.42 4.43
0.84
1.40
1.26
0.27
0.05
0.4
0.67
0.74
0.11
15.38
13.9
8.2
17.49
68.42
12.54
11.40
8.57
2.75
0.64
4.91
5
8.1
0.49
1.85
1.62
0.97
1.30
5.81
0.16
0.39
2.42
1.02
0.07
0.19
0.63
4.88
0.18
94.10
90.11
90.76
9.86
95.96
93.42
87.93
90.27
84.78
91.49
89.5
87.87
92.68
86.62
4.24
9.90
9.23
8.14
3.25
6.57
12.07
15.22
9.72
8.5
10.51
12.22
8.7
16.54
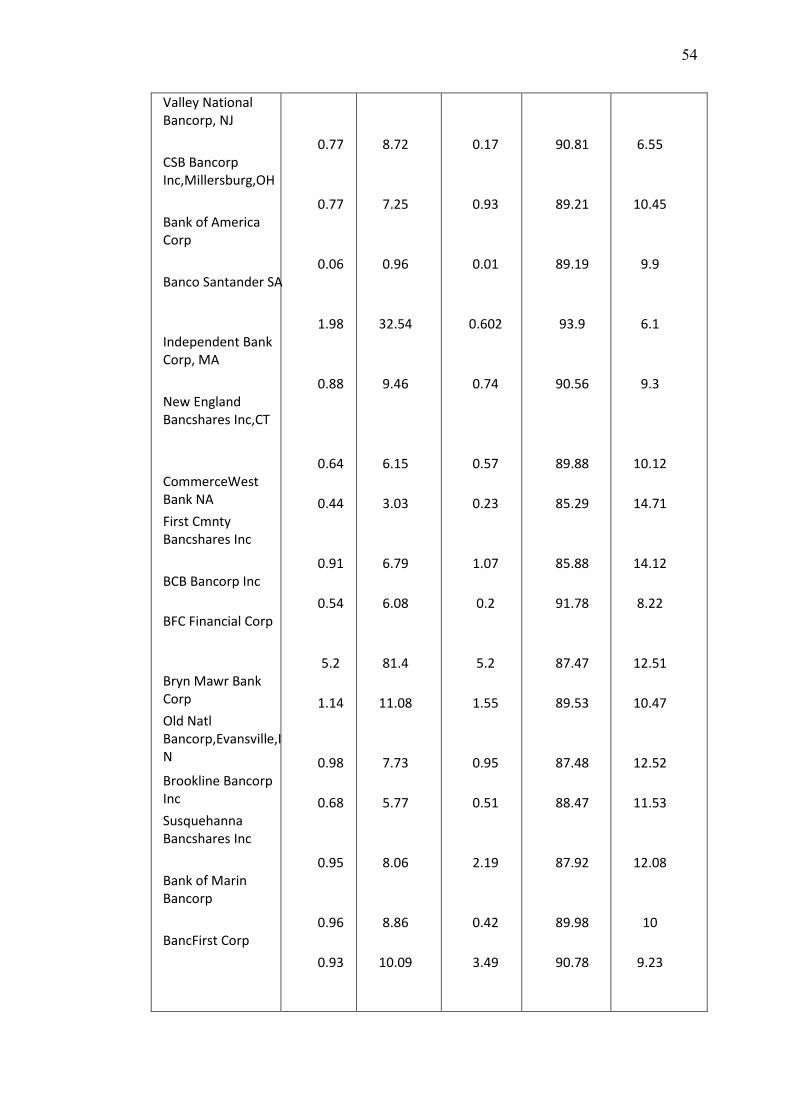
54
Valley National Bancorp, NJ
CSB Bancorp Inc,Millersburg,OH
Bank of America Corp
Banco Santander SA
Independent Bank Corp, MA
New England Bancshares Inc,CT
CommerceWest Bank NA First Cmnty Bancshares Inc
BCB Bancorp Inc
BFC Financial Corp
Bryn Mawr Bank Corp Old Natl Bancorp,Evansville,IN
Brookline Bancorp Inc Susquehanna Bancshares Inc
Bank of Marin Bancorp
BancFirst Corp
0.77
0.77
0.06
1.98
0.88
0.64
0.44
0.91
0.54
5.2
1.14
0.98
0.68
0.95
0.96
0.93
8.72
7.25
0.96
32.54
9.46
6.15
3.03
6.79
6.08
81.4
11.08
7.73
5.77
8.06
8.86
10.09
0.17
0.93
0.01
0.602
0.74
0.57
0.23
1.07
0.2
5.2
1.55
0.95
0.51
2.19
0.42
3.49
90.81
89.21
89.19
93.9
90.56
89.88
85.29
85.88
91.78
87.47
89.53
87.48
88.47
87.92
89.98
90.78
6.55
10.45
9.9
6.1
9.3
10.12
14.71
14.12
8.22
12.51
10.47
12.52
11.53
12.08
10
9.23
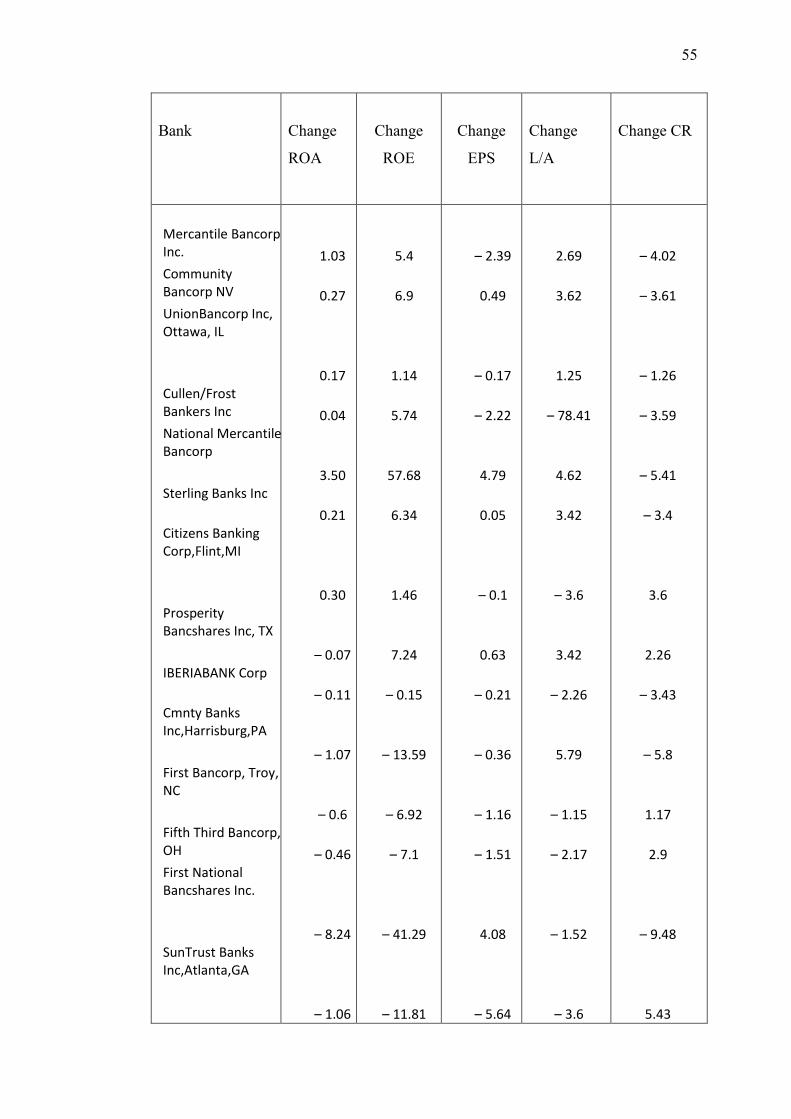
55
Bank Change
ROA
Change
ROE
Change
EPS
Change
L/A
Change CR
Mercantile Bancorp Inc. Community Bancorp NV UnionBancorp Inc, Ottawa, IL
Cullen/Frost Bankers Inc National Mercantile Bancorp
Sterling Banks Inc
Citizens Banking Corp,Flint,MI
Prosperity Bancshares Inc, TX
IBERIABANK Corp
Cmnty Banks Inc,Harrisburg,PA
First Bancorp, Troy, NC
Fifth Third Bancorp, OH First National Bancshares Inc.
SunTrust Banks Inc,Atlanta,GA
1.03
0.27
0.17
0.04
3.50
0.21
0.30
– 0.07
– 0.11
– 1.07
– 0.6
– 0.46
– 8.24
– 1.06
5.4
6.9
1.14
5.74
57.68
6.34
1.46
7.24
– 0.15
– 13.59
– 6.92
– 7.1
– 41.29
– 11.81
– 2.39
0.49
– 0.17
– 2.22
4.79
0.05
– 0.1
0.63
– 0.21
– 0.36
– 1.16
– 1.51
4.08
– 5.64
2.69
3.62
1.25
– 78.41
4.62
3.42
– 3.6
3.42
– 2.26
5.79
– 1.15
– 2.17
– 1.52
– 3.6
– 4.02
– 3.61
– 1.26
– 3.59
– 5.41
– 3.4
3.6
2.26
– 3.43
– 5.8
1.17
2.9
– 9.48
5.43

56
Valley National Bancorp, NJ
CSB Bancorp Inc,Millersburg,OH
Bank of America Corp
Banco Santander SA
Independent Bank Corp, MA
New England Bancshares Inc,CT
CommerceWest Bank NA First Cmnty Bancshares Inc
BCB Bancorp Inc
BFC Financial Corp
Bryn Mawr Bank Corp Old Natl Bancorp,Evansville,IN
Brookline Bancorp Inc Susquehanna Bancshares Inc
Bank of Marin Bancorp
BancFirst Corp
– 0.56
– 0.2
– 0.88
0.89
– 0.17
0.42
– 0.9
– 0.43
– 0.28
6.08
– 0.2
0.09
– 0.05
0.86
– 0.2
0.15
– 8.52
– 1.7
– 10.12
10.63
– 3.47
4.75
– 7.17
– 6.52
– 2.74
121.58
– 2.65
– 2.37
1.83
5.87
– 2.6
2.39
– 1.17
– 0.3
– 3.34
– 0.678
– 1.28
0.45
– 0.69
0.38
– 0.72
3.88
– 0.04
– 0.14
0.18
2.14
– 1.79
1.36
1.73
– 0.07
– 2.25
– 1.39
– 1.47
3.15
– 2
– 4.02
1.1
– 6.49
– 1.45
– 4.49
7.1
2.39
– 0.3
0.54
– 1.55
– 0.51
1.34
– 6.6
1.34
– 3.14
1.79
3.14
– 1.1
– 5.14
1.45
4.49
– 7.1
– 2.39
0.3
– 0.52

57