YMFG:Annual Report>2020 all
64
ANNUAL REPORT 2020 For the year ended March 31, 2020 Co-Creating a Bountiful Future for Our Region
Transcript of YMFG:Annual Report>2020 all

ANNUAL REPORT 2020For the year ended March 31, 2020
Co-Creating a Bountiful Future for Our Region

1 YMFG Annual Report 2020
Disclaimer Regarding Forward-Looking StatementsThe forward-looking statements in this Annual Report are based on management’s assumptions and beliefs in light of information available as of the date of publication, and involve both known and unknown risks and uncertainties. Actual fi nancial results may differ materially from those presented in this document, being dependent on a number of factors.
Yamaguchi Financial Group
Holding Company
Yamaguchi Bank
Banking businessNetworks in Japan:
131 (109 head offi ce and branch offi ces,
22 sub-branch offi ces)
Networks in overseas:
4 (3 branch offi ces, 1 representative offi ce)
YM Securities
Securities business
YM Asset Management
Investment management business
YM Consulting
Consulting business
Data Qvic
Data consulting and media businesses
Sanyu
Real estate leasing business
Momiji Card
Credit-card business
HOKEN HIROBA
Insurance and banking agency businesses
Yamagin Card
Credit-card business
YMFG Zone Planning
Research study of the region/Consulting business
YM Guarantee
Credit guarantee business
Momiji Estate
Real estate leasing business
YM Life Planning
Insurance and banking agency businesses
Izutsuya Withcard
Credit-card business
YM Career
Job placement business
YM Lease
Leasing business
YM Saison
Credit-card and other product planning and
developing business
Momiji Bank
Banking businessNetworks in Japan:
111 (98 head offi ce and branch offi ces,
13 sub-branch offi ces)
Kitakyushu Bank
Banking businessNetworks in Japan:
37 (37 head offi ce and branch offi ces)
Contents
YMFG Profi le .........................................................................1
Message from the Management ............................................3
YMFG Medium-Term Management Plan 2019 ........................4
Business Model ......................................................................5
Performance Highlights (YMFG) .............................................7
Performance Highlights (Three Banks) ....................................9
YMFG Forecast for the Fiscal Year Ending March 31, 2021 ...10
Overseas Networks ..............................................................11
Corporate Governance .........................................................12
Internal Audits and Compliance System ...............................13
Risk Management System ....................................................14
Business and Other Risks ......................................................15
Financial Section ..................................................................18
Group Companies
YMFG Profile (As of July 1, 2020)

YMFG Financial Highlights (For the fiscal year ended March 31, 2020)
¥10.6trillion
¥9.6trillion
12.62%
1.28%
¥25.4billion
¥7.7trillion
12.44%
A (Stable)R & I
Total Assets(Consolidated)
Total assets on a consoli-
dated Group basis amounted
to ¥10.6 trillion.
Deposit Balance(Three Banks)
Liquid deposits and time
and savings deposits
were robust.
Capital Ratio(Basel 3)(Consolidated)
This represented a year-on-
year decrease of 1.00 per-
centage point.
Non-Performing Loan Ratio(Three Banks)
Our non-performing loan
ratio up 0.03 percentage
point.
Net Income(Consolidated)
Net income increased ¥2.2
billion year on year, to
¥25.4 billion.
Balance of Loans(Three Banks)
Principal contributors to the
increase were rises in hous-
ing loans and loans to small
and medium-sized enter-
prises.
Tier 1 Ratio(Basel 3)(Consolidated)
This ratio was down 1.14
percentage point.
Credit Rating(YMFG)
Date of rating announce-
ment: October 24, 2019
trillion
trillion
%
%
billion
trillion
%
(Stable)R & I
YMFG Annual Report 2020 2

Message from the Management
Thank you for your continued support of the
Yamaguchi Financial group (“YMFG”).
The regional economy is affected by declining
childbirth and aging populations, the outflow of
young people into urban areas and a shortage
of workers to shoulder operations, as well as the
growing novel coronavirus disease (COVID-19)
pandemic. Amid these circumstances, expectations
are mounting and regional financial institutions
are being called upon to play an even greater role
in regional economic development by helping to
invigorate local companies and industries, ensure
employment and bolster the sustainability of the
regional economy.
Furthermore, the environment in which we operate
as a regional financial institution is characterized by
growing demand for new financial services. At the
same time, we are exposed to risks in a host of areas
that go beyond industry boundaries. These include
the emergence of fintech, further advances in AI and
other new technologies, and an ongoing move away
from the use of cash.
In this environment, in the fiscal year ended March
31, 2019 we formulated YMFG’s 2019 medium-term
management plan, which we launched in the aim
of further growth. Under the mission of “working
with intention to co-create a bountiful future for
our region,” we aim to go beyond the boundaries
of finance to address the social issues facing our
region, maintaining an awareness closely attuned
to businesses. To convert into a company that adds
value to the region, our basic goals are to “establish
a regional co-creation model” and “achieve ‘shinka’
of the financial model.”
Going forward, we will continue striving to
provide customers in the region we serve with the
best possible value-added services. By fostering the
development of the regional economy, we aim to
enhance our corporate value. We will create a stable
and highly effective corporate governance structure
for the Group and augment the transparency of
Group management to ensure accountability to our
stakeholders. We remain unyielding in our aim to
be a company that truly benefits and adds value
to the region. We look forward to your continued
patronage and support.
August 2020
Co-Creating
a Bountiful Future
for Our Region
Keisuke MukunashiPresident and Group COO
Takeshi YoshimuraChairman and
Group CEO
e
KeiPresGro
3 YMFG Annual Report 2020

ESG
SDGs/Society 5.0
Declining population and other social issues
Alternative methods for financial functions (Fintech, etc.)
By achieving the three basic goals below, realize a CSV management model for YMFG.
Basic Goal 1Establish a regional co-creation model
Trust and trustworthiness
Networks
Specialization
Further accelerate our initiatives to date, taking the regional environment and social trends into consideration
Category (consolidated) Fiscal Year Ended March 31, 2020 Fiscal Year Ending March 31, 2022(Results) (Final Year of the Plan)
ROE 3.97% 5.0% or more
Dividend payout ratio 24.0% 30% or more
Total capital ratio 12.62% 12% or more
Through our business activities, we aim to address regional social issues.In the process we aim for management focused on creating shared value (CSV),
which refers to both social value and economic value.
We aim to go beyond the boundaries of finance to address the social issues facing our region, maintaining an awareness closely attuned to businesses. We strive to be a company that adds value to the region.
Social trends Regional environment YMFG’s strengths
Goals
Basic Goals
Financial Targets
Working with intention to co-create a bountiful future for our region
Mission
External environment
We will produce a regional ecosystem for addressing regional social issues, steadily generating solutions.
We will configure an ecosystem platform to create new value by realizing numerous ecosystems.
Basic Goal 3Combine banking culture
and an entrepreneurial spirit
To create value—both economic and social—we must achieve fundamental changes in the way our employees think and act.
We will retain the best aspects of the banking culture and combine that with an entrepreneurial spirit, establishing a regional co-creation model and a financial model.
Basic Goal 2Achieve “shinka” of the financial model
From the perspectives of acting on behalf of our customers and achieving customer optimization, we will develop the business model on two fronts: deepening the model and extending it.
(Both are pronounced “shinka” in Japanese.)
Meanwhile, to extend the model we will pursue thorough digiti- zation, and expand and increase our sales area and scale of operation. As a result, we will make our existing functions more productive.
YMFG Medium-Term Management Plan 2019
YMFG Annual Report 2020 4

Business Model of the Medium-Term Management Plan
Leverage management resources in individual domains to generate
YM-CSV Model
Establish an original management model for creating shared value (CSV*) [the “YM-CSV Model”], and work to simultaneously enhance regional social value and YMFG’s economic value.
We will take the lead in arranging a “regional ecosystem” to resolve social problems the community faces and steadily yield solutions.
By implementing numerous ecosystems, we will create new regional value, converting regional weaknesses into strengths.
Regional ecosystem
YMFG
Providers ofsystem
infrastructure
Providers of goods and
services
Providers ofclient bases
Technologyproviders
Other
Resolveregional issues
Organically
Combination of banking culture
*Creating shared value: A management strategy framework. By creating shared value, targets both the economic profit-seeking activities of corporations and the generation of social value.
Establishment of a Regional Co-Creation Model
Relations withthe region
Human resourcenetwork
Regional data(integrated database)
DXRegionalnetwork
Support
5 YMFG Annual Report 2020

high levels of competitive advantage in the two models
linked
Evolution• Higher efficiency through
thorough digitalization• Greater scale
Deeper focus• Higher added value through existing functions • Permeation of a new financial model
Thoroughly review the existing banking model from a customer perspective, and target evolution and a deeper focus
Banking model
Digital data Life planningConsulting
and entrepreneurial spirit
Evolution and Deeper Focus in the Financial Model
Network withinvestee ventures
Ability to assess business feasibility(ability to evaluate organizations’ business models)
Funds
YMFG Annual Report 2020 6

Business profits from core operations increased ¥0.6 billion
year on year, to ¥29.2 billion.
Ordinary profits increased ¥3.2 billion, to ¥36.6 billion, and
net income attributable to owners of the parent amounted to
¥25.4 billion.
YMFG’s consolidated capital adequacy ratio (uniform
international standard) under Basel III was 12.62%. The total
Tier 1 capital adequacy ratio was 12.44%, and consolidated
common equity Tier I capital adequacy ratio were 12.41%.
20202018 2019
(Billions of yen)
Business Profits from Core OperationsOrdinary ProfitsNet income Attributable to Owners of the Parent
0
10
20
30
40
50
60
29.2
36.6
25.428.6
33.4
23.1
38.5
47.8
32.9
2018 20202019
(Billions of yen) (%)
0
50
100
150
200
250
45.0
10.7
44.6
100.3
48.4
13.4
32.8
94.6
45.9
13.0
31.1
90.2
0.0
0.5
1.0
1.5
2.0
2.5
Bankrupt and Quasi-Bankrupt Assets Doubtful AssetsSub-Standard Loans Non-Performing Loan Ratio
1.24 1.281.25
YMFG1.30
YMFG100.7
2018 2019 2020
(Billions of yen)Deposit Balance (Three Banks)
0
2,000
4,000
6,000
8,000
10,000
12,000
9,550.99,254.89,385.1
Note: The deposit balance includes the NCD balance.
Capital Adequacy Ratio (YMFG)
Deposit Balance (Three Banks)
Non-Performing Assets Based on the Financial Revitalization Law (Three Banks)
Performance Highlights (YMFG)
Business Profits from Core Operations/Ordinary Profits/Net Income Attributable to Owners of the Parent
2018 20202019
(%)
0
11
12
13
14
15
13.29
12.62
12.44
13.62
13.58
Capital Adequacy RatioTier I Ratio
13.29
(Basel III)
The total deposit balance at term-end was ¥9,026.2 billion, or
¥9,550.9 billion including Negotiable Certificates of Deposit
(NCDs). This came about because of the expansion of products
and services and steady marketing efforts based on solid
community relationships.
Performance during the fi scal year ended March 31, 2020
7 YMFG Annual Report 2020

Ratings for the Group companies were A (stable) for YMFG,
A+ (stable) for Yamaguchi Bank and Momiji Bank.
We have continued to provide stable dividends to our
shareholders while securing profits and reinforcing financial
health to maintain our credit strength.
In the year ended March 31, 2020, the dividend per share at
term-end was ¥12. Combined with the interim dividend of ¥12
per share, the full-year dividend amounted to ¥24 per share.(Yen)
2018 2019 2020 2021 (Forecast)
Annual dividend per share 20.0 22.0 24.0 26.0(Interim dividend) (10.0) (11.0) (12.0) (13.0)
YMFG aims to achieve its consolidated ordinary profits of
¥35.0 billion and net income attributable to owners of the
parent of ¥23.0 billion.
AAA
AA
ABBB
BB
B
CCC
CC
C
A (stable)
A+ (stable)
A+ (stable)
YMFG
Yamaguchi Bank
Momiji Bank
Rating and Investment Information, Inc.(As of October 24, 2019)
The balance of loans at term-end was ¥7,732.5 billion, as a result of active efforts to live up to the trust placed in us by our
customers by meeting healthy demand for funds.
2018 2019 2020
2,500
10,000
7,500
5,000
0
(Billions of yen)
Balance of Loans Balance of Loans in JapanBalance of Loans to Small and Medium-Sized Businesses
Balance of Personal Loans
2018 2019 2020
(Billions of yen)
0
300
600
900
1,200
1,5001,421.018.4%
1,407.418.9%
1,366.819.1%7,707.5
4,462.457.9%
7,732.57,425.9
4,339.858.4%
7,455.6
7,149.8
4,201.758.8%
7,178.4
Note: The percentages of loans to small and medium-sized businesses and personal loans are calculated on the basis of the balance of loans in Japan.
Dividend Policy (YMFG)Ratings for YMFG, Yamaguchi Bank and Momiji Bank
Balance of Loans/Balance of Personal Loans (Three Banks)
Expected Performance for the Fiscal Year Ending March 31, 2021 (YMFG)
YMFG Annual Report 2020 8

Performance Highlights (Three Banks)
2018 2019 2020
(Billions of yen)
Gross Operating IncomeBusiness Profits From Core Operations
0
20
40
60
80
53.9
23.1
52.5
21.4
54.4
23.8
2018 2019 2020
(Billions of yen)
Ordinary ProfitsNet Income
0
10
20
30
40
23.0
30.8
18.8
25.324.0
32.8
Gross Operating Income/Business Profi ts From Core Operations
Ordinary Profi ts/Net Income Capital Adequacy Ratio
(Basel III)
(%)
2018 2019 2020
Capital Adequacy Ratio
Tier I Ratio
0
12
14
16
18
20
15.10
15.2416.57
16.57
16.34
16.34
Yamaguchi Bank (Non-consolidated)
(Billions of yen)
Gross Operating Income Business Profits from Core Operations
2018 2019 20200
10
20
30
40
8.7
31.7
8.1
30.2
13.0
33.5
(Billions of yen)
Ordinary ProfitsNet Income
2018 2019 20200
3
6
9
12
15
6.37.77.7
9.69.1
12.1
(Basel III)
(%)
2018 2019 2020
Capital Adequacy Ratio
4
6
8
10
12
14
9.86 10.3110.37
Momiji Bank (Non-Consolidated)
Gross Operating Income/Business Profi ts From Core Operations
Ordinary Profi ts/Net Income Capital Adequacy Ratio
(Billions of yen)
Gross Operating Income Business Profits from Core Operations
2018 2019 20200
3
6
9
12
15
4.0
11.5
3.9
11.5
3.6
11.8
(Billions of yen)
Ordinary ProfitsNet Income
2018 2019 20200.0
1.5
3.0
4.5
6.0
4.1
5.5
2.5
3.33.4
4.7
(Basel III)
(%)
2018 2019 2020
Capital Adequacy Ratio
0
10
11
12
13
11.5211.0211.15
Kitakyushu Bank (Non-Consolidated)
Gross Operating Income/Business Profi ts From Core Operations
Ordinary Profi ts/Net Income Capital Adequacy Ratio
9 YMFG Annual Report 2020

(Billions of yen)
YMFG (Consolidated)
Fiscal Year Ending March 31, 2021
Year-on-Year Change
Ordinary profi ts 35.0 (1.6)
Net income attributable to owners of the parent 23.0 (2.4)
Yamaguchi Bank (Non-Consolidated)
Fiscal Year Ending March 31, 2021
Year-on-Year Change
Ordinary profi ts 24.5 (6.3)
Net income attributable to owners of the parent 17.5 (5.5)
Momiji Bank (Non-Consolidated)
Fiscal Year Ending March 31, 2021
Year-on-Year Change
Ordinary profi ts 7.0 (0.7)
Net income attributable to owners of the parent 5.7 (0.6)
Kitakyushu Bank (Non-Consolidated)
Fiscal Year Ending March 31, 2021
Year-on-Year Change
Ordinary profi ts 4.5 (1.0)
Net income attributable to owners of the parent 3.4 (0.7)
Note: Figures have been rounded off below the stated amounts.
YMFG Forecast for the Fiscal Year Ending March 31, 2021
As the operating environment remain adverse, we expect profi t categories to decrease
during the fi scal year ending March 31, 2021.
In the second year of our Medium-Term Management Plan 2019, we expect consolidated
ordinary profi ts for the YMFG Group to amount to ¥35.0 billion, down 4.4% year on year.
We also anticipate net income attributable to owners of the parent of ¥23.0 billion,
down 9.4%.
YMFG Annual Report 2020 10

2-36, 4-chome Takezaki-cho, Shimonoseki, P.O. Box 24,
Shimonoseki 750-8603, Japan SWIFT Address: YMBKJPJT
BUSAN BRANCH4F, Postal Insurance Busan Bldg., Jungang-Dong 3-Ga, 63, Jungang-Daero, Jung-Gu, Busan, Republic of KoreaSWIFT Address: YMBKKR2P
QINGDAO BRANCH2F, Crowne Plaza Hotel Qingdao, 76 Hong Kong Central Road, Qingdao, Shandong Province, The People’s Republic of ChinaSWIFT Address: YMBKCNBQ
DALIAN BRANCH14F Senmao Building No. 147, Zhongshan Road Xigang District, Dalian, Liaoning Province, The People’s Republic of ChinaSWIFT Address: YMBKCNBD
HONG KONG REPRESENTATIVE OFFICE 403, 4/F, Far East Finance Centre, 16 Harcourt Road, Hong Kong Fax: +852-28104902
Dalian
BusanQingdao
TaipeiHongKong
Ho Chi Minh
Bangkok
Hanoi
Jakarta
Yangon
Mumbai
Manila
[Korea]-Yamaguchi Bank, Busan Branch
[China]-Yamaguchi Bank Hong Kong Representative Office
[India]Business alliance:State Bank of India
[Thailand]Business Alliance: TMB BankAssigned employee: 1Business Alliance: Japan Finance Corporation (JFC)Representative Office in BangkokAssigned employee: 1
[Philippines]Business alliance: Metropolitan Bank & Trust Company
[Indonesia]Business alliance:Bank Negara Indonesia
[Taiwan, Philippines, Myanmar, Vietnam]Business alliance: Daiwa Securities Group
[Vietnam]Business alliance: Vietcombank
[Vietnam]Business alliance: HD BankAssigned employee: 1Business Alliance: AGS Joint Stock CompanyAssigned employee: 1
[Mexico]Business alliance:-State Government of Aguascalientes-State of Jalisco-State of Guanajuato-State of Nuevo Leon-Banamex
[China]-Yamaguchi Bank, Dalian Branch
[China]-Yamaguchi Bank, Qingdao Branch
International Department
Overseas Offices
Loans of overseas branches (As of March 31)
2017 2018 2020
(Millions of yen)
0
10,000
20,000
30,000
40,000
24,996
2019
29,68428,63830,498
2016
34,395
Yamaguchi Bank: The first local bank that can deal with RMB in China
Provide support to overseas business expansion by customers
through our 3 branches in Dalian, Busan, and Qingdao and a
representative office in Hong Kong Expand overseas business support
services through business alliances
with domestic and foreign financial
institutions and other companies
Overseas Networks (As of July 1, 2020)
11 YMFG Annual Report 2020

Corporate Governance
Based on its management policy of maintaining a sound and proactive enterprising spirit, YMFG aims for management transparency and fair, swift and bold decision-making that will lead to sustainable growth and increases in corporate value over the medium to long term. To this end and recognizing that creating an effective corporate governance system is an important management priority, on an ongoing basis we are pursuing the initiatives described below to enhance our corporate governance.i. We strive to ensure the rights of shareholders and create an environment
that facilitates the appropriate exercise of shareholders’ rights and substantive shareholder equality.
ii. We cooperate closely with our principal stakeholders, including customers, the local community, shareholders and employees.
iii. We diligently disclose important management-related information to our principal stakeholders.
iv. We endeavor to ensure the effectiveness of the business execution supervisory and auditing function through the establishment of various institutions, including the Board of Directors.
v. We create systems to promote constructive dialogue in order to build long-term relationships with shareholders.
The Board of Directors, consisting of 10 directors (including six outside
YMFG Corporate Governance Structure (As of July 1, 2020)
Yamaguchi Bank YM Securities YM Lease, YM Consulting, Izutsuya Withcard, Yamagin Card, YM Guarantee, Sanyu, YMFG Zone Planning, YM Asset Management, Momiji Estate, YM Life Planning, Hoken Hiroba, YM Saison, Momiji Card, Data Qvic, YM Career
Momiji Bank Kitakyushu Bank
General Meeting of Stockholders
Auditors and SupervisoryCommittee Office
Audit and Inspection Dept.
NominationCommittee
CompensationCommittee
Group CEO
Group COO Head of CEO Office
Group Executive Management Meeting
Appointment/Dismissal
Business Execution Structure
Appointment
Report
(Voluntary advisory body)
Cooperation
Cooperation
Internal Audit
Accounting Audit
Report Command
CommandCommand Command Command
CEO: Chief Executive OfficerCOO: Chief Operating officerCIO: Chief Innovation/information and Strategic Investment officerCSO: Chief Strategy Officer
Reports andRecommendation
Appointment/Dismissal Appointment/Dismissal
Accounting Auditor
Operation Departments
Company with an audit and supervisory committee
Unit COORegional Co-creation Unit
Unit COOFinancial Unit
Group CIO Strategic InnovationInvestment Business H.Q.
Group CSOCorporate Staff Division
Group ALM Committee
Group Compliance Committee
Group Risk Management Committee
Investment Project Consideration Committee
Deliberativeorgan
10 Directors (including 6 outside directors)
Board of DirectorsAudit and Supervisory Committee
3 Members (including 2 outside directors)
YMFG
Chairman and Group CEOTakeshi YoshimuraPresident and Group COOKeisuke MukunashiVice President and Unit COOKoichiro Kuno
DirectorMasao Kusunoki*DirectorYumiko Nagasawa*
DirectorNoriyuki Yanagawa*DirectorMinako Suematsu*
DirectorAudit and Supervisory Committee MemberSusumu FukudaDirectorAudit and Supervisory Committee MemberKazuo Tsukuda*DirectorAudit and Supervisory Committee MemberMichiaki Kunimasa*
* Masao Kusunoki, Yumiko Nagasawa, Noriyuki Yanagawa, Minako Suematsu, Kazuo Tsukuda and Michiaki Kunimasa are outside directors under Article 15 of Section 2 of the Companies Act.
YMFG Board of Directors and Corporate Auditors (As of July 1, 2020)
directors), makes decisions about important matters related to the Group’s management and supervises the directors. Furthermore, we have adopted the chief offi cer (CXO) system and the executive offi cer system to fortify the Board of Directors’ supervisory function and enhance the business execution function. The Nomination Committee discusses matters related to the appointment and dismissal of directors, and the Compensation Committee discusses matters related to the compensation of the directors. Both guarantee the objectivity and transparency of decision-making processes. YMFG has adopted an audit and supervisory committee system. The Audit and Supervisory Committee comprises three directors, of whom two are outside directors. The committee audit the execution of operations by directors, confi gure, audit and verify the operation of internal control systems at YMFG and its subsidiaries, and prepare audit reports. By having the Audit and Supervisory Committee, which chiefl y comprises outside directors, exercise its voting rights at Board of Directors meetings, we endeavor to reinforce its auditing and supervisory function with respect to the Board of Directors and enhance the transparency and speed of the decision-making process. The Group Executive Management Meeting, the Group Asset and Liability Management Committee, the Group Compliance Committee and the Group Risk Management Committee discuss important management issues.
YMFG Annual Report 2020 12

YMFG’s Attitude toward Compliance
YMFG shares a common understanding of their responsibilities
to fulfi ll their public mission and corporate social
responsibilities as a fi nancial group. Accordingly, we accord
topmost management priority to thorough compliance, take
the seriousness of compliance seriously and consider earning
the trust of a broad-based society our fundamental policy.
Compliance System
To ensure appropriate compliance, YMFG has established the
Compliance Management Department. In addition to ensuring
the status of compliance, this department conducts related
training for executives and employees. This department liaises
with the compliance management department of YMFG’s
subsidiaries as part of its efforts to centralize compliance
matters throughout the Group.
The Group Compliance Committee acts as a deliberative
Compliance System
Internal Audits and Compliance System
Principles of Internal Audits
We defi ne an internal audit as a series of processes for
objective verifi cation of the appropriateness and effectiveness
of internal controls (including risk management) and as
making suggestions for necessary improvements.
YMFG has devised standard internal audit rules for the
whole Group. On the basis of these rules, the internal audit
departments of each Group company implement audits.
Further, YMFG creates the Group’s medium-term internal
audit plan on the basis of its management policy and
conditions. Internal audits by the auditing bodies of each
Group company are conducted on the basis of this plan to
ensure their effectiveness and effi ciency.
Implementation of Internal Audits
YMFG’s Audit and Inspection Dept. plans audit processes
for the whole Group, implements audits and supervises each
Group company’s internal audits.
The YMFG Audit and Inspection Dept. devises the rules
and medium-term plans for the Group’s internal audits,
implements audits of the Group companies’ compliance/risk
management departments and checks the accuracy of the
fi nancial statements of the Group companies.
Internal audits of front-line sales outlets are performed to
verify the status of compliance and risk management functions
and ensure their mutual effectiveness.
The department monitors and gives guidance and advice
to the Group companies’ audit and inspection departments.
On the basis of their audit reports, the department reports on
the internal audits of the Group to the Board of Directors and
audit and supervisory committee.
Internal Audits
body of YMFG. We also formulate compliance programs for
each fi scal year, which equate to specifi c execution plans, and
monitor the status of program implementation.
Efforts to Prevent Money Laundering
The Act on Punishment of Organized Crimes and Control of
Crime Proceeds and the Law for Prevention of Transfer of
Criminal Proceeds prescribes heightened measures to prevent
money laundering. The Group’s efforts are appropriate and in
conformance with these regulations, in keeping with our aim
of maintaining society’s trust in us as a fi nancial institution.
Specifi cally, we have formulated a policy of controls and
procedures reasonably designed to prevent and detect money
laundering/terrorist fi nancing activities. We have appointed
a senior offi cer to take charge of this policy and established
training programs on this topic for all management and staff.
13 YMFG Annual Report 2020

Report
Audit
Audit
Report
Audit
Audit
Audit
Audit
Audit
Group Risk Management CommitteeGroup ALM Committee
Group Executive Management Meeting
Credit RiskOperational Risk• Processing risk• System risk• Information risk• Legal risk• Tangible asset risk• Personnel risk• Money laundering and Terrorism financing risks
Rumor Risk
IndependentAuditors
RiskAdministration Dept.
RiskAdministration Dept.
Corporate PlanningDept.
Risk Administration Dept.Compliance Administration Dept.Corporate Administration Dept.IT Administration Dept.
Risk Administration Dept.
Committees
Risk ManagementControl Department
Risk Category
Risk Category
Department in Charge of Risk Management
Department in Charge of Risk ManagementRelated Departments
Operations
Audit and Inspection Dept.
(Verification of appropriate and effective
risk management)
Groupwide Risk Management
YMFG
Group ALM Committee Group Risk Management Committee
Group Executive Management Meeting
HQ departments Risk management departments
HQ departments Sections related to risk management
Operations by HQ, branches, affiliates, etc.
Credit RiskMarket RiskLiquidity Risk
Market RiskLiquidity Risk
Reputational Risk
Board of Directors Audit and Supervisory Committee
Risk Administration Dept.
YMFGCommittees
Risk ManagementControl Department
Yamaguchi Bank Momiji Bank Kitakyushu Bank
Directions on basic policies/audit system/principles
Report on riskmanagement
IndependentAuditors
Operational Risk• Processing risk• System risk• Information risk• Legal risk• Tangible asset risk• Personnel risk• Money laundering and Terrorism financing risks
AuditCompliance, Risk Control HeadquartersControl Headquarters
Board of Directors Audit and Supervisory Committee
YM Securities, YM Lease, Izutsuya Withcard, YM Consulting, Sanyu, Momiji Estate, Yamagin Card, YM Guarantee, YMFG Zone Planning, YM Asset Management, YM Life Planning, Hoken Hiroba, Data Qvic, YM Saison, Momiji Card, YM Career
YMFG faces all kinds of risks that have become more
diversified and complex along with changes in the economy
and in society. Risk management is one of the most important
issues facing the Group.
As part of our basic risk management policy, we have devised
standard risk management rules that apply to the Group.
The Group has organized risk management sections,
risk management departments, Group Risk Management
Committee and Group Executive Management Meeting to
YMFG Risk Management System (AS of July 1, 2020)
Risk Management System
cope with risks. Risk amounts are measured by a uniform
method, capital is allocated on the basis of these methods,
and risks are collectively managed.
YMFG’s risk management sections check risk management
conditions in the whole Group.
The Audit and Inspection Department, which is independent
of the operation departments, implements internal audits
to ascertain the appropriateness and effectiveness of risk
management. This system applies both to the Group.
YMFG Annual Report 2020 14

Of the matters related to business and economic conditions outlined in the annual securities report, below are the major risks management recognizes as having the potential to materially affect the financial condition, operating performance and cash flows status of YMFG (the Bank and its consolidated subsidiaries). Recognizing this potential, YMFG strives to prevent such risk from manifesting and to respond appropriately in the event they do occur. The forward-looking items described below are those of which YMFG is aware as of the end of the fiscal year under review.
1. Credit Risk(1) Non-Performing LoansYMFG maintains sufficient allowances against non-performing loans to maintain the soundness of its assets. However, YMFG’s non-performing loans and credit expenses could increase as the result of economic movements in Japan and the local community, fluctuations in real estate values and share prices, and the management status of recipients of YMFG’s financing. Such factors could have a negative effect on operating performance and the financial condition, reducing reduce equity capital. To date, YMFG has worked diligently to move non-performing loans off the balance sheet, to write off non-performing loans appropriately, and to post sufficient allowances for doubtful accounts. However, the Group could face larger-than-expected losses when disposing of non-performing loans or incur higher-than-expected amortization. Such factors could have a negative effect on operating performance and the financial condition.
(2) Allowance for Doubtful AccountsIn accordance with predetermined standards, primarily, estimated loss amounts for the next one year and next three years are calculated for assets corresponding to normal assets and assets requiring caution. For assets classed as potentially bankrupt assets, loss amounts are stated by subtracting from lending amounts the amount of recoverable collateral or the expected amount recoverable from guarantees. However, actual losses may differ from the amounts expected when the allowance for doubtful accounts is posted. As a result, actual losses could significantly exceed expected losses, resulting in an insufficient allowance for doubtful accounts. Furthermore, worsening overall economic conditions, declines in collateral values and other unexpected factors may require the Group to revise its set standards and expected losses, resulting in the need to increase the allowance for doubtful accounts. This could have a negative effect on operating performance and the financial condition.
(3) Loans by Business Category, Geographic Region and Other FactorsFrom a risk management perspective, YMFG conducts credit management of its portfolio by rating level, business category, scale, region and other factors. However, large amounts of non-performing loans could be generated in a specific business category and, if poor business conditions in that business sector are prolonged, new corporate bankruptcies could arise. In such circumstances, YMFG’s credit expenses could increase, having a negative impact on YMFG’s operating performance and financial condition. Furthermore, as YMFG’s main bases of operation are in Yamaguchi Prefecture, Hiroshima Prefecture and the city of Kitakyushu, the Group’s operations tend to be particularly affected by regional economies. Conditions in those regional economies could therefore
Business and Other Risks
have a negative impact on YMFG’s operating performance and financial condition.
(4) Response to BorrowersIn some cases, YMFG may not exercise its legal rights even when a borrower defaults on their financial obligations, after taking into account the efficient and effective recovery of loans, among other factors. Furthermore, YMFG may support or cooperate with such borrowers in their efforts to secure additional loans. YMFG’s credit costs could rise as the result of a deterioration of the creditworthiness of such borrowers and its support, having a negative impact on YMFG’s operating performance and financial condition.
(5) Impact of COVID-19To prevent the spread of the novel coronavirus disease (COVID-19), companies are being asked to suspend operations, and people are being asked to refrain from going outdoors. This situation is affecting our region to an unprecedented degree. Given these circumstances, YMFG is working to understand the conditions of individual borrowers in a timely and appropriate manner and provide various types of support to help customers with cash flow and other aspects of business continuity, including through the application various types of support measures. However, if the operating environment were to deteriorate, credit costs could rise, having a negative impact on YMFG’s operating performance and financial condition.
2. Risks Related to the Capital Adequacy Ratio(1) Capital Adequacy RatioAs YMFG has overseas bases, it calculates a consolidated capital adequacy ratio according to uniform international standards as provided by “standards for determining whether a bank holding company’s equity capital is sufficient, after taking into account assets held by the bank holding company and its subsidiary companies, based on the provisions of Article 52-25 of the Banking Act” (Financial Services Agency Notification No. 20 of 2016). Accordingly, the consolidated capital adequacy ratio must be maintained at 8% or higher, the Tier 1 ratio at 6% or higher and the Tier 1 ratio on common shares at 4.5% or higher. YMFG’s capital adequacy ratio currently exceeds these levels. However, changes in amounts of capital stock, retained earnings and valuation differences on available-for-sales securities, as well as fluctuations in risk assets, could affect the capital adequacy ratio. Uniform international standards call for the setting of a capital conservation buffer (2.5% above individual minimums). Currently, YMFG exceeds these buffer levels. However, if it were to fall below these levels, YMFG might limit dividends and other outflows, having a negative impact on YMFG’s operating performance and financial condition. Among consolidated banking subsidiaries of YMFG, Yamaguchi Bank calculates its non-consolidated capital adequacy ratio according to uniform international standards based on “standards for determining whether a bank’s equity capital is sufficient, after taking into account assets held by the bank, based on the provisions of Article 14-2 of the Banking Act” (Financial Services Agency Notification No. 19 of 2016). Momiji Bank and Kitakyushu Bank calculate their non-consolidated capital adequacy ratios according to domestic standards, based on Financial Services Agency Notification No. 19 of 2016.
(2) Deferred Tax AssetsAs of the end of the consolidated fiscal year under review, Japanese
15 YMFG Annual Report 2020

accounting standards allow companies to record deferred tax assets as expected tax benefits to be realized in the future. Uniform international standards allow deferred tax assets related to temporary differences to be included in equity capital, up to a certain limited amount, and YMFG includes in equity capital an amount calculated in accordance with Financial Services Agency Notification No. 28 of 2012. As the balance sheet amount of deferred tax assets is based on various forecasts and assumptions, including those related to future taxable income, YMFG may reduce deferred tax assets if it decides that all or part of these deferred tax assets cannot be recovered. Such a reduction would have a negative impact on YMFG’s operating performance and financial condition and cause the capital adequacy ratio to decrease.
3. Market Risks(1) Interest Rate RiskYMFG, which engages mainly in banking operations, is affected by fluctuations in market interest rates through interest on loans—an asset investment method, yields on bond and other investments, and interest rates on deposits—a funding method. Mismatches between the amount and timing of asset investments and funding, as well as unforeseen interest rate fluctuations, may have a negative effect on YMFG’s operating performance and financial condition.
(2) Risk of Price Fluctuations on Holdings of Available-for-Sale Securities
YMFG has substantial holdings of marketable, available-for-sale securities for investment purposes. Broad-based and large-scale price declines may engender impairments or valuation losses on holdings of available-for-sale securities, which could have a negative effect on YMFG’s operating performance and financial condition and lower the capital adequacy ratio.
(3) Exchange transactionsYMFG’s operations are affected by exchange rate fluctuations. Ongoing yen appreciation reduces the value of foreign currency transactions when converted to yen. Also, certain assets and liabilities are presented in foreign currencies. If it is not possible to offset assets and liabilities denominated in foreign currencies by the same amount or hedge such differences effectively, YMFG’s operating performance and the financial condition may be negatively affected.
(4) Impact of COVID-19YMFG has in place a system to appropriately manage its holdings of available-for-sale securities. However, if financial markets deteriorate, the value of these holdings of available-for-sale securities could decrease, having a negative impact on YMFG’s operating performance and financial condition.
4. Liquidity Risks(1) Cash Flow RiskYMFG raises the majority of its funds through deposits and is therefore able to manage funds provided through a stable source of funding. However, inconsistencies between investment and funding or unexpected outflows of funds could hinder funding, rendering YMFG unable to fulfill its payment obligations on their settlement dates. Alternatively, YMFG may be compelled to raise funds at substantially higher interest rates than usual, thereby generating losses.
(2) Market Liquidity RiskMarket confusion may make it impossible for YMFG to buy and sell available-for-sale securities or it may have no alternative but to conduct such transactions at prices less favorable than usual, thereby generating losses.
(3) Risk Related to Liquidity RegulationsUniform international standards require the liquidity coverage ratio to be maintained at 100% or higher. YMFG’s liquidity coverage ratio currently exceeds this level. However, YMFG’s ratio could fall below this level due to changes in the amount of eligible liquid assets or cash outflows, having a negative impact on YMFG’s operating performance and financial condition.
5. Operational Risks(1) Administrative RiskAlthough its operations center on banking, YMFG also conducts comprehensive, regionally focused financial services including securities and credit card operations. If executives or employees were to perform operations inaccurately or if accidents or instances of fraud were to occur, in addition to direct losses YMFG could suffer a loss among customers of the trust it has cultivated over many years, consequently having a negative impact on YMFG’s operating performance and financial condition.
(2) Risk of Information LeaksYMFG retains significant information about customer deposits and loans that should not be leaked outside. The Group has in place measures to prevent outside incursions of its online and other systems. However, unexpected circumstances could result in outflows of such information. The Group stringently manages information printed on paper or stored in electronic media in accordance with information asset management regulations, but such information could be leaked outside the Group by people with malicious intent or as the result of the mishandling of information. Such situations could call into question the Group’s social responsibility and result in claims of compensation for damages. In addition, such situations could have a negative effect on operating performance and the financial condition.
(3) System RiskYMFG has measures in place to address system risk, such as computer systems going down or malfunctioning, as well as against fraudulent use and external cyberattacks. YMFG also has thorough security measures in place and manages information stringently in line with its security policy. However, the manifestation of system risk due to a disaster, the failure of equipment or telecommunication circuits or program failure could result damage or outflows of information. This situation could cause the suspension of payment functions and service operations, as well as a loss in the trust of society, negatively affecting YMFG’s operating performance and financial condition.
(4) Legal RiskYMFG strives to ensure thorough compliance and is reinforcing its systems to prevent legal violations. Nevertheless, YMFG could conduct legal violations within its various business operations, resulting in lawsuits and negatively affecting YMFG’s operating performance and financial condition.
(5) Human RiskYMFG endeavors to recruit and train competent human resources.
YMFG Annual Report 2020 16

However, the failure to recruit or train sufficient human resources could result in a decrease in competitiveness and efficiency, negatively affecting YMFG’s operating performance and financial condition.
(6) Reputational RiskNegative news reports and rumors about YMFG and the financial industry, whether true or not, could negatively affect YMFG’s operating performance, financial condition and share price.
6. Business-Related Risk(1) Risk of CompetitionThe competitive environment within the financial sector has changed substantially in recent years, due to extensive deregulation of financial systems, the restructuring of regional financial institutions and entry into the financial sector of companies from other industries. YMFG’s sales base could lose its competitive advantage against other financial institutions as a result, negatively affecting YMFG’s operating performance and financial condition.
(2) Risk of Unsuccessful Business StrategiesAlthough its operations center on banking, YMFG also conducts comprehensive, regionally focused financial services including securities and credit card operations and enacts business strategies aimed to enhance corporate value. However, greater-than-expected changes in the operating environment could prevent YMFG from generating the level of earnings it anticipates, or costs could be higher than anticipated, negatively affecting YMFG’s operating performance and financial condition. Furthermore, YMFG could fall short of its expected results if it is unsuccessful in enacting management strategies for development outlined in the YMFG Medium-Term Plan 2019, which commenced in the fiscal year ended March 31, 2020.
(3) Holding Company RiskBeing a bank holding company, the majority of YMFG’s earnings come from the dividends paid by its wholly owned subsidiaries, Yamaguchi Bank, Momiji Bank and Kitakyushu Bank. Under certain conditions, the Banking Act or the Companies Act may restrict the amounts that Yamaguchi Bank, Momiji Bank and Kitakyushu Bank can pay as dividends to YMFG. In addition, Yamaguchi Bank, Momiji Bank and Kitakyushu Bank may become unable to pay dividends to YMFG due to the insufficient posting of earnings. Their inability to pay dividends to YMFG could render YMFG unable to pay dividends.
(4) Risk of an Expanding Scale of OperationsIn line with legislative changes and deregulation, YMFG has expanded its scope of operations to take advantage of new earning opportunities. This greater scale of operations exposes YMFG to new risks. Also, these businesses may not progress as expected. As a result, YMFG’s operating performance and financial condition could be negatively affected.
7. Other Risks(1) Risk Related to Pension ObligationsDecreases in the market value or investment yield of YMFG’s pension assets or changes in the base rate used for calculating retirement benefit obligations can result in losses. Also, changes in pension plans can incur amortization expenses on past service obligations. In addition, changes in the interest rate environment and other factors can have a negative impact on the unfunded portion of retirement benefit obligations.
(2) Risk Related to Impairment of Fixed AssetsYMFG applies the “Accounting Standard for Impairment of Fixed Assets” to the fixed assets it owns. Changes in the purpose of use of these fixed assets, or decreases in profitability or asset values could lead to valuation losses, having a negative impact on YMFG’s operating performance and financial condition.
(3) Risk of Financial CrimesIn the face of rampant crimes targeting financial institutions, such as the forgery or theft of cash cards and remittance fraud, YMFG is strengthening its security measures to prevent damages due to financial crimes. However, the advent of sophisticated financial crimes could render YMFG unable to stop illegal or inappropriate transactions, leading to unexpected losses and credit losses, having a negative impact on YMFG’s operating performance and financial condition.
(4) Risk of Regulatory ChangeAs a bank holding company, YMFG is subject to restrictions and supervision under the Banking Act and is bound to operate within the restrictions in place as of the end of the consolidated fiscal year under review (including laws, regulations, policies and conventional practices). Consequently, future regulatory changes could negatively affect YMFG’s execution of operations, operating performance, financial condition and capital adequacy ratio.
(5) Risk of Credit Rating Being LoweredIf rating agencies were to lower their ratings, YMFG could be required to engage in transactions under unfavorable conditions or become unable to engage in certain transactions. This situation could have a negative impact on YMFG’s operating performance and financial condition.
(6) Compliance RiskTo encourage all executives and employees to reinforce the compliance system, each year YMFG formulates compliance program practice items and undertakes a variety of initiatives. However, if a compliance-related problem were to arise, it could cause direct losses as well as resulting in the loss of trust among customers cultivated over many years. As a result, YMFG’s operating performance and financial condition could be negatively affected.
(7) Risks Related to External FactorsExternal factors such as natural disasters (including earthquakes, storm and flood damage, and contagious diseases), man-made disasters (including terrorism and cybercrime) and technological disasters (including electrical outages and computer trouble), could result in damage to YMFG’s head office, branches and other locations, threatening YMFG’s ability to continue all or part of its operations and significantly affecting YMFG’s operations. In addition, to help prevent the recent COVID-19 pandemic from spreading, YMFG has decentralized operations at headquarters and sales branches, introduced teleworking, and adopted a time-shifted working schedule as part of its health maintenance and disease-prevention efforts. However, if the pandemic fails to subside, continues for a protracted period or increases in intensity, or if YMFG employees were to become infected, ensuring business continuity could become problematic. As a result, YMFG’s operations and financial condition could be negatively affected.
17 YMFG Annual Report 2020

YMFG Annual Report 2020 18
Financial Section
Financial Section
YMFG Business Situation ...........................................19
Consolidated Financial Statements ............................21
Notes to Consolidated Financial Statements ..............25
Independent Auditor’s Report ...................................54
Yamaguchi Bank Financial Statements ......................57
Momiji Bank Financial Statements .............................59
Kitakyushu Bank Financial Statements .......................61

19 YMFG Annual Report 2020
The Regional Economy
In the fi scal year ended March 31, 2020, the Japanese
economy was on a path of modest recovery. Toward the
end of the fi scal year, however, conditions worsened
signifi cantly due to the impact of the novel coronavirus
disease (COVID-19) pandemic. Exports and production
weakened. The employment situation, which had been
improving, was also affected, which in turn led to weaker
personal consumption.
The regional economy enjoyed a slight recovery, but
growing uncertainty toward the end of the fi scal year
brought the economy to a standstill. Bolstered by robust
domestic and overseas demand, production activity was
generally fi rm. In the second half, however, production
levels for export machinery and other items fell off as a
result of the COVID-19 pandemic. Personal consumption
weakened in the second half of the year, as demand fell
back following a surge ahead of the consumption tax
hike. Meanwhile, the manufacturing sector continued to
drive increases in capital investment, as major chemical
manufacturers invested to boost production capacity.
Against this backdrop, from the perspective of regional
invigoration and in line with their mission of contributing
to regional economic development, regional fi nancial
institutions face requests to deliver stronger fi nancial
soundness and profi tability, supply funding more fl exibly
and further enhance their fi nancial services.
YMFG Performance
Amid these fi nancial and economic conditions, supported
by its shareholders and business partners all YMFG’s
offi cers and employees were united in their efforts to
strengthen the Group’s management base, bolster
operating performance and contribute to the region.
During the year, we launched the YMFG Medium-
Term Management Plan 2019. We strove to realize the
goals of this plan, namely: “We aim to go beyond the
boundaries of fi nance to address the social issues facing
our region, maintaining an awareness closely attuned to
businesses. We strive to be a company that adds value to
the region.”
In international operations, in May 2019 the three
Group banks held the YMFG Overseas Business Seminar,
introducing the topics of “exchange rate market trends”
and “effective overseas development to address issues
facing corporate management.” Furthermore, in
September 2019 the three Group banks held the 2019
Liaoning Province China–Japan Business Meeting in
Dalian, in China’s Liaoning Province. The meeting was
held in conjunction with the Hokuhoku Financial Group
(Hokuriku Bank and Hokkaido Bank) and the Department
of Commerce of Liaoning Province. To promote overseas
expansion, we will continue to support business
development in Asia by reinforcing our Asian network.
Financial Results
On a consolidated basis, total income rose ¥12,830 million
year on year, to ¥175,423 million, due to higher gains on
the sale of Japanese government bonds and gains on the
sale of shares. Total expenses expanded ¥9,789 million,
to ¥139,065 million, mainly because of losses on the
redemption of Japanese government bonds and higher
credit costs. As a result, income before income taxes
rose ¥3,041 million, to ¥36,358 million, and net income
attributable to owners of the parent grew ¥2,242 million,
to ¥25,391 million.
Deposit amounted to ¥9,525.9 billion, up ¥295.1 billion,
due to efforts to enhance products and services to meet
increasingly diverse customer needs.
Loans and bills discounted increased ¥244.2 billion,
to ¥7,652.6 billion as of March 31, 2020, due to due to
the Group’s efforts to fulfi ll its role as a regional fi nancial
institution through its function as a fi nancial intermediary
and aggressive efforts to meet demand from business
partners with whom the Group has developed trust-
based relationships.
The Group’s holdings of securities came to ¥1,512.7
billion at year-end, up ¥114.7 billion, due to increases in
YMFG Business Situation
Summary of Business Results
YMFG Annual Report 2020 20
Millions of yen
2020
Millions of yen
2019
Millions of yen
2018
Millions of yen
2017
Thousands of U.S. dollars*1
2020
Consolidated total income 175,423 162,593 162,072 163,818 1,611,899
Consolidated net income attributable to owners of the parent
25,391 23,149 32,917 31,587 233,308
Consolidated comprehensive income (25,204) 652 47,269 37,676 (231,591)
Consolidated total net assets 630,245 660,958 660,451 617,053 5,791,096
Consolidated total assets 10,605,416 10,304,140 10,366,548 10,225,782 97,449,380
Net assets per share 2,458.73yen
2,580.74yen
2,653.60yen
2,486.35yen
22.59U.S. dollars
Current term net income per share 100.07 yen
94.65 yen
133.65 yen
128.70 yen
0.92U.S. dollars
Current term net income per share (diluted) 93.86yen
83.27yen
111.22yen
106.64 yen
0.86U.S. dollars
Capital ratio*2 12.62% 13.62% 13.29% 13.91%
Earnings on equity - increase 3.97% 3.53% 5.20% 5.31%
Group price earnings ratio 6.11 times 9.91 times 9.63 times 9.37 times
*1 US dollar amounts have been translated, for convenience only, at the rate of ¥108.83 = US$1.00 as of March 31, 2020.*2 YMFG calculated its capital ratio according to the uniform international standard (Basel 3).
Japanese national and regional government bonds. This
change refl ected investment decisions based on a polity of
enhancing profi tability for each fi scal year and across the
overall portfolio.
Total assets amounted to ¥10,605.4 billion at fi scal
year-end, up ¥301.3 billion from one year earlier. This
increase was the result of growth in loans and greater
holdings of securities.
Net assets came to ¥630.2 billion, down ¥30.7 billion
from a year earlier. The decline was due to a ¥36.0 billion
drop in unrealized gains on available-for-sale securities,
despite a ¥19.6 billion contribution due to higher profi t.
At the end of the fi scal year, the consolidated capital
adequacy ratio for the Yamaguchi Financial Group (uniform
international standard) was 12.62%. Our consolidated
total Tier 1 capital adequacy ratio was 12.44% and our
consolidated common equity Tier I capital adequacy ratio
was 12.41%.
Net cash provided by operating activities was ¥134.1
billion, a ¥381.9 billion difference from the previous year,
mainly due to the rise in negotiable certifi cates of deposit.
Net cash used in investing activities was ¥165.8 billion, a
¥505.5 billion difference from the previous year, and the
result of purchases of securities. Net cash used in fi nancing
activities was ¥39.1 billion, ¥5.4 billion more than in the
previous fi scal year, due to the redemption of bonds with
subscription rights to shares. As a result of these cash
fl ows, cash and cash equivalents at the end of the fi scal
year came to ¥944.8 billion, down ¥70.8 billion.
Yamaguchi Financial Group, Inc., Management Indices (Consolidated)

21 YMFG Annual Report 2020
ASSETSMill ions of yen
2020
Mill ions of yen
2019
Thousands of
U.S. dollars (Note 1)
2020
Assets Cash and due from banks (Notes 3, 4 and 9) ¥ 971,777 ¥ 1,043,994 $ 8,929,312 Call loans and bills purchased (Note 4) 1,088 39,042 9,997 Monetary claims bought 5,487 7,055 50,418 Trading assets (Notes 4 and 6) 1,542 1,465 14,169 Money held in trust (Notes 4 and 6) 48,412 30,565 444,841 Securities (Notes 4, 5, 6 and 9) 1,512,748 1,398,014 13,900,101 Loans and bills discounted (Notes 4, 7 and 8) 7,652,626 7,408,387 70,317,247 Foreign exchanges 20,693 18,550 190,141 Lease receivables and investment assets 19,763 18,109 181,595 Other assets (Notes 4, 6 and 9) 234,539 205,258 2,155,094 Tangible fi xed assets (Notes 10, 11, 15 and 20) 92,300 93,233 848,112 Intangible fi xed assets (Note 20) 10,679 10,927 98,126 Net defi ned benefi t asset (Note 14) 35,042 38,675 321,988 Deferred tax assets (Note 21) 18,425 1,367 169,301 Customers’ liabilities for acceptances and guarantees (Note 16) 46,098 46,547 423,578 Allowance for loan losses (65,803) (57,048) (604,640) Total assets ¥ 10,605,416 ¥ 10,304,140 $ 97,449,380
LIABILITIES AND NET ASSETS Liabilities Deposits (Notes 4 and 9) ¥ 9,525,935 ¥ 9,230,773 $ 87,530,414
Call money and bills sold (Note 9) 91,992 133,466 845,282 Payables under securities lending transactions (Note 9) 161,466 67,711 1,483,653 Trading liabilities (Notes 4 and 6) 742 568 6,818 Borrowed money (Notes 9 and 13) 27,999 29,553 257,273 Foreign exchanges 197 295 1,810 Bonds with warrants — 33,297 —Other liabilities (Notes 4 and 6) 101,336 75,448 931,142 Provision for bonuses 2,765 2,590 25,407 Net defi ned benefi t liability (Note 14) 3,930 2,906 36,111 Provision for directors’ retirement benefi ts 294 293 2,701 Provision for loss on interest repayments 10 15 92 Provision for reimbursement of deposits 1,029 1,281 9,455 Provision for customers point services 70 71 643 Provision for directors’ stock benefi ts 389 300 3,574 Reserves under special laws 28 28 257 Deferred tax liabilities (Note 21) 53 7,171 487 Deferred tax liabilities for land revaluation (Notes 15 and 21) 10,838 10,869 99,587 Acceptances and guarantees (Note 16) 46,098 46,547 423,578 Total liabilities 9,975,171 9,643,182 91,658,284
Net Assets Capital stock 50,000 50,000 459,432 (Notes 22 Capital surplus 58,656 58,685 538,969 and 23) Retained earnings 508,212 488,620 4,669,779
Treasury stock (14,321) (14,795) (131,591)Total shareholders’ equity 602,547 582,510 5,536,589 Unrealized gains on available-for-sale securities (Note 6) 9,689 45,710 89,029 Deferred losses on hedges (10,657) (1,270) (97,923)Revaluation reserve for land (Note 15) 24,455 24,526 224,707 Remeasurements of defi ned benefi t plans (2,022) 3,009 (18,579)Total accumulated other comprehensive income 21,465 71,975 197,234 Stock options (Note 24) 127 209 1,167 Non-controlling interests 6,106 6,264 56,106 Total net assets 630,245 660,958 5,791,096 Total liabilities and net assets ¥ 10,605,416 ¥ 10,304,140 $ 97,449,380
See accompanying notes.
CONSOLIDATED BALANCE SHEETSMarch 31, 2020 and 2019
Consolidated Financial Statements

YMFG Annual Report 2020 22
Mill ions of yen
2020
Mill ions of yen
2019
Thousands of
U.S. dollars (Note 1)
2020
IncomeInterest income: Interest on loans and discounts ¥ 75,941 ¥ 77,264 $ 697,795 Interest and dividends on securities 21,527 19,995 197,804 Other interest income 899 1,340 8,261 Trust fees 1 1 9 Fees and commissions 23,029 23,898 211,605 Trading income 1,304 2,316 11,982 Other operating income 34,146 24,584 313,755 Recoveries of written-off claims 15 25 138 Compensation for branch relocation 4 — 37 Other income (Note 17) 18,557 13,170 170,513 Total income 175,423 162,593 1,611,899 Expenses Interest expense: Interest on deposits 5,110 6,544 46,954 Interest on borrowings and rediscounts 3,042 2,381 27,952 Interest on bonds payable 572 664 5,256 Other interest expense 1,487 997 13,664 Fees and commissions 9,282 9,057 85,289 Other operating expenses 31,639 25,909 290,719 General and administrative expenses (Notes 18 and 24) 69,272 71,325 636,516 Impairment losses (Note 12) 144 14 1,323 Other expenses (Note 19) 18,517 12,385 170,146 Total expenses 139,065 129,276 1,277,819 Income before income taxes 36,358 33,317 334,080 Income taxes (Note 21): Current 13,250 10,637 121,750 Deferred (2,137) (646) (19,636)Net income 25,245 23,326 231,966 Net income attributable to non-controlling interests (146) 177 (1,342)Net income attributable to owners of the parent ¥ 25,391 ¥ 23,149 $ 233,308
Amounts per share of common stock:Yen
2020
Yen
2019
U.S. dollars (Note 1)
2020
Net income attributable to owners of the parent (Note 29) ¥ 100.07 ¥ 94.65 $ 0.92 See accompanying notes.
Mill ions of yen
2020
Mill ions of yen
2019
Thousands of
U.S. dollars (Note 1)
2020
Net income ¥ 25,245 ¥ 23,326 $ 231,966 Other comprehensive income (Note 26) (50,449) (22,674) (463,557) Unrealized gains (losses) on available-for-sale securities (36,031) (14,232) (331,075) Deferred gains (losses) on hedges (9,387) (1,102) (86,254) Remeasurements of defi ned benefi t plans (5,031) (7,340) (46,228)Comprehensive income (Note 26) ¥ (25,204) ¥ 652 $ (231,591) Comprehensive income attributable to owners of the parent (25,049) 489 (230,166) Comprehensive income attributable to non-controlling interests (155) 163 (1,425)
See accompanying notes.
CONSOLIDATED STATEMENTS OF INCOMEYears ended March 31, 2020 and 2019
CONSOLIDATED STATEMENTS OF COMPREHENSIVE INCOMEYears ended March 31, 2020 and 2019

23 YMFG Annual Report 2020
CONSOLIDATED STATEMENTS OF CHANGES IN NET ASSETSYears ended March 31, 2020 and 2019
Millions of yen
Shareholders’ Equity Accumulated other comprehensive income
Stock options
Non-controlling Interests
Total Net AssetsCapital
StockCapitalSurplus
RetainedEarnings
TreasuryStock
TotalShareholders’
Equity
Unrealized gains on available-for-sale
securities
Deferred losses on hedges
Revaluation reserve for
land
Remeasurements of defi ned
benefi t plans
Total accumulated
other comprehensive
income
Balance at March 31, 2018 ¥50,000 ¥60,882 ¥470,697 ¥(22,107) ¥559,472 ¥ 59,927 ¥ (168) ¥24,533 ¥10,350 ¥ 94,642 ¥ 359 ¥5,978 ¥660,451 Changes of items during the year Dividend paid (5,232) (5,232) (5,232) Net income attributable to owners
of the parent 23,149 23,149 23,149 Purchase of treasury stock (20,161) (20,161) (20,161) Disposal of treasury stock (2,468) 27,473 25,005 25,005 Reversal of revaluation reserve for land 6 6 6 Effect to capital surplus resulting
from changes in ownership interest in a subsidiary 271 271 271
Net changes of items other than shareholders’ equity (14,217) (1,102) (7) (7,341) (22,667) (150) 286 (22,531)Total changes of items during the year — (2,197) 17,923 7,312 23,038 (14,217) (1,102) (7) (7,341) (22,667) (150) 286 507 Balance at March 31, 2019 ¥50,000 ¥58,685 ¥488,620 ¥(14,795) ¥582,510 ¥ 45,710 ¥ (1,270) ¥24,526 ¥ 3,009 ¥ 71,975 ¥ 209 ¥6,264 ¥660,958 Changes of items during the year Dividend paid (5,870) (5,870) (5,870) Net income attributable to owners
of the parent 25,391 25,391 25,391 Purchase of treasury stock (339) (339) (339) Disposal of treasury stock (29) 813 784 784 Reversal of revaluation reserve for land 71 71 71 Effect to capital surplus resulting
from changes in ownership interest in a subsidiary —
Net changes of items other than shareholders’ equity (36,021) (9,387) (71) (5,031) (50,510) (82) (158) (50,750)
Total changes of items during the year — (29) 19,592 474 20,037 (36,021) (9,387) (71) (5,031) (50,510) (82) (158) (30,713)Balance at March 31, 2020 ¥50,000 ¥58,656 ¥508,212 ¥(14,321) ¥602,547 ¥ 9,689 ¥(10,657) ¥24,455 ¥ (2,022) ¥ 21,465 ¥ 127 ¥6,106 ¥630,245
Thousands of U.S. dollars (Note 1)
Shareholders’ Equity Accumulated other comprehensive income
Stock options
Non-controlling Interests
Total Net AssetsCapital
StockCapitalSurplus
RetainedEarnings
TreasuryStock
TotalShareholders’
Equity
Unrealized gains on available-for-sale
securities
Deferred losses on hedges
Revaluation reserve for
land
Remeasurements of defi ned
benefi t plans
Total accumulated
other comprehensive
income
Balance at March 31, 2019 $459,432 $539,235 $4,489,765 $(135,946) $5,352,486 $ 420,114 $(11,669) $225,360 $ 27,649 $ 661,454 $1,920 $57,549 $6,073,409 Changes of items during the year Dividend paid (53,937) (53,937) (53,937) Net income attributable to owners
of the parent 233,308 233,308 233,308 Purchase of treasury stock (3,115) (3,115) (3,115) Disposal of treasury stock (266) 7,470 7,204 7,204 Reversal of revaluation reserve for land 643 643 643 Effect to capital surplus resulting
from changes in ownership interest in a subsidiary 0
Net changes of items other than shareholders’ equity (331,085) (86,254) (653) (46,228) (464,220) (753) (1,443) (466,416)
Total changes of items during the year (266) 180,014 4,355 184,103 (331,085) (86,254) (653) (46,228) (464,220) (753) (1,443) (282,313)Balance at March 31, 2020 $459,432 $538,969 $4,669,779 $(131,591) $5,536,589 $ 89,029 $(97,923) $224,707 $(18,579) $ 197,234 $1,167 $56,106 $5,791,096
See accompanying notes.

YMFG Annual Report 2020 24
Millions of yen
2020
Millions of yen
2019
Thousands of
U.S. dollars (Note 1)
2020Cash fl ows from operating activities:
Income before income taxes ¥ 36,358 ¥ 33,318 $ 334,081 Depreciation 6,142 6,472 56,437 Impairment losses 144 14 1,323 Amortization of goodwill 355 353 3,262 Equity in earnings of affi liates (3) (10) (28)Net change in allowance for loan losses 8,754 5,358 80,437 Net change in provision for bonuses 175 (642) 1,608 Net change in defi ned benefi t asset 3,633 6,029 33,382 Net change in defi ned benefi t liability 1,024 1,109 9,409 Net change in provision for directors’ retirement benefi ts 1 14 9 Net change in provision for directors’ stock benefi ts 89 48 818 Net change in provision for loss on interest repayments (5) (8) (46)Net change in provision for reimbursement of deposits (252) (391) (2,316)Net change in provision for customers point services (1) (1) (9)Interest income (98,367) (98,599) (903,859)Interest expenses 10,211 10,586 93,825 Net gains related to securities transactions (15,667) (11,485) (143,958)Net losses (gains) from money held in trust (969) 816 (8,904)Net exchange losses (gains) 5,869 (676) 53,928 Net losses (gains) from disposition of fi xed assets 105 99 965 Net change in trading assets (77) 49 (708)Net change in trading liabilities 174 75 1,599 Net change in loans and bills discounted (244,239) (250,551) (2,244,225)Net change in deposits 128,682 138,786 1,182,413 Net change in negotiable certifi cates of deposits 166,480 (263,763) 1,529,725 Net change in borrowed money excluding subordinated loans (1,554) (246) (14,279)Net change in deposits with bank 1,444 (279) 13,268 Net change in call loans and bills purchased 39,522 39,744 363,154 Net change in call money and bills sold (41,474) 71,178 (381,090)Net change in payables under securities lending transactions 93,755 20,827 861,481 Net change in foreign exchanges (asset account) (2,143) (699) (19,691)Net change in foreign exchanges (liability account) (98) 168 (900)Net change in lease receivables and investment assets (1,654) (2,075) (15,198)Interest received 92,591 93,106 850,786 Interest paid (10,785) (10,769) (99,100)Other, net (35,671) (17,623) (327,767)
Subtotal 142,549 (229,668) 1,309,832 Income taxes paid (9,857) (18,200) (90,572)Income taxes refunds 1,359 — 12,487
Net cash used in operating activities 134,051 (247,868) 1,231,747
Cash fl ows from investing activities:Purchases of securities (3,489,606) (2,610,787) (32,064,743)Proceeds from sales of securities 3,221,245 2,779,979 29,598,870 Proceeds from maturity of securities 126,090 166,812 1,158,596 Purchases of money held in trust (64,810) (10,260) (595,516)Proceeds from sales of money held in trust 46,914 19,936 431,076 Purchases of tangible fi xed assets (2,899) (3,106) (26,638)Proceeds from sales of tangible fi xed assets 28 8 257 Purchases of intangible fi xed assets (2,720) (2,849) (24,993)
Net cash provided by investing activities (165,758) 339,733 (1,523,091)
Cash fl ows from fi nancing activities:Payments for redemption of bonds with subscription rights to shares (33,246) (9,034) (305,486)Dividends paid (5,870) (5,232) (53,937)Dividends paid to non-controlling shareholders (3) (3) (28)Purchases of treasury stock (339) (20,114) (3,115)Proceeds from disposal of treasury stock 393 395 3,612 Proceeds from sales of shares of parent held by subsidiaries — 1 —Payments for acquiring additional shares of a subsidiary that do not result in change in scope of consolidation
— (53) —
Proceeds from selling shares of a subsidiary that do not result in change in scope of consolidation
— 381 —
Net cash used in fi nancing activities (39,065) (33,659) (358,954)Effect of exchange rate changes on cash and cash equivalents (2) 7 (19)Net change in cash and cash equivalents (70,774) 58,213 (650,317)Cash and cash equivalents at the beginning of fi scal year 1,015,558 957,345 9,331,600 Cash and cash equivalents at the end of fi scal year (Note 3) ¥ 944,784 ¥ 1,015,558 $ 8,681,283
See accompanying notes.
CONSOLIDATED STATEMENTS OF CASH FLOWSYears ended March 31, 2020 and 2019

25 YMFG Annual Report 2020
1. BASIS OF PRESENTATION
Yamaguchi Financial Group, Inc. (“YMFG”) is a holding
company for The Yamaguchi Bank, Ltd. (“Yamaguchi
Bank”), Momiji Bank, Ltd. (“Momiji Bank”), The Kitakyushu
Bank, Ltd. (“Kitakyushu Bank”) and other subsidiaries.
YMFG and its consolidated subsidiaries (“the Group”)
maintain their accounts and records in accordance with
the provisions set forth in the Financial Instruments and
Exchange Law and its related accounting regulation and
in conformity with accounting principles and practices
generally accepted in Japan (“Japanese GAAP”). Japanese
GAAP are different in certain respects as to application
and disclosure requirements of International Financial
Reporting Standards.
The accompanying consolidated fi nancial statements
are a translation of the audited consolidated fi nancial
statements of YMFG which were prepared in accordance
with Japanese GAAP and were fi led with the appropriate
Local Finance Bureau of the Ministry of Finance as required
by the Financial Instruments and Exchange Law.
In preparing the accompanying consolidated fi nancial
statements, certain restructuring and reclassifi cations have
been made in the consolidated fi nancial statements issued
domestically in order to present them in a form which is
more familiar to readers outside Japan.
The consolidated fi nancial statements are stated in
Japanese yen. The translations of the Japanese yen
amounts into U.S. dollars are included solely for the
convenience of readers, using the prevailing exchange rate
at March 31, 2020, which was ¥108.83 to U.S.$1.00. Such
translations should not be construed as representations
that the Japanese yen amounts have been, could have
been, or could in the future be, converted into U.S. dollars
at this or any other rate of exchange.
2. SIGNIFICANT ACCOUNTING POLICIES
Consolidation and equity method(1) Scope of consolidation
Japanese accounting standards on consolidated
fi nancial statements require a company to consolidate
any subsidiaries of which the company substantially
controls the operations, even if it is not a majority
owned subsidiary. Control is defi ned as the power to
govern the decision-making body of an enterprise.
(i) 17 consolidated subsidiaries at March 31, 2020
and 2019.
The names of the main consolidated subsidiaries
are listed on page 1.
The scope of consolidation includes YM Career
Inc. due to its establishment in the fi scal year
ended March 31, 2020.
In addition, Kitakyushu Economics Institute, Inc.,
formerly a consolidated subsidiary, was excluded
from the scope of consolidation in the fi scal year
ended March 31, 2020 due to the merger between
Kitakyushu Economics Institute, Inc. and YMFG
Zone Planning Co., Ltd. (an absorption-type merger
in which YMFG Zone Planning Co., Ltd. was the
surviving company).
The scope of consolidation includes DATA QVIC
Inc. due to its establishment in the fi scal year
ended March 31, 2019.
(ii) One unconsolidated subsidiary at March 31, 2020
and 2019.
Name of major subsidiary:
Maple Funding Corporation
The unconsolidated subsidiary is excluded from
the scope of consolidation because its total assets,
ordinary income, net income (in proportion to
ownership), retained earnings (in proportion to
ownership) and accumulated other comprehensive
income are so immaterial that they do not hinder a
rational judgment of YMFG’s consolidated fi nancial
position and results of operations when excluded
from the scope of consolidation.
(2) Application of the equity methodJapanese accounting standards also require any
unconsolidated subsidiaries and affi liates with fi nancial
and operating policies over which YMFG is able to
Years ended March 31, 2020 and 2019
Notes to Consolidated Financial Statements

YMFG Annual Report 2020 26
exercise material infl uence to be accounted for by the
equity method.
(i) No unconsolidated subsidiary was accounted for by
the equity method at March 31, 2020 and 2019.
(ii) As at March 31, 2020 and 2019, two affi liates
were accounted for by the equity method.
Affi liates as at March 31, 2020 and 2019 were
as follows:
YM Saison Co., Ltd.
Momiji Card Co., Ltd.
(iii) As at March 31, 2020 and 2019, one
unconsolidated subsidiary was not accounted for
by the equity method.
Name of major subsidiary:
Maple Funding Corporation
The unconsolidated subsidiary is also excluded
from the scope of application of equity method
because its net income (in proportion to
ownership), retained earnings (in proportion to
ownership) and accumulated other comprehensive
income (in proportion to ownership) are so
immaterial that they do not hinder a rational
judgment of YMFG’s consolidated fi nancial position
and results of operations when excluded from the
scope of equity method.
(iv) There were no affi liates that were not accounted
for by the equity method as at March 31, 2020
and 2019.
(3) The balance sheet dates of consolidated subsidiariesThe balance sheet date of all of the consolidated
subsidiaries is March 31 every year.
(4) Accounting PoliciesTrading assets, trading liabilities and transactions for trading purposesThe valuation method of “Trading assets” and “Trading
liabilities” is as follows:
Balances incurred by transactions of which the purpose
is to earn a profi t by taking advantage of short-term
fl uctuations in a market or discrepancies in different
markets of interest rates, currency exchange rates, share
prices or other indices (hereinafter referred to as “trading
purposes”) are included in “Trading assets” or “Trading
liabilities” in the consolidated balance sheets as of the
date on which the transactions have been contracted.
The income or losses on these transactions are recorded
as “Trading income” and “Trading expenses” in the
consolidated statement of income.
Trading assets and trading liabilities are valued, in the
case of securities and commercial paper, at the market
value as of the date of the balance sheet and, in the case
of derivatives, including swaps, futures and options, at the
amount due if the transactions were to be settled as of the
date of the balance sheet. “Trading income” and “Trading
expenses” include interest income and interest expense,
respectively, and gains and losses, respectively, resulting
from the valuation of securities, commercial paper,
derivatives, etc., which are included in “Trading assets” or
“Trading liabilities.”
SecuritiesWith regard to the valuation of securities, held-to-maturity
debt securities are stated at amortized cost (straight-line
method) using the moving-average method. Investments
in unconsolidated subsidiaries that are not accounted for
by the equity method are stated at cost determined by the
moving-average method. Available-for-sale securities are in
general stated at fair value (cost of sale calculated primarily
according to the moving-average method) indicated
according to market price at the consolidated balance
sheet date (for equity securities, the average market price
during the one-month period ending on the consolidated
balance sheet date). Available-for-sale securities having no
readily available market value are valued at cost using the
moving-average method.
Unrealized gains (losses) on available-for-sale securities
are reported as a component of net assets.
Impairment loss is recognized if the value of securities is
declined signifi cantly and such decline is considered other
than temporal.
Money in trustTrust assets within money held in trust are valued using the
market value method.
DerivativesDerivatives other than those for which exceptional
accounting treatment is applied are stated at fair value.

27 YMFG Annual Report 2020
Method of hedge accountingThe subsidiaries that conduct banking business (“the
Banks”) apply deferred hedge accounting in accordance
with “Treatments of Accounting and Audit on Application
of Accounting Standard for Financial Instruments in
Banking Industry” (The Japanese Institute of Certifi ed
Public Accountants (“JICPA”) Industry Audit Committee
Report No. 24, February 13, 2002). As for the hedge
to offset market fl uctuation, the Banks assess the
effectiveness of the hedge by grouping the hedged items
such as deposits and loans and the hedging instruments
such as interest rate swaps by their maturity.
Also, the Banks apply deferred hedge accounting to
hedge foreign exchange risks associated with various
foreign currency denominated monetary assets and
liabilities as stipulated in “Treatment of Accounting and
Auditing Concerning Accounting for Foreign Currency
Transactions in Banking Industry” (JICPA Industry
Audit Committee Report No. 25, July 29, 2002). The
effectiveness of the currency swap transactions, exchange
swap transactions and similar transactions hedging the
foreign exchange risks of monetary assets and liabilities
denominated in foreign currencies is assessed based on
comparison of the foreign currency position of the hedged
monetary assets and liabilities and the hedging instruments.
The Banks apply an exceptional accounting treatment,
as permitted if certain conditions are met, for certain
interest rate swaps utilized as hedging instrument. In that
treatment, the interest swap contracts are not recorded at
fair values but the net interest to be paid or received under
the contracts is added or deducted to the interest arising
from their related hedged assets or liabilities.
Allowance for loan lossesThe Banks provide allowance for loan losses according to
the following write-off and provisioning standards.
For loans to borrowers who are legally bankrupt (due
to bankruptcy, composition, suspension of transactions
with banks by the rules of clearinghouses, etc.) or
substantially bankrupt, an allowance is provided in
the amount of loans, net of amounts expected to be
collected through disposition of collateral or through
execution of guarantees.
For loans to borrowers in danger of bankruptcy,
an allowance is provided in the amount considered
uncollectible based on the amount of loans, net of amounts
expected to be collected through disposition of collateral or
through execution of guarantees, and other sources.
Loans to normal borrowers and borrowers requiring
caution are classifi ed into certain groups, and expected
losses are estimated for the upcoming one or three-year
periods. Expected loss amounts are calculated by using
average values for actual rates of losses from bad debts
and default probabilities during a specifi c period in the
past, based on actual amounts of bad debt or bankruptcy
over a one or three-year period, and adjusted as necessary
for future forecasts.
Each branch as well as the credit supervision
department evaluates all loans in accordance with the self-
assessment rule.
Other consolidated subsidiaries provide an allowance for
an amount calculated using the rate of collection losses in the
past for loans of normal borrowers in addition to amounts
estimated based on collectability analysis for borrowers in
danger of bankruptcy and certain other borrowers.
Tangible fi xed assets (excluding lease assets)Depreciation of tangible fi xed assets of YMFG and its
consolidated subsidiaries that conduct banking business are
computed by using the declining-balance method except
for buildings (excluding fi xtures) acquired after April 1, 1998
and fi xtures and buildings acquired after April 1, 2016,
which are depreciated using the straight-line method.
The estimated useful lives of the assets are primarily
as follows:
Buildings: 7 to 50 years
Others: 2 to 15 years
Other consolidated subsidiaries depreciate their tangible
fi xed assets using mainly the declining-balance method
over the useful lives of the respective assets provided by
the Corporation Tax Act in Japan.
Intangible fi xed assets (excluding lease assets)Amortization of intangible fi xed assets is computed by
using the straight-line method. Software costs for internal
uses are amortized over the estimated useful life (5 years).

YMFG Annual Report 2020 28
Lease assetsLease assets included within tangible and intangible fi xed
assets related to fi nance lease transactions that do not
transfer ownership are depreciated over the lease term
using the straight-line method. For lease assets with a
guaranteed residual value stated in their lease agreements,
the residual value is set at the guaranteed amount.
Otherwise, the residual value is assumed to be zero.
Income taxesIncome taxes comprise corporate, enterprise and inhabitant
taxes. The Group recognizes tax effects of temporary
differences between the fi nancial statement basis and the
tax basis of assets and liabilities. The asset and liability
approach is used to recognize deferred tax assets and
liabilities for the expected future tax consequences of
temporary differences.
Foreign currency translationForeign currency assets and liabilities and the accounts of
overseas branches of YMFG and consolidated subsidiaries
are translated into yen at the rates prevailing at the
consolidated balance sheet date.
Provision for bonusesProvision for bonuses is provided for payment of bonuses
to employees, in the amount of estimated bonuses that are
attributable to the fi scal year.
Method of accounting for retirement benefi tsWhen calculating retirement benefi t obligations, the
benefi t formula method is used for attributing expected
retirement benefi ts to the year-end. Actuarial gains or
losses are amortized on a straight-line basis over certain
years (10-11 years) within the employees’ average
remaining service period commencing from the next fi scal
year of incurrence.
Some consolidated subsidiaries employ the simplifi ed
method for calculating retirement benefi t obligations
and periodic benefi t costs, stating retirement benefi t
obligations at the amounts required as if all employees
voluntarily terminate their employment as of the year-end.
Provision for directors’ retirement benefi tsThe provision for directors’ retirement benefi ts for
consolidated subsidiaries outside the banking business
is provided for the estimated amount corresponding to
accrued retirement benefi t payments to directors as of the
end of the fi scal year.
Provision for directors’ stock benefi tsThe provision for directors’ stock benefi ts is determined
according to the directors’ stock benefi t regulations for
YMFG and its subsidiaries (banks within YMFG (Yamaguchi
Bank, Momiji Bank and Kitakyushu Bank) and YM
Securities; the same shall apply hereafter) in preparation
for the payment of stock benefi ts to directors (excluding
directors who are members of the Audit and Supervisory
Committee, part-time directors and outside directors ) and
executive offi cers (hereinafter, “Subject Directors, etc.”)
based on expected stock benefi t obligations as of March
31, 2020.
Provision for loss on interest repaymentProvision for loss on interest repayment is provided for
possible losses on reimbursements of excess interest
payments and loan losses related to consumer fi nance loans
extended at interest rates in excess of the maximum interest
rate prescribed in the Interest Rate Restriction Law.
In accordance with “Audit Guidelines on Consumer
Finance Companies’ Provisions for Possible Losses on
Reimbursements of Excess Interest Payments,” issued by
JICPA in 2012, the amount of such provision is rationally
estimated and booked based on actual historical repayment
claims by debtors.
Provision for reimbursement of depositsProvision for reimbursement of deposits is provided for in
order to meet depositor requests for reimbursement on
deposits already derecognized as liabilities, in an amount
deemed necessary by estimating the losses corresponding
to the expected requests for reimbursements in the future.

29 YMFG Annual Report 2020
Provision for customer point servicesProvision for customer point services is provided in
conjunction with a point system to promote credit card
use. The provision is recorded for the expected cost to be
incurred when credit card members use points they have
received as of the balance sheet date.
Reserves under special lawsReserves under special laws consist of the fi nancial
instruments transaction responsibility reserve posted by
YM Securities Co., Ltd., which were calculated according
to the specifi ed formula of Article 46-5 of the Financial
Instruments and Exchange Act and Article 175 of the
Cabinet Offi ce Order Related to the Financial Instruments
Business, to prepare for future eventual losses originating
from incidents relating to the purchase and sale of
securities or other transactions.
Amounts per share of common stockComputations of net income per share of common stock
are based on the weighted-average number of shares
outstanding during each year.
Cash dividends per share represent the cash dividends
declared as applicable to each year.
Amortization of goodwill Goodwill is amortized mainly over a 10-year period using
the straight-line method.
Consumption taxesYMFG and its consolidated subsidiaries employ the
tax exclusion method for consumption tax and local
consumption taxes, meaning that transaction amounts
and consumption tax amounts are treated separately for
accounting purposes.
However, non-deductible consumption taxes for
purchase of property, plant and equipment are recognized
as expenses for the year of the purchase.
Adoption of consolidated tax payment systemYMFG and certain of its consolidated subsidiaries adopted
the consolidated tax payment system as provided under the
Corporation Tax Act.
Standards and guidance not yet adoptedThe following standard and guidance were issued but not
yet adopted.
- “Accounting Standard for Revenue Recognition” (ASBJ
Statement No. 29, March 31, 2020)
- “Implementation Guidance on Accounting Standard for
Revenue Recognition” (ASBJ Guidance No. 30, March
31, 2020)
(1) Overview
The above standard and guidance provide comprehensive
principles for revenue recognition. Under the standard and
guidance, revenue is recognized by applying following 5
steps:
Step 1: Identify contract(s) with customers.
Step 2: Identify the performance obligations in the contract.
Step 3: Determine the transaction price.
Step 4: Allocate the transaction price to the performance
obligation in the contract.
Step 5; Recognize revenue when (or as) the entity
satisfi es a performance obligation.
(2) Effective date
Effective from the beginning of the fi scal year ending
March 31, 2022.
(3) Effects of the application of the standards
The Company and its consolidated domestic subsidiaries
are currently in the process of determining the effects
of these new standards on the consolidated fi nancial
statements.
- “Accounting Standard for Management of Inventories”
(ASBJ Statement No. 9, July 4, 2019)
- “Accounting Standard for Financial Instruments” (ASBJ
Statement No. 10, July 4, 2019)
- “Implementation Guidance on Disclosures about Fair
Value of Financial Instruments” (ASBJ Guidance No. 19,
March 31, 2020)
(1) Overview
In order to enhance comparability with internationally
recognized accounting standards, “Accounting Standard
for Fair Value Measurement” and “Implementation
Guidance on Accounting Standard for Fair Value
Measurement” (together, hereinafter referred to as “Fair
Value Accounting Standards”) were developed and
guidance on methods measuring fair value was issued. Fair
Value Accounting Standards are applicable to the fair value
measurement of the following items:

YMFG Annual Report 2020 30
- Financial instruments in “Accounting Standard for
Financial Instruments”; and
- Inventories held for trading purposes in “Accounting
Standard for Measurement of Inventories.” and, under the
“revised Implementation Guidance on Disclosures about
Fair Value of Financial Instruments,” with notes outlining
details of fair value of fi nancial instruments for each level.
(2) Effective date
Fair Value Accounting Standards and guidance will be
effective from the beginning of the consolidated fi scal year
ending March 31, 2022.
(3) Effects of the application of the standards
The Company and its consolidated domestic subsidiaries are
currently in the process of determining the effects of these
new standards on the consolidated fi nancial statements.
- “Accounting Standard for Accounting Policy Disclosures,
Accounting Changes and Error Corrections” (ASBJ
Statement No. 24, March 31, 2020)
(1) Overview
The objective is to provide an overview of principles
for accounting treatment and procedures in the event
these subjects are not clearly determined under related
accounting standards.
(2) Effective date
Effective from the beginning of the fi scal year ending
March 31, 2021.
- “Accounting Standard for Disclosure of Accounting
Estimates” (ASBJ Statement No. 31, March 31, 2020)
(1) Overview
The objective is to disclose information that will contribute
to the understanding by users of fi nancial statements with
regard to amounts stated in the fi nancial statements for
the current fi scal year that involve accounting estimates
whose details present the risk of materially affecting
fi nancial statements for the following fi scal year.
(2) Effective date
Effective from the beginning of the fi scal year ending
March 31, 2021.
Additional Information(ESOP Trust)
To enhance its welfare benefi ts, YMFG has introduced the
ESOP Trust for Group employees (hereinafter, “Employees”)
1. ESOP Trust for Employees introduced in March 2017
(1) Overview of Transactions
Of those Employees enrolled in YMFG’s ESOP, YMFG has
established the trust for those benefi ciaries satisfying
certain conditions. This trust acquired as a lump sum
certain number of shares of YMFG corresponding to the
number expected to be acquired by YMFG’s ESOP over the
fi ve-year period beginning in March 2017. Thereafter, the
trust will sell YMFG’s shares to YMFG’s ESOP each month
on a specifi c date.
(2) Company Shares Residing in the Trust
YMFG’s shares residing in the trust are recorded in treasury
stock in the net assets section based on the book value of
the trust (excluding ancillary expenses).
The book value and the number of shares of this
treasury stock amounted to ¥588 million ($5 million) and
456 thousand shares on March 31, 2020 and ¥1,274
million and 990 thousand shares on March 31, 2019.
(3) Book Value of Borrowings Recorded by Applying the
Gross Price Method
The book value of borrowings recorded by applying the
gross price method was ¥929 million ($9 million) on March
31, 2020 and ¥1,321 million on March 31, 2019.
(Board Benefi t Trust (BBT))
YMFG has introduced a Board Benefi t Trust (“BBT”) to raise
awareness among Subject Directors,etc. of YMFG and its
subsidiaries (banks within the Group (Yamaguchi Bank,
Momiji Bank and Kitakyushu Bank) and YM Securities; the
following shall apply hereinafter) toward raising operating
performance at YMFG over the medium to long term and
contributing to increases in corporate value.
(1) Overview of Transactions
Via the trust, YMFG acquires YMFG’s common shares
using funds provided by YMFG. YMFG’s share and cash
equivalent to fair value of YMFG’s stock measured at the
time of retirement are granted to be distributed via the trust
to Subject Directors,etc. according to Subject Directors,etc.’
positions, and the level of achievement of operating
performance in accordance with directors’ stock benefi t

31 YMFG Annual Report 2020
regulations established by YMFG and its subsidiaries.
(2) Company Shares Residing in the Trust
YMFG’s shares residing in the trust are recorded as treasury
stock in the net assets section based on the book value of
the trust (excluding ancillary expenses).
The book value and the number of shares of this treasury
stock amounted to ¥878 million ($8 million) and 1,005
thousand shares on March 31, 2020 and ¥558 million and
578 thousand shares on March 31, 2019.
(Treatment Related to the Application of Tax Effect
Accounting for the Transition from the Consolidated
Taxation System to the Group Tax Sharing System)
With regard to matters related to the transition to the
group tax sharing system established by the “Act for the
Partial Amendment of the Income Tax Act” (Act No. 8 of
2020) and the revision of the single tax payment system
to coincide with the transition to the group tax sharing
system, YMFG and certain consolidated subsidiaries base
their amounts of deferred tax assets and deferred tax
liabilities on tax law prior to revision without applying
No. 44 of the “Implementation Guidance on Tax Effect
Accounting” (ASBJ Guidance No. 28, February 16,
2018), in accordance with treatment under Paragraph 3
of the “Practical Solution on the Treatment of Tax Effect
Accounting for the Transition from the Consolidated
Taxation System to the Group Tax Sharing System” (PITF
No. 39, March 31, 2020).
(Impact of the COVID-19 Pandemic)
The spread of the novel coronavirus disease (COVID-19)
is expected to continue affecting the economy for some
time. The Group is working to understand the conditions
of individual borrowers in a timely and appropriate manner
and provide various types of support to help customers
with cash fl ow and other aspects of business continuity.
Based on such situations, calculations of allowance for
doubtful accounts assumed that the impact on loans and
other credit costs would be limited.
However, these assumptions include uncertainties. If
the COVID-19 pandemic were to continue for a prolonged
period of time or to grow more serious rather than
subsiding, the operating environment could deteriorate
further. As a result, allowance for doubtful accounts could
be materially affected in upcoming fi scal years.
3. CONSOLIDATED STATEMENTS OF CASH FLOWS AND CASH EQUIVALENTS
1. In preparing the consolidated statements of cash fl ows,
the Group considers cash and due from THE BANK OF
JAPAN as cash and cash equivalents.
The reconciliation of cash and due from banks in the
consolidated balance sheets and cash and cash equivalents
in the consolidated statements of cash fl ows at March 31,
2020 and 2019 were as follows:
Millions of yenThousands of U.S. dollars
2020 2019 2020Cash and due from banks ¥971,777 ¥1,043,994 $8,929,312Time deposits in other banks (15,873) (16,602) (145,851)Other (11,120) (11,834) (102,178)Cash and cash equivalents ¥944,784 ¥1,015,558 $8,681,283
2. Details of important non-funding transactions
Details of important non-funding transactions through
the exercise of share options to shares that took place
during the fi scal year ended March 31, 2020 and 2019
were as follows:
Millions of yenThousands of U.S. dollars
2020 2019 2020Decrease in capital surplus by exercise of share options to shares
¥— ¥ (2,625) $—
Decrease in treasury shares by exercise of share options to shares
— 27,421 —
Decrease in bonds with subscription rights to shares by exercise of share options to shares
¥— ¥24,796 —
4. FINANCIAL INSTRUMENTS
Items pertaining to the status of fi nancial instruments(1) Policies on fi nancial instrumentsYMFG provides community-based integrated fi nancial
services centered on the banking, securities and credit card
businesses. Accordingly, the Group is subject to a variety
of risks, including credit risk, market risk and liquidity
risk. Due to changes in economic, social and fi nancial
conditions, these risks have grown more diverse and
complex. Under these conditions, the Group considers
strengthening its risk management structure as a priority
issue. To maintain and enhance the soundness of its
operations, YMFG has created groupwide risk management

YMFG Annual Report 2020 32
regulations, which clarify the Group’s fundamental stance
on risk management.
(2) Content and risks of fi nancial instrumentsOf fi nancial assets held by the Group, principally loans and
bills discounted extended to business partners are subject
to the credit risk from breach of contract. The Group holds
securities, principally debt securities, equity securities and
investment trusts, for trading purposes, for holding to
maturity, for purely investment purposes or to promote
positive business relations. These securities are subject to
issuer credit risk, interest rate fl uctuation risk and market
price fl uctuation risk.
The Group’s fi nancial liabilities center on deposits
and negotiable certifi cates of deposit, and call money
that it raises in the market. However, the Group is
subject to the liquidity risk of becoming unable to
secure necessary funding. The Group is also subject to
interest rate risk arising from fl uctuations in fi nancial and
economic conditions.
The Group employs derivative transactions to hedge
underlying market risks on its assets and liabilities. The
Group also provides derivatives as fi nancial products to
meet customers’ needs. Interest-related and securities-
related derivative transactions are employed to limit the
impact on income of future interest rate fl uctuations and
price fl uctuations for loans and bills discounted, deposits,
securities and other instruments bearing long-term interest
at fi xed rates. Currency-related derivative transactions are
used primarily to avoid fl uctuations in income stemming
from future exchange rate fl uctuations, stabilize funding
denominated in foreign currencies, as well as offered as
products to clients. With regard to transactions to secure
income through changes in market rates, which are
conducted on a limited basis, the Group has established
stringent standards that include risk limits and loss limits.
As market risk factors, interest rate related and
securities-related derivative transactions are subject to
the risk of fl uctuations in interest rates and prices, and
currency-related derivative transactions are subject to
exchange rate fl uctuations. For transactions that are
not conducted on exchanges, the Group is subject to
credit risk, the risk of loss in the event a counterparty
becomes unable to fulfi ll its contractual obligations due to
deteriorating fi nancial conditions.
With regard to use of hedge accounting, the Group
applies deferred hedge accounting after it ensured in
advance that the established conditions are satisfi ed. As for
hedging methods, the Group employs the portfolio hedge
where certain group of assets with similar risk is identifi ed
and such risk is hedged comprehensively. In addition, for
certain interest swap contracts, exceptional accounting
treatment are applied.
(3) Risk management structure related to fi nancial instruments
(i) Management of credit risk
Through the appropriate operation of a credit rating
system, the Group endeavors to determine the fi nancial
conditions of business partners and accurately evaluate
their credit risk. The Group has enhanced the precision
of its credit evaluations, reviewing business partner credit
ratings swiftly and appropriately for each fi nancial period
and each time their credit conditions change.
The Group conducts self assessments according to
stringent standards that are consistent throughout the
Group. The Group performs write-off and provisions
based on the results of its self assessments. The Group’s
authentication departments verify the content of such self
assessments. Independence is maintained through internal
audits conducted by audit departments. In addition,
the Group undergoes external audits conducted by its
independent external auditors.
With regard to the screening of individual transactions,
the Group employs a screening system suited to each
subsidiary bank’s size of the business and characteristics
to conduct detailed screenings that take individual sector
and regional characteristics into consideration. In terms of
portfolio management, the Group strives to enhance its
risk management by fi rst measuring credit risk, and then
managing risk by category, sector and geographic area.
Risk management departments periodically obtain
credit information and fair value as a part of managing
credit risks on securities issuers and counterparty risks on
derivative transactions.
(ii) Management of market risk
Qualitative information on the management of market risk
The Group has formulated a market risk management
process that identifi es and quantitatively measures market
risks. An asset-liability management (ALM) system is
employed to control market risk within allowable limits,
and the Group ALM Committee is periodically held to
respond to such risks.
YMFG periodically evaluates market risk conditions and
verifi es the appropriateness of risk controls.
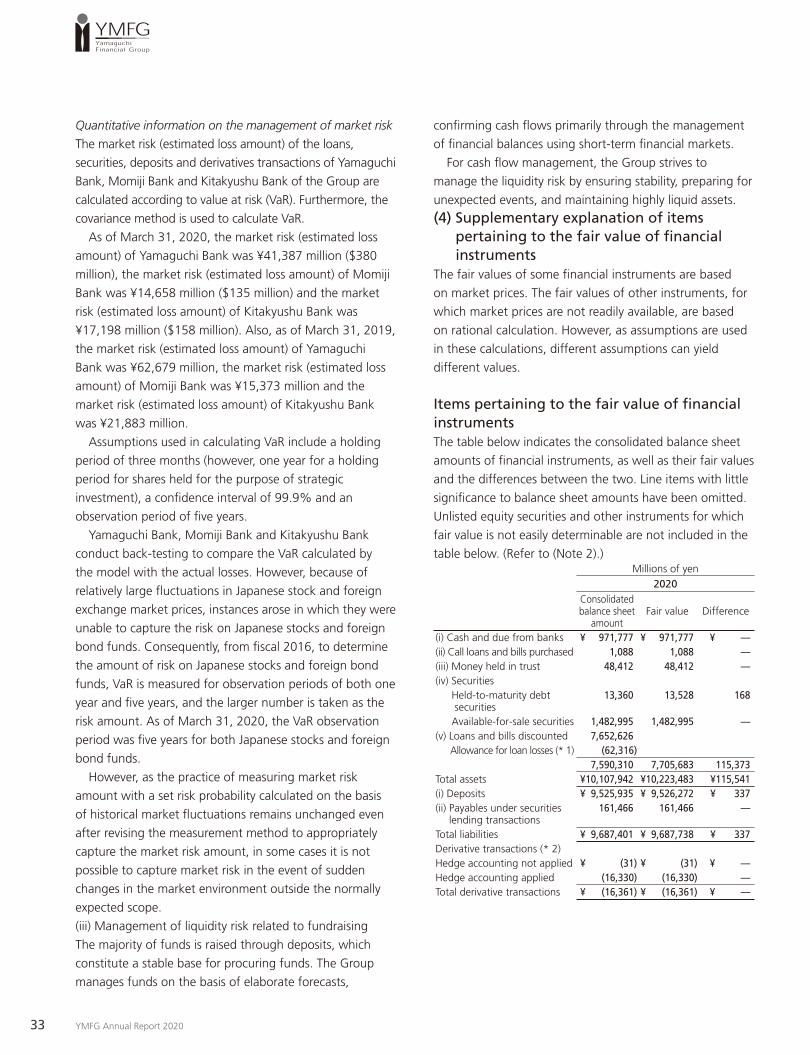
33 YMFG Annual Report 2020
Quantitative information on the management of market risk
The market risk (estimated loss amount) of the loans,
securities, deposits and derivatives transactions of Yamaguchi
Bank, Momiji Bank and Kitakyushu Bank of the Group are
calculated according to value at risk (VaR). Furthermore, the
covariance method is used to calculate VaR.
As of March 31, 2020, the market risk (estimated loss
amount) of Yamaguchi Bank was ¥41,387 million ($380
million), the market risk (estimated loss amount) of Momiji
Bank was ¥14,658 million ($135 million) and the market
risk (estimated loss amount) of Kitakyushu Bank was
¥17,198 million ($158 million). Also, as of March 31, 2019,
the market risk (estimated loss amount) of Yamaguchi
Bank was ¥62,679 million, the market risk (estimated loss
amount) of Momiji Bank was ¥15,373 million and the
market risk (estimated loss amount) of Kitakyushu Bank
was ¥21,883 million.
Assumptions used in calculating VaR include a holding
period of three months (however, one year for a holding
period for shares held for the purpose of strategic
investment), a confi dence interval of 99.9% and an
observation period of fi ve years.
Yamaguchi Bank, Momiji Bank and Kitakyushu Bank
conduct back-testing to compare the VaR calculated by
the model with the actual losses. However, because of
relatively large fl uctuations in Japanese stock and foreign
exchange market prices, instances arose in which they were
unable to capture the risk on Japanese stocks and foreign
bond funds. Consequently, from fi scal 2016, to determine
the amount of risk on Japanese stocks and foreign bond
funds, VaR is measured for observation periods of both one
year and fi ve years, and the larger number is taken as the
risk amount. As of March 31, 2020, the VaR observation
period was fi ve years for both Japanese stocks and foreign
bond funds.
However, as the practice of measuring market risk
amount with a set risk probability calculated on the basis
of historical market fl uctuations remains unchanged even
after revising the measurement method to appropriately
capture the market risk amount, in some cases it is not
possible to capture market risk in the event of sudden
changes in the market environment outside the normally
expected scope.
(iii) Management of liquidity risk related to fundraising
The majority of funds is raised through deposits, which
constitute a stable base for procuring funds. The Group
manages funds on the basis of elaborate forecasts,
confi rming cash fl ows primarily through the management
of fi nancial balances using short-term fi nancial markets.
For cash fl ow management, the Group strives to
manage the liquidity risk by ensuring stability, preparing for
unexpected events, and maintaining highly liquid assets.
(4) Supplementary explanation of items pertaining to the fair value of fi nancial instruments
The fair values of some fi nancial instruments are based
on market prices. The fair values of other instruments, for
which market prices are not readily available, are based
on rational calculation. However, as assumptions are used
in these calculations, different assumptions can yield
different values.
Items pertaining to the fair value of fi nancial instrumentsThe table below indicates the consolidated balance sheet
amounts of fi nancial instruments, as well as their fair values
and the differences between the two. Line items with little
signifi cance to balance sheet amounts have been omitted.
Unlisted equity securities and other instruments for which
fair value is not easily determinable are not included in the
table below. (Refer to (Note 2).)Millions of yen
2020Consolidated balance sheet
amountFair value Difference
(i) Cash and due from banks ¥ 971,777 ¥ 971,777 ¥ —(ii) Call loans and bills purchased 1,088 1,088 —(iii) Money held in trust 48,412 48,412 —(iv) Securities Held-to-maturity debt
securities13,360 13,528 168
Available-for-sale securities 1,482,995 1,482,995 —(v) Loans and bills discounted 7,652,626 Allowance for loan losses (* 1) (62,316)
7,590,310 7,705,683 115,373Total assets ¥10,107,942 ¥10,223,483 ¥115,541(i) Deposits ¥ 9,525,935 ¥ 9,526,272 ¥ 337(ii) Payables under securities
lending transactions161,466 161,466 —
Total liabilities ¥ 9,687,401 ¥ 9,687,738 ¥ 337Derivative transactions (* 2) Hedge accounting not applied ¥ (31) ¥ (31) ¥ —Hedge accounting applied (16,330) (16,330) —Total derivative transactions ¥ (16,361) ¥ (16,361) ¥ —

YMFG Annual Report 2020 34
Millions of yen2019
Consolidated balance sheet
amountFair value Difference
(i) Cash and due from banks ¥1,043,994 ¥1,043,994 ¥ —(ii) Call loans and bills purchased 39,042 39,042 —(iii) Money held in trust 30,565 30,565 —(iv) Securities Held-to-maturity debt
securities8,273 8,438 165
Available-for-sale securities 1,374,849 1,374,849 —(v) Loans and bills discounted 7,408,387 Allowance for loan losses (* 1) (53,983)
7,354,404 7,450,478 96,074Total assets ¥9,851,127 ¥9,947,366 ¥96,239(i) Deposits ¥9,230,773 ¥9,231,171 ¥ 398(iii) Call money and bills sold 133,466 133,466 —Total liabilities ¥9,364,239 ¥9,364,637 ¥ 398Derivative transactions (* 2) Hedge accounting not applied ¥ 1,577 ¥ 1,577 ¥ —Hedge accounting applied (2,115) (2,115) —Total derivative transactions ¥ (538) ¥ (538) ¥ —
Thousands of U.S. dollars2020
Consolidated balance sheet
amountFair value Difference
(i) Cash and due from banks $ 8,929,312 $ 8,929,312 $ —(ii) Call loans and bills purchased 9,997 9,997 —(iii) Money held in trust 444,841 444,841 —(iv) Securities Held-to-maturity debt
securities122,760 124,304 1,544
Available-for-sale securities 13,626,711 13,626,711 —(v) Loans and bills discounted 70,317,247 Allowance for loan losses (* 1) (572,599)
69,744,648 70,804,769 1,060,121Total assets $92,878,269 $93,939,934 $1,061,665(i) Deposits $87,530,414 $87,533,511 $ 3,097(ii) Payables under securities
lending transactions1,483,653 1,483,653 —
Total liabilities $89,014,067 $89,017,164 $ 3,097Derivative transactions (* 2) Hedge accounting not applied $ (285) $ (285) $ —Hedge accounting applied (150,051) (150,051) —Total derivative transactions $ (150,336) $ (150,336) $ —
(* 1) The general allowance for loan losses and specifi c allowance for loan losses are deducted.(* 2) The amount collectively represents derivative transactions that are recorded as trading
assets and liabilities, and other assets and liabilities. This indicates the net amount of rights and obligations under derivative transactions. Parentheses, ( ), indicate that the net amount is negative.
(Note 1) Methods of calculating the fair value of fi nancial
instruments
(1) Assets
(i) Cash and due from banks
As the settlement term of these instruments is short
(within one year) and their fair values and book values are
approximately the same, their book values are taken as
their fair values.
(ii) Call loans and bills purchased
As the settlement term of these instruments is short
(within one year) and their fair values and book values are
approximately the same, their book values are taken as
their fair values.
(iii) Money held in trust
As for the securities held as trusted assets in money held in
trust established independently for the purpose of investing
mainly in the securities, the value on stock exchanges is
taken as fair value for the equity securities, and either the
value on exchanges or a price indicated by other fi nancial
institutions dealing with the specifi c instruments is taken as
fair value.
Additional information related to money held in trust by
the purpose of holding are described in the note entitled
“Money held in trust.”
(iv) Securities
For equity securities, fair value is determined by stock
exchange prices; the fair value of debt securities is
determined by exchange prices or prices received from
information vendors. Fair values of investment trusts are
determined by exchange prices or standard prices disclosed
by investment trust management companies.
The fair value of private placement bonds guaranteed
by Yamaguchi Bank and Momiji Bank is determined for
each internal rating category and period by discounting
the total amount of interest and principal to their present
value, using as the discount rate the risk-free rate plus the
credit cost determined for each internal rating category.
However, fair value of bonds of legally bankrupt debtors,
substantially bankrupt debtors and debtors in danger
of bankruptcy is determined by deducting the expected
amount of loss on the bond by using the same method
applied to loans from the bond’s face value.
(v) Loans and bills discounted
For loans and bills discounted with fl oating interest rates,
as in the short term their values refl ect market interest
rates, unless the credit status of the obligor has changed
signifi cantly since the loans were extended, their fair value
is similar to their book value, so their book value is taken as
their fair value.
For loans and bills discounted bearing fi xed interest
rates, fair value is determined for each internal rating
category and period by discounting the total amount
of interest and principal to their present value, using as

35 YMFG Annual Report 2020
the discount rate the risk-free rate for operating loans
and bills discounted plus the credit cost for each internal
rating category. For consumer loans and bills discounted,
fair value is determined by discounting the total amount
of interest and principal to their present value using the
assumed interest rate on new loans of the same type. For
instruments having a short settlement period (within one
year), as their fair values and book values are approximately
the same, their book value is taken as their fair value.
With regard to loans to legally bankrupt obligors,
substantially bankrupt obligors or obligors who are in
danger of bankruptcy, the estimated collectible amount
is based on either the present value of estimated future
cash fl ows or the expected amounts recoverable from
the disposal of collateral and/or under guarantees. As
the fair value is essentially equivalent to the amount after
deducting the allowance for possible loan losses from the
book value as of the consolidated balance sheet date, this
amount is taken as fair value.
For loans that have no specifi c repayment period, as the
fair value is assumed to be equivalent with the book value
according to the expected payment dates and interest
rates, book value is taken as the fair value.
(2) Liabilities
(i) Deposits
The fair value of demand deposits is determined as
the payment amount if payment were required on the
consolidated balance sheet date (book value). The fair
value of time deposits is determined by discounting future
cash fl ows to their present value by certain time periods.
The discount rate employed is the interest rate required for
newly accepted deposits. For deposits having a short period
(within one year), as their fair values and book values are
approximately the same, their book value is taken as their
fair value.
(ii) Payables under security lending transactions and (iii) Call
money and bills sold
As the contract period is short (within one year) and the
market value is similar to the book value, the book value is
taken as the market value.
(3) Derivative transactions
The fair value of derivative transactions, comprising
interest-rate-related transactions (such as interest rate
futures, interest rate options and interest rate swaps)
currency-related transactions (such as currency futures,
currency options and currency swaps), bond-related
transactions (such as bond futures and bond options) is
taken as their value on exchanges, discounted present
value or price as calculated using option pricing models.
Interest rates swaps that employ exceptional accounting
treatment are accounted for as part of the loans and bills
discounted that are hedged. Therefore, their fair value is
included in the fair value of loans and bills discounted.
(Note 2) The consolidated balance sheet amounts of
fi nancial instruments for which market prices are not
readily available
Financial instruments for which market prices are not
readily available are not included in “Assets (4) Available-
for-sale securities.”
Millions of yenThousands of U.S. dollars
2020 2019 2020Category Consolidated balance sheet amount(1) Unlisted equity securities
(*1, *2)¥ 6,933 ¥ 6,918 $ 63,705
(2) Investments in partnerships, etc. (*3)
9,459 7,974 86,925
Total ¥16,392 ¥14,892 $150,630
(*1) As unlisted equity securities have no market prices and their fair value is not readily available, they are not included in the scope of fair value disclosures.
(*2) During the fi scal year ended March 31, 2020 and 2019, impairment losses of ¥47 million ($432 thousand) and ¥7 million were recorded on unlisted equity securities.
(*3) Of investments in partnerships, those partnership assets comprising unlisted equity securities, which have no readily available fair value, are not included in the scope of fair value disclosure.

YMFG Annual Report 2020 36
(Note 3) Expected maturity amount of monetary claims and
securities with maturities after the consolidated balance
sheet dateMillions of yen
2019
Within one year
More than one year
and within three years
More than three years and within fi ve years
More than fi ve years
and within seven years
More than seven years
(1) Due from banks
¥ 875,998 ¥ — ¥ — ¥ — ¥ —
(2) Call loans and bills purchased
1,088 — — — —
(3) Money held in trust
48,412 — — — —
(4) Securities 65,968 161,330 166,133 174,273 627,818Held-to- maturity debt securities
700 1,763 5,751 1,749 3,400
Local government bond
— 200 1,700 800 2,200
Corporate bond
700 1,563 4,051 949 1,200
Available-for- sale securities with maturities
65,268 159,567 160,382 172,524 624,418
Japanese government bond
9,000 42,000 23,100 21,500 234,600
Local government bond
6,725 22,158 22,057 26,974 131,548
Corporate bond
35,385 73,290 59,273 86,136 80,112
Others 14,158 22,119 55,952 37,914 178,158(5) Loans and
bills dis- counted (*)
1,693,152 1,047,647 1,065,149 856,915 2,989,763
Total ¥2,684,618 ¥1,208,977 ¥1,231,282 ¥1,031,188 ¥3,617,581
Millions of yen2019
Within one year
More than one year
and within three years
More than three years and within fi ve years
More than fi ve years
and within seven years
More than seven years
(1) Due from banks
¥ 942,716 ¥ — ¥ — ¥ — ¥ —
(2) Call loans and bills purchased
39,042 — — — —
(3) Securities 144,598 224,574 134,442 187,809 411,065Held-to- maturity debt securities
326 909 2,158 2,283 2,600
Local government bond
— 100 700 900 1,400
Corporate bond
326 809 1,458 1,383 1,200
Available-for- sale securities with maturities
144,272 223,665 132,284 185,526 408,465
Japanese government bond
57,000 88,000 6,500 39,600 58,250
Local government bond
15,508 9,826 9,424 10,965 70,775
Corporate bond
56,489 94,963 47,462 65,793 160,390
Others 15,275 30,876 68,898 69,168 119,050(4) Loans and
bills dis- counted (*)
1,721,944 991,035 962,930 809,990 2,922,490
Total ¥2,848,300 ¥1,215,609 ¥1,097,371 ¥997,799 ¥3,333,555

37 YMFG Annual Report 2020
Thousands of U.S. dollars2020
Within one year
More than one year
and within three years
More than three years and within fi ve years
More than fi ve years
and within seven years
More than seven years
(1) Due from banks
$ 8,049,233 $ — $ — $ — $ —
(2) Call loans and bills purchased
9,997 — — — —
(3) Money held in trust
444,841 — — — —
(4) Securities 606,157 1,482,405 1,526,537 1,601,341 5,768,815Held-to- maturity debt securities
6,432 16,200 52,844 16,071 31,241
Local government bond
— 1,838 15,621 7,351 20,215
Corporate bond
6,432 14,362 37,223 8,720 11,026
Available-for- sale securities with maturities
599,725 1,466,205 1,473,693 1,585,270 5,737,574
Japanese government bond
82,698 385,923 212,258 197,556 2,155,656
Local government bond
61,794 203,602 202,674 247,854 1,208,748
Corporate bond
325,140 673,436 544,638 791,473 736,121
Others 130,093 203,244 514,123 348,387 1,637,049(5) Loans and
bills dis- counted (*)
15,557,769 9,626,454 9,787,274 7,873,886 27,471,855
Total $24,667,997 $11,108,859 $11,313,811 $9,475,227 $33,240,670
(*) Loans and bills discounted for which no period is specifi ed are included in “within one year.”
(Note 4) Estimated repayment amounts of deposits,
negotiable certifi cates of deposit and other interest-bearing
liabilities to be repaid after the consolidated balance sheet dateMillions of yen
2020
Within one year
More than one year
and within two years
More than two years and within three years
Three years or
more
Deposits (*) ¥8,410,285 ¥438,092 ¥129,083 ¥29,100Negotiable certifi cates of deposit
510,864 8,481 30 —
Payables under securities lending transactions
161,466 — — —
Total ¥9,082,615 ¥446,573 ¥129,113 ¥29,100
Millions of yen2019
Within one year
More than one year
and within two years
More than two years and within three years
Three years or
more
Deposits (*) ¥8,076,897 ¥614,162 ¥158,059 ¥28,760Negotiable certifi cates of deposit
352,360 535 — —
Call money and bills sold 133,466 — — —Total ¥8,562,723 ¥614,697 ¥158,059 ¥28,760
Thousands of U.S. dollars2020
Within one year
More than one year
and within two years
More than two years and within three years
Three years or
more
Deposits (*) $77,279,105 $4,025,471 $1,186,098 $267,388Negotiable certifi cates of deposit
4,694,147 77,929 276 —
Payables under securities lending transactions
1,483,653 — — —
Total $83,456,905 $4,103,400 $1,186,374 $267,388
(*) Within deposits, demand deposits are included in “within one year.”
5. SECURITIES
Securities held at March 31, 2020 include shares of
unconsolidated subsidiaries and affi liates amounting to ¥27
million ($248 thousand) and investments of ¥1 million ($ 9
thousand). Corresponding fi gures at March 31, 2019, were
¥27 million and ¥1 million.
The amount of guarantee obligations for private
placement bonds (Financial Instruments and Exchange
Law, Article 2, Item 3), out of bonds included in
securities, amounted to ¥11,376 million ($105 million)
and ¥8,751 million as of March 31, 2020 and March 31,
2019 respectively.
Bonds included in securities also include securities
lent through unsecured loan agreements (bond lending
transactions) of ¥5,010 million, at March 31, 2019.
6. FAIR VALUE INFORMATION
SecuritiesThe following tables summarize book values, fair value and
acquisition cost of securities with available fair values as of
March 31, 2020 and 2019:
(a) Trading securities
Amount of unrealized gain (loss) on trading securities
included in the consolidated statement of income
— ¥(3) million ($28 thousand) and ¥2 million as at
March 31, 2020 and 2019, respectively.

YMFG Annual Report 2020 38
(b) Held-to-maturity debt securities:Millions of yen
2020Type Book value Fair value Difference
Securities with fair value exceeding book value
Local government bonds
¥ 2,900 ¥ 2,947 ¥ 47
Corporate bonds
8,225 8,349 124
Subtotal 11,125 11,296 171Securities with fair value not exceeding book value
Local government bonds
2,000 1,997 (3)
Corporate bonds
235 235 (0)
Subtotal 2,235 2,232 (3)Total ¥13,360 ¥13,528 ¥168
Millions of yen2019
Type Book value Fair value DifferenceSecurities with fair value exceeding book value
Local government bonds
¥3,000 ¥3,061 ¥ 61
Corporate bonds
5,144 5,248 104
Subtotal 8,144 8,309 165Securities with fair value not exceeding book value
Local government bonds
100 100 —
Corporate bonds
29 29 (0)
Subtotal 129 129 (0)Total ¥8,273 ¥8,438 ¥165
Thousands of U.S. dollars2020
Type Book value Fair value DifferenceSecurities with fair value exceeding book value
Local government bonds
$ 26,647 $ 27,079 $ 432
Corporate bonds
75,577 76,716 1,139
Subtotal 102,224 103,795 1,571Securities with fair value not exceeding book value
Local government bonds
18,377 18,350 (27)
Corporate bonds
2,159 2,159 (0)
Subtotal 20,536 20,509 (27)Total $122,760 $124,304 $1,544
(c) Available-for-sale securitiesMillions of yen
2020
Type Book value Acquisition cost Difference
Securities with book value exceeding acquisition cost
Shares ¥ 75,378 ¥ 34,954 ¥ 40,424Japanese government bonds
43,457 43,031 426
Local government bonds
94,338 94,077 261
Corporate bonds
242,770 240,383 2,387
Others 213,118 198,674 14,444Subtotal 669,061 611,119 57,942
Securities with book value not exceeding acquisition cost
Shares 11,832 15,250 (3,418)Japanese government bonds
293,589 300,872 (7,283)
Local government bonds
115,538 116,161 (623)
Corporate bonds
94,339 94,726 (387)
Others 298,636 330,612 (31,976)Subtotal 813,934 857,621 (43,687)Total ¥1,482,995 ¥1,468,740 ¥ 14,255
Millions of yen2019
Type Book value Acquisition cost Difference
Securities with book value exceeding acquisition cost
Shares ¥ 121,610 ¥ 48,812 ¥ 72,798Japanese government bonds
194,549 193,355 1,194
Local government bonds
112,188 111,315 873
Corporate bonds
415,824 410,561 5,263
Others 143,228 141,486 1,742Subtotal 987,399 905,529 81,870
Securities with book value not exceeding acquisition cost
Shares 5,688 6,450 (762)Japanese government bonds
60,845 61,525 (680)
Local government bonds
5,628 5,629 (1)
Corporate bonds
16,145 16,179 (34)
Others 299,143 314,311 (15,168)Subtotal 387,449 404,094 (16,645)Total ¥1,374,848 ¥1,309,623 ¥ 65,225

39 YMFG Annual Report 2020
Thousands of U.S. dollars2020
Type Book value Acquisition cost Difference
Securities with book value exceeding acquisition cost
Shares $ 692,622 $ 321,180 $ 371,442Japanese government bonds
399,311 395,396 3,915
Local government bonds
866,838 864,440 2,398
Corporate bonds
2,230,727 2,208,794 21,933
Others 1,958,256 1,825,554 132,702Subtotal 6,147,754 5,615,364 532,390
Securities with book value not exceeding acquisition cost
Shares 108,720 140,127 (31,407)Japanese government bonds
2,697,684 2,764,605 (66,921)
Local government bonds
1,061,637 1,067,362 (5,725)
Corporate bonds
866,847 870,403 (3,556)
Others 2,744,050 3,037,876 (293,826)Subtotal 7,478,938 7,880,373 (401,435)Total $13,626,692 $13,495,737 $ 130,955
(d) Held-to-maturity debt securities sold during the fi scal yearThere were no held-to-maturity securities sold during the fi scal year ended March 31, 2020 and 2019.
(e) Available-for-sale securities sold during the fi scal yearMillions of yen
2020Sale
amountTotal gain
on saleTotal loss on sale
Shares ¥ 14,689 ¥10,229 ¥ 64Japanese government bonds 1,253,003 6,494 1,453Local government bonds 6,840 59 —Corporate bonds 92,810 1,263 10Others 1,256,723 16,392 6,260Total ¥2,624,065 ¥34,437 ¥7,787
Millions of yen2019
Sale amount
Total gain on sale
Total loss on sale
Shares ¥ 9,519 ¥ 6,543 ¥ 367Japanese government bonds 1,233,253 2,763 1,368Local government bonds 1,656 — 2Corporate bonds 282,929 6,018 166Others 808,359 7,320 4,063Total ¥2,335,716 ¥22,644 ¥5,966
Thousands of U.S. dollars2020
Sale amount
Total gain on sale
Total loss on sale
Shares $ 134,972 $ 93,991 $ 588Japanese government bonds 11,513,397 59,671 13,351Local government bonds 62,850 542 —Corporate bonds 852,798 11,605 92Others 11,547,579 150,620 57,521Total $24,111,596 $316,429 $71,552
(f) Securities for which purpose of holding changed
There were no securities for which the purpose of holding
changed at March 31, 2020 and 2019.
Impairment losses on securitiesRegarding securities (excluding those for which market
prices are not readily available) other than trading securities,
if their market values have fallen substantially below their
acquisition price and are not expected to recover to the
acquisition price, such market values are recorded as
the consolidated balance sheet amounts. The valuation
difference is recorded as a loss for the fi scal year in which
such difference is realized (hereinafter, “impairment losses”).
During the fi scal year ended March 31, 2020, impairment
losses were ¥771 million ($7,084 thousand) on equity
securities and during the fi scal year ended March 31, 2019,
impairment losses totaled ¥27 million on equity securities.
The basis for determining whether the market value has
fallen signifi cantly is as follows.
If the market value of the securities in general has
fallen by 30% or more compared with the acquisition
cost, the value of the securities is determined to have
“fallen signifi cantly.” However in the case of shares and
equivalent securities, if their market value has fallen
by 30% or more but less than 50% of the acquisition
cost, the determination of whether the value has “fallen
signifi cantly” takes into consideration other factors such
as the issuing company’s credit risk (independent debtor
classifi cation, external ratings, etc.) and previous percentage
decreases over a specifi c period of time in the past.

YMFG Annual Report 2020 40
Money held in trust Information on money held in trust as of March 31, 2020
and 2019 was as follows:
(a) Money held in trust classifi ed as trading purposesMillions of yen
2020
Consolidated balance sheet
amount
Unrealized gains (losses) included in profi t (loss) for
the fi scal yearMoney held in trust classifi ed as trading purposes
¥4,714 ¥—
Millions of yen2019
Consolidated balance sheet
amount
Unrealized gains (losses) included in profi t (loss) for
the fi scal yearMoney held in trust classifi ed as trading purposes
¥4,730 ¥—
Thousands of U.S. dollars2020
Consolidated balance sheet
amount
Unrealized gains (losses) included in profi t (loss) for
the fi scal yearMoney held in trust classifi ed as trading purposes
$43,315 $—
(b) Money held in trust classifi ed as held-to-maturity
There are no corresponding transactions as at March
31, 2020 and 2019.
(c) Available-for-sale money held in trustMillions of yen
2020Consolidated balance sheet
amount
Acquisition cost
Unrealizedgains
(losses)Available-for-sale money held in trust
¥43,698 ¥44,695 ¥(997)
Millions of yen2019
Consolidated balance sheet
amount
Acquisition cost
Unrealizedgains
(losses)Available-for-sale money held in trust
¥25,835 ¥25,821 ¥14
Thousands of U.S. dollars2020
Consolidated balance sheet
amount
Acquisition cost
Unrealizedgains
(losses)Available-for-sale money held in trust
$401,526 $410,686 $(9,160)
Unrealized gains (losses) on available-for-sale securitiesInformation on unrealized gains (losses) on available-for-sale securities and available-for-sale money held in trust was as follows:
Millions of yenThousands of U.S. dollars
2020 2019 2020Net unrealized gains ¥13,501 ¥65,286 $124,056 Available-for-sale securities 14,498 65,271 133,217 Available-for-sale money held in trust
(997) 15 (9,161)
Deferred tax liabilities 3,821 19,576 35,110Unrealized gains on available- for-sale securities before following adjustment
9,680 45,710 88,946
Equivalent to non-controlling interests
(9) (0) (83)
YMFG’s interest in net unrealized gains on valuation of available-for-sale securities held by affi liates accounted for by the equity method
— — —
Unrealized gains on available- for-sale securities
¥ 9,689 ¥45,710 $ 89,029
Valuation differences on investments in partnerships,
etc., of ¥244 million ($2,242 thousand) at March 31, 2020
and ¥44 million at March 31, 2019, for which market
values are extremely diffi cult to determine, are recorded in
available-for-sale securities of net unrealized gains in the
list above.
Derivatives (1) Derivative transactions at March 31, 2020 and 2019, to
which hedge accounting is not applied
(a) Interest-rate-related:Millions of yen
2020
Type
Contract amounts
Over one year Fair value
Realizedgains
(losses)Over-the-counter:Interest rate swaps:Receivable fi xed, payable fl oating
¥22,108 ¥20,751 ¥ 561 ¥ 561
Receivable fl oating, payable fi xed
22,109 20,752 (352) (352)
Total ¥ — ¥ — ¥ 209 ¥ 209

41 YMFG Annual Report 2020
Millions of yen2019
Type
Contract amounts
Over one year Fair value
Realizedgains
(losses)Over-the-counter:Interest rate swaps:Receivable fi xed, payable fl oating
¥21,570 ¥18,642 ¥ 454 ¥ 454
Receivable fl oating, payable fi xed
21,570 18,643 (308) (308)
Total ¥ — ¥ — ¥ 146 ¥ 146
Thousands of U.S. dollars2020
Type
Contract amounts
Over one year Fair value
Realizedgains
(losses)Over-the-counter:Interest rate swaps:Receivable fi xed, payable fl oating
$203,143 $190,674 $ 5,155 $ 5,155
Receivable fl oating, payable fi xed
203,152 190,683 (3,234) (3,234)
Total $ — $ — $ 1,921 $ 1,921
(b) Currency-related:Millions of yen
2020
Type
Contract amounts
Over one year Fair value
Realizedgains
(losses)Over-the-counter:Currency swaps ¥282,308 ¥103,826 ¥(1,583) ¥ (393)Foreign exchange forward contracts: Sold 128,295 39,158 (2,384) (2,384) Bought 136,993 36,153 3,714 3,714Currency options Sold 133,467 98,561 (5,020) 606 Bought 133,467 98,561 5,034 744Total ¥ — ¥ — ¥ (239) ¥ 2,287
Millions of yen2019
Type
Contract amounts
Over one year Fair value
Realizedgains
(losses)Over-the-counter:Currency swaps ¥379,563 ¥104,863 ¥ 239 ¥ (945)Foreign exchange forward contracts: Sold 92,353 14,919 1,014 1,014 Bought 160,858 14,373 177 177Currency options Sold 122,012 85,952 (4,316) 1,246 Bought 122,012 85,952 4,319 54Total ¥ — ¥ — ¥ 1,433 ¥1,546
Thousands of U.S. dollars2020
Type
Contract amounts
Over one year Fair value
Realizedgains
(losses)Over-the-counter:Currency swaps $2,594,027 $954,020 $(14,546) $ (3,611)Foreign exchange forward contracts: Sold 1,178,857 359,809 (21,906) (21,906) Bought 1,258,780 332,197 34,127 34,127Currency options Sold 1,226,381 905,642 (27,015) 5,568 Bought 1,226,381 905,642 27,134 6,836Total $ — $ — $ (2,206) $ 21,014
(c) Stock-related:
There were no stock-related transactions as at March 31,
2020 and 2019.
(d) Bond-related:
There were no bond-related transactions as at March
31, 2020.
Millions of yen2019
Type
Contract amounts
Over one year Fair value
Realizedgains
(losses)Listed:Bond futures Sold ¥765 ¥— ¥(1) ¥(1)Total ¥ — ¥— ¥(1) ¥(1)
(e) Commodity-related:
There were no commodity-related transactions as at March
31, 2020 and 2019.
(f) Credit-derivatives:
There were no credit related transactions as at March 31,
2020 and 2019.

YMFG Annual Report 2020 42
(2) Derivative transactions as at March 31, 2020 and 2019,
to which hedge accounting is applied
(a) Interest-rate-related:Millions of yen
2020
TypeContract amounts
Over one year Fair value
Principal accounting procedure:Interest rate swapsReceive fl oating, payable fi xed ¥225,994 ¥225,994 ¥(14,933)Interest rate swaps employing exceptional accounting treatment:Interest rate swapsReceive fl oating, payable fi xed 168 108 *Total ¥ — ¥ — ¥(14,933)
Millions of yen2019
TypeContract amounts
Over one year Fair value
Principal accounting procedure:Interest rate swapsReceive fl oating, payable fi xed ¥127,166 ¥120,000 ¥(1,910)Interest rate swaps employing exceptional accounting treatment:Interest rate swapsReceive fl oating, payable fi xed 382 288 *Total ¥ — ¥ — ¥(1,910)
Thousands of U.S. dollars2020
TypeContract amounts
Over one year Fair value
Principal accounting procedure:Interest rate swapsReceive fl oating, payable fi xed $2,076,578 $2,076,578 $(137,214)Interest rate swaps employing exceptional accounting treatment:Interest rate swapsReceive fl oating, payable fi xed 1,544 992 *Total $ — $ — $(137,214)
(*) Of interest rate swaps employing exceptional accounting treatment, as these instruments are accounted for together with the hedged loans and bills discounted and borrowings, their fair value is included in the fair value of said loans and bills discounted within “Financial instruments.”
(b) Currency-related:Millions of yen
2020
TypeContract amounts
Over one year Fair value
Principal accounting procedure:Currency swaps ¥133,852 ¥22,602 ¥(1,397)Total ¥ — ¥ — ¥(1,397)
Millions of yen2019
TypeContract amounts
Over one year Fair value
Principal accounting procedure:Currency swaps ¥20,994 ¥4,900 ¥(205)Total ¥ — ¥ — ¥(205)
Thousands of U.S. dollars2020
TypeContract amounts
Over one year Fair value
Principal accounting procedure:Currency swaps $1,229,918 $207,682 $(12,837)Total $ — $ — $(12,837)
(c) Stock-related:
There were no stock-related transactions at March 31,
2020 and 2019.
(d) Bond-related:
There were no bond-related transactions at March 31,
2020 and 2019.
7. LOANS AND BILLS DISCOUNTED
Loans at March 31, 2020 and 2019 include “Risk-Managed
Loan Amounts” as follows:
(1) Loans to borrowers in bankruptcy amounting to
¥16,372 million ($150 million) and ¥14,168 million
denote loans subject to Article 96-1-3 and 96-1-4 of
“Order for Enforcement of the Corporation Tax Act”
(Cabinet Order No. 97 of 1965) on which interest
accrual has stopped as there is doubt about the
collectability of either principal or interest because they
have been contractually past due for a considerable
period of time or for other reasons.

43 YMFG Annual Report 2020
(2) Other delinquent loans amounting to ¥71,435 million
($656 million) and ¥65,253 million denote loans
on which the Banks have stopped accruing interest
excluding loans to borrowers in bankruptcy and loans
on which interest payments are deferred in order to
promote recovery of borrowers in economic diffi culty.
(3) Loans past due for three months or more amounting
to ¥767 million ($7 million) and ¥1,192 million denote
loans where payment of interest or principal has been
delayed for three months or more excluding loans to
borrowers in bankruptcy and other delinquent loans.
(4) Restructured loans amounting to ¥9,931 million
($92 million) and ¥12,203 million denote loans to
borrowers for which the repayment terms have been
modifi ed to more favorable terms including reduction
of interest rate, deferral of interest payments, extension
of principal payments and debt forgiveness with
the objective of promoting recovery of borrowers in
economic diffi culty excluding loans to borrowers in
bankruptcy, other delinquent loans, and past-due loans.
(5) The total of loans to borrowers in bankruptcy, other
delinquent loans, past-due loans, and restructured
loans amounted to ¥98,505 million ($905 million) and
¥92,816 million.
The loan amounts disclosed from (1) to (5) above are
amounts before deducting an allowance for loan losses.
Commercial bills Bills discounted are accounted for as fi nancing transactions
in accordance with the Industry Audit Committee Report
No. 24, February 13, 2002, of the JICPA, although the
Banks have the right to sell or pledge them without
restrictions. The total face value of commercial bills and
purchased foreign exchange bills obtained as a result of
discounting was ¥32,049 million ($294 million) at March
31, 2020 and ¥41,462 million at March 31, 2019.
Loan Participation Based on “Accounting Treatment and Presentation of
Loan Participation,” (Japanese Institute of Certifi ed Public
Accountants Accounting System Committee Report No.
3, November 28, 2014), the consolidated balance sheet
amount of loan participation agreements in which the
Banks have acquired the economic benefi ts and risks of
the underlying loans from the original lender was ¥2,694
million ($25 million) at March 31, 2020 and ¥7,015 million
at March 31, 2019.
8. COMMITMENT LINES
Loan agreements and commitment line agreements
relating to loans are agreements that oblige the
consolidated subsidiaries to lend funds up to a certain limit
agreed in advance. The consolidated subsidiaries make
the loans upon the request of an obligor to draw down
funds under such loan agreements as long as there is no
breach of the various terms and conditions stipulated in the
relevant loan agreement. The unused commitment balance
relating to these loan agreements amounted to ¥907,251
million ($8,336 million) at March 31, 2020 and ¥920,674
million at March 31, 2019. Of this amount, ¥751,011
million ($6,901million) at March 31, 2020, and ¥776,530
million at March 31, 2019, relates to loans for which the
term of the agreement is one year or less, or unconditional
cancellation of the agreement is allowed at any time.
In many cases the term of the agreement runs its course
without the loan ever being drawn down. Therefore,
the unused loan commitment will not necessarily affect
future cash fl ows. Conditions are included in certain loan
agreements that allow the consolidated subsidiaries either
to decline the request for a loan draw-down or to reduce
the agreed limit amount when there is due cause to do
so, such as when there is a change in fi nancial condition
or when it is necessary to protect the consolidated
subsidiaries’ credit. Consolidated subsidiaries take various
measures to protect their credit. Such measures include
having the obligor pledge collateral to the consolidated
subsidiaries in the form of real estate, securities, etc., at
entering into a loan agreement or in accordance with the
consolidated subsidiaries’ established internal procedures
for confi rming the obligor’s fi nancial condition, etc., at
regular intervals.

YMFG Annual Report 2020 44
9. PLEDGED ASSETS
At March 31, 2020 and 2019, the following assets were
pledged as collateral for certain liabilities of the Banks.
Millions of yenThousands of U.S. dollars
2020 2019 2020Cash and due from banks ¥ 14 ¥ 14 $ 129Securities 373,158 272,155 3,428,816
The collateral was pledged to secure the following:
Millions of yenThousands of U.S. dollars
2020 2019 2020Deposits ¥ 42,258 ¥28,693 $ 388,294Call money 21,222 — 195,001Payables under securities lending transactions
161,466 67,711 1,483,653
In addition, securities not included in the above
schedules were pledged as collateral for operating
transactions, such as foreign exchange contracts and
forward exchange contracts. These securities amounted
to ¥6,223 million ($57 million) at March 31, 2020 and
securities amounted to ¥9,045 million at March 31, 2019.
Also, other assets included security deposits, collateral
pledged for transactions involving public funds, collateral
pledged for fi nancial instruments, collateral pledged for
exchange settlements, the fi nancial futures margin and
margin on bond futures transactions, as indicated below.
Millions of yenThousands of U.S. dollars
2020 2019 2020Deposits ¥ 2,552 ¥ 2,858 $ 23,449Collateral pledged for transactions involving public funds
1,199 1,188 11,017
Collateral pledged for fi nancial instruments
30,587 6,267 281,053
Collateral pledged for exchange settlements
75,600 70,000 694,661
Financial futures margin 10 10 92Margin on bond futures transactions
1,000 — 9,189
10. ACCUMULATED DEPRECIATION
Accumulated depreciation of tangible assets was ¥78,245
million ($719 million) at March 31, 2020, and ¥76,231
million at March 31, 2019.
11. ADVANCED DEPRECIATION AMOUNT OF TANGIBLE FIXED ASSETS
At March 31, 2020 and 2019, accumulated advanced
depreciation amount of tangible fi xed assets were ¥8,175
million ($75 million) and ¥8,178 million. There were no
such advance depreciation expenses in fi scal year ended
March 31, 2020 and 2019.
12. IMPAIRMENT LOSSES
During the fi scal year ended March 31, 2020 and 2019,
impairment losses were recorded on the following assets.
Location Primary use Type
Impairment loss
Millions of yenThousands of U.S. dollars
2020 2019 2020Within Yamaguchi Prefecture
Assets for lease
Land, buildings, movable property
¥ — ¥11 $ —
Within Hiroshima Prefecture
Business-use assets
Movable property
¥ — ¥0 $ —
Within Fukuoka Prefecture
Business-use assets
Buildings, movable property
¥ 12 ¥2 $ 110
Within Ehime Prefecture
Idle assets for sale
Land, buildings
¥ 93 ¥— $ 864
Within Tokyo Metropolitan
Business-use assets
Buildings, movable property
¥ 28 ¥— $ 257
Other Business-use assets
Buildings, movable property
¥ 11 ¥— $ 92
Total ¥144 ¥14 $1,323
YMFG and its consolidated subsidiaries that engage in the
banking and securities business group their business-use
assets into the smallest units possible from the standpoint of
management accounting, which is the branch. Idle assets are,
in principle, grouped as units of individual assets. In addition,
corporate headquarters, administrative centers, training
facilities, company housing and dormitories are considered
corporate assets, as these are related to all the consolidated
subsidiaries which are engaged in the banking businesses.
Consolidated subsidiaries that do not engage in the
banking and securities business group their assets, in
principle, on an individual company basis.
In the fi scal year ended March 31, 2020 and 2019, the
book values of the business-use and idle assets, which were

45 YMFG Annual Report 2020
determined not to create suffi cient operating cash fl ow
are reduced to their recoverable values, and recognized
the reduction of ¥144 million ($1,323 thousand) and ¥14
million as impairment losses. This amount includes land
of ¥88 million ($817 thousand), buildings of ¥46 million
($414 thousand) and movable property of ¥10 million ($92
thousand) in fi scal year ended March 31, 2020, and land of
¥6 million, buildings of ¥5 million and movable property of
¥3 million in fi scal year ended March 31, 2019.
The recoverable amount used to estimate the
impairment loss for the fi scal year ended March 31, 2020
and 2019, is the net selling price, which is calculated by
deducting the expected disposal cost from the expected
disposal value.
13. BORROWED MONEY
Payment schedule of borrowed money as of March 31, 2020 is as follows:
Millions of yenThousands of U.S. dollars
2020 ¥ 9,232 $ 84,8302021 5,917 54,3692022 4,215 38,7302023 2,890 26,5552024 1,457 13,388Thereafter 4,288 39,401Total ¥27,999 $257,273
14. PROVISION FOR EMPLOYEE RETIREMENT BENEFITS
Overview of severance payments and pension plansYMFG and some consolidated subsidiaries employ funded
and unfunded defi ned benefi t and defi ned contribution
plans as employee retirement benefi ts.
Defi ned benefi t plans include defi ned benefi t corporate
pension plans and lump-sum retirement plans. Also, some
are established as retirement benefi t trusts.
Some consolidated subsidiaries employ the simplifi ed
method for calculating retirement benefi t obligations.
Defi ned benefi t plans(1) Reconciliation of retirement benefi t obligation
balances at the beginning and the end of the fi scal year ended March 31, 2020 and 2019
Millions of yenThousands of U.S. dollars
2020 2019 2020Retirement benefi t obligations at the beginning of the fi scal year
¥60,535 ¥59,819 $556,225
Service cost 1,784 1,728 16,393 Interest cost 99 152 910 Actuarial differences 2,257 1,895 20,739 Retirement benefi t payments (2,995) (3,061) (27,520) Others (4) 2 (28)Retirement benefi t obligations at the end of the fi scal year
¥61,676 ¥60,535 $566,719
(2) Reconciliation of plan asset balances at the beginning and the end of the fi scal year ended March 31, 2020 and 2019
Millions of yenThousands of U.S. dollars
2020 2019 2020Balance of plan assets at the beginning of the fi scal year
¥96,302 ¥102,726 $884,894
Expected return on plan assets 2,137 2,033 19,636Actuarial differences (4,561) (8,680) (41,909)Contribution from employer 759 2,125 6,974Retirement benefi t payments (2,150) (2,203) (19,756)Others 301 301 2,757Balance of plan assets at the end of the fi scal year
¥92,788 ¥ 96,302 $852,596
(3) Reconciliation of the balances of retirement benefi t obligations and plan assets at the end of the fi scal year ended March 31, 2020 and 2019, and the carrying amounts of net defi ned benefi t liability and net defi ned benefi t asset
Millions of yenThousands of U.S. dollars
2020 2019 2020Retirement benefi t obligations of funded plans
¥ 61,588 ¥ 60,449 $ 565,910
Plan assets (92,788) (96,303) (852,596)(31,200) (35,854) (286,686)
Retirement benefi t obligations of unfunded plans
88 85 809
Net carrying amount of obligations and assets
¥(31,112) ¥(35,769) $(285,877)

YMFG Annual Report 2020 46
Millions of yenThousands of U.S. dollars
2020 2019 2020Net retirement benefi t liability ¥ 3,930 ¥ 2,906 $ 36,111Net retirement benefi t asset (35,042) (38,675) (321,988)Net carrying amount of obligations and assets
¥(31,112) ¥(35,769) $(285,877)
(4) Retirement benefi t costs and their breakdowns
Millions of yenThousands of U.S. dollars
2020 2019 2020Service cost* ¥ 1,784 ¥ 1,728 $ 16,393Interest cost 99 152 910Expected return on plan assets (2,137) (2,033) (19,636)Recognized actuarial loss (418) 25 (3,841)Others 71 80 643Retirement benefi t costs on defi ned benefi t plans
¥ (601) ¥ (48) $ (5,531)
* Excludes employee contribution portion of defi ned benefi t corporate pensions
(5) Remeasurements of defi ned benefi t plansItems posted as remeasurements of defi ned benefi t plans
(before tax-effect exclusions) break down as follows.
Millions of yenThousands of U.S. dollars
2020 2019 2020Actuarial gain (loss) ¥(7,235) ¥(10,550) $(26,721)Total ¥(7,235) ¥(10,550) $(26,721)
(6) Cumulative remeasurements of defi ned benefi t plans
Items posted as cumulative remeasurements of defi ned
benefi t plans (before tax-effect exclusions) break down
as follows.
Millions of yenThousands of U.S. dollars
2020 2019 2020Unrecognized actuarial gain (loss)
¥2,908 ¥(4,328) $(26,721)
Total ¥2,908 ¥(4,328) $(26,721)
(7) Plan assets(i) Percentages of major asset categories to total plan assets
are as follows.2020 2019
Bonds 30% 29%Shares 47% 49%Others 23% 22%Total 100% 100%
(Note) Plan assets include 45% of corporate pension plans established as retirement benefi t trusts at the end of the fi scal year ended March 31, 2020, and 45% at March 31, 2019.
(ii) Method of establishing expected long-term return on
plan assets
(Corporate pensions)
Based on the weighted average rate according to the policy
asset mix (medium- to long term portfolio) of the expected
rate of return for individual investment fi duciary institutions,
net of investment cost
(Retirement benefi t trusts)
Past dividend performance is converted to yield.
(8) Basis of actuarial calculationThe basis of actuarial calculations as of March 31, 2020
and 20192020 2019
Discount rate 0.00%—0.51% 0.00%—0.77%
Expected long-term rate of return on plan assets
1.50%—2.60% 1.20%—2.60%
Expected rate of salary increase 0.63%—3.84% 0.65%—4.26%
Defi ned contribution plansThe required contribution to the consolidated subsidiaries’
defi ned contribution plans at the end of the fi scal year
ended March 31, 2020 and 2019 were ¥279 million ($3
million) and ¥282 million, respectively.

47 YMFG Annual Report 2020
15. REVALUATION RESERVE FOR LAND
Pursuant to the Law concerning Revaluation of Land
(Law No. 34, promulgated March 31, 1998, the “Law”),
YMFG revalued certain land used for banking operations
by consolidated subsidiaries. The tax-equivalent portion of
this revaluation amount was recorded in liabilities under
“deferred tax liabilities for revaluation reserve for land,”
and the reminder under net assets as “revaluation reserve
for land.”
Revaluation date: March 31, 1998
Item 3, Article 3, of the Law establishes the evaluation
method as that prescribed by Article 2-4 of the Order for
Enforcement of Law on Revaluation of Land (Enforcement
Order No. 119, promulgated March 31, 1998), and the
amount of land tax is calculated on the basis of the land
tax amount specifi ed under Article 16 of the Land-holding
Tax Act, adjusted rationally in accordance with the basis of
calculation announced offi cially by the Director General of
the National Tax Administration Agency.
Total difference between market value of land for
business use revalued in accordance with Article 10 of the
Law and the total post-revaluation book value of land at
March 31, 2020 and 2019 were ¥18,369 million ($169
million) and ¥20,113 million, respectively.
16. CONTINGENT LIABILITIES — ACCEPTANCES AND GUARANTEES
All contingent liabilities, including letters of credit,
acceptances and guarantees are refl ected in acceptances
and guarantees. As a contra account, customers’
liabilities for acceptances and guarantees are shown
on the asset side, which represent the Banks’ right of
indemnity from customers.
17. OTHER INCOME
Other income included the gains on sale of stock of
¥13,840 million ($127 million), income from investment
partnership of ¥1,574 million ($14 million) and gains on
investment in money held in trust of ¥984 million ($9
million) for the fi scal year ended March 31, 2020 and the
gains on sale of stock of ¥9,684 million, income from
investment partnership of ¥922 million and gains on
investment in money held in trust of ¥4 million for the
fi scal year ended March 31, 2019.
18. GENERAL AND ADMINISTRATIVE EXPENSES
Items included operating expenses for the year ended
March 31, 2020 and 2019 were as follows:
Millions of yenThousands of U.S. dollars
2020 2019 2020Salary and allowance ¥31,328 ¥31,302 $287,862Depreciation ¥ 6,142 ¥ 6,472 $ 56,437
19. OTHER EXPENSES
Items included other expenses for the year ended March
31, 2020 and 2019 were as follows:
Millions of yenThousands of U.S. dollars
2020 2019 2020Loss on sale of stock ¥4,408 ¥2,408 $40,504Losses on devaluation of stocks and other securities
¥ 818 ¥ 33 $ 7,516
Loss on investment in money held in trust
¥ 16 ¥ 821 $ 147
20. LEASE TRANSACTIONS
1. Finance lease transactions
Finance lease transactions that do not transfer ownership
(i) Content of lease assets
Tangible fi xed assets
Mainly vehicles and offi ce equipment
Intangible fi xed assets
Software
(ii) Depreciation method for lease assets
As described in “Lease assets under” (5) Accounting
Policies, in “2. SIGNIFICANT ACCOUNTING POLICIES.”

YMFG Annual Report 2020 48
2. Operating leases
Future minimum lease payments at March 31, 2020 and
2019 were as follows:
Borrower
Millions of yenThousands of U.S. dollars
2020 2019 2020Within one year ¥123 ¥111 $1,130More than one year 726 827 6,671Total minimum lease payments ¥849 ¥938 $7,801
Lender
Millions of yenThousands of U.S. dollars
2020 2019 2020Within one year ¥1 ¥— $ 9More than one year 7 — 64Total minimum lease payments ¥8 ¥— $73
21. INCOME TAXES
1. Signifi cant components of the deferred tax assets and
liabilities as of March 31, 2020 and 2019 were as follows:
Millions of yenThousands of U.S. dollars
2020 2019 2020
Deferred tax assets: Allowance for loan losses ¥17,174 ¥14,639 $157,806 Deferred gains or losses on hedges
4,672 560 42,929
Net defi ned benefi t liability 1,474 433 13,544 Provision for bonuses 867 844 7,967 Unrealized gains on available-for-sale securities
664 — 6,101
Depreciation 642 699 5,899 Net operating losses carryforwards
511 296 4,695
Losses on devaluation of securities
505 668 4,640
Other 2,376 2,306 21,832 Deferred tax assets 28,885 20,445 265,413 Valuation allowance (1,501) (1,479) (13,792) Total deferred tax assets 27,384 18,966 251,621Deferred tax liabilities: Unrealized gains on available-for-sale securities
(4,486) (19,576) (41,220)
Securities contributed to retirement benefi t trusts
(3,045) (3,067) (1,185)
Net defi ned benefi t asset (129) (766) (27,979) Other (1,352) (1,361) (12,414) Total deferred tax liabilities (9,012) (24,770) (82,798)Net deferred tax assets (liabilities)
¥18,372 ¥ (5,804) $168,823
2. Signifi cant differences between the statutory effective
tax rate and the actual income tax rate after application
of deferred income tax accounting for the year ended
March 31, 2020 and 2019 were omitted, as the
difference between the effective statutory tax rate and
the actual tax rate after application of deferred income
tax accounting were 5% or less of the effective statutory
tax rate.
22. NET ASSETS
Under the Companies Act of Japan (“the Act”), the entire
amount paid for new shares is in principle required to be
designated as common stock. However, a company may,
by a resolution of the Board of Directors, designate an
amount not exceeding one-half of the price of the new
shares as additional paid-in capital, which is included in
capital surplus.
Under the Act, in cases where dividend distribution of
surplus is made, the smaller of an amount equal to 10%
of the dividend or the excess, if any, of 25% of common
stock over the total of additional paid-in capital and legal
earnings reserve must be set aside as additional paid-in
capital or legal earnings reserve. Legal earnings reserve
is included in retained earnings in the accompanying
Consolidated Balance Sheets.
Under the Act, legal earnings reserve and additional
paid-in capital may be used to eliminate or reduce a
defi cit, or may be capitalized, by a resolution of the
shareholders’ meeting.
Under the Act, additional paid-in capital and legal
earnings reserve may not be distributed as dividends,
however all of these may be transferred to other capital
surplus and retained earnings, respectively, which are
potentially available for dividends.
The maximum amount that YMFG can distribute as
dividends is calculated based on the Non-Consolidated
Financial Statements of YMFG in accordance with the Act.
At the annual shareholders’ meeting, held on June 25,
2020, the shareholders approved cash dividends amounting
to ¥3,063 million ($28 million). Such appropriations have
not been accrued in the Consolidated Financial Statements

49 YMFG Annual Report 2020
as of March 31, 2020 and to be recognized in the period in
which they are approved by the shareholders.
At the annual shareholders’ meeting, held on June
25, 2019, the shareholders approved cash dividends
amounting to ¥2,807 million. Such appropriations have not
been accrued in the Consolidated Financial Statements as
of March 31, 2019 and to be recognized in the period in
which they are approved by the shareholders.
23. CHANGES IN NET ASSETS
1. Type and number of shares issued and treasury shares
were as follows:Number of shares (in thousand)
March 31, 2019 Increase Decrease March 31,
2020Shares issued Common stock 264,353 — — 264,353 Total 264,353 — — 264,353Treasury stock Common stock*1, *2, *3 10,749 445 635 10,559 Total 10,749 445 635 10,559
*1 The increase in the number of treasury stock is due to additional increase of Board Benefi t Trust (BBT) of 443 thousand shares, and purchases of shares constituting less than one trading unit, totaling 1 thousand shares. The decrease of treasury stock included the sale of 533 thousand shares from the ESOP Trust for Group employees to the YMFG stock ownership plan, the 85 thousand shares for the exercise of share options, 16 thousand shares due to the exercise of rights of the Board Benefi t Trust (BBT) and purchases of shares constituting less than one trading unit, which amounted to 0 thousand shares.
*2 Treasury stock as of beginning and ending of fi scal year ended March 31, 2020 include 990 thousand shares and 456 thousand shares held by the ESOP Trust for employee shareholders.
*3 Treasury stock as of beginning and ending of fi scal year ended March 31, 2020 include 578 thousand shares and 1,005 thousand shares held by the Board Benefi t Trust (BBT).
Number of shares (in thousand)March 31,
2018 Increase Decrease March 31, 2019
Shares issued Common stock 264,353 — — 264,353 Total 264,353 — — 264,353Treasury stock Common stock*1, *2, *3 17,853 14,653 21,756 10,750 Total 17,853 14,653 21,756 10,750
*1 The increase in the number of treasury stock is due to market purchases of 14,644 thousand shares, and purchases of shares constituting less than one trading unit, totaling 8 thousand shares. The decrease of treasury stock included 21,184 thousand shares stemming from the exercise of convertible bond-type share options to shares denominated in euros and US dollars that matured in 2018, the sale of 332 thousand shares from the ESOP Trust for Group employees to the YMFG stock ownership plan, the 167 thousand shares for the exercise of share options, 52 thousand shares due to the exercise of rights of the Board Benefi t Trust (BBT), the sale of 17 thousand shares to the parent company of a consolidated subsidiary and an equity-method affi liate and purchases of shares constituting less than one trading unit, which amounted to 0 thousand shares.
*2 Treasury stock as of beginning and ending of fi scal year ended March 31, 2019 include 1,323 thousand shares and 990 thousand shares held by the ESOP Trust for employee shareholders.
*3 Treasury stock as of beginning and ending of fi scal year ended March 31, 2019 include 631 thousand shares and 578 thousand shares held by the Board Benefi t Trust (BBT).
2. Stock options
Stock options at March 31, 2020 and 2019 were ¥127
million ($1 million) and ¥209 million, respectively.
3. Information on dividends is as follows:
(a) Dividends paid in the fi scal year ended March 31, 2020
and 2019.
Type of shares
Aggregate amount of dividends (Millions of yen)
Cash dividends per share
(Yen)
Record date
Effective date
Resolved at the board of directors meeting on May 11, 2019Common stock ¥2,807*1 ¥11.00 Mar. 31,
2019Jun. 26,
2019Resolved at the board of directors meeting on November 7, 2019Common stock ¥3,063*2 ¥12.00 Sep. 30,
2019Dec. 10,
2019
*1 The total amount of dividend on common stock includes ¥17 million in dividends to ESOP Trust for employee shareholders and Board Benefi t Trust (BBT).
*2 The total amount of dividend on common stock includes ¥15 million in dividends to ESOP Trust for employee shareholders and Board Benefi t Trust (BBT).
Type of shares
Aggregate amount of dividends (Millions of yen)
Cash dividends per share
(Yen)
Record date
Effective date
Resolved at the board of directors meeting on May 11, 2018Common stock ¥2,488*1 ¥10.00 Mar. 31,
2018Jun. 27,
2018Resolved at the board of directors meeting on November 9, 2018Common stock ¥2,751*2 ¥11.00 Sep. 30,
2018Dec. 10,
2018
*1 The total amount of dividend on common stock includes ¥20 million in dividends to ESOP Trust for employee shareholders and Board Benefi t Trust (BBT).
*2 The total amount of dividend on common stock includes ¥19 million in dividends to ESOP Trust for employee shareholders and Board Benefi t Trust (BBT).
Type of shares
Aggregate amount of dividends
(Thousands of U.S. dollars)
Cash dividends per share
(U.S. dollars)
Record date
Effective date
Resolved at the board of directors meeting on May 11, 2019Common stock $25,792*1 $0.10 Mar. 31,
2019Jun. 26,
2019Resolved at the board of directors meeting on November 7, 2019Common stock $28,145*2 $0.11 Sep. 30,
2019Dec. 10,
2019
*1 The total amount of dividend on common stock includes $156 thousand in dividends to ESOP Trust for employee shareholders and Board Benefi t Trust (BBT).
*2 The total amount of dividend on common stock includes $138 thousand in dividends to ESOP Trust for employee shareholders and Board Benefi t Trust (BBT).

YMFG Annual Report 2020 50
(b) Dividends to be paid in the fi scal year ending March 31,
2020 and 2019 are as follows:(Millions of yen, except per share amount)
Type of shares
Aggregate amount of dividends
(Millions of yen)
Source of
dividends
Cashdividendsper share
(Yen)
Recorddate
Effectivedate
Common stock ¥3,063* Retainedearnings
¥12.00 Mar. 31, 2020
Jun. 26, 2020
* The total amount of dividend on common stock includes ¥18 million in dividends to ESOP Trust and for employee shareholders and Board Benefi t Trust (BBT).
(Millions of yen, except per share amount)
Type of shares
Aggregate amount of dividends
(Millions of yen)
Source of
dividends
Cashdividendsper share
(Yen)
Recorddate
Effectivedate
Resolved at the board of directors meeting on May 10, 2019Common stock ¥2,807* Retained
earnings¥11.00 Mar. 31,
2019Jun. 26,
2019
* The total amount of dividend on common stock includes ¥17 million in dividends to ESOP Trust and for employee shareholders and Board Benefi t Trust (BBT).
(Thousands of U.S. dollars, except per share amount)
Type of shares
Aggregate amount of dividends
(Thou-sands of U.S. dol-
lars)
Source of
dividends
Cashdividendsper share(U.S. dol-
lars)
Recorddate
Effectivedate
Resolved at the board of directors meeting on May 15, 2020Common stock $28,145* Retained
earnings$0.11 Mar. 31,
2020Jun. 26,
2020
* The total amount of dividend on common stock includes $165 thousand in dividends to ESOP Trust and for employee shareholders and Board Benefi t Trust (BBT).
24. STOCK OPTIONS
At a Board of Directors meeting, resolutions were passed
with regard to subscription requirements for the allotment
of stock options as compensation to directors of YMFG’s
banking subsidiaries, Yamaguchi Bank, Momiji Bank and
Kitakyushu Bank. The details of these resolutions are
described below.
1. Recording of expenses related to stock options and the
name of line items.
There were no expenses in the fi scal year ended March 31,
2020 and 2019.
2. The contents of the stock options are outlined as below.2016
Category and number of persons to be granted stock options
27 directors (excluding directors who are members of the Audit and Supervi-sory Committee, part-time directors and outside directors) of YMFG’s subsidiar-ies, Yamaguchi Bank, Momiji Bank and Kitakyushu Bank.
Number of stock options by class of stock*
122,000 shares of YMFG’s common stock
Grant date August 25, 2015
Vesting conditions No vesting conditions set
Target length of service period
No target length of service period set
Period for exercise of rights August 26, 2015—August 25, 2045
2015
Category and number of persons to be granted stock options
27 directors (excluding outside directors) of YMFG’s subsidiaries, Yamaguchi Bank, Momiji Bank and Kitakyushu Bank.
Number of stock options by class of stock*
182,900 shares of YMFG’s common stock
Grant date July 29, 2014
Vesting conditions No vesting conditions set
Target length of service period
No target length of service period set
Period for exercise of rights July 30, 2014—July 29, 2044

51 YMFG Annual Report 2020
2014
Category and number of persons to be granted stock options
27 directors (excluding outside directors) of YMFG’s subsidiaries, Yamaguchi Bank, Momiji Bank and Kitakyushu Bank.
Number of stock options by class of stock*
225,100 shares of YMFG’s common stock
Grant date July 23, 2013
Vesting conditions No vesting conditions set
Target length of service period
No target length of service period set
Period for exercise of rights July 24, 2013—July 23, 2043
2013
Category and number of persons to be granted stock options
27 directors (excluding outside directors) of YMFG’s subsidiaries, Yamaguchi Bank, Momiji Bank and Kitakyushu Bank.
Number of stock options by class of stock*
294,900 shares of YMFG’s common stock
Grant date July 30, 2012
Vesting conditions No vesting conditions set
Target length of service period
No target length of service period set
Period for exercise of rights July 31, 2012—July 30, 2042
2012
Category and number of persons to be granted stock options
27 directors (excluding outside directors) of YMFG’s subsidiaries, Yamaguchi Bank, Momiji Bank and Kitakyushu Bank.
Number of stock options by class of stock*
192,600 shares of YMFG’s common stock
Grant date October 31, 2011
Vesting conditions No vesting conditions set
Target length of service period
No target length of service period set
Period for exercise of rights November 1, 2011—October 31, 2041
Note: Stated as the equivalent number of shares.
From the fi scal year ended March 31, 2016, the issuance
of stock options to directors of the YMFG subsidiaries
Yamaguchi Bank, Momiji Bank and Kitakyushu Bank
(excluding directors who are Audit and Supervisory
Committee members, part-time directors and outside
directors) was discontinued.
3. The summary of stock option activity is as indicated below.
(a) Number of stock options2016 2015 2014 2013 2012
Prior to vesting As of the end of the previous consolidated fi scal year
— — — — —
Granted — — — — — Expired — — — — —Vested — — — — —Rights not yet determined
— — — — —
After vesting As of the end of the previous consolidated fi scal year
52,600 60,000 41,300 36,700 18,700
Rights determined — — — — — Rights exercised 17,600 20,700 19,400 16,500 10,900 Expiry — — — — — Amount unexercised
35,000 39,300 21,900 20,200 7,800
(b) Price informationYen
2016 2015 2014 2013 2012Exercise price ¥ 1 ¥ 1 ¥ 1 ¥ 1 ¥ 1Average share price at time of exercise
759 759 759 759 759
Fair value on date granted
1,377 1,015 973 619 660
4. Method for estimating the number of rights determined
for stock options
Due to the diffi culty of rationally estimating the future
number of rights that will expire, in general a method is
employed that refl ects only the number of rights that have
actually expired.
25. INVESTMENT AND RENTAL PROPERTY
This note is omitted, as the total amount of investment and
rental property is immaterial.

YMFG Annual Report 2020 52
26. CONSOLIDATED STATEMENTS OF COMPREHENSIVE INCOME
Amounts of reclassifi cation adjustments and tax effect
amounts related to other comprehensive income in the
consolidated fi scal year ended March 31, 2020 and 2019
were as follows.
Millions of YenThousands of U.S. dollars
2020 2019 2020Unrealized gains (losses) on available- for-sale securitiesAmount generated during the year
¥(25,811) ¥ (3,090) $(237,168)
Reclassifi cation adjustments (25,959) (17,133) (238,528)Before tax effect adjustment (51,770) (20,224) (475,696)Tax effect amount 15,739 5,992 144,629Unrealized gains (losses) on available-for-sale securities
(36,031) (14,232) (331,067)
Deferred gains (losses) on hedgesAmount generated during the year
(14,259) (2,547) (131,021)
Reclassifi cation adjustments 760 963 6,983Before tax effect adjustment (13,499) (1,584) (124,038)Tax effect amount 4,112 482 37,784Deferred gains (losses) on hedges
(9,387) (1,102) (86,254)
Remeasurements of defi ned benefi t plansAmount generated during the year
(6,818) (10,575) (62,648)
Reclassifi cation adjustments (418) 25 (3,841)Before adjustment for tax effects
(7,236) (10,550) (66,489)
Tax effect amount 2,205 3,210 20,253Remeasurements of defi ned benefi t plans
(5,031) (7,340) (46,236)
Total other comprehensive income
¥(50,449) ¥(22,674) $(463,557)
27. SEGMENT INFORMATION
Business segment information is not presented, as the
Group’s business is predominantly consisted of the banking
business, and the securities brokerage, credit card, leasing,
consulting and other businesses conducted by the Group
collectively is limited.
Geographic segment information is not presented, as
domestic income of the Bank and consolidated subsidiaries
and their consolidated assets located substantially in Japan
represent more than 90% of the Group’s consolidated
income and assets.
Overseas sales information is not presented, as overseas
sales are less than 10% of the Group’s consolidated income.
28. RELATED PARTY TRANSACTIONS
Details of the transactions between the consolidated
subsidiaries of YMFG submitting the consolidated fi nancial
statements and related parties are as follows:
Executives and major shareholders of YMFG submitting the
consolidated fi nancial statements (only for individuals), etc.
For the year ended March 31, 2020
Category: Executive
Name: Kazuo Tsukuda
Occupation or title: Director and Audit and
Supervisory Committee
Member of YMFG
Relationship with related party: Lender of funds
Content of transaction: Lending of funds*
Transaction amount: ¥223 million ($2 million)
(average balance)
Account name: Loan
Year-end balance: ¥223 million ($2 million)* Conditions for this transaction and for method of deciding this transaction conditions were
the same as general transactions.
For the year ended March 31, 2019
Category: Executive
Name: Kazuo Tsukuda
Occupation or title: Director and Audit and
Supervisory Committee
Member of YMFG
Relationship with related party: Lender of funds
Content of transaction: Lending of funds*
Transaction amount: ¥223 million (average
balance)
Account name: Loan
Year-end balance: ¥223 million* Conditions for this transaction and for method of deciding this transaction conditions were
the same as general transactions.

53 YMFG Annual Report 2020
29. PER SHARE DATA
Yen U.S. dollars2020 2019 2020
Net assets per share ¥2,458.73 ¥2,580.74 $22.59Net income per share 100.07 94.65 0.92Net income per share (diluted) ¥ 93.86 ¥ 83.27 $ 0.86
Net assets per share are calculated based on the following:Millions of yen
except number of shares
Thousands of U.S. dollars
2020 2019 2020Net assets ¥630,245 ¥660,958 $5,791,096Amounts excluded from net assets
¥ 6,233 ¥ 6,473 $ 57,273
Stock options 127 209 1,167 Non-controling interests 6,106 6,264 56,106Net assets attributable to common stock at the fi scal year-end
624,012 654,485 5,733,823
Number of common stock at the fi scal year-end used for the calculation of net assets per share (in thousands)*
253,794 253,603 —
* Shares of YMFG held by the ESOP trust and the Board Benefi t Trust (BBT) are shown on the balance sheets as treasury stock, so are not included in the above number of common stock at the fi scal year-end used for the calculation of net assets per share. This number of shares held by the ESOP and the Board Benefi t Trust (BBT) was 1,568 thousand as of March 31, 2019, and 1,461 thousand as of March 31, 2020.
Net income per share is calculated based on the following:Millions of yen
except number of shares
Thousands of U.S. dollars
2020 2019 2020Net income attributable to owners of the parent
¥ 25,391 ¥ 23,149 $233,309
Amount not attributable to common shareholders
— — —
Net income attributable to owners of the parent for common stock
25,391 23,149 233,309
Average shares of common stock during the year* (in thousands)
253,747 244,575 —
Diluted net income per share is calculated based on
the following:Millions of yen
except number of shares
Thousands of U.S. dollars
2020 2019 2020Net income adjustment attributable to owners of the parent
¥ 398 ¥ 462 $3,657
Interest expenses (excluding tax amount)
398 462 3,657
Increase of shares of common stock
21,003 38,980 —
Bonds with warrant 20,852 38,719 — Warrant 150 260 —Dilutive shares not including calculation due to no dilutive effect
— — —
* Shares of YMFG held by the ESOP trust and the Board Benefi t Trust (BBT) are shown on the balance sheets as treasury stock, so are not included in the above average shares of common stock during the year. The average number of shares was 1,487 thousand in the fi scal year ended March 31, 2020 and 1,734 thousand in the fi scal year ended March 31, 2019.
30. SUBSEQUENT EVENTS
For the year ended March 31, 2020
There were no signifi cant subsequent events. Dividends
were made in June 2020. Please refer to “22. NET ASSETS.”
For the year ended March 31, 2019
There were no signifi cant subsequent events. Dividends
were made in June 2019. Please refer to “22. NET ASSETS.”

YMFG Annual Report 2020 54

55 YMFG Annual Report 2020

YMFG Annual Report 2020 56

57 YMFG Annual Report 2020
ASSETSMill ions of yen
2020
Mill ions of yen
2019
Thousands of
U.S. dollars
2020
Assets Cash and due from banks ¥ 616,575 ¥ 608,108 $ 5,665,487 Call loans and bills purchased 33,168 83,137 304,769 Monetary claims bought 5,487 6,941 50,418 Trading assets 990 886 9,097 Money held in trust 40,738 23,275 374,327 Securities 945,873 896,686 8,691,289 Loans and bills discounted 4,234,787 4,043,045 38,911,945 Foreign exchanges 10,367 9,726 95,259 Other assets 118,689 109,267 1,090,592 Tangible fi xed assets 44,273 44,554 406,809 Intangible fi xed assets 3,570 3,771 32,803 Prepaid pension cost 19,038 17,626 174,933 Deferred tax assets 6,917 — 63,558 Customers’ liabilities for acceptances and guarantees 25,438 23,788 233,741 Allowance for loan losses (30,420) (26,801) (279,519) Total assets ¥ 6,075,490 ¥ 5,844,009 $ 55,825,508
LIABILITIES AND NET ASSETS (SHAREHOLDERS’ EQUITY) Liabilities: Deposits ¥ 5,358,972 ¥ 5,135,626 $ 49,241,680
Call money and bills sold 85,701 133,617 787,476 Payables under securities lending transactions 115,421 50,173 1,060,562 Trading liabilities 742 570 6,818 Borrowed money 4,844 5,584 44,510 Foreign exchanges 4,082 2,119 37,508 Other liabilities 65,437 53,902 601,277 Provision for bonuses 41 8 377 Provision for retirement benefi ts 106 113 974 Provision for directors’ stock benefi ts 137 104 1,259 Provision for reimbursement of deposits 622 796 5,715 Provision for customers point services 43 41 395 Deferred tax liabilities — 7,210 —Deferred tax liabilities for land revaluation 7,380 7,410 67,812 Acceptances and guarantees 25,438 23,788 233,741 Total liabilities 5,668,966 5,421,061 52,090,104
Net assets: Capital stock 10,006 10,006 91,942 Capital surplus 380 380 3,492 Retained earnings 379,841 364,850 3,490,223 Total shareholders’ equity 390,227 375,236 3,585,657 Net unrealized gains on securities 8,891 32,208 81,696 Deferred gains or losses on hedges (9,283) (1,255) (85,298)Revaluation reserve for land 16,689 16,759 153,349 Total valuation and translation adjustments 16,297 47,712 149,747 Total net assets 406,524 422,948 3,735,404 Total liabilities, and net assets ¥ 6,075,490 ¥ 5,844,009 $ 55,825,508
NONCONSOLIDATED BALANCE SHEETS (UNAUDITED)March 31, 2020 and 2019
Yamaguchi Bank Financial Statements

YMFG Annual Report 2020 58
Mill ions of yen
2020
Mill ions of yen
2019
Thousands of
U.S. dollars
2020
IncomeInterest income: Interest on loans and discounts ¥ 42,199 ¥ 43,039 $ 387,752 Interest and dividends on securities 15,704 13,459 144,298 Other interest income 1,039 1,486 9,547 Fees and commissions 9,889 10,565 90,866 Trading income 63 24 579 Other ordinary income 15,955 10,376 146,605 Other income 13,026 8,916 119,691 Total income 97,875 87,865 899,338
Expenses Interest expense: Interest on deposits 4,006 5,078 36,810 Interest on borrowings and rediscounts 2,596 1,842 23,854 Other interest expense 1,008 324 9,262 Fees and commissions payments 4,815 4,719 44,243 Other operating expenses 18,579 14,525 170,716 General and administrative expenses 26,952 28,137 247,652 Impairment losses 121 11 1,112 Other expenses 9,231 8,010 84,820Total expenses 67,308 62,646 618,469 Income before income taxes and minority interests 30,567 25,219 280,869 Income taxes: Current 8,154 7,387 74,924 Deferred (588) (956) (5,403)Net income ¥ 23,001 ¥ 18,788 $ 211,348
Amounts per share of common stock:Yen
2020
Yen
2019
U.S. dollars
2020
Net income ¥ 115.01 ¥ 93.94 $ 1.06 Cash dividends applicable to the year 43.14 37.44 0.40
NONCONSOLIDATED STATEMENTS OF INCOME (UNAUDITED)Years ended March 31, 2020 and 2019

59 YMFG Annual Report 2020
ASSETSMill ions of yen
2020
Mill ions of yen
2019
Thousands of
U.S. dollars
2020
Assets Cash and due from banks ¥ 273,147 ¥ 358,475 $ 2,509,850 Call loans and bills purchased 1,088 1,110 9,997 Monetary claims bought — 114 —Trading assets 590 579 5,421 Money held in trust 4,714 4,730 43,315 Securities 527,742 458,733 4,849,233 Loans and bills discounted 2,316,966 2,253,369 21,289,773 Foreign exchanges 7,983 5,286 73,353 Other assets 87,927 70,298 807,930 Tangible fi xed assets 35,174 35,662 323,201 Intangible fi xed assets 2,258 2,368 20,748 Prepaid pension cost 15,949 14,672 146,550 Deferred tax assets 11,191 5,557 102,830 Customers’ liabilities for acceptances and guarantees 7,515 8,453 69,053 Allowance for loan losses (23,688) (18,933) (217,661) Total assets ¥ 3,268,556 ¥ 3,200,473 $ 30,033,593
LIABILITIES AND NET ASSETS (SHAREHOLDERS’ EQUITY) Liabilities: Deposits ¥ 3,010,767 ¥ 2,982,359 $ 27,664,863
Call money and bills sold 6,530 — 60,002 Payables under securities lending transactions 46,045 17,538 423,091 Borrowed money 7,624 7,638 70,054 Foreign exchanges 31 25 285 Other liabilities 23,796 10,798 218,653 Provision for bonuses 7 1 64 Provision for directors’ stock benefi ts 80 84 735 Provision for reimbursement of deposits 352 415 3,234 Deferred tax liabilities for land revaluation 4,419 4,419 40,605 Acceptances and guarantees 7,515 8,453 69,053 Total liabilities 3,107,166 3,031,730 28,550,639
Net assets: Capital stock 10,000 10,000 91,886 Capital surplus 59,533 59,533 547,027 Retained earnings 92,317 90,012 848,268 Total shareholders’ equity 161,850 159,545 1,487,181 Net unrealized gains on securities (7,481) 816 (68,741)Deferred gains or losses on hedges (1,384) (23) (12,717)Revaluation reserve for land 8,405 8,405 77,231 Total valuation and translation adjustments (460) 9,198 (4,227) Total net assets 161,390 168,743 1,482,954 Total liabilities, and net assets ¥ 3,268,556 ¥ 3,200,473 $ 30,033,593
Momiji Bank Financial Statements
NONCONSOLIDATED BALANCE SHEETS (UNAUDITED)March 31, 2020 and 2019

YMFG Annual Report 2020 60
Mill ions of yen
2020
Mill ions of yen
2019
Thousands of
U.S. dollars
2020
IncomeInterest income: Interest on loans and discounts ¥ 22,862 ¥ 23,310 $ 210,071 Interest and dividends on securities 5,167 5,901 47,478 Other interest income 177 217 1,626 Fees and commissions 5,697 5,983 52,348 Other ordinary income 6,391 3,182 58,725 Other income 3,378 3,335 31,038 Total income 43,672 41,928 401,286
Expenses Interest expense: Interest on deposits 651 1,030 5,982 Interest on borrowings and rediscounts 338 459 3,106 Other interest expense 478 672 4,392 Fees and commissions payments 3,918 3,835 36,001 Other operating expenses 3,231 2,353 29,689 General and administrative expenses 19,287 20,905 177,221 Other expenses 8,135 3,085 74,749 Total expenses 36,038 32,339 331,140 Income before income taxes and minority interests 7,634 9,589 70,146 Income taxes: Current 2,632 1,065 24,185 Deferred (1,285) 817 (11,808)Net income ¥ 6,287 ¥ 7,707 $ 57,769
Amounts per share of common stock:Yen
2020
Yen
2019
U.S. dollars
2020
Net income ¥ 14.43 ¥ 17.69 $ 0.13 Cash dividends applicable to the year 9.83 8.39 0.09
NONCONSOLIDATED STATEMENTS OF INCOME (UNAUDITED)Years ended March 31, 2020 and 2019

61 YMFG Annual Report 2020
ASSETSMill ions of yen
2020
Mill ions of yen
2019
Thousands of
U.S. dollars
2020
Assets Cash and due from banks ¥ 81,689 ¥ 76,160 $ 750,611 Call loans and bills purchased 238 151 2,187 Securities 36,484 41,191 335,238 Loans and bills discounted 1,180,763 1,159,186 10,849,609 Foreign exchanges 6,310 5,442 57,980 Other assets 8,576 3,725 78,803 Tangible fi xed assets 19,355 19,530 177,846 Intangible fi xed assets 960 977 8,821 Prepaid pension cost 847 831 7,783 Customers’ liabilities for acceptances and guarantees 13,145 14,307 120,785 Allowance for loan losses (9,437) (9,393) (86,713) Total assets ¥ 1,338,930 ¥ 1,312,107 $ 12,302,950
LIABILITIES AND NET ASSETS (SHAREHOLDERS’ EQUITY) Liabilities: Deposits ¥ 1,181,146 ¥ 1,136,787 $ 10,853,129
Call money and bills sold 33,168 45,206 304,769 Borrowed money 700 790 6,432 Foreign exchanges 50 55 459 Other liabilities 4,897 4,763 44,997 Provision for bonuses 15 1 138 Provision for retirement benefi ts 1,199 1,161 11,017 Provision for directors’ stock benefi ts 95 70 873 Provision for reimbursement of deposits 56 71 515 Deferred tax liabilities 1,071 3,102 9,841 Deferred tax liabilities for land revaluation 3,458 3,458 31,774 Acceptances and guarantees 13,145 14,307 120,785 Total liabilities 1,239,000 1,209,771 11,384,729
Net assets: Capital stock 10,000 10,000 91,886 Retained earnings 73,675 71,578 676,973 Total shareholders’ equity 83,675 81,578 768,859 Net unrealized gains on securities 8,488 12,991 77,994 Revaluation reserve for land 7,767 7,767 71,368 Total valuation and translation adjustments 16,255 20,758 149,362 Total net assets 99,930 102,336 918,221 Total liabilities, and net assets ¥ 1,338,930 ¥ 1,312,107 $ 12,302,950
Kitakyushu Bank Financial Statements
NONCONSOLIDATED BALANCE SHEETS (UNAUDITED)March 31, 2020 and 2019

YMFG Annual Report 2020 62
Mill ions of yen
2020
Mill ions of yen
2019
Thousands of
U.S. dollars
2020
IncomeInterest income: Interest on loans and discounts ¥ 11,228 ¥ 11,329 $ 103,170 Interest and dividends on securities 627 609 5,761 Other interest income 46 52 423 Fees and commissions 1,535 1,444 14,105 Other ordinary income 171 119 1,571 Other income 2,123 418 19,507 Total income 15,730 13,971 144,537
Expenses Interest expense: Interest on deposits 456 471 4,190 Interest on borrowings and rediscounts 365 413 3,354 Other interest expense 6 8 55 Fees and commissions payments 1,247 1,116 11,458 General and administrative expenses 7,591 7,794 69,751 Other expenses 608 890 5,587 Total expenses 10,273 10,692 94,395 Income before income taxes and minority interests 5,457 3,279 50,142 Income taxes: Current 1,423 836 13,075 Deferred (77) (92) (708)Net income ¥ 4,111 ¥ 2,535 $ 37,775
Amounts per share of common stock:Yen
2020
Yen
2019
U.S. dollars
2020
Net income ¥ 4,110,771.21 ¥ 2,534,656.75 $ 37,772.41 Cash dividends applicable to the year ¥ 2,148,141.73 ¥ 1,869,750.48 $ 19,738.51
NONCONSOLIDATED STATEMENTS OF INCOME (UNAUDITED)Years ended March 31, 2020 and 2019

Yamaguchi Financial Group, Inc.Corporate Planning Dept.