Rana Adhikari Caltech The Next Gravity Wave Interferometers.

YIELD GUARANTEES AND THE PRODUCER WELFARE BENEFITS OF CROP
INSURANCE
Shyam Adhikari*
Graduate Research Assistant
Texas Tech University
Thomas O. Knight
Professor
Texas Tech University
Eric J. Belasco
Assistant Professor
Texas Tech University
Selected Paper prepared for presentation at the Agricultural & Applied Economics
Association’s 2010 AAEA, CAES & WAEA Joint Annual Meeting, Denver, Colorado, July 25-27,
2010.
Copyright 2010 by Shyam Adhikari, Thomas O. Knight, and Eric J. Belasco. All rights reserved.
Readers may make verbatim copies of this document for non commercial purposes by any means,
provided that this copyright notice appears on all such copies.
____________________________
* Corresponding Author, Department of Agricultural and Applied Economics, Texas Tech
University, Box 42132, Lubbock, TX 79409-2132, Tel: (806)-742-2464, E-mail:

1
Yield Guarantees and the Producer Welfare Benefits of Crop Insurance
Abstract
Crop yield and revenue insurance products with coverage based on actual production history
(APH) yields dominate the U.S. Federal Crop Insurance Program. The APH yield, which plays a
critical role in determining the coverage offered to producers, is based on a small sample of
historical yields for the insured unit. The properties of this yield measure are critical in
determining the value of the insurance to producers. Sampling error in APH yields has the
potential to lead to over-insurance in some years and under-insurance in other years. Premiums,
which are in part determined by the ratio of the APH yield to the county reference yield, are also
affected by variations in APH yields. Congress has enacted two measures, yield substitution and
yield floors, that are intended to limit the degree to which sampling error can reduce the
insurance guarantee and producer welfare. We examine the impact of sampling error and
related policy provisions for Texas cotton, Kansas wheat, and Illinois corn. The analysis is
conducted using county level yield data from the National Agricultural Statistics Service and
individual insured-unit-level yield data obtained from the Risk Management Agency’s insurance
database. Our findings indicate that sampling error in APH yields has the potential to reduce
producer welfare and that the magnitude of this effect differs substantially across crops. The
yield substitution and yield floor provisions reduce the negative impact of sampling error but
also bias guarantees upward, leading to increased government cost of the insurance programs.
Key Words: Actual Production History, Crop Insurance, Sampling Error, Yield Guarantee
Introduction
Actual Production History (APH) yield insurance was the dominant insurance product offered
under the U.S. federal crop insurance program prior to the mid-1990s. The APH yield insurance
guarantee is based on a fixed price and the simple average of from four to ten years of historical
yields for the insured unit. Yield guarantees for the Revenue Assurance (RA) and Crop Revenue
Coverage (CRC) revenue insurance products are determined in the same manner. These APH-
yield-based yield and revenue insurance products continue to dominate the crop insurance
program in terms of premium collected and liability insured.

2
The actual production history yield guarantee is based on a 4 to 10 year average of
historical yields for the insured unit. Sampling error in APH yields has the potential to lead to
over-insurance in some years (relative to the chosen coverage level) and under-insurance in other
years. Furthermore, premium rates vary substantially based on the ratio of the APH yield for an
insured unit to a predetermined county reference yield and thus are affected by sampling error.
The problem of errors in APH yields and resulting insurance guarantees has surfaced in recent
policy debates. In the early part of the current decade, many farmers in the Western Corn Belt
and Plains States believed that a multi-year drought was undermining the effectiveness of their
insurance coverage by biasing their yield guarantees downward and their premium rates upward
(Knight, 2003, High Plain/Mid West Ag Journal, 2004). In his Congressional testimony on this
issue, Knight (2003) showed that the average yield of cotton during the 24 years period from
1972-1995 was 303 pounds per acre in Martin County, Texas compared with an average of 120
pounds per acre in the 7 year period from 1996 to 2002. These recently clustered low yields
significantly lowered most producers yield guarantees below the trend-adjusted expected yield.
In addition to affecting insurance guarantees, premium rates, and producer welfare,
sampling error in APH yields also has the potential to contribute to adverse selection. Adverse
selection occurs when farmers are better informed than the insurer about their yield and
indemnity distributions. Farmers who recognize that they have an opportunity to over-insure, due
to positive sampling error, are more likely to insure and to choose high coverage levels.
Similarly, farmers who believe that their yield guarantee is too low are less likely to insure or, if
insuring, to choose lower coverage levels (Carriquiry, Babcock and Hart, 2008, henceforth
CBH). Given a premium structure that would otherwise be actuarially fair, this selection process
will result in the collection of premiums that are inadequate to cover expected indemnities.

3
Recognizing that the statistical properties of APH yields result in producers being offered
guarantees that are sometimes significantly different from their expected yield, Congress has
enacted two measures that are intended to limit the degree to which these statistical phenomena
can reduce the insurance guarantee. These two policy provisions are yield substitution and yield
floors. Yield substitution allows the producer to use 60% of a specified county proxy yield (T-
yield) as a substitute for the actual historical yield in any year when the actual yield falls below
60% of the T-yield. This causes the historical yield used for each year in the APH yield
calculation to be censored at 60% of the pre-established county T-yield for that year. Use of
yield substitution varies substantially based on variability of crop yields in different regions. For
example, the Risk Management Agency (RMA) yield history data show that, in 2008, 62% of
APH yields for dryland cotton in the Texas High Plains made use of yield substitution compared
with 15% for Illinois corn and 46% for dryland wheat in Kansas.
Yield floors set minimum APH yields for an insured unit in the insurance year. The basic
provisions relating to yield floors set a minimum on the APH yield for an insured unit equal to
70% of the county T-yield yield if only one year of actual historical yields is provided. This
increases to 75% if 2-4 years of historical yields are provided and 80% when 5-10 years of actual
yields are used. Thus, yield substitution sets a minimum value for any single year’s yield used in
the APH yield calculation, while yield floors set minimums on the APH yield itself. In 2008,
yield floors were used in establishing insurance guarantees for 8.12% of Texas dryland cotton
units, 3.94% of Illinois corn units, and 4.89% of insured Kansas wheat units (Table 1).

4
Table 1. Percent of Units Using Yield Substitution or Yield Floors in 2008
Yield limitation Cotton
Corn
Wheat
Texas Illinois Kansas
Yield floor 8.12 3.94 4.89
Yield substitution 61.69 14.99 45.56
It is clear that sampling error has the potential to affect the producer welfare benefits of
yield and revenue insurance products that are based on APH yields. Furthermore, it is also clear
that use of yield substitution and yield floors mitigates the effects of a sample (APH) yield that is
substantially lower than the expected yield while not dampening the effect of upside sampling
error. The objective of this paper is to examine the producer welfare effects of sampling error in
APH yields when considering the rigidities associated with yield substitution and yield floors.
The analysis is conducted (1) assuming that there are no legislative restrictions (such as yield
floors and substitutions) and that APH yields are simple averages of different lengths of
historical yield series for the insured unit and (2) imposing the current legislative restrictions of
yield substitution and yield floors. CBH used the expected indemnity to measure the effect of
APH yields that are subject to sampling error. We extend beyond the expected indemnity and
evaluate producer welfare effects based on certainty equivalent differences. This provides
significant new insight into the effects of APH yield variability on the effectiveness of the U.S.
Federal Crop Insurance program.
Conceptual Framework
The producer’s yield is a random variable y described by a distribution function f�y� with
mean µ� and varianceσ��. Let the APH yield have the distribution αf�y� with mean
αµ� and variance ��σ�� , where α � 0.50 to 0.85, in increments of 0.05, is the insurance

5
coverage level. If the yield falls below the guarantee level�αy��, the farmer receives an indemnity
of p� � �αy� y� per acre, where, p� is the price guarantee. The APH yield, y�, is computed
using from 4 to 10 years of historical yields for the insured unit. Small samples such as 4 year
history will produce larger variance than larger samples of say 10 years. Let us assume the
expected yield guarantee is distributed normally with mean αµ and variance α�σ��. Consider
equal deviations of !ε from the expected yield guarantee αµ � x, as shown in Figure 1. Over-
insuring at a level x # ε increases the expected indemnity relative to the level associated with a
fair insurance guarantee of x . Similarly, under insuring at a level x ε decreases the expected
indemnity compared with a fair guarantee of x . Given an insurance guarantee that is in the left
tail of a bell shaped yield distribution, the probability mass between x # ε and x is greater than
that between x ε and x. The implication of this is that the effect of sampling error is to
increase the expected indemnity. Also, it is important to note that the degree of sampling error
increases as sample size decreases so that the expected indemnity decreases with sample size.
Figure 1. Contracted and Real Guarantee Level

6
As indicated earlier, premium rates for APH yield insurance, CRC, and RA vary with the
ratio of the APH yield to the county reference yield.1 This is illustrated if Figure 2, which shows
an example premium rate curve which is convex in the yield ratio (insured unit yield divided by
county reference yield). It is clear that
this convex component of the rate
structure imposes large rate
“penalties” when sampling error leads
to an APH yield substantially below
the expected yield for an insured unit.
This relationship is not symmetric in
that positive sampling error of the
same magnitude results in smaller rate
“discount.”
Both of the above factors are important in determining the effect of sampling error on
expected indemnities and on producer welfare. Those effects are examined in the sections that
follow.
Empirical Implementation
Farm level yield data are required to support the empirical analysis. We decompose National
Agricultural Statistics Service (NASS) county yield data into systemic and idiosyncratic
components in order to approximate the farm yield. We use the decomposition given by Miranda
(1991), Mahul (1999) and Carriquiry, Babcock and Chad ( 2008) as:
1 Actually, this component of the rate formula utilizes the rate yield rather than the APH yield. The rate yield is the
simple average of the historical yields without incorporation of yield substitutions and yield floors.
0
0.05
0.1
0.15
0.2
0.25
0.4 0.7 1 1.3 1.6
Pre
miu
m R
ate
by
Yie
ld R
ati
o
Yield Ratio
Figure. 2 Premium Rate as Function of Yield Ratio

7
%&' � (& # )&�%*' (*� # +&' � (* # ,& # )&�%* (*� # +&' (1)
where (* and (& are the mean county and farm yield, ,& is the difference between county mean
yield and farm mean yield, %&' and %*' are the farm and county yield in year t and +&' is the farm
yield deviation in year -. It is assumed that ./+&'0 � 0, ./%&'0 � (&, ./%*'0 � (* , (& � (* # ,&,
123�+&', %*'� � 0, 456�%*'� � 7*� and 456�%&'� � )&
�7*� # 7*
� . We assume the variance of the
idiosyncratic shock is uniform across the insured units within a county. The regression residual
+&' is used to estimate the variance as a weighted average of the error variance �78�� estimated for
each of the insured farm units. We used the mean of statistically significant )& for a county to
estimate the farm yield within that county.
Texas cotton, Illinois corn, and Kansas wheat were chosen for this study because these
states are major producing states for these crops and yield variability and insurance parameters
vary substantially across these states and crops. In evaluating the impact from sampling error and
yield rigidities, we use these different areas to examine differences in impacts by crop and
region. County yield data from 1972 to 2007 were used for the analysis. Farm level data from
1998 to 2007 were made available by RMA of the United States Department of Agriculture.
Both farm and county level data were detrended. Each county yield series was regressed as a
linear function of time for the 36 year period. After estimating the predicted yield, both the farm
and county level yield series were multiplicatively detrended and normalized to the base year
2007 predicted yield such that
129:-% %;<=> 5- -?< - %<56 � %*' � �@8A,BC@8A,D�
E56F %;<=> 5- -?< - %<56 � %&' � �@8G,BC@8G,D�

8
We estimated equation (1) using the detrended data series. The mean and variance of )& were
estimated. The normality of the distribution of )& was tested and failed to reject the null
hypothesis of normality. The residual +&' is assumed to have normal distribution with mean 0 and
variance 78�.
Debate regarding the distributional assumptions for crop yield distributions and the
implications for crop insurance has received great emphasis in the agricultural economics
literature (Goodwin and Ker, 1998, Ker and Goodwin, 2000, Atwood, Shaik, Watts, 2002,
Goodwin and Mahul, 2004). Researchers have used the Beta and other parametric distributions,
semi-parametric distributions and non-parametric distributions in order to avoid the conflicting
arguments for and against the normal distribution. At high levels of yield variance, such as in
case of dryland cotton in Texas, the Beta distribution often is not bell shaped. Further, a
nonparametric distribution needs to have an a priori form before simulating values. Therefore,
we assume the censored normal distribution for crop yields as discussed in Coble et. al, (2010).
For each county, 10,000 simulated observations were constructed from the detrended
yield series for the county using a censored normal cumulative distribution function. Price series
were constructed by assuming a lognormal distribution with the mean price and coefficient of
variation for 2008. The correlated yield-price samples were constructed using the Phoon, Quek,
and Huang (PQH) multivariate simulation method (Phoon, Quek, and Huang, 2002; Anderson,
Harri, and Coble, 2009). The residuals (+&') and )& were also simulated based on normal
distributions with the mean and standard deviation for respective counties. Each yield series
consists of 11 years of detrended random draws, where years 1 to 10 were used to construct
expected yield and the 11th year was used as the realized yields. These yield samples were used
to simulate the actuarially fair premium rate and indemnity for each of the yield realizations.

9
Monte Carlo integration has been widely used to approximate the insurance indemnity, farmers’
utility and certainty equivalents in the crop insurance literature. We used this approach to obtain
indemnity and certainty equivalent approximations.
The indemnity with APH is computed as:
H�)� � IJ � K5L�)(@ %, 0�
where, IJ is the price guarantee, (@ is the APH expected yield and % is the realized farm yield.
We refer to farm revenue as the crop revenue (the product of random yield and random price)
plus the insurance indemnity, minus premium �M� paid.
Our analysis uses an expected utility framework to compute the certainty equivalent for
the individual farm at different levels of coverage. A risk averse farmer maximizes expected
utility of wealth. We assume that farmers’ risk preferences are represented by a power utility
function which implies Constant Relative Risk Aversion (CRRA). The CRRA utility function
requires initial wealth in order to reflect appropriate risk aversion of farmers (Chavas, 2004). We
assume the initial wealth is the net worth per acre of the Agricultural and Food Policy Center
(AFPC) representative farm that is located closest to our study counties (Richardson et. al, 2008).
Let initial wealth be N and c is the production cost2 per acre. Farm revenue with insurance is:
O&�)� � N # I � % # H�)� M P
and the CRRA utility function is:
UR�β� � πR�β�UVW
2 Production cost per acre for cotton, corn, and wheat was taken from crop budget of Texas A and M University,
crop extension budget, University of Illinois, crop budget and Kansas State University, farm management guide
respectively for the counties under this study.

10
where, R > 1 is the coefficient of relative risk aversion and πR is revenue per acre as a function of
the APH guarantee level. Coble, Heifner, and Zuniga (2000) and Coble, Zuniga, and Heifner
(2003) have used R = 2. The insurance guarantee level is the product of expected yield and APH
coverage level. Assuming that a farmer chooses the APH insurance coverage level to maximize
his/her expected utility, the farmer’s decision problem as given by Mitchell and Knight (2008) is:
maxY EUR �β� � maxY [ π�β�UVWdF�πR]|β�
The maximized expected utilities are converted into associated certainty equivalents for each
case:
CE� � � EUR��U/�UVW�
The certainty equivalent was estimated for a range of levels of guarantee of APH
insurance under three different major scenarios: for small sample APH, for the small sample and
yield substitution, and for small sample and yield floor. Our welfare measure is based on the
difference in the certainty equivalent per acre for each policy regime compared with the per acre
certainty equivalent for the uninsured case.
Data Description
For this analysis, county yield data were obtained from NASS website. The data covers the yield
history from 1972 to 2008. Individual farm yield data were obtained from RMA as Type15 crop
insurance data for 2008 cotton, corn, and wheat. APH yield history data for the APH, RA , and
CRC insurance products were included in the analysis. These data allow us to determine the
frequency with which yield substitutions and yield floors were used in 2008. We selected
Lubbock County, Texas for cotton, Adam County, Illinois for corn and Dickinson County,

11
Kansas for wheat in our analysis. The coefficient of variation of farm level cotton yield in
Lubbock County is relatively larger than for the other crops and counties. Adam County corn has
the smallest coefficient of variation (Table 2).
Table 2. Summary Statistics
Parameters Cotton Corn Wheat
Lubbock, TX Adam, Ill Dickinson, KS
Yield parameters
Mean 410.42 158.35 40.63
StDev 174.19 31.49 10.39
CV 42.44 19.89 25.56
Min 160.87 68.99 13.35
Max 833.99 204.29 63.58
Beta Mean 0.79996 0.592 -1.901
StDev 0.48153 0.528 3.376
Weighted variance 49312.6 562.613 187.516
Price 0.59/lb 3.91/bu 6.73/bu
Results and Discussion
The expected insurance indemnity is a function of coverage level, APH yield, actual yield
realizations and random price of the commodity. The small sample available for computation of
the APH yield has an impact on the indemnity expectation because of the higher variability in the
expected yield from a small sample. Farmers with short yield histories have larger sampling error
in their APH yields and are more likely to purchase insurance and to insure at high coverage
levels when their APH yield exceeds their expected yield. This positive sampling error results in
a higher likelihood of collecting an insurance indemnity. Our results reveal that indemnities are
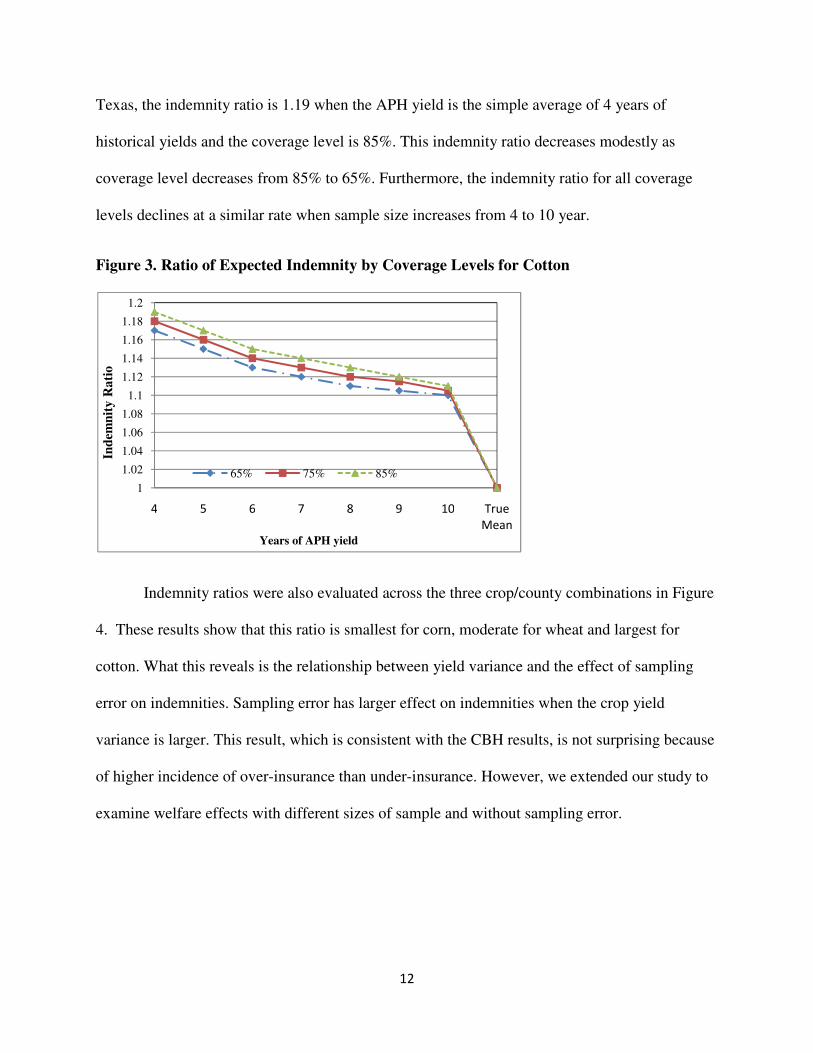
larger when APH sample size decreases. Figure 3 presents the indemnity ratios associated with
varying levels of yield history, by coverage level. These are the ratios of simulated indemnities
for different APH sample sizes (4 to 10 years) to the indemnity that would have been received if
the insurance guarantee had been based on the true mean yield. For cotton in Lubbock County,
12
Texas, the indemnity ratio is 1.19 when the APH yield is the simple average of 4 years of
historical yields and the coverage level is 85%. This indemnity ratio decreases modestly as
coverage level decreases from 85% to 65%. Furthermore, the indemnity ratio for all coverage
levels declines at a similar rate when sample size increases from 4 to 10 year.
Figure 3. Ratio of Expected Indemnity by Coverage Levels for Cotton
Indemnity ratios were also evaluated across the three crop/county combinations in Figure
4. These results show that this ratio is smallest for corn, moderate for wheat and largest for
cotton. What this reveals is the relationship between yield variance and the effect of sampling
error on indemnities. Sampling error has larger effect on indemnities when the crop yield
variance is larger. This result, which is consistent with the CBH results, is not surprising because
of higher incidence of over-insurance than under-insurance. However, we extended our study to
examine welfare effects with different sizes of sample and without sampling error.
1
1.02
1.04
1.06
1.08
1.1
1.12
1.14
1.16
1.18
1.2
4 5 6 7 8 9 10 True
Mean
Ind
emn
ity
Ra
tio
Years of APH yield
65% 75% 85%

13
Figure 4. Indemnity Ratio at 75% Coverage by Crop
Certainty equivalent differences with and without insurance (CE with insurance – CE
without insurance) provide the basis for our producer welfare analysis. These simulated
differences are shown graphically for the 75% coverage level in Figure 5. Several implications
can be drawn from these results. First, the benefits of the subsidized yield insurance are
substantial for all three example farms. Second, the magnitude of the benefit varies inversely
with yield variability in the county. Cotton in Lubbock County, Texas (CV=42.44) has the
largest welfare gain from insurance, followed by wheat in Dickenson County, Kansas
(CV=25.56), and then by corn in Adam County, Illinois (CV=19.89). Third, the welfare benefits
of insurance increase only modestly as the sample size increases from 4 to 10 years of APH yield
history. Fourth, for the example corn and cotton farms, the benefits of insurance based on the
true mean yield are almost fully captured, even with only four years of yield history to support
the APH yield calculation. However, for the example wheat farm the benefits of more years of
yield history are somewhat larger with perfect information, as reflected in the results for an APH
yield equal to the true mean yield. The reason for this last result is that the concave yield ratio
premium rate function for wheat in Dickenson County (see Figure 2) is significantly steeper than
for the other example county/crop insurance programs. This steep premium rate curve imposes a
0.90
0.95
1.00
1.05
1.10
1.15
1.20
4 5 6 7 8 9 10 True
Mean
Ind
em
nit
y R
ati
o
APH years
Cotton Corn Wheat

14
large premium rate penalty when the APH yield is low due to sampling error and, as a result, the
benefit of reduced (or no) sampling error is larger.
Figure 5. Effect of Sampling Error at 75% Coverage
The results for samples of 4 years, 10 years, and for an APH yield based on the true mean
yield are shown for alternative coverage levels in Table 3. At the 50% coverage level, sampling
error has almost no impact on producer welfare. Little impact is observed at the 65% coverage
level but the effect is more pronounced when the coverage level increases. A similar trend is
found for all three crops, but the magnitude of effect is different. As illustrated in Figure 5, the
benefit from crop insurance is largest for cotton, moderate for wheat and smallest for corn.
Moving from lower coverage to higher coverage, cotton has the largest gain followed by wheat
and corn. Also, the benefits of insurance increase at a decreasing rate with respect to coverage
level for all of these crops. Gains from larger sample size are negligible at the 50% coverage
level but are substantial at higher coverage levels. The results in Table 3 are consistent with
0
10
20
30
40
50
60
70
No Ins 4 5 6 7 8 9 10 TR_APH
Ce
rta
inty
Eq
uiv
ale
nt
APH years
Cotton Corn Wheat

15
Figure 5 in showing larger gains from increased sample size in Dickinson County wheat which
has a steeper rate curve.3
Table 3. Certainty Equivalent Differences With Sampling Error
Coverage Cotton Corn Wheat
level 4 10 True APH 4 10
True APH 4 10
True APH
50% 42.09 41.87 42.24 20.11 19.85 20.42 31.45 31.37 32.83
65% 54.75 54.83 55.60 28.38 27.87 28.81 37.26 38.44 41.66
75% 62.29 63.95 66.15 32.73 32.27 33.80 38.07 41.34 47.03
85% 65.81 67.50 69.54 34.31 35.56 37.22 39.98 46.35 52.13
We further examine the case of cotton by conducting a sensitivity analysis in order to
determine the effect of sampling error across different levels of risk aversion. Risk aversion
levels represented by a CRRA coefficient of 2, 3, and 4 were chosen for analysis. Figure 6 shows
the sensitivity of sampling error at these alternative levels of risk aversion. At the higher levels
of risk aversion, the changes in certainty equivalent are larger as sample size increases. However,
the difference in the effect of sampling error is very modest over the range of risk aversion
evaluated.
3 The exponent giving rise to the negative slope and convexity of the yield ratio curve is -1.369 for Lubbock County
cotton, -1.926 for Adam County corn, and -1.959 for Dickinson County wheat.

16
Figure 6. Sensitivity Analysis of Sampling Error with Alternative Risk Aversion Levels for
Cotton
Yield Substitution
APH-based yield and revenue insurance programs allow yield substitution if the farmers’
realized yield falls below 60 percent of the county T-yield. This provision was created by
Congress to mitigate the effects of a catastrophic event in one year on APH yield guarantees in
subsequent years. When the guarantee level is determined using one or more substitute yields,
the expected APH yield is biased upward relative to the true mean. This increases the probability
of collecting an indemnity and the expected indemnity, and also reduces yield variance, leading
to an increase in the certainty equivalent when insured relative to uninsured.
The analysis of welfare gains with and without yield substitution is presented in Figure
7. Here the dashed lines represent certainty equivalent gains from insurance (CE with insurance
– CE without insurance) with no yield substitution and the corresponding solid lines represent
certainty equivalent gains with yield substitution. Corn has the smallest net welfare gain from
yield substitution because it has low yield variance and lower frequency of yield substitution.
Net welfare gains for cotton and wheat are substantial. The gain for wheat is larger than the gain
0
20
40
60
80
100
120
Ce
rta
inty
Eq
uiv
ale
nt
APH years
R=2 R=3 R=4

in cotton, which has higher yield variance. The reason for this is the steep sl
premium rate function with respect to yield ratio as discussed earlier. Given this steep rate curve,
yield substitution prevents some occurrences of large rate penalties associated with one or more
years of exceptionally low yields.
insurance with sampling error and yield substitution
achieved with a guarantee equal the true mean yield. Thus, the upward bias in indemnities
created by yield substitution more than compensate for the loss of utility due to sampling error in
the insurance guarantee. This gain to producers is at least in part supported by increased
premium subsidies.
Figure 7: Certainty Equivalent
Yield Floors
Yield floors and yield substitution do not work simultaneously; rather the maximum of these two
is used. The yield floor has been used less frequently than yield substitution. Here we analyze the
welfare effects of yield floors, assuming
0
10
20
30
40
50
60
70
80
No Ins 4 5 6
Ce
rta
inty
Eq
uiv
ale
nt
----
17
cotton, which has higher yield variance. The reason for this is the steep slope of the wheat
premium rate function with respect to yield ratio as discussed earlier. Given this steep rate curve,
prevents some occurrences of large rate penalties associated with one or more
years of exceptionally low yields. It should be noted that the producer welfare gain from
with sampling error and yield substitution is larger than the gain that would be
achieved with a guarantee equal the true mean yield. Thus, the upward bias in indemnities
ion more than compensate for the loss of utility due to sampling error in
. This gain to producers is at least in part supported by increased
quivalent Gain with Yield Substitution at 75% Coverage
Yield floors and yield substitution do not work simultaneously; rather the maximum of these two
is used. The yield floor has been used less frequently than yield substitution. Here we analyze the
welfare effects of yield floors, assuming that yield substitution provisions are also in effect. We
7 8 9 10 TR_APH
APH years
---- Simple APH Yield Substitution
ope of the wheat
premium rate function with respect to yield ratio as discussed earlier. Given this steep rate curve,
prevents some occurrences of large rate penalties associated with one or more
the producer welfare gain from
is larger than the gain that would be
achieved with a guarantee equal the true mean yield. Thus, the upward bias in indemnities
ion more than compensate for the loss of utility due to sampling error in
. This gain to producers is at least in part supported by increased
overage
Yield floors and yield substitution do not work simultaneously; rather the maximum of these two
is used. The yield floor has been used less frequently than yield substitution. Here we analyze the
that yield substitution provisions are also in effect. We

18
use a yield floor of 85 percent of the county T-yield, based on the assumption that 5 or more
years of historical yields are available to support the APH yield calculation. Results shown in
Table 4 reveal that certainty equivalent gains compared to the no insurance case are very large
when the yield floor was used. The gain is largest for our example cotton farm, ranging from $46
to $76 per acre, and smallest in case of corn ranging from $20 to $38 per acre.
Table 4. Certainty Equivalent Differences with Yield Substitution and Yield Floors
Coverage Cotton Corn Wheat
level 4 10 True APH 4 10
True APH 4 10
True APH
50% 46.52 45.63 42.24 20.58 20.38 20.42 35.85 35.21 32.83
65% 61.29 60.31 55.60 29.30 28.80 28.81 44.79 44.54 41.66
75% 70.52 69.68 66.15 34.15 33.65 33.80 48.80 49.34 47.03
85% 75.87 74.93 69.54 38.02 38.97 37.22 39.50 42.30 52.13
In Table 5 we attempt to isolate the effects of yield substitution and yield floors. The
reported values are differences in certainty equivalent gains for each scenario (i.e., differences in
certainty equivalent differences relative to the uninsured case). For each crop, we report three
results: (1) the difference associated with use of yield substitution compared with a guarantee
based on the simple average APH yield; (2) the difference when using both yield substitution and
yield floors relative to the simple average yield; and (3) the difference between use of yield
substitution and use of yield floors in conjunction with substitution. The first results isolate the
effects of yield substitution; the second results show the combined effects of yield substitution
and floors; and the third result attempts to isolate the effects of yield floors when used in
conjunction with yield substitution. These results show that the certainty equivalent gains from
use of yield substitution are substantial compared with APH yields based on the simple average
of historical yields. These benefits are largest for wheat, but also substantial for cotton, and much

19
smaller for corn. The second results, with both yield substitution and yield floors in place, show
the same pattern, with even larger per acre welfare benefits. Finally, the third set of results,
which show the marginal welfare increase due to introduction of yield floors show that yield
floors have relatively modest benefits when yield substitution is already in effect. These final
results indicate that the marginal benefit of yield floors is strongly related to sample size, with
greater benefits when the sample size is small.
Table 5. Net Difference in Certainty Equivalent Differences for Alternative Scenarios (75%
Coverage Level)
Crop Scenario 4 5 6 7 8 9 10 TR_APH
Cotton
APH to yield substitution 6.53 6.08 5.97 5.98 5.79 5.48 5.48 0.00
APH to yield substitution and yield floor
8.23 7.22 6.77 6.54 6.21 5.82 5.73 0.00
APH to yield floor 1.71 1.14 0.80 0.56 0.42 0.35 0.25 0.00
Corn
APH to yield substitution 1.38 1.36 1.39 1.38 1.38 1.35 1.38 0.00
APH to yield substitution and yield floor
1.42 1.38 1.39 1.38 1.39 1.35 1.38 0.00
APH to yield floor 0.04 0.02 0.00 0.00 0.00 0.00 0.00 0.00
Wheat
APH to yield substitution 10.18 8.94 8.48 8.28 8.11 8.02 7.99 0.00
APH to yield substitution and yield floor
10.73 9.25 8.66 8.36 8.15 8.04 8.00 0.00
APH to yield floor 0.55 0.30 0.17 0.08 0.04 0.02 0.01 0.00
Conclusion
Establishing appropriate yield guarantees is important to the effective functioning of individual
level yield and revenue insurance programs. The approach that has been taken in the U.S. crop
insurance program is to use historical yields for the insured unit to establish individual yield
guarantees. This is a reasonable approach which takes into consideration most or all information
that is available for the vast majority of insured units. However, guarantees based on average
historical yields are subject to sampling error which can lead to over- or under-insurance. Policy

20
provisions, including yield substitution and yield floors, have been put in place to mitigate the
effect of down-side sampling error. These measures have a left-tail censoring effect on the
insured yield which raises the expected guarantee level.
This study analyzed the potential welfare gains/losses associated with sampling error,
with and without yield substitution and yield floors. Our results provide the following insights.
• Sampling error significantly increases expected indemnities and thus increases actuarially
fair premiums and premium subsidies.
• The welfare loss due to sampling error is larger in high risk areas and especially in areas
where premium rates are highly sensitive to differences in producers’ yields relative to a
predetermined county yield.
• Both yield substitution and yield floors increase producer welfare, with yield substitution
having the larger of the two effects.
• The upward bias in insured yields from yield substitution more than compensates for the
negative effects of sampling error and provides producer welfare in excess of an “accurate”
guarantee with no sampling error. This upward bias increases actuarially fair premium rates
and associated government premium subsidies.
These results indicate that there is a potential welfare loss associated with sampling error
but this potential welfare loss is more than offset by upward bias in insured yields created
through use of yield substitution and yield floors. This welfare gain to producers comes, at least
in part, at the expense of taxpayers in the form of increased premium subsidies. We believe that
future research efforts should be directed at investigating alternative mechanisms to mitigate

21
welfare losses from sampling error while reducing the potential for over-insurance and excessive
government cost.
References
Anderson, J. D., A. Harri, and K. H. Coble, 2009. Techniques for Multivariate Simulation from
Mixed Marginal Distributions with Application to Whole Farm Revenue Simulation.
Journal of Agri.l and Res. Econ. 34:53-67.
Atwood, J., S. Saik and M. Watts, 2002. Can Normality Be assumed for Crop Insurance.
Canadian Jour. of Agric. Econ. 50: 171-184.
Carriquiry, M. A., B. A. Babcock and C. E. Hart, 2008. Using a Farmer’s Beta for Improved
Estimation of Expected Yields. Journal of Agri. and Res. Econ. 33/1: 52-63.
Chavas, J. P., 2004. Risk Analysis in theory and Practice. Elsevier Academic Press.
Coble K. H., T. O. Knight, B. K. Goodwin, M. F. Miller, R. Rajesus, 2010. A Comprehensive
Review of the RMA APH And COMBO Rating Methodology, Risk Management Agency of
USDA, Final Report, March 15, 2010.
Coble, K. H., M. Zuninga and R. G. Heifner, 2003. Evaluation of the Interaction of Risk
Management Tools for Cotton and Soybeans”. Agricultural Systems. 75: 323-340.
Coble, K. H., R. G. Heifner and M. Zuninga, 2000. Implication of Crop Yield and Revenue
Insurance for Producer Hedging. Journal of Agri. and Res. Econ. 25/2: 432-452.

22
Goodwin, B. K. and O. Mahul, 2004. Risk Modeling Concepts Relating to the Design and
Rating of Agricultural Insurance Contracts. World Bank Policy Research Working Paper
No. 392.
Goodwin, B.K. and A.P. Ker, 1998. Nonparametric Estimation of Crop Yield Distributions:
Implications for Rating Group Risk (GRP) Crop Insurance Contracts. Am. Jour. of Agric.
Econ. 80: 139-53.
High plain/mid west ag journal, 2004. RMA Seek to Address Multi-Year Crop Loss. Issues.5-
13-04 High Plains Publishers. Dodge City Kansas.
Ker. A. P. and B. K. Goodwin, 2000. Nonparametric Estimation of Crop Insurance Rates
Revisited. Amer. Jour. Agric. Econ. 82: 463-478.
Knight T. O., 2003. Testimony Prepared for the United States House of Representatives
Subcommittee on General Farm Commodities and Risk Management. Dec 1, 2003.
Mahul, O., 1999. Optimal Area Yield Crop Insuarnce. Amer. Jour. Agric. Econ. 81: 75-82.
Miranda, M. J. , 1991. Area Yield Crop Insurance Reconsidered. Amer. Jour. Agric. Econ. 73:
233-242.
Mitchell, P. D., and T. O. Knight, 2008. Economic Analysis of Supplemental Deductible
Coverage as Recommended in the USDA’s 2007 Farm Bill Proposal. Agri. And Res Econ.
Review 37/1 : 117-131.
Phoon, K., S. T. Quek, and H. Huang, 2004. Simulation of Non-Gaussian Processes Using
Fractile Correlation. Probabilistic Engineering Mechanics. 19: 287-292.

23
Richardson, J. W., J. L. Outlaw, G. M. Knappek, J. M. Raultson, B. K. Herbst, D. P. Anderson,
and S. L. Klose, 2008. Representative Farms Economic Outlook for the December 2008
FAPRI/AFPC Baseline. 2008.