
YIELD AND STORABILITY OF SWEETPOTATO ( Ipomoea batatas …
309
i YIELD AND STORABILITY OF SWEETPOTATO (Ipomoea batatas (L.) Lam) AS INFLUENCED BY CHICKEN MANURE AND INORGANIC FERTILIZER By MARGARET ESI. ESSILFIE (10174030) THIS THESIS IS SUBMITTED TO THE UNIVERSITY OF GHANA, LEGON IN PARTIAL FULFILLMENT OF THE REQUIREMENTS FOR THE DEGREE OF DOCTOR OF PHILOSOPHY JUNE, 2015
Transcript of YIELD AND STORABILITY OF SWEETPOTATO ( Ipomoea batatas …

i
YIELD AND STORABILITY OF SWEETPOTATO (Ipomoea batatas (L.) Lam) ASINFLUENCED BY CHICKEN MANURE AND INORGANIC FERTILIZER
By
MARGARET ESI. ESSILFIE
(10174030)
THIS THESIS IS SUBMITTED TO THE UNIVERSITY OF GHANA, LEGON INPARTIAL FULFILLMENT OF THE REQUIREMENTS FOR THE DEGREE OF
DOCTOR OF PHILOSOPHY
JUNE, 2015

ii
DECLARATION
I hereby declare that except for references to the works of other researchers which have
been duly cited, this work is the result of my own original research and that this
dissertation has neither in whole nor in part been presented for another degree elsewhere.
………………………………………. ………………………………………………
Margaret Esi Essilfie (Student) Prof. (Mrs) E. T. Blay (Supervisor)
………………………………………… ………………………………………………
Date Date
……………………………………….. ………………………………………………..
Prof. J.C.Norman (Co-supervisor) Prof John Ofosu-Anim (Co-supervisor)
.…………………………………… ……………………………………………
Date Date

iii
ACKNOWLEDGEMENTS
I would like to express my thanks to God Almighty for providing all I needed to make this
research work possible.
In writing this thesis, I faced numerous problems which I could not solve single-handedly,
but with the help of my lecturers, I surmounted them. My gratitude goes to all the senior
members who contributed in diverse ways towards the successful completion of this work.
I wish to express my sincere thanks to my thesis supervisor Prof (Mrs) Essie T. Blay, and
my co-supervisors Prof. J.C. Norman and Prof. John Ofosu-Anim, for their guidance and
invaluable suggestions.
I wish to express my sincere gratitude to Prof Harrison Kwame Dapaah, Principal of
College of Agriculture Education of the University of Education, Winneba, Mampong-
Ashanti campus, for his enormous support, encouragement and useful comments.
I thank Mr. William Asante Asiedu and other staff of the Department of Crop Science,
University of Ghana for their technical assistance. The staff of the nutrition laboratory in
the Noguchi Memorial Institute for Medical Research (MMIMR) of University of Ghana
was helpful in laboratory analyses of sweetpotato tuber beta-carotene content. To them I
am most grateful
I am also grateful to the Management of the University of Education, Winneba. College of
Agriculture Education, Mampong–Ashanti Campus for the provision of land as well as
chicken manure from the animal farm for this work. I also express my appreciation to Crop
Research Institute and Soil Research Institute of CSIR all in Kumasi for the provision of
planting material and for analyses of the soil and manure samples respectively.
Finally, the staff of physical laboratory in the chemistry Department of the Kwame
Nkrumah University of Science and Technology in Kumasi was helpful in the laboratory
analyses of sweetpotato tubers starch and sugar content.

iv
DEDICATION
This research work is dedicated to God Almighty, my husband Mr. Joseph Essilfie and my
children, Issac Nyarko, Josephine Essilfie and William Frempong.

v
ABSTRACT
Two field experiments were conducted at the Multipurpose Crop Nursery of the University
of Education, Winneba, Mampong-Ashanti campus during the minor and major rainy
seasons from September, 2011 to January, 2012 and April to August, 2012 respectively to
verify the yield and storability of sweetpotato roots as influenced by chicken manure and
inorganic fertilzer in the forest transitional agro-ecological zone of Ghana.. In both
cropping seasons sweetpotato root tubers were stored for three (3) months after each
harvest using three storage methods (Pit, Ash and Grass). The experimental design used for
the field experiment was a 2 x 8 factorial arranged in randomized complete block design
with four replicates in both studies. In the storability studies the experimental design used
was a randomized complete block design with three replications. Sixteen (16) treatments
were included in the field experiments. The factors under field study were two varieties of
sweetpotato (i) Apomuden (Deep orange-fleshed colour with light orange skin), (ii)
Okumkom (White-fleshed colour with light purple skin) and chicken manure and inorganic
fertilizer (NPK) combination consisting of seven (7) organic manure and inorganic
fertilizer rates and the control. In the storability studies the harvested tubers from the eight
field treatments were sorted, cured and stored using the three storage methods (Grass, Ash
and Pit). The results obtained revealed that the application of a combination of organic
manure (chicken manure) and inorganic fertilizer for soil fertility enhancement in
sweetpotato production is a better option than either organic or inorganic fertilizer applied
alone. Apomuden grown on 15 – 30 – 30 kg/ha NPK + 5t/ha CM had the highest
marketable and total tuber yield during the major cropping season, while Okumkom grown
on 15-23-23 kg/ha NPK + 5t/ha CM and other amendments had the highest vegetative
biomass (number of leaves per plant and vine fresh weight at harvest) in both seasons.
Correlation analyses for both seasons showed that the vegetative growth was negatively

vi
correlated with tuber yield and market quality. However, tuber market quality was highly
positively correlated with total yield of tuber. The vegetative characters were positively
and significantly correlated with each other. The importance of using chicken manure and
inorganic fertilizer either alone or preferably in combination as soil amendment to enhance
tuber market quality at harvest, tuber nutritional composition with regard to beta-carotene,
starch and sugar content over the control was clearly shown from both studies. The
sweetpotato root tubers of both varieties with regard to beta- carotene, starch and sugar
contents increased with manure application, especially, during the minor season. The
results from both seasons clearly showed that for both varieties the pit method was the
most effective storage method in terms of beta- carotene as well as starch and sugar
contents over both ash and grass storage. Pit storage of Apomuden and Okumkom grown
on amended and control plots resulted in improved beta-carotene, starch and sugar contents
of root tuber and also stored better than ash and grass storage systems in both seasons.
With regard to the cost benefit analysis Apomuden and Okumkom grown on 30-30-30
kg/ha NPK treatment dominated the other amended plots and the control in both growing
seasons.

vii
TABLE OF CONTENTS
DECLARATION ...........................................................................................................................iii
ACKNOWLEDGEMENTS ..........................................................................................................iiii
DEDICATION ............................................................................................................................... iv
ABSTRACT ....................................................................................................................................v
TABLE OF CONTENTS .............................................................................................................viii
LIST OF FIGURES.....................................................................................................................xiiii
LIST OF TABLES .......................................................................................................................xiv
LIST OF ABBREVIATIONS .....................................................................................................xvii
CHAPTER ONE ............................................................................................................................. 1
1.0 INTRODUCTION............................................................................................................... 1
1.1 Background of Study........................................................................................................... 1
1.2 Problem Statement /Justification......................................................................................... 2
1.3 Objective of the Study......................................................................................................... 6
1.3.1 Specific Objectives.............................................................................................................. 6
CHAPTER TWO............................................................................................................................. 7
2.0 LITERATURE REVIEW....................................................................................................7
2.1 Origin and Botany ............................................................................................................... 7
2.2 Nutritive Value .................................................................................................................. 10
2.3 Varieties ............................................................................................................................ 10
2.4 Growth Requirements ....................................................................................................... 12
2 4.1 Climatic requirement......................................................................................................... 12
2.4.2 Soil Requirements ............................................................................................................. 14
2.5 Propagation........................................................................................................................ 15
2.6 Agronomic Practices ......................................................................................................... 16
2.6.1 Weed Control .................................................................................................................... 16
2.6.2 Pest and Diseases of Sweetpotato ..................................................................................... 18
2.7 Fertilization in Sweetpotato Production ............................................................................ 19
2.7.1.1 Effect of Nitrogen.............................................................................................................. 19
2.7.1.2 Effect of Potassium ........................................................................................................... 23
2.7.1.3 Effect of Phosphorus ......................................................................................................... 25
2.7.2 Effect of Organic Fertilizers.............................................................................................. 27

viii
2.7.2.1 Poultry Manure and its Effects on the Physical and Chemical Properties of the Soil ...... 27
2.7.2.2Effect of Poultry Manure on Growth and Yield of Sweetpotato........................................ 29
2.8. Harvesting and Curing ...................................................................................................... 32
2.9 Effect of storage method on quality and nutritional composition of sweetpotato roottubers ........................................................................................................................... 33
CHAPTER THREE....................................................................................................................... 40
3.0 MATERIALS AND METHODS ...................................................................................... 40
3.1 Introduction ....................................................................................................................... 40
3.2 Experimental Site and Climatic Conditions ...................................................................... 40
3.2.1 Experimental Site .............................................................................................................. 40
3.2.2 Climatic Conditions at the Experimental Sites .................................................................41
3.3 Experimental Design and Treatments ............................................................................... 42
3.3.1 Treatments ......................................................................................................................... 42
3.4 Organic manure preparation.............................................................................................. 42
3.5 Soil and Manure Sampling ................................................................................................ 46
3.6 Soil Physical and Chemical Analyses ............................................................................... 46
3.7 Land Preparation and Fertilization .................................................................................... 47
3.8 Planting Materials and Planting ........................................................................................ 47
3.9 Agronomic Practices ......................................................................................................... 48
3.10 Data Collection.................................................................................................................. 49
3.10.1 Vegetative Data ................................................................................................................. 49
3.10.2 Yield and Yield Component Data ..................................................................................... 51
3.10.3 Market Quality of Tuber ...................................................................................................52
3.10.4 Estimation of Harvest Index and Commercial Harvest Index........................................... 53
3.11 Sensory Evaluation............................................................................................................ 53
3.11.1 Preparation of Tubers for Sensory evaluation and Analysis ............................................. 53
3.12. Storage of Sweetpotato Root Tubers................................................................................. 54
3.12.1 Storage Methods................................................................................................................ 54
3.12.1.1 Pit Storage Method...................................................................................................... 54
3.12.1.2 Ash Storage Method....................................................................................................55
3.12.1.3 Grass Storage Method .................................................................................................55
3.13 Procedure for Beta – Carotenoid Analysis ........................................................................ 56
3.13.1 Sample collection .............................................................................................................. 56

ix
3.13.2 Sample preparation............................................................................................................ 56
3.13.3 Chemicals and standard reagents used .............................................................................. 57
3.14 Carotenoids Analysis......................................................................................................... 57
3.14.1 Carotenoid Extraction ....................................................................................................... 58
3.14.2 Partition ............................................................................................................................. 58
3.14.3 Evaporation of solvent ...................................................................................................... 59
3.14.4 Chromatography.......................................................................................................... 59
3.14.6 Identification of carotenoids.............................................................................................. 60
3.14.7 Quantification of Carotenoids ........................................................................................... 60
3.15 Starch and Sugar Analyses ................................................................................................ 60
3.17 Statistical Analyses ........................................................................................................... 62
CHAPTER FOUR ......................................................................................................................... 63
4.0 RESULTS.......................................................................................................................... 63
4.1 Organic Manure, Soil and Soil Plus Manure Analysis...................................................... 63
4.1.1 Manure Characteristics...................................................................................................... 63
4.1.2 Changes in Soil Nutrients Levels Due to Treatments ....................................................... 63
4.1.3 Changes in Soil Nutrient Levels Due to Treatment for Experiment 2 During the MajorGrowing Season in 2012 ............................................................................................. 67
4.2 Growth Performance of Two Sweetpotato Varieties as Influenced by Chicken Manureand Inorganic Fertilizer ............................................................................................... 67
4.2.2 Number of Leaves per Plant.............................................................................................. 72
4.2.3 Number of Branches.......................................................................................................... 73
4.2.4 Vine Diameter ................................................................................................................... 74
4.2.5 Vine Length....................................................................................................................... 75
4.2.6 Chlorophyll Content of Leaves ......................................................................................... 76
4.2.7 Root Fresh Weight per plant ............................................................................................. 81
4.2.8 Root Dry Weight Per Plant................................................................................................ 83
4.2.9 Vine Fresh Weight per Plant ............................................................................................. 90
4.2.10 Vine Dry Weight Per Plant................................................................................................ 92
4.2.11 Days To 50 % Flowering ..................................................................................................96
4.2.12 Vine Fresh Weight at Harvest ........................................................................................... 97
4.3 Yield Performance Of Two Varieties Of Sweetpotato...................................................... 98
4.3.1 Number of Marketable and Unmarketable Root Tubers per Plot ..................................... 98

x
4.3.2 Marketable and Unmarketable Tuber Weight Per Plot ................................................... 102
4.3.3 Total Tuber Yield ............................................................................................................ 104
4.3.4 Marketable Tuber Diameter ............................................................................................ 107
4.3.5 Unmarketable Tuber Diameter........................................................................................ 109
4.3.6 Average Tuber Weight ....................................................................................................110
4.3.7 Average Tuber Length ....................................................................................................111
4.3.8 Tuber Dry matter accumulation at harvest ...................................................................... 113
4.3.9 Harvest Index and Commercial Harvest Index ............................................................... 114
4.4 Marketable Quality of Tubers (Percentage Tuber Crack, Tuber Rot, Deformed Tuber,Forked Tuber, Pests Infested Tuber, Tuber Sprout) As Influenced By ChickenManure And Inorganic Fertilizer On Two Sweetpotato Varieties (Okumkom AndApomuden)................................................................................................................ 118
4.4.1 Percentage Cracked Tubers ............................................................................................. 118
4.4.2 Percentage Rotten Tubers................................................................................................ 120
4.4.3 Percentage Forked Tubers ............................................................................................... 120
4.4.4 Percentage Deformed Tubers .......................................................................................... 123
4.4.5 Percentage Pest Infested Tubers...................................................................................... 123
4.4.7 Percentage Sprouted Tuber at Harvest ............................................................................ 125
4.5 Sensory Characteristics of Cooked Tubers of Two Sweetpotato Varieties (Apomuden andOkumkom) During the Minor season, (2011) and Major season, (2012) ................. 126
4.6. Storability Studies ........................................................................................................... 130
4.6.1 Percentage Pest Infested Tubers of Sweetpotato During the 2011 Minor and 2012 MajorSeasons After 12 weeks of Storage in Ash, Grass or Pit........................................... 130
4.6.1.1 Percentage Pest Infested Tubers In Ash Storage............................................................. 130
4.6.1.2 Percentage Pest Infested Tubers in Grass Storage .......................................................... 136
4.6.1.3 Percentage Pest Infested Tubers in Pit Storage During the Minor and MajorSeasons ...137
4.6.2.1 Percentage Shrinkage in Tubers Stored in Ash During The Minor And Major Seasons 141
4.6.2.2 Percentage Shrinkage Tubers in Grass storage ............................................................... 145
4.6.2.3 Percentage Shrinkage in Tubers In Pit Storage ............................................................... 149
4.6.3.0 Percentage Rotten Tubers of Sweetpotato in Ash, Grass and Pit Storage during the Minorand the Major Seasons............................................................................................... 155
4.6.3.1 Percentage Rotten TubersIn Ash Storage........................................................................ 155
4.6.3.2 Percentage Rotten Tubers in Grass Storage ....................................................................159
4.6.3.3 Percentage Rotten Tubers in Pit Storage ......................................................................... 160

xi
4.6.4.0 Percentage Tuber Sprouting of Sweetpotato under Ash, Grass or Pit Storage During theMinor and The Major Seasons .................................................................................. 164
4.6.4.1 Percentage Tuber Sprouting in Ash storage ....................................................................164
4.6.4.2 Percentage Sprouted Tuber in Grass storage...................................................................170
4.6.4.3 Percentage Sprouted Tuber in Pit storage ....................................................................... 174
4.6.5.0 Percentage Weight Loss of Sweetpotato Tubers in Ash, Grass or Pit Storage During theMinor and The Major Seasons .................................................................................. 178
4.6.5.1 Percentage Weight Loss of Tubers in Ash Storage......................................................... 178
4.6.5.2 Percentage Tuber Weight Loss in Grass storage............................................................. 183
4.6.5.3Percentage Tuber Weight Loss in Pit storage ..................................................................184
4.7 Beta-Carotene Content of Sweetpotato Root Tubers ...................................................... 191
4.7.1 Beta-Carotene Content of Sweetpotato Root Tubers at Harvest ..................................... 191
4.7.2 Beta-Carotene Content of Sweetpotato Root Tubers after 12 weeks in Pit Or Ash Storage...................................................................................................................................193
4.8 Percentage Sugar Content of Sweetpotato RootTubers At Harvest and After 12 Weeks ofStorage in Ash, Grass orPit During 2011 minor season and 2012 major season ...... 194
4.8.1 Percentage Sugar Content of Root Tubers at Harvest ..................................................... 194
4.8.2 Percentage Sugar Content of Sweetpotato Root Tubers after 12 Weeks of Storage During2011 Minor Seasonand 2012 Major Season.............................................................. 196
4.9 Percentage Starch Content of Sweetpotato Root Tubers at Harvest and After ............... 199
4.9.1 Percentage Starch Content of Tubers at Harvest............................................................. 199
4.9.2 Percentage Starch of Sweetpotato Root Tubers after 12 Weeks of Storage in ............... 202
4.10 Correlation Matrix among Vegetative and Yield Parameters Measured on Sweetpotato at12 Weeks after Planting and at Harvest Respectively for the 2011 Minor Season and2012 Major Seasom...................................................................................................206
4.10.1 Correlation Matrix among Vegetative and Yield Parameters Measured on Sweetpotato at12 Weeks after Planting and at Harvest Respectively for the 2011 Minor Season.206
4.10.2 Correlation Matrix among Vegetative and Yield Parameters Measured on Sweetpotato at12 Weeks after Planting and at Harvest Respectively for the 2012 Major Season ...207
4.11 Partial budget analysis of sweetpotato as affected by chicken manure andinorganicfertilizer for the 2011 minor and 2012 major seasons..................................................... 208
CHAPTER FIVE......................................................................................................................... 216
5.0 DISCUSSION ................................................................................................................... 216
CHAPTER SIX ........................................................................................................................... 247
6.0 CONCLUSIONS AND RECOMMENDATIONS.......................................................... 247

xii
6.1 Conclusions ..................................................................................................................... 247
6.2 Recommendations ........................................................................................................... 253
REFERENCES............................................................................................................................ 256
LIST OF APPENDICES ............................................................................................................. 281

xiii
LIST OF FIGURES
.Fig. 4.1 Leaf number for 2011 minor season and 2012 major season ……………………..77
Fig. 4.2 Number of branches for 2011 minor season and 2012 major season…………………..78
Fig. 4.3 Vine diameter for 2011 minor season and 2012 major season…………………………79
Fig. 4.4 Vine length for 2011 minor season and 2012 major season……………………………80
Fig. 4.5 Chlorophyll content of leaves for 2011 minor season and 2012 major season ………....83
Fig. 4.6 Root fresh weight per plant for 2011 minor season and 2012 major season…………...85
Fig. 4.7 Root dry weight per plant for 2011 minor season and 2012 major season ……………..91
Fig. 4.8 Vine fresh weight per plant for 2011 minor season and 2012 major season…………...93
Fig. 4.9 Vine dry weight per plant for 2011 minor season and 2012 major season ……………95

xiv
LIST OF TABLES
Table 4.1: Chemical properties of chicken manure used for the minor and major growing seasons(2011) and 2012) respectively............……………………………………………….63
Table 4.2: Physical and chemical properties of soil and soil plus manure ap horizon at 0-20 cmdepth two weeks after planting (2 wap) for experiment 1 (2011)………………64
Table 4.3: Physical and chemical properties of soil and soil plus manure ap horizon at 0-20 cmdepth sixteen weeks after planting (16 wap) for experiment 1 (2011)…..65
Table 4.4: Guide to interpretation of soil analytical data………………………………………...67
Table 4.5: Physical and chemical properties of soil and soil plus manure ap horizon at 0-20cmdepth two weeks after planting for experiment 2 (2012)……………………..……68
Table 4.6: Physical and Chemical Properties of soilaand soil plus manure Ap horizon
at 0-20 cm depth sixteen weeks after planting for experiment 2 – 20……………...69
Table 4.7: Percentage crop establishment for 2011 minor season and 2012 major season….70
Table 4.8: Days to 50% flowering for 2011 minor season and 2012 major season……………..95
Table 4.9: Vine fresh weight at harvest for 2011 minor season and 2012 major season ……….97
Table 4.10: Number of marketable and unmarketable root tubers during 2011 minor season
and 2012 major season ……………………………………………….………….100
Table 4.11: Marketable and Unmarketable root tuber weight per plot for 2011 minor season and2012 major season…………………………………………………………….104
Table 4.12: Total tuber yield during 2011 minor season and 2012 major season…..………….105
Table 4.13: Marketable and Unmarketable Root Tuber Diameter During 2011 Minor Season
and 2012 Major Seas………………………………………………………………107
Table 4.14: average tuber weight and root tuber length during 2011 minor season and
2012 major season…………………………………………………………………111
Table 4.15: Root Tuber Dry Matter Accumulation at Harvest for 2011 Minor Season and
2012 Major Season................................................................................………………………..114
Table 4.16: Harvest Index and Commercial Harvest Index as Influenced by Chicken Manure andInorganic Fertilizer for 2011 Minor Season and 2012 Major Season………..116
Table 4.17: Percentage Cracked and Rotten Tubers for 2011 Minor Season and 2012
Major Season……………………………………………………………………...118
Table 4.18: Percentage forked and deformed tubers for 2011 minor season and 2012majorseason…………………………………………………………………………...121
Table 4.19: Percentage pest infested tubers during 2011 minor season and 2012 major season……………………………………………………………………………..124

xv
Table 4.20: Percentage sprouted tubers at harvest for 2011 minor season and 2012 major season……………………………………………………………………………...125
Table 4.21a: Sensory characteristics of cooked apomuden and okumkom tubers at harvest duringthe 2011 minor season …………………………………………………….127
Table 4.21b: Sensory characteristics of cooked apomuden and okumkom tubers at harvest for2011 minor season..………………………………………………………………...128
Table 4.21c: Sensory characteristics of cooked apomuden and okumkom tubers at harvest for the2012 major season ........…………………………………………………………….130
Table 4.21d: Sensory characteristics of cooked apomuden and okumkom tubers at harvest for2012 major season ..………………………………………………………………...131
Table 4.22a: Percentage pest infested tubers in ash storage for 2011 minor season …………..133
Table 4.22b: Percentage pest infested tubers in ash storage for 2012 major season…………..134
Table 4.23a: Percentage pest infested tubers in grass storage for 2011 minor season ………..137
Table 4.23b: percentage pest infested tubers in grass storage for 2012 major season ………..138
Table 4.24a: Percentage pest infested tubers in pit storage fot 2011 minor season ...………….141
Table 4.24b: Percentage pest infested tubers in pit storage for 2012 major season....…………142
Table 4.25a: Percentage shrinkage tubers in ash storage for 2011 minor season ....…………...145
Table 4.25b: Percentage shrinkage tubers in ash storage for 2012 major season ....…………...146
Table 4.26a: Percentage shrinkage tubers in grass storage for 2011 minor season ....…………149
Table 4.26b: Percentage shrinkage tubers in grass storage for 2012 major season ....…………150
Table 4.27a: Percentage shrinkage tubers in pit storage for 2011 minor season ...……………152
Table 4.27b: Percentage shrinkage tubers in pit storage for 2012 major season ...…………….153
Table 4.28a: Percentage rottentubers in ash storage for 2011 minor season .....………………156
Table 4.28b: Percentage rottentubers in ash storage for 2012 major season .....………………157
Table 4.29a: Percentage RottenTubers in Grass Storage for 2011 Minor Season……………...160
Table 4.29b: Percentage RottenTubers in Grass Storage for 2012 Major Season……………...161
Table 4.30a: Percentage RottenTubers in Pit Storage for 2011 Minor Season ………………...164
Table 4.30b: Percentage RottenTubers in Pit Storage for 2012 Major Season ………………..165
Table 4.31a: Percentage Sprouted Tubers in Ash Storage for 2011 Minor Season…………….167
Table 4.31b: Percentage Sprouted Tubers in Ash Storage for 2012 Major Season…………….168
Table 4.32a: Percentage Sprouted Tubers in Grass Storage for 2011 Minor Season………….171
Table 4.32b: Percentage Sprouted Tubers in Grass Storage for 2012 Major Season………….172
Table 4.33a: Percentage Sprouted Tubers in Pit Storage for 2011 Minor Season……………...175

xvi
Table 4.33b Percentage Sprouted Tubers in Pit Storage for 2012 Major Season……………...176
Table 4.34a: Percentage Weight loss of Tubers in Ash Storage for 2011 Minor Season ……..180
Table 4.34b: Percentage Weight loss of Tubers in Ash Storage for 2012 Major Season …….181
Table 4.35a: Percentage Weight loss of Tubers in Grass Storage for 2011 Minor Season…..184
Table 4.35b: Percentage Weight loss of Tubers in Grass Storage for 2012 Major Season …..185
Table 4.36a: Percentage Weight loss of Tubers in Pit Storage for 2011 Minor Season……..188
Table 4.36b:Percentage Weight loss of Tubers in Pit Storage for 2012 Major Season ……..189
Table 4.37: Beta-Carotene Content Of Tubers at Harvest for 2011 minor season and 2012 majorseason………………………………………………………………………191
Table 4.38: Beta-Carotene Content Of Sweetpotato Root Tubers Stored in Pit and Ash for 12weeks for 2011 minor season and 2012 major season ……………………………194
Table 4.39: Percentage Sugar Content Of Sweetpotato Root Tubers at Harvest for 2011 MinorSeason and 2012 Major Season …………………………………………..196
Table 4.40: Percentage Sugar Content Of Sweetpotato Root Tubers After 12 Weeks Of StorageIn Pit And Ash for 2011 Minor Season and 2012 Major Season………..199
Table 4.41 Percentage Starch Content of Root Tubers at Harvest for 2011 Minor Seasonand 2012Major Season ………………………………………………………………201
Table 4.42: Percentage Starch Content of Sweetpotato Root Tuber After 12 Weeks of Storage InPit And Ash for 2011 Minor Season and 2012 Major Season………..204
Table 4.43 ....... Correlation Matrix Among Growth and Yield Parameters for 2011 Minor Season...................................................................................................................................215
Table 4.44: Correlation Matrix among Growth and Yield Parameters During the 2012Major Season………….………………………………………….........................216
Table 4.45:Information used for the partial budget analysis…………………………............217
Table 4.46: Partial budget analysis for Apomuden variety of sweet potato as affected byinorganic fertilizer and chicken manure during 2011 minor season…………….218
Table 4.47:Partial budget analysis for Okumkom variety of sweet potato as affected byinorganic fertilizer and chicken manure during 2011 minor season………..........219
Table 4 48: Partial budget analysis for Apomuden variety of sweet potato as affected byinorganic fertilizer and chicken manure during 2012 major season……….........220
Table 4.49: Partial budget analysis for Okumkom variety of sweet potato as affected byinorganic fertilizer and chicken manure during 2012 major season………........221
LIST OF ABBREVIATIONS

xvii
[[[
FAO Food and Agriculture Organization
CRI Crop Research Institute
CSIR Council for Scientific and Industrial Research,
SRI Soil Research Institute
Kg Kilogram
cm centimeter
m meter
g gram
CM Chicken manure
Ha Hectare
T Tonne
Ha-1 Per hectare
Okum Okumkom
Apm Apomuden
LSD Least significant difference
TGB Total gross benefit
TVC Total variable cost
MRR marginal rate of return
NPK Nitrogen, Phosphorus and Potassium
Δ Change in cost incurred
HPLC High performance liquid chromatography
OFSP Orange fleshed sweetpotato
WFSP White fleshed sweetpotato

1
CHAPTER ONE
1.0 INTRODUCTION
1.1 Background of Study
Sweetpotato (Ipomoea batatas (L.) Lam) is a dicotyledonous plant belonging to the family
Convolvulaceae. It is an important tuber crop grown in the tropics, sub-tropics and warm
temperate regions of the world. The crop has a short duration (3 – 4 months).
Sweetpotato is the world’s seventh most important staple crop, grown in over 100
countries of the world, covering an estimated total area of 9.2 million hectare, with an
annual global production around 125 million tonnes. Almost 95% of the total production is
in developing countries. Being relatively resistant to pests and diseases and comparatively
water-use efficient, sweetpotato grows well in regions of marginal agricultural production.
The crop has the additional advantage that due to rapid soil coverage and good rooting
characteristics, it helps to reduce soil erosion. Thus, sweetpotato is a particularly valuable
crop for poorer farmers. This is reflected in the distribution of the crop. With an annual per
capita production in Africa averaging nearly 9 kg per capita consumption often exceeds
100 kg within poorer communities (CIP 1996).
In many parts of Africa, including Ghana, the crop is grown for its staple properties. The
root tuber is eaten boiled or as fried chips. It is also prepared into flour for various
domestic uses and drinking juice can also be extracted from the root tuber (CRI, 2003). As
a fast growing root crop that can be grown in all regions of the country, giving yields of 20

2
to 25 tonnes per hectare within four months, Sweetpotato has become an important food
crop in Ghana. It is also gaining importance as an export crop in the Bawku East District of
the Upper East Region. Farmers in the district export the crop to Burkina Faso, where good
prices are obtained (CRI, 2003).
1.2 Problem Statement /Justification
The production of sweetpotato is particularly in the Northern and Central Regions of
Ghana and as such local producers are not able to meet the demand for this crop in the
country. Although the Crop Research Institute (CRI) in Kumasi had released improved
varieties of sweetpotatoes with white, yellow and orange - flesh colours to farmers, it has
been observed that the few Ghanaian farmers who engage in small scale potato cultivation
in some selected areas in the country face a myriad of problems. The major problem is that
there have not been extensive studies on the crop to equip farmers with adequate
information on the agronomic practices. Rather work on testing adaptability and
acceptability of these released varieties through farmer participatory research and
dissemination of planting materials has been carried out (CRI- CSIR, 2006).
Despite its many benefits, sweetpotato is characterized by a low production, yield and
tuber quality in the country. This can be attributed to among other factors, the low fertility
of the soils on which the crop is grown. Sweetpotato responds to phosphorus and
potassium application under most conditions though the response rate and hence optimum
dose varies with the cultivar and soil types. Soil fertility depletion in smallholder farms is
currently recognized as the fundamental biophysical cause of declining per capita food
production in Africa. The inherent poor soil fertility of most soils in the tropics and

3
subtropics constitute a major constraint in sustainable smallholder crop production in Sub-
Saharan Africa (Myers et. al. 1994; Smailing et al., 1997).
The use of both organic and mineral fertilizers is often limited and this has resulted in a
gradual depletion of soil nutrients in sub- Saharan Africa (Smailing et al., 1997). Increase
in population which has resulted in land shortages has led to reduction in traditional
methods of maintaining soil fertility. Technologies based on combinations of organic and
inorganic sources of fertilizer would produce higher and more sustainable yields than
either organic or inorganic fertilizer alone (Mukhtar et al., 2010).
The soil in the production areas are characterized by low nitrogen, phosphorus and
potassium levels (SRI-CSIR, 2003). Since there is increased focus on sweetpotato as
source of energy and nutrients to meet the caloric and nutritional needs of the rapidly
growing population in Ghana, there is therefore the need to improve the fertility of the soil
through good management of potassium and phosphorus to achieve increase tuber yields.
Chemical fertilizers have been the conventional way supplying nutrients to the crop.
However with the increasing cost of fertilizers following the removal of government
subsidy on the commodity, farmers are looking for alternative but sustainable methods of
cultivating the crop. Applying poultry manure in combination with inorganic fertilizers
provides a favourable condition for both high and stable yields of various varieties of crops
(Palm et al., 1997).
In Ghana, not much work has been done on fertilizer regimes for optimum growth, yield
and development of sweetpotato. There is therefore the need for intensive research work on
nutrient supply to optimize the yield potential of the crop for commercial and industrial

4
utilization. The identification and selection of appropriate combination and rates of
inorganic and organic fertilizers will increase the production levels of sweetpotato in the
country and offer the possibility of utilizing the tubers in production of composite flours
thereby reducing the importationlevel of wheat flour and similar products for the food
industry in Ghana.
The use of foods rich in vitamin A to combat vitamin A deficiencies is gaining importance
in most parts of Africa. Increasing the consumption of the foods rich in vitamin A is
considered one of the food-based strategies for addressing vitamin A deficiency in the
communities (Smailing et al., 1997).
There is the need to satisfy different sectors of the society and to provide the vital
nutrients in the diet of those suffering from numerous ailments. There is therefore the need
to provide an alternate (cheap) source of these elements. In view of these the inclusion of
the orange fleshed cultivar which is important for vitamins and the white fleshed cultivar
which is also important source of energy in the evaluation is appropriate in optimizing the
soil nutrient supply for different sweetpotato types grown in the country to help combat
malnutrition among the under resourced.
There are adaptable varieties that are suitable for the local climatic conditions and planting
materials have been released to farmers by Crop Research Institute in the country.
Additionally, high beta- carotene cultivars have significant role to play in the national
crusade against Vitamin A deficiency (CRI, 2004).
Another serious constraint in large scale production and utilization of sweetpotato in
Ghana is the short shelf life of the harvested tuber.The crop is highly perishable and as
such requires good storage technique. Lack of suitable storage facilities among smallholder

5
farmers continues to expose farmers to intermittent food shocks even after harvesting of
the crop. Farmers rely on preservation methods derived from indigenous knowledge
systems for storing the harvested sweetpotato tubers.Studies indicate that post harvest
losses due to pest and diseases attack can account for as much as 40-60% of crop output
(Amoah et al., 2010). Important techniques of preserving crops derived from indigenous
knowledge have rarely been subjected to scientific enquiry. This study is premised on the
observation that local smallholder farmers in Ghana use most preservation methods
informally but not much is known about their efficacy from a scientific perspective. This
study will also examine the different sweetpotato storage techniques to compare their
efficacies and comparative effects on tuber quality. Information gleaned from these studies
may help to fine tune the indigenous technologies and popularize their use for
improvement in sweetpotato production and preservation. This will stem the current trend
of abandoning indigenous knowledge systems for more expensive and sometimes
hazardous chemical- based methods.
The principal post harvest problems associated with sweetpotato storage are fungal rots,
weevil damage and physiological changes (IITA, 1996). The only available storage
methods for sweetpotatoes are by leaving the crop in the ground and harvesting it only
when needed and trench storage (FAO, 1991). Eka (1998) reported that there is also dearth
of information on nutrient changes during storage of most root and tuber crops in Nigeria.
It is therefore important to optimize nutrient supply for high yield in the commonly
cultivated sweetpotato types in Ghana and to carry out a systematic study of the effects of
some storage methods on the stored sweetpotatoes in order to develop improved methods
of storage of the crop. This work is therefore aimed at investigating the possible changes in

6
quality and nutritional composition of sweetpotatoes during storage using different storage
methods.
1.3Objective of the Study
The objective of the study was to determine the yield and storability of two sweetpotato
cultivarsas influenced by chicken manure and inorganic fertilizer in the sweetpotato
production forest transitional agro- ecological zone of Ghana.
1.3.1Specific Objectives
The specific objectives are to:
1. Compare the effectiveness of organic (chicken manure), inorganic fertilizers and
integrated nutrient management for improvement of soil fertility on sweetpotato.
2. Determine the varietal response of sweetpotato root tubers to organic (chicken
manure), inorganic fertilizers and integrated nutrient management.
3. Compare the effectiveness of pit, ash, and grass storage methods for sweetpotato
root tubers in terms of: The rate of water loss in the root ubers, weight change, root
tuber sprouting, the rate of rotting of root tubers and pest infestation of root tubers.
4. Assess the effect of soil amendments on the quality of sweetpotato
5. Assess the effect of storage methods (Ash, Grass and Pit) on the nutrient levels of
sweetpotato root tubers.
6. Determine the financial implication of combined use of chicken manure and
inorganic fertilizer on the yield of sweetpotato.

7
CHAPTER TWO
2.0 LITERATURE REVIEW
2.1Origin and Botany
Sweetpotato, which is unknown in the wild state, is suggested to originate from the region
that extends from the south of Central America to the north – west of Latin America.
(Hawkes, 1989). Its spread to Polynesia and New Zealand dates back to the pre –
Columbian times. In the 16th century it reached many areas of Africa, Europe, India and
Indonesia through the Portuguese navigators (Yens, 1976).
At present world production of the crop is in excess of 130 million tonnes per annum, but
most of it is produced in Asia with China producing over 110 million (85%) tonnes per
year. In Africa, sweetpotato is grown in abundance around upland areas in the East African
Rift Valley, (Uganda, Burundi, Rwanda, Tanzania and Kenya) each country producing
about 1% of the world’s crop. The crop is now also widely grown as an important staple
food in a number of African countries including Burundi, Rwanda, Uganda and Nigeria
among others (Awojobi, 2004). It is also found in most African regions with large
variations in relief (e.g. Cameroun, Guinea, Madagascar) or where the dry season is too
marked for cassava growing as in the Sudano – Sahdian fringe or in North Africa. In all,
sub-Saharan Africa produces only 6% of the world’s sweetpotato crop (Tweneboah, 2000).
Past and current production trends suggest that sweetpotato output in developing countries

8
is increasing, for example in Africa it is estimated that it is presently growing at about five
percent per year (CIP, 1996).
In Ghana, the production of sweetpotato is concentrated almost entirely in the Northern,
Upper East and Upper West regions where it is sometimes included in traditional food crop
rotations. The crop is also frequently cultivated in the northern part of the Volta region ,
Ada-Sege areas in Greater Accra region and Komenda –Peposo areas in the Central Region
( Tweneboah, 2000).
Sweetpotato (Ipomoea batatas (L.) Lam), although naturally a perennial, is commonly
grown and harvested within the same cropping season. It belongs to the family
Convolvulaceae. It is grown particularly for its edible tubers produced by certain roots. It
is propagated by stem cuttings and tubers.
Sweetpotato is a herbaceous plant, generally with trailing stems, only the extremity of
which is erect. The stems are often called vines, but they are not true vines. The length of
the stems varies between 0.5 and 5 m long depending on the variety and the growing
conditions. Latex is present in all parts of the plant (Martin, 1985).
The leaves, measuring up to 15 cm long and pointed at the tip, are spirally arranged and
have long petioles of 5 -30 cm. They are cordate, entire or lobed with a more or less
pronounced leaf incision with a leaf area index (LAI) of 3-4, its growth decreasing when
the LAI exceeds 4 (Bhagsari and Ashley, 1990).
The flowers are violet or white and are hermaphroditic but rarely self-fertile. The corolla is
2.5 - 5 cm long. Flowering and consequently seed production of sweetpotato varies with
the variety and the environmental conditions. Flowering is maximal during short days (up
to 12 hours of daylight) and stops when daylight lasts more than 13 hours. Natural

9
pollination is done by insects. Cross-fertilization is the general rule as most varieties of
sweetpotato are self-incompatible. At each node, cuttings may produce adventitious roots
that can be divided into (i) young roots, (ii) fibrous roots, (iii) filiform tubers and (iv) good
tubers. Depending on the activity of the primary cambium, the young roots will evolve into
one of the three forms of root. In the case of seedlings, there is a fifth category of root,
which is a tap-root that appears after germination. This tap-root is predominant in the
tuberization process, giving rise to an enormous tuber (Janssens, 2001).
The tubers form where the roots curve downwards after growing horizontally. Their
number and size as well as the colour of the skin and flesh are variable. Their weight
usually varies between 0.2 and 3 kg and their number from two to five or more per plant.
The number of tuberous roots is a major yield component.
Tuberization generally begins between the second and third month, depending on the
variety and the agro-ecological conditions. The duration of vegetation, which can be as
little as 4 months or as much as 12, depends on the variety and the climate.
The root system is extensive reaching its peak within four (4) weeks after planting (WAP)
and secondary thickening starts at 8 WAP and is completed within 16 weeks (Lowe and
Wilson, 1974). The root tuber which is the main harvested organ may have a white,
yellow, orange, purple or brown skin surface and the flesh is white, yellow, orange, red or
purple. It matures within 4 months after planting even though harvesting is delayed on
higher elevations due to lower temperatures and radiation (Kimber, 1972).
The skin of the root tuber may be smooth or rough. It is sometimes grainy but only rarely
scaly or veined, and may be marked by the points at which the rootlets emerged. The skin
colour may change when the root tuber is cut and almost invariably do so when it is

10
attacked by parasites. This turn greenish or dark brown as the tissues oxidise in contact
with the air. The colours of the skin and of the storage parenchyma are good indicators of
different cultivars in the fresh state, but may alter during cooking. Provided it is kept clean
and in a favourable environment, the harvested root tuber will, after a few weeks, produce
sprouts that can grow into a new plant. The sweetpotato is thus a perennial (Degras, 2003).
2.2Nutritive Value
The fresh tuber of Sweetpotato contains 60-70 % water, 15-25 % starch, 1-2% proteins and
1-2 % sugar. The tuber also contains significant amount of vitamins A, B1, B2 and C and
minerals such as K, Na, P and Ca. The young leaves are also rich in protein, minerals and
vitamins (Onwueme and Sinha., 1991). The crop is efficient in the production of
carbohydrates, proteins, vitamins and cash income per unit area of land and time
(Magagula et al., 2010).
Varieties with yellow or orange flesh have a very high (up to 0.18 %) of beta-carotene and
taste of sweetpotato where as the White –fleshed varieties have low contents of beta –
carotene, a precursor to vitamin A (Messiaen, 1994).
2.3Varieties
The flesh colour of the root varies from various shades of white, cream, yellow to dark-
orange depending upon the pigment present. In the orange-fleshed sweetpotato the major
pigment present is carotenoids, especially β-carotene, while anthocyanin is present in
purple-fleshed varieties. Several varieties of sweetpotato are cultivated in Ghana for food
uses. Scientists of the Crop Research Institute (CRI) of the Council for Scientific and
Industrial Research (CSIR) have developed a sweetpotato variety that has the potential of

11
addressing the problem of Vitamin A deficiency in children.The new variety, locally called
Sauti, which is said to have high levels of beta carotene, the substance that is synthesized
to produce Vitamin A, is, therefore, a viable substitute for Vitamin A capsules
administered to children to prevent them from the negative effects of Vitamin A deficiency
which include poor eye sight. The new variety is one of the four improved varieties
developed in 1998, after a 10-year research by the institute.
Other varieties released by the Institute were Faara, Okumkom, Ogyefo and Santom Pona
(white-fleshed), sauti, high starch (yellow-fleshed), Apomuden and Otoo (orange- fleshed)
(CRI-CSIR, 2006).
Varieties of Orange flesh sweetpotato (OFS) released in Ghana in 2005 have increased
levels of beta-carotene and range from yellow- to orange-flesh colour. In previous studies
in Ghana, consumers accepted and utilized sweetpotato leaves as food through modified
and culturally-acceptable traditional recipes. Initial results of consumer preference tests in
Ghana of incorporating OFS as an ingredient in local breads showed significant positive
response and willingness to pay extra if available ( Bonsi et. al. 2009).
A trial on an evaluation of five new sweetpotato varieties in University of Ghana, Legon
shows that normally, sweetpotato varieties were accepted as staple food in Ghana in terms
of flavour and colour. Variety 91/198 was most preferred, while variety 91/62 was the
most preferred with regard to texture and taste. The overall acceptability showed that
variety 91/198 was the most preferred and was also the one with the least sugar content. In
fact, varieties 91/198 and 91/62 consistently emerged as the best two varieties, with most
of their qualities preferred among the five studied. On the whole, the Injala White variety
was the least accepted (Opare-Obisaw et. al. 2000).

12
2.4Growth Requirements
[[
2 4.1 Climatic requirement
Sweetpotato thrives and does best in a warm climate, with plenty of sunshine and moderate
showers evenly distributed throughout the growing season. The crop has a short growing
season and so can avoid long dry seasons (Kapinga et al., 1995). Sweetpotatoes are widely
grown from 40° N and 40° S and above 2500 m at the equator (Hahn and Hozyo 1984).
Best growth for the crop is obtained at average temperature of 24°C. The crop is very
adaptable, but the yield is higher under favourable conditions. Growth and production are
better in hot, humid regions. The plant, however, requires a high humidity at the beginning
of its growth only, once the tubers have formed, any excess moisture in the soil may cause
rotting. Tuberization is favoured by short days (11 hours) and cool nights. Tuberization is
inhibited if daylight lasts 14 hours or more (Degras, 2003).
Temperatures below 10° C may be inimical to sweetpotato plants. Growth begins at 15° C
and is optimal between 21° and 28° C (Janssens, 2001). Leaf shading is a key determinant
of soil temperature, relatively small increase in soil temperature can have a direct effect on
tuber quality.
Bourke (1985a) reported of yields as high as 20 to 30 tonnes per hectare in 8 months at
1600-2000 m altitude, where temperatures are typically 16o C to 18°C. According to Ngeve
et al., (1992), in the tropics, there is yield decline with increasing altitude. Goodbody and
Humpfreys (1986) have also indicated a delay in maturity with increasing altitude.

13
According to Folquer (1974), flower and seed production are best at daily maxima and
minima of 23-24°C and 13-19°C respectively. In Puerto Rico, flowering in glass houses
did not occur above 27°C (Campbell et al., 1963).
Kay (1973) has indicated a water requirement of at least 400 mm during the growing
season stating that the crops tolerance of water deficit during tuber initiation at 50-60 days
after planting. Sweetpotato is intolerant of water logging particularly during tuber initiation
but the crop at times is tolerant to drought (Wilson, 1982; Hahn and Hozyo, 1984).
Maximum dry matter accumulation rates of 85-170 kg ha"1 d" reaching a leaf area index
(LAI) of 3.24, were shown in a subtropical environment (latitude 29° S) (Lowe and
Wilson, 1974a). Substantially higher values of 260 kg ha"1 d'' at an LAI of 6.7 and a final
tuber yield of 15t ha"1 were attained when the crop was trellised on wire mesh 1.2 m high.
The authors however maintained that the growth rate and yield depends very much on
genotype. On biomass partitioning, Austin et al., (1970) and Huett, (1975) have indicated
relative growth rates of tubers to be 0.4 to 0.6 g g"' wk for the first half of their growth
period. Growth rate and partitioning between root tubers and vegetative organs are
sensitive to plant structure and nutrition; translocation rate may increase during tuber
growth (Hahn and Hozyo, 1984). There is an inverse relationship between mean tuber
weight and number of tubers (Lowe and Wilson, 1975). Watanabe and Nakayama (1969)
have reported of a large amount of fibrous root associated with increased top growth and
reduced tuber growth, a condition associated with high temperature, low potassium or high
nitrogen /potassium ratio.

14
Temperature both in the field and in storage has a large impact on tuber sugar content.
High soil temperatures result in sugar ends or other sugar-related problems. Low
temperatures result in cold-induced conversion of starch to sugars.
2.4.2 Soil Requirements
Sweetpotatoes are grown on a variety of soils, but well-drained light and medium textured
soils with a pH range of 4.5-7.0 are more favourable for the plant (Woolfe, 1992; Ahn,
1993).
Sweetpotato can colonize marginal soils because it readily produces adventitious roots and
has trailing vines,. Consequently, it is not very demanding as regards soil type. It needs a
light, friable, fairly permeable loam, without an excess of nitrogen, which would otherwise
stimulate development of the aerial parts at the expense of the root tubers (Raemaekers,
2001).
Sweetpotato shows good tolerance to aluminum-rich, phosphorus-poor acid soils. Growth
is still possible at pH 4.0. It adjusts easily to highly organic soils. Conversely, compacted
soils must be avoided. The crop will not tolerate continuous hydromorphic conditions for
more than three days. Excess nitrogen and hydromorphic conditions promote the
production of fibrous roots (Janseen, 2001).
Planting sweetpotato cuttings in heavy, waxy soils must be avoided as they are not
conducive to high yields of potatoes. Sweetpotatoes grow best in a well-drained, loamy to
sandy soil. Those grown in heavy clay soil may be smaller and misshapen. Sweetpotatoes
are adapted to a wide range of textural classes of soil. According to Mcgraw (1999), the
crop yields more and better on moist, well-drained light sandy loam or silty loam soils. He

15
observed that rich, heavy soils produce high yields of low quality roots whilst extremely
poor light sandy soils produce low yields of high quality tubers.
2.5 Propagation
Although sweetpotato can be cultivated by seed, conventionally and traditionally it is
propagated using stem cutting fragments 20-30 cm long with 3-5 nodes. The planting
materials are vines, sprouts and root cuttings and a hectare of land will require 400,000-
1,250,000 vines depending on the cultivar (Du Plooy et al., 1988).
Stems and lateral shoots can be used to supply cuttings. The age of the plant is an
important factor in the recovery and survival of cuttings, especially in ecosystems where
the length of the vegetative period is limited. Several factors influence the choice of plants
from which to take cuttings assuming a shortage of planting materials does not mean that
all plants have to be used. These include the degree of damage that may be caused to the
crop if a nursery is not involved, the ease with which the cutting operation can be carried
out, the plant's performance level and its health status. In most cases, only the upper parts
of the plant are used. They are easier to access, since little or no rooting will have taken
place, and they are generally considered to perform better. A study of two cultivars grown
from August to February in Guadeloupe showed that cuttings taken from the middle part of
the third stem gave better yields than cuttings taken from the top of the first two stems. The
lower cutting from the first stem also did better than the upper one under these conditions.
Nevertheless, when all responses are compared, upper cuttings are definitely the ones to
use (Degras, 2003).

16
Propagation is done vegetatively, generally by stem cutting or by using a roottuber, a
fragment of a tuber or a tuber sprout (sett), the latter having the same value as an ordinary
cutting. (Propagation by seed is only done for breeding purposes).
Cuttings are only used in tropical countries where sweetpotato is grown all year round.
They should be 20 - 40 cm in length, with 3 to 4 buds and should come from young tips or
by the middle of stems. They should be taken at the right time of planting or stored in the
shade until they are planted out. Cuttings taken at the base of the stem, where leaves have
dropped off, do nott grow well and the corresponding yields will be low. Planting one
hectare requires about 30,000 to 90,000 cuttings. Traditionally, the cuttings for a new crop
are taken from the top halves of young plants. This practice reduces the risks of
transmitting viruses and ensures a more vigorous growth of the cuttings. It does not,
however, preclude the transmission of latent viruses, which are often present in the young
tissues. Cuttings are planted at a spacing of 100 x 30 cm, with one cutting per hill. Virus-
infected plants should be pulled out (Janssens, 2001).
2.6 Agronomic Practices
2.6.1 Weed Control
Weed control is important until the plants cover the row. Effective weed control is
important during the early part of the growing season of the sweetpotato crop when the
plants are getting established but before the vines have grown extensively. The soil is
worked towards the row to widen the ridge. Cultivation should be continued until the vines
meet in the middle, but after this no or less attention is paid except to pull out the large
weeds by hand. The first intercultural operation 30 days after planting along with weeding
and earthing-up improves the physical condition of the soil. The second inter-cultural

17
operation and earthing-up should be done 45-60 days after planting. The cuttings take root
very quickly and, after two months, the vegetation will have covered the ground.
Maintenance operations are limited to weeding once or twice after planting and to
protecting the mounds against erosion (Raemaekers, 2001).
Weeding can be carried out entirely manually or may be partially or fully mechanised.
Under traditional manual cropping, the first weeding is often the only one. But provided it
is done carefully it may be all that is needed if the plot has been cleared from primary or
old secondary forest. Under such conditions the seed reserves of weeds in the soil are low,
and the ability of sweetpotato to cover the soil rapidly limits weed development.
In the USA, sweetpotato cropping, combined with selected cultural practices, has been
recommended for reducing infestations of Cyperus rotundus (Degras, 2003).
Weed control may also involve the use of herbicides. Application of herbicides has effect
on tubers. Tubers exhibit various effects when sprayed with herbicides. Poor colour and
flavour in potato chips will be experienced with the application of herbicides. Herbicides
containing urea increase the sugar content of the tuber. Herbicides such as chloramben,
Diphenamid and glyphosate cause decrease in the starch content of tubers, while others
cause a restructuring of the starch granules, some herbicides lower the amount of amylase
in the starch of the tuber while, some herbicides slow down the growth of plant roots,
which is a factor in reducing the final crop yield.( Lisinska and Leszcvaski, 1989).

18
2.6.2 Pest and Diseases of Sweetpotato
Throughout its range, sweetpotato is prey to nearly 300 insect pests. It is also attacked by
some 14 viruses and many different fungi. Yields are often lower in the tropics, suggesting
that pests and diseases in general are also significant constraints in these environments
(CIP, 1996).
Pests can attack the crop at any stage of its development - from the nursery to maturity in
farmers' fields. Wet and warm conditions increase the likelihood of serious infestations.
Harvested root tubers stored for processing at village level are also susceptible to pest
attack. Exposing stored root tubers to the sun can sometimes treat or limit the pest damage.
The feeding behaviour of some insects may look inconspicuous at the time but can lead to
serious problems later due to the transmission of viruses (Degras, 2001).
Sweetpotato is prone to a number of pest and disease attack in the field, at harvest and
during storage. In the field, the major pests are Cylas formicarius (Fab), a sweetpotato
weevil, whose larvae feed on the tubers and Sweetpotato butterfly (Acraea acerata) which
feed on the leaves (Purseglove, 1987; Capinera, 1998). According to them Cylas
puncticollis (Sum) is yet another serious pest for susceptible varieties when planted on
soils previously planted with infested crops with the attack being heaviest near the soil
surface. According to Sowley (1999), weevil attack is most serious when drought persists
for a long time, more especially in theminor season, but early planting and harvesting can
greatly reduce this situation (Lema, 1992).
Milking increases cylas build up, but control of the weevil can be achieved using a solution
of soap detergent (CRI, 2004). Major losses suffered by sweetpotato due to disease attack
include; soft rot and ring rot caused by Rhizopus stolonifer; storage rot caused by Erwinia

19
chrysanthemi; black rot caused by Ceratocystis fimbriata; surface rot by Fusarium
oxysporum; dry rot by Diapothe phaseolorum varbatatis; charcoal rot by Macrophomina
phaseolina and Java black rot by Botryodiplodia theobromae syn. Lasiodiplodia
theobromae (Sowley, 1999). Early harvesting between 3-5 months after planting has
generally been proven to maximize yield and reduce damage ( Missah and Kissiedu, 1994).
The major disease of sweetpotato in Ghana is the Sweetpotato Virus Disease (SPVD)
(CRI, 2004). Infected plants show stressed vegetative growth and development. Control
measures include use of resistant varieties, use of healthy planting materials, practice of
crop rotation and earthing up during weeding. The sweetpotato aphid is also reported to
destroy the young leaves and vegetation.
After harvest, drying of rootstubers too slowly or during rainy weather can encourage
attack by fungi or moulds (Degras, 2003).
2.7 Fertilization in Sweetpotato Production
2.7.1.1 Effect of Nitrogen
Bourke (1985b) reported that nitrogen is one of the most abundant elements in plants and
animals, as it is a major component of proteins. The amount of nitrogen required by a crop
is large compared with the natural nitrogen reserves in most soils, and so most crops
respond positively to additional nitrogen, whether from animal manures or inorganic
fertilisers such as urea. However, this pattern does not always hold for sweetpotato. In
some studies, nitrogen application has been reported to reduce sweetpotato yields. More
commonly, the pattern is for low rates of nitrogen to increase yield to some extent, but
higher rates to cause a yield decline. The reason for this confusing response is that nitrogen

20
supply has a strong influence on the distribution of dry matter within the plant, particularly
affecting root growth relative to top growth. When nitrogen supply is high, plants tend to
grow more tops relative to roots. In the case of sweetpotato, high nitrogen may cause
luxuriant growth of the vines at the expense of root tuber yield. However, excessive N
rates stimulate vine and root growth and delay tuber bulking and maturation (Bradbury and
Holloway, 1988).
Cultivars vary greatly in the level of nitrogen required to maximise yield, and in their
tendency to reduce yield at higher levels of nitrogen. In particular, negative responses to
nitrogen are more common in cultivars developed in low-fertility areas where soil
amendments are not traditionally used. One study reported that an application of 60 kg
nitrogen/ha increased yields of three USA cultivars but decreased the yields of three
African cultivars. In the soils of West Africa large responses to nitrogen are often obtained
on soils which have been heavily cropped in the past, or those subject to heavy leaching.
The response to nitrogen may be poor, however, if deficiencies of other nutrients such as
potassium are overlooked and left untreated. Sweetpotato tends to respond better to
composts of plant materials which contain high potassium relative to nitrogen, than to
animal manures, which are lower in potassium. However, this depends on the balance of
nutrients present in the soil (Hill and Bacon, 1984; Halavatau et al., 1996)
A sweetpotato crop of 20 t/ha removes approximately 87 kg N/ha, if root tubers and vines
are harvested. The optimum rate of fertilisation will depend on the amount of plant-
available nitrogen in the soil, and on yield potential, which may be dictated by the
available soil water and rainfall. Reported recommendations for application of nitrogen
fertilisers to sweetpotato generally lie between 30 and 90 kg N/ha (De Geus, 1967). Over

21
fertilization with nitrogen may lead to reduced yields, as it may encourage excessive vine
growth at the expense of the root tubers.
Nitrogen deficiency is sometimes associated with waterlogging of the soil. Under
anaerobic conditions, soil bacteria quickly convert soil nitrate into nitrogen gas (N2), which
is lost to the atmosphere. Improved drainage can be achieved by increasing the height of
ridges or mounds, keeping the troughs between them clear of weeds, and providing
adequate channels for excess water to leave the field. Sweetpotato is sensitive to
waterlogging, and the crop tends to yield poorly if waterlogging occurs for even a short
period, particularly in the early stages of crop growth. Therefore, good drainage is
necessary regardless of nitrogen supply. Improved nitrogen nutrition of the crop also leads
to higher protein concentrations in the root tubers, and this may be of considerable
significance in communities which obtain much of their protein from crops (sweetpotato).
Plants need nitrogen for growth, reproduction and photosynthesis. In most areas studied,
nitrogen (N) was not as effective as other fertilizers (potassium or phosphorus) in
increasing sweetpotato yield. Too much nitrogen could result in excessive vine growth,
misshapen tubers with cracked skin and poor storage qualities (Mascianica et al., 1985;
Walker and Woodson, 1987).
Work done in Ghana revealed that when the soil nitrogen level is zero(0), increasing
nitrogen fertilization is beneficial to yield, but that above 30 kg/ha nitrogen application
was detrimental to yield increase (SRI-CSIR, 2003).
Nitrogen affects the number and weight of root tubers. In Ghana a trial conducted by SRI-
CSIR on sweetpotato response to nutrient balances showed that when nitrogen levels are
increased above zero, yield levels of sweetpotato increase, but when nitrogen levels are

22
increased above the optimum level of 30 kg/ha to 60 or 90 kg/ha, the yield decreases,
relative to the optimum rate of 30-30-30 (SRI-CSIR, 2003). Khush (1999) stated that
historically, manure application rates have been based on crop nitrogen requirements,
nitrogen content of manure, and N availability in the source. However, because animal
manure causes soil phosphorus (P) to build up when manure is applied according to N
needs, the current tendency is to base application rates on P content of manure and soil
when P run off risk is high. Manure applications should consider both the P and N content
and site-specific conditions. Utilization of compost, manure, fertilizer, and cover cropping
has different effects on soil N movement, and soil quality and fertility, depending on how
long each has been implemented. While insufficient soluble N can curtail potential yield,
excessive soluble N can result in serious ground- and surface-water contamination.
Intensive use of N fertilization has contributed to heavy N leaching into the environment
(Socolow, 1999). Scientists have suggested improving crop plant utilization of N as one
way of reducing groundwater nitrate contamination. Using non-fertilizer approaches to
supply crops with less-soluble N could also help reduce N losses to the environment.
Nitrogen application also increases carotene content of sweetpotato root tuber (Degras,
2003). In a study conducted in Umudike in Nigeria on all trans-cis β-carotene content of
selected sweetpotato varieties as influenced by different levels of nitrogen fertilizer
application, revealed that there was a decline in the all-trans-cis-β-carotene content of
sweetpotato varieties with the exception of CIP Tanzania above 80 kg N/ha. This trend
established that the total β-carotene and all-trans-cis isomers of β-carotene yield are better
at 40 to 80 kg N/ha. The β-carotene values from sweetpotato varieties common to Africa
are however low (Ukom et al., 2011).

23
The International sweetpotato Center (2007) noted that the β-carotene content of
sweetpotato common to Africa ranged from 100 to 1,600 μ gRAE/100g, thus agreeing with
the β-carotene values obtained in this work for most of the varieties. The implication of
this result is that nitrogen fertilizer application for optimum β-carotene yield will depend
on each variety and environmental variations (Villagaria, 1999). This may be the reason
why TIS87/0087, (a white-fleshed, and improved elite variety) and Ex-Igbariam, (a local
orange-fleshed variety) with high nitrogen response ability and high photosynthetic
activity) yielded higher β-carotene and trans-cis β-carotene values than CIP Tanzania and
TIS8164 varieties. CIP Tanzania was observed to have the least β-carotene concentration
at 40-80 kg N/ha due probably to low nitrogen response and poor environmental adaptation
(Okon, 2006).
2.7.1.2 Effect of Potassium
Sweetpotato like all other tuber crops has a high requirement of potassium fertilizer
(Raemaekers, 2001). According to Foth (1978), K is required for efficient water utilization
in the crop, increases its sugar content and tolerance to diseases.
Potassium contributes to early growth, water and nutrient use, protein production and
improved resistance to disease. Increasing the rate of potassium fertilization results in a
significant increase in tuber yield.It has been shown to be an important fertilizer for
sweetpotatoes. In Ghana, potassium applications significantly improved sweetpotato yield.
Applications were made at NPK ratios of 30-30-0, 30-30-30 and 30-30-60, with increased
yields in tonnes/ha of 8.75, 12.3 and 14.4, respectively. The FAO document that outlined
this study commented that potassium appeared to be the most important nutrient in the
production of sweetpotato (SRI-CSIR, 2003).

24
Total root yield has been reported to increase with K supply but the magnitude however
depends on the initial K level (Hammett et al., 1984) indicating that K application at 120kg
K20/ha rate gave the highest yield. Nicholaides et al., (1981) have shown that different K
fertilizer levels produced no significant effect on both vine weight and vine length.
In a field study on K effect on yield, Zhi (1991) observed that total root yields were
significant with increased K application. The treatment 120 kg K2O/ha gave the highest
yield of 21.4 t/ha while O kg K2O/ha (control) gave the yield of 17.7 t/ha. Constantin et al.,
(1977) however established no significant difference in harvest index and dry matter
among the levels of K fertilizers. According to him differences however exist among
varieties. Villareal (1982) advocates for a far higher K level compared to N for maximum
sweetpotato yield as increasing N rates tend to decrease root yield.
According to Hammett and Miller (1982), increased starch content decreased firmness of
canned root and crude fibre content have been achieved through K application. Hammett
and Miller (1982) found out that the carotene content, ascorbic acid levels and soluble
carbohydrate levels of sweetpotato were not influenced by K application. K is significantly
crucial in the plant energy status, translocation and storage of assimilates and maintenance
of tissue water relations (Marschner, 1995).
Martin-Prevel (1989) and Perrenoud (1993) have indicated that K nutrition influences
tuber quality, tuber size, specific gravity, susceptibility to black spot bruises, after cooking
darkening, reducing sugar level, fry colour and storage quality. Perrenoud further
submitted that for desired light colour potato chips, the glucose and fructose content of
potato should not exceed 0.25%, which K effects or produces by its sugar reducing
property.

25
Perrenoud (1990) has reported of K increasing the crop resistance to diseases by improving
the plant's health and vigour. According to him, K increases the production of disease-
inhibitory compounds such as phenols, phytoalexins and auxins around infected sites of
resistant plants. Potassium fertilizers according to Perrenoud (1993), have also been found
to decrease the incidence of such diseases as late blight.
Bergmann (1992) indicated that K promotes the thickening of cell wall and the growth of
meristematic tissues thereby preventing penetration of the epidermis by parasites. Its
deficiency according to Kiraly (1976), increases inorganic N accumulation and the break
down of phenols that have fungicidal properties.
It is important to avoid excessive late-season applications of potash. Starch synthesis and
specific gravity increase with increasing K concentration up to an optimum tuber
concentration of 1.8 percent. However, at higher K concentrations, specific gravity
decreases as root tubers begin to absorb more water due to the osmotic effects of increased
tissue salt concentrations (Dahnke et. al. 1992).
2.7.1.3 Effect of Phosphorus
Phosphorus (P) as a major plant nutrient is generally essential for plant respiration,
photosynthesis, cell division, energy storage and early crop maturity. Phosphorus is
essential for energy transfer in plants and helps early growth and plant maturation,
including flowering. Phosphorustends to increase starch synthesis, but in contrast with N it
hastens rather than delays maturity. Phosphorus deficient potato plants typically produce
tubers with lower specific gravity compared to those with adequate P nutrition. The P/N
balance is also important and, to a degree, adequate P can help counter low specific gravity

26
associated with high N levels. Like nitrogen, phosphorus increase the carotene content of
tuberous roots during the yield increase period, and also affects the unit weight of
roottubers (Degras, 2003).
Most studies have shown that phosphorus does not have a significant effect on increasing
sweetpotato yield. For instance, the Philippine study commented that at all levels of N and
K used, addition of P did not result in any significant increase in yield (Degras, 2003).
Researchers in Ghana showed that increasing the rate of phosphorus application does not
increase sweetpotato yield (SRI-CSIR, 2003). A study by CRI (2003) on the effect of
imbalanced fertilization on sweetpotato tuber yield and number in the Sudan Savanna Zone
of Ghana showed that increasing rate of P does not increase yield.
Similar results were obtained by Jayawardenes (1985) when he conducted a study on the
effect of inorganic P fertilizer and poultry manure on yield of sweetpotato. Application of
inorganic P did not significantly affect yield and other characteristics of sweetpotato.
Application of 10 t/ha of poultry manure (PM), however, significantly increased the
number of marketable roots. A combination of 100 kg P2 O >5/ha and 10 tonnes PM/ha
recorded the highest yield compared to other treatments. Jayawardenes's findings also
showed that marketable tuber yields were not also influenced by the percentage of P and
PM applied. As part of Jayewardene's experiment the treatment 50 kg P205/ha + 10 tonnes
PM/ha treatment gave the lowest yield with no pronounced effect on vine growth and the
number of tubers per plot. PM at 10 t/ha with zero P produced significant number of
marketable tubers. PM at 30 t/ha gave significant root tuber yield in white sweetpotato
(Grewel and Trehan, 1983).

27
2.7.2 Effect of Organic Fertilizers
2.7.2.1 Poultry Manure and its Effects on the Physical and Chemical Properties of
the Soil
The physical and chemical composition of poultry manure is influenced by the bird type,
number of birds per unit area, kind and amount of litter, time of use and management
factors (Eno, (1962). The quality of PM is equally affected by climatic conditions during
litter production, and storage after production. Overcash (1983) reported that average daily
fresh manure produced by broilers and hens is 18 and 22 kg/1000 kg live weight per day
respectively also affected by feed.
According to FAO (1984), fresh droppings of chicken contain about 70% moisture.
Hileman (1967), reported that 1 tonne broiler litter could supply 6.38 kg Ca, 18.48 kg Mg,
1.01 kg Mn, 4.4 kg Fe, 0.18 kg B, 0.55 kg Zn and 0.015 kg Mo.
Poultry manure has been found to improve upon both the physical and chemical properties
of the soil when applied appropriately. Physically, Hileman (1967), and Bonsu (1986),
have reported that PM improves the physical condition of both light and heavy soils.
Improved physical conditions enhance aeration, ease of seed bed preparation, seed
germination,water holding capacity,soil microbial activity, water infiltration and structural
stability of the soil.
Chemically Bandel et al., (1972), has indicated that poultry manure helps to ameliorate and
improve micro-nutrient deficiencies in most soils. In their study in the rain forest zones
(Agboola et al., (1972) have revealed that moderate poultry manure application slowed
down humus decomposition by half compared to mineral fertilizer.

28
Poultry manure helps to correct Zn and Fe deficiencies in the soils and supplements NPK
fertilizers in crop production (Miller et al., 1970).
The release of ammonia from poultry litter when incorporated into the soil raised the pH of
soil hence reducing soil acidity (Hileman, 1971). Agboola et al., (1975), have reported of
similar chemical properties, adding that the content of exchangeable Ca and Mg is
increased and uptake of P improved, while reducing Fe, Al and Mn with the addition of
PM to the soil.
Poultry litter incorporation also increased organic carbon and N to the depth of 15 and
30cm respectively (Kingery et al., 1993). Addition of excess broiler manure to the soil
according to Hileman (1970), however increases soil toxicity and renders it inefficient.
As a basal fertilizer, poultry manure is worked into the soil during land preparation, the
depth depending on the soil type and climate. Deeper incorporation may be desired for
light porous soils than heavy or wet soils. Muller-Samann and Kotschi(1994),suggested
working the manure close to the surface rather than burying it deep. Owing to its caustic
effect and heat generation, application of poultry manure shortly before cropping causes
injury to crops (Bandel et al., 1972). Incorporation with tillage also reduces N and P losses
by volatilization and surface run-off (Moore et al., 1995).
An incubation period of one month after application before planting allows for total
nitrification to avoid the risk of ammonia toxicity (Siegel et al., 1975). Rate of
magnification and nitrification, varies depending on climate and soil. According to
Hileman (1971), however, there is no need for any incubation period before planting of
crops because of the rapid chemical changes in the soil following broiler litter
incorporation.

29
In a field study conducted in the Middleveld agro-ecological zone at the Malkerns
Research Station in Swaziland, the results showed that temperature at the soil surface was
significantly higher than at lower depths and was negatively but not significantly
correlated to some parameters: leaf area, leaf area index, specific leaf area ,net
assimilation rate and crop growth. Sweetpotato yields declined with increased levels of
chicken manure: 20 t/ha chicken manure yielded (20.6 t/ha); 40 t/ha chicken manure
yielded (19.3 t/ha); and 60 t/ha chicken manure yielded (13.3 t/ha) (Magagula et al., 2010).
Guri (1986)stated that animal manure that is not well decomposed generates much heat in
the soil. This heat can cause some soil microbes to become inactive and may also kill some
young plants growing in the soil. It is therefore advisable after applying the manure on the
land to leave it for at least two weeks to decompose well before planting. According to
Leonard (1982), manure that is applied too far in advance may lose nitrogen by leaching.
Fresh manure unlike decomposed manure should be applied a week or more in advance
and should be ploughed in as early as possible.
According to Baffour (1984), fertility of the soil must be maintained by applying animal
manure, compost, crop rotation, cover cropping, green manuring as well as proper land
usage. Riceand Rice (1987) observed that the use of well rotted manure prior to planting,
and a pre-planting application of complete fertilizer is generally beneficial and required for
good plant growth and yield.
2.7.2.2 Effect of Poultry Manure on Growth and Yield of Sweetpotato
The nutrient composition of poultry manure varies with the type of bird, the feed ration,
the proportion of litter to droppings, the manure handling system, and the type of litter.
Except for nitrogen, the availability of most nutrients in poultry manures is fairly

30
consistent. Nitrogen can occur in several forms, each of which can be lost when subjected
to improper management or unfavourable environmental conditions. Nitrogen in poultry
wastes comes from uric acid, ammonia salts, and organic (feacal) matter. The predominant
form is uric acid, which readily transforms to ammonia (NH3), a gaseous form of nitrogen
that can evaporate if not mixed into the soil. When it is thoroughly mixed, the ammonia
changes to ammonium (NH4+), which can be temporarily held on clay particles and organic
matter. Thus, soil mixing can reduce nitrogen losses and increase the amount available to
plants (Zublena et al., 1996).
The value of poultry manure stems from the fact that it has been used successfully on a
wide variety of crops either as a single plant nutrient source or in supplementation to
commercial fertilizers (Hileman, 1972). Hileman was particularly emphatic on broiler litter
which according to him returns huge proportion of plant food such as N, P, K and Mo to
soil.
Nutrient studies conducted in 2009 at the north Mississippi research and extension center
to grow, evaluate, and screen some sweetpotato cultivars showed that poultry litter can be
utilized as a fertilizer source in sweetpotato production and that over-application of
fertilizer can cause excessive vine growth and lower than expected yield. The excessive
vine growth was most likely due to excessive N fertilizer from additional inorganic N
fertilizer applied following a litter application. The best fertilizer system for conventional
farming includes poultry litter plus supplemental P&K based on litter and soil test
analyses. If growing for the organic market, a higher litter rate could be applied based on
available K as long as total N content does not exceed soil test recommendations (Smith et
al., 2009).

31
Asubonteng and Dennis (1995), in their study of poultry manure on rice revealed that
poultry manure was as good as mineral fertilizer; however its impact on yields depended
on the site and the state of the soil. In combination with N.P.K. (20.20.0), Boateng and
Oppong (1995), observed that poultry manure gave the best yield of maize.
Baum et al., (1983) observed that higher yield of maize was obtained with 10 t /ha of
poultry manure than with adequate application of N and P fertilizers. Miller and Turk
(1951) also observed that crops such as corn, cotton, tobacco and potato which were heavy
users of N and P benefited a lot from poultry manure.
Studies on the effect of poultry manure with mineral fertilizer on crop yield have shown
that poultry manure effectively complements inorganic fertilizers. Asubonteng and Dennis
(1985), have shown that the combined effect of poultry manure and mineral fertilizer on
crop yield was better than either of the two when applied on sole basis at all rates. Agboola
et al., (1975), have also reported that increasing P with mineral fertilizer and small amount
of poultry manure increased yields, although mineral fertilizer alone on extremely acidic
and humid sites had no effect on cowpea.
The combinations of poultry manure with mineral fertilizers are more often than not more
effective than equivalents of manure nutrients alone or those of separately applied
inorganic fertilizers (Buresh et al., 1997); Palm et al., (1997); and FAO, (1998)).
The combination of organic and inorganic fertilizer does not only improve crop yields, but
also improves the physical status of the soil. Dennis et al., (1993), have indicated that the
combination is best for savanna soils.

32
2.8. Harvesting and Curing
Sweetpotato matures within 3-4 months after which the root tubers become infested with
weevils. Maturity of the tubers is indicated by a slight yellowing or reddening of the
leaves, depending on the variety. Roots should be harvested as soon as they mature and
care taken so that tubers are not bruised during digging. Tubers should be handled with
care to avoid skinning and bruising. At harvest the following precautions should be taken;
a time when both the air and ground are dry should be selected, vine should be s removed
with a sharp hoe, vine cutter or any implement that will do the work rapidly and well
Harvest in the morning and allow the potatoes to lie out all day. Handle with great care, as
they are easily bruised, and every injury lessens their keeping qualities (Geo et al., 1925).
Roots are susceptible to rotting especially after damage due to mechanical injury or insect
infestation, as the wounds provide entry points for bacterial and fungal rots, and also
increase water loss. Sweetpotatoes should be cured before storing to heal wounds and
improve flavour. During the curing process starch is converted to sugar. Roots should be
cured immediately after harvest at 29 ± 1 °C (84 ± 2 °F), 90 to 97% RH for 4 to 7 days
(Kushman, 1975). During curing, ventilation is required to remove CO2 and replenish O2
because roots consume about 63 L metric ton-1
day-1
of O2 and release equivalent amounts
of CO2. Curing heals wounds from harvest and handling, helping reduce moisture loss
during storage and decrease the potential for microbial decay. In addition, curing facilitates
synthesis of enzymes operative in flavour development during cooking (Wang et al.,
1998).
Where artificial curing may not be necessary the tubers need to be stored at 13 o C – 16 0 C
immediately after harvesting. However, if roots are to be cured they are allowed to cure for
4-5 days under ambient conditions and then stored in underground pits lined with dry

33
materials (IITA, 1993). Sweetpotato is highly perishable once harvested unless processed.
Piece meal harvesting of this crop limit land use for other crops. After harvest, sweetpotato
roots can only be kept for a limited amount of time if not stored properly. Farmers
sometimes like to store sweetpotato for a better market price, but damage due to
sweetpotato weevil and root rot in stored roots may make storage counterproductive,
resulting in a lost opportunity to take advantage of the expected better price a few months
later (Degras, 2003).
[[
2.9 Effect of storage method on quality and nutritional composition of sweetpotato
root tubers
Despite nutritional importance of sweetpotato, the tubers have a short storage life,
generally, less than four weeks in the tropics. Their skin is easily damaged during harvest
and post-harvest handling leaving the crop highly perishable (IITA, 1996). Insect damage
of the leaves and root tuber on the field, dehydration and rotting of the tubers, high
moisture content leading to its high perishability, lack of storage skills which discourages
production, sprouting and chilling injury during low temperature storage are some of the
pre and post-harvest problems associated with sweetpotatoes cultivated in Nigeria (NSPRI,
2002). Cured sweetpotato can be stored for 4–7 months at 12.8–15.6°C and 85–90%
relative humidity. Non-cured sweetpotatoes do not store well and have a much shorter
shelf life.
Various traditional methods of sweetpotato storage such as heap storage, in-ground
storage, platform and pit storage methods have been practiced in Nigeria and across
African countries by farmers but the most common traditional method is the pit storage. Pit
storage of sweetpotatoes has been reported in Indonesia, Zimbabwe, and Malawi by

34
Woolfe (1992) and in Nigeria by Awojobi (2004). Pit storage can generally be considered
to be cheap for the rural communities since it requires minimum materials (Dandago and
Gungula, 2011). A study undertaken to investigate the effect of traditional storage practices
of small-scale organic farmers in rural KwaZulu–Natal on the quality of potatoes shows
that leaving potatoes in situ as a method of storage maintains desirable sensory properties
of potatoes by maintaining low sugar levels and higher starch content (Mutandwa and
Tafara, 2007).
Soil based technique involves digging of pits at a certain level of inclination (sloped areas).
This is done to facilitate the complete drainage of the pits which avoids accumulation of
moisture which would in turn lead to rotting or germination of root tubers (Mutandwa and
Tafara, 2007).
Tortoe et al., (2010), in an experiment to determine microbial deterioration of sweetpotato
root tubers stored in three different storage structures -traditional (cylindrical hole dug in
the dry ground and lined on the floor and walls with 20 kg of dry grass.), pit, and clamp (
consisted of a circular bed of dry grass, 20 cm thick, made on a 25 cm raised flat mound of
earth, surrounded by a concrete wall 30 cm above ground level.) storage structures for a
maximum of 28 days revealed that for the 7 days-cured sweetpotato root tubers, the bac-
teria population in the pit and clamp storage structures increased by 1.2-2.3 log cfu/g
whereas for the 14 days-cured root tubers, the bacteria population was 0.1-1.0 log cfu/g
within 28 days of storage. The fungal population in the 14 days-cured sweetpotato root
tubers was higher than in the 7 days-cured sweetpotato root tubers by 0.6-1.6 log cfu/g for
28 days of storage. For both the 7 and 14 days-cured sweetpotato root tubers, the
sweetpotato roo tuberts stored for 28 days in the three different storage structures had a
higher microbial count compared to the sweetpotato root tubers stored for 14 days. The

35
grass acted as an insulating material and ensured cool conditions in the pits (17oC, RH95-
100%).
Grass based technique involves the use of dry grass to create dry and cool conditions
within the storage area. This avoids the development of fungal diseases that normally
thrive under humid and warm conditions. Setiawati et al., (1994) reported that storage of
sweetpotato fresh root tubers in a room (with ordinary room temperature and air humidity)
for one month caused 15% root tuber damage. However, root tuber damage is lower if the
root tubers are covered with humid rice straw mulch, although the root tubers tend to
sprout.
Similarly, in a study conducted in Zimbabwe to assess the effectiveness of using soil, ash
and grass as means of preserving sweetpotato variety Mozambican White, the results
indicate that if quality of the stored crop and weight variation of root tubers is considered,
then use of soil banks is the most effective. However, weights of root tubers for ash and
grass were not statistically different from the soil treatment but some root tubers were
discoloured (Mutandwa and Tafara, 2007).
Ash based technique involves mixing ash powder with sweetpotatoes. The ash will act as
an absorbent to moisture and has a repelling effect on pests. Ash has alkaline properties,
which are not conducive to development of diseases (Mutandwa and Tafara, 2007).
Amoah et al., (2011), investigated into the storage performance of sweetpotato root tubers
in an evaporative cooling barn with three different pre-storage treatments - ash, brine and
Lantana camara extract to evaluate their effects on tuber weight loss, shrinkage, weevil
damage, sprouting and decay over 12 weeks duration. The control comprised root tubers
with no pre-treatment. Weight loss increased linearly from the inception of storage whilst

36
shrinkage became apparent only after 2 weeks and rose linearly. The root tubers were held
against weevil damage until the 6th week. Sprouting was initiated after 4 weeks of storage.
By the 12th week, the Lantana camara treatment yielded better results, recording overall
root wholesomeness of 76%, followed by the control (56%), the ash treatment (50%) and
the brine treatment (48%). The Lantana camara treatment also recorded the lowest weight
loss of 28%, lowest shrinkage of 3.8%, lowest severity of decay and sustained less weevil
damage at 47.5% compared with the other treatments. Sprouting was however, higher than
the other treatments. The brine and ash treatments performed poorest with the performance
indicators.
During storage, there are many changes that take place in the tissue micro structure of the
sweetpotato root tubers. The physiological and compositional changes that take place
include loss of moisture/water and modification of texture. During storage of sweetpotato
root tubers, starch is degraded into sugars by the action of endogenous amylase, thereby
affecting the micro structure of the sweetpotato root tubers. The extent of these amylase
moderated microstructural changes depend on temperature and water content. These
factors vary with storage time. High temperatures, in particular, are known to increase
respiration leading to lignification of the sweetpotato cell walls during storage. Orange-
fleshed sweetpotatoes {OFSP} (Ipomoea batatas (L.) Lam) contain high levelsof beta
carotene, an important provitamin A carotenoid. Stored sweetpotato root tubers undergo
many physiological changes that affect their beta carotene content and bioaccessibility as
well as the tissue micro structure. In a study conducted in Uganda to investigate the
changes in microstructure, beta carotene content and in vitro bioaccessibility of stored
OFSP root tuber shows that storage of OFSP root tubers using methods that maintain low
temperatures leads to higher retention of beta carotene (Tumuhimbise et al., 2010).

37
The post-harvest physiological processes that may affect storability include; respiration,
evaporation of water from the product, sprouting, changes in chemical composition,
diseases and damage by extreme temperatures. The relative importance of these processes
differs with the storage environment. In a research conducted in Uganda and Mozambique
to investigate into whether the substantial amount of vitamin A in orange sweetpotato is
retained during drying and subsequent storage showed that, drying the sweetpotato did not
greatly affect retention of vitamin A, but storage did. In fact, after four months of storage,
up to 70-80% of the vitamin A in the sweetpotato can be lost (Bechoff, 2011).
Storage can be prolonged if root tubers are placed for a period of time, under conditions
which promote the healing of wounds. The efficiency of wound healing may vary between
varieties Initial studies of four Kenyan varieties undertaken at NRI have also indicated
differences (Clark et al., 1989).
Under tropical conditions high temperatures are likely to result in high rates of respiration.
Increased rates of metabolic breakdown could result in increased levels of weight loss. The
evaporation of water is directly related to atmospheric water vapour pressure deficit.
Although the relative humidity in the tropics is frequently high, for uncovered root tubers
during marketing it can be sufficiently low to allow rapid water loss through the skin
surface. During marketing, the relative humidity to which root tubers are exposed can be
low, whereas during long-term storage much higher humidities are likely. The main forms
of deterioration will differ accordingly. The root tuber is primarily a starch storage organ,
with some sugars (mainly sucrose, glucose and fructose) and low levels of protein. The
main post-harvest physiological changes are associated with water loss, and carbohydrate
(starch and sugar) metabolism. The extent of water loss is expected to depend on the
properties of the periderm and the ability of the root tuber to heal wounds (Woolfe, 1992).

38
As the root tuber is a living organ, low levels of metabolism are necessary to maintain the
integrityof the cells. However high rates of metabolism can be detrimental to quality, by
changing the carbohydrate composition, or in the extreme case, by metabolizing so much
starch that air spacesform, and the texture of the root tuber becomes spongy. Most work on
the carbohydrate metabolism and respiration has been carried out on North American or
Japanese cultivars under the temperature regimes used in refrigerated stores (typically 13-
15°C) {Takahata et al., (1992) and Woolfe (1992)}. These have generally shown that sugar
levels increase during storage (Woolfe 1992). However, the metabolic rate is temperature
dependent, and the cultivars can vary significantly in their metabolic characteristics (Ahn
et al., 1980).
During longer term storage, sprouting of the root tuber can cause loss. Sprouting can be
controlled by sprout suppressants, but this is not economically feasible under most
situations in East Africa. Initial observations at NRI have indicated that East African
cultivars differ very markedly in their tendency to sprout during storage (Rees,
unpublished results).
Under certain conditions, notably at low oxygen levels, a switch to anaerobic respiration,
which involves the production of alcohol, and is detrimental to quality, can occur. For
example, the sweetpotato crop is particularly sensitive to low oxygen conditions that occur
during water logging. During storage in pits and clamps, oxygen levels can fall, and
anaerobic respiration can occur. An understanding of the control of the switch to anaerobic
respiration may enable the selection of varieties to minimise this problem (Tortoe et. al,
2010).

39
Root tubers are susceptible to rotting especially after damage due to mechanical injury or
insect infestation. Trials conducted in Tanzania have shown clear indications of varietal
differences in susceptibility to rots, but the basis of this difference has not been
investigated (Chilosa et al., 1995). More detailed studies have been carried out on North
American germplasm {Clark et al., (1989) and Clark (1992)} where resistance to rotting
has also been shown to exist within certain varieties. The root tuber possesses several
mechanisms of resistance to invading pathogens, including the formation of physical
barriers, as in the formation of wound periderm and hypersensitive cell death, and the
production of chemicals toxic to invading pathogens such as phytoalexins, proteinase
inhibitors and phenols. The relative importance of these mechanisms appears to vary
depending on variety and pathogen.
Among the more commonly encountered microorganisms causing storage rots are:
Lasiodiplodia theobromae (Java black rot); Ceratocystis fimbriata (black rot); Erwinia
chrysanthemi (bacterial soft rot); Fusarium oxysporum (surface rot); Fusarium solani (root
rot); Macrophomina phaseolina (charcoal rot); Monilochaetes infuscans (scurf); and
Rhizopus stolonifer (soft rot)). Timing of infection varies with the organism, field harvest
and storage conditions (Moyer, 1982).

40
CHAPTER THREE
3.0 MATERIALS AND METHODS
3.1 Introduction
Two experiments were carried out at the Multipurpose Crop Nursery at the College of
Agriculture Education, University of Education, Winneba, Mampong campus during the
minor and major rainy seasons, 2011/12 and 2012 respectively. In both growing seasons
sweetpotato root tubers were stored for three months after harvest using three storage
methods (pit, ash and grass).
3.2Experimental Site and Climatic Conditions
3.2.1 Experimental Site
Two field experiments (minor and major rainy seasons) were conducted both at the
Multipurpose Crop Nursery at the College of Agriculture Education, University of
Education, Winneba, Mampong Campus from September, 2011 to January, 2012 and
April to August, 2012 respectively.
Mampong - Ashanti (7° 8 N, 1° 24 W) is 457.5 m above sea level and is located in the
forest transitional agro ecological zone. The soil type is the savanna ochrosol formed from
the Voltaian sandstone of the Afram plains. Texturally, the soil is friable with a thin layer
of organic matter and is deep and brown-sandy loam and well-drained. It however has a
good water-holding capacity. The soil has been classified by FAO/UNESCO (1988) legend

41
as Chronic Luvisol and locally as the Bediesi series with a pH range of 4.0-6.5 and is good
for tuber, cereal, vegetable and legume crop production (Asiamah, 1988). The rainfall
pattern of the Mampong-Ashanti is bimodal. The area receives major rainfall between
March and July while the minor rainfall comes between August and October. The annual
rainfall ranges between 1270 mm and 1534 mm with the monthly being 91.2 mm. The
mean monthly temperature is between 25o C and 32o C (Ghana Meteorological Agency-
Mampong Ashanti, 2002).
3.2.2Climatic Conditions at the Experimental Sites
Differences in climatic factors (rainfall, temperature and relative humidity) were observed
between both cropping seasons (Tables 3.1; 3.2). The total monthly rainfall in the minor
seasonwas 429.8 mm and it occurred from September, 2011 to January, 2012 with the peak
in September and October. The mean monthly temperature of the area for the minor season
ranged between 23°Cto 31.9°C with the highest daily of 33.7° C occurring in January,
2012. The mean monthly relative humidity ranged from 54 to 93.4% with the peak
occurring between September and November. The bimodal rainfall pattern of Mampong-
Ashanti gave the area two seasons, the major season occurred between March and July and
the minor from September to November with one month drought spell in August (Ghana
Meteorological Agency – Mampong Ashanti, 2011).
In the major rainy season (2012), during experiment 2, the total monthly rainfall was
1,042.3 mm and it occurred from April to August, 2012 with the peak in May and July.
The mean monthly temperature of the site for the major season ranged between 22.5° C to
30.1° C, with the highest daily of 33.3° C occurring in April. The mean monthly relative
humidity ranged from 67.4 to 93.4% with the peak occurring between April and June.

42
Similarly, the bimodal rainfall pattern of Mampong-Ashanti gave the area two seasons, the
main season occurred between April and July for major season and the minor season from
September to November with one month dry spell in August (Ghana Meteorological
Agency – Mampong Ashanti, 2012).
3.3 Experimental Design and Treatments
In the field experiment, a 2 x 8 factorial arranged in randomized complete block design
with four replicates made up of seven organic manure and fertilizer rates and the control
(without any amendment) and two sweetpotato varieties (Okumkom and Apomuden) was
assigned to each block..
3.3.1 Treatments
There were sixteen treatment combinations (Table 3.3a and 3.3b)
3.4 Organic manure preparation
The broiler chicken manure used for the research project for each season was four months
old (20.0% moisture content) and was obtained from the poultry farm of the College of
Agriculture, University of Education, Winneba - Mampong campus and heaped under
shade for one month to dry and decompose before use. Sub-samples of the dried manure
were taken for nutrient analysis. The decomposed and dried chicken manure was applied
and worked into the soil two weeks before planting of vines.

43
Table 3.1: Climatic Data for 2011 Minor Rainy Season for Experiment One (1)
Month Total Rainfall(mm)
Mean RelativeHumidity (%)
06.00 h 15.00h
MeanTemperature (° C)
Min. Max.
September,2011
October
November
December
January, 2012
155.6
188.1
38.0
0.0
48.1
98 73
97 67
96 54
92 41
84 35
22.3 29.4
22.3 30.9
28.0 32.7
22.2 32.9
20.8 33.7Source: Ghana Meteorological Agency– Mampong Ashanti.
Table 3.2: Climatic Data for 2012 Major Rainy Season for Experiment Two (2)
Month Total Rainfall(mm)
Mean RelativeHumidity (%)
06.00 h 15.00h
Mean Temperature(° C)
Min. Max.
April
May
June
July
August
119.3
270.8
379.8
178.6
93.8
96 61
96 63
97 71
96 71
96 71
23.0 33.3
23.0 31.4
22.6 29.5
21.9 28.2
21.9 28.2
Source: Ghana Meteorological Agency – Mampong -Ashanti

44
Table 3.3a: Details of fertilization Treatments
Treatment Fertilization Treatments
T1
T2
T3
T4
T5
T6
T7
T8
T9
T10
T11
T12
T13
T14
T15
T16
Okumkom + 15-30-30 kg/haNPK+ 5t/ha CM
Okumkom + 15-23 23kg/ha NPK + 5t/ha CM
Okumkom + 15-15- 15kg/haNPK + 5t/ha CM
Okumkom + 30-60-60kg/haNPK + 5t/ha CM (Recommended)
Okumkom + 30-45-45kg/haNPK
Okumkom + 30-30-30kg/haNPK
Okumkom + 10t/ha CM
Okumkom + no fertilizer (Control)
Apomuden +15-30-30 kg/haNPK+ 5t/ha CM
Apomuden + 15-23 23 kg/ha NPK + 5t/ha CM
Apomuden +15-15- 15kg/haNPK + 5t/ha CM
Apomuden +30-60-60 kg/haNPK + 5t/ha CM (Recommended)
Apomuden +30-45-45 kg/ha NPK
Apomuden + 30-30-30 kg/haNPK
Apomuden + 10t/ha CM
Apomuden + no fertilizer (Control)

45
Table 3.3b: Treatment combinations
Treatments Inorganic Fertilizer (IF)
(NPK 15-15-15)
Triple Super Phosphate
(TSP)
Muriate of Potash
( MOP)
Chicken Manure
(CM)T1 100kg/ha 65kg/ha 24kg/ha 5t/ha
T2 100kg/ha 32.5kg/ha 12kg/ha 5t/ha
T3 100kg/ha - - 5t/ha
T4 200kg/ha 130kg/ha 48kg/ha -
T5 200kg/ha 65kg/ha 24kg/ha -
T6 200kg/ha - - --
T7 - - - 10t/ha
T8 - - - -
T9 100kg/ha 65kg/ha 24kg/ha 5t/ha
T10 100kg/ha 32.5kg/ha 12kg/ha 5t/ha
T11 100kg/ha - - 5t/ha
T12 200kg/ha 130kg/ha 48kg/ha -
T13 200kg/ha 65kg/ha 24kg/ha -
T14 200kg/ha - - -
T15 - - - 10t/ha-
T16 - - - -

46
3.5 Soil and Manure Sampling
After lining and pegging the experimental area was demarcated into plots and prior to
planting, soil and chicken manure were mixed thoroughly. Samples of the mixture of soil
and manure and no-manure soil (control) were randomly taken from Ap horizon at the
uniform depth of 0-20 cm from the Multipurpose Crop Nurseryat the College of Agriculture
Education, University of Education, Winneba, Mampong Campus.
3.6 Soil Physical and Chemical Analyses
Soil samples and soil plus chicken manure from the site were bulked, air-dried and sub-
samples were taken for analysis at the CSIR-Soil Research Institute, Fumesua near Kumasi.
The characteristics analyzed for included; Bulk density, soil texture, Soil pH, Organic
matter, Total Nitrogen, Exchangeable Calcium, Magnesium, Potassium, Sodium and
Effective Cation Exchange Capacity, and Bray N0.2 Extractable Phosphorus and Potassium.
The soil after air-drying was homogenized by passing it through 5 mm sieve. Soil texture
was determined by the Hydrometer method. Soil pH was measured on 1:1 (soil: distilled
water) and 1:2 (soil: 0.01m CaCl2) mixtures and measured on a pH meter (Pracitronic pH
meter) manufactured by Veb Pracitron in Dresden, Germany. The soil pH was taken for
manure plus soil mixtures and the control plots. Soil organic matter was determined by the
wet combustion method (Walkey and Black, 1934). Percentage total nitrogen was
determined by the micro Kjeldahl-technique ((AOAC, 1975). The available phosphorus was
extracted by the Bray method and determined colorimetrically (Bray and Kurtz 1945).
Potassium was determined by flame emission photometry (IITA, 1979). The exchangeable
cations calcium, magnesium, potassium and sodium were determined as recommended by

47
IITA (1979) using EDTA Titration after extraction with 0.1N Ammonium Acetate at pH 7.
Effective Cation Exchange Capacity (ECEC) was calculated as the sum of the exchangeable
bases and exchangeable acidity (IITA, 1979).
3.7 Land Preparation and Fertilization
Land clearing was immediately followed by ploughing and harrowing as there were no
stumps. The major weed at site was Cyperus spp and it was also controlled with 41%g
Glyphosate (Weedout) at the rate of 2.0 1/ha. The 3.0 m long x 4.0 m wide plots were laid
with four ridges per plot each measuring about 0.4m high. The ridges were manually
constructed with a hoe.
Chicken manure was applied and worked into the soil two weeks before planting of vines.
This was done to ensure complete decomposition of organic manure and to allow for total
nitrification to avoid the risk of ammonia toxicity. The NPK (15:15:15), Triple super
phosphate (TSP), and Muriate of potash (MoP) were applied two weeks after planting of
vines. This was applied 5 cm deep and 5 cm away from the vines. The inorganic fertilizers
were applied at this period because it will help the sweetpotato vines to get a good start as
plants can get access to nutrient early. Both inorganic (NPK, TSP, MoP) and organic
(Chicken manure) were applied at appropriate rates as per treatments.
3.8 Planting Materials and Planting
The sweetpotato varieties used for the experiments were 'Okumkom' ( a 120 – day maturing
improved variety) and ‘Apomuden’ ( also a 120 – day maturing improved variety) developed
by the Crop Research Institute of the Council for Scientific and Industrial Research (CSIR-

48
CRI), Kumasi. The tuber skin colour of ‘Okumkom’ is light purple while the tuber flesh is
white and it has a yield capacity of over 19 t/ha. The tuber skin colour of ‘Apomuden’ is light
orange while the tuber flesh is reddish (deep) orange and it has a yield capacity of over 29
t/ha.
Vine cuttings of length 0.3 m from topmost apical sections and other actively growing
sections were used for planting. All open leaves were detached from mature vines, each of
which was cut to 30 cm in length. The removal of leaves was done to reduce transpiration
and ensure good vine establishment. Two-thirds of each vine (with 4-5 nodes) was buried
into the soil (about 15-20 cm deep) at an angle leaving one-third above the soil at one vine
per hill/stand at a spacing of 1.0 m x 0.3 m. Each experimental plot contained four (4) rows
with eleven (11) plants within each row. There were eighteen (18) plants within the harvest
area (two central rows per plot). Planting of vines for the minor rainy season was done on the
20th September, 2011 and that of the major rainy season, was on the 19 May, 2012. Vines
for the major rainy season experiment were obtained from a multiplication nursery raised
during the dry season in the Multipurpose Crop Nursery, at the College of Agriculture
Education, University of Education,Winneba- Mampong campus. Each experimental plot
measured 4.0 m x 3.0 m with 1.0 m between plot and 2.0 m between blocks. The total field
size for each season was 64.0 m x 18.0 m (1152 m2).
3.9 Agronomic Practices
Weeds were controlled in both field experiments at 3 -4 weeks after planting of vines using
cutlass and hand hoeing method before close of the canopy and to reduce competition with
crops. Subsequent weed control was by hand pulling and reshaping of ridges.

49
During the minor rainy season field experiment, intermittent drought spell necessitated
supplementary irrigation from mid- October 2011 to harvesting in January, 2012.
The NPK (15:15:15), Triple super phosphate (TSP), and Muriate of potash (MoP) were
applied two (2) weeks after planting of vines. Both inorganic (NPK, TSP, MoP) and organic
(Chicken manure) were applied at appropriate rates as per treatments.
Incidence of pests and diseases was periodically monitored by visits to experimental sites to
check for such pests as sweetpotato weevil (Cylas spp) and sweetpotato butterfly (Acraea
aceratd) and diseases such as Sweetpotato Virus Disease (SPVD). Pests and diseases were
controlled by spraying sweetpotato plants with Polythrine 10 insecticide at the rate of 350 ml
per 15 litre Knapsack sprayer tank. This was done three times before harvesting for both
seasons.
3.10 Data Collection
3.10.1 Vegetative Data
The percentage crop establishment was measured at 4 weeks after planting (WAP). This was
achieved by counting the number of plants that sprouted and the percentage crop
establishment subsequently estimated.
The vegetative data taken were leaf number, number of branches, plant height, vine length,
vine diameter/girth, leaf chlorophyll content, vine fresh weight per plant, root fresh weight
per plant, dry matter accumulation and vine fresh weight at harvest. Five non-border plants
from each treatment plot were randomly sampled for leaf number, number of branches, plant

50
height, vine length, vine diameter. However, three plants were randomly sampled for leaf
chlorophyll content, vine and root fresh weight per plant and dry matter accumulation data
was collected at two weeks interval beginning from 4 weeks after planting (WAP). For vine
fresh weight at harvest, however, all eighteen plants from the two central rows for each
treatment plot were sampled.
The number of leaves per plant, number of branches, plant height, vine length and vine
diameter/girth were measured at 2 weeks interval from 4 WAP to 12 WAP. The leaf
chlorophyll content was measured at four weeks interval from 4 WAP to 16 WAP using a
Fieldscout CM 100 chlorophyll meter, Spectrum Technologies Inc.
Plants were also destructively sampled and weighed for vine fresh weight accumulation at 2
weeks interval from 4 WAP to 12 WAP using an electronic weighing scale. Mean values per
treatment were then estimated. After destructive sampling for vine and root fresh weight
gain, 200 g samples per plot were oven-dried at 72°C for 72 hours to remove all moisture.
Dried samples were then weighed using an electronic weighing scale and the mean dry
matter gain per treatment was subsequently estimated using the sample vine dry weight, the
sample vine fresh weight and the total fresh vine weight. This can be expressed
mathematically as follows:
Fresh vine weight= ( ) ( )Where: X (g) = total fresh vine weight
Y(g) = 200 g of fresh vine weight

51
Vine dry weight = ( ) ( )Where: X (g) = vine dry weight
Y (g) = 200 g of vine dry weight
The fresh vines of all the plants from the two central rows were sampled and the root tubers
were harvested and weighed using a weighing scale and the weight of root tubers at harvest
estimated in tonnes per hectare.
3.10.2 Yield and Yield Component Data
The number of marketable and unmarketable root tubers per plot, root tuber length, weight
per root tuber and total root tuber /yield was estimated from the two central rows. The
marketable and unmarketable root tubers diameters were classified as tuber diameter less
than (<) 3 cm -unmarketable and the tuber diameter greater than (>) 3 cm - marketable.
Diameters were measured from the middle portion of the tuber using vernier calipers.
The dry matter of root tuber (DM) was estimated from a sub sample of 200 g taken from the
tubers harvested from the two central rows. The 200 g sub samples were oven-dried for 48
hours at 80°C and the dry matter weight estimated using an electronic scale.

52
3.10.3 Market Quality of Tuber
The main parameters considered under market quality attributes of harvested tubers included
tuber cracks, tuber rot, sprouts in tubers, tuber split, misshapen root tubers and weevil
infestation. The tubers harvested from the eighteen plants of each plot were sorted into five
categories using the recommended scale below CRI (2003) under the Roots and Tubers
Improvement Programme (RTIP). None…(1) means 1% of the root tuber had symptoms of
Cylas infestation, slight ….(2) means 25% of the root tubers had symptoms of Cylas
infestation,Moderate .......(3) means 50 % of the root tubers had symptoms of Cylas
infestation,Severe..........(4) means 75 % of the root tubers had symptoms of Cylas
infestation and Very Severe ……(5) means almost 100 % of the root tubers had symptoms
of Cylas infestation
Each attribute was scored by relating the number of affected tubers to the total number of
tubers per treatment plot.
Rating Scale
i. None ............ 1
ii. Slight............2
iii. Moderate .......3
iv. Severe..........4
v. Very Severe ....5

53
3.10.4 Estimation of Harvest Index and Commercial Harvest Index
At harvest, the plants from the two central rows of each treatment plot were harvested and
separated into tubers and vegetative parts and their separate weights taken for estimation of
the harvest and commercial indexes. The harvest index was estimated as the ratio of the total
root tuber yield to the sum of the root tuber yield and vegetative biomass. Commercial
harvest index was also estimated as the ratio of the weight of the marketable root tubers
obtained earlier to the total root tuber yield (CRI, 2003).
3.11 Sensory Evaluation
3.11.1 Preparation of Tubers for Sensory evaluation and Analysis
The fresh sweetpotato tubers after harvest were washed and cooked separately based on the
treatment at a temperature of 1000 C for 30 minutes. They were boiled with 8.0 g of iodated
salt dissolved in 1000 ml of water. The cooked tubers were cut into cubes of size 2 cm x 2
cm x 2 cm, coded randomly and served to panelists for evaluation.
Six panelists consisting of three males and three females, aged between 25 and 43 years old
who had been selected and trained were used in the sensory evaluation. Cooked samples of
sweetpotato tubers for the two varieties were evaluated for their colour (surface and inner
flesh), flavour, taste, texture, palatability and overall acceptability. A 5- point (Appendix 21)
category scale was used for scoring and the results were subjected to statistical analysis.

54
3.12. Storage of Sweetpotato Root Tubers
Sweetpotato root tubers used for the storage experiment were obtained from the field
experiments during both growing seasons. The root tubers were harvested at four months
from the day of planting. After harvest, sweetpotato root tubers of 200-250 g were sorted to
remove physically, and pest or disease damaged tubers. The sorted root tubers were cured
naturally in the sun for three days by spreading them on the ground (25-30 0C, RH 80-
95%).The sweetpotatoes from each treatment were divided into three portions. For each
storage condition or method (pit, ash and grass) the root tubers were divided into sixteen
treatments, each containing seven tubers. The experimental design used was randomized
complete block design where the two varieties and fertilization constituted the treatments
and were each replicated three times. A simple random sampling technique was used to
select tubers from each treatment and replicate. The random sampling approach was to
ensure that the parameters under observation are taken from representative universe of units
from each replicate and treatment.
3.12.1 Storage Methods
The various storage methods were set up as follows:
3.12.1.1 Pit Storage Method
Storage in pit (50x 50x 50 cm) with alternate layers of grass and finally covered with soil. Pit
store was constructed (under a shade to prevent rain water from entering the storage pit) by
digging circular pit of 0.5 m diameter at the top, 0.5 m depth and 0.5 m wide at the base. The
size of the pit was chosen to suit local climatic conditions and is modification of traditional
pits. Pit was lined with dry plantain leaves before the sweetpotato tubers were stored in
them. Layers of tubers as per treatment were separated with about 1.0 kg dry spear grass

55
(Imperata cylindrica). The sweetpotatoes tubers were finally covered with dry spear grass
before covering them with approximately 2.0 kg of soil. The grass acted as an insulating
material and ensured cool condition in the pit (17O C, RH 95-100%).
3.12.1.2 Ash Storage Method
Storage in wood ash packed in a basket (50x 50x 70 cm) and tubers alternated with layers of
grass and finally covered with grass. A basket measuring 0.5 m at the base, 0.5 m high and
0.7 m wide at the top was lined with dry plantain leaves before tubers were stored in them.
Tubers as per treatment were thoroughly coated with wood ash by mixing them with two (2)
kg of wood ash and tubers were then alternated with 1.0 kg of dry spear grass The ash
acted as an absorbent to moisture and has a repelling effect on pests. Wood ash has alkaline
properties, which are not conducive to development of diseases.
3.12.1.3 Grass Storage Method
Tubers were stored in grass packed in a basket (50 x 50 x70 cm) with tubers alternating with
layers of grass and finally covered with a grass. A basket measuring 0.5 m at the base, 0.5 m
high and 0.7m wide at the top was lined with plantain leaves before tubers were placed in
them. Layers of tubers as per treatment were separated with about 1.0 kg dry spear grass
(Imperata cylindrica). The sweetpotatoes were then finally covered with dry spear grass at
the top.
In each basket and pit 112 tubers were placed and subjected to the experimental conditions.
These quantities of tubers were obtained from the field experiments after harvest. After
setting up the potato under the various storage methods it was monitored for three months
and data was collected every two weeks on.

56
Weight loss in sweetpotato (as a % of the total weight stored), Sprouting of sweetpotatoes
(%), Spoilage of sweetpotatoes (%), tuber shrinkage, pests and disease infested tubers were
the data collected. The freshly harvested sweetpotatoroot tubers were also analyzed for their
nutrient composition and the following data were collected: Sugar, Starch (predominant
carbohydrate in sweetpotatoes) and beta carotenoid.
At the expiration of the storage period the stored samples were carefully sorted and
observations recorded. Samples from each treatment were thereafter also analyzed for sugar,
starch, and Beta- carotenoid.
3.13 Procedure for Beta – Carotenoid Analysis
3.13.1 Sample collection
A total of forty eight (48) fresh sweetpotato root tubers comprising 24 orange- flesh
sweetpotatoes (OF) and 24 white-flesh sweetpotatoes with pink skin (WF) were obtained
from the field experiments after harvest.
3.13.2 Sample preparation
Three sweetpotato root tubers were randomly selected from each treatment at harvest. The
freshly harvested sweetpotato samples (from each variety and treatment) were washed with
clean water, packaged in aluminum foil, labeled and stored at -4°C. The samples were
shredded later with a plastic grater and made to pass through a 0.2 mm mesh, packaged in
well labeled test tubes and stored at - 30°C for subsequent β- carotene analysis using HPLC.
Precautionary measures such as exclusion of oxygen, and protection from light were taken to
prevent carotenoids losses. Similar sweetpotato sample preparation was carried out after

57
three months storage of tubers from each of the storage method for β- carotene analysis
using HPLC.
3.13.3 Chemicals and standard reagents used
All chemicals and beta-carotene standard were obtained from nutrition laboratory of the
Noguchi Memorial Institute for Medical Research (MMIMR) of the University of Ghana,
Legon-Accra, with the beta-carotenoid analysis also carried out in the same nutrition
laboratory. The water used for analytical work was double-distilled.
3.14 Carotenoids Analysis
The steps involved in the carotenoids analysis according to method described by Rodriguez-
Amaya (1999a) are outlined in the following chart below:
Flow diagram of carotenoids content determination
Qualification of carotenoids
Identification of carotenoids
Chromatography
Evaporation
Partition
Extraction

58
3.14.1 Carotenoid Extraction
The -4° C frozen and thawed samples were used for the beta-carotene analysis using HPLC.
Small amount (about 1.0 g) of the prepared sample was weighed using an electronic balance
(Sartorius, Analytic AC210s) into a mortar.Carotenoids were extracted by grinding about 1.0
g of each sample in a mortar using pestle for five (5) minutes with about 1/3 of the measured
cold acetone ( 20 ml) was poured into the mortar containing the sample. The residue was
filtered in Butcher funnel equipped with filter paper (Whatman # 2 filter paper, Maidstone,
England). The residue was returned to the mortar and the extraction was repeated using 20
ml of cold acetone until the residue was nearly colourless. Precautionary measures such as
exclusion of oxygen, protection from light and avoiding temperatures above 40 o C were
taken to prevent carotenoid losses during extraction and analysis.
3.14.2 Partition
Since the acetone used during the extraction is water-soluble, and also has damaging effect
on HPLC system, it was washed away as described by Rodriguez- Amaya (1999). The total
extract was gently and carefully transferred to a separating funnel (250 m) containing 20 ml
of petroleum spirit. Two distinct phases (lower and upper) were formed during the washing.
The water used for washing was allowed to flow along the wall of the separating funnel. The
lower acetone-aqueous phase was carefully discarded. Washing procedure continued for five
more times with 200 mls of distilled water at each time until the lower phase appeared
extremely clear, indicating complete removal of acetone from the extract. The final washing
was done carefully. The lower phase was gently and completely discarded as much as
possible without losing the upper phase (extract). The upper phase (petroleum-extract) was

59
collected over about 5.0 g anhydrous sodium sulphate (dry agent), to absorb residual water in
the extract. The separating funnel was rinsed thoroughly with petroleum spirit into a 50ml
eppendorf tube containing the extract. The final volume of the extract in the tube was noted
and recorded.
3.14.3 Evaporation of solvent
The petroleum spirit used during the partition was evaporated from the extract because of its
damaging effect on the HPLC equipment. Under normal circumstance, the whole volume of
the extract was supposed to be evaporated, but due to insufficiency of the nitrogen gas, 2mls
of the total volume of the extract was evaporated on rotary evaporator with nitrogen gas to
dryness. The evaporated extracts were used for the spectrophotometric analysis and injection
in the HPLC.
3.14.4 Chromatography
A rapid reversed-phase HPLC was used for the analysis of the carotenoids. The HPLC
system consisted of pressure pump (model: shimadzu LC-64), injector port, stationary
column, detector (model: shimadzu SPD-6AV) and recorder (model: shimadzu C-R6A
chromatopac). A mixture of acetonitrile/dichloromethane/methanol in the ratio 7:2:1 v/v/v
was used as the blank. The absorbance of the standard carotenoids was determined
spectrophotometrically at a wavelength of 450 mm. The HPLC system was calibrated using
the blank (mobile phase) and was washed thoroughly using the mobile phase ( a mixture of
acetonitrile/dichloromethane/methanol) in the ratio (7:2:1 v/v/v) for ten (10) minutes
Immediately before injection, the dried extracts in the test tubes were dissolved in a mixture
of methanol/dichloromethane (50%:50% v/v) and vortexed.. About 20 µl of the redissolved

60
extract was injected into the HPLC using a syringe. The extract was pumped at a rate of 1.5
ml/minute from the injector into the stationary column, where separation of the carotenoids
took place according to their polarity. The absorbance of the carotenoids was determined at a
wavelength of 450 mm. The results were recorded and printed by recorder as spectra. The
standard carotenoids and the extracts were injected separately in equal volumes into the
HPLC.
3.14.6 Identification of carotenoids
The different varieties of sweetpotatoes contained different arrays of carotenoids such as
lutein, β- carotene, lycopene etc. The identification of the carotenoids from the extract was
based on the elution (retention) time between the standard carotenoids and extracts.
3.14.7 Quantification of Carotenoids
Carotenoids, as other analytes in solution obey Beer-Lambert law which states that,
absorbance of carotenoids is directly proportional to the concentration.
The concentrations of the carotenoids in the extracts were calculated by comparing the
concentration and area under the peak of the standard carotenoids with the area under the
peak of the carotenoid in the extract. The calculations are shown in (Appendix 22).
3.15 Starch and Sugar Analyses
Three sweetpotato root tubers were randomly selected from each treatment at harvest. The
freshly harvested sweetpotato samples from (each treatment) were washed with clean water,
packaged in aluminum foil, labeled and stored at -4°C for starch and sugar analysis using

61
Abbe Refractometer, model, 98-440, Novex-Holland. Additionally, fresh sweetpotato root
tubers were randomly selected after three months storage from each of the storage method
for similar analysis.
The samples were shredded later with a plastic grater and made to pass through a 0.2 mm
mesh. 10.0 g of each sample was placed in a cheese cloth and a few drops of the sap squeeze
out and slowly onto the lens of the Refractometer and closed with the cover. The eye piece
was immediately focused to clearly see the graduation. The sugar content of each sample (in
Brix) was quickly recorded. This was repeated for the other treatments by using new cheese
cloth.
For the determination of starch, the refractive indices obtained from the samples were
compared to standard scale to obtain accurate values, thus the percentage mass of the starch
was read from a chart corresponding to the value of refractive index. Precautionary measures
such as cleaning of lens with soft damp cloth after every reading and allowing sap to rest on
the lens for at least 30 seconds before taking a reading were taken.
3.16 Estimation of Partial Budget
Partial budget analyses for both Apomuden and Okumkom varieties of sweetpotato grown in
the minor and major seasons using chicken manure and inorganic fertilizer combination
consisting of seven (7) organic manure and inorganic fertilizer rates and the control were
estimated. The adjusted yield, total gross benefit, variable cost (fertilizer, application and
transportation costs), total variable cost (TVC), net benefit (NB) and marginal rate of return
were also estimated. These can be expressed mathemathically as follows:

62
1. Adjusted yield( t/ha) = 85 % x yield obtained
2. Total Gross Benefit = Adjusted yield x farm gate price
3. Total variable cost= fertilizer cost + application cost + transportation cost
4. Net benefit = Total gross benefit – Total variable cost
5. Marginal rate of return (MRR) (%) =
3.17 Statistical Analyses
The data collected were analyzed using Analysis of Variance (ANOVA) The data obtained
were analyzed using the GenStat Release 9.2 ( PC/Windows XP) statistical package,
Copyright 2007, Lawes Agricultural Trust (Rothamsted Experimental Station) and the Least
Significant Difference (LSD) was used to separate the means at 5 % level of probability.
Δ net benefit x 100Δ total variable cost

63
CHAPTER FOUR
4.0 RESULTS
4.1Organic Manure, Soil and Soil Plus Manure Analysis
4.1.1 Manure Characteristics
Table 4.1 shows nutrient contents of 4-month old chicken manure from a deep litter system
which was used for Experiments 1 and 2. The organic carbon, organic matter, available
phosphorus and exchangeable Aluminium were relatively high although available potassium
and the exchangeable cations especially calcium and magnesium were low for Experiment 1
site. The acidity level of the chicken manure for experiment 1 site is (6.81) being almost
neutral but slightly alkaline (8.28) for Experiment 2 site. The wide difference that existed
between the chicken manure used for the two experiments is attributed to differences in
climatic conditions during litter production and storage after production and the time of use
of the organic manure.
4.1.2 Changes in Soil Nutrients Levels Due to Treatments
Initial effects of manure application on some soil physical and chemical properties at the
2011 experimental site are shown in Table 4.2. Both the untreated soil (no- manure) and
manure supplemented soils fell within the sandy loam textural range 10t/ha chicken manure
supplemented soil gave higher levels of organic matter, exchangeable Ca, Mg and effective
cation exchange capacity than the other manured soil and control. Both the untreated soil and

64
manured soil gave an acidic pH (5.44 and 5.77); however, 10t/ha chicken manure
supplemented soil gave a slightly acidic pH (6.45).
Table 4.3 shows the effect of manure application on soil chemical properties at 16 weeks
after planting. Organic carbon, total nitrogen, organic matter, available phosphorus and
potassium decreased while the soil pH and bulk density for all treatments increased.
Table 4.1: Chemical Properties of Chicken Manure used for the Minor and MajorGrowing Seasons (2011) and 2012) Respectively
Property
Value
Chicken Manure
(Experiment 1- 2011)
Chicken Manure
(Experiment 2-2012)Organic carbon (%)
Total nitrogen (%)
Organic matter (%)
Available P (ppm)
Available K (ppm)
PH (1:1 H2O)
Total Exchangeable Bases (TEB)
Exchangeable Aluminium (Al+H)
Effective Cation Exchange Capacity(E.C.E.C) Me/100g
Bases saturation (%)
Exchangeable CationsCa2+ (mg/100g)Mg2+(mg/100g)K+ (mg/100g)Na+ (mg/100g)
4.36
0.46
7.52
319.69
828.91
6.81
37.59
0.08
37.67
99.70
20.0314.952.050.56
13.42
2.35
23.14
439.29
74.40
8.28
0.05
29.99
29.99
99.83
11.487.487.883.10

65
Table 4.2: Physical and Chemical Properties of Soil and Soil Plus Manure Ap Horizonat 0-20 cm Depth Two Weeks after Planting (2 WAP) for Experiment 1- (2011)
Property
Value
UntreatedSoil
(Control)Inorganic
Fertilizer + Soil
10t/HaChicken
Manure + Soil
5t/Ha ChickenManure +Inorganic
Fertilizer +SoilSand (%)
Silt (%)
Clay (%)
Organic carbon (%)
Total nitrogen (%)
Organic matter (%)
pH (1:1 H2O)
Available P (ppm)
Available K (ppm)
Bulk density (g/cm3)
Exchangeable cationsCa2+ (mg/100g)Mg2+(mg/100g)K+ (mg/100g)Na+ (mg/100g)
Total Exchangeablebases
Effective CationExchange Capacity(E.C.E.C) Me/100g
ExchangeableAluminium (Al+H)
66.49
27.51
6.00
1.06
0.13
1.83
5.44
38.02
73.65
1.49
2.492.940.350.13
5.91
7.11
0.75
68.78
27.22
4.00
1.07
0.14
1.84
5.44
1018.78
503.78
1.51
2.972.941.340.13
7.38
8.13
0.15
66.86
25.14
8.00
1.26
0.17
2.17
6.45
334.04
113.83
1.67
12.806.740.480.17
20.19
20.34
0.15
65.93
26.07
8.00
1.14
0.15
1.97
5.77
436.10
177.44
1.51
6.142.140.670.18
9.13
9.58
0.45

66
Bases Saturation (%) 89.40 90.70 99.26 95.30Table 4.3: Physical and Chemical Properties of Soil and Soil Plus Manure Ap Horizon at 0-20cm Depth Sixteen Weeks after Planting (16 WAP) for Experiment 1 (2011)
Property
Value
UntreatedSoil
(Control)
InorganicFertilizer +
Soil
10t/HaChicken
Manure + Soil
5t/Ha ChickenManure +Inorganic
Fertilizer +SoilSand (%)
Silt (%)
Clay (%)
Organic carbon (%)
Total nitrogen (%)
Organic matter (%)
pH (1:1 H2O)
Available P (ppm)
Available P (ppm)
Bulk density (g/cm3)
Exchangeable cationsCa2+ (mg/100g)Mg2+(mg/100g)K+ (mg/100g)Na+ (mg/100g)
Total exch. bases
Effective cationExchange Capacity(E.C.E.C) Me/100g
ExchangeableAluminium (Al+H)
Bases saturation (%)
67.34
27.00
5.66
0.98
0.07
1.69
5.69
33.48
100.43
1.48
4.140.930.380.13
5.58
6.18
0.60
90.30
68.55
27.15
4.30
0.71
0.02
1.22
5.61
11.56
130.56
1.50
4.011.870.450.12
6.45
7.25
0.80
89.00
67.00
26.20
6.80
0.84
0.11
1.45
6.60
13.47
93.74
1.58
3.471.340.340.14
5.29
5.89
0.60
89.80
66.50
27.00
6.50
0.74
0.13
1.28
5.88
11.08
113.82
1.52
4.271.340.410.21
6.23
6.64
0.50
92.47

67
4.1.3 Changes in Soil Nutrient Levels Due to Treatment for Experiment 2 During
the Major Growing Season in 2012
Soil nutrient analysis at depth 0-20 cm at both sites was carried out and the results are
presented in Tables 4.5, 4.6. The soil and manure supplemented soil for both initial and final
analyses fell within the sandy loam textural range. The soil analyses for both initial and final
showed that pH was neutral for the top soil. The soil supplemented with inorganic fertilizer
was acidic at the initial manure application but slightly acidic at 16 weeks after planting. The
other manure treated soils were slightly acidic at both initial and final soil nutrient analyses.
Organic matter content was low to moderate and the total nitrogen levels were moderate at
two to 16 weeks after planting. Exchangeable calcium and magnesium levels were low to
moderate at the initial soil nutrient analysis. However, exchangeable calcium levels were
moderate at 16 weeks after planting.
4.2 Growth Performance of Two Sweetpotato Varieties as Influenced by Chicken
Manure and Inorganic Fertilizer
4.2.1 Percentage Crop Establishment
The percentage crop establishment as influenced by chicken manure and inorganic fertilizer
is presented in Table 4.7. During the minor season (2011), there was a significant difference
between Apomuden and Okumkom in percentage crop establishment (Appendix 1).
Apomuden grown on the control plot had the highest percentage crop establishment (78.8 %)
and differed significantly from 15-30-30 kg/ha NPK+5t/ha CM plot which recorded the
lowest mean (59.2% ) at 4 WAP. However, Okumkom grown on 30-30-30 kg/ha NPK plot
had the highest percentage crop establishment (70.9 %) followed by 15-30-30 kg/ha
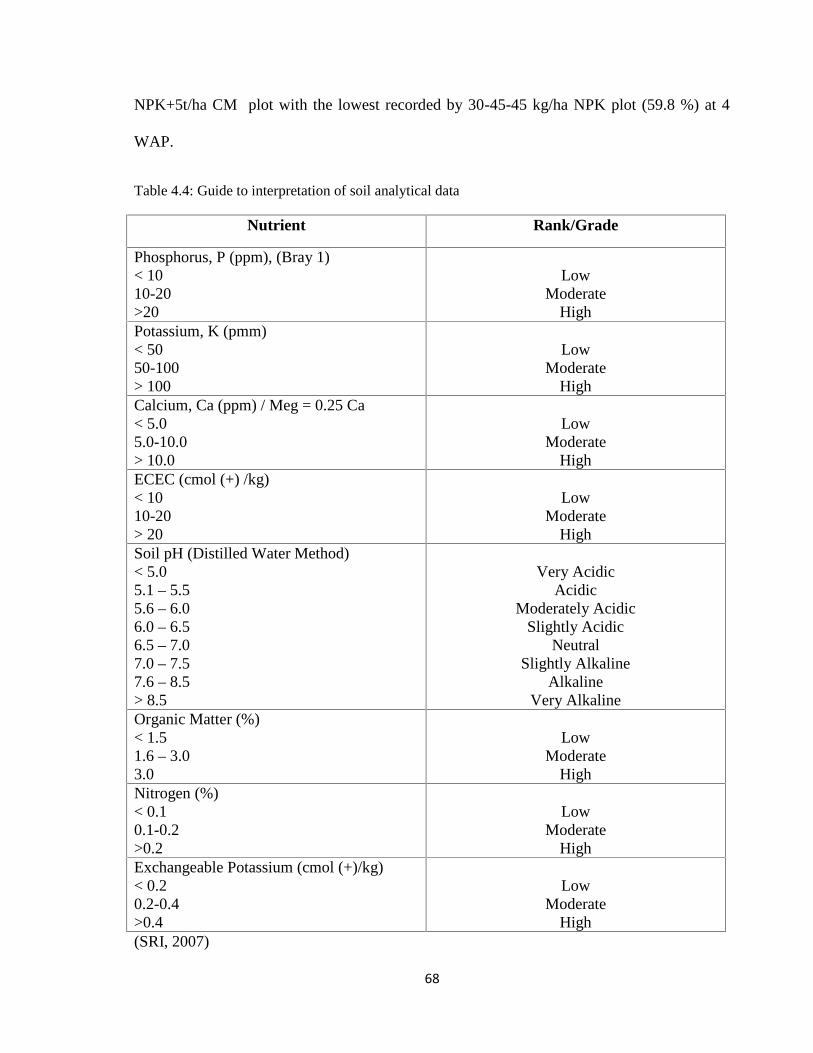
68
NPK+5t/ha CM plot with the lowest recorded by 30-45-45 kg/ha NPK plot (59.8 %) at 4
WAP.
Table 4.4: Guide to interpretation of soil analytical data
Nutrient Rank/Grade
Phosphorus, P (ppm), (Bray 1)< 1010-20>20
LowModerate
HighPotassium, K (pmm)< 5050-100> 100
LowModerate
HighCalcium, Ca (ppm) / Meg = 0.25 Ca< 5.05.0-10.0> 10.0
LowModerate
HighECEC (cmol (+) /kg)< 1010-20> 20
LowModerate
HighSoil pH (Distilled Water Method)< 5.05.1 – 5.55.6 – 6.06.0 – 6.56.5 – 7.07.0 – 7.57.6 – 8.5> 8.5
Very AcidicAcidic
Moderately AcidicSlightly Acidic
NeutralSlightly Alkaline
AlkalineVery Alkaline
Organic Matter (%)< 1.51.6 – 3.03.0
LowModerate
HighNitrogen (%)< 0.10.1-0.2>0.2
LowModerate
HighExchangeable Potassium (cmol (+)/kg)< 0.20.2-0.4>0.4
LowModerate
High(SRI, 2007)

69
Table 4.5: Physical and Chemical Properties of Soil and Soil Plus Manure Ap Horizon at 0-20 cmDepth Two Weeks after Planting for Experiment 2 – (2012)
Property
Value
UntreatedSoil
(Control)
InorganicFertilizer +
Soil10t/ha ChickenManure + Soil
5t/ha ChickenManure +
Inorganic Fertilizer+Soil
Sand (%)
Silt (%)
Clay (%)
Organic carbon (%)
Total nitrogen (%)
Organic matter (%)
pH (1:1 H2O)
Available P (ppm)
Available K(ppm)
Bulk density (g/cm3)
Exchangeable cationsCa(mg/100g)MgKNa
Total Exchangeablebases
Effective cationExchange Capacity(E.C.E.C) Me/100g
ExchangeableAluminium (Al+H)
Bases saturation (%)
75.80
15.20
9.00
1.21
0.13
2.09
6.73
153.87
43.96
1.51
5.342.670.500.17
8.68
8.78
8.68
98.86
59.90
31.30
8.80
1.00
0.21
1.72
5.42
439.29
74.40
1.49
3.472.670.660.22
7.02
7.82
7.02
89.77
70.80
22.00
7.20
0.92
0.32
1.59
6.19
285.42
71.01
1.49
4.540.800.620.21
6.17
6.27
6.17
98.41
66.90
26.60
6.50
1.07
0.16
1.85
6.02
692.82
87.92
1.49
5.070.530.800.25
6.65
7.45
6.65
89.26

70
Table 4.6: Physical and Chemical Properties of Soil and Soil Plus Manure Ap Horizon at 0-20 cmDepth Sixteen Weeks after Planting for Experiment 2 – (2012)
Property
Value
UntreatedSoil
(Control)
InorganicFertilizer +
Soil
10t/haChicken
Manure + Soil
5t/ha ChickenManure +
Inorganic Fertilizer+Soil
Sand (%)
Silt (%)
Clay (%)
Organic carbon (%)
Total nitrogen (%)
Organic matter (%)
pH (1:1 H2O)
Available P (ppm)
Available K (ppm)
Bulk density (g/cm3)
Exchange cationsCa2+ (mg/100g)Mg2+(mg/100g)K+ (mg/100g)Na+ (mg/100g)
Total Exch. bases
Effective cationExchange Capacity(E.C.E.C) Me/100g
Exch. Al. (Al+H)
Bases saturation (%)
74.64
15.36
10.00
0.57
0.05
0.98
6.72
76.40
115.68
1.47
4.545.670.300.11
10.62
11.75
0.10
99.19
59.80
32.20
8.00
1.11
0.10
1.91
6.45
59.86
97.58
1.44
6.700.800.250.08
7.83
10.54
0.10
89.05
72.54
21.46
6.00
0.47
0.04
0.81
6.49
71.00
133.12
1.44
5.340.530.340.14
6.35
6.41
0.10
98.44
67.58
26.46
6.00
0.68
0.06
1.17
6.33
55.10
126.05
1.44
5.610.530.320.12
6.58
6.68
0.10
98.50

71
In the major season (2012), chicken manure and inorganic fertilizer applied either singly or
in combination did not significantly influence crop establishment for the two cultivars. In
both seasonsOkumkom grown on amended plots during the major season produced
substantially higher percentage crop establishment than in the minor season. Crop
establishment ranged from (53.5- 85.5%) in both seasons (Table 4.7).
Table 4.7: Percentage crop establishment during 2011 minor season and 2012 major
season
Variety
Percentage CropEstablishment (%)
(minor season)Mean
Percentage CropEstablishment (%)
(major season)Apomud Okumk. Apomud Okumk Mean
Fertilizer RatesNo fertilizer (Control)
10t/ha CM
30-30-30 kg/ha NPK
15-15-15 kg/ha NPK + 5t/ha CM
30-45-45 kg/ha NPK
15-23-23 kg/ha NPK + 5t/ha CM
30-60-60 kg/ha NPK
15-30-30 kg/ha NPK + 5t/ha CM
78.8
66.1
72.9
75.2
71.3
71.3
66.9
59.2
69.2
60.6
70.9
63.7
59.8
68.7
64.5
70.6
74.0
63.3
71.9
69.5
65.5
70.0
65.7
64.9
80.6
53.5
53.5
73.9
85.5
76.1
75.0
63.5
72.6
75.5
61.1
63.2
61.1
69.6
71.5
75.5
76.6
64.5
57.3
68.6
73.3
72.8
73.3
69.5
Mean 70.2 66.0 70.2 68.8
LSD (P =0.05) ; Variety 7.7 NS
Fertilizer 15.4 NS
Variety x Fertilizer 21.8 NS

72
4.2.2 Number of Leaves per Plant
The result on number of leaves per plant as influenced by chicken manure and inorganic
fertilizer is presented in Figure 4.1. During the minor season (2011), Okumkom under
amendment and control differed significantly from Apomuden in number of leavesper plant
for the enrire growing period. Apomden grown on amended plots did not differ significantly
in number of leaves per plant from the control from 4 to 10 WAP. Apomuden grown on 15-
15-15 kg/ha NPK + 5t/ha CM plot differed significantly from other amended and the control
plots at 12 WAP. The least (160) number of leaves per plant was recorded by 10t/ha CM at
12 WAP. Okumkom grown on amended plots did not differ significantly in number of leaves
per plant from the control from 4 to 10 WAP.The highest (542) number of leaves was
recorded by Okumkom grown on 15-30-30 kg/ha NPK+ 5t/ha CM and differed significantly
from other amended and the control plots at 12 WAP. The least (400) number of leavesper
plant was recorded by 10t/ha CM at 12 WAP (Fig. 4.1).
In the major season (2012), Okumkom under amendment differed significantly from
Apomuden in number of leavesper plant for the enrire growing period. Apomden grown on
amended and the control plots did not differ significantly in number of leaves per plant from
4 to 10 WAP. Apomuden grown on 10t/ha CM differed significantly in number of leaves per
plant ffrom other amended and the control plots at 12 WAP. The least was recorded by 30-
30-30 kg/ha NPK at 12 WAP.Okimkom grown on amended and the control plots did not
differ significantly in number of leaves per plant from 4 to 10 WAP. The highest (463)
number of leaves per plant was recorded by Okumkom grown on 30-45-45 kg/ha NPK and
differed significantly from other amended and the control plots at 12 WAP. The least (409)
number of leaves per plant was recorded by 15-23-23 kg/ha NPK + 5t/ha CM at 12 WAP.

73
Generally, Apomuden and Okumkom grown on 10t/ha CM produced the lowest number of
leaves per plant in the minor season than in the major season at 12 WAP (Fig. 4.1).
4.2.3 Number of Branches
The result on number of branches as influenced by chicken manure and inorganic fertilizer is
presented in Figure 4. 2. During the minor season (2011), Apomuden grown on amended
plots did not differ significantly in number of branches per plant from the control from 4 to 8
WAP. Apomuden grown on 30-45-45 kg/ha NPK differed significantly in number of
branches per plant from other amended and the control plots from 10 to 12 WAP. Apomuden
grown on 10t/ha CM had the lowest (9.0) number of branches at 12 WAP. Okumkom grown
on amended plots did not differ significantly in number of branches per plant from the
control from 4 to 8 WAP. Okumkom grown on 15-30-30 kg/ha NPK + 5t/ha CM had
significantly higher (42.0) number of branches per plant at 10WAP. Application of 30-45-45
kg/ha NPK to Okumkom which had the highest number of branches per plant (50.0) differed
significantly from othe amended and the control plots at 12 WAP. . The lowest (26.0)
number of branches per plant was recorded by 10t/haCM at 12 WAP (Fig 4.2).
In the major season (2012), Okumkom grown on amended and the control plot had
significantly higher number of vine branches than Apomuden. Apomuden grown on
amended plots did not differ significantly in number of branches per plant from the control
from 4 to 12 WAP. Okumkom grown on amended plot did not differ significantly in number
of branches per plant from the control from 4 to 8 WAP. Okumkom grown on 15-30-30
kg/ha NPK+ 5 t/ha CM differed significantly from other amended plots and the control from
10 tol 12 WAP. The control plot had the least number of branches from at 12 WAP (Fig 4.2).

74
4.2.4 Vine Diameter
The results of vine diameter as influenced by chicken manure and inorganic fertilizer are
presented in Fig. 4.3. During the minor season (2011), Apomuden grown on amended plots
did not show any significant difference from the control from 4 to 10 WAP. . Application of
15-30-30 kg/ha NPK + 5t/ha CM to Apomuden had the highest vine diameter (1.14 cm) and
differed significantly from other amended and the control plots at 12 WAP. The lowest (0.62
cm) was recorded by 10t/ha CM plot at 12 WAP (Fig 4.3). Okumkom grown on amended
plots gave substantially high vine diameter than the control plot over the period except
10t/ha CM which had the lowest mean (0.89) at 12 WAP. 30 -45-45 kg/ha NPK plot had the
highest vine diameter from 8 to 12 WAP.
In the major season (2012), application of amended and unamended plots to Apomuden and
Okumkom did not show significant difference between the treatments over the period. In
both seasons Apomuden grown on chicken manure in combination with inorganic fertilizer
(15-15-15 kg/ha NPK + 5t/ha CM and 15-30-30 kg/ha NPK+5t/ha CM) produced the highest
vine diameter at 12 WAP.Okumkom grown on inorganic fertilizer alone (30-45-45 kg/ha
NPK and 30-30-30 kg/ha NPK) in 2011 and 2012 growing seasons respectively had the
highest vine diameter at 12 WAP. However, the two sweetpotato varieties (Apomuden and
Okumkom) grown on amended and unamended plots during the major season in 2012
produced substantially higher vine diameter than when grown on the same treatments during
the minor season (Fig 4.3).

75
4.2.5 Vine Length
Vine length as influenced by chicken manure and inorganic fertilizer is presented in figure 4.
4. In 2011, during the minor season application of amendment to Apomuden did not differ
significantly from the control in vine length from 4 to 6 WAP. However,application of
10t/ha CM to Apomuden recorded the lowest vine length among the amended treatments
over the period except at 10 WAP. Apllication of 15-23-23 kg/ha NPK + 5t/ha CM. to
Apomuden which had the highest (104.5 cm) vine length differed significantly from other
amended and the control plots at 8 WAP. Apomuden grown onamended plots did not differ
significantly from the control in vine length from 10 to 12 WAP. Okumkom grown on
amended plots did not differ significantly from the control plot in vine length over the entire
period (Fig 4.4).
In the major season (2012), application of amendment to Apomuden did not differ
significantly from the control in vine length at 4 WAP. Apomuden grown on15-23- 23kg/ha
NPK+ 5 t/ha CM plot differed significantly from the other amended and the control plots at 6
WAP and from 10t/haCM which had the highest vine length (147.2 cm) at 8 WAP.
Apomuden grown on 15-30- 30kg/ha NPK+ 5 t/ha CM plot had the highest vine length
(164.8 cm) and differed significantly from the other amended and the control plots at 12
WAP. The 30-30-30 kg/ha NPK treated plant recorded the lowest vine length at 12
WAP.Application of amendment to Okumkom did not differ significantly from the control in
vine length from 4 to 10 WAP. Okumkom grown on 30-30-30 kg/ha NPK plot had the
highest vine length (183.5 cm) and differed significantly from the other amended and the
control plots at 12 WAP. The lowest (130.1 cm) vine length was recorded by the control at

76
12 WAP. In both seasons Okumkom grown on amended plots produced substantially higher
vine length over Apomuden on the same treatments at 12 WAP (Fig. 4.4).
[[[[
4.2.6 Chlorophyll Content of Leaves
The chlorophyll content of leaves as influenced by chicken manure and inorganic fertilizer is
presented in Figure 4.5. During the 2011 minor season, application of amendment to
Apomuden did not differ significantly from the control in chlorophyll content of leaves from
4 to 12 WAP.Apomuden under 15-23-23 kg/ha NPK + 5t//haCM which had the highest (721
spad) chlorophyll content of leaves differed significantly from the other amended plots and
the control at 16 WAP. The lowest (615 spad) was recorded by 15 30-30 kg/ha NPK +
5t//haCM at 16 WAP There was however, a substantial reduction of chlorophyll content of
leaves at 16 WAP in all the treatments(Fig.4.5). Application of amendment to Okumkom did
not differ significantly from the control in chlorophyll content of leaves from 4 to 16 WAP.
The Apomuden variety showed significant difference response of leaf chlorophyll content to
the different amendments from Okumkom (Fig.4.5).
In the major season (2012), application of amendment to Apomuden did not differ
significantly from the control in chlorophyll content of leaves at 4 WAP Apomuden grown
on 30-45-45 kg/ha NPK differed significantlyin chlorophyll content of leaves from the other
amended and the control plots at 8 WAP and from 10t/ha CM at 10 WAP. Apomuden grown
on 15-23-23 kg/ha NPK+ 5t/ha CM plot had the highest chlorophyll content of leaves (639.0
spad) and differed significantly from the other amended and the control plots at 16 WAP.

77
Fig. 4.1 Leaf numbers for 2011 minor season and 2012 major season
0
100
200
300
400
500
600
0 4 6 8 10 12
Num
ber
of le
aves
per
pla
nt
Weeks after planting
(a) Apomuden, minor season
No fertilizerChicken manure (10t/ha)NPK 30-30-30NPK 15-15-15 + 5t/ha Chicken manureNPK 30-45-45NPK 15-23-23 + 5t/ha Chicken manureNPK 30-60-60NPK 15-30-30 + 5t/ha Chicken manure
0
200
400
600
0 4 6 8 10 12
Num
ber
of le
aves
per
pla
nt
Weeks after planting
(b) Okumkom. minor season
No fertilizerChicken manure (10t/ha)NPK 30-30-30NPK 15-15-15 + 5t/ha Chicken manureNPK 30-45-45NPK 15-23-23 + 5t/ha Chicken manureNPK 30-60-60NPK 15-30-30 + 5t/ha Chicken manure
0100200300400500600
0 4 6 8 10 12
Num
ber
of le
aves
per
pla
nt
Weeks after planting
(c) Apomuden, major season
No fertilizerChicken manure (10t/ha)NPK 30-30-30NPK 15-15-15 + 5t/ha Chicken manureNPK 30-45-45NPK 15-23-23 + 5t/ha Chicken manureNPK 30-60-60NPK 15-30-30 + 5t/ha Chicken manure
0100200300400500600
0 4 6 8 10 12
Num
ber o
f lea
ves p
lant
Weeks after planting
(d) Okumkom, major season
No fertilizerChicken manure (10t/ha)NPK 30-30-30NPK 15-15-15 + 5t/ha Chicken manureNPK 30-45-45NPK 15-23-23 + 5t/ha Chicken manureNPK 30-60-60NPK 15-30-30 + 5t/ha Chicken manure

78
Fig. 4.2 Number of branches during 2011 minor season and 2012 major season
0
20
40
60
80
0 4 6 8 10 12
Num
ber o
f bra
nche
s
Weeks after planting
(a) Apomuden, minor season
No fertilizerChicken manure (10t/ha)NPK 30-30-30NPK 15-15-15 + 5t/ha Chicken manureNPK 30-45-45NPK 15-23-23 + 5t/ha Chicken manureNPK 30-60-60
0
10
20
30
40
50
60
70
80
0 4 6 8 10 12
Num
ber o
f bra
nche
s
Weeks after planting
(b) Okumkom, minor season
No fertilizerChicken manure (10t/ha)NPK 30-30-30NPK 15-15-15 + 5t/ha Chicken manureNPK 30-45-45NPK 15-23-23 + 5t/ha Chicken manureNPK 30-60-60
0
10
20
30
40
50
60
0 4 6 8 10 12
Num
ber
of b
ranc
hes
Weeks after planting
(c) Apomuden, major season
No fertilizerChicken manure (10t/ha)NPK 30-30-30NPK 15-15-15 + 5t/ha Chicken manureNPK 30-45-45NPK 15-23-23 + 5t/ha Chicken manureNPK 30-60-60
0
10
20
30
40
50
60
0 4 6 8 10 12Num
ber
of b
ranc
hes
Weeks after planting
(d) Okumkom, major season
No fertilizerChicken manure (10t/ha)NPK 30-30-30NPK 15-15-15 + 5t/ha Chicken manureNPK 30-45-45NPK 15-23-23 + 5t/ha Chicken manureNPK 30-60-60

79
Fig. 4.3 Vine diameter during 2011 minor season and 2012 major season
0
0.5
1
1.5
2
0 4 6 8 10 12
Vin
e di
amet
er (c
m)
Weeks after planting
(a) Apomuden, minorseason
No fertilizerChicken manure (10t/ha)NPK 30-30-30NPK 15-15-15 + 5t/ha Chicken manureNPK 30-45-45NPK 15-23-23 + 5t/ha Chicken manureNPK 30-60-60NPK 15-30-30 + 5t/ha Chicken manure
0
0.5
1
1.5
2
0 4 6 8 10 12
Vin
e di
amet
er (c
m)
Weeks after planting
(b) Okumkom, minor season
No fertilizerChicken manure (10t/ha)NPK 30-30-30NPK 15-15-15 + 5t/ha Chicken manureNPK 30-45-45NPK 15-23-23 + 5t/ha Chicken manureNPK 30-60-60NPK 15-30-30 + 5t/ha Chicken manure
0
1
2
0 4 6 8 10 12
Vin
e di
amet
er (c
m)
Weeks after planting
(c) Apomuden, majorseason
No fertilizerChicken manure (10t/ha)NPK 30-30-30NPK 15-15-15 + 5t/ha Chicken manureNPK 30-45-45NPK 15-23-23 + 5t/ha Chicken manureNPK 30-60-60NPK 15-30-30 + 5t/ha Chicken manure
0
0.5
1
1.5
2
0 4 6 8 10 12
Vin
e di
amet
er (c
m)
Weeks after planting
(d) Okumkom, major season
No fertilizerChicken manure (10t/ha)NPK 30-30-30NPK 15-15-15 + 5t/ha Chicken manureNPK 30-45-45NPK 15-23-23 + 5t/ha Chicken manureNPK 30-60-60NPK 15-30-30 + 5t/ha Chicken manure

80
Fig. 4.4 Vine length during 2011 minor season and 2012 major season
-150
50
250
0 4 6 8 10 12
Vin
e le
ngth
(cm
)
Weeks after planting
(a) Apomuden, minor season
No fertilizerChicken manure (10t/ha)NPK 30-30-30NPK 15-15-15 + 5t/ha Chicken manureNPK 30-45-45NPK 15-23-23 + 5t/ha Chicken manureNPK 30-60-60NPK 15-30-30 + 5t/ha Chicken manure
-150
50
250
0 4 6 8 10 12
Vin
e le
ngth
(cm
)
Weeks after planting
(b) Okumkom, minor season
No fertilizerChicken manure (10t/ha)NPK 30-30-30NPK 15-15-15 + 5t/ha Chicken manureNPK 30-45-45NPK 15-23-23 + 5t/ha Chicken manureNPK 30-60-60NPK 15-30-30 + 5t/ha Chicken manure
0
50
100
150
200
250
0 4 6 8 10 12
Vin
e le
ngth
(cm
)
Weeks after planting
(c) Apomuden, major season
No fertilizerChicken manure (10t/ha)NPK 30-30-30NPK 15-15-15 + 5t/ha Chicken manureNPK 30-45-45NPK 15-23-23 + 5t/ha Chicken manureNPK 30-60-60NPK 15-30-30 + 5t/ha Chicken manure
0
50
100
150
200
250
0 4 6 8 10 12
Vin
e le
ngth
(cm
)
Weeks after planting
(d) Okumkom, major season
No fertilizerChicken manure (10t/ha)NPK 30-30-30NPK 15-15-15 + 5t/ha Chicken manureNPK 30-45-45NPK 15-23-23 + 5t/ha Chicken manureNPK 30-60-60NPK 15-30-30 + 5t/ha Chicken manure

81
The least (426.0 spad) chlorophyll content of leaves was recorded by 30-30-30kg/ha NPK
at 16 WAP (Fig.4.5). Application of amendment to Okumkom did not differ significantly
from the control in chlorophyll content of leaves at 4 WAP. Okumkom under amendment
differed significantly from the control from 8 to 12 WAP. However, Okumkom grown on
amended and the control plots did not differ significantly in chlorophyll content of leaves
at 16 WAP. There was a substantial reduction in chlorophyll content of leaves for all
treatments at 16 WAP (Fig.4.5).
In both seasons Apomuden grown on 15-23-23 kg/ha NPK+5t/ha CM plot had the highest
chlorophyll content of leaves at 16 WAP. For both varieties leaf chlorophyll content was
higher during the minor season (2011) than during the major season (2012) for all
treatments (Fig .4.5).
4.2.7 Root Fresh Weight per plant
The results of root fresh weight per plant as influenced by chicken manure and inorganic
fertilizer are presented in Figure 4.6. During the minor season (2011), Apomuden grown
on amended plots did not differ significantly from the control in root fresh weight per plant
from 4 to 10 WAP. Application of 15-15 kg/ha NPK+5t/ha CM to Apomuden differed
significantly from the other amended and the control plots in root fresh weight per plant at
12 WAP. The lowest (364 g) was recorded by 30-45-45 kg/ha NPK plot. Okumkom grown
on amended plots did not differ significantly from the control in root fresh weight per plant
from 4 to 8 WAP. Application of 15-23-23 kg/ha NPK+5t/ha CM differed significantly
from other amended plots and the controlin root fresh weight per plant from 10 to 12
WAP. Okumkom under 15-23-23 kg/ha NPK+5t/ha CM had the highest (479 g) root fresh

82
weight per plantat 12 WAP. The lowest root fresh weight per plant (205 g) was recorded
by 10t/ha CM at 12WAP (Fig 4.6).
In the major season (2012), Apomuden grown on amended plots did not differ significantly
from the control in root fresh weight per plant from 4 to 6 WAP.
Application of 30-60-60 kg/ha NPK Apomuden differed significantly from other amended
and the control plotsin root fresh weight per plant from 8 to 10 WAP.At 12 WAP,
application of 15-15-15 kg/ha NPK+5t/ha CM to Apomuden which had the highest root
fresh weight per plant (1093 g) differed significantly from the other amended and the
control plots at 12 WAP. The lowest (123 g) was recorded by the control at 12 WAP (Fig.
4.6).
In both seasons application of 15-15-15 kg/ha NPK+5t/ha CM to Apomuden had the
highest root fresh weight per plant at 12 WAP. However, Apomuden treated with 15-15-15
kg/ha NPK+5t/ha CM during the major season in 2012 had substantially higher root fresh
weight per plant thanduring the minor season at 12 WAP. Similarly, application of 15-23-
23kg/ha NPK+5t/ha CM to Okumkom had the highest root fresh weight per plant at 12
WAP in both seasons with the root fresh weight per plant during the major season (2012)
being substantially higher than during the minor season (Fig. 4.6).

83
Fig. 4.5 Chlorophyll content of leaves during 2011 minor season and 2012 major
season
200
700
1200
0 4 8 12 16
Chl
orop
hyll
cont
ent
Weeks after planting
(a) Apomuden, minor season
No fertilizerChicken manure (10t/ha)NPK 30-30-30NPK 15-15-15 + 5t/ha Chicken manureNPK 30-45-45NPK 15-23-23 + 5t/ha Chicken manureNPK 30-60-60NPK 15-30-30 + 5t/ha Chicken manure
200
700
1200
0 4 8 12 16
Chl
orop
hyll
cont
ent
Weeks after planting
(b) Okumkom, minor season
No fertilizerChicken manure (10t/ha)NPK 30-30-30NPK 15-15-15 + 5t/ha Chicken manureNPK 30-45-45NPK 15-23-23 + 5t/ha Chicken manureNPK 30-60-60NPK 15-30-30 + 5t/ha Chicken manure
0
200
400
600
800
1000
1200
0 4 8 12 16Chl
orop
hyll
cont
ent
Weeks after planting
(c) Apomuden, major season
No fertilizerChicken manure (10t/ha)NPK 30-30-30NPK 15-15-15 + 5t/ha Chicken manureNPK 30-45-45NPK 15-23-23 + 5t/ha Chicken manureNPK 30-60-60NPK 15-30-30 + 5t/ha Chicken manure
0200400600800
10001200
0 4 8 12 16Chl
orop
hyll
cont
ent
Weeks after planting
(d) Okumkom, major season
No fertilizerChicken manure (10t/ha)NPK 30-30-30NPK 15-15-15 + 5t/ha Chicken manureNPK 30-45-45NPK 15-23-23 + 5t/ha Chicken manureNPK 30-60-60NPK 15-30-30 + 5t/ha Chicken manure

84
4.2.8 Root Dry Weight Per Plant
The result on root dry weight per plant as influenced by chicken manure and inorganic
fertilizer is presented in Figure 4. 7. In 2011 during the minor season, application of
amendment to Apomuden did not differ significantly in root dry weight per plant from the
control from 4 to 6 WAP. Application of 30-30-30 kg/ha NPK to Apomuden differed
significantly in root dry weight per plant from other amended and the control plots from 8
to 10 WAP and from 10t/ha CM at 12 WAP. The lowest (139.8 g) root dry weight per
plant was recorded by 30-45-45 kg/ha NPK, at 12 WAP (Fig 4.7).
Application of amendment to Okumkom did not differ significantly in root dry weight per
plant from the control from 4 to 6 WAP. Okumkom grown on 15-15-15 kg/ha NPK+5t/ha
CM plot differed significantly in root dry weight per plant from the other amended and the
control plots from 8 to 10 WAP and from 15-30-30 kg/ha NPK+5t/ha CM plot with the
highest (239.8 g) root dry weight per plant at 12 WAP. The lowest (126.2 g) was recorded
by 10t/ha CM at 12WAP (Fig. 4.7). In the major season (2012), Apomuden grown on
amended plot did not differ significantly in root dry weight per plant from the control at 4
WAP.
Apomuden grown on 30-30-30 kg/ha NPK, differed significantly in root dry weight per
plant from other amended and the control plots from 6 to 10WAP and from 15-15-15
kg/ha NPK+5t/ha CM at 12 WAP. The least (60.0 g) root dry weight per plant was
recorded by 15-23-23 kg/ha NPK+5t/ha CM and the control plots at 12 WAP (Fig. 4.7).
Okumkom grown on amended plot did not differ significantly in root dry weight per plant
from the control from 4 to 8 WAP.

85
Fig. 4.6 Root fresh weight per plant during 2011 minor season and 2012 major season
0100200300400500600
0 4 6 8 10 12
Roo
t fr
esh
wei
ght
per
plan
t (g
)
Weeks after planting
(a) Apomuden, minor season
No fertilizerChicken manure (10t/ha)NPK 30-30-30NPK 15-15-15 + 5t/ha Chicken manureNPK 30-45-45NPK 15-23-23 + 5t/ha Chicken manureNPK 30-60-60NPK 15-30-30 + 5t/ha Chicken manure
0
100
200
300
400
500
600
0 4 6 8 10 12
Roo
t fr
esh
wei
ght
per
plan
t (g
)
Weeks after planting
(b) Okumkom, minor season
No fertilizerChicken manure (10t/ha)NPK 30-30-30NPK 15-15-15 + 5t/ha Chicken manureNPK 30-45-45NPK 15-23-23 + 5t/ha Chicken manureNPK 30-60-60NPK 15-30-30 + 5t/ha Chicken manure
0200400600800
10001200
0 4 6 8 10 12
Roo
t fr
esh
wei
ght
per
plan
t (g
)
Weeks after planting
(c) Apomuden, major season
No fertilizerChicken manure (10t/ha)NPK 30-30-30NPK 15-15-15 + 5t/ha Chicken manureNPK 30-45-45NPK 15-23-23 + 5t/ha Chicken manureNPK 30-60-60NPK 15-30-30 + 5t/ha Chicken manure
0200400600800
10001200
0 4 6 8 10 12
Roo
t fr
esh
wei
ght p
er p
lant
(g)
Weeks after planting
(d) Okumkom, major season
No fertilizerChicken manure (10t/ha)NPK 30-30-30NPK 15-15-15 + 5t/ha Chicken manureNPK 30-45-45NPK 15-23-23 + 5t/ha Chicken manureNPK 30-60-60NPK 15-30-30 + 5t/ha Chicken manure

86
Okumkom under15-23-23 kg/ha NPK+5t/ha CM differed significantly in root dry weight
per plant from other amended and the control plots from 10 to 12 WAP with the highest
(388.0 g) root dry weight per plant recorded at 12 WAP. The lowest root dry weight per
plant (43.0 g) was recorded by 15-15-15 kg/ha NPK+5t/ha CM at 12 WAP (Fig. 4.7).
Okumkom under15-23-23 kg/ha NPK+5t/ha CM differed significantly in root dry weight
per plant from other amended and the control plots from 10 to 12 WAP with the highest

87
(388.0 g) root dry weight per plant recorded at 12 WAP. The lowest root dry weight per
plant (43.0 g) was recorded by 15-15-15 kg/ha NPK+5t/ha CM at 12 WAP (Fig. 4.7).
Okumkom under15-23-23 kg/ha NPK+5t/ha CM differed significantly in root dry weight
per plant from other amended and the control plots from 10 to 12 WAP with the highest
(388.0 g) root dry weight per plant recorded at 12 WAP. The lowest root dry weight per
plant (43.0 g) was recorded by 15-15-15 kg/ha NPK+5t/ha CM at 12 WAP (Fig. 4.7).

88
Okumkom under15-23-23 kg/ha NPK+5t/ha CM differed significantly in root dry weight
per plant from other amended and the control plots from 10 to 12 WAP with the highest
(388.0 g) root dry weight per plant recorded at 12 WAP. The lowest root dry weight per
plant (43.0 g) was recorded by 15-15-15 kg/ha NPK+5t/ha CM at 12 WAP (Fig. 4.7).
Okumkom under15-23-23 kg/ha NPK+5t/ha CM differed significantly in root dry weight
per plant from other amended and the control plots from 10 to 12 WAP with the highest

89
(388.0 g) root dry weight per plant recorded at 12 WAP. The lowest root dry weight per
plant (43.0 g) was recorded by 15-15-15 kg/ha NPK+5t/ha CM at 12 WAP (Fig. 4.7).
Okumkom under15-23-23 kg/ha NPK+5t/ha CM differed significantly in root dry weight
per plant from other amended and the control plots from 10 to 12 WAP with the highest
(388.0 g) root dry weight per plant recorded at 12 WAP. The lowest root dry weight per
plant (43.0 g) was recorded by 15-15-15 kg/ha NPK+5t/ha CM at 12 WAP (Fig. 4.7).

90
Okumkom under15-23-23 kg/ha NPK+5t/ha CM differed significantly in root dry weight
per plant from other amended and the control plots from 10 to 12 WAP with the highest
(388.0 g) root dry weight per plant recorded at 12 WAP. The lowest root dry weight per
plant (43.0 g) was recorded by 15-15-15 kg/ha NPK+5t/ha CM at 12 WAP (Fig. 4.7).
4.2.9 Vine Fresh Weight per Plant
The vine fresh weight per plant as influenced by chicken manure and inorganic fertilizer is
presented in Fgure 4. 8. During the minor season (2011), Apmuden grown on amended
plots did not differ significantly from the control in vine fresh weight per plant from 4 to
10 WAP. Application of 15-15-15 kg/ha NPK+5t/ha CM to Apomuden differd
significantly in vine fresh weight per plant from other amended and the control plots at 12
WAP. The lowest (544 g) vine fresh weight per plant was recorded by 30-30-30kg/ha
NPK. There was substantial decrease in vinefresh weight per plant between treatments at
12 WAP (Fig. 4.8). Okumkom grown on amended plots did not differ significantly from
the control in vine fresh weight per plant from 4 to 8 WAP.Application of 30-30-30kg/ha
NPK to Okumkom differed significantly in vine fresh weight per plant from other amended
and the control plots from 10 to 12 WAP. The lowest (1371 g) vine fresh weight per plant
was recorded by the control at 12 WAP. In the major season (2012), Apomuden grown on
amended plots did not differ significantly in vine fresh weight per plant from the control
from 4 to 6 WAP. Application of 30-60-60 kg/ha NPK to Apomuden differed significantly
in vine fresh weight per plant from other amended and the control plot at 8WAP and from
15-15-15 kg/ha NPK+5t/ha CM plot differed significantly in vine fresh weight per plant
from 10 to 12 WAP. The lowest was recorded by the control at 12 WAP (Fig 4.8).

91
Fig. 4.7 Root dry weight per plant during 2011 minor season and 2012 major season
0
200
400
0 4 6 8 10 12
Roo
t dry
wei
ght (
g)
Weeks after planting
Apomuden, minor season
No fertilizerChicken manure (10t/ha)NPK 30-30-30NPK 15-15-15 + 5t/ha Chicken manureNPK 30-45-45NPK 15-23-23 + 5t/ha Chicken manureNPK 30-60-60NPK 15-30-30 + 5t/ha Chicken manure
0
200
400
0 4 6 8 10 12
Roo
t dry
wei
ght (
g)
Weeks after planting
Okumkom, minor season
No fertilizerChicken manure (10t/ha)NPK 30-30-30NPK 15-15-15 + 5t/ha Chicken manureNPK 30-45-45NPK 15-23-23 + 5t/ha Chicken manureNPK 30-60-60NPK 15-30-30 + 5t/ha Chicken manure
0
200
400
600
0 4 6 8 10 12
Roo
t dry
wei
ght (
g)
Weeks after planting
(c) Apomudem, major season
No fertilizerChicken manure (10t/ha)NPK 30-30-30NPK 15-15-15 + 5t/ha Chicken manureNPK 30-45-45NPK 15-23-23 + 5t/ha Chicken manureNPK 30-60-60NPK 15-30-30 + 5t/ha Chicken manure
0
200
400
600
0 4 6 8 10 12
Roo
t dry
wei
ght (
g)
Weeks after planting
d) Okumkom, major season
No fertilizerChicken manure (10t/ha)NPK 30-30-30NPK 15-15-15 + 5t/ha Chicken manureNPK 30-45-45NPK 15-23-23 + 5t/ha Chicken manureNPK 30-60-60NPK 15-30-30 + 5t/ha Chicken manure

92
Okumkom grown on amended plots did not differ significantly from the control in vine
fresh weight per plant from 4 to 6 WAP.Application of 15-23-23 kg/ha NPK + 5t/ha CM to
Okumkom differed significantly in vine fresh weight per plant from other amended and the
control plot at 8WAP. The 15-30-30 kg/ha NPK+5t/ha CM had the highest vine fresh
weight per plant and differed significantly from other amended and the control plots from
10 to 12 WAP. The lowest was recorded by 15-15-15 kg/ha NPK + 5t/ha CM at 12 WAP.
4.2.10 Vine Dry Weight Per Plant
The vine dry weight per plant as influenced by chicken manure and inorganic fertilizer is
presented in Figure 4. 9. During the minor season (2011), Apmuden grown on amended
plots did not differ significantly from the control in vine dry weight per plant from 4 to 8
WAP. Application of 30-45-45 kg/ha NPK to Apomuden differed significantly in vine dry
weight per plant from other amended and the control plots at 10 WAP. The lowest vine dry
weight per plant was recorded by 10t/ha CM at 10 WAP. However, application of
10t/haCM to Apomuden had significantly higher (294 g) vine dry weight per plant than
other amended and the control plotsat 12 WAP. The lowest (132 g) was recorded by 30-
30-30 kg/ha NPK at 12 WAP (Fig. 4.8). Okumkom grown on amended plots did not differ
significantly from the control in vine fresh weight per plant from 4 to 6 WAP. Application
of 30-30-30kg/ha NPK to Okumkom differed significantly in vine dry weight per plant
from other amended plots from 8 to 10 WAP. The 15-15-15 kg/ha NPK + 5t/haCM to
Okumkom had the highest (1305 g) vine dry weight per plant and differedsignificantly in
vine dry weight per plant from other amended plots at 12 WAP. The lowest (351 g) vine
dry weight per plant was recorded by 15-30-30 kg/haNPK +5t/haCM at 12 WAP (Fig. 4.8).

93
Fig. 4.8 Vine fresh weight per plant during 2011 minor season and 2012 major season
0
1000
2000
3000
0 4 6 8 10 12
Vin
e fr
esh
wei
ght p
er p
lant
(g)
Weeks after planting
a) Apomuden, minor season
No fertilizerChicken manure (10t/ha)NPK 30-30-30NPK 15-15-15 + 5t/ha Chicken manureNPK 30-45-45NPK 15-23-23 + 5t/ha Chicken manureNPK 30-60-60NPK 15-30-30 + 5t/ha Chicken manure
0
2000
4000
0 4 6 8 10 12
Vin
e fr
esh
wei
ght p
er p
lant
(g)
Weeks after planting
(b) Okumkom, minor season
No fertilizerChicken manure (10t/ha)NPK 30-30-30NPK 15-15-15 + 5t/ha Chicken manureNPK 30-45-45NPK 15-23-23 + 5t/ha Chicken manureNPK 30-60-60NPK 15-30-30 + 5t/ha Chicken manure
0
1000
2000
3000
4000
5000
0 4 6 8 10 12Vin
e fr
esh
wei
ght p
er p
lant
(g)
Weeks after planting
(c) Apomuden, major season
No fertilizerChicken manure (10t/ha)NPK 30-30-30NPK 15-15-15 + 5t/ha Chicken manureNPK 30-45-45NPK 15-23-23 + 5t/ha Chicken manureNPK 30-60-60NPK 15-30-30 + 5t/ha Chicken manure
0
2000
4000
6000
0 4 6 8 10 12Vin
e fr
esh
wei
ght p
er p
lant
(g)
Weeks after planting
(d) Okumkom, major season
No fertilizerChicken manure (10t/ha)NPK 30-30-30NPK 15-15-15 + 5t/ha Chicken manureNPK 30-45-45NPK 15-23-23 + 5t/ha Chicken manureNPK 30-60-60NPK 15-30-30 + 5t/ha Chicken manure

94
In the major season (2012), Apmuden grown on amended plots did not differ significantly
from the control in vine dry weight per plant from 4 to 6WAP. Apomuden grown on the
10t/haCM plot differed significantly in vine dry weight per plant from other amended and
the control plots at 8 WAP and from 30-45-45 kg/ha NPK at 10 WAP. The 15-15-15 kg/ha
NPK + 5t/haCM to Apomuden differed significantly in vine dry weight per plant from
other amended and the control plots at 12WAP. The lowest was recorded by 10t/haCM at
12 WAP (Fig. 4.8).
Okumkom grown on amended plots did not differ significantly from the control in vine
fresh weight per plant at 4 WAP. Application of 30-45-45kg/ha NPK to Okumkom
differed significantly in vine dry weight per plant from other amended plots at 6 WAP and
from 15-23-23 kg/ha NPK + 5t/haCM to Okumkom from 8 to 10 WAP. Application of 15-
23-23 kg/ha NPK + 5t/haCM to Okumkom had the highest vine dry weight per plant
(798.0 g) and differed significantly in vine dry weight per plant from other amended and
the control plots at 12 WAP. The lowest vine dry weight per plant (112.0 g) was recorded
by 15-15-15 kg/ha NPK +5t/haCM at 12 WAP (Fig. 4.8). In both Apomuden and
Okumkom grown on amended and unamended treatments in the major season (2012) had
substantially higher vine dry weight per plant than in the minor season at 12 WAP.

95
Fig. 4.9Vine dry weight per plant during 2011 minor season and 2012 major season
0
500
1000
1500
2000
0 4 6 8 10 12
Vin
e dr
y w
eigh
t (g)
Weeks after planting
(a) Apomuden, minor season
No fertilizerChicken manure (10t/ha)NPK 30-30-30NPK 15-15-15 + 5t/ha Chicken manureNPK 30-45-45NPK 15-23-23 + 5t/ha Chicken manureNPK 30-60-60NPK 15-30-30 + 5t/ha Chicken manure
0
1000
2000
0 4 6 8 10 12Vin
e dr
y w
eigh
t (g)
Weeks after planting
(b) Okumkom, minor season
No fertilizerChicken manure (10t/ha)NPK 30-30-30NPK 15-15-15 + 5t/ha Chicken manureNPK 30-45-45NPK 15-23-23 + 5t/ha Chicken manureNPK 30-60-60NPK 15-30-30 + 5t/ha Chicken manure
0
200
400
600
800
1000
0 4 6 8 10 12VIn
e dr
y w
eigh
t (g)
Weeks after planitng
(c)Apomuden, major season
No fertilizer
Chicken manure (10t/ha)
NPK 30-30-30
NPK 15-15-15 + 5t/ha Chickenmanure
0
200
400
600
800
1000
0 4 6 8 10 12
Vin
e dr
y w
eigh
t (g)
Weeks after planting
(d) Okumkom, major season
No fertilizerChicken manure (10t/ha)NPK 30-30-30NPK 15-15-15 + 5t/ha Chicken manureNPK 30-45-45NPK 15-23-23 + 5t/ha Chicken manureNPK 30-60-60NPK 15-30-30 + 5t/ha Chicken manure

96
4.2.11 Days To 50 % Flowering
Table 4.8 shows the days to 50 % flowering of Apomuden variety of sweetpotato as
influenced by chicken manure and inorganic fertilizer. Apomuden grown on 30-45-45
kg/ha NPK plot during the minor season in 2011 was the earliest to flower (57.0 days).
However, 30-60-60 kg/ha NPK, 15-30-30 kg/ha NPK + 5t/ha CM and the control plots had
the same days to 50 % flowering. Similarly, 30-30-30 kg/ha NPK and 15-23-23 kg/ha NPK
+ 5t/ha CM plots had the same days to 50 % flowering during the minor season. In the
major season (2012), application of 15-15-15 kg/ha NPK + 5t/ha CM to Apomuden
produced the earliest flowering (53.0 days). Application of 15-15-15 kg/ha NPK + 5t/ha
CM to Apomuden shortened days to 50 % flowering by 15 days compared to the control.
Apomuden cultivar showed non- significant difference in days to 50 % flowering in
response to fertilization in both seasons (Table 4.8).
Table 4.8: Days to 50% flowering during 2011 minor season and 2012 major season
Variety
Days to 50 % flowering(minor season)
Apomuden
Days to 50% flowering(major season)
ApomudenFertilizer Rates
No fertilizer (Control)
10t/ha CM
30-30-30kg/ha NPK
15-15-15 kg/ha NPK + 5t/ha CM
30-45-45kg/ha NPK
15-23-23kg/ha NPK + 5t/ha CM
30-60-60kg/ha NPK
15-30-30 kg/ha NPK + 5t/ha CM
62.0
63.0
59.0
58.0
57.0
59.0
62.0
62.0
68.0
59.0
62.0
53.0
62.0
65.0
56.0
60.0
LSD (P = 0.05) NS NS

97
4.2.12 Vine Fresh Weight at Harvest
Table 4.9 shows vine fresh weight at harvest as influenced by chicken manure and
inorganic fertilizer. During the minor season (2011), application of 15-23-23 kg/ha NPK +
5t/ha CM to Apomuden recorded the highest vine fresh weight at harvest (27.0 t/ha) with
the lowest recorded by 30-30-30 kg/ha NPK plot (18.0 t/ha). There was no significant
difference between amended and control plots in vine fresh weight at harvest. However,
Okumkom grown on 30-60-60 kg/ha NPK plot had the highest vine fresh weight at
harvest.and the lowest recorded by 30-30-30kg/ha NPK plot (Table 4.9).
In the major season (2012), application of 15-15-15 kg/ha NPK+5t/ha CM to Apomuden
recorded the highest vine fresh weight at harvest followed by 15-30-30 kg/ha NPK +5t/ha
CM plot (6.83 t/ha) with the lowest recorded by the control. There was however, no
significant difference between amended and unamended plots in vine fresh weight at
harvest .Similarly, application of 15-23-23 kg/ha NPK+5t/ha CM to Okumkom recorded
the highest vine fresh weight at harvest with the lowest recorded by 15-15-15 kg/ha
NPK+5t/ha CM plot followed by the control. However, there was no significant difference
between amended and unamended plots in vine fresh weight at harvest (Table 4.9).

98
Table 4.9: Vine fresh weight at harvest during 2011 minor season and 2012 major
season
Variety
Vine fresh weightat harvest (t/ha)(minor season)
Mean
Vine fresh weightat harvest (t/ha)
(major season)
MeanApomud. Okumk. Apomud. Okumk.Fertilizer RatesNo fertilizer
10t/ha CM
30-30-30 kg/ha NPK
15-15-15 kg/ha CM + 5t/ha CM
30-45-45kg/ha NPK
15-23-23 kg/ha NPK + 5t/ha CM
30-60-60 kg/ha NPK
15-30-30 kg/ha NPK + 5t/ha CM
22.2
19.0
18.0
20.0
26.5
27.0
24.7
20.7
54.0
64.5
57.2
59.0
58.5
63.5
67.7
60.0
38.1
41.7
37.6
39.5
42.5
45.2
46.2
40.4
3.47
4.60
3.83
6.92
3.70
4.80
4.30
6.83
8.20
16.00
8.87
6.30
14.07
20.23
12.60
11.40
5.83
10.30
6.35
6.61
8.88
12.52
8.45
9.12
Mean
LSD (P =0.05) VarietyFertilizerVariety x Fertilizer
22.3
6.1NSNS
60.6 4.81 12.21
3.23NSNS
4.3 Yield Performance of Two Varieties of Sweetpotato
4.3.1 Number of Marketable and Unmarketable Root Tubers per Plot
Table 4.10 shows number of marketable and unmarketable root tubers per plot as
influenced by chicken manure and inorganic fertilizer. During the minor season (2011),
there was a significant difference between Apomuden and Okumkom in marketable root
tuber number per plot (Appendix 2). Apomuden grown on 15-15-15 kg/ha NPK + 5t/ha
CM and 30-45-45 kg/ha NPK plots had the highest marketable root tuber numbe rper plot

99
(22.0) with the lowest recorded by 10t/ha CM plot (14.0). Application of 15-23-23 kg/ha
NPK+ 5t/ha CM and the control to Okumkom had the highest number of marketable root
tubers per plot and 15-15-15 kg/ha NPK + 5t/ha CM plot recorded the lowest mean (9.0)
(Table 4.10). Generally, Apomuden grown on 15-15-15 kg/ha NPK + 5t/ha CM, 10t/ha
CM, 30-30-30 kg/ha NPKand 30-45-45 kg/ha NPK plots had significantly higher
marketable root tuber number per plot than Okumkom grown on the same treatmenst.
Apomuden and Okumkom grown on15-23-23 kg/ha NPK+ 5t/ha CM plot had the same
marketable root tuber number per plot (Table 4.10).
In the major season (2012), there was a significant difference between Apomuden and
Okumkom in marketable root tuber number per plot (Appendix 3). Apomuden grown on
15-30-30 kg/ha NPK + 5 t/ha CM plot had the highest number of marketable root tuber per
plot (49.0) and 30-45-45kg/ha NPK plot had the lowest mean (28.0). Okumkom grown on
15-23-23 kg/ha NPK + 5 t/ha CM plot had the highest marketable root tuber number per
plot (35.0) and the control had the lowest mean (15.0) (Table 4.10).
In both seasons Okumkom grown on 15-23-23 kg/ha NPK + 5 t/ha CM plot had the
highest marketable root tuber number per plot. Generally, both sweetpotato varieties grown
on amended and unamended plots during the major season in 2012 had higher marketable
root tuber numbers than yields obtained during the minor season in 2011. There was no
significant difference between variety x fertilizer interaction in marketable root tuber
number per plot (Table 4.10).
In the case of unmarketable number of root tuber per plot, there was a significant
difference between Apomuden and Okumkom in unmarketable root tuber number per plot
(Appendix 4). Application of 30-30-30 kg/ha NPK to Apomuden had the highest mean

100
(20.0) with the lowest recorded by 10t/ha CM plot (11.0) during the minor season in 2011.
Application of 30-45-45 kg/ha NPK to Okumkom produced the highest unmarketable root
tuber number per plot (9.0) compared to the other treatments which recorded the same
mean (6.0) except 15-23-23 kg/ha NPK + 5t/ha CM and control plots (Table 4.10).In the
major season (2012), there were significant differences between Okumkom and Apomuden
except for treatments 10t/ha CM and the control in unmarketable root tuber number per
plot (Appendix 5). Apomuden grown on 15-30-30 kg/ha NPK+5t/ha CM plot had the
highest unmarketable root tuber number per plot (40.0) and differed significantly from the
control, 15-23-23 kg/ha NPK+5t/ha CM and 30-45-45 kg/ha NPK plots (Table 4.10).
Okumkom grown on 15-23-23 kg/ha NPK+5t/ha CM plot had the highest unmarketable
root tuber number per plot (61.0) and differed significantly from all the treatments except
30-60-60 kg/ha NPK and 15-30-30 kg/ha NPK + 5t/ha CM. Okumkom grown on amended
plots except 10t/ha CM, 30-30-30 kg/ha NPK and 15-15-15 kg/ha NPK+5t/ha CM plots
and the control had significantly higher unmarketable root tuber number per plot than
Apomuden. In both seasons Okumkom grown on 15-15-15 kg/ha NPK +5t/ha CM plot had
the lowest unmarketable root tuber number per plot.
Generally, both Apomuden and Okumkom grown on amended and the control plots during
the major season had substantially higher unmarketable root tuber number per plot than the
mean obtained during the minor season (Table 4.10).

101
Table 4.10.: Number of marketable and unmarketable tubers during 2011 minor season and 2012 major season
Variety
Number ofmarketable roottubers per plot (No.)
(minor season)
Mean
Number ofmarketableroottubers per plot
(No.) (major season)
Mean
Number ofunmarketable root
tubers per plot(No.). (minor season) _
Apom. Okum. Mean
Number ofunmarketable root
tubers per plot(major season)
Apomud. Okum.Apomud. Okumk. Apomud. Okumk. MeanFertilizer RatesNo fertilizer
Chicken manure (10t/ha)
NPK 30-30-30
NPK 15-15-15 + 5t/haChicken manure
NPK 30-45-45
NPK 15-23-23 + 5t/haChicken manure
NPK 30-60-60
NPK 15-30-30 + 5t/haChicken manure
18.0
14.0
21.0
22.0
22.0
19.0
19.0
15.0
19.0
10.0
14.0
9.0
16.0
19.0
16.0
17.0
18.0
12.0
17.0
16.0
19.0
19.0
18.0
16.0
34.0
31.0
34.0
37.0
28.0
36.0
35.0
49.0
15.0
20.0
26.0
20.0
25.0
35.0
33.0
21.0
25.0
25.0
30.0
28.0
27.0
36.0
34.0
35.0
17.0
11.0
20.0
16.0
14.0
12.0
16.0
13.0
7.0
6.0
6.0
6.0
9.0
8.0
6.0
6.0
12.0
8.0
13.0
11.0
11.0
10.0
11.0
10.0
24.0
35.0
24.0
24.0
16.0
17.0
35.0
40.0
20.0
22.0
31.0
19.0
32.0
61.0
48.0
47.0
22.0
29.0
28.0
22.0
24.0
39.0
41.0
44.0
Mean
LSD(P =0.05) VarietyFertilizerVariety x Fertilizer
19.0 15.0
3.60NSNS
35.0 25.0
7.38NSNS
15 7.0
2.82NSNS
27.0 35.0
7.8615.7222.23

102
4.3.2 Marketable and Unmarketable Tuber Weight Per Plot
The effect of chicken manure and inorganic fertilizer on marketable and unmarketable
tuber weight per plot of two sweetpotato varieties is presented in Table 4.11.During the
minor season (2011), there was a significant difference between Apomuden from
Okumkom in marketable tuber weight per plot except the control plot (Appendix 6).
Apomuden grown on amended plots except 15-23-23 kg/ha NPK-5t/ha CM differed
significantly from Okumkom grown on the same treatments in marketable tuber weight per
plot. Apomuden grown on 30-45-45 kg/ha NPK plot had the highest marketable tuber
weight per plot (3.75 kg). The lowest marketable tuber weight was recorded by 10t/ha CM
plot (2.13 kg). Okumkom grown on the control plot had the highest marketable tuber
weight per plot (3.05 kg) and the least was recorded by 15-15-15 kg/ha NPK+ 5t/ha CM
treatments. There was no significant difference between amended and the control
treatmentst in marketable tuber weight per plot (Table 4.11).
In the major season (2012), there was a significant difference between Apomuden from
Okumkom in marketable tuber weight per plot (Appendix 7). Apomuden grown on
amended treatments differed significantly from the control treatment in marketable tuber
weight per plot.Apomuden grown on 15-30-30 kg/ha NPK +5t/ha CM plot had the highest
marketable tuber weight per plot (12.13 kg) with the least recorded by the control plot
(2.80kg). Okumkom grown on 15-23-23kg/ha NPK+5t/ha CM plot had the highest
marketable tuber weight per plot (7.00 kg) followed by 30-60-60kg/ha NPK plot both of
which differed significantly from the control plot with the lowest mean(1.93 kg).
Application of 15-15-15kg/ha NPK + 5t/ha CM and 15-30-30kg/haNPK + 5tlha CM to
Apomuden differed significantly in variety x fertilizer interaction from Okumkom in

103
marketable tuber weight per plot. Generally, Apomuden and Okumkom grown on amended
plots during the major season had higher marketable tuber weight per plot than mean
values obtained during the minor season (Table 4.11).
In the case of unmarketable tuber weight, during the minor season (2011), there was a
significant difference between Apomuden and Okumkom in unmarketable tuber weight per
plot (Appendix 8). Apomuden grown on amended plots except 10tlha CM and 30-45-45
kg/ha NPK and the control plots differed significantly from Okumkom in unmarketable
tuber weight per plot Apomuden grown on 30-30-30 kg/ha NPK plot had the highest
unmarketable tuber weight per plot (0.55 kg) followed by 30-60-60 kg/ha NPK plot (0.44
kg) with the lowest recorded by 10t/ha CM (0.23 kg) (Table 4.11). Okumkom grown on
30-45-45 kg/ha NPK plot had the highest unmarketable tuber weight per plot (0.31 kg) and
the lowest recorded by 15-30-30 kg/ha NPK + 5t/ha CM in unmarketable tuber weight per
plot (0.13 kg). Application of 15-15-15 kg/ha NPK + 5t/ha CM to Okumkom had the same
unmarketable tuber weight per plot with the control (0.18 kg). There was no significant
difference between amended plots and the control in unmarketable tuber weight per plot
(Table 4.11).
In the major season (2012), there was a significant difference between Okumkom and
Apomuden in unmarketable tuber weight per plot except 10t/haCM, 30-30-30 kg/ha NPK
and the control plots (Appendix 9). Apomuden grown on 30-60-60 kg/ha NPK plot had the
highest unmarketable tuber weight per plot (0.67 kg) which differed significantly from 15-
23-23 kg/ha NPK +5t/ha CM plot with the lowest mean value (0.13 kg). Significant
difference occurred between Okumkom grown on 15-23-23 kg/ha NPK +5t/ha CM plot
from 15-15-15 kg/ha NPK +5t/ha CM and the control plots in unmarketable tuber weight

104
per plot. Apomuden and Okumkom grown on 30-30-30 kg/ha NPK and the control plots
had the same unmarketable tuber weight per plot (0.33 kg) and (0.27 kg) respectively
(Table 4.11). Generally, Okumkom grown on amended and unamended plots during the
major season produced substantially higher unmarketable tuber weight per plot than mean
obtained during the minor season (Table 4.11).
4.3.3 Total Tuber Yield
Effect of chicken manure and inorganic fertilizer on total tuber yield of two sweetpotato
varieties is presented in Table 4.12. During the minor season (2011), A significant
difference occurred between Apomuden grown on the different amendments except 15-23-
23 kg/haNPK + 5t/ha CM 15-30-30 kg/haNPK +5t/ha CM and the control from Okumkom
in total tuber yield Apomuden grown on 30-30-30 kg/haNPK plot had the highest total
tuber yield (41.00 t/ha) with the lowest recorded by 15-30-30kg/haNPK + 5t/ha CM (28.
00 t/ha). There was no significant difference between the amended and the control plots
(Table 4.12).
In the major season (2012), there was no significant difference in variety x fertilizer
interaction between treatments in total tuber yield. Generally, Apomuden and Okumkom
grown on amended and unamended plots during the major growing season produced
substantially higher total tuber yield than during the minor growing season (Table 4.12).

105
Table 4.11.: Marketable and Unmarketable tuber weight per plot during 2011 minor season and 2012 major season
Variety
Weight ofmarketable tubers
per plot(kg)
(minor season)
Mean
Weight ofmarketable tubersper plot (kg)(major season)
Mean
Weight ofUnmarketabletubers per plot (kg)(minor season)
Weight ofUnmarketabletubersper plot(kg) (majorseason)
Apomud Okumk. Apomud Okumk Apomud Okumk Mean Apomd Okumk MeanFertilizer RatesNo fertilizer
10t/ha CM
30-30-30 kg/haNPK
15-15-15 kg/haNPK + 5t/ha CM
30-45-45 kg/haNPK
15-23-23 kg/haNPK + 5t/ha CM
30-60-60 kg/haNPK
15-30-30 kg/haNPK+ 5t/ha CM
2.98
2.13
3.18
3.33
3.75
3.30
3.43
3.15
3.05
1.65
1.95
1.53
2.80
3.00
2.68
2.63
3.01
1.89
2.56
2.43
3.28
3.15
3.05
2.89
2.80
6.47
7.03
8.73
5.80
7.23
6.97
12.23
1.93
3.93
3.83
2.90
4.23
7.00
6.23
3.23
2.37
5.20
5.43
5.82
5.02
7.12
6.60
7.73
0.37
0.23
0.55
0.31
0.30
0.32
0.44
0.26
0.18
0.20
0.22
0.18
0.31
0.22
0.16
0.13
0.27
0.22
0.38
0.25
0.30
0.27
0.30
0.20
0.27
0.50
0.33
0.37
0.23
0.13
0.67
0.57
0.27
0.30
0.33
0.27
0.73
1.73
1.23
1.13
0.27
0.40
0.33
0.32
0.48
0.93
0.95
0.85
Mean
LSD (P =0.05); VarietyFertlizer
Variety x Fertilizer
3.15 2.41
0.46NSNS
7.16 4.16
1.332.673.78
0.35 0.20
0.07NSNS
0.38 0.75
0.320.460.66

106
Table 4.12: Total Tuber Yield During 2011 Minor Season and 2012 Major Season
Variety
Total tuber yield(t/ha)(minor season)
Mean
Total tuber yield(t/ha)(major season)
MeanApomud. Okumk. Apomud OkumkFertilizer RatesNo fertilizer
10t/ha CM
30-30-30 kg/haNPK
15-15-15kg/haNPK +5t/ha CM
30-45-45 kg/haNPK
15-23-23 kg/haNPK +5t/ha CM
30-60-60 kg/haNPK
15-30-30 kg/haNPK +5t/ha CM
35.0
25.0
41.0
38.0
36.0
31.0
34.0
28.0
26.0
16.0
20.0
15.0
25.0
27.0
22.0
23.0
30.0
20.0
30.0
26.0
30.0
30.0
28.0
26.0
59.0
64.0
61.0
65.0
45.0
58.0
70.0
86.0
38.0
52.0
66.0
49.0
62.0
85.0
93.0
89.3
49.0
58.0
63.0
57.0
53.0
72.0
82.0
88.0
Mean
LSD (P =0.05); VarietyFertilizer
Variety x Fertilizer
33.0 22.0
5.18NSNS
64.0 67.0
NSNSNS

107
4.3.4 Marketable Tuber Diameter
The results of the marketable tuber diameter as influenced by chicken manure and
inorganic fertilizer and variety are presented in Table 4.13. For the minor growing season
(2011), the diameter of marketable tubers was not significantly affected either by variety or
the application of fertilizer. However, there was a general trend towards an increase in
marketable tuber diameter in Okumkon grown on amendments except 10t/ha CM, 30-60-
60 kg/ha NPK and 15-30-30g/ha NPK + 5t/ha CM and the control (Table 4.13).
In the major season (2012), there was a significant difference between Apomuden grown
on amendments except 15-23-23 kg/haNPK + 5t/ha CM and the control from Okumkom in
marketable tuber diameter. Apomuden grown on 15-30-30kg/haNPK +5t/ha CM plot had
the highest marketable tuber diameter (8.64cm) with the lowest recorded by the control
(6.31cm). No significant difference was observed between amended and unamended plots
in marketable tuber diameter (Table 4.13).
In both seasons Apomuden grown on 15-30-30kg/haNPK+5t/ha CM plot had the highest
marketable tuber diameter. Similarly, both Apomuden and Okumkom grown on 15-15-
15kg/haNPK+5t/ha CM plot had the lowest marketable tuber diameter during the minor
and major growing seasons respectively. Generally, Apomuden and Okumkom grown on
amended and unamended plots produced substantially higher marketable tuber diameter
during the major season than in the minor season (Table 4.13).

108
Table 4.13: Marketable and UnmarketableTuber Diameter During 2011 Minor SeasonAnd 2012 Major Season
Variety
Marketable TuberDiameter (cm)
(minor season)
Mean
Marketable TuberDiameter(cm)(major season)
Mean
Unmarketabletuber
Diameter (cm)(minor season)
Marketable tuberDiameter (cm)
(major season)
Apomud. Okumk. Apomud Okumk Apomud Okumk Mean Apomd Okumk MeanFertilizer RatesNo fertilizer
10t/ha CM
30-30-30 kg/haNPK
15-15-15 kg/haNPK+ 5t/ha CM
30-45-45 kg/haNPK
15-23-23 kg/haNPK +5t/ha CM
30-60-60 kg/haNPK
15-30-30 kg/haNPK +5t/ha CM
4.60
4.66
4.68
4.56
5.11
4.83
5.02
5.14
5.32
4.46
4.93
5.24
5.65
5.25
5.00
5.11
4.96
4.56
4.80
4.90
5.38
5.04
5.01
5.13
6.31
6.75
7.37
7.14
6.39
6.46
7.01
8.64
5.40
6.72
6.33
5.38
5.99
7.01
6.17
5.65
5.85
6.73
6.85
6.26
6.19
6.73
6.59
7.15
2.15
2.03
2.09
1.93
2.03
2.19
2.19
2.02
2.06
2.19
2.37
2.24
2.24
2.13
2.08
2.19
2.11
2.11
2.23
2.08
2.13
2.16
2.13
2.07
2.42
2.55
2.43
2.49
2.26
2.71
2.63
2.65
2.52
2.50
2.44
2.52
2.55
2.56
2.55
2.61
2.45
2.53
2.43
2.50
2.41
2.63
2.59
2.50
Mean
LSD (P =0.05)VarietyFertilizer
Variety x Fertilize
4.82 5.12
NSNSNS
7.01 6.08
0.64NSNS
2.08 2.18
0.10NSNS
2.52 2.53
NSNSNS

109
4.3.5 Unmarketable Tuber Diameter
The results of the unmarketable tuber diameter as influenced by chicken manure and
inorganic fertilizer and variety are presented in Table 4.13. During the minor season
(2011), there was a significant difference between Okumkomgrown on amendments except
15-23-23 kg/ha NPK + 5t/ha CM and 30-60-60 kg/ha NPK and the control from
Apomuden inunmarketable tuber diameter. Application of 15-23-23kg/ha NPK + 5t/ha CM
and 30-60-60kg/ha NPK to Apomuden had the highest and the same unmarketable tuber
diameter. The lowest was recorded byApomuden under 15-15-15kg/ha NPK+5t/ha CM
inunmarketable tuber diameter. Application of 10t/ha CM and 30-45-45kg/ha NPK to
Apomuden had the same mean (2.03 cm) (Table 4.14).Okumkom grown ongrown on 30-
30-30 kg/ha NPK had the highest unmarketable tuber diameter (2.37 cm) with the lowest
recorded by the control (2.06 cm). Application of 15-15-15 kg/ha NPK + 5t/ha CM and 30-
45-45 kg/ha NPK to Okumkom had the same mean (2.24 cm). Similarly, Okumkom grown
on 10t/ha CM and 15-30-30 kg/ha NPK + 5t/ha CM plots also had the same mean in
unmarketable tuber diameter. No significant difference was observed in variety x fertilizer
interaction in unmarketable tuber diameter (Table 4.13).
In the major season (2012), the diameter of unmarketable tuber was not significantly
affected either by variety or the application of fertilizer. However, there was a general
trend towards an increase in unmarketable tuber diameter with Okumkon grown on
amendments except 10t/ha CM, 15-23-23 kg/ha NPK, 30-60-600 kg/ha NPK and 15-30-30
kg/ha NPK + 5t/ha CM and the control.No significant difference was observed in variety x
fertilizer interaction in unmarketable tuber diameter (Table 4.13).
In both seasons Apomuden grown on 15-23-23 kg/ha NPK+5t/ha CM plot had the highest

110
unmarketable tuber diameter. Similarly, Apomuden and Okumkom grown on amended and
unamended plots during the major season produced substantially higher unmarketable
tuber diameter than in the minor season (Table 4 .13).
4.3.6 Average Tuber Weight
Table 4.14 shows the average tuber weight as influenced by chicken manure and
inorganic fertilizers. During the minor season (2011), there was a significant difference
between Apomuden from Okumkom in average tuber weight (Appendix 10). Apomuden
grown on 30-45-45 kg/ha NPK + 5t/haCM plot had the highest average weight per tuber
(0.30 kg) and 15-15-15kg/ha NPK + 5t/ha CM plot had the lowest weight per tuber
(0.15kg). Application of 15-15-15 kg/ha NPK+ 5t/ha CM to Okumkom had the highest
weight per tuber (0.23 kg).and the lowest recorded by 10t/haCM, 30-30-30 kg/ha NPK, 30-
60-60 kg/ha NPK and 15-30-30 kg/ha NPK+ 5t/ha CM plots in average weight per tuber
(0.16 kg). Amended plots did not differ significantly from the control plot in average
weight per tuber. However, there was a general trend towards an increase in average
weight per tuber with Apomuden grown on amendments except 15-15-15 kg/ha NPK+
5t/ha CM and the control (Table 4.14).
In the major season (2012), there was a significant difference between Apomuden from
Okumkom in average tuber weight (Appendix 11).Apomuden grown on 15-30-30 kg/ha
NPK+5t/ha CM plot had the highest average tuber weight (0.53 kg) with the lowest
recorded by the control (0.28 kg). Okumkom grown on 15-23-23 kg/ha NPK+5t/ha CM
plot had the highest average tuber weight (0.30 kg) with the lowest recorded by 15-15-15
kg/ha NPK+5t/ha CM and the control (0.19 kg). No significant difference occurred

111
between amended and unamended plots in average tuber weight (Table 4.14).
Generally, Apomuden grown on amended and the control plots during the majorseason
produced substantially higher average tuber weight than Apomuden grown on the same
treatments during the minor season. Okumkom grown on amended plots except NPK 15-
15-15+5t/ha CM treatment during the major season produced substantially higher average
tuber weight than Okumkom grown on the same treatments during the minor season (Table
4.14).
4.3.7 Average Tuber Length
Table 4.14 shows average tuber length as influenced by chicken manure and inorganic
fertilizers.During the minor season (2011), there was a significant difference between
Apomuden from Okumkom in average tuber length (Appendix 12). Application of 15-30-
30 kg/ha NPK+5t/ha CM to Apomuden had the highest average tuber length (17.88 cm)
and 30-60-60kg/ha NPK plot recorded the lowest average tuber length (13.80 cm).
Okumkom grown on 10t/ha CM plot had the highest average tuber length (14.0 cm) and
the control recorded the lowest average tuber length (10.77 cm). There was no significant
difference between amended plots and the control in average tuber length (Table 4.14).
In the major season (2012), there was a significant difference between Apomuden from
Okumkom except Apomuden under 15-23-23 kg/ha NPK +5t/ha CM in average tuber
length.

112
Table 4.14: Average Tuber Weight and Tuber Length During 2011 Minor SeasonAnd 2012 Major Season
Variety
Average tuberweight (kg)
(minor season)
Mean
Average tuberweight (kg)
(major season)
Mean
Average tuberLength (cm)
(minor season)
Average tuberLength (cm)(major season)
Apomud. Okumk. Apomud Okumk Apomud Okumk Mean Apomd Okumk MeanFertilizer RatesNo fertilizer
10t/ha CM
30-30-30kg/haNPK
15-15-15kg/haNPK+ 5t/ha CM
30-45-45 kg/haNPK
15-23-23 kg/haNPK + 5t/haCM
30-60-60 kg/haNPK
15-30-30 kg/haNPK + 5t/haCM
0.22
0.22
0.22
0.15
0.30
0.24
0.23
0.26
0.21
0.16
0.16
0.23
0.17
0.18
0.16
0.16
0.21
0.19
0.19
0.19
0.23
0.21
0.20
0.21
0.28
0.36
0.37
0.35
0.36
0.31
0.43
0.53
0.19
0.23
0.24
0.19
0.26
0.30
0.23
0.21
0.23
0.29
0.31
0.27
0.31
0.30
0.33
0.37
16.67
15.82
14.52
15.00
16.17
14.30
13.80
17.88
10.77
14.00
11.95
12.12
11.15
12.02
12.40
11.32
13.72
14.91
13.24
13.56
13.66
13.16
13.10
14.60
20.74
19.43
19.87
22.29
20.79
19.38
21.59
24.50
17.17
17.57
17.33
16.83
18.40
20.03
20.26
17.40
18.95
18.50
18.60
19.56
19.59
19.71
20.92
20.95
Mean
LSD (P =0..05)VarietyFertilizer
Variety x Fertilizer
0.23 0.18
0.04NSNS
0.37 0.23
0.06NSNS
15.52 11.97
1.48NSNS
21.07 18.12
1.05NS2.97

113
Apomuden grown on 15-30-30 kg/haNPK+5t/ha CM plot had the highest average tuber
length (24.50 cm) and the lowest (19.38 cm) average tuber length recorded by 15-23-23
kg/ha NPK+5t/ha CM plot. Okumkom grown on 30-60-60 kg/haNPplot had the highest
(20.26 cm) average tuber length and the least (16.83 cm) average tuber length recorded
by15-15-15 kg/ha NPK+5t/ha CM plot.There was no significant difference between
amended and the control plots in average tuber length (Table 4.14).
In both seasons Apomuden grown on 15-30-30 kg/ha NPK+5t/ha CM plot had the highest
average tuber length. Generally, Apomuden grown on amendedplots except 15-23-23
kg/ha NPK+5t/ha CM plot during the major season and the control produced substantially
higher average tuber length than Okumkom grown on the same treatments in both seasons.
Similarly, Apomuden and Okumkom grown on amended and unamended plots recorded
substantially higher average tuber length during the major seasonthan during the minor
season (Table 4.14).
4.3.8 Tuber Dry matter accumulation at harvest
Table 4.15 shows tuber dry matter accumulation at harvest as influenced by chicken
manure and inorganic fertilizers. During the minor season (2011), there was no significant
difference between variety x fertilizer interaction in tuber dry matter accumulation at
harvest However, there was a general trend towards greater increase in tuber dry matter
accumulation at harvest with Okumkon grown on amendments except 30-60-60 kg/ha
NPK and the control than in Apomuden (Table 4.15).

114
In the major season (2012), there was a significant difference between amendments and the
control in tuber dry matter accumulation at harvest. There was however, no significant
difference in variety x fertilizer interaction in tuber dry matter accumulation at harvest.
Generally, application of chicken manure plus inorganic fertilizer to Apomuden during the
major season produced substantially higher tuber dry matter accumulation at harvest than
during the minor season with 15-30-30 kg/ha NPK + 5t/haCM plot producing the highest
mean (3.08 kg) (Table 4.15).
4.3.9 Harvest Index and Commercial Harvest Index
The harvest index and commercial harvest index as influenced by chicken manure and
inorganic fertilizer are presented in Table 4.16. During the minor season (2011), there was
a significant difference between Apomuden from Okumkom in harvest index. Application
of 30-30-30 kg/haNPK and 15-15-15 kg/ha NPK + 5t/ha CM to Apomuden produced the
highest and the same Harvest index (0.66) with 10t/ha CM recording the lowest mean
(0.55). On the other hand Okumkom grown on the control plot produced the highest
harvest index (0.41) and the lowest recorded by treatment 10t/ha CM (0.21). There was no
significant difference between amendments and the control in harvest index (Table 4.16).
In the major season (2012), there was a significant difference between Apomuden from
Okumkom in harvest index. Application of 30-45-45 kg/ha NPK to Apomuden produced
the highest Harvest index (0.65) and the lowest was recorded by the control plot (0.52).
However, 30-30-30 kg/ha NPK, 30-60-60 kg/ha NPK and 15-30-30 kg/ha NPK+5t/ha CM
plots had the same mean (0.64).

115
Table 4.15: Tuber Dry Matter Accumulation at Harvest during 2011 Minor Season
and 2012 Major Season
Variety
Tuber dry matteraccumulation at
Harvest ( kg)(minor season)
Mean
Tuber dry matteraccumulation at
Harvest ( kg)(major season)
MeanApomud. Okumk. Apomud. Okumk.FertilizerNo fertilizer
10t/haCM
30-30-30 kg/haNPK
15-15-15 kg/haNPK + 5t/ha CM
30-45-45 kg/haNPK
15-23-23 kg/haNPK + 5t/ha CM
30-60-60 kg/haNPK
15-30-30 kg/haNPK+ 5t/ha CM
1.24
0.74
1.11
1.10
1.21
1.21
1.11
1.09
1.43
0.76
0.72
0.72
4.81
1.36
1.07
1.17
1.34
0.75
0.91
0.91
3.01
1.29
1.09
1.13
0.55
1.71
1.28
1.80
1.83
1.92
1.53
3.08
0.71
1.12
1.57
0.86
1.32
2.63
1.97
1.51
0.63
1.41
1.43
1.33
1.57
2.27
1.75
2.29
Mean
LSD (P =0.05); VarietyFertilizer
Variety x Fertilizer
1.10 1.51
NSNSNS
1.71 1.46
NS0.85NS
Okumkom grown on 15-23-23 kg/ha NPK+5t/ha CM plot had the highest harvest index
with the lowest recorded by 10t/ha CM plot followed by the control plot. There was no
significant difference between amendmends and the control in harvest index. In both
seasons application of 10t/ha CM to Okumkom produced the same and the lowest Harvest
index (0.21) (Table 4.16).
In the case of commercial harvest index, during the minor season (2011), there was no
significant difference between Okumkom from Apomuden in commercial harvest index.

116
However, there was a general trend towards an increase in commercial harvest index with
Okumkon grown on amendments except 10t/ha CM and 30-45-45 kg/ha NPK plots and the
control compared with Apomuden There was no significant difference in variety x
fertilizer interactionin commercial harvest index (Table 4.16).
In the major season (2012), there was a significant difference between Apomuden and
Okumkom in commercial harvest index. Application of 15-23-23 kg/ha NPK+5t/ha CM to
Apomuden produced the highest commercial harvest index (0.97) and the least (0.86) was
recorded by the control. Okumkom grown on 30-30-30 kg/ha NPK and 15-15-15kg/ha
NPK+5t/ha CM plots had the same and the highest commercial harvest index (0.91) and
the least (0.73) was recorded by 15-30-30kg/ha NPK +5t/ha CM plot.There was no
significant difference between amendments and the control in commercial harvest index
(Table 4.16). Generally, Apomuden grown on amended and the control plots during the
major season produced substantially higher commercial harvest index than during the
minor season. However, Okumkom grown on amended plots except 10t/ha CM, 30-30-30
kg/ha NPK plot and the control produced substantially higher commercial harvest index
during the minor season than during the major season. Okumkom grown on 15-15-15
kg/ha NPK + 5t/ha CM plot had the same mean (0.91) in both seasons (Table 4.16).

117
Table 4.16: Harvest Index and Commercial Harvest Index As Influenced By Chicken Manure And Inorganic Fertilizer
During 2011 Minor Season And 2012 Major Season
Variety
Harvest index(minor season)
Mean
Harvest index(major season)
Mean
Commercialharvest index(minor season)
Commercialharvest index(major season)
Apomud. Okumk. Apomud Okumk Apomud Okumk Mean Apomd Okumk MeanFertilizer RatesNo fertilizer
10t/ha CM
30-30-30 kg/haNPK
15-15-15 kg/haNPK + 5t/haCM
30-45-45 kg/haNPK
15-23-23 kg/haNPK+ 5t/ha CM
30-60-60 kg/haNPK
15-30-30 kg/haNPK + 5t/haCM
0.60
0.55
0.66
0.66
0.61
0.57
0.58
0.61
0.41
0.21
0.27
0.22
0.33
0.35
0.27
0.33
0.50
0.38
0.46
0.44
0.47
0.46
0.42
0.47
0.52
0.61
0.64
0.57
0.65
0.58
0.64
0.64
0.23
0.21
0.30
0.36
0.24
0.41
0.34
0.30
0.37
0.41
0.47
0.47
0.44
0.50
0.49
0.47
0.85
0.88
0.84
0.90
0.93
0.89
0.85
0.92
0.94
0.87
0.89
0.91
0.89
0.93
0.92
0.94
0.90
0.87
0.86
0.91
0.91
0.91
0.89
0.93
0.86
0.93
0.95
0.95
0.95
0.97
0.91
0.95
0.87
0.88
0.91
0.91
0.85
0.80
0.84
0.73
0.87
0.90
0.93
0.93
0.90
0.88
0.88
0.84
Mean
LSD (P =0.05); VarietyFertilizer
Variety x Fertilizer
0.61 0.30
0.044NSNS
0.61 0.30
0.078NSNS
0.88 0.91
NSNSNS
0.93 0.85
0.039NSNS

118
4.4 Marketable Quality of Tubers (Percentage Tuber Crack, Tuber Rot,
Deformed Tuber, Forked Tuber, Pests Infested Tuber, Tuber Sprout) As
Influenced By Chicken Manure And Inorganic Fertilizer On Two Sweetpotato
Varieties (Okumkom And Apomuden)
4.4.1 Percentage Cracked Tubers
Percentage cracked tubers produced in the different treatments are shown in Table 4.17. In
the minor season (2011), there was no significant difference between Apomuden and
Okumkom in percentage cracked tubers. However, there was a general trend towards an
increase in percentage cracked tubers with Okumkon grown on amendments except 15-15-
15 kg/ha NPK + 5t/ha CM, 30-60-60 kg/ha NPK and 15-30-30 kg/ha NPK + 5t/ha CM and
the control than Apomuden. There was no significant difference between the amended and
the control plots in percentage cracked tuber (Table 4.17).
In the major season (2012), the difference between Apomuden and Okumkom was not
significant in percentage cracked tubers although there was a general trend towards an
increase in percentage cracked tubers with Okumkon grown on amendments except30-30-
30 kg/ha NPK, 30-45-45kg/ha NPK 15-23-23 kg/ha NPK + 5t/ha CM, 30-60-60 kg/ha
NPK and 15-30-30 kg/ha NPK + 5t/ha CM and the control than Apomuden. There was no
significant difference between the amended and the control plots in percentage cracked
tuber (Table 4.17).
Apomuden and Okumkom grown on amended plots except 15-15-15 kg/aNPK+5t/ha CM
and 30-45-45 kg/ha NPK plots respectively and the control produced substantially higher
percentage cracked tubers during the major season than during the minor season (Table
4.17).

119
Table 4.17: Percentage Cracked and RottenTubers During 2011 Minor Season And 2012 Major Season
Variety
Percentage Crackedtubers (%)
(minor season)Mean
Percentage Crackedtubers (%)
(major season)Mean
Percentage RottenTubers (%)(minor season)
PercentageRotten Tubers (%)(major season)
Apomud. Okumk. Apomud Okumk Apomud Okumk Mean Apomd Okumk MeanFertilizer RatesNo fertilizer
10t/ha CM
30-30-30kg/ha NPK
15-15-15 kg/ha NPK + 5t/haCM
30-45-45 kg/ha NPK
15-23-23 kg/ha NPK + 5t/haCM
30-60-60 kg/ha NPK
15-30-30 kg/ha NPK+ 5t/ha CM
0.0
4.4
2.8
9.7
5.8
5.1
7.1
3.2
7.5
8.1
3.0
8.9
9.7
5.3
2.3
0.0
3.8
6.3
2.9
9.3
7.7
5.2
4.7
1.6
8.66
13.55
14.70
7.51
12.44
11.39
12.59
16.78
11.05
13.59
12.04
11.42
6.44
7.64
9.80
11.76
9.86
13.57
13.37
9.47
9.44
9.52
11.19
14.27
0.0
6.3
6.7
0.0
2.1
3.6
2.1
0.0
0.0
0.0
6.2
3.9
4.1
3.7
3.9
0.0
0.0
3.2
6.4
1.9
3.1
3.7
3.0
0.0
2.11
0.0
2.17
0.0
0.0
0.0
2.04
0.0
0.0
0.0
0.0
0.0
0.0
0.0
0.0
0.0
1.06
0.0
1.08
0.0
0.0
0.0
1.02
0.0
Mean
LSD (P =0.05); VarietyFertilizer
Variety x Fertilizer
12.20 10.47
NSNSNS
4.8 5.6
NSNSNS
2.6 2.7
NSNSNS
0.79 0.00
NSNSNS

120
4.4.2 Percentage Rotten Tubers
Percentage of rotten tubers produced in the different treatments is presented in (Table
4.17).In the minor season (2011), there was no significant difference between Apomuden
and Okumkom in percentage cracked tubers. There was no significant difference between
the amended and the control plots in percentage cracked tuber (Table 4.17).
In the major season (2012), the difference between Apomuden and Okumkom was not
significant although there was a general trend towards increasing percentage cracked
tubers in Apomuden grown on amendments and the control than Okumkom. There was no
significant difference between the amended and the control plots in percentage cracked
tuber (Table 4.17).
4.4.3 Percentage Forked Tubers
Percentage of forked and deformed tubers produced in the different treatments is presented
in Table 4.18. In the minor season (2011), there was a significant difference between
Apomuden from Okumkom in percentage forked tubers. Apomuden grown on 30-45-45
kg/ha NPK plot had the highest percentage forked tubers (19.2 %) followed by 15-23-
23kg/ha NPK + 5t/ha CM plot (19.0 %) with the lowest recorded by 10t/ha CM (14.4 %).
Application of 15-15-15 kg/ha NPK+ 5 t/ha CM to Okumkom had the highest percentage
forked tubers (28.8 %) and the lowest recorded by the control plot (18.6 %). There was no
significant difference between the amended and the control plots in percentage forked
tubers (Table 4.18).
In the major season (2012), there was a significant difference between Apomuden and

121
Okumkom in percentage forked tubers. Apomuden grown on 15-23-23 kg/ha NPK+5t/ha
CM plot had the highest (6.47%) percentage forked tubers followed by 15-30-30 kg/ha
NPK+5t/ha CM and 15-15-15 kg/haNPK +5t/ha CM plots with zero (0.0) forked tubers
recorded by the other amended and the control plots. Okumkom grown on 15-15-15kg/ha
NPK+5t/ha CM plot had the highest (13.7 %) percent forked tubers followed by the control
plot (13.46%) with the lowest (2.84%) percentage forked tubers recorded by 15-30-
30kg/ha NPK+ 5t/ha CM treatment. There was no significant difference between the
amended and the control plots in percentage forked tubers.There was no significant
difference between the amended and the control plots in percentage forked tubers (Table
4.18).
Apomuden grown on 10t/ha CM plot had the lowest percentage forked tubers in both
seasons. Similarly, Apomuden and Okumkom grown on both amended and the control
plots during the minor season recorded substantially higher percentage forked tubers than
during the major season (Table 4.18).

122
Table 4.18: Percentage Forked and Deformed Tubers During 2011 Minor Season And 2012Major Season
Variety
Percentage Forkedtubers (%)(minor season)
Mean
Percentage Forkedtubers (%)(major season)
Mean
Percentage Deformedtubers
(%)(minor season)
PercentageDeformed tubers(%)(major season)
Apomud. Okumk. Apomud Okumk Apomud Okumk Mean Apomd Okumk MeanFertilizer RatesNo fertilizer
10t/ha CM
30-30-30kg/ha NPK
15-15-15 kg/ha NPK + 5t/haCM
30-45-45 kg/ha NPK
15-23-23 kg/ha NPK +5t/ha CM
30-60-60 kg/ha NPK
15-30-30 kg/ha NPK+ 5t/ha CM
17.5
14.4
14.7
18.7
19.2
19.0
15.9
17.0
18.6
21.4
23.0
28.8
20.4
23.3
26.7
23.3
18.1
17.9
18.8
23.8
19.8
21.1
21.3
20.2
0.0
0.0
0.0
2.30
0.0
6.47
0.0
3.03
13.46
2.99
7.73
13.69
8.49
8.30
4.43
2.84
6.73
1.50
3.86
8.00
4.25
7.38
2.21
2.94
17.2
17.0
12.0
14.8
19.2
15.6
14.0
17.0
18.3
17.5
14.5
15.2
16.3
12.0
14.8
11.9
17.7
17.2
13.3
15.0
17.7
13.8
14.4
14.5
17.78
17.41
12.66
15.30
19.19
16.06
15.16
18.72
19.05
18.82
14.53
17.07
19.57
15.34
23.34
16.77
18.42
18.17
13.60
16.19
19.38
15.70
19.25
17.75
Mean
LSD (P =0.05); VarietyFertilizer
Variety x Fertilizer
17.0 23.2
3.74NSNS
12.48 7.48
2.95NSNS
15.9 15.1
NSNSNS
16.54 18.08
NSNSNS

123
4.4.4 Percentage Deformed Tubers
The result of percentage deformed tubers produced in the different treatment is presented
in (Table 4.18). In the minor season (2011), there was no significant difference between
Apomuden and Okumkom in percentage deformed tubers. There was no significant
difference between the amended and the control plots in percentage deformed tuber (Table
4.18).
In the major season (2012), the difference between Apomuden and Okumkom was not
significant in percentage deformed tubers. There was no significant difference between the
amended and the control plots in percentage deformed tuber (Table 4.18). Okumkom
grown on amended and unamended plots during the major season produced substantially
higher percentage deformed tubers than during the minor season (Table 4.18).
4.4.5 Percentage Pest Infested Tubers
The results of percentage pests infested tubers produced in the different treatment is
presented in (Table 4.19).In the minor season (2011), there was a significant difference
between Apomuden from Okumkom in percentage pest infestedtubers.Apomuden grown
on 15-23-23 kg/ha NPK + 5t/ha CM plot had the highest (37.4%) percentage pess infested
tubers by followed by 30-45-45 kg/ha NPK and the lowest (20.1%)percentage pess
infested tubers recorded by 15-30-30kg/ha NPK + 5t/ha CM plot. The level of pest
infestation was however very severe (5) in Apomuden (Table 4.19). Okumkom grown on
15-23-23kg/ha NPK + 5t/ha CM plot had the highest (17.4%) percentage pest infested
tubers followed by 30-45-45 kg/ha NPK plot with the lowest 9.7%) percentage pest

124
infested tubers recorded by 10t/ha CM plot. The level of infestation was however slight (2)
(Table 4.19). There was no ignificant difference between amendments and the control in
percentage pest infested tubers.
In the major season (2012), there was a significant difference between Apomuden from
Okumkom in percentage pest infestedtubers.Apomuden grown on 15-30-30 kg/ha
NPK+5t/ha CM plot had the highest (25.6%) percentage pest infested tubers and the lowest
(14.3%) recorded by 10t/ha CM plot. The level of infestation was severe (4) (Table 4.19).
Okumkom grown on 15-15-15 kg/ha NPK+5t/ha CM plot had the highest (15.2%)
percentage pest infested tubers and the lowest (5.0%) recorded by the control. The level of
infestation was however slight (2) (Table 4.19). There was no significant difference in
variety x fertilizer percentage peat infeated tubers. Apomuden grown on amended and the
control plots produced substantially higherpercentage pest infested tubers than
Okumkomin both seasons. Okumkom grown on 10t/ha CM plot had the lowest percentage
pest infested tubers in both seasons. Generally, the level of pest infestation of Apomuden
and Okumkom grown on amended and control plots during the minor season was more
severe than during the major season (Table 4.19).

125
Table 4.19: Percentage Pest Infested Tubers during 2011 Minor Season and 2012Major Season
4.4.7 Percentage Sprouted Tuber at Harvest
The percentage sprouted tuber at harvest produced in the different treatments is presented
in (Table 4.20). In the minor season (2011), there was no significant difference between
Apomuden and Okumkom in percentage sprouted tubers. There was no significant
difference in variety x fertilizer interaction in percentage sprouted tuber (Table 4.20).
In the major season (2012), there was no significant difference between Apomuden and
Okumkom in percentage sprouted tubers. There was no significant differene in variety x
fertilizer interaction in percentage sprouted tuber (Table 4.20).
Variety
Percentage Pestinfested tubers (%)
(minor season)Mean
Percentage Pestinfested tubers (%)
(major season)MeanApomud. Okumk. Apomud Okumk
Fertilizer RatesNo fertilizer
10t/ha CM
30-30-30 kg/ha NPK
15-15-15 kg/ha NPK + 5t/haCM
30-45-45 kg/ha NPK
15-23-23 kg/ha NPK+ 5t/ha CM
30-60-60 kg/ha NPK
15-30-30 kg/ha NPK+ 5t/ha CM
28.8
24.1
29.6
28.3
30.1
37.4
27.4
20.1
11.2
9.7
16.0
14.4
16.9
17.4
15.7
12.1
20.0
16.9
22.8
21.3
23.5
27.4
21.6
16.1
18.2
14.3
14.7
23.8
21.4
24.9
21.6
25.6
5.0
5.3
6.1
15.2
5.8
9.2
9.6
11.5
11.6
9.8
10.4
19.5
13.6
17.0
15.6
18.5
Mean
LSD (P=0.05); VarietyFertilizer
Variety x Fertilizer
28.2 14.2
5.94NSNS
20.6 8.5
5.22NSNS

126
Table 4.20: Percentage Sprouted Tubers at Harvest During 2011 Minor Season
And 2012 Major Season
4.5 Sensory Characteristics of Cooked Tubers of Two Sweetpotato Varieties
(Apomuden and Okumkom) During the Minor season, (2011) and Major
season, (2012)
Table 4.21 shows sensory characteristics of cooked tubers of two varieties of sweetpotato
as influenced by chicken manure and inorganic fertilizer. In the minor season (2011), there
was a significant difference between Apomuden and Okumkom in terms of taste, texture,
colour, palatability and overall acceptability at harvest and after cooking. Application of
30-45-45 kg/ha NPK to Okumkom had higher (4.83) preference rating in terms of taste
than Apomuden grown on all the other amended and the control tubers (Table 4.21a).
Variety
Percentage sproutedtubers (%)(minor season)
Mean
Percentagesptoutedtubers (%)
(major season)MeanApomud. Okumk. Apomud Okumk
Fertilizer RatesNo fertilizer
10t/ha CM
30-30-30kg/ha NPK
15-15-15 kg/ha NPK + 5t/haCM
30-45-45 kg/ha NPK
15-23-23 kg/ha NPK + 5t/haCM
30-60-60 kg/ha NPK
15-30-30 kg/ha NPK + 5t/haCM
4.53
4.39
0.00
0.00
2.91
2.55
0.00
0.00
0.00
0.00
3.41
0.00
3.74
0.00
0.00
0.00
2.27
2.19
1.70
0.00
3.33
1.27
0.00
0.00
0.0
0.0
0.0
6.46
2.63
3.95
0.0
2.14
0.0
0.0
0.0
0.0
0.0
0.0
1.78
0.0
0.0
0.0
0.0
3.23
1.32
1.98
0.89
1.07
Mean
LSD (P =0.05); VarietyFertilizer
Variety x Fertilizer
1.80 0.89
NSNSNS
1.90 0.22
NSNSNS

127
Okumkom grown on 30-45-45 kg/ha NPK plot had the highest (4.17) preference with
regard to colour and the least (2.50) preference recorded by 30-30+30 kg/ha NPK. In terms
of texture, Okumkom grown on 15-15-15 kg/ha NPK + 5t/ha CM, 30-45-45 kg/ha NPK
and 15-23-23 kg/ha NPK+5t/ha CM plots produced similar and the highest (3.33)
preference compared to Apomuden. Okumkom grown on 15-23-23 kg/ha NPK+ 5t/ha CM
plot had the highest (4.17) preference and the lowest was recorded by the control (2.67)
with regard to flavour (Table 4. 21b). In terms of palatability Okumkom differed
significantly from Apomuden with 30-45-45 kg/ha NPK treatment recording the highest
preference under the amended plot except 15-23-23 kg/ha NPK+ 5t/ha CM and the control.
Overall acceptability showed that Okumkom grown on 30-45-45 kg/ha NPK was the most
preferred.Apomuden grown on 15-30-30 kg/ha NPK+ 5t/ha CM was the least accepted
during the minor season. There was no significant difference between amendment and the
comtrol tubers in terms of taste, texture, colour and flavour at harvest and after cooking
(Tables 4.21a and 4.21b).
In the major season (2012), there was a significant difference between Apomuden and
Okumkom in terms of taste, texture, colour, palatability andOverall acceptabilityat harvest
and after cooking.The overall acceptability showed that Apomuden grown on amendment
except 30-30-30 kg/ha NPK and 30-45-45 kg/ha NPK and the control differed significantly
from Okumkom with Apomuden grown on 15-15-15 kg/ha NPK+ 5t/haCM recording the
highest preference.Okumkom under 15-30-30 kg/ha NPK +5t/ha CM emerged as the
overall best acceptable tuber in terms of taste than Apomuden. Okumkom grown on
amendment except 15-23-23 kg/ha NPK+5t/haCM and 15-30-30 kg/ha NPK+ 5t/ha CM
and the control differed significantlyfrom Apomuden with regards to texture at harvest.

128
Table 4.21a: Sensory Characteristics of Cooked Apomuden and Okumkom Tubers at Harvest During The 2011 Minor
Season
.
Variety
Taste
Mean
Texture
Mean
Colour
Apomud. Okumk. Apomud Okumk Apomud Okumk MeanFertilizer RatesNo fertilizer
10t/ha CM
30-30-30 NPK
15-15-15 kg/ha NPK+ 5t/haCM
30-45-45 kg/ha NPK
15-23-23 kg/ha NPK+ 5t/ha CM
30-60-60 kg/ha NPK
15-30-30 kg/ha NPK+ 5t/ha CM
3.50
2.83
3.83
3.33
3.50
3.83
3.00
2.67
3.67
4.00
3.50
3.67
4.83
2.50
4.17
3.50
3.58
3.42
3.67
3.50
4.17
3.17
3.58
3.08
1.50
2.17
2.50
2.00
1.83
1.66
2.33
2.33
3.00
2.16
2.83
3.33
3.33
3.33
3.00
3.16
2.25
2.16
2.66
2.66
2.58
2.50
2.66
2.75
4.67
3.67
4.00
3.33
4.16
4.66
3.66
2.16
2.83
3.00
2.50
3.33
4.17
3.16
3.33
3.83
3.75
3.33
3.25
3.33
4.16
3.91
3.50
3.00
Mean
LSD (P =0.05); VarietyFertilizer
Variety x Fertilizer
3.31 3.73
0.40NS
1.13
2.04 3.02
0.27NS
0.77
3.79 3.27
0.39NS1.12

129
Table 4.21b: Sensory Characteristics of Cooked Apomuden And Okumkom Tubers at Harvest During The 2011 Minor
Season
Variety
Flavour
Mean
Palatability
Mean
Overall acceptability
Apomud. Okumk. Apomud Okumk Apomud Okumk MeanFertilizer RatesNo fertilizer
10t/ha CM
30-30-30 kg/haNPK
15-15-15 kg/haNPK + 5t/ha CM
30-45-45 kg/haNPK
15-23-23 kg/haNPK+ 5t/ha CM30-60-60 kg/haNPK
15-30-30 kg/haNPK+ 5t/ha CM
3.83
2.66
3.83
3.16
3.16
4.00
4.00
2.66
2.67
3.67
2.83
3.33
3.83
4.17
3.33
3.33
3.25
3.16
3.33
3.25
3.50
4.08
3.66
3.00
3.17
2.83
3.16
3.50
3.16
2.83
2.50
2.83
3.66
4.00
3.83
4.16
4.66
2.66
4.00
3.16
3.41
3.41
3.50
3.83
3.91
2.75
3.25
3.0
16.7
14.2
17.3
15.3
15.9
17.0
15.5
12.7
15.9
16.9
15.4
17.8
20.8
15.9
17.8
17.0
16.3
10.5
16.3
16.5
18.3
16.5
16.7
14.9
Mean
LSD (P= 0.05); VarietyFertilizer
Variety x Fertilizer
3.41 3.39
NSNS1.08
3.00 3.77
0.360.73NS
15.6 17.2
0.300.60NS

130
Apomuden and Okumkom grown on 15-23-23 kg/ha NPK+5t/ha CM emergedas most of
its qualities preferred (colour, flavour and palatability).There was no significant difference
between tubers under amendment and the comtrol in terms of taste, texture, colour and
flavor (Tables 4. 21c and 4.21d). Apomuden grown on 15-30-30 kg/ha NPK+ 5t/ha CM
was the least accepted in both seasons (Tables 4.21b and 4.21d).
4.6. Storability Studies
4.6.1 Percentage Pest Infested Tubers of Sweetpotato During the 2011 Minor and
2012 Major Seasons After 12 weeks of Storage in Ash, Grass or Pit
4.6.1.1 Percentage Pest Infested Tubers In Ash Storage
Table.4.22a shows the percentage pests infested tubers of two varieties of sweetpotato as
influenced by chicken manure, inorganic fertilizer and storage in Ash. In the minor season
(2011), tubers obtained from Apomuden and Okumkom grown on amended plots and the
control recorded zero pest infested tubers for the first 6 weeks in ash storage except in 30-
30-30 kg/ha NPK treatment which recorded (22.2%). Apomuden treated with 15-15-15
kg/ha NPK+5t/ha CM had the highest percentage pest infested tubers (49.3%) in ash
storage while Okumkom under the same treatment had no pest infested tubers at 10 and 12
weeks after storage in ash (Table. 4.22a).
In the major season (2012), both Apomuden and Okumkom tubers produced under
amended or unamended treatments and storage in Ash had zero mean value pests infested
tubers for the first 2 weeks in ash storage.

131
Table 4.21c: Sensory Characteristics of Cooked Apomuden And Okumkom Tubers at Harvest During the 2012Major
Season
Variety
Taste
Mean
Texture
Mean
Colour
Apomud. Okumk. Apomud Okumk Apomud Okumk MeanFertilizer RatesNo fertilizer
10t/ha CM
30-30-30 kg/ha NPK
15-15-15 kg/ha NPK + 5t/haCM
30-45-45 kg/ha NPK
15-23-23 kg/ha NPK +5t/ha CM
30-60-60 kg/ha NPK
15-30-30 kg/ha NPK +5t/ha CM
3.71
4.00
2.57
4.57
3.53
4.71
3.00
2.86
3.57
1.29
3.71
3.86
3.00
3.86
4.00
4.29
3.64
2.65
3.14
4.22
3.27
4.29
3.50
3.58
2.14
2.29
2.86
2.00
2.00
1.57
1.86
2.71
3.13
3.57
2.29
3.29
3.14
1.71
2.71
1.57
2.64
2.93
2.58
2.65
2.57
1.64
2.29
2.14
4.43
4.14
3.57
4.29
4.14
4.29
3.86
3.29
3.00
3.43
3.43
2.57
4.00
3.71
2.57
3.57
3.72
3.79
3.50
3.33
4.43
4.00
3.22
3.43
Mean
LSD (P =0.05); VarietyFertilizer
Variety x Fertilizer
3.63 3.44
0.40NS1.13
2.17 2.68
0.27NS0.77
4.08 3.29
0.39NS1.12

132
Table 4.21d: Sensory Characteristics of Cooked Apomuden and Okumkom Tubers at HarvestDuringthe 2012 Major
Season
Variety
Flavour
Mean
Palatability
Mean
Overall acceptability
Apomud. Okumk. Apomud Okumk Apomud Okumk MeanFertilizer RatesNo fertilizer
10t/ha CM
30-30-30 kg/haNPK
15-15-15 kg/haNPK + 5t/ha CM
30-45-45 kg/haNPK
15-23-23 kg/haNPK + 5t/ha CM
30-60-60 kg/haNPK
15-30-30 kg/haNPK+ 5t/haCM
3.29
3.86
3.00
4.00
3.43
4.14
4.14
3.00
3.14
3.29
2.86
3.43
3.71
3.29
3.00
3.57
3.22
3.58
2.93
3.72
3.57
3.72
3.57
3.29
4.14
3.29
2.57
4.71
3.43
4.71
3.43
2.71
3.57
3.43
3.86
3.86
3.00
4.14
3.71
4.57
3.86
3.36
3.22
4.29
3.22
4.43
3.57
3.64
17.6
17.6
14.7
19.6
16.4
19.4
16.3
14.6
16.4
15.0
16.2
17.1
16.8
16.7
16.0
14.1
17.0
8.3
15.5
18.3
16.6
18.0
16.2
14.3
Mean
LSD (P =0.05); VarietyFertilizer
Variety x Fertilizer
3.60 3.29
NSNS
1.08
3.62 3.76
0.361.12NS
17.0 16.0
0.301.270.85

133
However, application of 10t/ha CM, 15-15-15 kg/ha NPK+5t/ha CM or 15-30-30 kg/ha
NPK+5t/ha CM to Apomuden and storage in Ash had the highest percentage pest infested
tubers at the first 8 WAS with the lowest recorded by unamended tubers (Table. 4.22b).
Okumkom treated with 15-23-23kg/ha NPK +5t/ha CM and 15-30-30 kg/haNPK+5t/ha
CM and storage in Ash produced the highest percentage pest infested tubers (52.2%) with
the lowest recorded by 10t/ha CM and the control tubers. However, 30-30-30 kg/ha NPK
and 30-45-45 kg/ha NPK and the control tubers of Apomuden and Okumkom stored in
Ash recorded the same percentage pests infested tubers at 8 WAS (Table 4.22b).
Apomuden produced on 15-23-23 kg/ha NPK +5t/ha CM and stored in Ash had the highest
percentage pest infested tubers while the lowest was recorded by 30-60-60 kg/ha NPK
treated tubers at 12 WAS. However, Okumkom grown on 10t/ha CM and 30-30-30 kg/ha
NPK plots had the highest percentage pest infested tubers at 12 WAS in Ash storage.
Tubers of Okumkom grown on the other fertilizer treatments except 15-15-15kg/ha NPK
+5t/ha CM had the same mean (52.2%) percentage pest infested tubers at 12 WAS in Ash
storage (Table. 4.22b). A significant difference occurred in variety x fertilizer interaction
in percentage pest infested tubers in Ash storage 12 WAS in both seasons (Tables. 4.22a
and 4.22b).

134
Table 4.22a: Percentage Pest Infested Tubers in Ash Storage During the 2011 Minor Season
VarietyWeek 2
Mean
Week 4
Mean
Week 6
Mean
Week 8
Mean
Week 10
Mean
Week 12
MeanApomud. Okumk. Apomud. Okumk. Apomud. Okumk. Apomud. Okumk. Apomud. Okumk. Apomud. Okumk.Fertilizer rate
T 1
T 2
T 3
T 4
T 5
T 6
T 7
T 8
0.0
0.0
0.0
0.0
0.0
0.0
0.0
0.0
0.0
0.0
0.0
0.0
0.0
0.0
0.0
0.0
0.0
0.0
0.0
0.0
0.0
0.0
0.0
0.0
0.0
0.0
0.0
0.0
0.0
0.0
0.0
0.0
0.0
0.0
0.0
0.0
0.0
0.0
0.0
0.0
0.0
0.0
0.0
0.0
0.0
0.0
0.0
0.0
0.0
0.0
0.0
0.0
0.0
0.0
0.0
0.0
0.0
0.0
22.2
0.0
0.0
0.0
0.0
0.0
0.0
0.0
11.1
0.0
0.0
0.0
0.0
0.0
22.4
0.0
0.0
32.2
22.4
22.4
40.5
32.4
0.0
22.4
32.4
0.0
0.0
0.0
32.4
22.4
11.2
11.2
16.2
16.1
11.2
11.2
36.4
27.4
40.5
32.3
0.0
49.3
40.4
32.3
40.6
32.3
22.4
32.4
32.5
0.0
32.3
32.4
49.3
32.4
31.5
32.4
16.2
24.6
36.3
32.3
44.9
32.4
40.4
32.3
0.0
49.3
40.4
32.3
40.6
32.4
22.3
32.4
32.3
0.0
32.2
32.2
49.2
32.4
31.4
32.3
16.1
24.6
36.3
32.3
44.9
32.4
Mean 0.0 0.0 0.0 0.0 0.0 2.7 21.5 13.7 33.4 29.2 33.4 29.1
LSD (P = 0.05); Variety = 0.0 0.0 0.2 0.5 0.5 0.6Fertilizer = 0.0 0.0 0.4 1.1 1.1 1.3
Variety x Fertilizer = 0.0 0.0 0.6 1.5 1.5 1.9
T 1 - No fertilizer T5 - 30-45-45 kg/ha NPK
T 2 - 10t/ha CM T6 - 15-23-23 kg/ha NPK +5t/ha CM
T3 - 30-30-30 kg/ha NPK T7 - 30-60-60 kg/ha NPK
T 4 - 15-15-15 kg/ha NPK + 5t/ha CM T8 - 15-30-30 kg/ha NPK + 5t/ha CM

135
Table 4.22b: Percentage Pest Infested Tubers in Ash Storage During the 2012 Major Season
VarietyWeek 2
Mean
Week 4
Mean
Week 6
Mean
Week 8
Mean
Week 10
Mean
Week 12
MeanApomud. Okumk. Apomud. Okumk. Apomud. Okumk. Apomud. Okumk. Apomud. Okumk. Apomud. Okumk.Fertilizer rate
T 1
T 2
T 3
T 4
T 5
T 6
T 7
T 8
0.0
0.0
0.0
0.0
0.0
0.0
0.0
0.0
0.0
0.0
0.0
0.0
0.0
0.0
0.0
0.0
0.0
0.0
0.0
0.0
0.0
0.0
0.0
0.0
0.0
0.0
0.0
20.7
30.0
0.0
20.7
30.0
20.7
0.0
0.0
0.0
0.0
30.0
0.0
20.7
10.3
0.0
0.0
10.3
15.0
15.0
10.3
25.3
20.7
37.7
20.7
20.7
30.0
0.0
20.7
30.0
20.7
0.0
0.0
0.0
0.0
30.0
0.0
45.0
20.7
18.8
10.3
10.3
15.0
15.0
10.3
37.5
20.7
45.0
30.0
45.0
37.7
45.0
30.0
45.0
20.7
20.7
30.0
30.0
37.7
52.2
37.7
52.2
20.7
32.8
30.0
37.5
37.7
48.6
33.8
48.6
37.7
45.0
30.0
45.0
37.7
69.2
30.0
45.0
45.0
60.0
60.0
52.2
37.7
52.2
52.2
52.2
41.3
52.5
45.0
48.6
37.7
60.7
41.1
48.6
52.2
60.0
45.0
45.0
45.0
69.2
30.0
45.0
60.0
69.2
69.2
60.0
52.2
52.2
52.2
52.2
56.1
64.6
57.1
52.5
48.6
60.7
41.1
48.6
Mean 0.0 0.0 12.6 8.9 22.5 11.9 37.3 35.1 42.4 51.4 48.9 58.4
LSD (P = 0.05); Variety = 0.0 0.38 0.48 0.59 0.60 0.59Fertilizer = 0.0 0.77 0.96 1.17 1.20 1.17
Variety x Fertilizer = 0.0 0.09 0.36 1.66 1.70 1.60
T 1 - No fertilizer T5 - 30-45-45 kg/ha NPK
T 2 - 10t/ha CM T6 - 15-23-23 kg/ha NPK +5t/haCM
T3 - 30-30-30 kg/ha NPK T7 - 30-60-60 kg/ha NPK
T 4 - 15-15-15 kg/ha NPK + 5t/ha CM T8 - 15-30-30 kg/ha NPK + 5t/ha CM

136
4.6.1.2 Percentage Pest Infested Tubers in Grass Storage
The results of percentage pests infested tubers of two varieties of sweetpotato as influenced
by chicken manure and inorganic fertilizers and storage in Grass are presented in Table 4.
23. In the minor season (2011), Apomuden grown on 15-30-30 kg/ha NPK+ 5t/ha CM had
the highest percentage pest infested tubers (32.4%) for the first 4 weeks in Grass storage
followed by 15-15-15kg/ha NPK+5t/ha CM treatrment (22.4%) with zero pest infestation
recorded by 30-45-45 kg/ha NPK. There were significant differences in variety x fertilizer
interaction in percentage pests infested tubers under grass storage and for amended and
unamended plots (Table 4.23a). There was no significant difference between Apomuden
and Okumkom stored in grass in percentage pest infestion at 12 WAS.There was a
significantdifference in variety x fertilizer interaction in percentage pests infested tubers at
12 WAS in grass storage (Table 4. 23a).
In the major season (2012), application of amended and unamended treatments to
Apomuden and Okumkom and storage in grass for the first 2 weeks recorded zero values
for pest infestation in the tubers (Table. 4.23b). Application of 10t/ha CM, 30-30-30 kg/ha
NPK and 30-45-45 kg/ha NPK to Apomuden produced the highest percentage pest infested
tubers (20.7%) for the first 6 WAS in grass storage with other amended and unamended
tubers recording zero values pest infestation for the same period. However, 15-15-15kg/ha
NPK +5t/ha CM treated tubers recorded the highest percentage pest infested tubers
followed by 15-23-23 kg/ha NPK +5t/ha CM, 15-30-30kg/ha NPK+5t/ha CM and tubers
from unamended treatment with the lowest recorded by tubers produced on the other
amendment treatments for the first 6 WAS in grass storage (Table. 4.23b). Similarly,
Apomuden treated with 15-23-23 kg/ha NPK +5t/ha CM had the highest percentage pest

137
infested tubers (60.0%) with the lowest recorded by 30-45-45 kg/ha NPK (20.7%) at 12
WAS in grass storage. However, tubers of Okumkom from all amended treatments had the
highest and the same percentage pest infested tubers (69.2%) except 15-23-23kg/ha NPK
+5t/ha CM and 15-30-30kg/ha NPK +5t/ha CM treated tubers which recorded the lowest
(52.2%) at 12 WAS in grass storage. There was significant difference in variety x fertilizer
interaction in percentage pests infested tubers at 12 WAS in grass storage (Table. 4.23b).
4.6.1.3 Percentage Pest Infested Tubers in Pit Storage During the Minor and
Major Seasons
The percentage pest infested tubers of two varieties of sweetpotato under chicken manure
and inorganic fertilizers or storage in pit is presented in Table. 4.24. In the minor season
(2011), Apomuden raised on the control plot produced the highest (22.4%) percent pest
infested tubers followed by 30-45-45 kg/ha NPK and 30-60-60 kg/ha NPK (22.3%) which
differed significantly from other amended tubers in percentage pest infested tubers for the
first 4 WAS in pit storage (Table 4.24a). In the case of Okumkom tubers raised on
unamended plot had the highest pest infested tubers (32.5%) and differed significantly
from tubers from all the amended plots for the first 4 weeks in pit storage. Application of
15-30-30 kg/ha NPK +5t/ha CM or 15-23-23kg/ha NPK+5tlha CM to Apomuden differed
significantly from other amended and the control raised tubers for the first 8 WAS in pti
storage . However, Okumkom raised on control plot had the highest pest infested tubers
(40.59%) and differed significantly from the amended plots raised tubers for the first 8
WAS in pit (Table 4.24a).

138
Table 4.23a: Percentage Pest Infested Tubers In Grass Storage During The 2011Minor Season
VarietyWeek 2
Mean
Week 4
Mean
Week 6
Mean
Week 8
Mean
Week 10
Mean
Week 12
MeanApomud. Okumk. Apomud. Okumk. Apomud. Okumk. Apomud. Okumk. Apomud. Okumk. Apomud. Okumk.
Fertilizer rate
T 1
T 2
T 3
T 4
T 5
T 6
T 7
T 8
0.0
0.0
0.0
0.0
0.0
0.0
0.0
32.5
0.0
0.0
0.0
0.0
0.0
0.0
0.0
0.0
0.0
0.0
0.0
0.0
0.0
0.0
0.0
16.2
0.0
0.0
0.0
22.4
0.0
0.0
0.0
32.4
0.0
0.0
0.0
0.0
0.0
0.0
0.0
0.0
10.3
0.0
0.0
10.3
15.0
15.0
10.3
25.3
22.4
32.4
22.4
22.4
0.0
22.4
22.3
32.4
22.4
0.0
22.4
0.0
0.0
0.0
22.4
22.3
22.4
16.2
22.4
11.2
0.0
11.2
22.3
27.4
22.4
32.4
32.5
32.5
32.4
32.3
22.3
32.4
22.3
0.0
22.3
22.3
22.2
32.4
32.3
22.4
22.3
16.2
27.4
27.4
27.3
32.3
27.3
27.4
32.3
32.4
32.4
40.4
32.3
40.4
40.4
32.3
40.4
22.5
49.2
32.4
32.4
32.3
49.2
22.4
36.4
27.4
40.8
36.4
32.4
36.4
44.8
27.3
32.4
32.2
32.4
40.5
32.3
40.5
40.5
32.4
40.5
22.4
49.3
32.4
32.3
32.4
49.3
22.3
36.5
27.3
40.9
36.4
32.3
36.5
44.9
27.3
Mean 4.0 0.0 6.8 0.0 22.1 11.2 29.9 22.0 35.4 35.1 35.4 35.1
LSD (P = 0.05); Variety = 0.10 0.20 0.40 0.60 NS NSFertilizer = 0.30 0.40 0.90 1.30 1.20 1.60
Variety x Fertilizer = 0.50 0.60 1.30 1.90 1.80 2.30
T 1 - No fertilizer T5 - 30-45-45 kg/ha NPK
T 2 - 10t/ha CM T6 - 15-23-23 kg/ha NPK +5t/haCM
T3 - 30-30-30 kg/ha NPK T7 - 30-60-60 kg/ha NPK
T 4 - 15-15-15 kg/ha NPK + 5t/ha CM T8 - 15-30-30 kg/ha NPK + 5t/ha CM
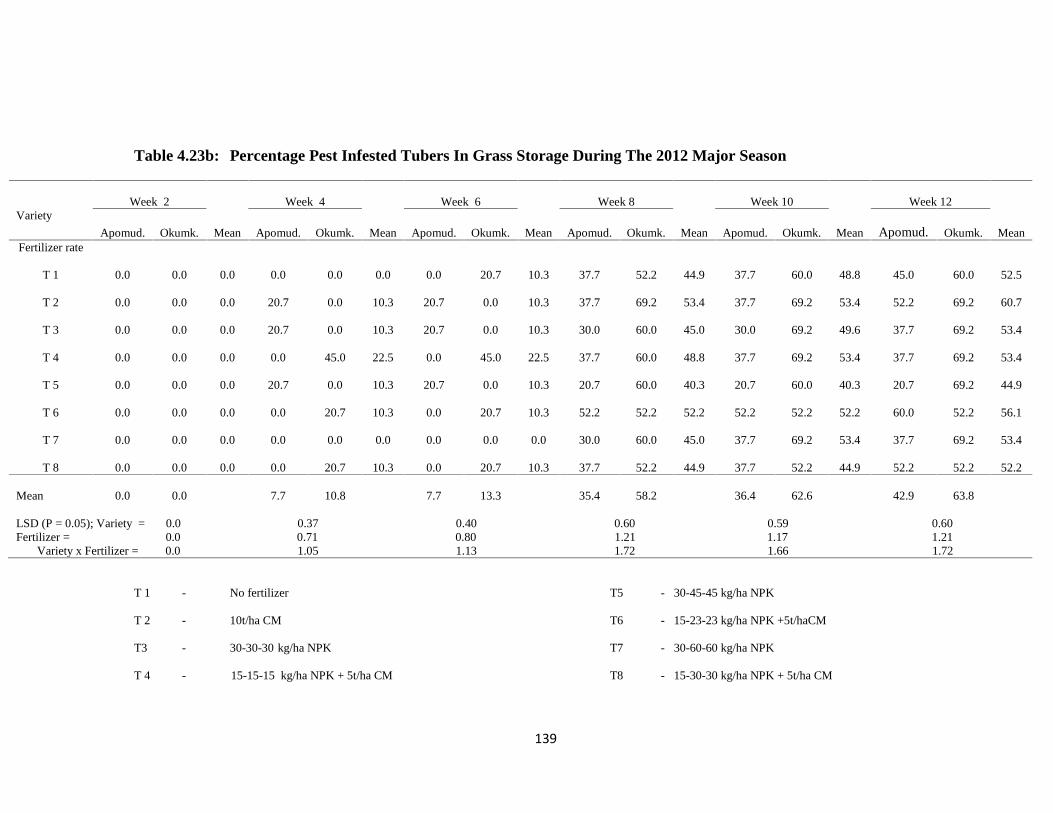
139
Table 4.23b: Percentage Pest Infested Tubers In Grass Storage During The 2012 Major Season
VarietyWeek 2
Mean
Week 4
Mean
Week 6
Mean
Week 8
Mean
Week 10
Mean
Week 12
MeanApomud. Okumk. Apomud. Okumk. Apomud. Okumk. Apomud. Okumk. Apomud. Okumk. Apomud. Okumk.Fertilizer rate
T 1
T 2
T 3
T 4
T 5
T 6
T 7
T 8
0.0
0.0
0.0
0.0
0.0
0.0
0.0
0.0
0.0
0.0
0.0
0.0
0.0
0.0
0.0
0.0
0.0
0.0
0.0
0.0
0.0
0.0
0.0
0.0
0.0
20.7
20.7
0.0
20.7
0.0
0.0
0.0
0.0
0.0
0.0
45.0
0.0
20.7
0.0
20.7
0.0
10.3
10.3
22.5
10.3
10.3
0.0
10.3
0.0
20.7
20.7
0.0
20.7
0.0
0.0
0.0
20.7
0.0
0.0
45.0
0.0
20.7
0.0
20.7
10.3
10.3
10.3
22.5
10.3
10.3
0.0
10.3
37.7
37.7
30.0
37.7
20.7
52.2
30.0
37.7
52.2
69.2
60.0
60.0
60.0
52.2
60.0
52.2
44.9
53.4
45.0
48.8
40.3
52.2
45.0
44.9
37.7
37.7
30.0
37.7
20.7
52.2
37.7
37.7
60.0
69.2
69.2
69.2
60.0
52.2
69.2
52.2
48.8
53.4
49.6
53.4
40.3
52.2
53.4
44.9
45.0
52.2
37.7
37.7
20.7
60.0
37.7
52.2
60.0
69.2
69.2
69.2
69.2
52.2
69.2
52.2
52.5
60.7
53.4
53.4
44.9
56.1
53.4
52.2
Mean 0.0 0.0 7.7 10.8 7.7 13.3 35.4 58.2 36.4 62.6 42.9 63.8
LSD (P = 0.05); Variety = 0.0 0.37 0.40 0.60 0.59 0.60Fertilizer = 0.0 0.71 0.80 1.21 1.17 1.21
Variety x Fertilizer = 0.0 1.05 1.13 1.72 1.66 1.72
T 1 - No fertilizer T5 - 30-45-45 kg/ha NPK
T 2 - 10t/ha CM T6 - 15-23-23 kg/ha NPK +5t/haCM
T3 - 30-30-30 kg/ha NPK T7 - 30-60-60 kg/ha NPK
T 4 - 15-15-15 kg/ha NPK + 5t/ha CM T8 - 15-30-30 kg/ha NPK + 5t/ha CM

140
Apomuden grown on 15-30-30 kg/ha NPK + 5t/ha CM had the highest percentage pest
infested tubers (49.3%) and differed significantly from the control treatment raised tubers
at 12 WAS. Similarly, Apomuden raised on amended plots gave higher percentage pest
infested tubers than Okumkom at 12 WAS in pit storage (Table. 4.24a).
In the major season (2012), application of 10t/ha CM 15-15-15 kg/ha NPK+5t/ha CM to
Apomuden differed significantly from tubers from all the other amended and the control
tubers in pest infested tubers for the first 4 WAS (Table 4.24b). Okumkom raised on 15-
15-15 kg/ha NPK+5t/ha CM or 15-30-30 kg/ha NPK+5t/ha CM had the highest percentage
pest infested tubers (45.0%) and differed significantly from the other amended and the
control tubers in pest infested tubers at the first 4 WAS in pit (Table. 4.12b). At 6 weeks
after pit storage, application of the treatments namely 10t/ha CM, 15-15-15 kg/ha
NPK+5t/ha CM and 15-23-23 kg/ha NPK+5t/ha CM to Apomuden had the same mean
percent infestation as which was the highest percentage pest infested tubers (52.2%) with
the least recorded by control raised tubers. Amended tubers of Apomuden differed
significantly from control tubers in percentage pest infested tubers at 6 WAS. However,
application of 15-15-15kg/ha NPK+5t/ha CM or 30-45-45kg/ha NPK to Okumkom
produced the highest percentage pest infested tubers at the first 6 WAS in pit storage with
zero values pest infestation recorded by 10t/ha CM and 15-23-23kg/ha NPK+5t/ha CM
treated tubers. Application of 15-30-30kg/ha NPK+5t/ha CM to both Apomuden and
Okumkom resulted in the same percentage pests infested tubers at 6 WAS under pit
storage (Table. 4.24b).Application of 15-23-23 kg/ha NPK+5t/ha CM to Apomuden
produced the highest percentage pest infested tubers (69.2%) with the lowest recorded by
30-60-60 kg/ha NPK, 15-30-30 kg/ha NPK+5t/ha CM and control raised tubers at 12 WAS

141
in pit storage. However, 30-45-45 kg/ha NPK raised tubers of Okumkom recorded the
highest percentage pest infested tubers (69.2%) followed by 15-15-15kg/ha NPK+5t/ha
CM treated tubers (60.0%) with zero values infestation recorded by 10t/ha CM and 15-23-
23 kg/ha NPK+5t/ha CM treated tubers at 12 WAS in pit storage. There was significant
difference in variety x fertilizer interaction in percentage pest infested tubers at 12 WAS in
pit storage (Table. 4.24b). Generally, Apomuden and Okumkom grown on amended and
control plots in the major season (2012) and stored under the three storage conditions
(Ash, Grass and Pit) had substantially higher percentage pest infested tubers at 12 WAS
than plants grown during the minor season in 2011 for both varieties and stored under
similar conditions. In both seasons, Okumkom treated with 10t/ha CM and stored in pit
had the lowest percentage pest infested tubers at 12 WAS. Generally, Apomuden grown
under soil amendment and stored in pit had the highest percentage pest infested tubers
followed by ash storage with the leastpercent infestation recorded by grass storage at 12
WAS in both seasons (Tables. 4.24a and 4.24b).
4.6.2.1 Percentage Shrinkage in Tubers Stored in Ash During The Minor And
Major Seasons
Table 4.25 shows percentage shrinkage in tubers of two sweetpotato varieties stored for 12
weeks in Ash. In the minor season (2011), Apomuden treated with 10t/ha CM had the
highest percentage shrinkage in tubers (32.5%) followed by the control and 30-30-30 kg/ha
NPK tubers (32.4%) for the first 4 weeks in ash storage with the least recorded by 15-23-
23 kg/ha NPK+ 5t/ha CM and 30-60-60 kg/ha NPK treated tubers with zero value percent
shrinkage (Table 4.25a).

142
Table 4.24a: Percentage Pest Infested Tubers in Pit Storage During the 2011 Minor Season
VarietyWeek 2
Mean
Week 4
Mean
Week 6
Mean
Week 8
Mean
Week 10
Mean
Week 12
MeanApomud. Okumk. Apomud. Okumk. Apomud. Okumk. Apomud. Okumk. Apomud. Okumk. Apomud. Okumk.Fertilizer rate
T 1
T 2
T 3
T 4
T 5
T 6
T 7
T 8
0.0
0.0
0.0
0.0
0.0
0.0
22.5
0.0
0.0
0.0
0.0
0.0
0.0
0.0
0.0
0.0
0.0
0.0
0.0
0.0
0.0
0.0
11.2
0.0
22.4
0.0
0.0
0.0
22.3
0.0
22.3
0.0
32.5
0.0
0.0
0.0
22.4
0.0
22.5
0.0
27.4
0.0
0.0
0.0
22.3
0.0
22.4
0.0
32.5
32.5
21.9
22.4
32.4
22.4
22.3
32.3
32.4
0.0
0.0
22.2
22.2
22.3
22.3
22.5
32.4
16.1
10.9
22.3
27.3
22.3
22.3
27.4
32.4
32.3
22.4
32.3
32.4
40.4
32.4
40.4
40.5
0.0
22.6
32.4
32.4
22.4
32.4
22.4
36.5
16.1
22.5
32.4
32.4
31.4
32.4
31.4
32.4
32.3
22.4
57.4
40.5
40.5
40.4
49.3
40.4
22.4
32.5
32.3
32.3
40.5
32.5
32.4
36.4
27.3
27.5
44.8
36.4
40.5
36.4
40.8
32.4
32.4
22.4
57.4
40.4
40.4
40.5
49.3
40.5
22.3
32.5
32.4
32.2
40.5
32.3
32.4
36.4
27.3
27.4
44.9
36.3
40.4
36.4
40.8
Mean 2.8 0.0 8.3 9.6 27.3 18.0 33.1 25.6 39.4 33.2 39.4 33.1
LSD (P =0.05); Variety = 0.09 0.30 0.60 0.60 0.50 0.50Fertilizer = 0.18 0.70 1.30 1.30 1.00 1.10
Variety x Fertilizer = 0.25 1.00 1.90 1.90 1.40 1.60
T 1 - No fertilizer T5 - 30-45-45 kg/ha NPK
T 2 - 10t/ha CM T6 - 15-23-23 kg/ha NPK +5t/haCM
T3 - 30-30-30 kg/ha NPK T7 - 30-60-60 kg/ha NPK
T 4 - 15-15-15 kg/ha NPK + 5t/ha CM T8 - 15-30-30 kg/ha NPK + 5t/ha CM

143
Table 4.24b: Percentage Pest Infested Tubers in Pit Storage During the 2012 Major Season
VarietyWeek 2
Mean
Week 4
Mean
Week 6
Mean
Week 8
Mean
Week 10
Mean
Week 12
MeanApomud. Okumk. Apomud. Okumk. Apomud. Okumk. Apomud. Okumk. Apomud. Okumk. Apomud. Okumk.Fertilizer rate
T 1
T 2
T 3
T 4
T 5
T 6
T 7
T 8
30.0
45.0
30.0
45.0
37.7
30.0
37.7
37.7
20.7
0.0
0.0
20.7
30.0
0.0
30.0
37.0
25.3
22.5
15.0
32.8
33.8
15.0
33.8
37.3
30.0
52.2
37.7
52.2
37.7
30.0
45.0
37.7
20.7
0.0
0.0
45.0
37.7
0.0
30.0
45.0
25.3
26.1
18.8
48.6
37.7
15.0
37.5
41.3
37.7
52.2
45.0
52.2
45.0
52.2
45.0
45.0
45.0
0.0
37.7
60.0
60.0
0.0
37.7
45.0
41.3
26.1
41.3
56.1
52.5
26.1
41.3
45.0
37.7
52.2
45.0
52.2
45.0
52.2
45.0
45.0
45.0
0.0
37.7
60.0
60.0
0.0
37.7
45.0
41.3
26.1
41.3
56.1
52.5
26.1
41.3
45.0
45.0
52.2
60.0
52.1
52.2
69.2
45.0
45.0
45.0
0.0
45.0
60.0
69.2
0.0
52.2
45.0
45.0
26.1
52.5
56.0
60.7
34.6
48.6
45.0
45.0
52.2
60.0
52.1
52.2
69.2
45.0
45.0
45.0
0.0
45.0
60.0
69.2
0.0
52.2
45.0
45.0
26.1
52.5
56.0
60.7
34.6
48.6
45.0
Mean 36.6 17.3 40.3 22.3 46.7 35.6 46.7 35.6 52.6 39.5 52.6 39.5
LSD (P =0.05); Variety = 0.52 0.54 0.48 0.48 0.56 0.56Fertilizer = 1.05 1.09 0.96 0.96 1.12 1.12
Variety x Fertilizer = 1.49 1.54 1.36 1.36 1.59 1.59
T 1 - No fertilizer T5 - 30-45-45 kg/ha NPK
T 2 - 10t/ha CM T6 - 15-23-23 kg/ha NPK +5t/ha CM
T3 - 30-30-30 kg/ha NPK T7 - 30-60-60 kg/ha NPK
T 4 - 15-15-15 kg/ha NPK + 5t/ha CM T8 - 15-30-30 kg/ha NPK + 5t/ha CM

144
Okumkom on control plot gave the highest percentage shrinkage in tubers (49.3%) in ash
storage and the least recorded by 30-30-30 kg/ha NPK treated tubers for the first 4 weeks
in ash storage. In the case of Apomuden under 30-60-60 kg/ha NPK treated tubers
recorded had the highest percentage shrinkage (49.3%) while the least was recorded by 15-
30-30 kg/ha NPK +5t/ha CM tubers at 12 weeks storage in ash. However, at 12 WAS the
control raised tubers of Okumkom had the highest percentage shrinkage was tubers
(67.3%) and the least.shrinkage recorded by 15-15-15 kg/ha NPK +5t/ha CM (49.1%).
There was a significant difference in variety x fertilizer interaction in percentage shrinkage
tuber in ash storage at 12 WAS (Table.4.25a).
In the major season (2012), 30-30-30 kg/ha NPK and the control raised tubers of
Apomuden gave the highest percentage shrinkage in tubers (30.0%) at the first 4 weeks in
ash storage with the least recorded by all other amended plots (20.7%) except 15-15-15
kg/ha NPK+5t/ha CM and 15-23-23 kg/ha NPK +5t/ha CM tubers which recorded zero
values percent tuber shrinkage (Table 4.25b). At 8 weeks in ash storage, Apomuden raised
on amended plots had the highest and the same percentage shrinkage in tubers (30.0%)
except 15-15-15 kg/ha NPK +5t/ha CM and the control which recorded the same and the
least percent shrinkage (20.7%). Similarly, Okumkom raised on 15-15-15 kg/ha
NPK+5t/ha CM and 15-30-30 kg/ha NPK+5t/ha CM treatments had the highest
percentage tuber shrinkage at the first 8 weeks in ash storage with the least recorded
bytubers from all the other amended treatments except 30-45-45 kg/ha NPK and the
control plots which recorded zero value tuber shrinkage. Application of 10t/ha CM, 15-15-
15 kg/ha NPK+5t/ha CM and 15-30-30 kg/ha NPK+5t/ha CM to Apomuden showed the
highest percentage shrinkage in tubers (45.0%) at 12 weeks in ash storage with the lowest

145
recorded by 30-60-60 kg/ha NPK and 30-30-30 kg/ha NPK plots (30.0%). Similarly,
application of 10t/ha CM to Okumkom produced the highest percentage shrinkage in
tubers (69.3%) followed by 15-15-15 kg/ha NPK+5t/ha CM and the control raised tubers
with (60.0%) shrinkage ant the lowest recorded by 30-45-45 kg/ha NPK raised tubers
(37.7%) at 12 weeks in ash storage. Application of 30-45-45 kg/ha NPK to Apomuden and
Okumkom produced the same and lowest percentage tuber shrinkage at 12 weeks in ash
storage (37.7%). There was significant difference in variety x fertilizer interaction in
percentage tuber shrinkage at 12 weeks in ash storage (Table 4.25b).
4.6.2.2 Percentage Shrinkage Tubers in Grass storage
Table 4.26 shows percentage shrinkage in tubers of two sweetpotato varieties as influenced
by chicken manure and inorganic fertilizersa nd storage for 12 weeks in grass. In the minor
season (2011), Apomuden raised on15-30-30 kg/ha NPK +5t/ha had the highest percentage
shrinkage in tuber (32.5%) and differed from other amended tubers except 30-60-60 kg/ha
NPK and the control tubers for the first 4 weeks in grass storage (Table 4.26a). Okumkom
raised on 30-45-45 kg/haNPK had the highest percentage shrinkage of tubers (47.2%) and
differed significantly from all the amended and the control treated tubers for the first 4
weeks in grass storage. At 12 WAS Apomuden raised on 30-60-60kg/ha NPK had the
highest percentage shrinkage in tubers (49.3%) with the lowest recorded by 30-30-30kg/ha
NPK plot (32.4%) in grass storage. Okumkom raised on 10t/ha CM had the highest
percentage shrinkage in tubers (57.4%) and differed significantly from other amended
tubers except 30 60-60 kg/ha NPK and the control tubers in percentage shrinkage at 12
WAS.

146
Table 4.25a: Percentage Shrinkage Tubers in Ash Storage During the 2011 Minor Season
VarietyWeek 2
Mean
Week 4
Mean
Week 6
Mean
Week 8
Mean
Week 10
Mean
Week 12
MeanApomud. Okumk. Apomud. Okumk. Apomud. Okumk. Apomud. Okumk. Apomud. Okumk. Apomud. Okumk.Fertilizer rate
T 1
T 2
T 3
T 4
T 5
T 6
T 7
T 8
32.2
22.4
22.4
0.0
0.0
0.0
0.0
0.0
40.4
32.3
0.0
32.4
0.0
0.0
0.0
22.3
36.3
27.3
11.2
16.2
0.0
0.0
0.0
11.1
32.4
32.5
32.4
0.0
22.4
0.0
0.0
0.0
49.3
40.4
0.0
40.5
22.4
22.4
22.4
40.6
40.8
36.4
16.2
20.2
22.4
11.2
11.2
20.3
40.4
32.2
32.2
32.4
22.2
22.2
22.2
0.0
57.3
57.3
40.6
49.3
32.5
49.2
32.4
40.4
48.8
44.8
36.4
40.8
27.3
35.7
27.3
20.2
40.4
32.5
40.3
32.3
32.3
22.4
40.5
22.3
67.3
57.4
57.3
49.2
40.4
40.5
40.4
49.2
53.9
44.9
48.8
40.7
36.4
31.5
40.4
35.7
40.5
32.2
40.4
32.3
41.5
32.2
49.1
22.2
67.3
57.5
57.3
49.3
49.3
57.3
57.4
49.4
53.9
44.8
48.9
40.8
45.4
44.7
53.2
35.8
40.4
32.4
40.4
32.2
40.4
32.2
49.3
22.4
67.3
57.3
57.3
49.1
49.3
57.4
57.4
49.2
53.9
44.8
48.9
40.7
44.9
44.8
53.3
35.8
Mean 9.6 15.9 14.9 29.7 25.5 44.9 32.9 50.2 36.3 55.6 36.2 55.6
LSD (P = 0.05); Variety = 0.40 0.40 0.40 0.50 0.50 0.70Fertilizer = 0.80 0.80 0.90 1.10 1.10 1.40
Variety x Fertilizer = 1.20 1.20 1.30 1.50 1.60 2.00
T 1 - No fertilizer T5 - 30-45-45 kg/ha NPK
T 2 - 10t/ha CM T6 - 15-23-23 kg/ha NPK +5t/haCM
T3 - 30-30-30 kg/ha NPK T7 - 30-60-60 kg/ha NPK
T 4 - 15-15-15 kg/ha NPK + 5t/ha CM T8 - 15-30-30 kg/ha NPK + 5t/ha CM

147
Table 4.25b: Percentage Shrinkage Tubers in Ash Storage During ihe 2012 Major Season
VarietyWeek 2
Mean
Week 4
Mean
Week 6
Mean
Week 8
Mean
Week 10
Mean
Week 12
MeanApomud. Okumk. Apomud. Okumk. Apomud. Okumk. Apomud. Okumk. Apomud. Okumk. Apomud. Okumk.Fertilizer rate
T 1
T 2
T 3
T 4
T 5
T 6
T 7
T 8
0.0
0.0
0.0
0.0
0.0
0.0
0.0
0.0
0.0
0.0
0.0
0.0
0.0
0.0
0.0
0.0
0.0
0.0
0.0
0.0
0.0
0.0
0.0
0.0
30.0
20.7
30.0
0.0
20.7
0.0
20.7
20.7
0.0
0.0
0.0
0.0
0.0
20.7
0.0
30.0
15.0
10.3
15.0
0.0
10.3
10.3
10.3
25.3
30.0
30.0
30.0
20.4
20.7
30.0
20.7
20.7
0.0
0.0
20.7
20.7
0.0
20.7
0.0
30.0
15.0
15.0
25.3
20.6
10.3
25.3
10.3
25.3
37.7
30.0
30.0
20.7
30.0
30.0
30.0
30.0
20.7
20.7
20.7
30.0
0.0
20.7
20.7
30.0
29.2
25.3
25.3
25.3
15.0
25.3
25.3
30.0
37.7
45.0
30.0
45.0
37.7
37.7
30.0
45.0
60.0
69.2
52.2
60.0
37.7
52.2
52.2
52.2
48.8
57.1
41.1
52.5
37.7
45.0
41.1
48.6
37.7
45.0
30.0
45.0
37.7
37.7
30.0
45.0
60.0
69.3
52.2
60.0
37.7
52.3
52.2
52.2
48.8
57.1
41.1
52.5
37.7
45.0
41.1
48.6
Mean 0.0 0.0 17.8 6.3 25.3 11.5 29.8 20.4 38.5 54.4 38.5 544
LSD (P = 0.05); Variety = 0.0 0.42 0.56 0.56 0.59 0.60Fertilizer = 0.0 0.85 1.13 1.13 1.18 1.21
Variety x Fertilizer = 0.0 1.20 1.59 1.59 1.68 1.71
T 1 - No fertilizer T5 - 30-45-45 kg/ha NPK
T 2 - 10t/ha CM T6 - 15-23-23 kg/ha NPK +5t/ha CM
T3 - 30-30-30 kg/ha NPK T7 - 30-60-60 kg/ha NPK
T 4 - 15-15-15 kg/ha NPK + 5t/ha CM T8 - 15-30-30 kg/ha NPK + 5t/ha CM

148
Apomuden and Okumkom raised on amended and the control plots differed significantly in
variety x fertilizer interaction in percentage tuber shrinkage at 12 weeks in grass storage
(Table 4.26a).
In the major season (2012), Apomuden raised on 30-60-60 kg/ha NPK differed
significantly from the other amended and the control plots in percentage tuber shrinkage
during the first 4 weeks (Table 4.26b). Okumkom raised on 15-23-23kg/ha NPK + 5t/ha
CM, 15- 30-30 kg/ha NPK +5t/ha CM and the control plots had the highest (20.7%) and
the same percentage shrinkage in tuber in tuber and differed significantly from the other
amended tubers at 6 weeks in grass storage.. Apomuden raised on 30-60-60kg/ha NPK had
the highest percentage tuber shrinkage (37.7%) with the least recorded by 30-30-30kg/ha
NPK, 30-45-45 kg/ha NPK and 15-30-30 kg/ha NPK +5t/ha CM treated tubers (20.7%).
However, unamended tubers of Okumkom had the highest percentage tuber shrinkage
(30.0%) with the least recorded by 15-23-23kg/ha NPK +5t/ha CM and 15-30-30kg/ha
NPK+5t/ha CM and 15-30-30kg/ha NPK+5t/ha CM raised tubers at 6 weeks in grass
storage. All other amended treated tubers however recorded zero values for tuber shrinkage
at the same period (Table.4.26b). Application of 15-23-23 kg/ha NPK +5t/ha CM to
Apomuden produced the highest percentage in tuber shrinkage (52.2%) followed by 15-30-
30 kg/ha NPK +5t/ha CM tuber (45.0%) at 12 weeks in grass storage with the least
recorded by 30-30-30 kg/ha NPK raised tubers (30.0%). Similarly, at 12 weeks in grass
storage application of 10t/ha CM, 30-30-30 kg/haNPK and 30-60-60 kg/ha NPK to
Okumkom recorded the highest percentage in tuber shrinkage (69.0%) followed by 15-15-
15 kg/ha NPK+5t/ha CM raised tuber with the lowest recorded by 15-23-23 kg/ha NPK+
5t/ha raised tubers (52.2%). Apomuden and Okumkom raised on amended and the control

149
plots differed significantly in variety x fertilizer interaction for percentage tuber shrinkage
at 12 weeks in grass storage (Table 4.26b). Generally, Okumkom raised on amended and
the control plots produced higher percentage tuber shrinkage than Apomuden at 12 WAS
in grass storage in both seasons. Similarly, in both seasons application of 10t/ha CM to
Okumkom had the highest percentage in tuber shrinkage at 12 weeks in grass storage.
However, application of 30-30-30 kg/ha NPK to Apomuden showed the lowest percentage
in tuber shrinkage at 12 weeks in grass storage for both seasons (Tables 4.26a and 4.26b).
4.6.2.3 Percentage Shrinkage in Tubers In Pit Storage
Table 4.27 shows percentage shrinkage tubers of two sweetpotato varieties as influenced
by chicken manure and inorganic fertilizers and storage for 12 weeks in pit. In the minor
season (2011), Apomuden tubers raised on30-45-45 kg/ha NPK differed significantly from
all the amended tubers except 10t/ha CM and 30-30-30kg/ha NPK in percentage shrinkage
in tubers (32.5%) for the first 4 weeks in pit storage (Table 4.27a). Okumkom raised on
control plot had the highest percentage shrinkage in tubers (40.5%) and differed
significantly from amended tubers in percentage shrinkage in tuber for the first 4 weeks in
pit storage. Apomuden raised on 30-30-30 kg/ha NPK and 30-45-45 kg/ha NPK which had
the highest and the same percentage shrinkage tubers (49.3%) differed significantly from
the control in percentage shrinkage in tuber at 12 weeks in pit storage. Okumkom raised on
30-60-60 kg/haNPK differed significantly from all the other amended and control tubers at
12 weeks in pit storage. There was significant difference in variety x fertilizer in
percentage shrinkage in tuber (Table 4.27a). In the major season (2012), Apomuden raised
on 30-45-45 kg/ha NPK and 30-60-60 kg/ha NPK plots.

150
Table 4.26a: Percentage Shrinkage in Tubers under Grass Storage During the 2011 Minor Season
VarietyWeek 2
Mean
Week 4
Mean
Week 6
Mean
Week 8
Mean
Week 10
Mean
Week 12
MeanApomud. Okumk. Apomud. Okumk. Apomud. Okumk. Apomud. Okumk. Apomud. Okumk. Apomud. Okumk.Fertilizer rate
T 1
T 2
T 3
T 4
T 5
T 6
T 7
T 8
0.0
0.0
0.0
0.0
0.0
0.0
22.4
0.0
22.4
32.5
22.4
22.3
0.0
0.0
22.2
22.4
11.2
16.2
11.2
11.1
0.0
0.0
22.3
11.2
32.3
22.3
0.0
22.3
22.4
22.5
32.4
32.5
32.4
32.2
42.5
40.5
47.2
0.0
40.6
32.3
32.3
27.2
21.2
31.4
34.8
11.2
36.5
32.4
32.3
22.3
32.3
32.33
32.3
22.3
32.4
32.3
40.6
40.6
49.2
40.5
49.3
32.2
49.2
32.5
36.4
31.4
40.8
36.4
40.8
27.2
40.8
32.4
40.5
40.4
32.4
40.5
32.2
40.6
40.5
40.4
40.4
40.4
49.6
57.3
32.4
32.4
49.3
40.4
40.4
40.4
41.0
48.9
32.3
36.5
44.9
36.4
40.4
40.4
32.3
40.5
40.3
40.4
49.4
40.4
49.2
57.3
49.2
57.3
32.2
49.4
57.5
40.5
44.8
48.8
40.8
48.9
36.3
44.9
53.4
40.5
40.4
40.5
32.4
40.5
40.4
40.5
49.3
40.4
49.4
57.4
49.3
57.3
32.4
49.2
57.3
40.6
44.9
49.0
40.8
48.9
36.4
44.9
53.3
40.5
Mean 2.8 18.0 23.3 33.5 29.8 41.7 37.4 42.8 40.5 49.1 40.5 49.1
LSD (P =0.05); Variety = 0.30 0.90 0.60 0.50 0.70 0.70Fertilizer = 0.70 1.90 0.30 1.10 1.40 1.40
Variety x Fertilizer = 1.00 2.70 1.80 1.60 2.00 2.00
T 1 - No fertilizer T5 - 30-45-45 kg/ha NPK
T 2 - 10t/ha CM T6 - 15-23-23 kg/ha NPK +5t/ha CM
T3 - 30-30-30 kg/ha NPK T7 - 30-60-60 kg/ha NPK
T 4 - 15-15-15 kg/ha NPK + 5t/ha CM T8 - 15-30-30 kg/ha NPK + 5t/ha CM

151
Table 4.26b: Percentage Shrinkage in Tubers under Grass Storage During the 2012 Major Season
VarietyWeek 2
Mean
Week 4
Mean
Week 6
Mean
Week 8
Mean
Week 10
Mean
Week 12
MeanApomud. Okumk. Apomud. Okumk. Apomud. Okumk. Apomud. Okumk. Apomud. Okumk. Apomud. Okumk.Fertilizer rate
T 1
T 2
T 3
T 4
T 5
T 6
T 7
T 8
20.7
20.7
0.0
20.7
20.7
20.7
30.0
20.7
0.0
0.0
0.0
0.0
0.0
0.0
0.0
0.0
10.3
10.3
0.0
10.3
10.3
10.3
15.0
10.3
30.0
30.0
20.7
30.0
20.7
30.0
37.7
20.7
20.7
0.0
0.0
0.0
0.0
20.7
0.0
20.7
25.3
15.0
10.3
15.0
10.3
25.3
18.8
20.7
30.0
30.0
20.7
30.0
20.7
30.0
37.7
20.7
30.0
0.0
0.0
0.0
0.0
20.7
0.0
20.7
30.0
15.0
10.3
15.0
10.3
25.3
18.8
20.7
37.7
37.7
23.8
37.7
20.7
37.7
37.7
30.0
30.0
0.0
0.0
20.7
20.7
37.7
30.0
30.0
33.8
18.8
11.9
29.2
20.7
37.7
33.8
30.0
37.7
37.7
30.0
37.7
37.7
52.2
37.7
45.0
60.0
69.2
69.2
69.2
60.0
52.2
69.2
60.0
48.8
53.4
49.6
53.4
48.8
52.2
53.5
52.5
37.7
37.7
30.0
37.7
37.7
52.2
37.8
45.0
60.0
69.3
69.3
69.2
60.0
52.2
69.3
60.0
48.8
53.5
49.6
53.5
48.8
52.2
53.5
52.5
Mean 19.2 0.0 27.4 7.7 27.5 8.93 32.9 21.1 39.5 63.6 39.5 63.6
LSD (P = 0.05); Variety = 0.38 0.47 0.42 0.94 0.60 0.60Fertilizer = 0.76 0.94 1.84 1.88 1.21 1.20
Variety x Fertilizer = 1.08 1.33 1.19 2.67 1.71 1.70
T 1 - No fertilizer T5 - 30-45-45 kg/ha NPK
T 2 - 10t/ha CM T6 - 15-23-23 kg/ha NPK +5t/ha CM
T3 - 30-30-30 kg/ha NPK T7 - 30-60-60 kg/ha NPK
T 4 - 15-15-15 kg/ha NPK + 5t/ha CM T8 - 15-30-30 kg/ha NPK + 5t/ha CM

152
This had the highest and the same percentage shrinkage in tuber (30.0%) differed
significantly from the other amended and the control tubers for the first 4 weeks in pit
storage (Table 4.27b). Okumkom raised on 30-60-60 kg/ha NPK differed significantly
from other amended and the control tubers in percentage tuber shrinkage for the first 4
weeks in pit storage. Application of 30-45-45 kg/ha NPK to Apomuden tubers differed
significantly from other amended and unamended Apomuden tubers in percentage
shrinkage at 12 weeks in pit storage. Similarly, Okumkom raised on 30-60-60 kg/ha NPK
differed significantly from other amended and unamended tubers in percentage tuber
shrinkage at 12 weeks in pit storage with 15-23-23 kg/ha NPK+5t/ha CM treated tubers
recording no mean value for the same period. There was a significant difference in variety
x fertilizer interaction for percentage tuber shrinkage at 12 WAS in pit (Table.4.27b).
Generally, Apomuden and Okumkom raised on amended and unamended plots during the
minor season and stored in pit or grass had higher percentage tuber shrinkage than tubers
stored under the same conditions in the major season after 12 weeks in storage (Tables
4.26 and 4.27). However, application of 30-60-60 kg/ha NPK to Apomuden during the
minor season and storage in ash and grass produced higher and same percentage tuber
shrinkage (49.3 %) at 12 weeks in storage (Tables 4.4.25a and 4.26a). Apomuden raised on
amended and unamended plots and stored in grass and ash had higher percentage shrinkage
than in pit storage. In the major season, Application of 30-30-30 kg/ha NPK to Apomuden
and storage in pit, ash or grass recorded the lowest percentage tubers shrinkage at 12 weeks
in storage. However, application of 10t/ha CM to Okumkom during the major season and
storage in grass and ash had higher percentage tuber shrinkage and same percent shrinkage
in tuber (69.3%) at 12 weeks in storage (Tables .4.25. 4.26 and 4.27).
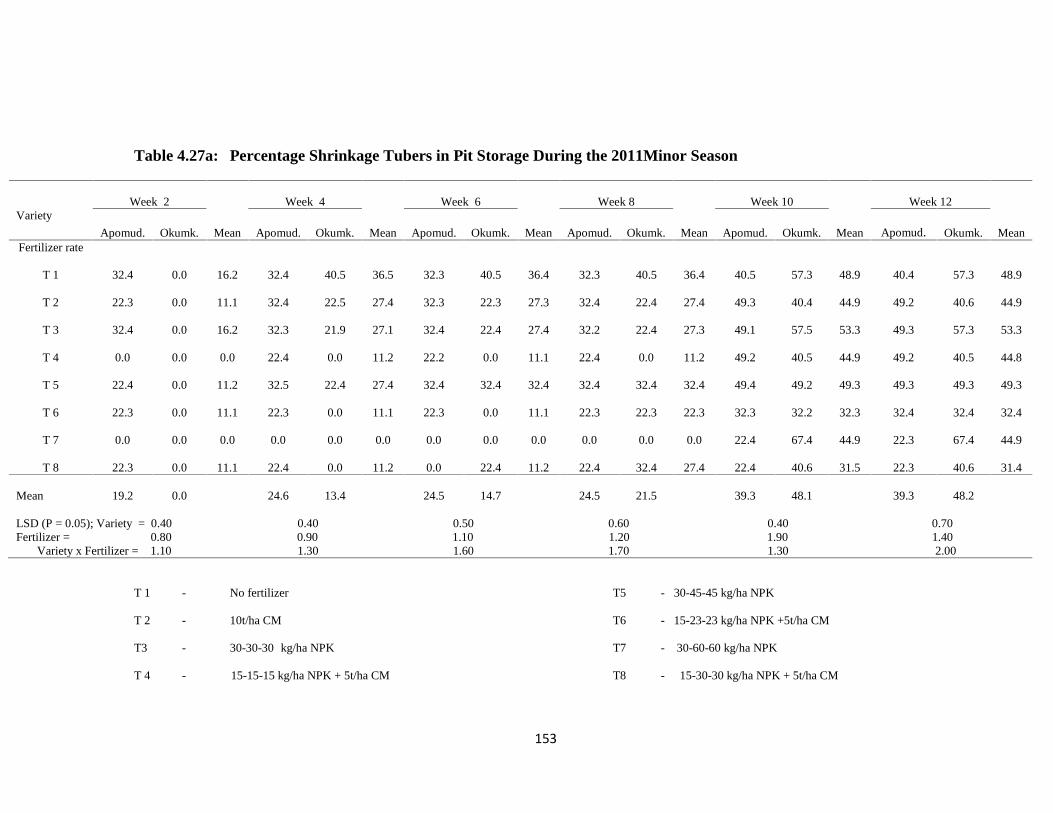
153
Table 4.27a: Percentage Shrinkage Tubers in Pit Storage During the 2011Minor Season
VarietyWeek 2
Mean
Week 4
Mean
Week 6
Mean
Week 8
Mean
Week 10
Mean
Week 12
MeanApomud. Okumk. Apomud. Okumk. Apomud. Okumk. Apomud. Okumk. Apomud. Okumk. Apomud. Okumk.Fertilizer rate
T 1
T 2
T 3
T 4
T 5
T 6
T 7
T 8
32.4
22.3
32.4
0.0
22.4
22.3
0.0
22.3
0.0
0.0
0.0
0.0
0.0
0.0
0.0
0.0
16.2
11.1
16.2
0.0
11.2
11.1
0.0
11.1
32.4
32.4
32.3
22.4
32.5
22.3
0.0
22.4
40.5
22.5
21.9
0.0
22.4
0.0
0.0
0.0
36.5
27.4
27.1
11.2
27.4
11.1
0.0
11.2
32.3
32.3
32.4
22.2
32.4
22.3
0.0
0.0
40.5
22.3
22.4
0.0
32.4
0.0
0.0
22.4
36.4
27.3
27.4
11.1
32.4
11.1
0.0
11.2
32.3
32.4
32.2
22.4
32.4
22.3
0.0
22.4
40.5
22.4
22.4
0.0
32.4
22.3
0.0
32.4
36.4
27.4
27.3
11.2
32.4
22.3
0.0
27.4
40.5
49.3
49.1
49.2
49.4
32.3
22.4
22.4
57.3
40.4
57.5
40.5
49.2
32.2
67.4
40.6
48.9
44.9
53.3
44.9
49.3
32.3
44.9
31.5
40.4
49.2
49.3
49.2
49.3
32.4
22.3
22.3
57.3
40.6
57.3
40.5
49.3
32.4
67.4
40.6
48.9
44.9
53.3
44.8
49.3
32.4
44.9
31.4
Mean 19.2 0.0 24.6 13.4 24.5 14.7 24.5 21.5 39.3 48.1 39.3 48.2
LSD (P = 0.05); Variety = 0.40 0.40 0.50 0.60 0.40 0.70Fertilizer = 0.80 0.90 1.10 1.20 1.90 1.40
Variety x Fertilizer = 1.10 1.30 1.60 1.70 1.30 2.00
T 1 - No fertilizer T5 - 30-45-45 kg/ha NPK
T 2 - 10t/ha CM T6 - 15-23-23 kg/ha NPK +5t/ha CM
T3 - 30-30-30 kg/ha NPK T7 - 30-60-60 kg/ha NPK
T 4 - 15-15-15 kg/ha NPK + 5t/ha CM T8 - 15-30-30 kg/ha NPK + 5t/ha CM

154
Table 4.27b: Percentage Shrinkage Tubers in Pit Storage During the 2012 Major Season
VarietyWeek 2
Mean
Week 4
Mean
Week 6
Mean
Week 8
Mean
Week 10
Mean
Week 12
MeanApomud. Okumk. Apomud. Okumk. Apomud. Okumk. Apomud. Okumk. Apomud. Okumk. Apomud. Okumk.Fertilizer rate
T 1
T 2
T 3
T 4
T 5
T 6
T 7
T 8
0.0
0.0
0.0
0.0
0.0
0.0
0.0
0.0
0.0
0.0
0.0
0.0
0.0
0.0
20.7
0.0
0.0
0.0
0.0
0.0
0.0
0.0
10.3
0.0
0.0
0.0
0.0
20.7
30.0
20.7
30.0
20.7
20.7
0.0
0.0
0.0
20.7
0.0
30.0
0.0
10.3
0.0
0.0
10.3
25.3
10.3
30.0
10.3
20.7
0.0
0.0
20.7
30.0
20.7
30.0
20.7
20.7
0.0
0.0
0.0
20.7
0.0
37.7
0.0
20.7
0.0
0.0
10.3
25.3
10.3
33.8
10.3
20.7
20.7
0.0
30.0
37.7
20.7
30.0
20.7
30.0
20.7
0.0
20.7
20.7
0.0
45.0
20.7
25.3
20.7
0.0
25.3
29.2
10.3
37.5
20.7
20.7
20.7
0.0
37.7
45.0
30.0
30.0
20.7
37.7
20.7
20.7
20.7
30.0
0.0
60.0
30.0
29.2
20.7
10.3
29.2
37.5
15.0
45.0
25.3
20.7
30.0
20.7
37.7
45.0
30.0
30.0
23.8
45.0
20.7
20.7
20.7
30.0
0.0
60.0
30.0
32.8
25.3
20.7
29.2
37.5
15.0
45.0
26.9
Mean 0.0 2.5 15.2 8.9 17.8 9.9 22.5 19.7 25.6 27.4 29.7 28.4
LSD (P = 0.05); Variety = 0.14 0.41 0.44 0.55 0.51 0.96Fertilizer = 0.28 0.83 0.88 1.10 1.03 1.93
Variety x Fertilizer = 0.39 1.18 1.24 1.58 1.46 2.73
T 1 - No fertilizer T5 - 30-45-45 kg/ha NPK
T 2 - 10t/ha CM T6 - 15-23-23 kg/ha NPK +5t/ha CM
T3 - 30-30-30 kg/ha NPK T7 - 30-60-60 kg/ha NPK
T 4 - 15-15-15 kg/ha NPK + 5t/ha CM T8 - 15-30-30 kg/ha NPK + 5t/ha CM

155
4.6.3.0 Percentage Rotten Tubers of Sweetpotato in Ash, Grass and Pit Storage
during the Minor and the Major Seasons
4.6.3.1 Percentage Rotten TubersIn Ash Storage
Table 4.28 shows percentage shrinkage tubers of two sweetpotato varieties as influenced
by chicken manure and inorganic fertilizers and stored in ash for 12 weeks. In the minor
season (2011), Apomuden and Okumkom raised on amended and unamended plots and
stored in ash recorded zero values percent rotten tubers for the first 2 weeks in storage.
Application of 30-30-30 kg/ha NPK to Apomuden which had the highest percentage rotten
tubers (49.3%) differed significantly from other amended and unamended plots for the first
6 weeks in ash storage. However, application of 30-45-45 kg/ha NPK, 15-23-23 kg/ha
NPK, +5t/ha CM and 30-60-60 kg/ha NPK, treatments to Okumkom produced the highest
percentage rotten tubers (32.4%) while the the control recorded zero values percent rotten
tubers at 6 weeks in ash storage (Table 4.28a).
Application of 30-45-45 kg/ha NPK to Apomuden which had the highest percentage rotten
tubers (67.5%) differed significantly from other amended and unamended Apomuden
tubers at 12 weeks in ash storage. Similarly Okumkom under 30-45-45 kg/ha NPK had the
highest percentage rotten tubers (49.4%) while the least was recorded by 15-30-30 kg/ha
NPK+5t/ha CM treated tubers (22.3%) in percentage rotten tubers at 12 weeks in ash
storage (Table 4.28a).
In the major season (2012), application of 30-60-60 kg/ha NPK to Apomuden had the
highest percentage rotten tubers (37.7%) for the first 4 weeks in ash storage with no mean
values percent trotten tubers recorded by 10t/ha CM, 30-30-30 kg/ha NPK and 30-45-45

156
kg/ha NPK treated tubers (Table 4 28b). However, application of 15-23-23 kg/ha
NPK+5t/ha CM and 15-30-30 kg/ha NPK+5t/ha CM to Okumkom tubers recorded the
highest percentage rotten tubers (20.7%) for the first 4 weeks in storage with other
amended and control treated tubers recording zero values rotten tubers during the same
period in ash storage. Application of 30-60-60 kg/ha NPK to Apomuden produced the
highest percentage rotten tubers (69.2%) with the lowest recorded by 15-23-23 kg/ha NPK
+5t/ha CM treated tubers (20.8%) for the first 8 weeks in ash storage. A significant
difference in percentage rotten tubers was observed between amended and unamended
Apomuden tubers at 8 weeks in ash storage. Application of 15-23-23 kg/ha NPK +5t/ha
CM and 15-30-30 kg/ha NPK+ 5t/ha CM to Okumkom showed the highest percentage
rotten tubers (37.7%) followed by 30-30-30 kg/ha NPK, 30-45-45 kg/ha NPK and
unamended treated tubers which had the same percent rotten tubers (20.7%) at 8 weeks in
ash storage. The other amended tubers of Okumkom recorded zero values percent rotten
tubers for the same period in ash storage (Table. 4.28b).
Application of inorganic fertilizers and organic manure either alone or in combination
except 15-23-23 kg/ha NPK +5t/ha CM and 10t/ha CM and the unamended tubers of
Apomuden recorded the highest percentage rotten tubers (90.0%) with the least recorded
by 15-23-23 kg/ha NPK +5t/ha CM treated tubers (52.2%) at 12 weeks in ash storage.
Similarly, application of organic manure and inorganic fertilizers either alone or in
combination except 15-15-15 kg/ha NPK +5t/ha CM and the unamended tubers of
Okumkom had the highest percentage rotten tubers (90.0%) with the least recorded by 30-
45-45 kg/ha NPK and 30-60-60 kg/ha NPK treated tubers (52.2%) at 12 weeks in ash
storage (Table 4. 28b).

157
Table 4.28a: Percentage RottenTubers in Ash Storage Duing the 2011 Minor Season
VarietyWeek 2
Mean
Week 4
Mean
Week 6
Mean
Week 8
Mean
Week 10
Mean
Week 12
MeanApomud. Okumk. Apomud. Okumk. Apomud. Okumk. Apomud. Okumk. Apomud. Okumk. Apomud. Okumk.Fertilizer rate
T 1
T 2
T 3
T 4
T 5
T 6
T 7
T 8
0.0
0.0
0.0
0.0
0.0
0.0
0.0
0.0
0.0
0.0
0.0
0.0
0.0
0.0
0.0
0.0
0.0
0.0
0.0
0.0
0.0
0.0
0.0
0.0
22.3
32.3
32.2
32.2
0.0
40.5
22.3
0.0
0.0
0.0
0.0
22.2
22.4
0.0
0.0
22.4
11.1
16.1
16.1
27.2
11.2
20.2
11.1
11.2
32.3
32.5
49.3
32.3
22.3
22.3
32.3
40.6
0.0
22.3
22.4
22.3
32.4
32.4
32.4
22.3
16.1
27.4
35.8
27.3
27.4
27.4
32.4
31.4
32.2
32.3
49.2
49.1
40.3
22.3
40.6
49.2
22.3
22.3
22.3
22.4
32.3
32.4
32.3
22.4
27.3
27.3
35.8
35.7
36.3
27.3
36.4
35.8
40.6
32.4
49.3
57.5
67.5
22.2
40.4
49.1
22.3
32.3
40.4
22.2
49.3
40.5
49.3
22.3
31.5
32.4
44.9
39.9
58.4
31.3
44.8
35.7
40.7
32.1
49.1
57.3
67.5
22.3
40.5
49.1
22.4
32.2
40.4
22.5
49.4
40.6
49.3
22.3
31.6
32.2
44.8
39.9
58.4
31.4
44.9
35.7
Mean 0.0 0.0 22.7 8.3 33.0 23.3 39.4 26.1 44.9 34.8 44.8 34.9
LSD (P =0.05); Variety = 0.0 0.30 0.40 0.40 0.40 0.40Fertilizer = 0.0 0.60 0.80 0.90 0.90 0.80
Variety x Fertilizer = 0.0 1.90 1.20 1.30 1.30 1.10
T 1 - No fertilizer T5 - 30-45-45 kg/ha NPK
T 2 - 10t/ha CM T6 - 15-23-23 kg/ha NPK +5t/haCM
T3 - 30-30-30 kg/ha NPK T7 - 30-60-60 kg/ha NPK
T 4 - 15-15-15 kg/ha NPK + 5t/ha CM T8 - 15-30-30 kg/ha NPK + 5t/ha CM

158
Table 4.28b: Percentage RottenTubers in Ash Storage During the 2012 Major Season
VarietyWeek 2
Mean
Week 4
Mean
Week 6
Mean
Week 8
Mean
Week 10
Mean
Week 12
MeanApomud. Okumk. Apomud. Okumk. Apomud. Okumk. Apomud. Okumk. Apomud. Okumk. Apomud. Okumk.Fertilizer rate
T 1
T 2
T 3
T 4
T 5
T 6
T 7
T 8
0.0
0.0
0.0
0.0
0.0
0.0
0.0
0.0
0.0
0.0
0.0
0.0
0.0
0.0
0.0
0.0
0.0
0.0
0.0
0.0
0.0
0.0
0.0
0.0
30.0
0.0
0.0
20.7
0.0
20.7
37.7
20.7
0.0
0.0
0.0
0.0
0.0
20.7
0.0
20.7
15.0
0.0
0.0
10.3
0.0
20.7
18.8
20.7
37.7
20.7
20.7
45.0
45.0
20.7
60.0
45.0
0.0
0.0
20.7
0.0
0.0
37.7
0.0
30.0
18.8
10.3
20.7
22.5
22.5
29.2
30.0
37.8
52.2
37.7
37.7
45.0
45.0
20.8
69.2
45.0
20.7
0.0
20.7
0.0
20.7
37.7
0.0
37.7
36.4
18.8
29.2
22.5
32.8
29.2
34.6
41.3
90.0
69.2
52.2
90.0
69.2
45.0
90.0
90.0
69.2
69.2
60.0
60.0
45.0
90.0
52.2
90.0
79.6
69.2
56.1
75.0
57.1
67.5
71.1
90.0
90.0
69.3
90.0
90.0
90.0
52.2
90.0
90.0
90.0
90.0
60.0
59.6
52.2
90.0
52.2
90.0
90.0
79.6
75.0
74.8
71.1
71.1
71.1
90.0
Mean 0.0 0.0 16.2 5.1 36.8 11.0 44.0 17.2 74.4 66.9 82.6 73.0
LSD (P = 0.05); Variety = 0.0 0.39 0.50 0.51 0.47 0.52Fertilizer = 0.0 0.78 1.01 1.02 0.94 1.04
Variety x Fertilizer = 0.0 1.10 1.43 1.45 1.34 1.47
T 1 - No fertilizer T5 - 30-45-45 kg/ha NPK
T 2 - 10t/ha CM T6 - 15-23-23 kg/ha NPK +5t/haCM
T3 - 30-30-30 kg/ha NPK T7 - 30-60-60 kg/ha NPK
T 4 - 15-15-15 kg/ha NPK + 5t/ha CM T8 - 15-30-30 kg/ha NPK + 5t/ha CM

159
4.6.3.2 Percentage Rotten Tubers in Grass Storage
Table 4.29 shows percentage rotten tubers of two sweetpotato varieties as influenced by
chicken manure and inorganic fertilizer and stored in grass for 12 weeks. In the minor
season (2011), Apomuden under control had the highest percentage (22.5%) rotten tubers
while all the amended tubers except 15-23-23 kg/ha NPK+5t/ha CM recorded no mean
valuespercent rotten tubers for the first 4 weeks in grass storage. Okumkom under
amended plots except 15-30-30 kg/ha NPK+ 5t/ha CM recorded the highest percentage
rotten tubers (40.6%) while the unamended tubers recorded zero values for rotten tubers
during the first 4 weeks in grass storage (Table 4.29a). Similarly, 15-23-23 kg/ha
NPK+5t/ha CM and 30-60-60 kg/ha NPK treated tubers of Apomuden which had the
highest percentage rotten tubers (40.5%) differed significantly from other amended and the
control tubers with zero values for rotten tubers recorded by 30-45-45 kg/ha NPK and 30-
60-60 kg/ha NPK tubers during the first 8 weeks in grass storage (Table 4.29a).
Apomuden under 15-30-30 kg/ha NPK+5t/ha CM had the highest percentage rotten tubers
(49.7%) with the least recorded by the control (32.4%) at 12 weeks in grass storage.
Similarly, application of 15-30-30 kg/ha NPK+5t/ha CM to Okumkom produced the
highest percentage rotten tubers (40.6%) followed by 15-23-23kg/ha NPK+5t/ha CM
(40.4%) and differed significantly from other amended and control tubers at 12 weeks in
grass storage. However, 30-45-45 kg/ha NPK tubers of Okumkom recorded zero values
rotten tubersat 12 weeks in grass storage (Table 4.29a).
In the major season (2012), application of 30-45-45 kg/ha NPK and 30-60-60 kg/ha NPK
to Apomuden produced the highest percentage rotten tubers (52.2%) and differed
significantly from the other amended and unamended tubers with the lowest recorded by

160
15-15-15 kg/ha NPK +5t/ha CM tubers for the first 6 weeks in grass storage (Table 4.29b).
In the case of Okumkom, application of 15-30-30 kg/ha NPK +5t/ha CM and unamended
tubers showed the highest percentage rotten tubers (30.0%) for the first 6 weeks in grass
storage. Zero srotten tuber wasr ecorded by the other amended plots for the same period.
Tubers produced from application of30-45-45 kg/ha NPK to Apomuden had the highest
percentage rotten tubers (69.2%) and differed significantly from the other amended and the
control tubers for the first 8 weeks in grass storage with the lowest recorded by 15-23-
23kg/ha NPK+5t/ha CM treated tubers (37.7%). Similarly, application of 15-23-
23kg/haNPK +5t/ha CM to Okumkom recorded the highest percentage rotten tubers
(37.7%) and differed significantly from the other amended and control tubers for the first
8 weeks in grass storage. Application of amended and unamended treatments to both
Apomuden and Okumkom produced the same mean percentage rotten tubers at 10 and 12
weeks in grass storage (Table.4.29b).
4.6.3.3 Percentage Rotten Tubers in Pit Storage
Table4.30 shows percentage rotten tubers of two sweetpotato varieties as influenced by
chicken manure and inorganic fertilizer and storage in pit for 12 weeks. In the minor
season (2011), Apomuden grown on 30-45-45 kg/ha NPK treatment gave the highest
(49.3%) percentage rotten tubers and differed significantly from the other amended and
unamended tubers at 12 weeks in pit storage and the least (22.3%) was recorded by 15-
15-15 kg/ha NPK + 5t/ha CM tubers for the same period.

161
Table 4.29a: Percentage RottenTubers in Grass Storage During the 2011 Minor Season
VarietyWeek 2
Mean
Week 4
Mean
Week 6
Mean
Week 8
Mean
Week 10
Mean
Week 12
MeanApomud. Okumk. Apomud. Okumk. Apomud. Okumk. Apomud. Okumk. Apomud. Okumk. Apomud. Okumk.Fertilizer rate
T 1
T 2
T 3
T 4
T 5
T 6
T 7
T 8
0.0
0.0
0.0
0.0
0.0
0.0
0.0
0.0
0.0
0.0
0.0
0.0
0.0
0.0
0.0
0.0
0.0
0.0
0.0
0.0
0.0
0.0
0.0
0.0
22.5
0.0
22.4
0.0
22.4
22.3
22.4
0.0
0.0
0.0
0.0
0.0
0.0
0.0
0.0
40.6
11.2
0.0
11.2
0.0
11.2
11.1
11.2
20.3
22.3
22.0
22.4
0.0
22.4
22.6
32.3
22.4
22.3
22.5
22.3
22.4
0.0
40.5
0.0
40.5
22.3
22.2
22.3
11.2
11.2
31.5
16.1
31.4
32.4
32.5
32.4
32.4
22.3
32.4
32.4
32.4
22.4
22.4
22.4
22.4
0.0
40.5
0.0
40.5
27.4
27.4
27.4
27.4
11.1
36.4
16.2
36.5
32.3
40.4
32.4
32.4
49.2
40.6
40.5
49.2
22.4
22.4
22.2
22.3
0.0
40.4
22.2
40.5
27.3
31.4
27.3
27.4
24.6
40.5
31.3
44.9
32.4
40.5
32.5
32.5
49.3
40.7
40.5
49.7
22.2
22.3
22.7
21.9
0.0
40.4
22.3
40.6
27.3
31.4
27.6
27.2
24.6
40.5
31.4
45.1
Mean 0.0 0.0 14.0 5.0 20.8 21.3 31.2 21.3 39.6 24.0 39.7 24.0
LSD (P = 0.05); Variety = 0.0 0.30 0.40 0.50 0.50 0.60Fertilizer = 0.0 0.60 0.90 1.10 1.10 1.30
Variety x Fertilizer = 0.0 0.90 1.30 1.50 1.60 1.80
T 1 - No fertilizer T5 - 30-45-45 kg/ha NPK
T 2 - 10t/ha CM T6 - 15-23-23 kg/ha NPK +5t/haCM
T3 - 30-30-30 kg/ha NPK T7 - 30-60-60 kg/ha NPK
T 4 - 15-15-15 kg/ha NPK + 5t/ha CM T8 - 15-30-30 kg/ha NPK + 5t/ha CM

162
Table 4.29b: Percentage RottenTubers in Grass Storage Duirng the2012 Major Season
VarietyWeek 2
Mean
Week 4
Mean
Week 6
Mean
Week 8
Mean
Week 10
Mean
Week 12
MeanApomud. Okumk. Apomud. Okumk. Apomud. Okumk. Apomud. Okumk. Apomud. Okumk. Apomud. Okumk.Fertilizer rate
T 1
T 2
T 3
T 4
T 5
T 6
T 7
T 8
0.0
0.0
0.0
0.0
0.0
0.0
0.0
30.0
0.0
0.0
0.0
0.0
0.0
0.0
0.0
0.0
0.0
0.0
0.0
0.0
0.0
0.0
0.0
15.0
37.7
37.7
37.7
20.7
52.2
30.0
52.2
37.7
30.0
0.0
0.0
0.0
0.0
0.0
0.0
30.0
33.8
18.8
18.8
10.3
26.1
15.0
26.1
33.8
37.7
37.7
45.0
45.0
69.2
30.0
52.3
45.0
30.0
0.0
0.0
0.0
20.7
0.0
0.0
30.0
33.8
18.8
22.5
22.5
45.0
15.0
26.1
37.5
45.0
52.2
52.2
52.2
69.2
37.7
52.4
52.2
30.0
20.7
20.7
20.7
30.0
37.7
20.7
37.7
37.5
36.4
36.4
36.4
49.6
37.7
36.5
44.9
90.0
90.0
90.0
90.0
90.0
90.0
90.0
90.0
90.0
90.0
90.0
90.0
90.0
90.0
90.0
90.0
90.0
90.0
90.0
90.0
90.0
90.0
90.0
90.0
90.0
90.0
90.0
90.0
90.0
90.0
90.0
90.0
90.0
90.0
90.0
90.0
90.0
90.0
90.0
90.0
90.0
90.0
90.0
90.0
90.0
90.0
90.0
90.0
Mean 3.7 0.0 38.2 7.5 45.2 10.0 51.6 27.3 90.0 90.0 90.0 90.0
LSD (P = 0.05); Variety = 0.14 0.48 0.49 0.59 0.60 0.60Fertilizer = 0.29 0.96 0.99 1.18 1.21 1.21
Variety x Fertilizer = 0.41 1.35 1.41 1.67 1.75 1.72
T 1 - No fertilizer T5 - 30-45-45 kg/ha NPK
T 2 - 10t/ha CM T6 - 15-23-23 kg/ha NPK +5t/haCM
T3 - 30-30-30 kg/ha NPK T7 - 30-60-60 kg/ha NPK
T 4 - 15-15-15 kg/ha NPK + 5t/ha CM T8 - 15-30-30 kg/ha NPK + 5t/ha CM

163
Application of 15-30-30 kg/ha NPK + 5t/ha CM to Okumkom had the highest percentage
rotten tubers (90.3%) and differed significantly from other amended and unamended
treatments with the least (22.3%) recorded by the controlat 12 weeks in pit storage (Table
4.30a).
In the major season (2012), application of 30-45-45kg/ha NPK to Apomuden produced the
highest (45.0%) percentage rotten tubers and differed significantly from the other
amended and unamended tubers for the first 6 weeks in pit storage (Table 4.30b).
However, 10t/ha CM and 15-23-23kg/haNPK +5t/ha CM treated tubers recorded zero
values for percent rotten tubersduring the same period and in storage condition.
Application of 15-15-15 kg/ha NPK +5t/ha CM to Okumkom showed the highest
percentage rotten tubers (52.0%) and differed significantly from other amended tubers and
the control for the first 6 weeks in pit storage. 10t/ha CM treated tubers however recorded
zero values for percent rotten tubers for the same period and storage condition. Application
of 30-45-45 kg/haNPK to Apomuden produced the highest (52.4%) percentage rotten
tubers followed by 15-15-15 kg/haNPK+5t/ha CM treatment (52.2%) and the lowest
(20.7%) was recorded by 15-23-23kg/ha NPK+5t/ha CM treatment at 12 weeks in pit
storage. There was a significant difference between amended and the control tubers of
Apomuden in percentage rotten tubers at 12 weeks in pit storage. 30-60-60 kg/ha NPK
under Okumkom had the highest percentage rotten tubers (90.0%) and differed significant
from the other amended tubers and the control at 12 weeks in pit storage with the lowest
(30.0 %) recorded by 10t/ha CM and 15-23-23kg/ha NPK+5t/ha CM tubers. There was a
significant difference in variety x fertilizer interaction in percentage rotten tubers at 12
weeks in pit storage (Table 4.30b). In both seasons Apomuden and Okumkom grown on

164
amended and unamended plots and stored in grass during the major season had
substantially higher percentage rotten tubers followed by ash storage with the least
recorded by pit storage at 12 weeks in storage. Generally, Apomuden and Okumkom
grown on amended and the control plots and stored in pit, ash and grass during the major
season produced higher percentage rotten tubers compared to the minor season (Tables 4.
30a and 4.30b).
4.6.4.0 Percentage Tuber Sprouting of Sweetpotato under Ash, Grass or Pit
Storage During the Minor and The Major Seasons
4.6.4.1 Percentage Tuber Sprouting in Ash storage
Table 4.31 shows the percentage tuber sprout of two varieties of sweetpotato as influenced
by chicken manure and inorganic fertilizer and storage in ash for 12 weeks. In the minor
season (2011), Apomuden grown on the control plot and stored in ash which had the
highest (40.3%) percentage sprouted tuber differed significantly from the amended
treatments for the first 4 weeks in ash storage (Table 4.31a). Okumkom under 10t/ha CM
treatment had the highest (22.4%) percentage sprouted tuber while the other amended and
unamended tubers recorded zero values for sprouted tubers during the first 4 weeks in ash
storage. Similarly, Apomuden grown on unamended plot had the highest percentage
sprouted tubers (67.4%) with no mean values sprouted tuber recorded by 30-60-60
kg/haNPK at 12 weeks in ash storage.

165
Table 4.30a: Percentage RottenTubers in Pit Storage During the 2011 Minor Season
VarietyWeek 2
Mean
Week 4
Mean
Week 6
Mean
Week 8
Mean
Week 10
Mean
Week 12
MeanApomud. Okumk. Apomud. Okumk. Apomud. Okumk. Apomud. Okumk. Apomud. Okumk. Apomud. Okumk.Fertilizer rate
T 1
T 2
T 3
T 4
T 5
T 6
T 7
T 8
0.0
22.3
22.5
22.4
0.0
0.0
32.4
22.3
22.4
0.0
0.0
22.5
22.5
0.0
0.0
67.4
11.2
11.1
11.2
22.4
11.2
0.0
16.2
44.9
0.0
32.5
22.4
22.3
32.5
32.3
32.5
22.4
22.5
22.4
22.4
22.5
32.5
22.4
32.5
67.4
11.2
27.4
22.4
22.4
32.5
27.3
32.5
44.9
40.5
32.4
40.5
22.4
49.2
32.5
32.6
32.4
22.5
40.6
32.5
32.3
32.5
22.6
40.7
67.4
31.5
36.5
36.5
27.4
40.9
27.5
36.6
49.9
40.5
40.5
40.6
22.3
49.3
32.3
32.5
40.5
22.3
40.5
40.65
32.4
40.5
32.5
40.6
67.4
31.4
40.5
40.6
27.3
44.9
32.4
36.5
54.0
40.6
40.5
40.5
22.5
49.2
40.5
40.5
40.5
22.5
4.5
40.5
32.4
40.6
32.5
57.5
90.3
31.5
40.5
40.5
27.4
44.9
36.5
49.0
65.4
40.5
40.5
40.5
22.3
49.3
40.7
40.6
40.5
22.3
40.5
40.6
32.5
40.3
32.5
57.5
90.3
31.4
40.5
40.5
27.4
44.8
36.6
49.1
65.4
Mean 15.2 16.8 27.6 30.6 35.3 36.4 37.3 39.6 39.3 44.6 39.4 44.6
LSD (P =0.05); Variety = 0.40 0.30 0.50 0.60 0.50 0.60Fertilizer = 0.80 0.70 1.00 1.20 1.10 1.20
Variety x Fertilizer = 1.10 1.10 1.40 1.70 1.60 1.70
T 1 - No fertilizer T5 - 30-45-45 kg/ha NPK
T 2 - 10t/ha CM T6 - 15-23-23 kg/ha NPK +5t/haCM
T3 - 30-30-30 kg/ha NPK T7 - 30-60-60 kg/ha NPK
T 4 - 15-15-15 kg/ha NPK + 5t/ha CM T8 - 15-30-30 kg/ha NPK + 5t/ha CM

166
Table 4.30b: Percentage RottenTubers in Pit Storage During the 2012 Major Season
VarietyWeek 2
Mean
Week 4
Mean
Week 6
Mean
Week 8
Mean
Week 10
Mean
Week 12
MeanApomud. Okumk. Apomud. Okumk. Apomud. Okumk. Apomud. Okumk. Apomud. Okumk. Apomud. Okumk.Fertilizer rate
T 1
T 2
T 3
T 4
T 5
T 6
T 7
T 8
0.0
0.0
0.0
0.0
0.0
0.0
0.0
20.7
0.0
0.0
0.0
0.0
20.7
20.7
0.0
0.0
0.0
0.0
0.0
0.0
10.3
10.3
0.0
10.3
20.7
0.0
0.0
20.7
37.7
0.0
30.0
31.0
0.0
0.0
0.0
30.0
20.7
20.7
0.0
0.0
10.3
0.0
0.0
25.3
29.2
10.3
15.0
15.5
30.0
0.0
20.7
37.7
45.0
0.0
30.0
31.0
30.0
0.0
37.7
52.2
37.7
20.7
30.0
37.7
30.0
0.0
29.2
45.0
41.3
10.3
30.0
34.3
30.0
20.7
20.7
45.0
45.0
20.7
37.8
31.0
45.0
0.0
37.5
52.3
45.0
20.8
45.0
37.7
37.5
10.3
29.1
48.6
45.0
20.7
41.4
34.3
45.0
20.7
31.0
52.2
52.2
20.7
37.8
31.0
45.0
0.0
37.7
52.4
45.0
20.8
45.0
37.8
45.0
10.3
34.3
52.3
48.6
20.7
41.4
34.4
45.0
30.0
37.8
52.2
52.4
20.7
37.8
37.4
45.0
30.0
45.0
52.6
45.0
30.0
90.0
45.0
45.0
30.0
41.4
52.4
48.7
25.3
63.9
41.2
Mean 2.5 5.1 17.5 8.9 24.3 30.7 31.3 35.4 36.3 35.4 39.1 47.8
LSD (P =0.05); Variety = 0.21 0.36 0.49 0.50 0.53 0.56Fertilizer = 0.42 0.73 0.99 1.00 1.06 1.12
Variety x Fertilizer = 0.60 1.04 1.41 1.41 1.50 1.59
T 1 - No fertilizer T5 - 30-45-45kg/haNPK
T 2 - 10t/ha CM T6 - 15-23-23kg/haNPK +5t/haCM
T3 - 30-30-30 kg/haNPK T7 - 30-60-60kg/haNPK
T 4 - 15-15-15 kg/haNPK + 5t/ha CM T8 - 15-30-30kg/haNPK + 5t/ha CM

167
Okumkom under 10t/ha CM treatment had the highest percentage sprouted tuber (32.3%)
while the other amended and unamended plots recorded no values sprouted tuber at 12
week in ash storage. There was a significant difference in variety x fertilizer in percentage
sprouted tuber at 12 weeks in ash storage (Table 4.31a).
In the major season (2012), application of 10t/ha CM to Apomuden had the highest
(45.0%) percentage sprouted tubers with 30-30-30kg/haNPK and the control recorded no
values sprouted tuber at the first 6 weeks in ash storage (Table 4.31b). Application of 30-
60-60kg/haNPK to Okumkom had the highest (37.7%) percentage sprouted tubers with the
least (20.7%) recorded by 10t/ha CM and 15-30-30kg/haNPK+5t/ha CM tubers at the first
6 weeks in ash storage. Application of 10t/ha CM and 15-30-30kg/haNPK+5t/ha CM to
Apomuden had the highest (45.0%) percentage sprouted tubers with the least (20.7%)
recorded by 30-45-45 kg/haNPK and 15-15-15kg/haNPK +5t/ha CM tubers at 12 weeks in
ash storage. However, 30-30-30 kg/haNPK and the control tubers recorded zero values
percent sprouted tuber (0.0) at 12 weeks of ash storage. Application of 30-60-60kg/haNPK
to Okumkom had the highest (60.0%) percentage sprouted tuber with the least (20.7%)
recorded by 10t/ha CM and 15-30-30kg/haNPK+5t/ha CM tubers at 12 weeks of ash
storage. However, 30-30-30kg/haNPK, 15-15-15kg/haNPK +5t/ha CM and the control
tubers recorded the same percentager sprouted tubers (37.7%) at 12 weeks in ash storage.
There was a significant difference in variety x fertilizer interaction in percentage sprouted
tubers at 12 weeks in ash storage (Table. 4.31b).

168
Table 4.31a: Percentage Sprouted Tubers in Ash Storage During the 2011 Minor Season
VarietyWeek 2
Mean
Week 4
Mean
Week 6
Mean
Week 8
Mean
Week 10
Mean
Week 12
MeanApomud. Okumk. Apomud. Okumk. Apomud. Okumk. Apomud. Okumk. Apomud. Okumk. Apomud. Okumk.Fertilizer rate
T 1
T 2
T 3
T 4
T 5
T 6
T 7
T 8
22.4
0.0
0.0
0.0
0.0
22.4
0.0
0.0
0.0
22.4
0.0
0.0
0.0
0.0
0.0
0.0
11.2
11.2
0.0
0.0
0.0
11.2
0.0
0.0
40.3
22.4
0.0
22.3
32.4
22.4
0.0
22.5
0.0
22.4
0.0
0.0
0.0
0.0
0.0
0.0
20.1
22.4
0.0
11.1
16.2
11.2
0.0
11.2
67.4
22.3
22.3
32.4
49.1
32.4
0.0
32.3
0.0
32.3
0.0
0.0
0.0
0.0
0.0
0.0
33.7
27.3
11.1
16.2
24.5
16.2
0.0
16.1
67.4
22.4
32.4
32.4
49.4
32.2
0.0
32.4
0.0
32.4
0.0
0.0
0.0
0.0
0.0
0.0
33.7
27.4
16.2
16.2
24.7
16.1
0.0
16.2
67.4
22.4
32.4
32.5
49.3
32.4
0.0
32.2
0.0
32.3
0.0
0.0
0.0
0.0
0.0
0.0
33.7
27.3
16.2
16.2
24.6
16.2
0.0
16.1
67.4
22.3
32.3
32.4
49.2
32.5
0.0
32.2
0.0
32.3
0.0
0.0
0.0
0.0
0.0
0.0
33.7
27.3
16.1
16.2
24.6
16.2
0.0
16.1
Mean 5.6 2.8 20.3 2.8 32.3 4.0 33.6 4.0 33.6 4.0 33.5 4.0
LSD (P = 0.05); Variety = 0.20 0.30 0.40 0.40 0.50 0.60Fertilizer = 0.50 0.70 0.90 0.80 1.10 1.20
Variety x Fertilizer = 1.70 1.00 1.30 1.10 1.60 1.70
T 1 - No fertilizer T5 - 30-45-45kg/haNPK
T 2 - 10t/ha CM T6 - 15-23-23kg/haNPK +5t/haCM
T3 - 30-30-30 kg/haNPK T7 - 30-60-60kg/haNPK
T 4 - 15-15-15 kg/haNPK + 5t/ha CM T8 - 15-30-30kg/haNPK + 5t/ha CM

169
Table 4.31b: Percentage Sprouted Tubers in Ash Storage During the 2012 Major Season
VarietyWeek 2
Mean
Week 4
Mean
Week 6
Mean
Week 8
Mean
Week 10
Mean
Week 12
MeanApomud. Okumk. Apomud. Okumk. Apomud. Okumk. Apomud. Okumk. Apomud. Okumk. Apomud. Okumk.Fertilizer rate
T 1
T 2
T 3
T 4
T 5
T 6
T 7
T 8
0.0
0.0
0.0
0.0
0.0
0.0
0.0
0.0
0.0
0.0
0.0
0.0
0.0
0.0
0.0
0.0
0.0
0.0
0.0
0.0
0.0
0.0
0.0
0.0
0.0
37.7
0.0
0.0
0.0
0.0
20.7
20.7
20.7
0.0
20.7
0.0
20.7
20.7
37.7
0.0
10.3
18.8
10.3
0.0
10.3
10.3
29.2
10.3
0.0
45.0
0.0
20.7
20.7
30.0
20.7
26.3
30.0
20.7
30.0
30.0
26.3
30.0
37.7
20.7
15.0
32.8
15.0
25.3
23.5
30.0
29.2
23.5
0.0
45.0
0.0
20.7
20.7
37.7
20.7
45.0
37.7
20.7
37.7
37.7
26.4
30.0
60.0
20.7
18.8
32.8
18.8
29.2
23.5
33.8
40.3
32.8
0.0
45.0
0.0
20.7
20.7
37.7
20.8
45.0
37.7
20.7
37.7
37.7
26.5
30.0
60.0
20.7
18.8
32.8
18.8
29.2
23.6
33.8
40.4
32.8
0.0
45.0
0.0
20.7
20.7
37.7
20.8
45.0
37.7
20.7
37.7
37.7
26.5
30.0
60.0
20.7
18.8
32.8
18.8
29.2
23.6
33.8
40.4
32.8
Mean 0.0 0.0 9.8 15.0 20.4 28.1 23.7 33.8 23.7 33.9 23.7 33.9
LSD (P = 0.05); Variety = 0.0 0.36 1.54 1.54 0.54 1.54Fertilizer = 0.0 0.73 3.08 1.00 1.07 3.08
Variety x Fertilizer = 0.0 1.03 4.36 1.41 4.35 4.35
T 1 - No fertilizer T5 - 30-45-45kg/haNPK
T 2 - 10t/ha CM T6 - 15-23-23kg/haNPK +5t/haCM
T3 - 30-30-30 kg/haNPK T7 - 30-60-60kg/haNPK
T 4 - 15-15-15 kg/haNPK + 5t/ha CM T8 - 15-30-30kg/haNPK + 5t/ha CM

170
4.6.4.2 Percentage Sprouted Tuber in Grass storage
Table 4.32 shows the percentage sprouted tuber of two varieties of sweetpotato as
influenced by chicken manure and inorganic fertilizer and stored in grass for 12 weeks. In
the minor season (2011), Apomuden grown on 30-45-45 kg/haNPK treatment which had
the highest (40.4%) percentage sprouted tuber differed significantly from the other
amended and unamended tubers with the least (22.3%) recorded by 15-23-23kg/haNPK
+5t/ha CM and 15-30-30 kg/haNPK +5t/ha CM treatments at the first 6 weeks in grass
storage (Table 4.32a). However, amended and the control tubers of Okumkom recorded
zero values percent sprouted tuber for the same storage period. Application of 30-45-45
kg/haNPK to Apomuden had the highest (40.4%) percentage sprouted tuber at 12 weeks in
grass storage and differed significantly from the other amended and unamended tubers
with the lowest (22.3%) recorded by 15-23-23 kg/haNPK +5t/ha CM and 15-30-
30kg/haNPK +5t/ha CM tubers. Similarly, Okumkom under 15-23-23kg/haNPK +5t/ha
CM treatment had the highest percentage sprouted tuber (32.3%) followed by 15-30-30
kg/haNPK +5t/ha CM (22.5%). The other amended and unamended tubers recorded zero
values for sprouted tubers at 12 weeks in grass storage. There was a significant difference
in variety x fertilizer interaction in percentage sprouted tuber at 12 weeks in ash storage
(Table 4.32a).
In the major season (2012), application of 15-23-23kg/haNPK +5t/ha CM to Apomuden
had the highest (37.7%) percentage sprouted tuber followed by 30-60-60 kg/haNPK treated
tubers at the first 8 weeks in grass storage. However, the other amended and the control
tubers record zero values for sprouted tuber at the first 8 weeks in grass storage (Table
4.32b). Application of 10t/ha CM and 15-23-23kg/haNPK +5t/ha CM to Okumkom had

171
the highest percentage sprouted tubers (37.7%) followed by 30-30-30kg/haNPK (30.0%)
treated tubers with the least recorded by 15-30-30kg/haNPK +5t/ha CMtubers at the first 8
weeks in grass storage. The other amended and unamended tubers recorded no values at
the first 8 weeks in grass storage. However, application of 15-23-23kg/haNPK +5t/ha CM
to Apomuden produced the highest percentage sprouted tubers (37.8%) with the least
recorded by 30-60-60 kg/haNPK tubers at 12 weeks in grass storage. The other amended
and unamended treated tubers recorded zero values sprouted tubers at the same period in
grass storage. Application of 15-23-23kg/haNPK +5t/ha CM to Okumkom however, had
the highest percentage sprouted tubers (37.8%) with the least (20.7%) recorded by 15 -30-
30kg/haNPK +5t/ha CM treated tubers at 12 weeks in grass storage. Apomuden and
Okumkom under 15-23-23kg/haNPK +5t/ha CM had similar (37.8%) sprouted tubers at 12
weeks in grass storage (Table 4.32b).

172
Table 4.32a: Percentage Sprouted Tubers in Grass Storage During the 2011 Minor Season
VarietyWeek 2
Mean
Week 4
Mean
Week 6
Mean
Week 8
Mean
Week 10
Mean
Week 12
MeanApomud. Okumk. Apomud. Okumk. Apomud. Okumk. Apomud. Okumk. Apomud. Okumk. Apomud. Okumk.Fertilizer rate
T 1
T 2
T 3
T 4
T 5
T 6
T 7
T 8
0.0
0.0
22.4
22.3
22.4
22.3
22.4
0.0
0.0
0.0
0.0
0.0
0.0
0.0
0.0
0.0
0.0
0.0
11.2
11.1
11.2
11.1
11.2
0.0
32.4
32.4
32.3
32.3
32.4
22.4
32.4
22.4
0.0
0.0
0.0
0.0
0.0
0.0
0.0
0.0
16.2
16.2
16.1
16.1
16.2
11.2
16.2
11.2
32.4
32.5
32.4
32.3
40.4
22.3
32.3
22.3
0.0
0.0
0.0
0.0
0.0
0.0
0.0
0.0
16.2
16.2
16.2
16.1
20.2
11.1
16.1
11.1
32.2
32.5
32.4
32.4
40.5
22.2
32.4
22.3
0.0
0.0
0.0
0.0
0.0
32.4
0.0
22.3
16.1
16.2
16.2
16.2
20.2
27.3
16.2
22.3
32.3
32.3
32.4
32.5
40.4
22.4
32.4
22.3
0.0
0.0
0.0
0.0
0.0
32.3
0.0
22.4
16.1
16.1
16.2
16.2
20.2
27.3
16.2
22.3
32.4
32.3
32.4
32.3
40.4
22.3
32.2
22.3
0.0
0.0
0.0
0.0
0.0
32.3
0.0
22.5
16.2
16.1
16.2
16.1
20.2
27.3
16.1
22.4
Mean 14.0 0.0 29.9 0.0 30.8 0.0 30.8 6.85 30.9 6.8 30.8 6.8
LSD (P = 0.05); Variety = 0.30 0.40 0.40 0.50 0.40 0.60Fertilizer = 0.60 0.90 0.90 1.00 0.90 1.20
Variety x Fertilizer = 0.90 1.30 1.20 1.50 1.40 1.80
T 1 - No fertilizer T5 - 30-45-45kg/haNPK
T 2 - 10t/ha CM T6 - 15-23-23kg/haNPK +5t/haCM
T3 - 30-30-30 kg/haNPK T7 - 30-60-60kg/haNPK
T 4 - 15-15-15 kg/haNPK + 5t/ha CM T8 - 15-30-30kg/haNPK + 5t/ha CM

173
Table 4.32b: Percentage Sprouted Tubers in Grass Storage During the 2012 Major Season
VarietyWeek 2
Mean
Week 4
Mean
Week 6
Mean
Week 8
Mean
Week 10
Mean
Week 12
MeanApomud. Okumk. Apomud. Okumk. Apomud. Okumk. Apomud. Okumk. Apomud. Okumk. Apomud. Okumk.Fertilizer rate
T 1
T 2
T 3
T 4
T 5
T 6
T 7
T 8
0.0
0.0
0.0
0.0
0.0
0.0
0.0
0.0
0.0
0.0
0.0
0.0
0.0
0.0
0.0
0.0
0.0
0.0
0.0
0.0
0.0
0.0
0.0
0.0
0.0
0.0
0.0
0.0
0.0
20.7
20.7
0.0
0.0
20.7
0.0
0.0
0.0
30.0
0.0
0.0
0.0
10.3
0.0
0.0
0.0
25.3
10.3
0.0
0.0
0.0
0.0
0.0
0.0
37.7
20.7
0.0
0.0
37.7
30.0
0.0
0.0
37.7
0.0
20.7
0.0
18.8
15.0
0.0
0.0
37.7
10.3
10.3
0.0
0.0
0.0
0.0
0.0
37.7
20.7
0.0
0.0
37.7
30.0
0.0
0.0
37.7
0.0
20.7
0.0
18.8
15.0
0.0
0.0
37.7
10.3
10.3
0.0
0.0
0.0
0.0
0.0
37.7
20.7
0.0
0.0
37.7
30.0
0.0
0.0
37.7
0.0
20.7
0.0
18.8
15.0
0.0
0.0
37.7
10.3
10.3
0.0
0.0
0.0
0.0
0.0
37.8
20.8
0.0
0.0
37.7
30.0
0.0
0.0
37.8
0.0
20.7
0.0
18.8
15.0
0.0
0.0
37.8
10.4
10.3
Mean 5.1 6.3 7.3 15.7 7.3 15.7 7.3 15.7 7.3 15.7
LSD (P = 0.05); Variety = 0.0 0.29 1.54 0.34 0.34 0.34Fertilizer = 0.0 0.58 3.08 0.68 0.68 0.68
Variety x Fertilizer = 0.0 1.83 4.36 0.96 0.96 0.96
T 1 - No fertilizer T5 - 30-45-45kg/haNPK
T 2 - 10t/ha CM T6 - 15-23-23kg/haNPK +5t/haCM
T3 - 30-30-30 kg/haNPK T7 - 30-60-60kg/haNPK
T 4 - 15-15-15 kg/haNPK + 5t/ha CM T8 - 15-30-30kg/haNPK + 5t/ha CM

174
4.6.4.3 Percentage Sprouted Tuber in Pit storage
Table 4.33 shows the percentage sprouted tuber of two varieties of sweetpotato grown
under chicken manure, inorganic fertilizer or various combinationsof the two and storeds
in pit for 12 weeks. In the minor season (2011), Apomuden grown on control plot and
stored in pit had the highest (32.4%) percentage sprouted tuber and no mean value
recorded by 30-60-60 kg/haNPK treatment for the first 4 weeks in pit storage.Okumkom
grown on 15-30-30kg/haNPK +5t/ha CM treatment which had the highest percentage
sprouted tuber (22.5%) differed significantly from the other amended tubers which
recorded zero values for the first 4 weeks in pit storage (Table 4.33a) . Application of 15-
15-15 kg/haNPK +5t/ha CM to Apomuden produced the highest (57.4%) percentage
sprouted tuber and differed significantly from the other amended tubers with the least
recorded by the control tubers (32.2%) for the first 8 weeks in pit storage.
At 12 weeks, Apomuden under 15-15-15kg/haNPK +5t/ha CM and 30-30-30 kg/haNPK
treatments which had the highest and the same (57.4%) percentage sprouted tuber differed
significantly from the other amended and control tubers in pit storage. Okumkom grown
on 30-60-60 kg/haNPK treatment, had the highest (49.3%) percentage sprouted tuber and
the least recorded by 10t/ha CM and 30-45-45 kg/haNPK treated tubers at 12 weeks in pit
storage. There was a significant difference in variety x fertilizer in percentage sprouted
tuber at 12 weeks in pit storage (Table 4.33a).
In the major season (2012), application of 15-23-23kg/haNPK +5t/ha CM to Apomuden
had the highest (52.2%) percentage sprouted tubers and 30-60-60kg/haNPK and 15-15-
15kg/haNPK +5t/ha CM tubers recorded zero sprouted tuber at the first 4 weeks in pit
storage. Application of 30-30-30 kg/haNPK to Okumkom which had the highest (52.2%)

175
percentage sprouted tuber differed significantly from other amended and the control tubers
at 4 weeks in pit storage (Table 4.33b). Application of 10t/ha CM and 30-30-30 kg/haNPK
to Apomuden which had the highest and the same (69.2%) percentage sprouted tubers
differed significantly from the control which recorded the least mean (37.7%) at first 8
weeks in pit storage. Similarly, 30-30-30kg/haNPK, 15-23-23kg/haNPK+5t/ha CM and
15-30-30kg/haNPK +5t/ha CM tubers of Okumkom had the highest and the same (69.2%)
percentage sprouted tuberswith the least (20.7%) recorded by 30-60-60 kg/haNPK tubers
at 8 weeks in pit storage A significant difference was observed between Okumkom under
amended except 10t/ha CM and 30-45-45kg/haNPK tubers and the control in percentage
sprouted tubers at the first 8 weeks in pit storage. At 12 weeks application of 30-30-30
kg/haNPK to Apomuden and Okumkom had the same (69.3%) percentage sprouted tubers
in pit storage. There was a significant difference in variety x fertilizer in percentage
sprouted tubers at 12 weeks in pit storage (Table 4.33b). Apomuden and Okumkom under
amended and control plots and stored in pit produced relatively higher percentage sprouted
tubers during the major season than in the minor season at 12 weeks of store (Tables 4.33a
and 4.33b).
Apomuden and Okumkom under amended and control plots and stored in pit produced
higher percentage sprouted tubers compared to ash or grass storage at 12 weeks of store.
Application of 10t/ha CM to Okumkom and storage in grass or pit during the minor season
recorded zero values sprouted tubers at 12 weeks in storage (Tables 4. 32a and 4.33a).

176
Table 4.33a: Percentage Sprouted Tubers in Pit Storage During the 2011 Minor Season
VarietyWeek 2
Mean
Week 4
Mean
Week 6
Mean
Week 8
Mean
Week 10
Mean
Week 12
MeanApomud. Okumk. Apomud. Okumk. Apomud. Okumk. Apomud. Okumk. Apomud. Okumk. Apomud. Okumk.Fertilizer rate
T 1
T 2
T 3
T 4
T 5
T 6
T 7
T 8
22.4
0.0
22.2
22.4
22.2
22.4
0.0
0.0
22.4
0.0
0.0
0.0
0.0
0.0
0.0
0.0
22.4
0.0
11.1
11.2
11.1
11.2
0.0
0.0
32.4
22.4
32.3
22.2
22.3
22.6
0.0
32.3
22.3
0.0
0.0
0.0
0.0
0.0
0.0
22.5
27.3
11.2
16.1
11.1
11.1
11.3
0.0
27.4
32.2
32.4
40.5
40.4
40.5
32.2
40.5
32.2
32.2
0.0
22.3
22.4
0.0
22.4
22.3
32.55
32.2
16.2
31.4
31.4
20.2
27.3
31.4
32.4
32.2
32.4
49.3
57.4
40.4
32.4
40.4
40.5
32.3
0.0
22.3
22.3
0.0
22.3
22.3
40.5
32.3
16.2
35.8
39.8
20.2
27.3
31.3
40.5
32.3
32.5
57.3
57.3
40.5
40.4
49.3
49.2
32.5
0.0
32.4
32.4
0.0
32.2
49.2
40.5
32.4
16.2
44.9
44.8
20.2
36.3
49.2
44.8
32.4
32.4
57.4
57.4
40.4
40.4
49.2
49.2
32.2
0.0
32.4
32.4
0.0
32.4
49.3
40.2
32.3
16.2
44.9
44.9
20.2
36.4
49.2
44.7
Mean 13.9 2.8 23.3 5.6 36.4 19.3 40.6 20.2 44.9 27.4 44.8 27.4
LSD (P = 0.05); Variety = 0.30 0.50 0.50 0.50 0.50 0.60Fertilizer = 0.80 1.10 1.10 1.10 1.00 1.30
Variety x Fertilizer = 1.20 1.60 1.50 1.50 1.50 1.80
T 1 - No fertilizer T5 - 30-45-45kg/haNPK
T 2 - 10t/ha CM T6 - 15-23-23kg/haNPK +5t/haCM
T3 - 30-30-30 kg/haNPK T7 - 30-60-60kg/haNPK
T 4 - 15-15-15 kg/haNPK + 5t/ha CM T8 - 15-30-30kg/haNPK + 5t/ha CM

177
Table 4.33b Percentage Sprouted Tubers in Pit Storage During the 2012 Major Season
VarietyWeek 2
Mean
Week 4
Mean
Week 6
Mean
Week 8
Mean
Week 10
Mean
Week 12
MeanApomud. Okumk. Apomud. Okumk. Apomud. Okumk. Apomud. Okumk. Apomud. Okumk. Apomud. Okumk.Fertilizer rate
T 1
T 2
T 3
T 4
T 5
T 6
T 7
T 8
0.0
0.0
20.7
0.0
30.0
0.0
0.0
0.0
0.0
30.0
0.0
20.7
20.7
20.7
20.7
30.0
0.0
15.0
10.3
10.3
25.3
10.3
10.3
15.0
20.7
37.7
20.7
0.0
37.7
52.2
0.0
20.7
30.0
45.0
52.2
37.7
26.3
45.0
20.7
45.0
25.3
41.3
36.4
18.8
32.0
48.6
10.3
32.8
30.0
45.0
69.2
30.0
30.0
52.2
30.0
37.7
37.7
45.0
52.2
45.0
52.2
69.2
20.7
45.0
33.8
45.0
60.7
37.5
41.1
60.7
25.3
41.3
37.7
69.2
69.2
45.0
45.0
52.2
45.0
52.2
45.0
52.2
69.2
45.0
52.2
69.2
20.7
69.2
41.3
60.7
69.2
45.0
48.6
60.7
32.8
60.7
37.7
69.2
69.3
52.2
45.0
52.2
60.0
52.2
45.0
60.0
69.3
45.0
52.3
69.2
20.8
69.2
41.3
64.6
69.3
48.6
48.6
60.7
40.4
60.7
37.8
69.3
69.3
52.2
45.0
52.2
60.0
52.3
45.0
60.0
69.3
45.0
52.3
69.2
20.8
69.3
41.4
64.6
69.3
48.6
48.6
60.7
40.4
60.8
Mean 6.3 17.8 23.7 37.7 40.5 45.9 51.9 52.8 54.7 53.8 54.8 53.8
LSD (P = 0.05); Variety = 0.42 1.54 0.60 0.56 0.60 0.60Fertilizer = 0.84 3.08 1.20 1.13 1.21 1.22
Variety x Fertilizer = 1.19 4.35 1.69 1.59 1.71 1.72
T 1 - No fertilizer T5 - 30-45-45kg/haNPK
T 2 - 10t/ha CM T6 - 15-23-23kg/haNPK +5t/haCM
T3 - 30-30-30 kg/haNPK T7 - 30-60-60kg/haNPK
T 4 - 15-15-15 kg/haNPK + 5t/ha CM T8 - 15-30-30kg/haNPK + 5t/ha CM

178
4.6.5.0 Percentage Weight Loss of Sweetpotato Tubers in Ash, Grass or Pit
StorageDuring the Minor and The Major Seasons
4.6.5.1 Percentage Weight Loss of Tubers in Ash Storage
Table 4.34 shows the percentage weight loss of two varieties of sweetpotato as influenced
by chicken manure and inorganic fertilizer and storage in ash for 12 weeks. In the minor
seasom (2011), there was a significant difference between Apomuden from Okumkom in
percentage weight loss in tubers..Application of 15-15-15kg/haNPK +5t/ha CM to
Apomuden produced the highest percentage weight loss in tubers followed by 10t/ha CM
tubers with the lowest recorded by 30-45-45kg/haNPK at the first 4 weeks in ash storage
(Table 4. 34a). A significant difference was observed between amended and unamended
tubers in percentage weight loss in tubers in ash storage at the first 4 weeks in storage.
Similarly, Okumkom grown on 15-15-15kg/haNPK +5t/ha CM plot and stored in ash had
the highest percentage weight loss in tubers and differed significantly from 15-30-
30kg/haNPK+5t/ha CM tubers which recorded the lowest mean at the first 4 weeks in ash
storage (Table 4.34a).
At eight weeks in ash storage, 30-60-60kg/haNPK on Apomuden produced the highest
(68.7%) percentage weight loss in tubers with the lowest recorded by 30-45-45kg/haNPK
tubers followed by unamended tubers (49.5%). Application of 15-15-15kg/haNPK +5t/ha
CM to Okumkom had the highest (73.6%) percentage weight loss in tubers and differed
significantly from 10t/ha CM tubers which had the lowest mean (42.4%) at the first 8
weeks in ash storage. There was a significant difference between Apomuden from
Okumkom in percentage weight loss in tubers at 12 weeks in ash storage (Appendix 18).
Application of 30-30-30kg/haNPK and 15-30-30kg/haNPK+5t/ha CM to Apomuden

179
which recorded the highest percentage weight loss in tubers at 12 weeks in ash storage
differed significantly from the other amended and unamended treatments with the lowest
weight loss recorded by unamended tubers. Okumkom under 15-15-15kg/haNPK +5t/ha
CM differed significantly from unamended tubers in percentage weight loss at 12 weeks in
ash storage. There was a significant difference in variety x fertilizer interaction in
percentage tuber weight loss at 12 weeks in ash storage (Table 4.34a).
In the major season (2012), Apomuden under controland stored in ash which had the
highest (41.52%) percentage weight loss in tubers differed significantly from amended
tubers at the first 4 weeks in ash storage. Application of 15-23-23kg/haNPK +5t/ha CM to
Okumkom produced the highest (28.46%) percentage tuber weight lossand differed
significantly from other amended and unamended tubers which recorded the lowest
mean(10.78%) at the first 4 weeks in ash storage (Table 4 34b).
Similarly, application of 30-60-60kg/haNPK to Apomuden which had the highest
percentage weight loss in tubers (70.25%) differed significantly from the other amended
and unamended tubers at the first 8 weeks in ash storage with the least (37.49%) weight
loss recorded by 15-23-23kg/haNPK+5t/ha CM tubers. Okumkom under 15-23-
23kg/haNPK+5t/ha CM differed significantly from the other amended and unamended
tubers and had the highest (52.36%) percentage tuber weight loss at the first 8 weeks in
ash storage with the least (16.36%) recorded by 30-60-60kg/haNPK tubers. At 12 weeks
30-60-60 kg/haNPK grown on Apomuden had the highest (76.22%) percentage tuber
weight loss and differed significantly from the other amended and unamended tubers with
the least tuber weight loss recorded by 15-23-23kg/haNPK +5t/ha CM tubers in ash
storage. Okumkom grown on 15-23-23 kg/haNPK +5t/ha CM had the highest percentage

180
weight loss in tubers (58.54%) at 12 weeks in ash storage. followed by 30-45-45kg/haNPK
(57.19%) tubers with the least tuber weight loss recorded by 30-60-60kg/haNPK fertilized
tubers There was a significant difference in variety x fertilizer interaction in percentage
tuber weight loss at 12 weeks in ash storage (Table 4.34b).

181
Table 4.34a: Percentage Weight loss of Tubers in Ash Storage During the 2011 Minor Season
VarietyWeek 2
Mean
Week 4
Mean
Week 6
Mean
Week 8
Mean
Week 10
Mean
Week 12
MeanApomud. Okumk. Apomud. Okumk. Apomud. Okumk. Apomud. Okumk. Apomud. Okumk. Apomud. Okumk.Fertilizer rate
T 1
T 2
T 3
T 4
T 5
T 6
T 7
T 8
23.6
26.8
26.2
29.4
23.5
24.4
24.4
23.3
13.5
24.8
22.5
23.7
22.6
22.7
21.5
11.6
18.6
25.8
24.3
26.6
23.1
23.5
22.9
17.5
31.4
38.5
38.4
39.4
30.5
36.3
34.6
30.6
24.6
29.7
23.7
57.6
31.3
27.6
30.3
22.7
28.0
34.1
31.0
48.5
30.9
31.9
32.4
26.7
39.6
54.2
51.4
55.3
36.5
45.3
54.6
41.5
40.6
34.4
33.4
71.6
41.6
36.4
36.5
40.4
40.1
44.3
42.4
63.4
39.0
40.9
45.5
41.0
49.5
66.6
63.6
64.6
48.4
57.5
68.7
61.6
50.4
42.4
49.3
73.6
65.6
52.6
47.4
51.6
50.0
54.5
56.5
69.1
57.0
55.0
58.1
56.6
64.6
78.4
90.3
75.4
73.3
82.4
85.6
90.3
60.3
59.4
59.6
73.7
70.5
58.5
59.5
66.7
62.4
68.9
74.9
74.5
71.9
70.4
72.5
78.5
69.4
81.2
92.1
80.3
79.2
85.1
87.3
92.1
65.1
65.1
65.4
78.3
75.2
64.3
65.3
70.4
67.3
73.2
78.8
79.3
77.2
74.7
76.3
80.8
Mean 25.2 20.4 34.9 30.9 47.3 41.9 60.1 54.1 80.0 63.5 83.3 68.6
LSD (P = 0.05); Variety = 0.38 0.40 0.44 0.41 0.41 0.78Fertilizer = 0.77 1.80 0.89 0.83 0.83 1.57
Variety x Fertilizer = 1.20 1.13 1.26 1.18 1.18 2.22
T 1 - No fertilizer T5 - 30-45-45kg/haNPK
T 2 - 10t/ha CM T6 - 15-23-23kg/haNPK +5t/haCM
T3 - 30-30-30 kg/haNPK T7 - 30-60-60kg/haNPK
T 4 - 15-15-15 kg/haNPK + 5t/ha CM T8 - 15-30-30kg/haNPK + 5t/ha CM

182
Table 4.34b: Percentage Weight loss of Tubers in Ash Storage During the 2012 Major Season
VarietyWeek 2
Mean
Week 4
Mean
Week 6
Mean
Week 8
Mean
Week 10
Mean
Week 12
MeanApomud. Okumk. Apomud. Okumk. Apomud. Okumk. Apomud. Okumk. Apomud. Okumk. Apomud. Okumk.Fertilizer rate
T 1
T 2
T 3
T 4
T 5
T 6
T 7
T 8
11.51
11.51
16.27
5.24
18.41
13.32
5.6
14.8
6.24
12.21
12.35
9.30
14.33
13.81
11.23
12.77
8.8
11.8
14.3
7.2
16.3
13.5
8.4
13.8
41.52
14.69
34.61
31.65
30.62
34.42
30.49
30.62
10.78
19.62
18.24
15.60
14.33
28.46
11.27
24.68
26.15
17.15
26.43
23.62
22.47
31.44
20.88
27.65
43.26
24.60
41.67
31.58
33.24
35.25
35.55
31.33
18.83
19.62
21.46
18.41
17.32
32.50
14.55
24.58
31.05
22.11
31.56
25.00
25.28
33.88
25.05
27.95
49.34
40.34
47.37
55.48
49.60
37.49
70.25
51.48
24.61
25.30
25.43
28.34
21.32
52.36
16.36
36.26
36.98
32.82
36.40
41.91
35.46
44.92
43.30
43.87
66.37
53.64
62.38
58.49
60.62
43.26
76.22
58.22
45.38
37.63
30.31
37.75
57.35
58.58
26.49
53.71
55.88
45.64
46.35
48.12
58.99
50.92
51.36
55.96
66.27
53.64
62.35
58.42
60.49
43.26
76.22
58.18
45.35
37.47
30.28
37.55
57.19
58.54
26.46
53.68
55.81
45.55
46.32
47.99
58.84
50.90
51.34
55.93
Mean 12.0 11.5 31.08 17.87 34.56 20.91 50.17 28.75 59.90 43.40 59.86 43.31
LSD (P =0.05); Variety = 0.53 0.62 0.59 0.56 0.58 0.67Fertilizer = 1.07 1.24 1.18 1.13 1.17 1.34
Variety x Fertilizer = 1.52 1.75 1.66 1.61 1.66 1.90
T 1 - No fertilizer T5 - 30-45-45kg/haNPK
T 2 - 10t/ha CM T6 - 15-23-23kg/haNPK +5t/haCM
T3 - 30-30-30 kg/haNPK T7 - 30-60-60kg/haNPK
T 4 - 15-15-15 kg/haNPK + 5t/ha CM T8 - 15-30-30kg/haNPK + 5t/ha CM

183
4.6.5.2 Percentage Tuber Weight Loss in Grass storage
Table 4.35shows the percentage weight loss of two varieties of sweetpotato as influenced
by chicken manure and inorganic fertilizer and storage in grass for 12 weeks.In the minor
season (2011), application of 30-30-30kg/haNPK to Apomuden and stored in grass had the
highest (41.5%) percentageweight loss in tuberswith the lowest recorded by 10t/ha CM
tubers at the first 4 weeks in grass storage (Table 4.35a). Application of 10t/ha CM to
Okumkom which had the highest percentage weight loss in tubers differed significantly
from other amended and unamended tubers at the first 4 weeks in grass storage.Apomuden
on unamended treatment had the highest (69.4%) percentage weight loss in tubers with the
lowest (53.6%) tuber weight loss recorded by 15-30-30kg/haNPK +5t/ha CM tubers at 8
weeks in grass storage.10t/ha CM tubers of Okumkom had the highest percentage weight
loss in tubers and differed significantly from other amended and unamended treatmentat
the first 8 weeks in grass storage with the lowest recorded by 30-60-60kg/haNPK tubers
(Table 4.35a).At 12 week application of 15-30-30kg/haNPK+5t/ha CM and 15-15-
15kg/haNPK +5t/ha CM to Apomuden which had the highest percentage weight loss in
tubers differed significantly from unamended tubers in grass storage. 10t/ha CM tubers of
Okumkom had the highest percentage weight loss of tubers and differed significantly from
the other amended tubers with the lowest recorded by 30-60-60kg/haNPKtubers at 12
weeks in grass (Appendix 19) .There was a significant differencein variety x fertilizer
interaction in percentage weight loss in tubers at 12 weeks in grass storage (Table 4.35a).
In the major season 30-45-45 kg/haNPK to Apomuden had the highest (62.50%)
percentage weight loss in tubers and differed significantly from the other amended and
unamended tubers at the first 6 weeks in grass storage with the least (20.73%) tuber

184
weight loss recorded by15-15-15kg/haNPK +5t/ha CM treatment. However, unamended
tubers of Okumkom which had the highest (32.64%) percentage weight loss in tubers
followed by 15-30-30kg/haNPK +5t/ha CM treated tubers (31.78%) differed significantly
from the other amended tubers at 6 weeks in grass storage(Table 4 35b).
30-45-45 kg/haNPK to Apomuden had the highest (81.29%) percentage weight loss with
the lowest (47.30%) recorded by 15-23-23kg/haNPK +5t/ha CM tubers at 12 weeks in
grass storage. A significant difference was observed between amended tubersand the
unamended treatments in percentage weight loss of tubers at 12 weeks in grass
storage.Application of 15-30-30kg/haNPK +5t/ha CM to Okumkom had the highest
percentage (58.25%) weight loss in tubers with the least (32.13%) recorded by 10t/ha CM
tubers followed by 15-15-15kg/haNPK +5t/ha CM tubers (32.16%) at 12 weeks in grass
storage. A significantdifference was observed in variety x fertilizer interaction in
percentage weight loss in tubers at 12 weeks in grass storage (Table 4.35b).
4.6.5.3 Percentage Tuber Weight Loss in Pit storage
Table 4.36 shows the percentage weight loss of two varieties of sweetpotato tubers as
influenced by chicken manure and inorganic fertilizer sand storage in pit for 12 weeks. In
the minor season (2011), 30-45-45kg/haNPK to Apomuden had the highest percentage
weight loss in tubers followed by 30-60-60 kg/haNPK fertilized tubers with the lowest
recorded by 15-30-30 kg/haNPK +5t/ha CM tubers at the first 4 weeks in pit (Table 4.
36a). Application of 15-30-30 kg/haNPK+5t/ha CM to Okumkom which had the highest
percentage weight loss in tubers differed significantly from the other amended and
unamended treatment at the first 4 weeks in pit storage.

185
Table 4.35a: Percentage Weight loss of Tubers in Grass Storage During the 2011 Minor Season
VarietyWeek 2
Mean
Week 4
Mean
Week 6
Mean
Week 8
Mean
Week 10
Mean
Week 12
MeanApomud. Okumk. Apomud. Okumk. Apomud. Okumk. Apomud. Okumk. Apomud. Okumk. Apomud. Okumk.Fertilizer rate
T 1
T 2
T 3
T 4
T 5
T 6
T 7
T 8
24.4
22.6
23.5
24.5
23.5
25.6
24.5
21.4
23.4
30.4
29.6
7.4
31.4
18.5
18.5
22.6
23.9
26.5
26.6
15.9
27.4
22.0
21.5
22.0
40.5
37.5
41.5
40.6
38.4
39.5
39.6
37.6
36.7
47.4
42.4
33.4
46.4
33.5
35.3
42.5
38.6
42.5
41.9
37.0
42.4
36.5
37.4
40.1
54.3
47.3
50.4
47.5
46.6
48.6
49.3
50.5
44.1
61.5
46.4
42.4
54.4
43.4
40.5
58.4
49.2
54.4
48.4
45.0
50.5
46.0
44.9
54.4
69.4
56.5
63.6
55.6
59.5
64.7
64.3
53.6
66.5
76.4
52.5
52.5
57.3
57.4
46.6
65.5
67.9
66.4
58.0
54.0
58.4
61.0
55.4
59.6
75.5
73.4
78.4
90.3
80.5
83.5
80.4
90.3
68.5
76.6
60.4
63.3
62.6
68.4
56.7
72.3
72.0
75.0
69.4
76.8
71.5
76.0
68.5
81.3
80.3
78.2
83.1
92.2
85.2
88.3
85.3
92.2
74.4
80.3
65.2
68.2
67.2
73.4
60.5
77.2
77.4
79.3
74.2
80.2
76.2
80.9
72.9
84.7
Mean 23.8 22.7 39.4 39.7 49.3 48.9 60.9 59.3 81.5 66.1 85.6 70.8
LSD (P =0.05); Variety = 0.30 NS 0.44 0.41 0.43 0.81Fertilizer = 0.78 0.85 0.89 0.83 0.87 1.63
Variety x Fertilizer = 1.10 1.21 1.27 1.18 1.23 2.31
T 1 - No fertilizer T5 - 30-45-45kg/haNPK
T 2 - 10t/ha CM T6 - 15-23-23kg/haNPK +5t/haCM
T3 - 30-30-30 kg/haNPK T7 - 30-60-60kg/haNPK
T 4 - 15-15-15 kg/haNPK + 5t/ha CM T8 - 15-30-30kg/haNPK + 5t/ha CM

186
Table 4.35b: Percentage Weight loss of Tubers in Grass Storage During the 2012 Major Season
VarietyWeek 2
Mean
Week 4
Mean
Week 6
Mean
Week 8
Mean
Week 10
Mean
Week 12
MeanApomud. Okumk. Apomud. Okumk. Apomud. Okumk. Apomud. Okumk. Apomud. Okumk. Apomud. Okumk.Fertilizer rate
T 1
T 2
T 3
T 4
T 5
T 6
T 7
T 8
13.47
14.23
22.34
8.52
14.11
7.41
11.45
22.36
7.28
7.43
18.41
6.28
20.60
16.41
19.15
8.18
10.51
10.83
20.37
7.40
17.36
11.91
15.30
15.27
47.42
34.42
47.42
15.56
60.69
26.52
35.42
34.63
28.44
11.40
20.29
12.51
20.60
25.53
19.29
30.62
37.93
22.91
33.85
14.04
40.65
26.03
27.35
32.63
49.20
39.21
50.72
20.73
62.50
28.70
41.48
37.27
32.64
14.23
21.72
14.15
22.24
30.62
23.33
31.78
40.92
26.72
36.22
17.44
42.37
29.66
32.41
34.52
52.42
43.82
61.41
40.51
77.42
33.73
41.58
42.31
32.51
16.25
30.62
20.19
31.70
48.42
41.58
38.25
42.46
30.03
46.02
30.35
54.56
41.07
33.08
40.28
67.56
75.81
70.28
67.35
81.29
47.27
47.56
49.32
38.41
32.40
36.62
32.71
36.63
51.52
35.32
58.25
52.99
54.10
53.45
50.03
58.96
49.39
41.44
53.79
67.76
75.77
70.31
67.29
81.29
47.30
47.56
49.32
38.28
32.33
36.46
32.61
36.50
51.25
35.52
58.25
53.02
54.05
53.39
49.95
58.90
49.28
41.54
53.79
Mean 14.27 12.97 37.76 21.08 41.23 23.84 49.15 30.31 63.31 40.23 63.33 40.15
LSD (P = 0.05); Variety = 0.53 0.60 0.57 0.57 0.52 0.54Fertilizer = 1.0 31.21 1.15 1.15 1.05 1.08
Variety x Fertilizer = 1.46 1.71 1.63 1.63 1.49 1.53
T 1 - No fertilizer T5 - 30-45-45kg/haNPK
T 2 - 10t/ha CM T6 - 15-23-23kg/haNPK +5t/haCM
T3 - 30-30-30 kg/haNPK T7 - 30-60-60kg/haNPK
T 4 - 15-15-15 kg/haNPK + 5t/ha CM T8 - 15-30-30kg/haNPK + 5t/ha CM

187
At the first 8 weeks in pit storage unamended tubers of Apomuden had the highest
percentage (72.4%) weight loss in tubers followed by 30-30-30kg/haNPK tubers with the
lowest (33.5%) weight loss. recorded by 15-15-15kg/haNPK +5t/ha CM tubers. Tubers
produced from application of 30-30-30kg/haNPK to Okumkom which produced the
highest percentage (59.5%) weight loss in tubers differed significantly from the other
amended and unamended treatments at the first 8 weeks in pit storage. There was a
significant difference between Apomuden and Okumkom in percentage weight loss in
tubers (Appendix 20). Application of 30-60-60 kg/haNPK to Apomuden produced tubers
with the highest percentage weight loss in tubers which differed significantly from the
other amended and unamended tretments at 12 weeks in pit storage. Application of 30-45-
45kg/haNPK to Okumkom had the highest percentage weight loss of tubers with the lowest
recorded by 10t/ha CM tubers at 12 weeks in pit storage. Generally, in the minor season,
Apomuden and Okumkom grown on amended plots and stored in grass had the highest
percentage weight loss in tubers at 12 weeks in storage, followed by ash storage and the
least recorded by tubers stored in pit (Tables 4.34a. 4.35a and 4.36a).
In the major season (2012) application of 30-45-45 kg/haNPK to Apomuden had the
highest (44.60%) percentage tuber weight loss with the lowest (13.49%) tuber weight loss
recorded by 15-23-23 kg/haNPK +5t/ha CM tubers at the first 4 weeks in pit storage. A
significant difference was observed between amended and unamended treatments in
percentage weight loss in tubers of Apomuden at the first 4 weeks in pit storage (Table
4.36b). Application of 30-45-45kg/haNPK to Okumkom had the highest percentage
(31.36%) weight loss in tubers and differed significantly from other amended and
unamended treatments. The lowest percentage (6.38%) weight loss in tubers was recorded
188
by 15-30-30kg/haNPK +5t/ha CM treated tuber at 4 weeks in pit storage. Apomuden
grown on 30-45-45kg/haNPK plot had the highest percentage ((47.30%) weight loss in
tubers followed by unamended tubers (46.32%) with the lowest (15.60%) weight loss
recorded by 15-23-23kg/haNPK +5t/ha CM tubers at 8 weeks in pit storage. A
significantdifference was observed between amended and unamended treatmentsin
percentage weight loss in tubers at 8 weeks in pit storage. Application of 30-60-
60kg/haNPK to Okumkom had the highest percentage (64.30%) weight loss in tubers and
differed significantly from other amended and unamended treatments with the lowest
(14.31%)recorded by 30-30-30 kg/haNPK tubers at 8 weeks in pit storage. A significant
difference was observed between treatments at 8 weeks in pit storage.
At 12 weeks application of 30-45-45 kg/haNPK to Apomuden had the highest percentage
(49.51%) tuber weight loss with the lowest (21.65%)tuber weight loss recorded by 30-30-
30kg/haNPKtubers in pit storage. 30-60-60kg/haNPK on Okumkom had the highest
percentage (90.0%) weight loss in tubers with the lowest (10.61%) weight loss recorded by
30-30-30kg/haNPKtubersat 12 weeks in pit storage. There was a significant difference in
variety x fertilizer interaction in percentage weight loss of tubers at 12 weeks in pit storage
(Table 4.36b).
Generally, application of amendment treatments to Apomuden and storage in ash, grass or
pit during the minor season produced substantially higher percentage tuber weight loss at
12 weeks as compared to similarly treated tubers stored under the same condition during
the major season (Tables 4.34, 4.35 and 4.36).

189
Table 4.36a: Percentage Weight loss of Tubers in Pit Storage During the 2011 Minor Season
VarietyWeek 2
Mean
Week 4
Mean
Week 6
Mean
Week 8
Mean
Week 10
Mean
Week 12
MeanApomud. Okumk. Apomud. Okumk. Apomud. Okumk. Apomud. Okumk. Apomud. Okumk. Apomud. Okumk.Fertilizer rate
T 1
T 2
T 3
T 4
T 5
T 6
T 7
T 8
15.5
28.1
9.6
23.6
40.2
18.2
22.6
18.2
20.4
22.5
24.7
14.5
20.6
18.5
18.7
23.5
17.9
25.3
17.1
19.1
30.4
18.3
20.6
20.8
31.6
32.6
34.2
29.7
48.6
35.1
48.5
28.5
34.6
45.5
52.5
31.1
38.3
27.3
27.7
56.7
33.1
39.1
43.3
30.4
43.5
31.2
38.1
42.6
40.3
42.5
61.4
32.5
48.5
36.5
57.6
37.5
44.6
46.6
58.4
37.4
48.6
40.8
40.7
57.5
42.4
44.6
59.9
35.0
48.5
38.7
49.2
47.5
72.4
60.5
70.5
33.5
54.4
60.7
59.3
55.6
50.6
47.7
59.5
50.4
55.5
47.6
53.8
58.3
61.5
54.1
65.0
42.0
54.9
54.2
56.5
57.0
73.4
65.4
73.5
34.7
55.1
61.0
78.0
59.4
57.5
53.5
59.5
51.4
68.4
59.6
63.4
64.7
65.5
59.5
66.5
43.1
61.7
60.3
70.7
62.1
75.2
70.3
76.4
39.6
60.2
65.2
81.4
65.4
61.2
58.3
63.2
56.2
74.2
66.2
69.2
69.3
68.2
64.3
69.8
47.9
67.2
65.7
75.3
67.4
Mean 22.0 20.4 36.1 39.2 44.6 46.9 58.4 52.9 62.6 59.8 66.7 64.7
LSD (P = 0.05); Variety = 0.43 0.40 0.42 0.40 0.43 0.77Fertilizer = 0.87 0.81 0.84 0.81 0.86 1.54
Variety x Fertilizer = 1.23 1.15 1.19 1.15 1.22 2.18
T 1 - No fertilizer T5 - 30-45-45kg/haNPK
T 2 - 10t/ha CM T6 - 15-23-23kg/haNPK +5t/haCM
T3 - 30-30-30 kg/haNPK T7 - 30-60-60kg/haNPK
T 4 - 15-15-15 kg/haNPK + 5t/ha CM T8 - 15-30-30kg/haNPK + 5t/ha CM

190
Table 4.36b: Percentage Weight loss of Tubers in Pit Storage During the 2012 Major Season
VarietyWeek 2
Mean
Week 4
Mean
Week 6
Mean
Week 8
Mean
Week 10
Mean
Week 12
MeanApomud. Okumk. Apomud. Okumk. Apomud. Okumk. Apomud. Okumk. Apomud. Okumk. Apomud. Okumk.Fertilizer rate
T 1
T 2
T 3
T 4
T 5
T 6
T 7
T 8
6.61
10.31
12.40
9.03
10.28
4.81
14.72
10.18
14.41
12.60
6.34
14.72
10.75
4.81
8.77
6.41
10.51
11.46
9.37
11.88
10.51
4.81
11.75
8.30
41.52
13.55
14.25
14.46
44.60
13.49
21.41
21.26
15.47
18.79
14.28
20.42
31.36
11.27
24.33
6.38
28.49
16.17
14.27
17.44
37.98
12.38
22.87
13.82
43.36
16.31
14.45
14.43
46.54
14.82
22.73
24.06
18.80
19.72
14.35
43.30
31.49
11.23
50.69
28.47
31.08
18.01
14.40
28.86
39.01
13.03
36.71
26.26
46.32
18.68
16.30
38.40
47.30
15.60
24.23
26.28
37.38
36.40
14.31
57.40
37.50
18.23
64.30
53.68
41.85
27.54
15.31
47.90
42.40
16.91
44.27
39.98
47.63
30.65
21.78
45.00
49.51
35.45
24.36
37.42
46.56
36.44
10.71
57.30
47.55
16.53
90.00
53.28
47.09
33.55
16.25
51.15
48.53
25.99
57.18
45.35
47.63
30.59
21.65
45.00
49.51
35.39
24.46
37.38
46.80
36.44
10.61
57.37
47.48
16.53
90.00
53.45
47.21
33.51
16.13
51.18
48.50
25.96
57.23
45.42
Mean 9.79 9.85 23.07 17.79 24.59 27.26 29.14 39.90 36.48 44.80 36.45 44.83
LSD (P = 0.05); Variety = NS 0.60 0.61 0.62 0.43 0.52Fertilizer = 0.97 1.21 1.21 1.25 0.87 1.03
Variety x Fertilizer = 1.38 1.71 1.72 1.76 1.23 1.46
T 1 - No fertilizer T5 - 30-45-45kg/haNPK
T 2 - 10t/ha CM T6 - 15-23-23kg/haNPK +5t/haCM
T3 - 30-30-30 kg/haNPK T7 - 30-60-60kg/haNPK
T 4 - 15-15-15 kg/haNPK + 5t/ha CM T8 - 15-30-30kg/haNPK + 5t/ha CM

191
4.7 Beta-Carotene Content of Sweetpotato Root Tubers
4.7.1 Beta-Carotene Content of Sweetpotato Root Tubers at Harvest
Table 4.37 shows beta-carotene content of two varieties of sweetpotato tubers at harvest as
influenced by chicken manure and inorganic fertilizer. In the minor season (2011),
therewas a significant difference between Apomuden from Okumkomon beta-carotene
content of tubers at harvest (Appendix 14). Beta-carotene content ranged from 1.4-30.3
mg/100g for Apomuden and 1.2- 8.6 mg/100g for Okumkom. The resultshowed significant
effect of organic and inorganic fertilizers either singly or in combination on beta-carotene
content of tubers at harvest (Table 4.37).
In the major season (2012), therewas a significant difference between Apomuden from
Okumkomon beta-carotene content of tubers at harvest (Appendix 15). Beta-carotene
contents ranged from 1.1-14.9 mg/100g for Apomuden and 0.2- 0.7 mg/100g for
Okumkom. Apomuden grown on both amended and the control plots produced
significantly higher beta-carotene content than Okumkom at harvest The result showed
significant effects of organic and inorganic fertilizers either singly or in combination on
beta-carotene content of tubers at harvest for both varieties.Apomuden grown on amended
and the control plots gave relatively higher beta-carotene in both seasons than Okumkom
(Table 4.37).

192
Table 4.37:Beta-Carotene Content Of Tubers at Harvest during the 2011 minor season and2012 major season
Variety
Beta-Carotene of tuberat Harvest (mg/100g)
(minor season)
Mean
Beta-Carotene oftuber at Harvest
(mg/100g)(major season)
MeanApomud. Okumk. Apomud. Okumk.Fertilizer RatesNo fertilizer
10t/ha CM
30-30-30kg/haNPK
15-15-15 kg/haNPK + 5t/ha CM
30-45-45 kg/haNPK
15-23-23 kg/haNPK + 5t/ha CM
30-60-60 kg/haNPK
15-30-30 kg/haNPK + 5t/ha CM
6.1
15.4
1.4
9.3
4.2
7.5
4.4
30.3
4.1
1.4
4.3
6.1
1.2
4.6
2.3
8.6
5.1
8.4
2.9
7.7
2.7
6.1
3.3
19.5
3.1
4.3
13.1
13.3
14.9
2.9
7.5
1.1
0.4
0.3
0.4
0.4
0.7
0.4
0.2
0.4
1.7
2.3
6.7
6.9
7.8
1.6
3.8
0.7Mean
LSD (P =0.05); VarietyFertilizer
Variety x Fertilizer
9.9 4.1
0.621.241.75
14.1 1.8
0.0260.0520.074
7.52 0.38

193
4.7.2 Beta-Carotene Content of Sweetpotato Root Tubers after 12 weeks in Pit Or
Ash Storage
Table 4.38 shows beta-carotene content of two varieties of sweetpotato tubers for 12 weeks
in pit and ash storage as influenced by chicken manure and inorganic fertilizers. In the
minor season (2011), there was a significant difference between Apomuden and Okumkom
for beta-carotene content of tubers in pit storage (Appendix 16). Okumkom grown on
control treatment as well as amendments except 10 t/ha CM, 15-15-15 kg/ha NPK +
5t/haCM and 30-45-45kg/ha NPK recorded zero values for beta carotene and the control
on beta carotene of tuberafter 12 weeks in pit storage. There was a significant effect of
organic and inorganic fertilizers either singly or in combination on beta-carotene content of
tubers in pit storage.
In the major season (2012), there was a significant difference between Apomuden from
Okumkomon beta-carotene content of tubers in pit storage (Appendix 17). Application of
15-23-23kg/ha NPK +5t/ha CM to Apomuden which had the highest (21.07 mg/100g)
beta-carotene content of tubers differed significantly from the control in pit storage at 12
weeks. Okumkom grown on 30-60-60 kg/ha NPK plot had the highest beta-carotene
content (2.87mg/100g) of tubers followed by 15-23-23 kg/haNPK+5t/ha CM (2.73
mg/100g) with the lowest (0.48 mg/100g) beta-carotene recorded by 15-15-
15kg/haNPK+5t/ha CM tubers at 12 weeks in pit storage. There was significant difference
in variety x fertilizer interaction on beta-carotene content of tubers at 12 weeks in pit
storage.There was a relatively higher beta-carotene in Apomuden grown on amended and
the control plots after 12 weeks of pit storage during the minor and the major seasons than
Okumkom under similar treatments. There was a relatively higher beta-carotene in

194
Apomuden treated with amended and the control plots and stored in pit for 12 weeks in the
minor season than at harvest except for 30-45-45 kg/ha NPKplot (Table 4.38).
In the case of ash storage, Apomuden and Okumkom stored in ash did not store well
recording zero values after 12 weeks in storage for beta carotene content of tubers during
the minor season (Table 4.38). In the major season (2012), Apomuden tubers produced on
amendment treatments except 15-23-23 kg/ha NPK+5t/ha CM and the control and stored
in ash did not store well recording zero beta carotene at 12 weeks of storage. There was
significant difference in variety x fertilizer interaction for beta-carotene content of tubers at
12 weeks in ash storage. Pit storage was the most effective storage method in terms of
tuber beta-carotene content followed by ash storage with the least beta carotene by grass
storage at 12 weeks of storage (Table 4.38).
4.8 Percentage Sugar Content of Sweetpotato RootTubers At Harvest and After
12 Weeks of Storage in Ash, Grass orPit During 2011 minor season and 2012
major season
4.8.1 Percentage Sugar Content of Root Tubers at Harvest
The results of percentage sugar content of tubers at harvest as influenced by chicken
manure, inorganic fertilizers and variety is presented in Table 4.39. In the minor season
(2011), there was a significant difference between Okumkom and Apomuden in percentage
sugar content of tubers at harvest Apomuden grown on 15-23-23 kg/haNPK+ 5t/ha CM
plot had the highest (13.5%) percentage sugar content of tubers at harvest with the lowest
(10.0%) sugar content recorded by tubers grown on 30-45-45kg/haNPK tubers.

195
Table 4.38: Beta-Carotene Content of Sweetpotato Tubers Stored in Pit and Ash for 12 weeks during 2011 minorseason and 2012 major season
Variety
Beta-Carotene of tuberat12 weeks in storage –Pit ( mg/100g)
(minor season)
Mean
Beta-Carotene of tuberat 12 weeks in storage– Pit ( mg/100g)
(major season)
Mean
Beta-Carotene oftuber at 12 weeks instorage –Ash(mg/100g)(major season)
Apomud. Okumk. Apomud Okumk Apomd Okumk Mean
Fertilizer RatesNo fertilizer
10t/ha CM
30-30-30 kg/haNPK
15-15-15 kg/haNPK+ 5t/ha CM
30-45-45 kg/haNPK
15-23-23 kg/haNPK+ 5t/ha CM
30-60-60 kg/haNPK
15-30-30 kg/haNPK + 5t/haCM
25.4
28.7
36.1
32.2
31.5
34.5
5.5
32.6
0.0
25.2
0.0
0.2
0.1
0.0
0.0
0.0
12.7
27.0
18.0
16.2
15.7
17.2
2.7
16.3
4.26
17.6
10.57
16.48
15.78
21.07
14.78
12.40
1.83
1.79
1.55
0.48
1.40
2.73
2.87
1.76
3.04
9.72
6.06
8.48
8.59
11.90
8.82
7.08
0.0
0.0
0.0
0.0
0.0
1.54
0.0
0.0
0.0
2.19
2.03
2.26
1.53
0.0
1.31
0.0
0.0
1.09
1.01
1.13
0.76
0.77
0.65
0.0
Mean
LSD (P =0.05); VarietyFertilizer
Variety x Fertilizer
28.3 3.2
0.490.981.39
14.12 1.80
0.020.040.0
0.19 1.16
0.0030.0070.010

196
Application of 10t/ha CM to Okumkom gave the highest (24.5%) percentage sugar
content of tuber at harvest and differed significantly from the other amendment treatments
and the control. There was a significant difference in variety x fertilizer in percentage
sugar content of tubers at harvest (Table 4.39).
In the major season (2012), there was a significant difference between Okumkom and
Apomuden in percentage sugar content of tubers at harvest. Application of 30-45-45
kg/haNPK to Apomuden gave the highest (11.7%) percentage sugar content of tuber at
harvest followed by 15-15-15kg/haNPK+5t/ha CM tubers (11.0%) which differed
significantly from the control tubers. Okumkom grown on 30-30-30kg/haNPK, 30-45-
45kg/haNPK and 30-60-60 kg/haNPK treatments recorded the same and the highest (12.0
%) percentage sugar content of tuber at harvest and the lowest (11.0%) sugar content
recorded by 10t/ha CM and 15-30-30kg/haNPK+5t/ha CM tubers. There was a significant
difference in variety x fertilizer interaction in percentage sugar content of tuber at harvest
(Table 4.39). Generally, Apomuden and Okumkom grown on amended and unamended
plots during the minor season produced substantially higher percentage sugar content of
tubers at harvest than during the major season (Table 4. 39).
4.8.2 Percentage Sugar Content of Sweetpotato Root Tubers after 12 Weeks of
Storage During 2011 Minor Seasonand 2012 Major Season
The result of percentage sugar of sweetpotato tubers after 12 weeks in pit or ash storage as
influenced by chicken manure, inorganic fertilizers and variety is presented in Table 4.40.
In the minor season (2011), there was a significant difference in variety x fertilizer
interaction in percentage sugar content of tubers after 12 weeks in storage.

197
Table 4.39: Percentage Sugar Content OfSweetpotato Root Tubers at HarvestDuring 2011 Minor Season and 2012 Major Season
Variety
Percentage Sugar oftuber at harvest (%)
(minor season)Mean
Percentage Sugarof tuber at harvest(%) (major season)
MeanApomud. Okumk. Apomud. Okumk.Fertilizer RatesNo fertilizer
10t/ha CM
30-30-30kg/haNPK
15-15-15 kg/haNPK+ 5t/ha CM
30-45-45 kg/haNPK
15-23-23 kg/haNPK + 5t/ha CM
30-60-60 kg/haNPK
15-30-30 kg/haNPK + 5t/ha CM
12.1
11.7
10.5
12.1
10.0
13.5
11.0
13.0
17.0
24.5
17.7
19.0
20.0
18.5
23.0
16.5
14.5
18.1
14.1
15.5
15.0
16.0
17.0
14.7
9.7
8.0
10.0
11.0
11.7
9.7
10.0
10.7
11.7
11.0
12.0
11.5
12.0
11.7
12.0
11.0
10.7
9.5
11.0
11.2
11.8
10.7
11.0
10.8Mean
LSD (P =0.05); VarietyFertilizer
Variety x Fertilizer
11.7 19.5
0.080.170.24
10.1 11.6
0.430.861.21
7.52 0.38
The highest percentage (10.2%) sugar content of tubers was recorded by control tubers of
Apomuden followed by 15-30-30kg/haNPK + 5t/ha CM and the lowest (8.2%) sugar
content recorded by 30-45-45 kg/haNPK tubers after 12 weeks in pit storage.
However, 30-30-30 kg/haNPK and 30-60-60 kg/haNPK tubers of Apomuden did not store
well recording zero values’for sugar content of tubers after 12 weeks in pit storage.
Okumkom grown on 10t/ha CM recorded the highest percentage (14.2%) sugar content of

198
tubers and differed significantly from 15-23-23kg/haNPK +5t/ha CM and 15-15-15
kg/haNPK+ 5t/ha CM tubers which recorded the lowest (11.0%) sugar content of tubers
after 12 weeks in pit storage. All the other amendments and the control grown tubers of
Okumkom did not store well recording zero values for sugar content of tubers after 12
weeks in pit storage (Table 4.40). Generally, Okumkom grown on amended plots and
stored in pit recorded substantially higher percentage sugar content of tubers than
Apomuden after 12 weeks in pit storage (Table 4.40).
In the major season (2012), there was a significant difference in variety x fertilizer
interaction in percentage sugar content of tubers after 12 weeks in storage. Application of
30-45-45 kg/haNPK to Apomuden gave the highest (11.7%) percentage sugar content of
tubers followed by 10t/ha CM tubers. All the other amendment except 15-15-15kg/haNPK
+ 5t/ha CM tubers.recorded the same mean (10.0%) after 12 weeks in pit storage.
Okumkom grown on 30-45-45 kg/haNPK plot had the highest percentage (12.0%) sugar
content of tuber after 12 weeks in pit storage with the lowest (11.0%) sugar content
recorded by 15-30-30kg/haNPK kg/haNPK +5t/ha CM and the control tubers. However,
30-30-30 kg/haNPK and 30-60-60 kg/haNPKtubers of Okumkom did not store well
recording zero values of sugar content of tuber at 12 weeks in pit storage. Generally,
Okumkom grown on amendment and unamended plots recorded substantially higher
percentage sugar content of tubers than Apomuden grown on the same treatment after 12
weeks in pit storage. Apomuden and Okumkom grown on amended and unamended plots
and stored in pit during the major season stored better and had higher percentage sugar
content of tubers than during the minor season after 12 weeks in pit storage (Table 4.40).
In the case of ash storage during the major season, Apomuden tubers produced with or

199
without application of amenment did not store well recording zero value for ssugar content
of tuber at 12 weeks in storage. Okumkom grown on 30-45-45 kg/haNPK plot had the
highest (12.1%) percentage sugar content of tuber after 12 weeks in ash storage followed
by 30-60-60kg/haNPK (12.0%) and the lowest (11.7%). sugar content recorded by 30-30-
30kg/haNPK produced tubers. All the other amendmen tand the control grown tubers of
Okumkom did not store well recording zero values for sugar content of tubers after 12
weeks in ash storage (Table 4. 40).
In both seasons Apomuden and Okumkom grown on amended and unamended plots and
stored in grass did not store well recording no values after 12 weeks in storage. Pit storage
was the most effective storage method followed by ash with grass storage being the least in
percentage sugar content of tubers after 12 weeks in storage in both seasons (Table 4. 40).
4.9 Percentage Starch Content of Sweetpotato Root Tubers at Harvest and After
12 Weeks of Storage in Ash, Grass Or Pit During 2011 Minor Season and 2012
Major Season
4.9.1 Percentage Starch Content of Tubers at Harvest
The result of percentage sugar content of tubers at harvest as influenced by chicken
manure, inorganic fertilizers and variety is presented in Table 4.41. In the minor season
(2011), there was a significant difference between Okumkom and Apomuden in percentage
starch content of tuber at harvest.

200
Table 4.40: Percentage Sugar Content of Sweetpotato Root Tubers after 12 Weeks of Storage in Pit And Ash During 2011Minor Season and 2012 Major Season
Variety
Percentage (%) Sugarof tuber 12 weeks afterstorage Pit)(minor season)
Mean
Percentage (%) Sugarof tuber 12 weeks
after storage( Pit) (major season)
Mean
Percentage (%)Sugar of tuber 12
weeks after storage(Ash) (major
season)
Apomud. Okumk. Apomud Okumk Apomd Okumk MeanFertilizer RatesNo fertilizer
10t/ha CM
30-30-30 kg/haNPK
15-15-15 kg/haNPK + 5t/haCM
30-45-45 kg/haNPK
15-23-23 kg/haNPK+ 5t/ha CM
30-60-60 kg/haNPK
15-30-30 kg/haNPK + 5t/haCM
10.2
9.6
0.0
9.7
9.3
8.2
0.0
10.0
0.0
14.2
0.0
11.0
0.0
13.0
0.0
0.0
5.1
11.9
0.0
10.3
4.6
10.6
0.0
5.0
10.0
11.0
10.0
10.5
11.7
10.0
10.0
10.0
11.0
11.6
0.0
11.7
12.0
11.8
0.0
11.0
10.5
11.3
5.0
11.1
11.8
10.9
5.0
10.5
0.0
0.0
0.0
0.0
0.0
0.0
0.0
0.0
0.0
0.0
11.7
0.0
12.1
0.0
12.0
0.0
0.0
0.0
5.8
0.0
6.0
5.2
6.0
0.0
Mean
LSD (P =0.05); VarietyFertilizer
Variety x Fertilizer
7.1 4.7
0.581.161.64
10.7 8.6
0.410.821.16
0.0 4 .48
0.140.290.42

201
Apomuden grown on the control however, produced the highest percentage (16.8%) starch
content of tubers followed by 15-23-23 kg/haNPK + 5t/ha CM and 15-30-30 kg/haNPK +
5t/ha CM tubers which had the same mean (14.9%) with the lowest (11.2%) sugar content
recorded by 30-45-45 kg/haNPKtubers at harvest. Application of 10t/ha CM to Okumkom
produced the highest percentage (27.9%) starch content of tubers at harvest followed by
30-60-60 kg/haNPK (25.7%) with the lowest (18.6%) starch content recorded by 15-30-
30kg/haNPK + 5t/ha CM tubers. There was a significant difference in variety x fertilizer
interaction in percentage starch content of tubers at harvest (Table 4.41).
In the major season (2012), there was a significant difference between Okumkom and
Apomuden in percentage starch content of tuber at harvest. Application of 30-45-
45kg/haNPK to Apomuden produced the highest percentage (13.2%) starch content of
tubers at harvest with the lowest (9.6%) starch content recorded by 10t/ha CM tubers.
However, application of 30-30-30kg/haNPK, 15-15-15kg/haNPK+5t/ha CM or 15-30-
30kg/haNPK+5t/ha CM to Apomuden resulted in the same mean starch (12.0%) content.
Okumkom grown on 30-45-45kg/haNPK and 30-60-60kg/haNPK plots had the highest
and the same percentage (13.8%) starch content at harvest.The lowest (12.4%) percent
starch content was recorded by Okumkom grown on 10t/haCM and 15-30-30kg/haNPK
+5t/ha CM andwhich had the same mean. Generally, application of amendment and control
to Apomuden or Okumkom during the minor season produced substantially higher
percentage starch content of tubers at harvest than in the major season (Table 4.41).

202
Table 4.41 Percentage Starch Content of Tubers at Harvest During 2011 Minor Season and2012 Major Season
Variety
Percentage (%)Starch of tuber atharvest
(minor season)
Mean
Percentage (%)Starch of tuber atharvest(major season)
MeanApomud. Okumk. Apomud OkumkFertilizer RatesNo fertilizer
10t/ha CM
30-30-30kg/haNPK
15-15-15 kg/haNPK + 5t/ha CM
30-45-45 kg/haNPK
15-23-23 kg/haNPK + 5t/ha CM
30-60-60 kg/haNPK
15-30-30 kg/haNPK + 5t/ha CM
16.8
13.3
11.9
14.3
11.2
14.9
13.2
14.9
19.6
27.9
20.4
21.6
23.2
20.9
25.7
18.6
18.2
20.6
16.1
17.9
17.2
17.9
19.4
16.7
10.8
9.6
12.0
12.0
13.2
10.8
11.0
12.0
13.2
12.4
13.7
13.0
13.8
13.2
13.8
12.4
12.0
11.0
12.8
12.5
13.5
12.0
12.4
12.2Mean
LSD (P =0.05); VarietyFertilizer
Variety x Fertilizer
13.8 22.2
1.170.340.48
11.4 13.1
0.340.670.96
7.52 0.38
4.9.2 Percentage Starch of Sweetpotato Root Tubers after 12 Weeks of Storage in
Pit, Ash or Grass Storage During the 2011 Minor and 2012 Major Seasons
The result of percentage starch content of tubers after 12 weeks in pit and ash storage as
influenced by chicken manure, inorganic fertilizers and variety is presented in Table 4.42.
In the minor season (2011), there was a significant difference in variety x fertilizer
interaction in percentage starch content of tubers after 12 weeks of storage in pit.

203
Apomuden grown on 15-30-30kg/haNPK +5t/ha CM and the control plots had the highest
percentage (11.5%) starch content of tubers after 12 weeks of storage in pit and differed
significantly from 15-23-23kg/haNPK + 5t/ha CM which recorded the lowest percentage
(9.0%) starch content of tubers. Apomuden grown on 10t/ha CM and 30-45-45kg/haNPK
plots had the same percentage (10.8%) starch content of tubers after 12 weeks of storage in
pit. Tubers produced from application of 30-30-30kg/haNPK and 30-60-60kg/haNPK to
Apomuden did not store well recording zero mean values for stach after 12 weekso f
storage in pit (Table 4.42).
Application of 10t/ha CM to Okumkom had the highest percentage (15.6%) starch content
of tubers after 12 weeks of storage in pit followed by 15-23-23kg/haNPK + 5t/ha CM
(13.6%) with the lowest (12.0%) starch content .recorded by 15-15-15kg/haNPK + 5t/ha
CM tuber. All the other amended and unamended tubers did not store well recording zero
mean values for starch after 12 weeks of storage in pit (Table 4.42).
In the major season (2012), there was a significant difference between Apomuden and
Okumkom in percentage starch content of tubers after 12 weeks of storage in pi.
Application of 30-45-45kg/haNPK to Apomuden produced the highest percentage (13.2%)
starch content of tubers after 12 weeks of storage in pit and differed significantly from all
the other amendments except 10t/ha CM and 15-15-15kg/haNPK+5t/ha CM tubers and the
control which recorded the lowest and the same percentage (11.0%). starch content of
tubers after 12 weeks of storage in pit. Okumkom grown on30-45-45 kg/haNPK had the
highest percentage (13.8%) starch content of tubers and differed significantly from 15-30-
30 kg/haNPK +5t/ha CM and the control which recorded the lowest and the same (12.0%)
starch content after 12 weeks of storage in pit. Tubers produced by application of 30-30-

204
30kg/haNPKand 30-60-60 kg/haNPK to Okumkom did not store well recording zero mean
values after 12 weeks of storage in pit (Table 4.42).
In the case of ash storage, tubers produced from application of amendment and control to
both Apomuden and Okumkom during the minor season did not store well recording zero
values for starch content of tuber after 12 weeks of storage. In the major season (2012),
there was a significant difference in variety x fertilizer interaction in starch content of tuber
after 12 weeks of storage in ash. Tubers from application of 15-23-23 kg/haNPK +5t/ha
CM to Apomuden had the highest percentage (11.7%) starch content of tubers after 12
week of storage storage in ash. All the other amended and unamended tubers did not store
well recording no mean values after 12 weeks ofstoragein ash. Okumkom grown on30-45-
45 kg/haNPK plot had the highest percentage (14.0%) starch content of tubers at 12 weeks
of storage in ash followed by 30-60-60 kg/haNPK plot (13.8%) and the lowest percentage
(13.2%) starch content was recorded by 30-30-30kg/haNPK treated tubers. All the other
amended and unamended tubers did not store well recording zero mean values for starch
after 12 weeks of storage in ash (Table 4.42).
Generally, Pit storage proved the most effective storage method followed by ash storage
with grass storage being the least in percentage starch content of tubers after 12 weeks of
storage in both seasons. There was a substantial reduction in percentage starch content of
tubers for both Okumkom and Apomuden grown on amended t and the control plots at 12
weeks of storage in pit than at harvest in both seasons (Table 4.42).

205
Table 4.42: Percentage Starch Content of Sweetpotato Root Tuber After 12 Weeks of Storage in Pit And Ash During2011 Minor Season and 2012 Major Season
Variety
Percentage (%) Starchoftuber 12 weeks instorage - (Pit) (minorseason)
Mean
Percentage (%)Starch of tuber 12weeks in storage-( Pit) (majorseason)
Mean
Percentage ( %)Starch of tubers 12weeks in storage-(Ash) ( majorseason)
Apomud. Okumk. Apomud Okumk Apomd Okumk MeanFertilizer RatesNo fertilizer
10t/ha CM
30-30-30 kg/haNPK
15-15-15 kg/haNPK + 5t/ha CM
30-45-45 kg/haNPK
15-23-23 kg/haNPK + 5t/ha CM
30-60-60 kg/haNPK
15-30-30 kg/haNPK + 5t/ha CM
11.5
10.8
0.0
10.8
10.4
9.0
0.0
11.5
0.0
15.6
0.0
12.0
0.0
13.6
0.0
0.0
5.7
13.2
0.0
11.4
5.2
11.3
0.0
5.7
11.0
12.0
11.0
11.7
13.2
11.0
11.0
11.0
12.0
13.0
0.0
13.2
13.8
13.4
0.0
12.0
11.5
12.5
5.5
12.4
13.5
12.2
5.5
11.5
0.0
0.0
0.0
0.0
0.0
11.7
0.0
0.0
0.0
0.0
13.2
0.0
14.0
0.0
13.8
0.0
0.0
0.0
6.6
0.0
7.0
5.8
6.9
0.0
Mean
LSD (P =0.05); VarietyFertilizer
Variety x Fertilizer
8.0 5.1
0.601.211.72
11.49 9.67
0.450.911.29
1.46 5.12
0.140.290.42

206
4.10 Correlation Matrix among Vegetative and Yield Parameters Measured on
Sweetpotato at 12 Weeks after Planting and at Harvest Respectively for the
2011 Minor Season and 2012 Major Seasom
4.10.1 Correlation Matrix among Vegetative and Yield Parameters Measured on
Sweetpotato at 12 Weeks after Planting and at Harvest Respectively for the
2011 Minor Season
Table 4.43 shows the relationship among number of leaves per plant, number of branches,
stem diameter, vine length, marketable tuber number, marketable tuber weight, total tuber
yield, average tuber diameter and average tuber weight for the minor season using
correlation matrix. In the minor season (2011), there were highly significant positive
correlation between 40% of the traits including total tuber weight and marketable tuber
weight (0.99**), number of leaves per plant and number of branches (0.89**),
unmarketable tuber number and unmarketable tuber weight (0,89**), total tuber weight and
marketable tuber number (0.80 **), marketable tuber weight and marketable tuber number
(0.78**), vine length and number of branches (0.64**), stem diameter and number of
branches (0.50**), and slightly positive correlation between marketable tuber weight and
average tuber diameter ( 0.46**), and, total tuber weight and average tuber diameter
(0.42**). However, negative correlation occurred between number of branches and number
of unmarketable tubers (-0.46**). Again, vine length and number of unmarketable tubers
showed negative correlation (-0.44**), number of leaves per plant and number of
unmarketable tubers (-0.43**), number of leaves per plant and marketable tuber number (-
0.20). Generally, the vegetative growth was negatively correlated with tuber weight and
market quality. While tuber market quality was highly positively correlated with total

207
weight of tuber. The vegetative characters were positively and significantly correlated with
each other (Table 4.43).
4.10.2 Correlation Matrix among Vegetative and Yield Parameters Measured on
Sweetpotato at 12 Weeks after Planting and at Harvest Respectively for the
2012 Major Season
Table 4.44 shows the relationship among number of leaves per plant, number of branches,
stem diameter, vine length, marketable tuber number, marketable tuber weight, total tuber
yield, average tuber diameter, and average tuber weight for the minor season using
correlation matrix. In the major season (2012), there were highly significant positive
correlation between 40% of the traits including total tuber weight and marketable tuber
weight (0.98**), number of leaves per plant and number of branches (0.93**),
unmarketarble tuber number and unmarketable tuber weight (0,91**), total tuber weight
and marketable tuber number (0.71 **), marketable tuber weight and marketable tuber
number (0.70**), marketable tuber weight and average tuber diameter (0.0.68**), and, total
tuber weight and average tuber diameter (0.0.66**), and slightly positive correlation
between vine length and number of branches (0.49**), stem diameter and number of
branches (0.39**). However, negative correlation occurred between number of branches
and number of unmarketable tubers (-0.26). Again, number of leaves per plant and
marketable tuber number showed negative correlation (-0.22), as did stem diameter and
marketable tuber weight (-0.15). Generally, the vegetative growth was negatively
correlated with tuber weight and market quality. While tuber market quality was highly

208
positively correlated with total weight of tuber. The vegetative characters were positively
and significantly correlated with each other (Table 4.44).
4.11 Partial budget analysis of sweetpotato as affected by chicken manure and
inorganic fertilizer for the 2011 minor and 2012 major seasons
Table 4 45 shows the information used for the partial budget analysed for both Apomuden
and Okumkom varieties of sweetpotato for the minor and major growing seasons.
Apomuden and Okumkom grown on 30-30-30 kg/ha NPK during the minor and major
growing seasons dorminated over the other amended and the control plots except during
the minor season in which the unamended plot dominated over the amended plots (Tables
4.45,4 .46, 4.47 and 4. 48). In the 2011 minor season, application of 30-30-30 kg/ha NPK
to Apomuden for every GH¢ 1.0 incurred as cost of applying the inorganic fertilizer you
regain GH¢ 1.0 and get GH¢ 298.30 as profit. In the case of 2012 major season, for every
GH¢ 1.0 incurred as cost of applying 30-30-30 kg/ha NPK you regain GH¢ 1.0 and get
GH¢ 32.04 as profit for Apomuden and GH¢ 1761.61 for Okumkom respectively.

209
Table 4.43 Correlation Matrix among Growth and Yield Parameters During the 2011 Minor Season
* Significant at 1%
** Significant at 5%
1 2 3 4 5 6 7 8 9 10 111. Total yield of tubers2. Ave. tuber diameter 0.42**3. Marketable tuber
number0.80** 0.01
4. Marketabletuberweight
0.99** 0.46** 0.78**
5. Number of branches -0.11 0.37** -0.18 -0.076. Number of leaves per
plant-0.16 0.33** -0.20 -0.12 0.89**
7. Stem diameter -0.05 0.25* -0.23 -0.02 0.50** 0.48**8. Unmarketable tuber
number0.24* -0.34** 0.35** 0.13 -0.46** -0.43** -0.36**
9. Unmarketable tuberweight
0.23 -0.19 0.29* 0.11 -0.30** -0.29** -0.26* 0.89**
10. Vine length 0.02 0.37** -0.09 0.07 0.64** 0.56** 0.42** -0.44** -0.32**11. Ave. tuber weight 0.56** 0.51** 0.15 0.58** -0.13 -0.21 0.03 -0.07 -0.07 0.08

210
Table 4.44 Correlation Matrix among Growth and Yield Parameters During the 2012 Major Season
1 2 3 4 5 6 7 8 9 10 11
1.Total yield of tubers
2. Ave. tuber diameter0.66**
3.Marketable number0.71** 0.32*
4. Marketable weight0.98** 0.68** 0.70**
5.Number of branches-0.13 -0.16 -0.26 -0.21
6.Number of leaves-0.12 -0.17 -0.22 -0.18 0.93**
7. Stem diameter0.09 0.12 -0.15 0.08 0.39** 0.31*
8.Unmarketable number0.36** 0.03 0.37** 0.24 0.34** 0.32* 0.10
9.Unmarketable weight0.38** 0.04 0.30* 0.24 0.46** 0.48** 0.13 0.91**
10. Vine length0.34** 0.36** 0.07 0.30* 0.49** 0.47** 0.45** 0.35** 0.39**
11. Ave. tuber weight0.70** 0.84** 0.35** 0.73** -0.26 -0.25 0.02 0.02 0.02 0.27*
* Significant at 1%
** Significant at 5%

211
Table 4.45: Information used for the partial budget analysis
Variable Quantity/Amount
1. Farm gate price of sweetpotato(t-1)
2. Fertilizer cost 1 bag (50kg) of 15-15-15 NPK
3. Poultry manure (1 tonne)4. Labour for inorganic fertilizer and
chicken manure application
Labour cost for application (manday-1)
5. Transportation cost 1 bag (50kg) of inorganic fertilizer
1 tonne chicken manure
GH¢450.00
GH¢100.00
GH¢100.0010 man days ha-1
GH¢300.00
GH¢10.00
GH₵30.00

212
Table 4.46: Partial budget analysis for Apomuden variety of sweet potato as affected by inorganic fertilizer andchicken manure during 2011 minor season
Nofertilizer(control)
10tlha CM 30-30-30kg/ha NPK
15-15-15kg/ha NPK+ 5t/haCM
30-45-45kg/ha NPK
15-23-23kg/ha NPK +5t/ha CM
30-60-60kg/ha NPK
15-30-30kg/ha NPK +5t/ha CM
Gross benefitsYield (t ha-1)Adjusted yield (85%) (t ha-1)Total Gross Benefit (TGB)(₵ × 103 ha-1)
35.029.75
13387.5
25.021.259562.5
41.034.85
15682.5
38.032.3
14535
36.030.6
13770
31.026.35
11857.5
34.028.9
13005
28.023.8
10710
Variable CostFertilizer cost (₵ × 103 ha-1 )NPK
Poultry manureApplication Cost(IFR + PM) (₵ × 103 ha-1)Transportation Cost (₵ × 103
ha-1 )NPKCM
000
00
01000300
0300
2500
300
250
125500300
12.5150
3750
300
37.50
187.5500300
18.75150
5000
300
500
250500300
25150
Total Variable Cost (TVC)(₵ × 103 ha-1)Net Benefit (TGB-TVC) (₵× 103 ha-1 )
0
13387.5
1600
7962.5
575
15107.5
1087.5
13447.5
712.5
13057.5
1156.25
10701.25
850
12155
1225
9485
Marginal Rate of Return(MRR)
Nofertilizer(control)
30-30-30kg/ha NPK
30-45-45kg/ha NPK
30-60-60kg/ha NPK
15-15-15kg/ha NPK +
5t/ha CM
15-23-23kg/ha NPK +
5t/ha CM
15-30-30kg/ha NPK +
5t/ha CM
10 t/ha CM
TVC (₵ × 103 ha-1)Net Benefit (₵ × 103 ha-1)MRR (%) = ΔNB/ΔTVC ×100
013387.5
57515107.5299.13
712.513057.5
D*
85012155
D
1087.5447.5
D
1156.2510701.25
D
12259485
D
16007962.5
D
*D = Dominated; MRR of 30-30-30 kg/ha NPK + control

213
Table 4.47 Partial budget analysis for Okumkom variety of sweet potato as affected by inorganic fertilizer andchicken manure during 2011 minor season
Nofertilizer(control)
10tlhaCM
30-30-30kg/haNPK
15-15-15kg/ha NPK+ 5t/ha CM
30-45-45kg/ha NPK
15-23-23kg/ha NPK+ 5t/ha CM
30-60-60kg/haNPK
15-30-30kg/haNPK +5t/haCM
Gross benefitsYield (t ha-1)Adjusted yield (85%) (t ha-1)Total Gross Benefit (TGB) (₵ × 103 ha-
1)
2622.09900
1613.66120
2017
7650
1512.755737.5
2521.259562.5
2722.95
10327.5
2218.78415
2319.558797.5
Variable CostFertilizer cost (₵ × 103 ha-1 )
NPK Chicken manure
Application Cost(IFR + PM) (₵ × 103 ha-1)Transportation Cost (₵ × 103 ha-1 )
NPK CM
000
00
01000300
0300
2500
300
250
125500300
12.5150
3750
300
37.50
187.5500300
18.75150
5000
300
500
250500300
25150
Total Variable Cost (TVC)(₵ × 103 ha-1)Net Benefit (TGB-TVC) (₵ × 103 ha-1)
0
9900
1600
4520
575
7075
1087.5
4650
712.5
8850
1156.25
9171.25
850
7565
1225
7572.5Marginal Rate of Return (MRR) No
fertilizer(control)
30-30-30
kg/haNPK
30-45-45kg/haNPK
30-60-60kg/ha NPK
15-15-15kg/ha NPK+ 5t/ha CM
15-23-23kg/ha NPK+ 5t/ha CM
15-30-30kg/ha
NPK +5t/ha CM
10 t/haCM
TVC (₵ × 103 ha-1)Net Benefit (₵ × 103 ha-1)MRR (%) = ΔNB/ΔTVC × 100
09900D*
5755545
D
712.55025
D
8506800
D
1087.58475
D
1156.259171.25
D
12257190
D
16007197
D*D = Dominated; MRR of control over amended plots

214
Table 4 48: Partial budget analysis for Apomuden variety of sweet potato as affected by inorganic fertilizer andchicken manure during 2012 major season
Nofertilizer(control)
10tlha CM 30-30-30kg/ha NPK
15-15-15kg/ha NPK+ 5t/haCM
30-45-45kg/ha NPK
15-23-23kg/ha NPK +5t/ha CM
30-60-60kg/ha NPK
15-30-30kg/ha NPK +5t/ha CM
Gross benefitsYield (t ha-1)Adjusted yield(85%) (t ha-1)Total Gross Benefit (TGB)(₵ × 103 ha-1)
5950.15
22567.5
6454.4
24480
6151.85
23332.5
6555.25
24862.5
2521.25
17212.5
2722.9522185
2218.7
26775
2319.5532895
Variable CostFertilizer cost (₵ × 103 ha-1 )
NPK Chicken manure
Application Cost(IFR + PM) (₵ × 103 ha-1)Transportation Cost (₵ × 103
ha-1 ) NPK CM
000
00
01000300
0300
2500
300
250
125500300
12.5150
3750
300
37.50
187.5500300
18.75150
5000
300
500
250500300
25150
Total Variable Cost (TVC)(₵ × 103 ha-1)Net Benefit (TGB-TVC) (₵× 103 ha-1 )
0
22567.5
1600
22880
575
22757.5
1087.5
23775
712.5
16500
1156.25
21028.75
850
25925
1225
31670
Marginal Rate of Return(MRR)
Nofertilizer(control)
30-30-30kg/ha NPK
30-45-45kg/ha NPK
30-60-60kg/ha NPK
15-15-15kg/ha NPK +
5t/ha CM
15-23-23kg/ha NPK +
5t/ha CM
15-30-30kg/ha NPK +
5t/ha CM
10 t/ha CM
TVC (₵ × 103 ha-1)Net Benefit (₵ × 103 ha-1)MRR (%) = ΔNB/ΔTVC ×100
022567.5
57522757.533.04
712.516500
D*
85025925
D
1087.523775
D
1156.2521028.75
D
122531670
D
160022880
D
*D = Dominated; MRR of 30-30-30 kg/ha NPK + over control

215
Table 4.49: Partial budget analysis for Okumkom variety of sweet potato as affected by inorganic fertilizer andchicken manure during 2012 major season
Nofertilizer(control)
10tlha CM 30-30-30kg/ha NPK
15-15-15kg/ha NPK+ 5t/haCM
30-45-45kg/ha NPK
15-23-23kg/ha NPK +5t/ha CM
30-60-60kg/ha NPK
15-30-30kg/ha NPK +5t/ha CM
Gross benefitsYield (t ha-1)Adjusted yield (85%) (t ha-1)Total Gross Benefit (TGB)(₵ × 103 ha-1)
3832.3
14535
5244.2
19890
6656.1
25245
4941.65
18742.5
6252.7
23715
8572.25
32512.5
9379.1
35595
89.375.9
34155
Variable CostFertilizer cost (₵ × 103 ha-1 )
NPK Chicken manure
Application Cost(IFR + PM) (₵ × 103 ha-1)Transportation Cost (₵ × 103
ha-1 ) NPK CM
000
00
01000300
0300
2500
300
250
125500300
12.5150
3750
300
37.50
187.5500300
18.75150
5000
300
500
250500300
25150
Total Variable Cost(TVC)(₵ × 103 ha-1)Net Benefit (TGB-TVC) (₵ × 103 ha-1 )
0
14535
1600
18290
575
24670
1087.5
17655
712.5
23002.5
1156.25
31356.25
850
34745
1225
32930
Marginal Rate of Return(MRR)
Nofertilizer(control)
30-30-30kg/ha NPK
30-45-45kg/ha NPK
30-60-60kg/ha NPK
15-15-15kg/ha NPK +
5t/ha CM
15-23-23kg/ha NPK +
5t/ha CM
15-30-30kg/ha NPK +
5t/ha CM
10 t/ha CM
TVC (₵ × 103 ha-1)Net Benefit (₵ × 103 ha-1)MRR (%) = ΔNB/ΔTVC ×100
014535
57524670
1762.61
712.523002.3
D*
85034745
D
1087.517655
D
1156.2531356.25
D
122532930
D
160018290
D
*D = Dominated; MRR of 30-30-30 kg/ha NPK + over control

216
CHAPTER FIVE
5.0 DISCUSSION
The effect of chicken manure and inorganic fertilizer on the growth of sweetpotato
revealed that percentage crop establishment during the minor and the major growing
seasonsfortwo sweetpotato varieties (Apomuden and Okumkom) ranged from (59.2 – 78.8)
and (53.5 – 85.5), respectively. Organic and inorganic fertilization either singly or in
combination did not significantly influence crop establishment across growing seasons and
cultivars. The healthy and actively growing parts of vines used as planting materials might
have accounted for the high percentage crop establishment. The low crop establishment
experienced for Apomuden grown on 30-30-30 kg/haNPK or 10 t/ha CM during the major
growing season might be due to differences in variety and its response to soil nutrient
coupled with initial low rainfall during the 2012 major season. According to Jassens
(2001); Degras (2003) there is the need to use healthy and actively growing portions of
planting material (Vines) and appropriate spacing as well as reduce weed competition for
good plant growth later during the seasons. Percentage crop establishment for Okumkom
planted and supplied with 30 – 45 – 45 kg/haNPK was lowest in both seasons. These
results obtained at both experimental sites and growing seasons were similar to those found
by Buresh et al., (1997), and Palm et al., (1997), who observed that the combinations of
poultry manure with mineral fertilizers were more often than not more effective in
supporting plant growth and yield than equivalents of manure nutrients alone or those of
sole applied inorganic fertilizers. Okumkom grown on amended plots during the major
season generally produced higher percentage crop establishment than those in the minor
season. The high total monthly rainfall values recorded during the major season (April –

217
July) as compared to minor season in 2011 (September – December). (Tables 3.1 and 3.2),
and cultivar differences might have contributed to such high percentage crop
establishment.
Leaf number of Okumkom cultivar grown during the minor season on the amended
treatments with the exception of 10t/haCM was significantly higher than the control.
Significant difference in plant growth observed between amended and unamended
(control) plots could be attributed to differences in organic matter and effective cation
exchange capacity (ECEC) (SRI – CSIR – 2003). Apomuden cultivar did not show any
significant difference in leaf number for the amended and the control treatments.
Okumkom produced significantly higher leaf number than Apomuden across all
treatments. This could be due to variety characteristics. Apomuden and Okumkom planted
on amended plots with exception of 30-30-30 kg/haNPK and 10tlha CM gave higher leaf
numbers than the control at 12 WAP during the major season. The relatively lower soil
fertility status, especially, exchangeable Ca and low effective cation exchange capacity
(E.C.E.C) in chicken manure during the major growing season might have contributed to
the low plant growth and leaf appearance in 10t/haCM treatment. Calcium functions in
plant as an essential part of plant cell structure, provides the normal transport and retention
of other elements as well as strength in the plant. Generally, both cultivars planted on
amended and control plots during the major season produced significantly higher leaf
numbers than during the minor season. This observation might be attributed to high rainfall
that resulted in better soil moisture supply coupled with a relatively higher soil N
especially at the early planting stage of sweetpotato during the major season leading to
better nutrient availability. According to Maynard and Hill (2000,) excessive rain or

218
nitrogen can lead not only to vigorous vine growth but also result in poorly developed
stringy root tubers.
Number of vine branches, vine diameter and vine length of both sweetpotato cultivars
(Okumkom and Apomuden) grown on amended treatments were significantly higher than
the control in both seasons. This might be due to differences in soil fertility status through
increased availability of nitrogen on manured plots. These results obtained at both sites and
growing seasons were similar to the findings of Bradbury and Holloway, (1988), who
reported that in sweetpotato, high nitrogen may cause luxuriant growth of the vines at the
expense of storage root yield and that excessive N rates stimulate vine growth. Similarly,
according to Walker and Woodson (1987), and Mukthar et al., (2010), too much nitrogen
could result in excessive vine growth and that application of organic and inorganic
fertilizer to two cultivars of sweetpotato produced significantly different number of
branches and this was attributed to differences in genetic composition of the sweetpotato
varieties. Apomuden and Okumkom grown on amended and control plots during, the
major season produced significantly higher number of vine branches, diameter and length
over those grown under the same treatments during the minor season at 12 weeks after
planting. The differences in sweetpotato growth observed in the two seasons might be
attributed to high rainfall during the major season coupled with slow and effective release
of nutrients from manure applied during the major season. Raemaekers (2001), indicated
that vine length and growth habit of sweetpotato depend on cultivar and environment,
particularly, the climate of the growing area available to the plant and the plant’s nutrition.
The results obtained during the major season were similar to those found by Hartemink et

219
al., (2000a and 2000b,) who observed that sweetpotato response to nutrient input was
greatly affected by other factors such as rainfall and number of cropping seasons.
Apomuden and Okumkom planted on 10t/ha CM had significantly lower number of
branches and vine diameter than the other amended and the control plots during the minor
season compared to the major season. Perhaps the initial relatively slow release of N in
chicken manure as well as initial competition for nutrients by the soil microorganisms
responsible for mineralization might have accounted for the significantly lower number of
branches and vine diameter of both sweetpotato cultivars grown on 10t/ha CM, during the
minor season. Rice and Rice (1987) indicated that the use of well rotted manure prior to
planting and a pre-planting application of complete fertilizer is generally beneficial and
required for good plant growth and yield.
Chlorophyll content of leaves for Apomuden treated with 15 – 23 – 23 kg/haNPK + 5t/ha
CM was significantly higher than the other amended treatments and the control at 16
weeks after planting in both seasons. This result indicates positive influence of chicken
manure in combination with inorganic inputs on leaf chlorophyll content over unamended
soils. The significantly higher chlorophyll content of leaves observed in Apomuden than
Okumkom and in the manured plots than control plots could be due to differences in
varieties as well as N, Mg and presence of Zn in chicken manure. Miller et al., (1970)
indicated that poultry manure helps to correct Zn and Fe deficiencies in the soils and
supplements NPK fertilizers in crop production. Bandel et al., (1972), shared similar
opinion indicating that poultry manure helps to alleviate micro-nutrient deficiencies in
most soils. According to Mascianica et al., (1985), and Walker and Woodson, (1987),

220
plants need nitrogen for growth, reproduction and photosynthesis which depend directly on
chlorophyll content of leaves.
Apomuden and Okumkom grown on amended and control plots during the minor season
had substantially higher chlorophyll content of leaves than the major season. Probably
moderate rainfall observed during the minor cropping period might have accounted for this
result. The initial high rainfall experienced during the major cropping period coupled with
temporary waterlogging in the field might have resulted in nitrogen deficiency through
leaching of nutrients in the soil. The growth rate and dry matter partitioning between root
tubers and vegetative organs of sweetpotato are sensitive to plant structure and nutrition
(Wilson, 1982; Hahn and Hozyo, (1984)).
Application of 15 – 15 – 15kg/haNPK + 5t/ha CM to Apomuden resulted in significantly
higher root dry weight over the other amended treatments and control at 12 WAP in both
seasons. Similarly, Okumkom grown on 15 – 23 – 23kg/haNPK + 5t/ha CM had
significantly higher root fresh weight than control at 12 WAP in both seasons. These
results indicate positive influence of chicken manure in combination with inorganic
fertilizers on vegetative biomass over sole organic and inorganic amended or unamended
soils. The advantage of manured plots over control in leaf number and vine branches was
reflected in dry matter accumulation. The higher number of leaves and vine branches might
have enhanced effective sunlight interception for photosynthesis, hence more dry matter
accumulation in manured plants than the control.
Raemaekers (2001), in a research conducted in Guadeloupe showed that the stems and leaf
stalks account for the bulk of the fresh matter produce two months after planting
sweetpotato cuttings. The relatively higher soil fertility status, especially the organic matter

221
in manured plots might have accounted for higher dry matter accumulation in cultivars
treated with both organic and inorganic fertilizer. According to Dick (1992), the addition
of soil organic matter as amendment to cropping soil benefits soil biota by providing not
only nutrients but also energy. Edwards and Neuhauster (1988) stated that organic matter
in addition to supplying nutrients to plants, animal manure when converted to
vermicomposts provide certain humic acids which can stimulate plant growth. In both
seasons, application of organic manure in combination with inorganic fertilizer to
Apomuden and Okumkom resulted in significantly higher dry matter accumulation than
organic manure alone (10t/ha CM), and the control at 12 WAP. The low growth in terms of
dry matter accumulation especially of Okumkom during the major season on 10t/ha CM
plot might be the result of high rates of chicken manure applied to the soil. According to
Igua (1985), higher rates of poultry manure rather depress sweetpotato yield. Again, the
lower leaf number recorded in Okumkom and Apomuden in both seasons at 12 WAP
might have resulted in decreased sunlight interception for photosynthesis hence low dry
matter accumulation. Apomuden and Okumkom grown under amended plots, especially,
15 – 15 – 15kg/haNPK + 5t/ha CM and15 – 23 – 23kg/haNPK + 5t/ha CM treatments had
substantially higher dry matter accumulation during the major season than the minor
season at 12 WAP. The increase in dry weight observed could be attributed to better
climatic conditions during the major cropping season. Perhaps the higher total monthly
rainfall values during the major cropping period (April – July) in 2012 than during the
minor season cropping period (September – December) in 2011 which ranged from 938.5
mm and 381.7mm respectively might have contributed to significant fresh and dry weight
gains during the major season. An indication of the need for supplementary irrigation at the

222
early growth stage, especially, at the tuber formation stage during drought periods.
According to Degras (2003), sweetpotatoes need uniform irrigation water per week for
normal growth, especially, during transplant establishment and root development to reduce
incidence of disease. Raemaekers (2001) also indicated that the growth potential of
sweetpotato and for that matter differences in dry weight depend on cultivar and
environment. Generally, the high percentage crop establishment coupled with increased
number of leaves and chlorophyll content of leaves in manured plots might have also
contributed to the high dry matter accumulation.
Integrated fertility management schemes of mineral fertility and organic manure (chicken
manure) and manure nutrients alone did not influence days to 50% flowering of Okumkom
grown in both seasons. This observation could be attributed to differences in cultivars
characteristics. Apomuden grown on amended plots, especially, 15 – 15 – 15kg/haNPK +
5t/ha CM, 15 – 30 – 30kg/haNPK + 5t/ha CM, 30-60-60 kg/haNPK and 10t/ha CM during
the major season were earlier to flower than those grown on the same treatments during the
minor season.
This observation might be due to differences in phosphorus, nitrogen and presence of
boron in chicken manure. Nelson and Tisdale (1979) indicated that poultry manure
contains some minor nutrients such as iron, boron, copper and zinc. Mascianica et al.,
(1985) and Walker and Woodson (1987), have also indicated the need for nitrogen for
plant growth, reproduction and photosynthesis. Degras (2003) indicated that phosphorus is
essential for energy transfer in plants and helps early growth and plant maturation
including flowering. Okumkon was not influenced by soil nutrient supply to flower. This

223
might be attributed to the fact that sweetpotato varieties utilize nutrient differently due to
differences in genetic make-up.
Apomuden and Okumkom grown on amended plots in both seasons had significantly
higher fresh vine weight at harvest than the control except for Apomuden grown on 30 –
30 – 30kg/haNPK during the minor season. This result is similar to the findings of
Raemaekers (2001) and Edwards and Neuhauser (1988), and followed the trends in leaf
number, number of branches, vine length, fresh vine weight gain and dry matter
accumulation. The effect of organic and inorganic fertilization either singly or in
combination on Okumkom was manifested as a significantly higher influence on fresh vine
weight at harvest over Apomuden across both cropping periods except 15 – 15 – 15
kg/haNPK +5t/ha CM. This might be due to differences in cultivar characteristics.
Apomuden and Okumkom grown on amended and control plots during the minor season
had significantly higher fresh vine weight at harvest than during the major season in 2012
although 15-15-15kg/haNPK + 5t/ha CM and 15-23-23kg/haNPK + 5t/ha CM had the
highest fresh vine weight. The relatively high initial levels of soil nutrients, especially,
total exchangeable Ca, Mg and ECEC at the experimental site during the minor cropping
season might have accounted for these results obtained. Chicken manure and NPK
fertilizer further improved the chemical properties of the soil resulting in high fresh vine
weight at harvest.
Correlation analyses for both seasons show that the vegetative growth was negatively
correlated with tuber weight and market quality, while tuber market quality was highly
positively correlated with total weight of tuber. The vegetative characters were positively
and significantly correlated. This suggests a weak association among number of leaves and

224
yield parameters. This observation might be due to high soil nitrogen. According to
Nandpuri et al., (1971) and Sanchez (1973) high nitrogen encourages vine growth and
tends to cause a decline in yields.
Crop yield is a measurement of the amount of a crop that was harvested per unit of land
area and is normally measured in metric tonnes per hectoare or kilograms per hectare. In
both seasons Apomuden grown on chicken manure and inorganic fertilizer alone 10t/ha
CM and 30 – 30 – 30 kg/haNPK respectively and combination of organic and inorganic
fertilizer, 15 – 15 – 15 kg/haNPK + 5t/ha CM had significantly higher marketable tuber
numbers than Okumkom grown on the same treatments. Hartemink et al., (2000) have
reported of significant marketable tuber increases with both poultry manure and inorganic
nitrogen inputs. But for the relatively lower soil fertility status, especially, nitrogen and
ECEC (SRI, 2007), at both sites, the amended treatments would have supported better root
tuber formation in terms of root tuber numbers and weight as observed. These results
obtained at both sites were similar to those found by SRI – CSIR (2003), which observed
that when the soil nitrogen level is zero or low increasing nitrogen fertilization is beneficial
to yield and that nitrogen affects the number and weight of tuberous roots. Mukthar et al.,
(2010) similarly indicated that addition of organic matter in combination with fertilizer can
create a beneficial interaction. The findings of Bouwkamp (1985), however indicated that
sweetpotato clones utilize N differently and may require different N fertilization rates.
Generally, both sweetpotato cultivars grown on amended and control plots during the
major season had marketable tuber numbers which were higher than those obtained during
the minor season. The poor climatic conditions due to long periods of drought that

225
occurred at tuber bulking stage during the cropping period (September – December) (Table
3.1) might explain the lower numbers of marketable tubers during the minor season.
Hartemink et al., (2000a), have indicated that rainfall can affect sweetpotato response to
nutrient input. According to Degras (2003), regular irrigation of sweetpotato is required,
especially during the tuber formation stage.
The number of unmarketable tubers of Apomuden grown on amended and control plots
was significantly higher than Okumkom during the minor season. The differences in
cultivar characteristics with regard to lower number of branches and leaf numbers of
Apomuden compared with Okumkom might have accounted for late canopy closure and
subsequent dryer soils and higher soil temperatures. Degras (2003) indicated that very dry
soil results in small-sized tubers. Janseen (2001), also indicated that a relatively small
increase in soil temperature can have direct effect on tuber quality.
Generally, both Apomuden and Okumkom grown on amended and control plots had
significantly higher unmarketable tuber number during the major season than during the
minor season. High initial rainfall during the major cropping period (April – July) might
have negatively affected the quality of tubers. Maynard and Hill (2000) indicated that
excessive rain prevent proper root formation and that luxurious growing conditions caused
by excessive watering or nitrogen supply can lead to vigorous vine growth and result in
poorly developed stringly roots.
The organic and inorganic fertilization either singly or in combination on both cultivars
had a significant influence on tuber yield during minor cropping season. The significantly
higher total tuber yield observed in Apomuden grown on amended and control plots in the
minor season compared to Okumkom might be attributed to the differences in cultivar.

226
Over fertilization with nitrogen may lead to reduced yields as it may encourage excessive
vine growth at the expense of the storage roots as observed in the major season. Nandpuri
et al., (1971) emphasized the significant role of fertilizer especially N on yield of
sweetpotato based on the type of soil, cultivar and the climate. Apomuden grown on 15 -
30 – 30kg/haNPK + 5t/ha CM had a significantly higher total tuber yield during the major
season than during the minor season which might be due to better climatic conditions
coupled with perhaps the high initial fertility status of the soil (Hartemink et al., (2000a)
and Mukthar et al., (2010).
There was no significant difference between amended and the control plots in marketable
tuber weight per plot during the minor growing season. Application of 15-30-30kg/haNPK
+ 5t/ha CM to Apomuden produced significantly higher marketable tuber weight per plot
than Okumkom grown on the other manured and the control plots during the major season.
Apomuden and Okumkom grown on amended plots during the major season had higher
marketable tuber weight per plot than in the minor season. This observation might be due
to the high nitrogen in chicken manure. SRI – CSIR (2003) when the soil nitrogen level is
zero or low increasing nitrogen fertilization affects the weight of tuberous roots.
No significant difference occurred between amended and the control plots in unmarketable
tuber weight per plot during the minor season. Apomuden grown on amended and the
control plots produced significantly hugher unmarketable tuber weight in the minor season
than Okumkom grown on the same plots for the same season. Significant increase in
unmarketable tuber weight per plot occurred between Apomuden grown on 30-60-60
kg/haNPK and 15-23-23kg/haNPK +5t/ha CM during the major growing season.
Okumkom grown on amended plots except10t/ha CM, 30-30-30 kg/haNPK and 15-15-

227
15kg/haNPK -+ 5t/ha CM and the control differed significantly from Apomuden grown on
the same plots in the major season. The significant increase in unmarketable tuber weight
per plot in Okumkom compared to Apomuden might be attributed to differences in genetic
composition of the two varieties. Okumkom grown on amended plots and the control plots
during the major season had higher unmarketable tuber weight per plot than Okumkom on
same treatments during the minor season. The excessively high rainfall experienced
during the major season might have affected the tuber size. Wilson (1982) and Hahn and
Hozyo (1984) indicated that sweetpotato is intolerant to high rainfall that may result in
water logging especially, during tuber initiation, but the crop is at times tolerant to drought.
The total tuber yield for both varieties grown on amended treatments, especially, 10t/ha
CM during the minor season was relatively lower than during the major cropping season.
The high rate of chicken manure applied combined with intermittent long period of
drought during the cropping season might have accounted for the low tuber yield in the
10t/ha CM plot. This result obtained during the minor cropping season with 10t/ha CM is
similar to those reported by Igua (1985), who observed that over fertilization with chicken
manure rather depressed yield. The high vine fresh weight at harvest might have also
contributed to the low total tuber yield. The relatively high initial levels of soil nutrients,
especially, total exchangeable Ca, Mg and ECEC at the experimental site during the minor
cropping season might explain the high vine fresh weight at harvest. Bradbury and
Holloway (1988) also observed that high luxuriant growth of the vines as a result of high
nitrogen levels results in low storage root yield.

228
Integrated fertility management schemes of inorganic fertilizers and chicken manure did
not influence marketable and unmarketable tuber diameter for both varieties although
Apomuden grown on amended treatments, especially, 15 – 30 – 30kg/haNPK + 5t/ha CM
and 15 – 23 – 23kg/haNPK + 5t/ha CM had higher marketable and unmarketable tuber
diameter respectively in both seasons. The higher marketable tuber diameter observed
especially, with Apomuden grown on amended plots than control in both seasons
apparently resulted from improved soil chemical and physical properties that were induced
by manure application especially, the exchangeable potassium substantiating the findings
of Martin-Prevel (1989) and Perrenoud (1993), who indicated that potassium nutrition
influences tuber size and also improves tuber yield by increasing tubers size. Generally, the
high nitrogen level especially in chicken manure might resulted in high vine growth at the
expense of tuber formation hence affecting tuber size in Apomuden grown on 15-23-
23kg/haNPK + 5t/ha CM plot.
A significant difference occurred between Apomuden and Okumkom in average tuber
weight in both seasons. Generally, Apomuden and Okumkom under amendment and
unamended plots during the major season produced higher average tuber weight than
during the minor season. This observation might be due to differences in genetic
composition of the sweetpotato varieties and their response to soil nutrients coupled with
better climatic conditions during the major cropping period.
Okumkom grown on amended plots had higher tuber length than the control plots in both
seasons except 15 – 15 – 15 kg/haNPK + 5t/ha CM treatment. However, Apomuden grown
on amended and the control plots recorded significantly higher tuber length than
Okumkom in both seasons although Apomuden grown on 15 – 23 – 23 kg/haNPK +5t/ha
229
CM recorded the lowest tuber length in the major season. The increase in tuber length on
amended plots might be due to differences in soil fertility and structural stability of the
manured soil, especially, the presence of chicken manure which might have enhanced
penetration of tuber in the soil combined with differences in cultivar responses to soil
nutrients. Dennis et al., (1993) indicated that the combination of organic and inorganic
fertilizers not only improved crop yields but also improved the physical status of the soil.
According to Hileman (1967) and Bonsu (1986), poultry manure improves the physical
conditions of soil in terms of better water holding capacity, improved soil microbial
activity, water infiltration and structural stability of the soil.
A significant difference occurred between Apomuden grown on 15-30-30 kg/haNPK +
5t/ha CM and the other amended and the control plots in tuber dry matter accumulation at
harvest during the major season. The difference in tuber dry matter accumulation of
Apomuden and Okumkom at harvest might be due to differences in genetic composition of
varieties and their response to balanced soil nutrition coupled with better climatic
conditions (Anochili (1984) and SRI-CSIR (2003). There was no significant difference
between Apomuden and Okumkom grown on amended and the control plots interms of
tuber dry matter accumulation at harvest in both seasons. Application of chicken manure
either alone or in combination with inorganic fertilizers to especially, Apomuden during
the major season led to production of substantially higher tuber dry matter accumulation at
harvest than during the minor season.
Results obtained in both seasons did not elicit significant effect of the inorganic fertilizer
either alone or in combination with chicken manure on either harvest index or commercial

230
harvest index in both varieties. In both seasons Apomuden grown on 30 – 30 – 30
kg/haNPK had the highest harvest index. These results obtained might be due to the
relatively high total tuber yield observed in both seasons with corresponding lower fresh
vine weight at harvest. Okumkom grown on amended and unamended plots in both
seasons recorded lower harvest index than Apomuden grown on the same treatments. The
high vine fresh weight at harvest for Okumkom with corresponding lower total tuber yield,
especially, in the minor cropping season might have resulted in this observation. Higher
fresh vine weight at harvest tends to lower tuber yield and consequently lower harvest
index and could be attributed to high partitioning of assimilates to vegetative biomass at
the expense of tuber (sinks). Bradbury and Holloway (1988) have observed that high
luxuriant growth of the vines as a result of nitrogen results in low storage root yield and
cosequently lower harvest index.
Apomuden grown on amended and the control plots had higher commercial harvest index
during the major season than during the minor season. This observation might be due to
high soil nitrogen and potassium coupled with better climatic condition that resulted in
higher marketable tuber weight and the consequent higher commercial harvest index in the
major season compared to the minor season. According to SRI-CSIR (2003), balanced
fertilization gives large tubers hile the number of tubers harvested decreases.
With regards to root tuber quality, there was no significant effect in variety x fertilizer
interaction on market qualities in both seasons except for forked tubers, and pest
infestation where significant effects were observed between varieties across both
experimental sites. The significant difference between varieties in forked and pests infested
tubers might be attributed to differences in genetic composition of the sweetpotato

231
varieties. During the major season, a relatively higher percentage of tuber cracking was
recorded for both Apomuden and Okumkom grown on amended and control plots than
during the minor season. The slow and effective release of N especially from amended
plots coupled with high total monthly rainfall values during the cropping period (April –
July) could explain these observations. According to Lerner (2001), excessive amounts of
N may encourage excessive vine growth and result in cracked and poor storage quality.
Degras (2003) also reported that over watering of sweetpotato late in the cropping season
may cause the tuber to crack.
Generally, a relatively higher percentage of rotten tuber was recorded, especially, on the
amended plots during minor season for both varieties than during the major season.
Although total monthly rainfall values during tuber initiation (October – November) in the
minor season were relatively high, the long dry period of drought and the high maximum
temperature might have resulted in higher tuber rot during the minor season than in the
major season. Wilson (1982), Hahn and Hozyo (1984) and Degras (2003) indicated that
under favourable conditions (optimum temperature of 30 – 34o C) soil-borne bacteria
destroys tuberous root that results in soft or wooly forms of rot. Okumkom grown on
amended and control treatments during the major season recorded zero tuber rot. Similarly,
Apomuden and Okumkom grown on 15 – 30 – 30 kg/haNPK + 5t/ha CM had zero values
for rotten tubers in both seasons. These results might be attributed to differences in genetic
composition of cultivars and their responses to manure treated soil and environmental
adaptation.
Okumkom grown on 15 – 15 – 15kg/haNPK + 5t/ha CM had the highest forked tubers in
both seasons. The organic and inorganic fertilizer inputs in terms of high N from poultry

232
manure in the soil might have accounted for the result obtained. According to Lerner
(2001), excessive amounts of N may cause excessive vine growth, misshapen roots and
poor storage quality. A significantly high numbers of forked tubeer were produced during
the minor season by both varieties planted on amended and control plots than during major
season. This observation might be attributed to difference in climatic conditions and soil
nutrient levels especially nitrogen as indicated by Lerner (2001).
Percentage deformed tubers was varied depending on the composition of NPK in the
compound fertilizer. Apomuden grown on 30-45-45kg/haNPK had the highest number of
deformed tubers with the lowest number of deformed tubers occurring on plots treated with
30-30-30 kg/haNPK in both seasons. Increased potassium nutrition in the soil might have
accounted for the observed outcome. Kleinkopf et al., (1988), and Bergmann (1992),
reported that sweetpotato grown under higher K concentration results in stress at the early
part of tuber bulking that leads to absorption of water due to the osmotic effects of
increased tissue salt concentration and low specific gravity that result in high level of
internal and external defects resulting in misshapen tubers. Okumkom and Apomuden
grown on both amended and the control plots during the major season gave substantially
higher percentage of deformed tubers than during the minor season. A relatively slow and
effective release of nutrients from amended plots in the soil combined with better climatic
condition during the major cropping period could have accounted for this observation.
Kleinkopf et al., (1988) observed that during water stress, the low availability of nutrients
may temporarily stop tuber growth. Under good climatic condition tuber growth resumes,
especially, at the active site of most active cell growth that result in malformed tubers.

233
The level of pest infestation for Apomuden grown on amended and the control plots was
more severe than Okumkom in both seasons. The differences in variety, cultural and
environmental adaptation probably accounted for this result. Rajamma and Pillar, (1991)
observed that resistance traits of sweetpotato roots is strongly confounded with
environmental effects, differences in tuber variety and cultural practices employed such as
mounding and earthing up both at planting and during tuberous root development.
Generally, the level of pest infestation of Apomuden and Okumkom grown on amended
and control plots during the minor season was higher than during the major season except
for Apomuden grown on 15 – 30 – 30kg/haNPK + 5t/ha CM treated plot. Although total
monthly rainfall values were relatively high during the initial cropping period (September
– October) during the minor season intermittent long periods of drought during root
development might have resulted in high incidence of pest infestation during the minor
season. The findings of CIP (1995), and Sowley (1999) indicated that weevil attack is most
serious when drought persists for a long time, more especially, in the minor season and
also when wet and warm conditions increase the likelihood of serious pest infestations
respectively.
Mean sprouted tuber for Apomuden grown on amended and control plots was higher than
Okumkom in both seasons. Generally, Apomuden grown on amended plots during the
major season had higher sprouted tuber than during the minor season. Differences in
variety, climatic condition and soil temperature probably accounted for this result.
According to IITA (1996), high moisture content leading to high perishability of tubers,
lack of storage skills which discourages production, sprouting and chilling injury during

234
low temperature storage are some of the pre and post harvest problems associated with
sweetpotato.
On sensory characteristics of cooked tubers of two sweetpotato varieties at harvest for
2011 minor season and 2012 major season the application of organic and inorganic
fertilization either singly or in combination had no significant effect tuber colour, taste,
texture and flavour at harvest and after cooking in both minor and major seasons for both
varieties. The overall acceptability showed that Okumkom grown on 30-45-45 kg/haNPK
had higher preference in both seasons than Apomuden. Okumkom’s higher preference is
probably due to lower sugar content of tubers and also to the fact that most of its cooking
qualities were preferred to Apomuden. This result is similar to that found by Opare-
Obisaw et al., (2000).
Okumkom grown on 10t/haCM had the highest preference with regard to texture at harvest
during the major season, while Apomuden and Okumkom grown on 15-23-23 kg/ha/NPK
+5t/ha CM emerged as the best with most of its qualities preferred (colour, flavour and
palatability) in both seasons. According to Thybo and Martens (2000) the sensory
attributes that define cooked sweetpotato quality are internal colour, intensity of aroma and
flavour, sweetness and after taste, hardness and moistness. Overall acceptability showed
that Okumkom grown on 30-45-45 kg/haNPK was the most preferred (colour, taste,
texture, and palatability) at harvest during the minor season. The overall acceptability of
Okumkom grown on amended plots might be due to the better nutrient supply and the good
climatic condition that resulted in high starch content and fibrous texture associated with
low sugar content of roots. Degras (2003) indicated that starch content is influenced by
climatic variations during the year and cropping season and especially location, .and that

235
dry textured tubers are generally preferred in the tropics and in other traditional growing
areas.
Apomuden grown on 15-30-30kg/haNPK + 5t/ha CM was the least accepted in both
seasons. The high sugar level in Apomuden tubers, disagreeable smell experienced while
being eaten, yellow colour observed after cooking and while being eaten coupled with
waxy or wet texture which are not preferred by the population probably accounted for the
relatively low values as reported by Degras (2003).
On beta-carotene content of sweetpotato root tubers at harvest and after 12 weeks of
storage in ash, grass and pit theresults in both seasons indicate significant effects of
organic and inorganic fertilization either singly or in combination on beta-carotene content
of root tubers at harvestfor both varieties. The significant differences could be due to
differences in cultivar, fertilizer input and climatic factors. According to Degras (2003),
the range of vitamin A found in sweetpotato is quite wide and that the range of values
within a specific vitamin depends primarily on cultivar, but there is strong interaction with
management and environmental factors. Apomuden grown on amended and the control
plots gave relatively higher beta-carotene in both seasons than Okumkom. According to
Degras, (2003) N and P increase the carotene content of the tuber roots during bulking and
also affect the unit weight of tuberous roots especially, under good environmental
conditions.Villagaria (1999), reported that nitrogen fertilizer application for optimum Beta-
carotene yield depend on variety and environmental variations.
There was a relatively higher beta-carotene in Apomuden grown on amended and the
control plots and stored in pit 12 weeks of storage in minor season than at harvest except

236
for 30-45-45kg/haNPK. The positive response of Apomuden to pit storage with regard to
increase in beta-carotene in this study had similarly been reported by Tumuhimbise et al.,
(2010). Apomuden and Okumkom stored in ash did not store well recording zero values at
12 weeks of storage during the minor season. Relatively low beta-carotene values recorded
by Okumkom in pit storage as well as zero values recorded by both Okumkom and
Apomuden in ash storage in the minor season might probably be due to high storage
temperatures. This result is similar to that found by Tumuhimbise et al., (2010), who
indicated that sweetpotato roots stored using methods that maintain low temperature lead
to high retention of Beta-carotene. Pit storage was the most effective storage method
followed by ash with the least by grass storage for beta- carotene content of tuber at 12
weeks in storage. These results might be attributed to the fact that in pit storage the tubers
protected from direct sunlight and therefore the transfer of moisture was biased towards
gain rather than loss while storage in grass and ash resulted in moisture losses which were
also accompanied by the nutrient losses.
The starch content of the sweetpotato root tubers at harvest and after 12 weeks of storage
in ash, grass and pit revealed that in both seasons there were significant effects of the
chicken manure and inorganic fertilizer either alone or in combination with starch content
of tuber for both varieties at harvest. The significant difference in starch content on both
varieties and for the two cropping seasons might be explained in terms of differences in
cultivar and climatic variations during the year and cropping season. Metabolic activity is
temperature dependent for the formation of starch based on the cultivar. In both seasons
significantly higher starch content was produced by Okumkom than Apomuden grown on
amended and control plots at harvest although application of 30-45-45kg/haNPK and 15-

237
30-30kg/haNPK + 5t/ha CM to Okumkom did not show any significant effect from
Apomuden in the major season. This observation could be due to differences in cultivar
and their responses to soil nutrients for the formation of starch during tuber bulking.
Degras (2003) indicated that there is a significant role of starch content for determination
of fresh and dry matter with the range dependent on cultivar for its classification.
In both seasons there was a significant difference between Okumkom grown on amended
plots and Apomuden in tuber starch content at harvest. This observation might be due to
differences in cultivar. Apomuden and Okumkom grown on amended and control plots
except Okumkom grown on 30-30-30kg/haNPK and 30-45-45kg/haNPK had higher tuber
starch content at harvest in the minor season than in the major season. The relatively higher
rainfall during the major season than the minor season combined with the amended plots
might have supported faster plant growth in terms of leaf appearance during the major
season. Excessive rainfall might have accounted for the excessive vine growth and delayed
tuber bulking and maturation which resulted in low starch content during the major season
(Bradbury and Holloway (1988).
Apomuden and Okumkom under 30- 45-45 kg/haNPK and stored in pit had the highest
tuber starch content during the major season compared to the minor season. The increased
starch content in both varieties under 30-45-45 kg/haNPK and storage in pit during the
major season might be due to high moisture level under the pit storage during the major
season as well as the influenced of P and K in the chicken manure applied during crop
cultivation. .According to Degras (2003) starch content falls during tuberous root storage
especially, under moisture stress and that the effectiveness of different storage treatments
is closely linked with the conditions in terms of management under which the crop was

238
grown. Starch synthesis increased with increasing K concentration up to an optimum tuber
concentration of 1.8%. Kiraly (1976) and Degras (2003) indicated that P tends to increase
starch synthesis and hasten maturity.
Tubers stored in pit showed the most effective storage method with regard to tuber starch
content followed by ash and grass storage in that order at 12 weeks in storage in both
seasons. The inability of tuber to store well under grass storage conditions might probably
be due to the fact that grass storage was not protected from direct sunlight and therefore
storage in grass resulted in moisture losses which were also accompanied with the nutrient
losses. Bechoff (2011) indicated that post- harvest physiological processes that may affect
storability include evaporation of water from the product and changes in chemical
composition. Okumkom and Apomuden grown on amended and control plots and stored in
pit for 12 weeks for both seasons gave a relatively low starch content compared to the
starch level at harvest. The relatively low temperature especially, during the major season
storage period and high respiration rate due to the long storage for tubers of both varieties
stored in pit might have contributed to the drop in starch content. Starch content of tubers
tends to reduce during long term storage as a result of high respiration rate. According to
Degras (2003), both α–amylase and β–amylase enzymes present in tuberous root act
effectively under low temperature storage conditions and have the effect of converting
starch to sugars during storage thereby reducing the starch content below the level at
harvest.
The sugar content of sweetpotato root tubers at harvest and after 12 weeks af storage in
ash, grass and pit revealed that Apomuden and Okumkom grown on amended and the
control plots had higher sugar content at harvest during the minor season than in the major

239
season. The relatively high total maximum temperature values during the cropping season
(September to December) in the minor season compared to the major season might have
resulted in the higher tuber sugar content at harvest. Similarly, high soil moisture
experienced during the major cropping season might have accounted for the low sugar
content of tuber at harvest. Similar result was obtained by Watamabe and Nakayama
(1969), who indicated that both field and storage temperature has a large impact on tuber
sugar content and that high soil temperatures result in tuber sugar ends or other sugar-
related problems in sweetpotato. Lehminger (1981) reported that enzymes (B- amylase) are
protein compounds whose building blocks comprise principally of carbon and nitrogen.
The higher organic carbon content of the soil from the minor season site implies a higher
capacity for the synthesis of carbon and subsequently sugar in both varieties.
Application of chicken manure either alone or in combination with inorganic fertilizers to
Okumkom and storage in pit had higher sugar content than Apomuden at 12 weeks in
storage in both seasons. The significant increase in sugar content in Okumkom over
Apomuden might be due to differences in cultivar and their ability to respond to manure
treatment and storage condition. Degras (2003) indicated that the amount of glycosides
(sugar) found in cellular and ligneous membranes of sweetpotato vary largely in
accordance with the cultivar. Apomuden grown on amended and control plots and stored in
pit during the major season had better storability with higher sugar content than during the
minor season at 12 weeks in storage. The high relative humidity and water content in tuber
coupled with low temperature in the pit during the major season storage period might have
accounted for the results obtained. According to Ahn et al., (1980), takahat et al., (1992),
Woolfe (1992) and Tumuhimbese et al., (2010), higher humidity during long-term storage

240
are likely and that the extent of enzyme amylase depends on temperature and tuber water
content. Pit storage was the most effective storage method followed by ash with grass
storage being the least in sugar content for both cultivars at 12 weeks in storage in both
seasons. Mutandwa and Tafara (2007) indicated that if quality of the stored crop and
weight variation of tubers is considered then the use of soil banks (pit) is the most effective
compared to ash and grass.
On storability of sweetpotato after 12 weeks under pit, ash or grass storage Apomuden
grown on 15-23-23 kg/haNPK +5t/ha CM and stored under grass had the highest
percentage pest infested tuber at 12 weeks of storage in both seasons. Similarily,
Okumkom grown on 30-30-30 kg/haNPK and 30 -60-60 kg/haNPK and stored under grass
recorded the highest pest infested tuber at 12 WAS in both seasons. Although both
varieties were grown under high level of K before storage in grass, probably the high
temperatures of the storage condition might have resulted in high pest infestation.
According to Martin-Prevel (1989) and Perrenoud (1993) potassium nutrition influences
storage quality of tuber. Kushman (1975) indicated that storage room above 19o C results
in loss of root quality and marketability.
Apomuden and Okumkom grown on amended and control plots had relatively higher pest
infested tubers during the major season than during the minor season in all the three
storage conditions at 12 WAS. The relatively high total monthly rainfall (September -
November) combined with high relative humidity during the day and relatively high
maximum temperature during the storage period in the major season compared to the
minor season storage period (January – March of 2012) might have accounted for these

241
observations . CIP (1995) indicated that wet and warm conditions increased the likelihood
of serious pest infestation.
Okumkom grown on 15-30-30kg/haNPK + 5t/ha CM plot and stored in grass had the
lowest pest infested tubers at 12 WAS in both seasons. The good keeping quality in terms
of least pest infestation in Okumkom might be attributed to differences in cultivars and
their response to manure treatment and storage conditions. The relatively high K from
chicken manure and inorganic fertilizer used to treat tubers before storage might also
contributed to the least pest infestation. According to Bergmann (1992), K promotes the
thickening of tuber cell wall and growth of meristematic tissues and thus prevents
penetration of the epidermis by parasites.
Apomuden grown on amended plot and stored in pit at 12 WAS recorded the highest pest
infested tubers followed by Apomuden under ash storage with the least recorded by grass
storage at 12 WAS in both seasons. The high pest infestation ofApomuden grown on
amended plot and stored in pit might be due to the manure treatments on the tuber and
storage conditions. Ahn et al., (1980) indicated that the effectiveness of different storage
treatments is closely linked with the conditions under which the crop was grown. In the
course of the study it was observed that under the pit storage condition .apart from
sweetpotato weevils which were the common pest identified among all the three storage
conditions cricket and millipede were also identified, especially, during the major season
which produced the result obtained.

242
Apomuden grown on 30-45-45kg/haNPK plot and stored in ash and pit had the highest
number of rotten tubers at 12 WAS in both storage periods and differed significantly from
those grown on amended and control plots. However, Okumkom grown on amended plots
and stored in grass at 12 WAS in the minor season had no values rotten tubers. The highest
severity of decay observed in Apomuden grown on 30- 45- 45 kg/haNPK plot and stored in
ash and pit compared to other treatments might be due to high weevil damage, especially,
in pit storage at 12 WAS. Apomuden and Okumkom grown on amended and control plots
and stored in grass had higher number of rotten tubers followed by storage in ash with the
least number recorded in pit storage during the major season than during the minor season.
The severity of decay under grass storage condition might be due to the high temperatures
that existed during the long-term storage period coupled with high weevil infestation
(Kushman (1975), Woolfe (1992) and Tortoe et al., (2010).
A significant difference in weight loss of root tubers was observed between Apomuden and
Okumkom grown on amended and control plots and stored in ash, grass and pit in both
seasons.
The significant difference in weight loss of root tuber might be due to cultivar differences
as influenced by mineral fertilizer and organic manure application during the growth
period combined with the differences in storage conditions. Weight loss of tubers for both
Apomuden and Okumkom grown on amended and control plots and stored in ash, grass
and pit increased linearly from the begining of storage in both season (Amoah et al., 2011).
Okumkom grown on 15-15-15kg/haNPK + 5t/ha CM plot and stored in ash had the highest
tuber weight loss at 12 WAS in both season. This observation might be due to combined
effect of organic and inorganic fertilizers applied to the tuber during growth coupled with

243
application of ash. Biswas et al., (1988) and Mutandwa and Tafara (2007) indicated that
application of ash to sweetpotato tubers act as an absorbent to moisture resulting in low
relative humidity in the storage condition with resultant high water loss through the tuber
skin surface.
Generally, amended tubers of Apomuden stored in ash, grass and pit during the minor
season storage at 12 WAS gave higher tuber weight loss than the during major season
storage. This observation might be attributed to differences in cultivar, low relative
humidity coupled with relatively high maximum temperature during the storage period in
minor season (January – March, 2012) than during the major season storage period
(September – November). High temperature under storage condition are likely to result in
high rates of respiration, increased rates of metabolic breakdown which could result in
increased levels of tuber weight loss. During the storage period, tuberous roots lose weight
owing to respiration and transpiration (Woolfe, 1992 and Degras 2003).
Apomuden grown on 30-60-60 kg/haNPK and stored in ash, grass or pit gave the highest
and the same percentage shrinkage tuber (49.3 %) at 12 WAS in the minor season.
Shrinkage of tubers, especially, during the minor season storage period became apparent
for both varieties only after 2 weeksof storage and rose linearly (Amoah et al., 2011).
Apomuden grown on amended and the control plots and stored in grass or ash differed
significantly from pit storage in tuber shrinkage at 12 WAS during the major storage
period. The increased tuber shrinkage in grass or ash storage for Apomuden might be due
to dry storage condition coupled with increased temperature and high severity of tuber

244
decay. Increased temperature during tuber storage results in high rates of metabolism by
changing the carbohydrate composition or in the extreme case by metabolizing so much
starch that air spaces form and the texture of the root becomes spongy (Takahata et al.,
(1992) and Woolfe, (1992). The spongy texture of tubers due to high temperature might
have resulted in severity of tuber decay with observed tuber shrinkage in grass and ash
storage than in the pit.
Apomuden and Okumkom grown on amended and control plots and stored in pit at 12
WAS during the minor season storage period showed higher tuber shrinkage than in the
major season. The relatively high total monthly temperature, low relative humidity and low
total monthly rainfall during the minor season storage period (January to March, 2012)
compared to the major season period, might have accounted for the high temperature under
the pit storage condition. According to Woolfe (1992); Tumuhimbise et al., (2010), high
temperature and low relative humidity in the storage environment result in increased
respiration and rapid water loss through the skin surface and lignifications of tuber cell
wall.
Apomuden under amended plots except 15-15-15kg/haNPK +5t/ha CM or the control and
stored in pit gave higher tuber sprouting than Okumkom grown under the same treatments
at 12 WAS in both seasons. The results obtained might be due to differences in cultivar
and thier responds to fertilizer and resultant physiological changes. Rees (unpublished
results) indicated that sweetpotato cultivars differ very markedly in the tendency to sprout
during storage. Apomuden and Okumkom grown on amended and control plots and stored
in pit during the major season storage period differed significantly from ash and grass
storage at 12 WAS in tuber sprout. The relatively low total monthly temperature, high

245
relative humidity and high total monthly rainfall during the storage period in the major
season compared to the minor season storage period might have resulted in humid and cool
storage condition in pit. According to NSPRI (2002), low temperature storage can result in
sprouting which is one of the post-harvest problems associated with sweetpotato cultivated
and stored in Nigeria. Slight accumulation of water in the pit due to high rainfall observed
during the major season storage period might have also contributed to high tuber sprout in
pit storage. According to Dandago and Gungula (2011), accumulation of moisture in soil
based technique which involves digging of pits at a certain level of inclination could lead
to germination of tubers.
Okumkom grown on amended plots, especially, 15-15-15kg/haNPK +5t/ha CM and 30 –
45 – 45 kg/haNPK and stored in grass recorded zero values tuber sprout at 12 WAS in both
seasons. This observation might be due to differences in cultivar and their response to
amended treatment during growth combined with the dry grass used during storage of
tuber. Biswas et al., (1988) and Setiawate et al., (1994) indicated that the effectiveness of
different storage treatments is closely linked with the conditions under which the crop was
grown and that storage condition are more effective when the tuberous roots have matured
in dry soils. Similarly, root damage is lower if the roots are covered with humid rice straw
mulch, although the roots tend to sprout. Probably the dry grass used to store tuber reduced
or caused no tuber sprout in grass storage due to the dry storage condition. Apomuden and
Okumkom grown on amended and control plots and stored in pit gave higher tuber sprout
than under ash and grass storage at 12 WAS in both seasons. Sprouting was initiated in pit
storage at two weeks of storage. This observation might be due to humid grass straw mulch

246
as a result of high relative humidity in pit storage condition substantiating the finding of
Setiawate et al., (1994), and Amoah et al., (2010).
With regard to partial budget analysis, the application of 30-30-30 kg/ha NPK proved to be
more cost effective for the production of both sweetpotato varieties in both seasons than
the other amended and the control plots. This result obtained was similar to the findings of
SRI-CSIR. (2003) that sweetpotato response to nutrient balances showed that when
nitrogen levels are increased above zero, yield levels of sweetpotato increase, but when
nitrogen levels are increased above the optimum level of 30 kg/ha to 60 or 90 kg/ha, the
yield decreases, relative to the optimum rate of 30-30-30 kg/ha.

247
CHAPTER SIX
6.0 CONCLUSIONS AND RECOMMENDATIONS
6.1 Conclusions
On the basis of the results of the field and storage studies across both seasons the following
conclusions were drawn:
Objective 1:
Increased organic matter from chicken manure and inorganic fertilization in
combination improved both soil physical and chemical properties compared to
inorganic fertilizer alone and the control. The pH and exchangeable cations
increased with organic manure and inorganic fertilizer as mineral supplements
either singly or in combination. Bulk density also decreased with chicken manure
and inorganic fertilizer application. A combination of chicken manure and
inorganic fertilizer is paramount for increased sweetpotato yield.
Obective 2:
The application of chicken manure and inorganic fertilizer as mineral supplements
either singly or in combination influenced the yield of sweetpotato in both
vegetative biomass and fresh tuber production and enhanced sensory
characteristics, tuber nutritional composition for example beta-carotene, sugar as
well as starch content of tubers at harvest and after three months storage. Market
quality of tubers at harvest and physiological changes or quality of tuber during
storage of the two varieties of sweetpotato under three different storage conditions
(pit, ash and grass) across both seasons was also improved.

248
Apomuden grown on 15 – 15 – 15kg/haNPK +5t/ha CM was the earliest to flower,
produced the highest fresh vine weight at harvest during the major cropping season
and the highest root dry weight and marketable tubers in both seasons but produced
the highest percent cracked tuber and non- sprouted tubers at harvest in the minor
season.
Apomuden grown on 15 – 30 – 30kg/haNPK + 5t/ha CM had the highest total tuber
yield and tuber dry matter accumulation at harvest during the major season, the
lowest percentage pest infested tubers, non- rotten tubers in both seasons and non-
sprouted tubers during the minor season but produced the highest percent cracked
tubers during the major cropping season.
Okumkom grown on 15 – 23 – 23 kg/haNPK + 5t/ha CM had the highest number
of branches, fresh vine weight and tuber dry matter accumulation at harvest during
the major season but produced the highest percent forked tubers in both seasons.
Both Apomuden and Okumkom grown on 10t/ha CM produced the lowest total
tuber yield during the minor season at harvest in both seasons.
Apomuden grown on 30 – 45 – 45 kg/haNPK and 30 – 30 – 30 kg/haNPK
produced the highest and the lowest percent deformed tubers at harvest respectively
in both seasons.
Generally, Apomuden grown on amended and control plots gave higher levels of
pest infestation at harvest in both seasons than Okumkom planted on the same
treatments. However, Okumkom grown on amended plots gave higher number of
vine branches, vine diameter and vine length in both seasons than Apomuden
planted under similar treatments.

249
Okumkom grown on both amended and control plots produced higher marketable
and unmarketable tuber numbers during the major season than during the minor
season.
In both seasons correlation analyses showed that the vegetative growth was
negatively correlated with tuber yield and market quality and tuber market quality
was highly positively correlated with total yield of tuber. The vegetative characters
were also positively and significantly correlated.
Apomuden and Okumkom grown on amended plots produced higher percent
cracked tuber and higher percentage of deformed tubers at harvest during the major
season than during the minor season.
No tuber sprouting at harvest occurred in both Apomuden and Okumkom grown on
10t/ha CM and 30 – 30 – 30 kg/haNPK plots during the major season and
Okumkom grown on amended and the control plots produced no rotten tubers at
harvest during the major cropping season.
Apomuden and Okumkom grown on amended and control plots produced higher
rnumber of forked, pest infested and rotten tubers at harvest during the minor
season than during the major season.
Both Apomuden and Okumkom grown on 30 – 30 – 30 kg/haNPK and 30 – 60 – 60
kg/haNPK produced no sprouted tuber at harvest during the major and minor
seasons.

250
Objectice 3:
On the basis of physiological quality of tuber during storage using the three storage
methods, Apomuden grown on 15 – 15 – 15 kg/haNPK + 5t/ha CM and stored in
pit had lower sprouted tuber than the other amended tubers at 12 WAS in both
seasons.
Higher percent rotten tubers were produced in Apomuden and Okumkom grown on
amended and control plots and stored in ash at 12 WAS during the major season
than during the minor season.
Generally, both varieties showed higher percent sprouted and pest infested tubers
during the major season compared to the minor season at 12 WAS.
Tuber weight loss and tuber shrinkage increased in Apomuden grown on amended
plots and stored in ash, grass or pit during the minor season at 12 WAS compared
to the major season.
There was an increase in tuber sprouting in both Apomuden and Okumkom grown
on amended and control plots and stored in pit. Pest infested tubers and rotten
tubers increased in both varieties stored in grass or ash compared to pit storage at
12 WAS in both seasons.
Objective 4:
Tubers of Okumkom produced on 30 – 45 – 45 kg/ha NPKwere more acceptable at
harvest and after cooking during the minor season than Apomuden on the same
treatments during the major season. This suggests the need to modify the nutrient
supply according to environmental conditions.

251
Tubers of Apomuden and Okumkom produced on 15 – 23 – 23kg/ha NPK + 5t/ha
CM emerged the overall best accepted tubers with regard to colour flavour and
palatability at harvest and after cooking in both seasons.
Sweetpotato tuber nutritional composition in terms of beta-carotene, sugar and
starch contents at harvest and after 12 weeks of storage increased under chicken
manure and inorganic fertilizer application. Higher beta-carotene content of tubers
occurred in Apomuden grown on 15 – 30 – 30 kg/ha NPK + 5t/ha CM treatment at
harvest during the minor season than Okumkom tubers produced on the same
treatment in the major seasons.
Higher beta-carotene content was obtained with Apomuden grown on both
amended and control plots at harvest in both seasons than Okumkom grown on
similar treatments and cropping seasons. Generally, higher beta-carotene content of
tubers was obtained in Apomuden on amended and control plots and stored in pit at
12 WAS in both seasons than Okumkom. This confirms varietal difference in Beta-
carotene content.
Apomuden and Okumkom grown on amended and control plots produced higher
tuber starch content at harvest during the minor season than the major season
except for Apomuden grown on 30 – 30 – 30 kg/ha NPK and 30 – 45 – 45 kg/ha
NPK treatments which recorded lower values in the minor season. Also, higher
stuber tarch content at harvest was obtained in Okumkom compared to Apomuden
grown on amended and control plots in both seasons. This suggests the influence of
variety and nutrient supply on starch production in sweetpotato and also that starch
production in the tubers is better in the minor season than the wet season.
252
Apomuden and Okumkom grown on amended and the control plots had higher
sugar content at harvest during the minor season than during the major season.
Objective 5:
Okumkom and Apomuden grown on amended and control plots and stored in pit
produced a relatively higher mean beta-carotene content at 12 WAS, especially,
during the minor season than at harvest, suggesting an improvement in beta-
carotene content in sweetpotato tubers under pit storage.
Okumkom and Apomuden grown on amended and the control plots and stored in
pit had a relatively lower mean tuber starch content at 12 WAS in both seasons than
at harvest.
Higher sugar content of tubers occurred in Okumkom grown under amended plots
and stored in pit than Apomuden under the same treatments at 12 WAS in both
seasons, although not all the amended treatments of Okumkom stored well.
Both varieties grown under amended and control plots and stored in pit during the
major season stored better in terms of tuber sugar content at 12 WAS than during
the minor season.
Pit storage appeared to be more efficient for the storage of sweetpotato tubers with
regard to beta- carotene, starch and sugar content than ash or grass storage systems.
Objective 6:
Apomuden and Okumkom grown on 30-30-30 kg/ha NPK dominated in terms of
cost benefit analysis than the other amended plots and the control in both growing
seasons especially in the major season.

253
6.2 Recommendations
On the basis of the experimental results it is recommended that:
Objective 1:
A combination of chicken manure and inorganic fertilizer for soil fertility
supplementation for sweepotato production is a better option than either chicken
manure or inorganic mineral input applied singly.
Objective 2:
Apomuden should be grown on a combination of 15 – 30 – 30 kg/haNPK + 5t/ha
CM for higher marketable and total fresh tuber yields in the forest transitional zone
or similar environments, while a combination of 15-23-23 kg/haNPK + 5t/ha CM
and 30 – 45 + 45 kg/haNPK especially, and other amendments with Okumkom is
recommended for higher vegetative biomass that can serve as animal feed in other
agro-ecologies.
Objective 3:
For effective reduction of number of rotten, sprouted and pest infested tubers,
Okumkom and Apomuden tubers may be stored under ash, pit or grass storage
conditions during the minor season. However, Okumkom and Apomuden on15 –
15 – 15 kg/haNPK + 5t/ha CM, especially, and stored in pit during both seasons is
recommended for lower tuber sprouting during storage.
Similarly, for effective storage of Apomuden and Okumkom on amended and
control plots with regard to lower root tuber weight loss and tuber shrinkage tubers
may be stored under any ofl the three storage methods during the major season.

254
Objective 4:
Apomuden and Okumkom grown on amended plots, especially, 10t/ha CM, 30-30-
30 kg/haNPK, 15-15-15 kg/haNPK + 5t/ha CM and 15-30-30 kg/haNPK + 5t/ha
CM is recommended for no root tuber sprouting at harvest during the major and
minor seasons respectively for the forest transitional zone.
Apomuden and Okumkom under 15 – 23 – 23 kg/ha NPK + 5t/ha CM is
recommended as the most preferred with regard to colour, flavour and palatability
at harvest and after cooking in both seasons. However, growing Okumkom on 30 –
45 – 45 kg/ha NPK is recommended for overall best acceptable root tuber during
the minor season at harvest and after cooking.
Production of Apomuden on amended plots especially, 15 – 30 – 30 kg/ha NPK +
5t/ha CM should be promoted and attempts made to reduce the cultivation of
Okumkom among rural farmers in the country, especially, during the minor season
to improve vitamin A among children.
Objective 5:
Pit storage of Apomuden and Okumkom grown on amended and control plots is
recommended for both the major and the minor seasons since the concentration of
beta-carotene in the tubers increased and also after storage was better than in ash or
grass storage systems.
Production of Okumkom and Apomuden on amended plots should be promoted and
attempt made to increase the cultivation for high tuber starch content during the
minor season whereas for production of low root tuber sugar content cultivation
should be preferably done during the major season.

255
For effective storage of Apomuden and Okumkom pit storage method is
recommended for improved starch and sugar content of tubers after storage than in
ash or grass storage methods in both seasons.
Objective 6:
For farmers to appreciate the benefits of amendment and also for high sweetpotato
yield, it is recommended that farmers should apply 30- 30- 30 kg/ha NPK on their
fields.
256
REFERENCES
Agboola, A. A., Obigbesan, G. O. and Fayemi, A. A. A. (1975).Interrelations between
organic and inorganic fertilizer in tropical rainforest of Western Nigeria.
FAO Soil Bulletin No. 27, 337-351; Rome. Ahn, J.
Ahn, P. M., Collins, W. W. and Pharr, D. M. (1980). Influence of preharvest
temperature and flooding on sweetpotato roots in storage. Hortscience 15:
261-263.
Ahn, P. M. (1993). Tropical soils and fertilizer use, Intermediate. Trop. Agric Series.,
Longman Sci. and Tech. Ltd. UK.
Almeida-Muradian, L. B. and Penteado, M. V. C. (1992). Carotenoids and provitamin
A value of some Brazilian sweetpotato cultivars (Ipomoea batatas Lam)
Sao Paulo, 145-154
Ambe, J. T.(1997). Response of Sweetpotato (Ipomoea batatas (L) Lam.) to seedbed
preparation in high rainfall forest zone of Cameroun Africa Journal of Root
and Tuber Crops.3 (1).22-23.
Amoah, R. S., Teye, E., Abano, E. E. and Tetteh , J. P. ( 2011) Effect of pre-storage
treatment on the shelf-life of TIS 2 sweetpotato variety. Journal of
Agriculture and Biological science vo. 6 (4), 9-12.
Anochilo, B. C. (1984). Food Crop Production. Macmillan Publishers Limited,
Basingstoke pp 11.
Asiamah, R. D. (1988) Soils and soil suitability of Ashanti region. Soil Research Institute
- Council for Scientific and Industrial Research, Kwadaso-Kumasi.
ReportNo.l93 p. 21.

257
Asubongteng, K. O. and Dennis, E. A. (1995). Effects of different types of organic
Fertilizers on valley bottom rice varieties. Proceedings of seminar on
organic and sedentary Agriculture.pp. 141-156, Accra, Soil Reasearch
Institute-CSIR, Ghana.
Austin, M. E. Aung L. H. and Graves, B. (1970).Some observations on the growth and
development of sweetpotato (Ipomoea batatas L).Journal of Horticultural
Science 45, 257-64
Awojobi, B. F. (2004). Indigenous knowledge in potato utilization, processing and
preservation.In Olakesusi, F. (Eds).Proceedings of Post Harvest seminar P.
1-127. Ilorin: Nigerian Stored Products Research Institute.
Baffour, I. H. (1984).Agricultural Science for West African Schools, Afram Publication
Ltd.
Accra 96 p.
Bandel, V. A., Shaffeur, C. S. McClurge, C. A. (1972). Poultry Manure- A valuable
Fertilizer. University of Maryland Cooperative Extension Services. Fact
sheet 3C.
Baum, E., Kotschi, J., Lilley, K. and Ngware, S. (1983). Integrated Livestock
Development Project in Western Tanzanian. Evaluation Report, GTZ.
Bechoff, A., (2011). Effect of drying and storage on the degradation of total carotenoids in
orange fleshed sweetpotato cultivars. International Journal of food Science
and Technology 12 (1) 90- 103
Bergmann, W. (1992).Nutritional Disorders of Plants.Gustav Fischer Verlag, New York.
pp 111-141.

258
Bhagsari, A. S. and Ashley, D. A. (1990).Relationship of photosynthesis and harvest
index to sweetpotato yield.Journal of the American Society for Horticultural
Science, 115,288-93.
Biswas, J., Sen, H. and Mukhopadyay, S. K. (1988), Effect of time of planting on tuber
development of sweetpotato (Ipomoea batatas L. Lam). Journal of root
crops 14(1): 11-15
Boateng, J. K. and Oppong, J. (1995). Effect of farmyard manures and methods of land
clearing on soil properties in maize yield. Proceedings of Seminar on
organic and sedentary Agriculture. Accra, pp. 85-93.
Bonsi, E., Bonsi. C., Zabawa, R., Doamekpor, P. and Kebede, E. (2009) Concentrated
nutritional and economic enhancement of Ghanaian diets using orange-
fleshed sweetpotato products. Horticulture collabotative research support
program. Tuskegee University.
Bonsu, M. (1986).Organic residues of less erosion in Ghana.Soil erosion and
Conservation. Soil Conservation Society of America, pp. 615-621.
Bourke, R., M. (1985a). Sweetpotato (Ipomoea batatas) production and research in Papua
New Guinea. Papua New Guinea. Journal of Agriculture, Forestry and
Fisheries, 33, 89-108.
Bourke, R. M. (1985b). Influence of nitrogen and potassium fertiliser on growth of
sweetpotato (Ipomoea batatas) in Papua New Guinea. Field Crops
Research, 12, 363-375.

259
Bouwkamp, J. C. (1985). Production requirements. In J. C. Bouwkamp (ed) Sweetpotato
Products: A natural resource for the tropics. CRC Press Inc. Boca Ration,
pp 9-33.
Bovell-Benjamin, A. C. (2007). Sweetpotato.A review of its past, present and future role
in human nutrition. Adv. Food a Nutr. Res., 52-58
Bradbury, J. H. and Holloway, W. D. (1988). Chemistry of tropical root crops:
significance for nutrition and agriculture in the Pacific. ACIAR Monograph
6, Australian Centre for International Agricultural Research.
Brechin, J. and McDonald, G. K. (1994).Effect of form and rate of pig manure on the
growth, nutrient uptake, and yield of barley (cv. Galleon).Australian Journal
of Experimental Agriculture,34, 505– 510.
Buresh, I. J., Sanchez, P. A. and Calhounn, F. (Ed). (1997). Replenishing soil Fertility.
In Africa: SSSA Special Publication 51, SSSA and ASA, Madison.
Buri, B. J. (1997). Beta carotene and human health; A review of current Research.Nutr.
Res., 17: 547-580.
Campbell, G. M., Hermandez, T. P. and Miller, J. F. (1963).The effect of Temperature,
photoperiod and other related treatments on flowering in Ipomoea
batatas.Proceedings of the American Society for Horticultural Science, 83,
618-22
Capinera, L. J. (1998). Sweetpotato weevil (Cylas formicerius (Fabricius).Publication
No.EENY-27.University of Florida, pp 5.

260
Chang, C. T., Liou, H. Y., Tang, H. L. and Sung, H. Y. (1996). Activation, purification
and properties of β-amylase from sweetpotatoes (Ipomoea batatas).
Biotechnology and Applied Biochemistry 24, 13-18
Cheong, C. G., Eom, S. H., Chang, C., Shin, D. H., Song, H. K., Min, K., Moon, J. H.,
Kim, K. K., Hwang, Y. and Suh, S. W. (1995). Crystallisation, molecular
repalcement solution, and refinement of tetrameric β-amylase from
sweetpotato. Proteins: Structure, Function and Genetics 21, 105-117
Chilosa, N. N. V., Mayona, C. M., Rwiza, E., Ndondi, T., Kilima, M. S., Mbilinyi, L.
B., Kapinga, R., and Rees, D (1995). Collaborative research between the
Root and Tuber Research Programme and NRI: Post-harvest evaluation of
sweetpotato varieties. Paper presented at the National Root and Tuber
Coordinating Committee Meeting held at Mwanza on 16th-17th October
1995.
CIP, (1996).Sweetpotato Facts. Leaflet. Lima, Peru, 2 pp.
Clark, C. A. (1992). Postharvest diseases of sweetpotatoes and their control. Postharvest
News and information 3: 75N-79N.
Clark, C. A., Wilder-Ayers, J. A. and Duarte, V. (1989) .Resistance of sweetpotato to
bacterial root and stem rot caused by Erwinia chrysanthem.Plant Disease
773: 984-987.
Constantin, R. J., Jones, L. G., Hammett, H. L. & Hermandez, T. P. (1977).Effect of
potassiumand phosphorus fertilization on quality of sweetpotato. Journal of
American Soil Science Society, 102: 779-781.

261
Crops Research Institute (2002), Council for Scientific and Industrial Research, Ghana
Sweetpotato: The Crop of the Future. Factsheet, November 2002, pp 1-6.
Crop Research Institute (2003), Council for Scientific and Industrial Research. Ghana.
Annual Report.
Crop Research Institute (2004), Council for Scientific and Industrial Research. Ghana.
Annual Report.
Crop Research Institute (2004), Council for Scientific and Industrial Research, Ghana.
Sweetpotato Production Guide. A Resource and Reference Manual pp 12-
14.
Crop Research Institute (2006). Council for Scientific and Industrial Research,
Ghana.Annual Report.
Dahnke, W. C., Fanning, C. and Ctanach, A. (1992), Sweetpotato facts sheets. North
Dakola State University
Dandago, M. A. and Gungula, D. T.( 2011). Effects of various storage methods on the
quality and nutritional composition of sweetpotato (Ipomoea batatas L).in
Yola Nigeria. International Food Research Journal 18: 271-278
De Geus, J. G. (1967). Fertilizer Guide for Tropical and Subtropical Farming.Centre
d'Etude de l'Azote, Zurich.
Degras, L. (2003). Sweetpotato: The tropical Agriculturalist. Macmillan publishers Ltd.
Lima, Peru.
Dennis, E. A.; Anane-Sakyi, C. and Affi-Pungu, G. (1993).The effect of cowdung and
mineral fertilizers on the yield of dry season onion gardening in Upper East

262
Region of Ghana. Paper Presented at First National Workshop on Food and
Industrial Crops, 25-27 October 1994. Kumasi, Ghana.
Dick, R. P. (1992) . A review: long-term effects of agricultural systems on soil
biochemical and microbial parameters. Agriculture Ecosystems&
Environment, 40, 25–36.
Du Plooy, D. P., Wagner, J. J. and Bosch S. E. (1988).Cultivation of Sweetpotatoes.
Printed and Published in the Republic of South Africa by the Department of
Agriculture and Water Supply, pp 1 -8.
Edwards, C. A. and Neuhauser, E. F. (1988).Earthworms in Waste and Environmental
Management. SPB Academic Publishing: The Hague.
Eka, O. U. (1998) Nutritional quality of plant foods. University of Benin: Post harvest
research unit. p 1-31
Eno, C. F. (1962). Chicken Manure: Its importance value, preservation and disposition.
University of Florida Agricultural Experimental Station, Circular S-140.
FAO (1984).Fertilizer and Plant Nutrition Guide; FAO Soil Bulletin. No. 9: 45-51.
FAO (1991). Postharvest treatment of potato: storage, preservation; in Post-harvest and
processing of African staple food: a technical compendium. FAO
Agricultural bulleting, 89: 218-225. Edited by Bensini MC, Walston JP.
FAO of the United Nations, (2001).Processed Statistics of 2001.(Unpublished). Rome. Pp
132-139.
FAO/UNESCO (1988), Food and Agricultural Organization/United Nations Educational
Scientific and Cultural Organization. Soil map of the World.Revised
legend. Rome: FAO.

263
Farrell D. J, Jibril H, Perez-Maldonado R A, and Mannion P. F. (2000).A note on a
comparison of sweetpotato vines and Lucerne meal for broiler chickens.
Animal Feed Science Technology 85: 145-150.
Figueroa V. and Rodriguez, J. (1994).Un alimento seco para aves basado en mieles de
cana de azucar. Livestock Research for Rural Development. 6(1)
http://www. fao. org/ag/aga/agap/FRG/FEEDback/lrrd/lrrd6/1/vilda2. htm
Folquer, F. (1974). Varietal efficiency in the spring production of sweetpotato seeds
(Ipomoea batatas (L) Lam) Revista Agronomica del Noroeste Agentino. 11,
193-225. {Field Crop Abstract) (1976), 29, 881.
Foth, H. D. (1978).Fundamentals of Soil Science, 6th Edition. John Willey and Sons, New
York.
Geo. W., Carver, M. S. and AGR,D. (1925). How the Farmer Can Save His
Sweetpotatoes and Ways of Preparing Them for the Table. BULLETIN NO.
38Tuskegee Institute Press
Ghana Meteorological Agency-Mampong –Ashanti (2011)
Ghana Meteorological Agency, Mampong –Ashanti (2012)
Goodbody, S. and Humpfreys,G. S. (1986). Soil chemical status and the prediction of
Sweetpotato yields.Tropical Agriculture (Trinidad), 63.209-11.
Grewel, J. S. and Trehan, S. P. (1983).Residue effect of phosphorus and potassium
fertilizer and farmyard manure on potato yield, nutrient uptake and soil
fertility.Indian Journal of Agricultural Science. 53 (I): 65-72.

264
Guri, B. S. Y. (1986). A simple guide to Home Gardening (1st Edition), National Catholic
Secretariat, Accra. p. 12
Hagenimana, V., Simard, R E. and Vezina, L-P.(1994a). Amylolytic activity in
germinating sweetpotato (Ipomoea batatas) roots. Journal of the American
Society of Horticultural Science 119, 313-320
Hagenimana, V., Vezina, L-P.and Simard, R. E. (1994b). Sweetpotato alpha and beta
amylases: characterisation and kinetic studies with endogenous inhibitors.
Journal of Food Science 59, 373-377
Hahn, S. K. (1977). Sweetpotato. In Eco - physiology of Tropical Crops. Goldworthy N.
M. Fisher,Chichester: Wiley. P 1124
Hahn, S. K. and Hozyo, Y. (1984).Sweetpotato. In: The physiology of field cropsEd. P. R.
Goldworthy N. M. Fisher,Chichester: Wiley. pp. 551-8.
Hakiza, J. I., Taryamureeba, G., Kakuhenzire,R. M., Odongo,B., Mwanga,R. M.,
Kanzikwer, A,R. and Adipala ,E. (2000). Potato and sweetpotato
improvement in Uganda; A historical perspective.African potato
Association Conference Proceedings 5:47-58
Halavatau, S., Asher, C. J. and Bell, L. C. (1996). Soil fertility and sweetpotato research
in Tonga - Nitrogen and Phosphorus. In: Craswell, E. T. Asher, C. J. and
O’Sullivan, J. N. (eds). ACIAR Proceedings No. 65: Mineral nutrient
disorders of root crops in the Pacific. pp 58-64.
Hammett, L. K. and Miller, C. H, (1982).Influence of N Sources, N Rate and K Rate on
the Yield and Mineral Concentrations of Sweetpotato.Journal of America
Society of Horticultural Science. 109: 294-298.

265
Hammett, L. K., Miller, C. H., Swallow, W. H. and Harden, C. (1984). Influence of N
Source, N rate and K rate on Yield and Mineral Concentration of
Sweetpotato. Journal of American Society of Horticultural Science, 101(3):
204-218.
Hartemink, E. A., Johnson, M., O'Sullivan, J. N. and Poloma, S. (2000a). Nitrogen use
Efficiency of taro and sweetpotato in the humid lowland of Papua New
Guinea, Agriculture, Ecosystems and Environment, 79: 271-280.
Hartemink, E. A., Poloma, S. Maino, M., Powell, K. S., Egenae, J. and O'Sullivan-
Hileman, L. H. (2000b). The Fertilizer Value of Broiler litter. Arkansas
Agricultural Exp. L Station, Report Series 158: 3-7.
Hawkes, J. G. (1989). The domestication of roots and tubers in the Americas. In Foraging
and Farming: The Evolution of Plant Exploitations, ed. D. R. Harris & G.
D. C. Hillman, pp. 481- 99. One World Archaeology, No. 13 London:
Unwind Hyman.
Hileman, L. H. (1967). The Fertilizer Value Of Broiler Litter. Arkansas Agriculture Exp.
1 Station, Report Series 158:3-7
Hileman, L. H. (1971). Effect of rate of poultry manure application on selected Chemical
properties; Proceedings of International Symposium on live Stock waste.
American Society of Engineers, St. Jos Michigan, 247-248.
Hill, W. A. and Bacon, P. (1984).Fertilizer N use efficiency and associative N2-fixation
of sweetpotato. In: Proceedings of the Sixth Symposium of the International
Society for Tropical Root Crops, CIP Lima Peru, pp 535-542.

266
Horton, E. D. (1989). Recent trends in world sweetpotato production and use. Sweetpotato
Research and Development for small Farmers, (eds) Kenneth T., Mackay,
Manuel K., and Paloma and Roinda T. Samico. Publications.SEAMEO-
SEARCA Phillipines. p391.
Huang, A. S., Tanudjaja, L. and Lum, D. (1999). . Content of alpha-, beta-carotene, and
dietary fibre in 18 sweetpotato varieties grown in Hawaii.Journal of Food
Compos Anal., 12: 147−151.
Huett, D. O. (1975).A study of factors contributing to variability in the yield and quality
of sweetpotato (Ipomoea batatas (L). Lam). MSc Agronomy Thesis,
University of Sydney, Australia.
Igua, P. B. (1985). The effect of different rates of chicken manure on growth and yield of
intercropped maize (Zea mays) and sweetpotato (Ipomoea batatas).B. Sc.
Thesis, Port Moresby, University of Papua New Guinea, 68.
IITA (1996).Sweetpotato.In sustainable food production in sub-Saharan Africa 1;
International Institute of Tropical Agriculture (IITA) contribution. pp. 79-
83.
Ifenkwe, O. P., Okonkwo, J. C., Nwonkocha, H. N. and Njoku, J. C. (1986).Effect of
organicand inorganic nutrient sources on total and graded yields of potato in
the Jos Plateau of Nigeria. IDRC Ottawa, Canada, 258, 81,
Imas, P. and Bansal, S. K. (1999). In: Potassium and Integrated Nutrient Management in
Potato, Coordinator, International Potash Institute, Basel, Switzerland, 60p.
International Institute for Tropical Agriculture (IITA), (1993). Sustainable Food
Production in Saharan Africa 1. IITA’s contributions.IITA Ibadan, Nigeria.

267
Janssens, M. (2001).Crop production in tropical Africa.CIP Royal Library Albert I.
Brussels pp 204, 220-221.
Jayawardenes, T. (1985). Phosphorusfertilizer and organic matter effect on yield of
sweetpotato Journal of Agricultural science. 36 (8) pp 33-65.
Jiang, G. S., Li, Y. N. and Cai, S. J. (1994). Zymological properties of sweetpotato β-
amylase and its application in beer brewing. Food Science-China 3, 7-11
Kapinga, R. E., Ewell, P. T., Jeremiah, S. C. and Kileo, R. (1995). Sweetpotatoes in
Tanzanian farming and food systems: implication for research. CIP Sub-
Saharan Africa Region.Nairobi, Kenya/Ministry of Agriculture, Dare-Es-
Salaam, Tanzania. 47pp.
Kay, D. E. (1973).Root Crops, London: Tropical Product Institute, 245pp.
Kays, S. J. and Kays. S. E. (1998). Sweetpotato chemistry in relation to health. pp. 231-
272. In: Sweetpotato Production Systems toward the 21st
Century. Kyushu
National Agri.
Expt. Sta., Miyakonojo, Miyazaki, Japan.
Khush, G. S. (1999). Green revolution: preparing for the 21st century. Genome 42:646-
655.
Kimber, A. J. (1972): The sweetpotato in subsistence agriculture. Papua New Guinea
Agricultural Journal, 23, 80-100.
Kingery, W. L., Wood, C. W., Delaney, D. P., William, J. P. and Mullins G. L.
(1993).Impact of long term application of broiler litter on economically
related soil properties. Jnl Environ. Qual. 22, pp 51.

268
Kiraly, Z. (1976). Plant disease resistance as influenced by biochemical effects of
nutrients in fertilizer. Proceedings of the IPI 12th Colloquium on: Fertilizer
Use and Plant Health held at Izmir, Turkey, 1976. International Potash
Institute, Bern, Switzerland, pp. 33-46.
Kirchmann, H. and Bergstrom, L. (2001). Do organic farming practices reduce nitrate
leaching? Communications in Soil Science and Plant Analysis 32:997-1028.
Kleinkopf, G. E., Westermann, D. T. and Wille, M. J. (1988). Soil temperature effects
on sugar end development. Proc. of the University of Idaho Winter
Commodity Schools 20:180-181.
Kushman, L. J. (1975). Effect of injury and relative humidity during curing on weight and
volume loss of sweetpotatoes during curing and storage. HortScience
10:275-277.
Lehminger, A. L. (1981). Biochemistry.Worth Publishers, New York. P 1104
Lema, K. M. (1992). Reducing weevil damage in sweetpotato, using host plant resistance
and early planting and harvesting, pp 345-346. In Promotion of Root Crop
Based Industries. Tropical Root Crops: Proceedings of the 4th Triennial
Symposia, ISTRC- AB. M. O. Akoroda and O. B. Arene (ed) IITA, Ibadan,
Nigeria.
Leonard, D. (1982). Traditional field crops.United Status: peace crops. Macmilan press
Ltd. 147 – 148 pp.
Lerner, B. R. (2001). The sweetpotato.Purdue University cooperative extension
service.Vegetables HO-136. W. West Lafayette.

269
Lisinska, G. and Leszcynski; W. (1989).The effects of herbicides upon
potatoes.American Journal of Potato Research. 14 (2) 112-123
Lowe, S. B. and Wilson, L. A. (1975). Yield and yield components of six sweetpotato
(Ipomoea batatas) cultivars: Experimental Agriculture, 11, 39-48.
Magagula, N. E. M., Ossom, E. M., Rhykerd, R. L. and Rhykerd, C. L. (2010).Effects
of chicken manure on soil properties under Sweetpotato [Ipomoea batatas
(L).Lam. ]Culture in Swaziland.American-Eurasian Journal of Agronomy, 3
(2): 36-43
Manson, A. and Miles, N. (2005).Using manures to supply plant nutrients.hppt:
//agriculture. kzntl. gov. za/portal/ Agricpublications/Agric updates/using
manures to supply plant nutrients /tabid /327. Default.aspx. 29/05/09
Marschner, H. (1995). Mineral Nutrition in Higher Plants. 2nd Ed. Academic Press,
London, PP. 79
Martin, F. W. and Jones, A. (1972). The species of ipomoea closely related to the
Sweetpotato Economic Botany 26, 201-15.
Martin, F. W. (1985). Differences among sweetpotato in response to shading.Tropical
Agriculture (Trinidad), 62, 161-3.
Martin-Prevel, P. J. (1989). Physiological Processes related to Handling and Storage
Quality of Crops. Proceedings of the 21st IPI Colloquium on: Methods of K
Research in Plants, held at Louvain-la-Neuve, Belguim, 19-21 June 1989,
International Potash Institute, Bern, Switzerland, pp. 219-248.

270
Mascianica, M. P., Bellinder, R. R., Graves, B., Morse, R. D. and Talleyrand, H.
(1985).Forecasting of N fertilization requirements for sweetpotatoes.
Journal of the American Society for Horticultural Science 110, 358-361.
Maynard, A. A. and Hill, E. V. (2000).How to grow sweetpotatoes in Connecticut.The
Connecticut Agricultural Experimental station. New Haven. CT 06504
http:www. ct. gov\caes
Mayne, S. T. (1996). Beta-carotene, carotenoids and disease prevention in Human. Faseb
J., 10: 690-701.
McGraw, D. (1999). Sweetpotato Production, Oklahoma Co-operative Extension Service,
OSU, Extension Facts, F-6022, USA.
Mclaren, D. S, and Frigg, M. (2001).Sight and Life Manual on Vitamin A Deficiency
Disorders (VAAD) 2nd edition. p31.
Messiaen, C. M. (1994).The Tropical Vegetable Garden.Macmillan Press Ltd, London
and Basingstoke. 225 – 259
Miller A. J., Lindsey, W. L. and Parsa A. A. (1970).Use of poultry manure for
correction of Zn and Fe deficiency in plants. Scientific Series Paper No.
1417, Colorado Agricultural Experimental Station, Colorado, pp. 120-124.
Miller, C. E., and Turk, L. M. (1951).Fundamentals of Soil Science, 2nd Edition John
Willey, N. Y., pp. 60.
Miller, C. H. and Covington, H. M. (1982) Mineral Nutrition Studies with
SweetPotatoduring a Three-year Period. N. C. Agricultural Research
Service Technical Bulletin 273, pp. 24.

271
Ministry of Food and Agriculture (MoFA), (1988).Sweetpotato. Food Production and
Utilization Training Course Resource Materials, F. Osei Opare, J. D.
Nsarkoh, and Aryeetey, J. (Eds) Ministry of Agriculture, Ghana.
Missah, E. & Kissiedu, A. F. K. (1994).Effect of Time of Harvesting on the Yield and
Pest Incidence of two sweetpotato varieties in the forest zone of Ghana, pp.
267-270.Root Crop for Security in Africa. Proceedings of the 5th Triennial
Symposium of the ISTRC-AB. M. O. Akoroda (ed) Ibadan, Nigeria
Moat, M. and Dryden, G. M. (1993). Nutritive value of sweetpotato forage (Ipomoea
batatas (L) Lam.) as a ruminant animal feed.Papua-New Guinea Journal of
Agriculture Forestry and Fishery.36(1): 79-85.
Moore, P. A. Daniel, T. C., Sharpley, A. N. and Wood, C. W. (1995). Poultry manure
management: environmentally sound options. Soil and water conservation,
50: 321-327.
Moyer, J. W. (1982). Postharvest disease management for sweetpotatoes. In: Sweetpotato.
Proc. 1st
Intl. Symp., AVRDC, Taiwan, pp. 177-184.
Mukhtar, A. A. Tanimu, B. Arunah U. L. and Babaji B. A. (2010).Evaluation of the
agronomic characters of sweetpotato varieties grown at varying levels of
organic and Inorganic Fertilizer.World Journal of Agricultural Sciences 6
(4): 370-373, IDOSI Publications, Kaduna, Nigeria
Muller-Samann, K. M. andKotschi, J. (1994).Manure and its application. In: sustained
growth: soil fertility management in tropical smallholdings. cta/gtz, 265-
346.

272
Mupangwa, J. F, Ngongoni, N. T, Topps J H and Ndlovu, P. (1997).Chemical
composition and dry matter degradability profiles of forage legumes Cassia
rotundiflora cv. Wynn, Lablab purpureus cv. Highworth and
Macroptiliumatropurpureum cv. Siratro at 8 weeks of growth (pre-
anthesis). Animal Feed Science Technology 69:167-178.
Mutandwa, E. and Tafara G. C. (2007). Comparative assessment of indigenous methods
ofsweetpotato preservation among smallholder farmers: case of grass, ash
and soil based approaches in Zimbabwe. African studies quarterly 9 no. 3.
Myers, R. J. K., Palm,C. A., Cuevas, E., Gunatilleke ,I. U. N. and Brissard, M. (1994).
The synchronization of nutrient mineralization and plant nutrient demand.
In:The Biological Management of Tropical Soil Fertility. John Wiley &
sons, N. York
Nandpuri, K. S., Dhillon, R. S. and Singh S. (1971).The influence of fertilizers and
Irrigation on growth and yield of sweetpotato.Indian Journal of
Horticulture, 28,139-43.
Ngeve, J. M., Hain, S. K. and Bouwkamp, J. C. (1992).Effect of altitude and
environment on sweetpotato yield in Cameroon.Tropical Agriculture
(Trinidad), 69, 43-8.
Nicholaides, J. J., Chanay, H. F. and Magcagni, H. J. (1981).Sweetpotato response to P
and K fertilization. Agronomy Journal 77: 466-470.
Ningthoujam, S. (2010). How to Grow Sweetpotatoes. Fact Sheet North Carolina
Cooperative Extension Service, Salisbury

273
Nishiyama, I. (1971) Evolution and domestications of sweetpotato Botanical Magazine
(Tokyo), 84, 377-87.
Norman, J. C. (1992). Tropical Vegetable Crops. Arthur H. Publishers. Stockwell Ltd.
Great Britain. p 221
NSPRI (2002).Utilization of sweetpotato. In: Proceedings of Nigerian Stored Products
Research Institute (NSPRI) workshop in participatory technology
development methods. Community analysis report on postharvest practices
on cassava and sweetpotato, Udo-Ekong CR. pp. 11-12.
Nyakatawa, E. Z., Reddy, K. C. and Sistani, K. R. (2001). Tillage, cover cropping, and
poultry litter effects on selected soil chemical properties. African crop
science journal 58 (3) p. 69–74.
Okon, O. F. (2006). Growth and productivity of white and orange- fleshed sweetpotato
(Ipomoea batatas (L) (Lam) varieties as influenced by nitrogen fertilization.
M. Sc thesis, Department of Agronomy, Michael Okpara University of
Agriculture, Umudike.
Onwueme, I. C. (1978) The tropical tuber crops: yarn, cassava, sweetpotato and
cocoyam.New York, John Wiley and sons p. 176-183
Onwueme, I. C., and Sinha T. D (1991) .Field crop production in tropical Africa-
Technical centre for Agricultural and Rural Co-operation CTA publication,
Ede.The Netherlands.Pp 293.CTA publication, Ede.The Netherlands.Pp
293. Onwueme, I. C., and Sinha T. D (1991) .Field crop production in
tropical Africa-Technical centre for Agricultural and Rural Co-operation

274
CTA publication, Ede.The Netherlands.Pp 293.CTA publication, Ede.The
Netherlands.Pp 293.
Onwueme, I. C., and Sinha T. D (1991) .Field crop production in tropical Africa-
Technical centre for Agricultural and Rural Co-operation CTA publication,
Ede.The Netherlands.Pp 293.CTA publication, Ede.The Netherlands.Pp
293.
Opare-Obisaw, C., Danquah, A. O., Doku, E. V., Boakye, B. B. and Ansah-
Kissiedu,D. (2000) Consumer evaluation of five new sweetpotato (Ipomoea
batatas) varieties. Journal of Consumer Studies & Home Economics 24 ((1)
61–65,
Opena, R. P., Takagi, H. & Tsou, S. C. S. (1989). AVRDC Sweetpotato Improvement
Program, pp. 107-118. In: Sweetpotato Research and Development for
Small Farmers. (eds) Kenneth, T. Mackay, Manuel, K. Paloma and Rolinda,
T. Samico. Pub. SEAMEO-SEARCA, Philippines, pp 391.
Oslon, J. A. (1999). Carotenoids In:Shils, M. E Oslon J. A, Shike M, Ross A. C (Eds).
Modern nutrition in health and disease, 9th edition. Williams and Wilkin,
Baltimore. pp. 525-541.
Otoo, J. A. (1998). Second inspection of sweetpotato varietal release.publishedby Crop
Research Institute, Kumasi.
Overcash, M. R., Numenik, F. J., Mine, J. R. (1983).Introduction to Livestock Waste.
CRI Livestock Waste Management, CRC Press, N. Y. 1-22.
Palm, C. A., Myers, R. J. K. and Nandwa, S. M. (1997).Combined use of organic and
Inorganic nutrient sources for fertility maintenance and replenishment. In:

275
Replenishing Soil fertility in Africa pp. 93-217. SSSA Special
Republication 51.SSSA and ASA, Madison, WI.
Perrenoud, S. (1990).Potassium and plant health IPI Bulletin 8.2nd Edition. International
Potash Institute, Basel, Switzerland, pp. 29.
Perrenoud, S. (1993).Fertilizing for higher yield potato.IPI Bulletin 8.2nd Edition. International
Potash Institute, Basel, Switzerland, pp 29
Purseglove J. W. (1987) Tropical Crops: Dicotyledons Vol. 1 and 2 combined. Longman
Group Limited, England, pp 607.
Raemaekers, R. H. (2001). Crop production in tropical Africa.CIP Royal Library Albert I
Brussels pp 204, 220-221.
Rajamma, P. L. and Pillar, J. M. (1991) Efficiency of insecticides and pruning in the
control of sweetpotato weevil. Journal of root crops 17: 174-179
Rees, D. (2000). An assessment of sweetpotato damage and implications for shelf-life in
selected urban markets of Tanzania. NRI Report no. 2488 30 pp (C)
Rice, P. P. and Rice, L. W. (1987).Fruit and vegetable production in Africa.Macmillan
Publishers London.Pp . 231
Rodriguez-Amaya, D. B. (1999).A Guide to Catenoids Analysis in Foods.International
Life Sciences Institute (ISLI) Press, Washington DC.
Ruschi, B. R. (1998). The maintenance of sweetpotato planting materials in
Namibia.Options for the development of a vine production and distribution
system. M InstAgrar thesis, University of Pretoria, South Africa
Safo, E. Y., Ankoma, B. A., Ahenkorah, Y., Kwakye, P. K., Poku, J. A., Donkoh, F.,
Dennis, E. A., and Setsoafia, K. M. (1998). Report of subcommittee on

276
fertilizer use. National Agricultural Research Project (NARP), Council for
Scientific and Industrial Research, Accra, Ghana.
Saleh, H. H. (2002). The adaptive research: Progress and constraints; the case of Zanzibar.
Paper presented at the currriculum workshop held at Kizimbani Agricultural
Training Institute
Sanchez, P. A. (1973). Nitrogen fertilization. In: A Review of Soil Research in Tropical
Latin America, pp 90-125. Raleigh, North Carolina: North Carolina
agricultural experimental station.
Scott, G. J., Rosegrant,M. and Ringler, C. (2000).Roots and tubers for the 21st century.
Trends, projections and policy for developning countries,food, agriculture
and the environmental discussion paper. International Food Policy Research
Institute (IFPRI). Washington D. C. USA.
Setiawati, Y., Sudaryono A. and Setyono.P. (1994). Studi penyimpanan ubijalar segar.
Dalam: Seminar penerapan teknologi produksi dan pascapanen ubijalar
untuk mendukung agroindustri ubijalar. Edisi khusus Balitkabi. Pp. 100-
109.
Siegel, R. S., Hafez, A. A. R., Azevedo, J. and Stout, P. R. (1975). Management
procedures for effective fertilization with poultry manure. Unuversity of
Calfonia, Davis Compost Science, 16: 5-9.
Smailing, E. M. A., Nandwa, S. M. and Janssen, B. H. (1997).Soil fertility is at stake.
In: Replenishing soil fertility in Africa. Buresh, R. J., Sanshez, P. A. and
Calboun, F. (Eds). USA: SSSA Special Republication No. 51. 47-61 pp
Madison, W. I

277
Smith, T. P., S. Stoddard, Shankle, M. W. and Schultheis, J. (2009).Sweetpotato
production in the United States p. 287-323. In G. Loebenstein and G.
Thottappilly (eds). The Sweetpotato.Springer Science+Business Media BV.
Socolow, R. H. (1999). Nitrogen management and the future of food: Lessons from the
management of energy and carbon. In Proceedings of the National
Academy of Sciences, 96(11):6001-6008.
Soil Research Institute of Council for Scientific and Industrial Research, Ghana
(2003).Soil nutrient (mineral) content Factsheet.
Soil Research Institute (2007). Soil nutrient (mineral) content.
Sowley, E. N. K. (1999). Etiology of storage root of sweetpotato (Ipomoea batatas (L)
Lam) and its control by curing. An Mphil thesis presented to the
Department of Crop Science, University of Ghana, Legon, pp. 120
Stalham, M. A. and Allen, E. J. (2001).Effect of variety, irrigation regime and planting
date on depth, rate and duration and density of root growth in the potato
(Solanum tuberosum L).crop. J. of Agricultural Sci, Cambridge 137: 251-
270
Takahata, Y., Noda, T., And Nagata, T. (1992). Varietal diversity of free sugar
composition in storage root of sweetpotato. Japan. J. Brees. 42: 515-521
Takahata, Y., Noda, T. and Nagata, T. (1994).Effect of β-amylase stability and starch
gelatinisation during heating on varietal differences in maltose content in
sweet potatoes. Journal of Agricultural and Food Chemistry 42, 2564-2569
The International sweetpotato center (2007), Sweetpotato facts sheet. Lima, Peru p. 2
278
Thybo, A. K. and Martens, M. (2000).Analysis of sensory assessors in texture profiting
of potatoes by multivariate modeling.Food quality and preference. 11, 293-
298
Tisdale, L. S., Nelson, W. L. and Beaton, J. W. (1979) Soil fertility and soil fertilizers.
Macmillan publishing company, NewYork
Toda, H., Nitta, Y., Asanami, S., Kim, J. P. and Sakiyama, F. (1993). Sweetpotato β-
amylase.Primary structure and identification of the active-site glutamyl
residue. European Journal of Biochemistry 216, 25-38
Tortoe, C. Obodai, M. and Amoa-Awua, W. (2010,) Microbial deterioration of white
variety sweetpotato (Ipomoea batatas) under different storage structures.
International Journal of Plant Biology.1 (1)
Tumuhimbise G. A., Namutebi A. and Muyonga, J. H. (2010).Changes in
microstructure, beta -carotene content and in vitro bioaccessibility of
orange-fleshed sweetpotato roots stored under different conditions.
African Journal of food, agriculture, nutrition and development. 10 (8)
3015-3028
Tweneboah, C. K. (2000). Vegetable and Species in West Africa.Published by Co-Wood
Ltd., Accra.Pp 8- 15.
Ukom, N., Ojimelukwe, P. C. and Alamu, E. O. (2011).ll trans-cis β-carotene content of
selected sweet potato (Ipomoea batatas (L) Lam) varieties as influenced by
different levels of nitrogen fertilizer application African Journal of Food
Science Vol. 5(3), pp. 131 – 137

279
USDA (2009).Economic research service organic production ataset. http://www. ers. usda.
gov/Data/Organic/index. htm.
Vaida, Y. (1995). Vitamin A food production and use in Nepal”. In empowering vitamin
A foods.Eds E. Wasantwisut and G. A. Attig. Bangkok; Inst. Nutr., pp. 29-
44.
Venglovsky, J., Sasakova, N. and Placha, I. (2009). Pathogens and antibiotic residues in
animal manures and hygienic and ecological risks related to subsequent
land application. J. Am. Soc..Hort. Sci.100, 5386–5391.
Villagaria, O. M. R. (1999). Analysis of sweetpotato growth under different rates of
nitrogen fertilization Ph. D Thesis.North Carolina State University, Raleigh,
N. C. USA.
Villareal, R. L. (1982). Sweetpotato in the tropics: progress and problems, pp. 3- 16. In:
sweetpotato proceedings of the first international symposium. AVRDC,
Shanhua, Tainan, Taiwan, China.
Walker, D. W. and Woodson, W. R. (1987). Nitrogen rate and cultivar effects on
nitrogen and nitrate concentrations of sweetpotato leaf tissue.
Communications in soil science and plant analysis 18, 529-541.
Wang, Y., R. J. Horvat, R. A. White and S. J. Kays.(1998). Influence of postharvest
curing treatment on the synthesis of the volatile flavor components in
sweetpotato. Acta Hort. 464:207-212.
Watanabe, K. and Nakayama, K. (1969). Studies on the effects of soil physical
conditions on the growth and yield of sweetpotato: X. Crop Science Society
of Japan Proceedings, 39, 446-50.

280
Wilson, L. A. (1982). Tuberization in sweetpotato (Ipomoea batatas (L) Lam.).In
proceedings of the first international sweetpotato symposium, pp 79-94.
Tainan, Taiwan: Asian Vegetable Research and Development Centre.
Wilson, L. G., Averre, C. W., Baird, J. V., Beasley, E. G., Bonnano, A. R., Estes, E.
A., and Sorensen, K. A. (1989). Growing and marketing quality
sweetpotato. Bulletin No. AG- 09, N. C. Agr. (Trinidad) 50:53-59
Wooife, J. A. (1992). Sweetpotato: an untapped food resource. Cambridge University
Press, Cambridge, UK, 643 pp.
Yens, D. E. (1976).Sweetpotato.Ipomoea batatas (Convolvulaceae) In: Evolution Crop
Plants ed. NW Simmons pp 52-5. London: Longman.
Zhi, Z. (1991). Effect of potassuim on the yield of three sweetpotato varieties.Karsetsart
University, Kampphaeng, Saen Campus, Nakhon Pathom, Thailand.
Zublena, J. P., Barker, J. C. and Carter, T. A. (1996). Poultry manure as a fertilizer
source, Fact Sheet. North Carolina Cooperative Extension Service

281
LIST OF APPENDICES
Appendix 1: Percentage crop establishmentduring the 2011 minor seasonAnalysis of VarianceSource of variation d.f. s.s. m.s. v.r. F pr.
Reps stratum 3 1470.2 490.1 2.09
Reps.*Units* stratumVariety 1 281.7 281.7 1.20 0.279Fertilizer 7 796.6 113.8 0.49 0.840Variety.Fertilizer 7 781.4 111.6 0.48 0.847Residual 45 10546.4 234.4
Total 63 13876.2
Appendix 2: Number of marketable tubers during the 2011 minor seasonAnalysis of Variance
Source Of Variation D.F. S.S. M.S. V.R. F Pr.
Reps Stratum 3 83.38 27.79 0.54
Reps.*Units* StratumVariety 1 232.56 232.56 4.53 0.039Fertilizer 7 304.00 43.43 0.85 0.555Variety.Fertilizer 7 345.19 49.31 0.96 0.471Residual 45 2308.62 51.30
Total 63 3273.75
Appendix 3: Number of marketable tubers during the 2012 major seasonAnalysis of Variance
Source of variation d.f. s.s. m.s. v.r. F pr.
REPS stratum 2 447.0 223.5 1.42
REPS.*Units* stratumVariety 1 1419.2 1419.2 9.05 0.005Fertilizer 7 812.3 116.0 0.74 0.640Variety.Fertilizer 7 925.0 132.1 0.84 0.562Residual 30 4707.0 156.9
Total 47 8310.5

282
Appendix 4: Number of unmarketable tubers during the 2011 minor seasonAnalysis of VarianceSource Of Variation D.F. S.S. M.S. V.R. F Pr.
Reps Stratum 3 282.38 94.12 2.99
Reps.*Units* StratumVariety 1 1040.06 1040.06 33.03 <.001Fertilizer 7 123.25 17.61 0.56 0.785Variety.Fertilizer 7 148.19 21.17 0.67 0.694Residual 45 1417.12 31.49
Total 63 3011.00
Appendix 5: Number of unmarketable tubers during the 2012 major seasonAnalysis of VarianceSource of variation d.f. s.s. m.s. v.r. F pr.
REPS stratum 2 90.5 45.2 0.25
REPS.*Units* stratumVariety 1 808.5 808.5 4.55 0.041Fertilizer 7 3339.6 477.1 2.68 0.028Variety.Fertilizer 7 3160.6 451.5 2.54 0.035Residual 30 5331.5 177.7
Total 47 12730.8
Appendix 6: Marketable tuber weight per plot during the 2011 minor seasonAnalysis of VarianceSource of variation d.f. s.s. m.s. v.r. F pr.
Reps Stratum 3 12.284 4.095 2.48
Reps.*Units* StratumVariety 1 8.851 8.851 5.36 0.025Fertilizer 7 11.923 1.703 1.03 0.422Variety.Fertilizer 7 4.754 0.679 0.41 0.890Residual 45 74.246 1.650
Total 63 112.058

283
Appendix 7: Marketable tuber weight per plot during the 2012 major seasonAnalysis of VarianceSource of variation d.f. s.s. m.s. v.r. F pr.
Reps Stratum 2 104.940 52.470 10.17
Reps.*Units* StratumVariety 1 107.700 107.700 20.87 <.001Fertilizer 7 113.110 16.159 3.13 0.013Variety.Fertilizer 7 95.525 13.646 2.64 0.030Residual 30 154.820 5.161
Total 47 576.095
Appendix 8: Unmarketable tuber weight per plot during the 2011 minor seasonAnalysis of VarianceSource of variation d.f. s.s. m.s. v.r. F pr.
Reps Stratum 3 0.14607 0.04869 2.14
Reps.*Units* StratumVariety 1 0.35775 0.35775 15.70 <.001Fertilizer 7 0.18241 0.02606 1.14 0.354Variety.Fertilizer 7 0.18700 0.02671 1.17 0.338Residual 45 1.02553 0.02279
Total 63 1.89877
Appendix 9: Unmarketable tuber weight per plot during the 2012 major seasonAnalysis of Variance
Source of variation d.f. s.s. m.s. v.r. F pr.
REPS stratum 2 0.8717 0.4358 2.82
REPS.*Units* stratumVariety 1 1.6133 1.6133 10.43 0.003Fertilizer 7 3.6200 0.5171 3.34 0.009Variety.Fertilizer 7 3.6400 0.5200 3.36 0.009Residual 30 4.6417 0.1547
Total 47 14.3867

284
Appendix 10: Average tuber weight during the 2011 minor seasonAnalysis of Variance
Source of variation d.f. s.s. m.s. v.r. F pr.
Reps Stratum 3 0.080784 0.026928 4.15
Reps.*Units* StratumVariety 1 0.046991 0.046991 7.24 0.010Fertilizer 7 0.014996 0.002142 0.33 0.936Variety.Fertilizer 7 0.054451 0.007779 1.20 0.323Residual 45 0.292035 0.006490
Total 63 0.489257
Appendix 11: Average tuber weight during the 2012 major seasonAnalysis of Variance
Source of variation d.f. s.s. m.s. v.r. F pr.
REPS stratum 2 365604. 182802. 20.87
REPS.*Units* stratumVariety 1 250724. 250724. 28.63 <.001Fertilizer 7 71803. 10258. 1.17 0.348Variety.Fertilizer 7 86728. 12390. 1.41 0.236Residual 30 262764. 8759.
Total 47 1037622.
Appendix 12: Average tuber length during the 2011 minor seasonAnalysis of VarianceSource of variation d.f. s.s. m.s. v.r. F pr.
Reps Stratum 3 125.910 41.970 4.84Reps.*Units* Stratum
Variety 1 201.995 201.995 23.28 <.001Fertilizer 7 25.180 3.597 0.41 0.888Variety.Fertilizer 7 54.656 7.808 0.90 0.515Residual 45 390.497 8.678
Total 63 798.239

285
Appendix 13: Average tuber length during the 2012 major seasonAnalysis of Variance
Source of variation d.f. s.s. m.s. v.r. F pr.
Reps Stratum 2 165.688 82.844 25.95
Reps.*Units* StratumVariety 1 104.537 104.537 32.74 <.001Fertilizer 7 37.212 5.316 1.67 0.156Variety.Fertilizer 7 61.706 8.815 2.76 0.024Residual 30 95.774 3.192
Total 47 464.916
Appendix 14: Beta-carotene content of tubers at harvest during the 2011 minorseasonAnalysis of VarianceSource of variation d.f. s.s. m.s. v.r. F pr.
Reps stratum 3 28.683 9.561 6.31
Reps.*Units* stratumVariety 1 1154.640 1154.640 762.15 <.001Treatment 7 5534.040 790.577 521.84 <.001Variety.Treatment 7 8106.237 1158.034 764.39 <.001Residual 45 68.174 1.515
Total 63 14891.774
Appendix 15: Beta-carotene content of tubers at harvest during the 2012 majorseasonAnalysis of VarianceSource of variation d.f. s.s. m.s. v.r. F pr.
Reps stratum 2 2.812E-03 1.406E-03 0.70
Reps.*Units* stratumVariety 1 6.118E+02 6.118E+02 3.063E+05 <.001Treatment 7 3.270E+02 4.671E+01 23386.90 <.001Variety.Treatment 7 3.138E+02 4.483E+01 22445.92 <.001Residual 30 5.992E-02 1.997E-03
Total 47 1.253E+03

286
Appendix 16: Beta-carotene content of tubers after 12 weeks in pit storage during the2011 minor seasonAnalysis of VarianceSource of variation d.f. s.s. m.s. v.r. F pr.
Reps stratum 3 26.3811 8.7937 9.16
Reps.*Units* stratumVariety 1 10126.6736 10126.6736 10549.01<.001Treatment 7 2499.1260 357.0180 371.91<.001Variety.Treatment 7 2408.5081 344.0726 358.42<.001Residual 45 43.1984 0.9600
Total 63 15103.8873
Appendix 17: Beta-carotene content of tubers after 12 weeks in pit storage during the2012 major seasonAnalysis of VarianceSource of variation d.f. s.s. m.s. v.r. F pr.
Reps stratum 2 6.050E-03 3.025E-03 2.47
Reps.*Units* stratumVariety 1 1.822E+03 1.822E+03 1.487E+06<.001Treatment 7 2.915E+02 4.164E+01 33990.65<.001Variety.Treatment 7 2.674E+02 3.820E+01 31180.85<.001Residual 30 3.675E-02 1.225E-03
Total 47 2.381E+03
Appendix 18: Percentage weight loss of tubers at 12 weeks in ash storage during the2011 minor seasonAnalysis of VarianceSource of variation d.f. s.s. m.s. v.r. F pr.
Reps stratum 3 17.105 5.702 2.33
Reps.*Units* stratumVariety 1 3445.203 3445.203 1408.32 <.001Treatment 7 1069.489 152.784 62.45 <.001Variety.Treatment 7 1335.142 190.735 77.97 <.001Residual 45 110.084 2.446
Total 63 5977.022

287
Appendix 19: Percentage weight loss of tubers at 12 weeks in grass storage during the2011 minor seasonAnalysis of Variance
Source of variation d.f. s.s. m.s. v.r. F pr.
Reps stratum 3 6.499 2.166 0.82
Reps.*Units* stratumVariety 1 3496.210 3496.210 1325.32 <.001Treatment 7 820.141 117.163 44.41 <.001Variety.Treatment 7 1135.930 162.276 61.51 <.001Residual 45 118.710 2.638
Total 63 5577.489
Appendix 20: Percentage weight loss of tubers at 12 weeks in pit storage during the2011 minor seasonAnalysis of VarianceSource of variation d.f. s.s. m.s. v.r. F pr.
Reps stratum 3 25.100 8.367 3.57
Reps.*Units* stratumVariety 1 62.182 62.182 26.53 <.001Treatment 7 3507.916 501.131 213.83 <.001Variety.Treatment 7 2235.074 319.296 136.25 <.001Residual 45 105.459 2.344
Total 63 5935.732

288
APPENDIX 21: Sensory Evaluation of Sweetpotato Tubers as Influenced by Chicken manure And Inorganic FertilizersPanelist Code………………
Age :……………………….(Years)
Sex :……………………….(Male/Female)
ATTRIBUTES RATINGSCALE
101 102 103 104 105 106 107 108 109 110 111 112 113 114 115 116
ColourAppearance of thetuber flesh as it isserved
1= very light2=slightly light3=moderate4=Slightlyintense5=Very intense
TasteThe flavor that isexperienced whenthe tuber is chewed
1=Very bad2=Slightly tasty3=Neither tastynor tasteless4=very tasty5=Extremelytasty
FlavourIs a combination oftaste while chewingand swallowingtuber
1= very light2=slightly light3=moderate4=Slightlyintense5=Very intense
ATTRIBUTES RATINGSCALE
101 102 103 104 105 106 107 108 109 110 111 112 113 114 115 116
TextureChew sample tuberwith little action.The impression of
1=Very tender2=Slightly tender3=Neither tendernor tough

289
texture is whethertuber breaks easilybetween theteeth(tenderness )ordifficult to bitethrough(Toughness)
4=Slightly tough5=Very tough
PalatabilityIs a combination oftaste and colourwhile chewing andswallowing the tuber
1=highlyunpalatable2=slightlyunpalatable3=neitherunpalatable norpalatable4=slightlypalatable5=highlypalatable
ATTRIBUTES RATINGSCALE
101 102 103 104 105 106 107 108 109 110 111 112 113 114 115 116
OverallAcceptability.Consumption oftuber with pleasure.General preferenceand choice of tuber
1=Highlyunacceptable2=Slightlyunacceptable3=Neitherunacceptable noracceptable4=Slightlyacceptable5=Highlyacceptable

290
APPENDIX 22
CALCULATIONS
Concentration OfPurified Carotenoid Standards
The concentration of the purified carotenoids standards were spectrophotometrically determined
based on their extinction coefficient (E1%) at a maximum wavelength of 450 nm. In the standard
1cm quartz cuvette, the E1% of the supplied standards are given below
Β-carotene = 2592
The concentrations of these carotenoids standards were calculated according to Beer-Lambert
Law.
Conc.(ng/µl) = , where
E1%
= Absorbance of the carotenoids
E1%= Extinction coefficient of the 1cm quartz cuvette.
The absorbance of the carotenoids standards were determined as shown below,
Β-carotene =0.750
Concentrations of Carotenoids in the Extracts of the Different Varieties of the
Sweetpotatoes.
The concentrations of the carotenoids in the extracts were calculated by comparing the
concentrations and areas under the peak of the standard carotenoids with the areas under the peak
of the carotenoids in the extract. The formular below was used to calculate the concentrations of
the carotenoids (Rodriguez- Amaya and Kimura, 2004).

291
AxχCs (ng/µl) , where
Ax = peak area of carotenoids (β-carotene)
Cs = Concentration of β-carotene standard
As = Peak area of the standard
Concentration (levels) of carotenoids in the White/ orange fleshed sweetpotato.
Concentration of β-carotene in the sweetpotato extracted at room temperature (OF1)
The following parameters were used to calculate the concentration of β-carotene in the
sweetpotato:
Example;
Sample weight = 0.600 g
Volume of cold acetate = 20 mls
Volume of petroleum spirit = 20mls
Total (final) volume of extract = 25mls
Volume of extract evaporated = 2mls
Volume of reconstitution = 800 µ
Area of β-carotene standards peak:
First area = 175562
Second area = 20093
Area of β-carotene peak in the extract = 204888

292
Concentration of β- carotene in the orange-fleshed sweetpotato heated 50oC (OF3)
The following concentration of β- carotene in the sweetpotato was calculated based on the
following:
Sample weight = 0.9340g
Volume of cold acetate = 25mls
Volume of petroleum spirit = 20mls
Total volume of extract = 20mls
Volume of extract evaporation = 2mls
Volume of reconstitution = 600µ/s
Concentration of β-carotene standard = 57.870ng/20µl
Area of β-carotene standards peaks
First area = 175562
Second area = 20093
Peak area of β-carotene in the extract = 592890


