Yes Bank Transformation series 2017 Submission (First Round)
7
CASE SOLUTION EMPOWERING SMART CITIES FOR ECONOMIC, ENVIRONMENTAL AND SOCIAL SUSTAINABILITY - A case study by Microsoft Waste Management in Smart Cities TEAM – RADIOACTIVE, IIM ROHTAK
-
Upload
anupreet-choudhary -
Category
Business
-
view
36 -
download
2
Transcript of Yes Bank Transformation series 2017 Submission (First Round)
CASE SOLUTION
EMPOWERING SMART CITIES FOR ECONOMIC,
ENVIRONMENTAL AND SOCIAL SUSTAINABILITY
- A case study by Microsoft
Waste Management in
Smart Cities
TEAM – RADIOACTIVE, IIM ROHTAK
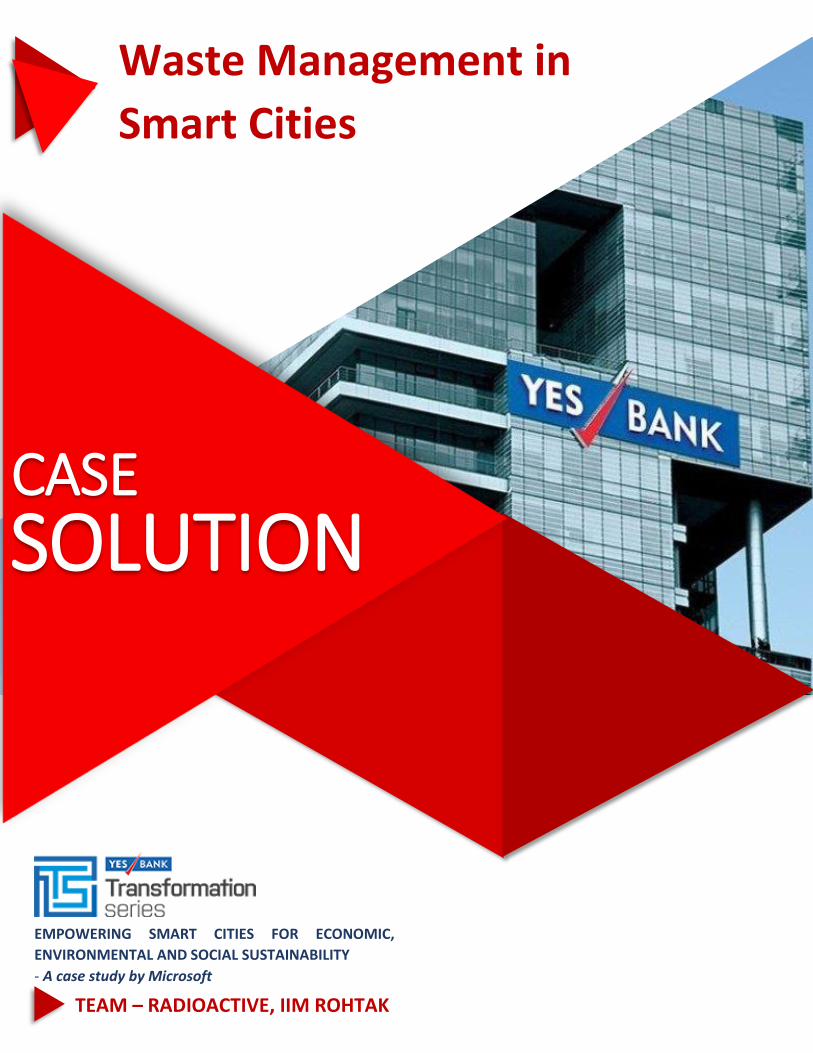
ne of the major
problem that we
are facing today is
related to solid
waste management in major
cities. Current systems in
India can’t cope up with the
waste generated by the
rapidly growing
population. Waste
generation depends on
factors like population
density, economic status,
level of commercial activity,
culture and the city. Various
statistics shows how crucial
this problem of waste
generation is. For example:
India generates 133760 tons
of solid waste per day but
only 25884 tons per day is treated, because of poor waste management infrastructure.
o
Waste Management
in India
0
0.5
1
1.5
2
2.5
0
200
400
600
800
1000
1200
1400
1911 1921 1931 1941 1951 1961 1971 1981 1991 2001 2011
Exp
on
enti
al G
row
th R
ate
(An
nu
al, %
)
Po
pu
lati
on
(in
mill
ion
s)
Exhibit 1: Population Growth in India between 1911 to 2011 Source: Provisional Population Totals-India, 2011
Population Annual Exponential Growth Rate (%)
0.36
0.54
0.44
0.52
0.26
0.41
0.35
Exhibit 2: Per Capita Waste Generation Data (in Kg/Capita/Day) Source: Census of India 2011, CPCB Report 2011
Ahmedabad Hyderabad Bangalore Chennai
Kolkata Delhi Mumbai
“Mega City is a
Recent
Phenomenon. With
globalization of the
economy, many
people have
migrated to the
cities”
1
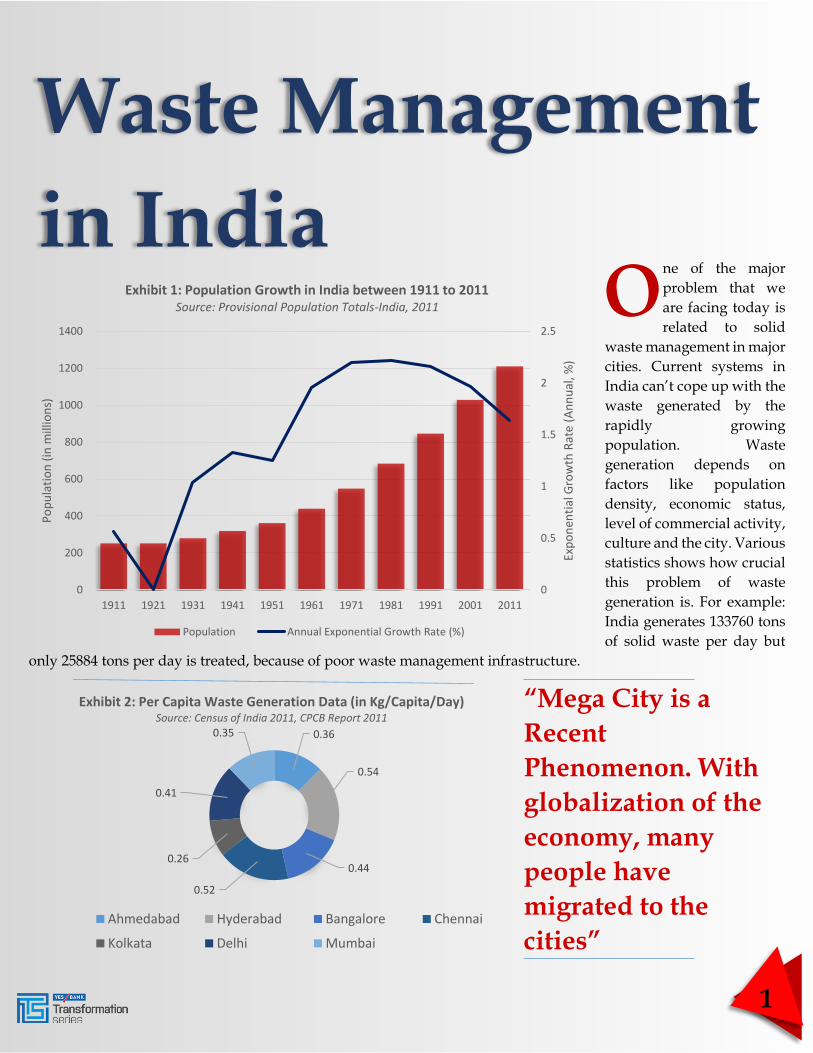
0 - 3841
3842-7682
7682-11522
11523-15363
15364-19604
SW generation (MT per day)
41%
40%
6%
4%
2%
2%4% 1%
Exhibit 4: Average (% by weight) composition of solid waste in Indian metro cities
Source: Shaarholy et.al (doi:10.1016/j.wasman.2007.02.008)
compostable inert paper plastic glass metals textile leather
Exhibit 3: State-level statistics of MSW generation
in India (2009–2012). Source: Central Pollution Control
Board, Govt. of India, 2012.Process
“UP, Maharashtra,
WB and
Tamilnadu are the
most affected
States”
“95% of the
compostable
waste is in the
wet form”
2
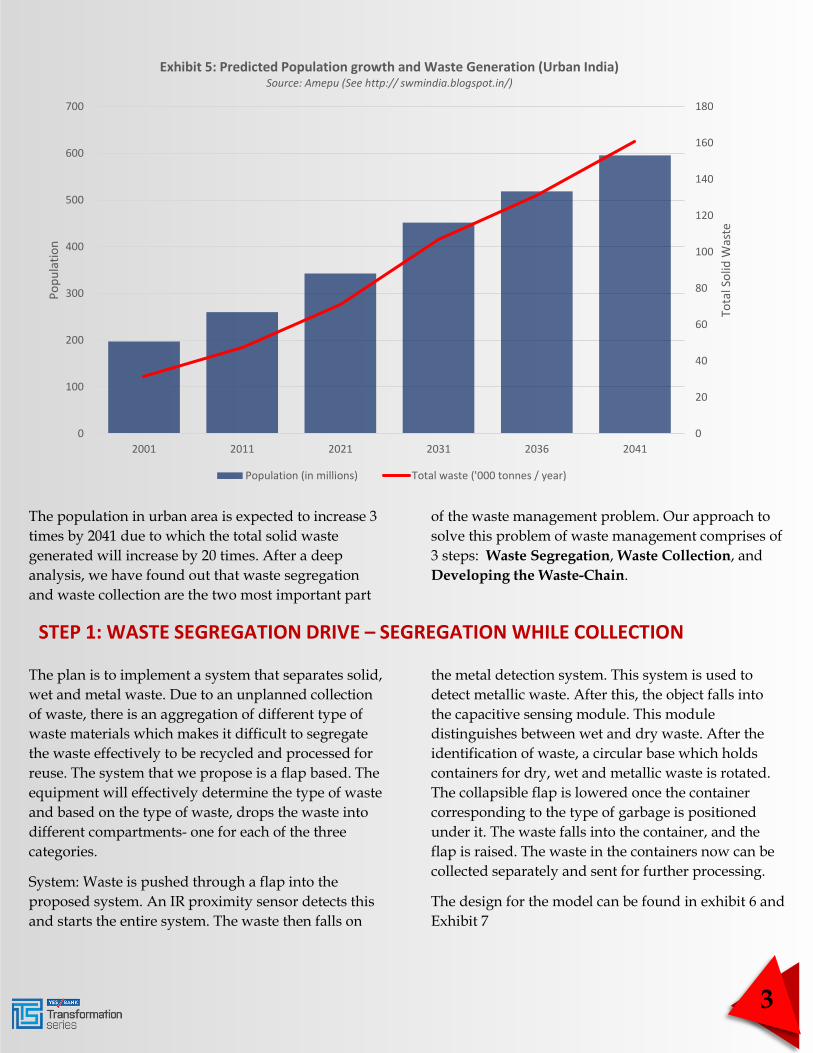
The population in urban area is expected to increase 3
times by 2041 due to which the total solid waste
generated will increase by 20 times. After a deep
analysis, we have found out that waste segregation
and waste collection are the two most important part
of the waste management problem. Our approach to
solve this problem of waste management comprises of
3 steps: Waste Segregation, Waste Collection, and
Developing the Waste-Chain.
The plan is to implement a system that separates solid,
wet and metal waste. Due to an unplanned collection
of waste, there is an aggregation of different type of
waste materials which makes it difficult to segregate
the waste effectively to be recycled and processed for
reuse. The system that we propose is a flap based. The
equipment will effectively determine the type of waste
and based on the type of waste, drops the waste into
different compartments- one for each of the three
categories.
System: Waste is pushed through a flap into the
proposed system. An IR proximity sensor detects this
and starts the entire system. The waste then falls on
the metal detection system. This system is used to
detect metallic waste. After this, the object falls into
the capacitive sensing module. This module
distinguishes between wet and dry waste. After the
identification of waste, a circular base which holds
containers for dry, wet and metallic waste is rotated.
The collapsible flap is lowered once the container
corresponding to the type of garbage is positioned
under it. The waste falls into the container, and the
flap is raised. The waste in the containers now can be
collected separately and sent for further processing.
The design for the model can be found in exhibit 6 and
Exhibit 7
0
20
40
60
80
100
120
140
160
180
0
100
200
300
400
500
600
700
2001 2011 2021 2031 2036 2041
Tota
l So
lid W
aste
Po
pu
lati
on
Exhibit 5: Predicted Population growth and Waste Generation (Urban India) Source: Amepu (See http:// swmindia.blogspot.in/)
Population (in millions) Total waste ('000 tonnes / year)
STEP 1: WASTE SEGREGATION DRIVE – SEGREGATION WHILE COLLECTION
3
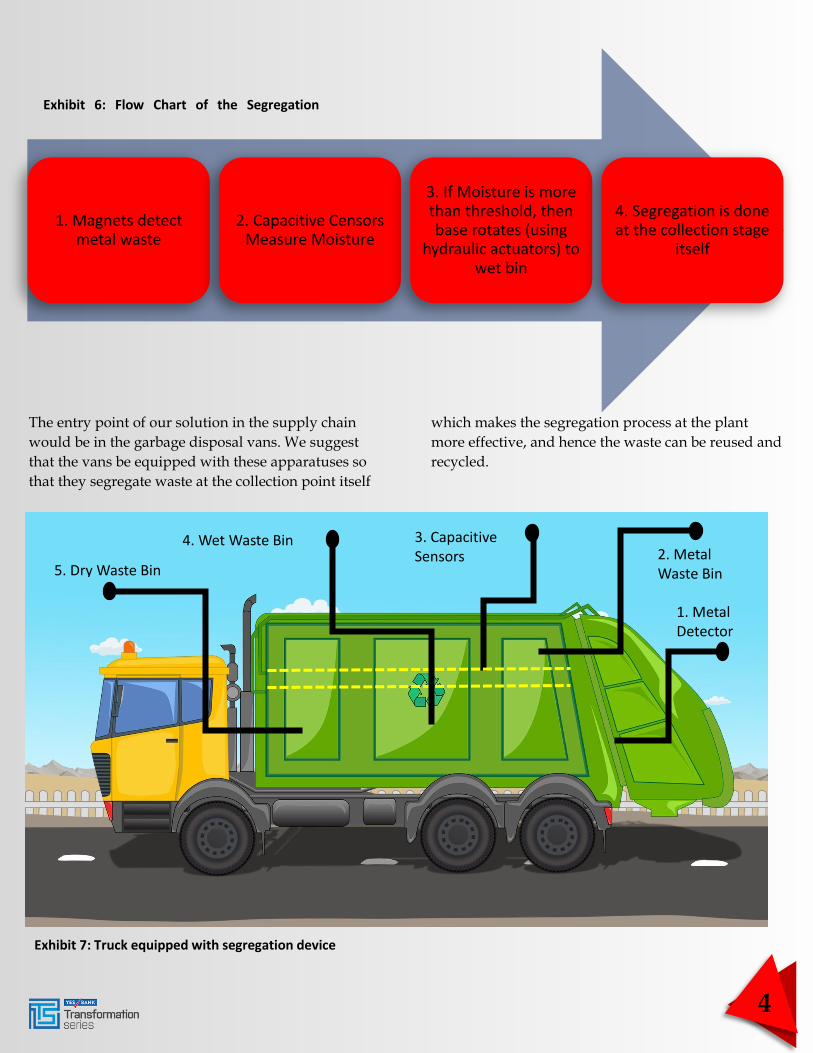
The entry point of our solution in the supply chain
would be in the garbage disposal vans. We suggest
that the vans be equipped with these apparatuses so
that they segregate waste at the collection point itself
which makes the segregation process at the plant
more effective, and hence the waste can be reused and
recycled.
1. Metal Detector
2. Metal Waste Bin
3. Capacitive Sensors
4. Wet Waste Bin
5. Dry Waste Bin
1. Magnets detect metal waste
2. Capacitive Censors Measure Moisture
3. If Moisture is more than threshold, then base rotates (using
hydraulic actuators) to wet bin
4. Segregation is done at the collection stage
itself
Exhibit 6: Flow Chart of the Segregation
Process
Exhibit 7: Truck equipped with segregation device
4
The basic problem here is that the officials collecting
the waste from the bins collect either too slow or too
fast. They sometimes collect the waste from the bin
either when the bin is almost empty or when waste is
overflowing on to the road.
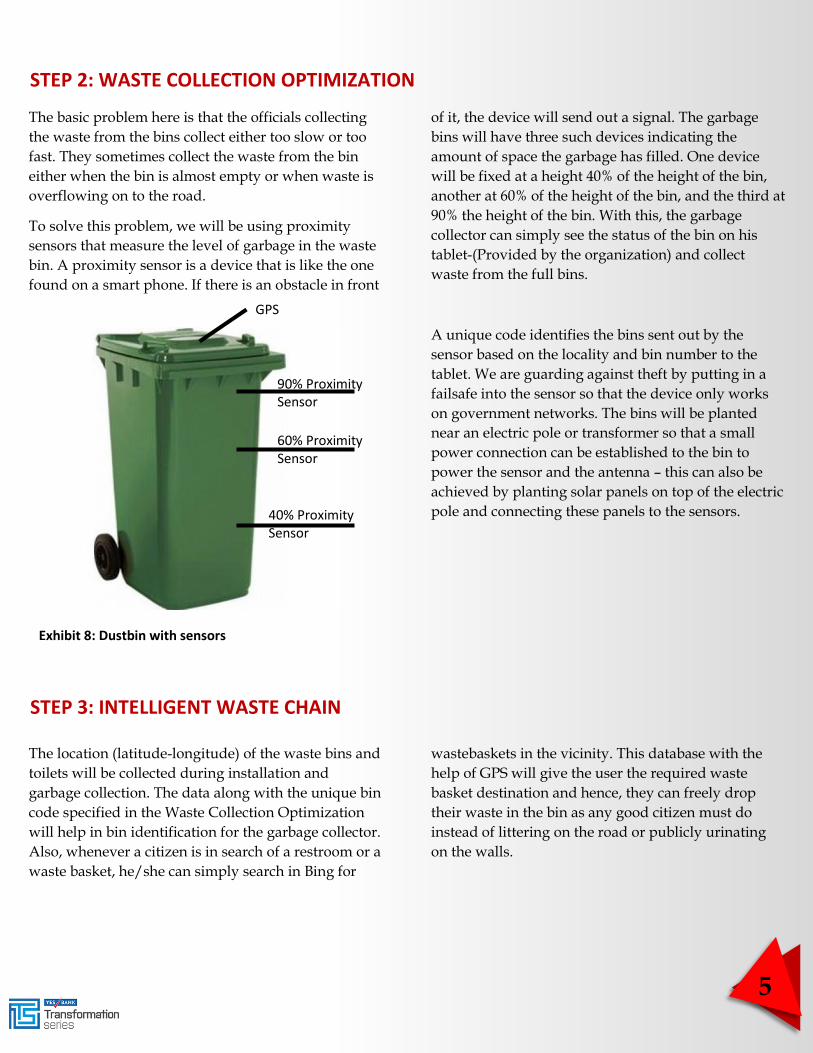
To solve this problem, we will be using proximity
sensors that measure the level of garbage in the waste
bin. A proximity sensor is a device that is like the one
found on a smart phone. If there is an obstacle in front
of it, the device will send out a signal. The garbage
bins will have three such devices indicating the
amount of space the garbage has filled. One device
will be fixed at a height 40% of the height of the bin,
another at 60% of the height of the bin, and the third at
90% the height of the bin. With this, the garbage
collector can simply see the status of the bin on his
tablet-(Provided by the organization) and collect
waste from the full bins.
A unique code identifies the bins sent out by the
sensor based on the locality and bin number to the
tablet. We are guarding against theft by putting in a
failsafe into the sensor so that the device only works
on government networks. The bins will be planted
near an electric pole or transformer so that a small
power connection can be established to the bin to
power the sensor and the antenna – this can also be
achieved by planting solar panels on top of the electric
pole and connecting these panels to the sensors.
The location (latitude-longitude) of the waste bins and
toilets will be collected during installation and
garbage collection. The data along with the unique bin
code specified in the Waste Collection Optimization
will help in bin identification for the garbage collector.
Also, whenever a citizen is in search of a restroom or a
waste basket, he/she can simply search in Bing for
wastebaskets in the vicinity. This database with the
help of GPS will give the user the required waste
basket destination and hence, they can freely drop
their waste in the bin as any good citizen must do
instead of littering on the road or publicly urinating
on the walls.
STEP 2: WASTE COLLECTION OPTIMIZATION
90% Proximity Sensor
60% Proximity Sensor
40% Proximity Sensor
GPS
Exhibit 8: Dustbin with sensors
STEP 3: INTELLIGENT WASTE CHAIN
5
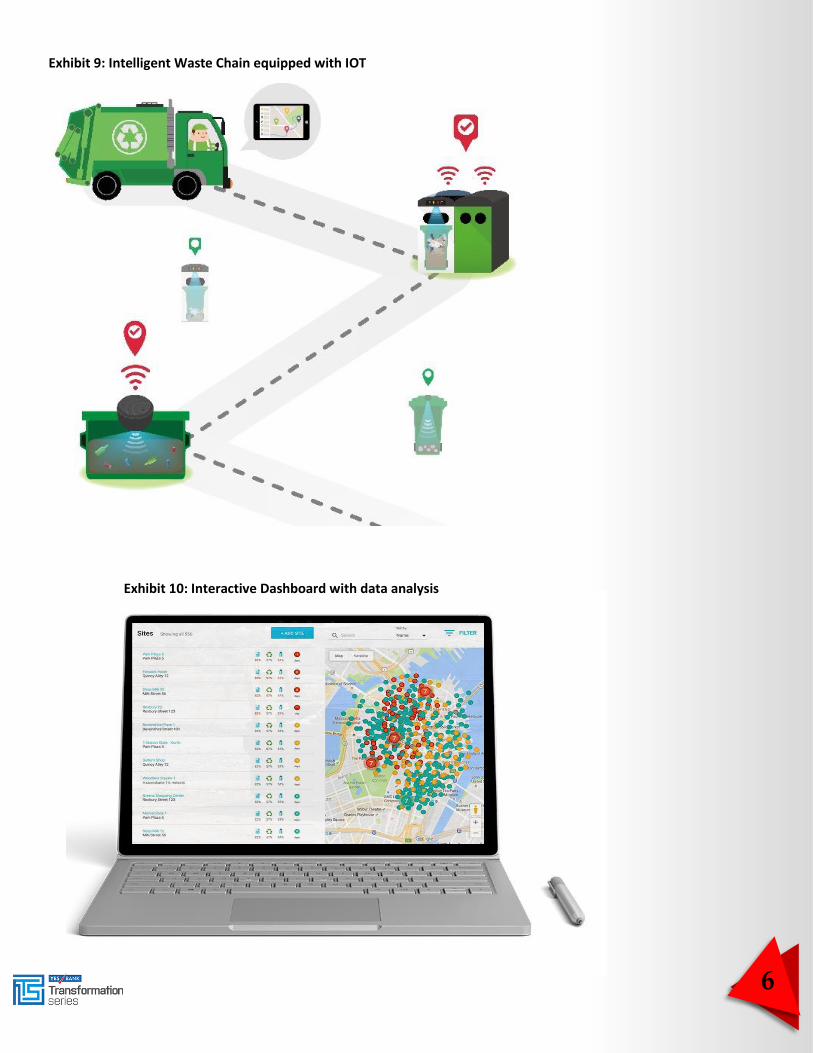
Exhibit 9: Intelligent Waste Chain equipped with IOT
Exhibit 10: Interactive Dashboard with data analysis
6