Yemeni-German Cooperation in the Water & Sanitation Sector Gerhard Redecker KfW-Office Sana’a May...
33
Yemeni-German Cooperation in the Water & Sanitation Sector Gerhard Redecker KfW-Office Sana’a May 2005 Urban Water and Poverty
-
Upload
evangeline-riley -
Category
Documents
-
view
214 -
download
0
Transcript of Yemeni-German Cooperation in the Water & Sanitation Sector Gerhard Redecker KfW-Office Sana’a May...

Yemeni-German Cooperation in the Water & Sanitation Sector
Gerhard RedeckerKfW-Office Sana’a
May 2005
Urban Water and Poverty
Yemeni-German Cooperation in the Water & Sanitation Sector
Yemen’s water cycleWater and PRSPWater supply and healthUrban water demandPoverty Baseline data for 8 townsWater supply patternWater expenditureWater tariff structurePro-poor technology choicesWater sector benchmarksNWSSIP & MDG finance needsGerman FC sector commitmentsOpen questions and concerns

3
...for People
...for Food
...for Nature
...for other Use
Domestic Urban
Domestic Rural
Schools Mosques
Govern-ment
Othertrade
Industry
Agro-industry
IrrigationAgricult.
RainfedAgricult.
Ground-water
Fauna &Flora
WATER
Climate
MDG 1 / Target 1: Halve, between 1990 and 2015, the proportion of people whose income is less than 1 dollar per
day
MDG 1 / Target 2: Halve, between 1990
and 2015, the proportion of people
who suffer from hunger
MDG 2 / Target 3: Ensure that by 2015, children
everywhere, boys and girls alike, will be able to complete a full course of primary schooling
MDG 7 / Target 9: Integrate the principles of
sustainable development into country policies and programs
and reverse the loss of environmental resources
MDG4 / Target 5: Reduce by two-thirds,
between 1990 and 2015, the under-five mortality rate
MDG 7 / Target 10: Halve, by 2015, the
proportion of people without sustainable access to safe
drinking water
MDG 7 / Target 11: By 2020, have achieved a
significant improvement in the lives of at least 100 million
slum dwellers / Indicator 31: urban population with access
to improved sanitation
Urban Water and Poverty Water use and MDG relevance

4
Urban Water and Poverty Yemen‘s water cycle
14.2 mn people living in RURAL
(partly dispersed) settlements
About 1000 larger dams with 80 mn
cbm storage capacity
Springs, shallow wells and seasonal
surface water source
Domestic rainwater harvesting
Average annual rainfall 50-60 mn cbm
Western aquifers storage 35 bn cbm depleting at 1.3 bn
cbm pa
5.5 mn people living in URBAN areas / towns / cities
Manufac-turing industry
Rainfed agriculture about
400.000 has
Irrigated agri-culture about
400.000 has(50% = QAT)
Public sewerage treatment
plants
Business & service facilities
Liquid industrial
waste
Untreated or pre-treated sewerage
Untreated or pre-treated sewerage
Percentage rainwater use
??
Max. 10% spate irriga-
tion
1-2% of total GW use
1-2% of total GW use
3-4% of total GW use
3-4% of total GW use
3 bn cbm total ground-
water use
YARD
AquiferInfiltration
AquiferInfiltration
AquiferInfiltration
2% of total supply
AquiferInfiltration
AquiferInfiltration
Irrigation efficiency 35% only
Evapo-ration
Evapo-ration
Evapo-ration
Evapo-ration
Direct run-off to wadis at least xx %
of rainfallAquifer
Infiltration
Evapo-ration
Evapo-ration
Effluent for unrestricted
useAquifer
Infiltration
Potential 1-2% of irriga-
tion water
Evapo-ration
Cesspits, soak away, small sewe-rage networks, no
treatmentAquifer
Infiltration
AquiferInfiltration
60% of total supply
Peri-urban areas; 53 %
of supply
25% of total supply
2% of total supply
75% of sewerage
25% of coverage
Own treatment facilitiesAquifer
Infiltration
Evapo-ration
90% of total ground-water
use
20% sew. coverage
47% WS coverage
50-70% of supplied water goes to
sewerage
Total urban water demand 150 mn
cbm pa
3% of total supply
Urban:Population in towns, centers, cities with +10.000 inhabitants, plus capitals of governorates with less than 10.000 inhabitantsRural:Settlement clusters of 15.000 inhabitants or less

5
Urban Water and Poverty Water and poverty in the PRSP
…efficient and equitable water resources management is critical to poverty reduction…
Urban water and sanitation scarcity of water resources low service coverage water pollution
Agriculture / Irrigation water resource capture unsustainable water mining practices anti-poor water rights pattern exacerbate inequalities agricultural water use key to reduce poverty
… poor water management creates poverty… (World Bank CWRAS, Jan 2005)
Environment environmental degradation (erosion) drives poverty water pollution affects the poor more climate change affects the poor more, since they much depend on rainfed agriculture environmental health problems affect the poor most
… all these “externalities” are hidden costs imposed by the better off on the poor…
Note: The first PRS progress report for 2003 makes little or no reference to respective achievements

6
Urban Water and Poverty Recommendation for better poverty focus

7
Urban Water and Poverty Expected development of urban demand
0
5
10
15
20
25
30
35
Yr 1986 Yr 2000 Yr 2002 Yr 2004 Yr 2009 Yr 2015
Total Population (million) Urban Population (million)
National Annual Growth Rate (%pa) Urban Annual Groth Rate (%pa)
Urban Population Share (%)
In 2015 and reaching MDGs, urban demand will have risen by 50% as compared to 2005

8
Urban Water and Poverty Water demand and supply pattern (NWSSIP)
Water Demand & Supply Pattern
0
20
40
60
80
100
120
Target Urban l/c/d Realistic Urban l/c/d Target Rural l/c/d Realistic Rural l/c/d
Big Cities Central Montainous Zone Coastal Zone Other Areas (dispersed)
Minimum health impact
threshold

9
Urban Water and Poverty Water demand and health impact
Independently from reliability of water supply service, the average quantity of fetched water declines with walking time and distance.
Non-critical for all household needs (drinking, cooking, bathing, washing) is only a distance to source of up to 100 mts.
At a distance beyond 1000 mts, the basic water needs (7.5 l/c/d at average temperature and low physival activity) are apparently no longer attended sufficiently.
l/c/d % 90 90
80 80
70 70
60 60
50 50
40 40
30 30
20 20
10 10
5 10 15 20 25 30 >30 minutes walking to/from source
0 200 400 600 800 1000 >1000 mts walking distance
Source: WHO/SDE/WSH/03.02, WHO Geneve 2003
Ø water fetched
l/c/d
Level of health concern (%) low -
high
Coverage of basic hygiene
needs (%)
Coverage of drinking water
needs (%)
No
n-c
riti
cal i
n a
ll as
pec
ts
A household water supply of 20 l/c/d is generally considered as a threshold for obtaining measurable health impacts.
10
Average HH Income/Month
0
10,000
20,000
30,000
40,000
50,000
60,000
70,000A
l Sha
her
2002
Ja'a
r/Z
injib
ar20
02
Jibl
ah 2
002
Ibb
2004
Am
ran
2004
Sa'
ada
2004
Zab
id 2
004
YE
R
Total Ø Q1Ø Q5 Ø Food Poverty Line
Urban Water and Poverty Household income and food poverty
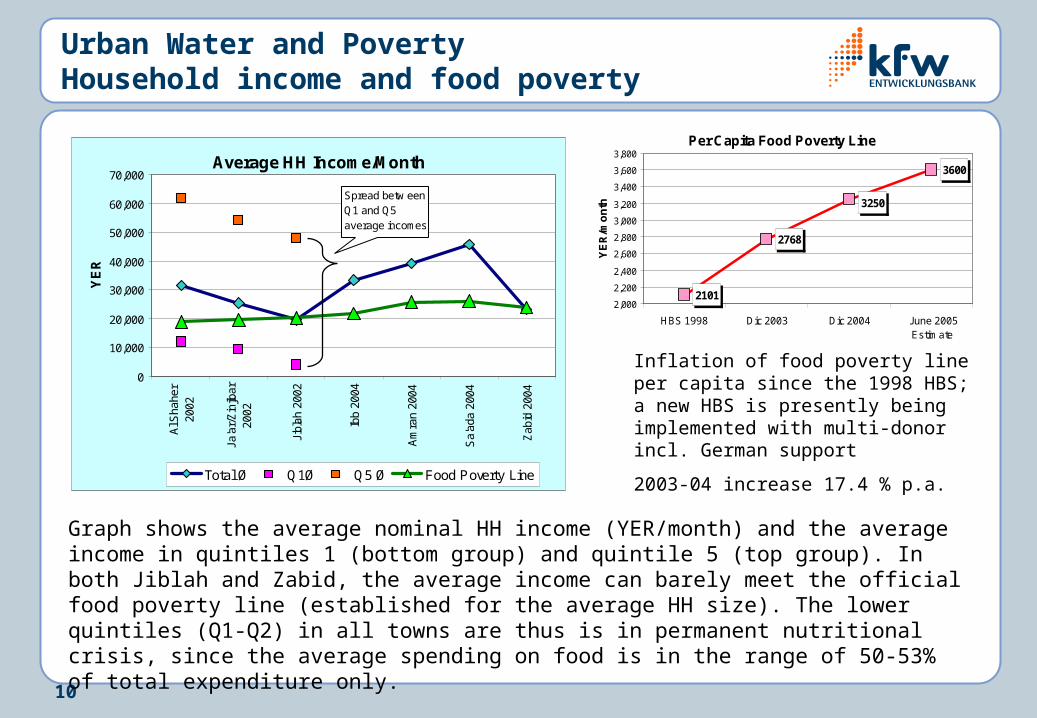
Graph shows the average nominal HH income (YER/month) and the average income in quintiles 1 (bottom group) and quintile 5 (top group). In both Jiblah and Zabid, the average income can barely meet the official food poverty line (established for the average HH size). The lower quintiles (Q1-Q2) in all towns are thus is in permanent nutritional crisis, since the average spending on food is in the range of 50-53% of total expenditure only.
Per Capita Food Poverty Line
2101
2768
3600
3250
2,000
2,200
2,400
2,600
2,800
3,000
3,200
3,400
3,600
3,800
HBS 1998 Dic 2003 Dic 2004 June 2005Estimate
YE
R/m
on
th
Spread betw een Q1 and Q5 average incomes
Inflation of food poverty line per capita since the 1998 HBS; a new HBS is presently being implemented with multi-donor incl. German support
2003-04 increase 17.4 % p.a.
11
Urban Water and Poverty Poverty index & household expenditure pattern
Poverty Index Selected Towns
0% 20% 40% 60% 80% 100%
Al Shaher 2002
Ja'ar/Zinjibar 2002
Jiblah 2002
Ibb 2004
Amran 2004
Sa'ada 2004
Zabid 2004
Food (extreme) poverty Absolute poverty Non-poor
Household Expenditure Pattern
0% 20% 40% 60% 80% 100%
Al Shaher 2002
Ja'ar/Zinjibar 2002
Jiblah 2002
Ibb 2004
Amran 2004
Sa'ada 2004
Zabid 2004
Food+Beverages Water+Sanitation
Taobacco+Qat Other Expenses
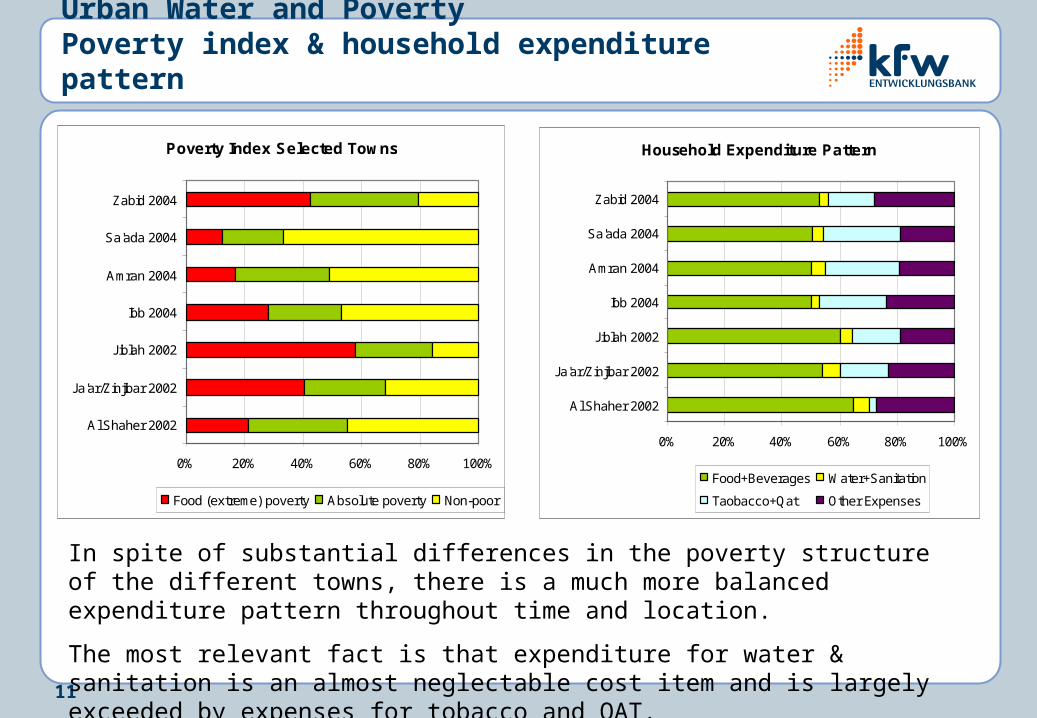
In spite of substantial differences in the poverty structure of the different towns, there is a much more balanced expenditure pattern throughout time and location.
The most relevant fact is that expenditure for water & sanitation is an almost neglectable cost item and is largely exceeded by expenses for tobacco and QAT.
12
Urban Water and Poverty Household water supply sources
Sources of Water Supply
0% 20% 40% 60% 80% 100%
Al Shaher 2002
Ja'ar/Zinjibar 2002
Jiblah 2002
Ibb 2004
Amran 2004
Sa'ada 2004
Zabid 2004
Average w ater other sources cbm/HH/mo
Average w ater from netw orks cbm/HH/mo
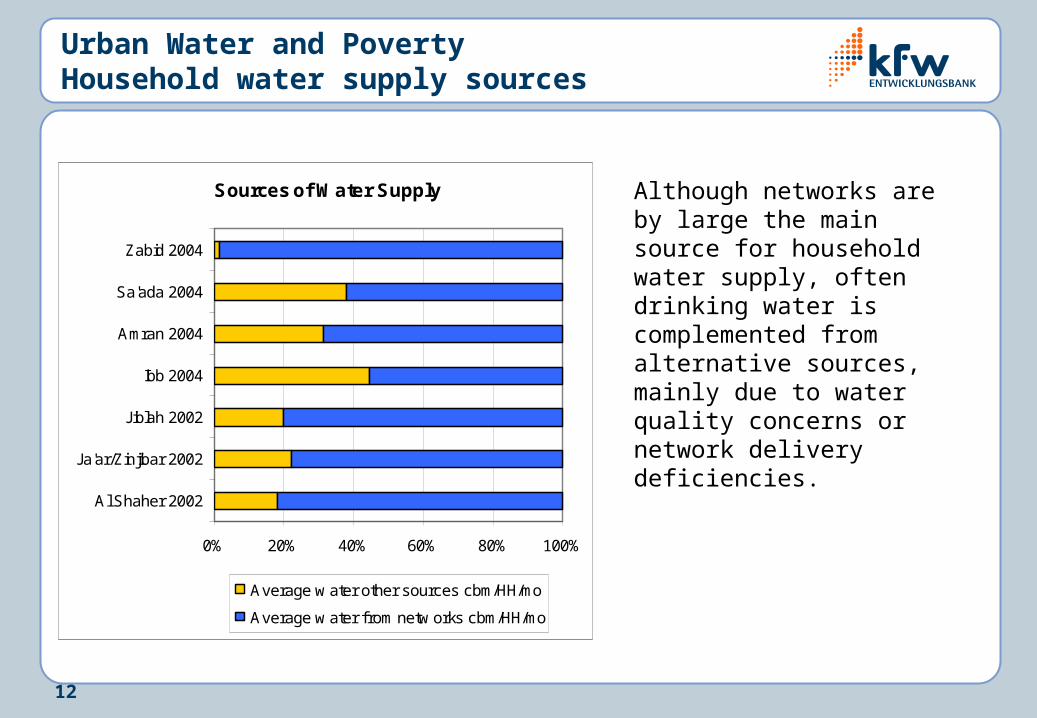
Although networks are by large the main source for household water supply, often drinking water is complemented from alternative sources, mainly due to water quality concerns or network delivery deficiencies.

13
Urban Water and Poverty Relation of network coverage and water use
Network Coverage & Sources of Drinking Water (%)
0 20 40 60 80 100
Sa'ada
Ibb
Amran
Zabid
Coverage of water network Network Trucks Bottled
In both Zabid and Ibb, high network coverage coincides with its use as main source for drinking water. This may be due to high poverty rates which leave little room for alternative and more expensive sources such as water trucks and bottled water.
Water networks are thus a pro-poor investment.
The high usage of alternative sources in Amran and Sa’ada may relate to higher average incomes, but also points at low network performance / water availability.

14
Urban Water and Poverty Income quintiles and water expenditure 2002
JIBLAH - Income Quintiles and Water Expenditure
0 5 10 15 20 25
Quintile 1
Quintile 2
Quintile 3
Quintile 4
Quintile 5
%
Water Cost related toIncome
Water Cost related toExpenditure
% of HH in IncomeQuintiles
In spite of being the poorest town of the sample and representing a higher percen-tage in the lower income quintiles, the household water cost does not show a sub-stantial deviation between the different income quintiles. In other words, the higher overall poverty of the town has not inflicted a higher water expenditure on the poor.

15
Urban Water and Poverty Income quintiles and water expenditure 2002
AL SHAHER - Income Quintiles and Water Expenditure
0 5 10 15 20 25
Quintile 1
Quintile 2
Quintile 3
Quintile 4
Quintile 5
%
Water Cost related toIncome
Water Cost related toExpenditure
% of HH in IncomeQuintiles
The household water cost does not show a substantial deviation between the dif-ferent income quintiles, the lowest quintiles have only a slightly higher expenditure. In other words, poorer population groups have similar expenditure share for water than the non-poor groups, related to their overall expenditure or income.
16
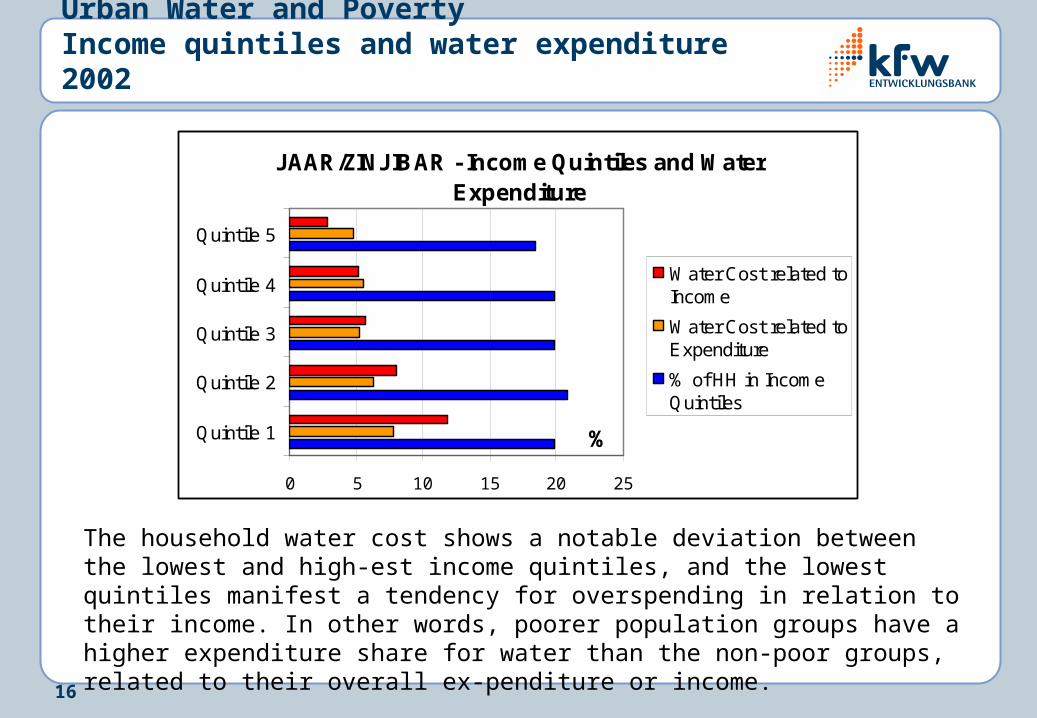
Urban Water and Poverty Income quintiles and water expenditure 2002
JAAR/ZINJIBAR - Income Quintiles and Water Expenditure
0 5 10 15 20 25
Quintile 1
Quintile 2
Quintile 3
Quintile 4
Quintile 5
%
Water Cost related toIncome
Water Cost related toExpenditure
% of HH in IncomeQuintiles
The household water cost shows a notable deviation between the lowest and high-est income quintiles, and the lowest quintiles manifest a tendency for overspending in relation to their income. In other words, poorer population groups have a higher expenditure share for water than the non-poor groups, related to their overall ex-penditure or income.

17
Urban Water and Poverty Real cost of water and the Yemeni scenario
Source: Global Water Partnership TAC Background Paper No. 2 (Water as a Social and Economic Good) / own elaboration
O&M Cost
Capital Charges
Opportunity Cost
Economic Externalities
Environmental Externalities
FullSupplyCost
Full EconomicCost
Full Cost
Su
sta
ina
ble
Val
ue
in
Us
e o
f R
eso
urc
e
General Principles for Cost of Water
Operat'l.Bench-
mark
NWSSIPBench-
mark
Urban Subsec-tor Goal
Not specified
or calulated
The Yemen Reality of Urban Water
Coincides with BMZ Sector Concept

18
Urban Water and Poverty Cost of household water supply alternatives
Cost of Water by Sources (YER/cbm)
0
500
1,000
1,500
2,000
2,500
3,000
3,500
Network Truck Bottled
Al Shaher
Ja'ar/Zinjibar
Jiblah
Filtered/bottled water is only purchased for drinking / some cooking purposes. Low quality network and truck water requires additional expenses for purification or boiling. The single most relevant poverty impact is thus achieved by extending networks to unserved areas.

19
Urban Water and Poverty Cross-subsidized “lifeline“ tariffs
► Low end tariffs (<= 5 cbm) range from 20 to 120 YR per cbm
► High end tariffs (5-10 cbm) range from 20 to 150 YR per cbm
► Many utilities face substantial real value loss of revenue from tariffs due to accumu-lated inflation. In one case, its value is only 40% compared to date of introduction 1)
1) For simplicity, a 1% monthly YER inflation is assumed
Range of Prevailing Water Tariffs for "Lifeline" Consumption and its Discounted Value
0
20
40
60
80
100
120
140
160
Ad
en
Ho
de
ida
h
Sa
you
n
Mu
kalla Ibb
Da
ma
r
Ra
'ad
a
Al S
ha
he
r
Ja'a
r/Z
injib
ar
Ya
rim
Am
ran
Ba
jil
Za
bid
Ba
it a
l Fa
qih
Mo
kha
Ma
nso
uri
a
Sa
'ad
a
Ha
jja
Ma
hw
ee
t
Utilities
YER per cbm% Value
> 0 - 5 m3/mth
> 5 - 10 m3/mth
% Real Value
Avg. cost for billed
water IBB

20
Urban Water and Poverty Client base structure of selected utilities
Structure of Client Base - Selected Utilities
0% 20% 40% 60% 80% 100%
Mahweet
Dhamar
Bajil
Bait al F.
Mansuria
Zabid
Mokha
Hajja
Amran
Sa'ada
Yarim
Ibb
Dom 0-5 cbm Dom >5-10 cbm Dom >10-20 cbm
Dom >20 cbm Govt./Schools Comm./Other
All domestic clients of the selected utilities are making use of the “lifeline” tariffs of the first two brackets.
Due to the block tariff system design, considerable savings are made by he large consumers.
The large users benefit from all “subsidized” tariff brackets. The poverty targeting of the cross-subsidy scheme could be substantially improved.

21
Urban Water and Poverty Consumption structure of selected utilities
As can be expected, the actual water consumption of the “lifeline” tariff clients is much lower than their representation in the client structure, the average at some 37% of all water sales.
The consumption of govern-mental and commercial facilities is generally low.
It appears that the cross-subsidizing potential lies mostly within the domestic users consuming > 10 cbm/month.
Consumption Structure - Selected Utilities
0% 20% 40% 60% 80% 100%
Mahw eet
Dhamar
Bajil
Bait al F.
Mansuria
Zabid
Mokha
Hajja
Amran
Sa'ada
Yarim
Ibb
Dom 0-5 cbm Dom >5-10 cbm Dom >10 cbm
Govt./Schools Comm./Other

22
Urban Water and Poverty Water tariffs and targeting pro-poor cross-subsidy
YARIM - Domestic Water Tariffs, Client Base & Consumption
0
20
40
60
80
100
120
140
160
180
0-5 5-10 10-20 20-30 >30
cbm/month
YE
R/c
bm
0
5
10
15
20
25
30
35
Per
cen
t
Tariff YER/cbm Client Base % Consumption %
In IBB for example, out of each 1000 clients, 580 benefit unnecessarily from lifeline consumption subsidy (< 10 cbm/month): 330 are in the 10-20 cbm range, and 200 in the >20 cbm range. The large consumers benefit throughout various tariff ranges. Clients consuming up to 30 cbm/month are actually saving about 43% on their water bills, consumers of up to 20 cbm/month still about 41%, compared to paying max. tariffs for total consumption. Splitting the first 10 cbm into 2 tariff groups and eliminating the subsidy portions for large consu-mers would substantially increase revenue without affecting the poor.
IBB - Domestic Water Tariffs, Client Base & Consumption
0
20
40
60
80
100
120
140
160
180
0-5 5-10 10-15 15-20 20-30 >30
cbm/month
YE
R/c
bm
0
2
4
6
8
10
12
14
16
18
Per
cen
t
Tariff YER/cbm Client Base % Consumption %
23
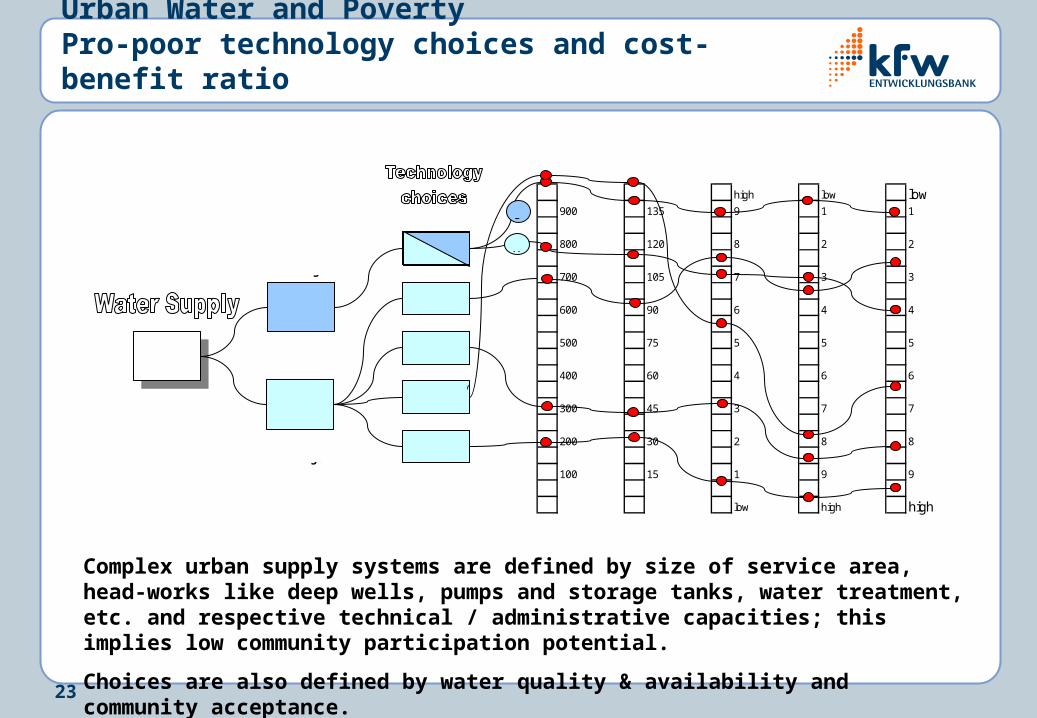
Urban Water and Poverty Pro-poor technology choices and cost-benefit ratio
high low low 900 135 9 1 1
800 120 8 2 2
700 105 7 3 3
600 90 6 4 4
500 75 5 5 5
400 60 4 6 6
300 45 3 7 7
200 30 2 8 8
100 15 1 9 9
low high high
MDG targets2015
Urban Areas
Rural Areas
House connection
Borehole w/ hand pump
RW harvest / cistern
Standpost
Hand dug well / prot.
Cost per Person
Cost per Unit
Cost-benefit scale
75% coverage
62% coverage
R
U
O&M Com-plexity
Cmty. Part. Potential
Complex urban supply systems are defined by size of service area, head-works like deep wells, pumps and storage tanks, water treatment, etc. and respective technical / administrative capacities; this implies low community participation potential.
Choices are also defined by water quality & availability and community acceptance.

24
Urban Water and Poverty Pro-poor technology choices and cost-benefit ratio
low low high1 1 9 225 1350
2 2 8 200 1200
3 3 7 175 1050
4 4 6 150 900
5 5 5 125 750
6 6 4 100 600
7 7 3 75 450
8 8 2 50 300
9 9 1 25 150
high high low
MDG targets2015
Convent'lsewerage
Simplified sewerage
WC with soak away
External latrines
VIP latrines
Urban Areas
Rural Areas
U
R
Cost per Unit
Cost per Person
O&M Com-plexity
62.5% coverage
58.5% coverage
Cost-benefit scale
Cmty. Part. Potential
Unit cost and O&M complexity of urban systems are largely defined by size of service area, topography (pumping), treatment plants and respective technical / administrative capacities; this implies low community participation potential.
Choices are also defined by environmental aspects and community acceptance.
25
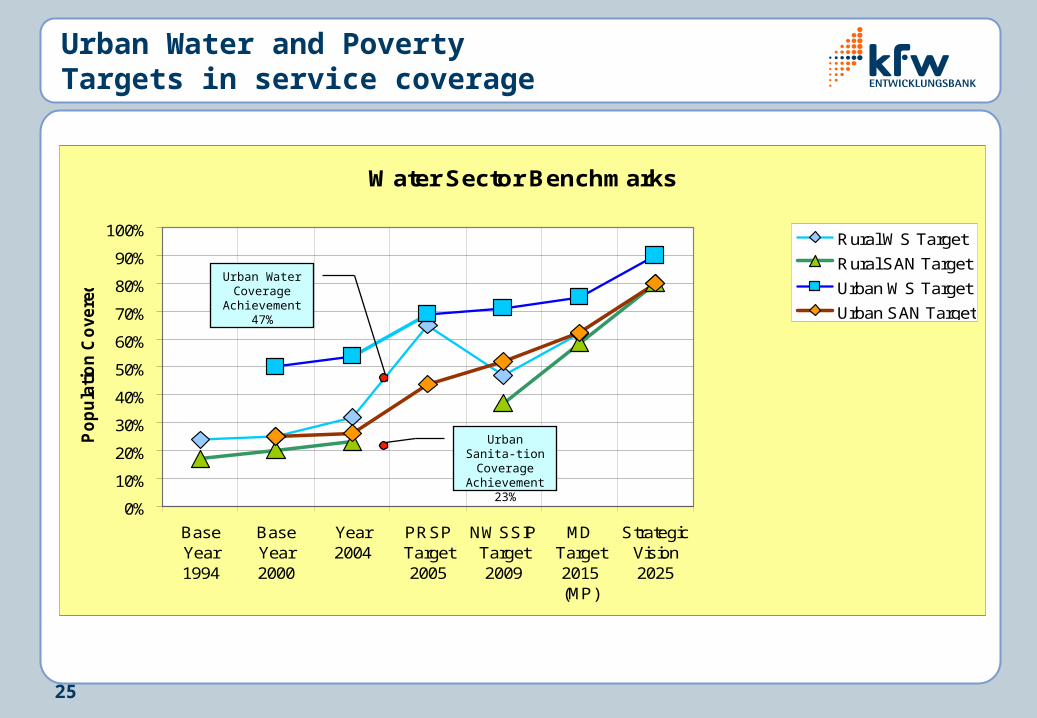
Urban Water and Poverty Targets in service coverage
Water Sector Benchmarks
0%
10%
20%
30%
40%
50%
60%
70%
80%
90%
100%
BaseYear1994
BaseYear2000
Year2004
PRSPTarget2005
NWSSIPTarget2009
MDTarget2015(MP)
StrategicVision2025
Po
pu
lati
on
Co
vere
d
Rural WS Target
Rural SAN Target
Urban WS Target
Urban SAN Target
Urban Water Coverage
Achievement 47%
Urban Sanita-tion Coverage Achievement
23%

26
Urban Water and Poverty NWSSIP investment plan and finance needs
NWSSIP 2005-2009 Funding Scenario
Goy 429 mn 28%
$ Gap 559 mn
36%
Donors550 mn
36%
NWSSIP 2005-2009 Finance Needs (Total USD 1.538 million)
Cost 47 Gap 20
Cost 750 Gap 130Cost 48 Gap 23
Cost 454 Gap 275
Cost 28 Gap 22
Cost 190 Gap 70
Cost 21 Gap 19
0 100 200 300 400 500 600 700 800
IWRM
UWSS-Hw
UWSS-Sw
RWSS-Hw
RWSS-Sw
IRRIG
ENVIR
Su
bs
ec
tors
USD million
Donors
GoY
$ Gap

27
Urban Water and Poverty MDG financial needs assessment
MDG Water Sector Needs Assessment (2005-2015)
0 200 400 600 800 1000 1200 1400 1600
WS Capital
WS O&M
SAN Capital
SAN O&M
Cap. Bldg.
Su
bs
ec
tors
USD million
Rural
Urban

28
Urban Water and Poverty NWSSIP & MDG sub-sector finance distribution
NWSSIP 2005-2009 Subsector Finance Shares
IRRIG12%
RWSS-Sw2%
ENVIR1%
IWRM3%
RWSS-Hw30%
UWSS-Sw3%
UWSS-Hw49%
MDG Costing Module Finance Shares (Total 4.124 USD million)
Sanitation55%
Cap. Bldg.4%
Water Supply41%
29
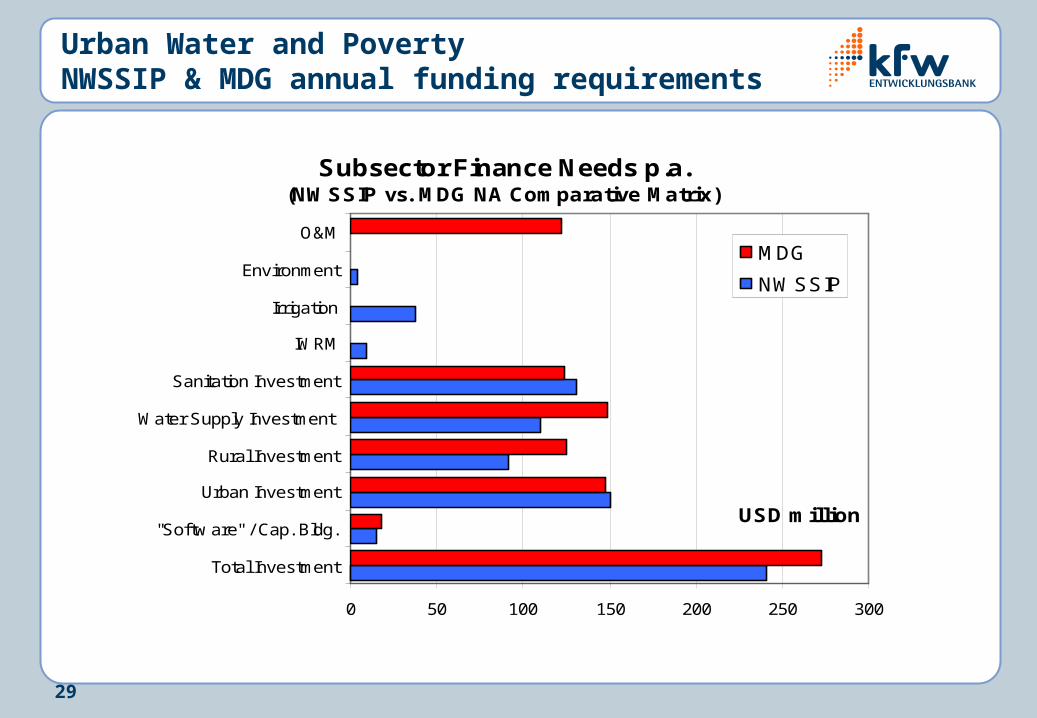
Urban Water and Poverty NWSSIP & MDG annual funding requirements
Subsector Finance Needs p.a.(NWSSIP vs. MDG NA Comparative Matrix)
0 50 100 150 200 250 300
Total Investment
"Softw are" / Cap. Bldg.
Urban Investment
Rural Investment
Water Supply Investment
Sanitation Investment
IWRM
Irrigation
Environment
O&M
USD million
MDG
NWSSIP
30
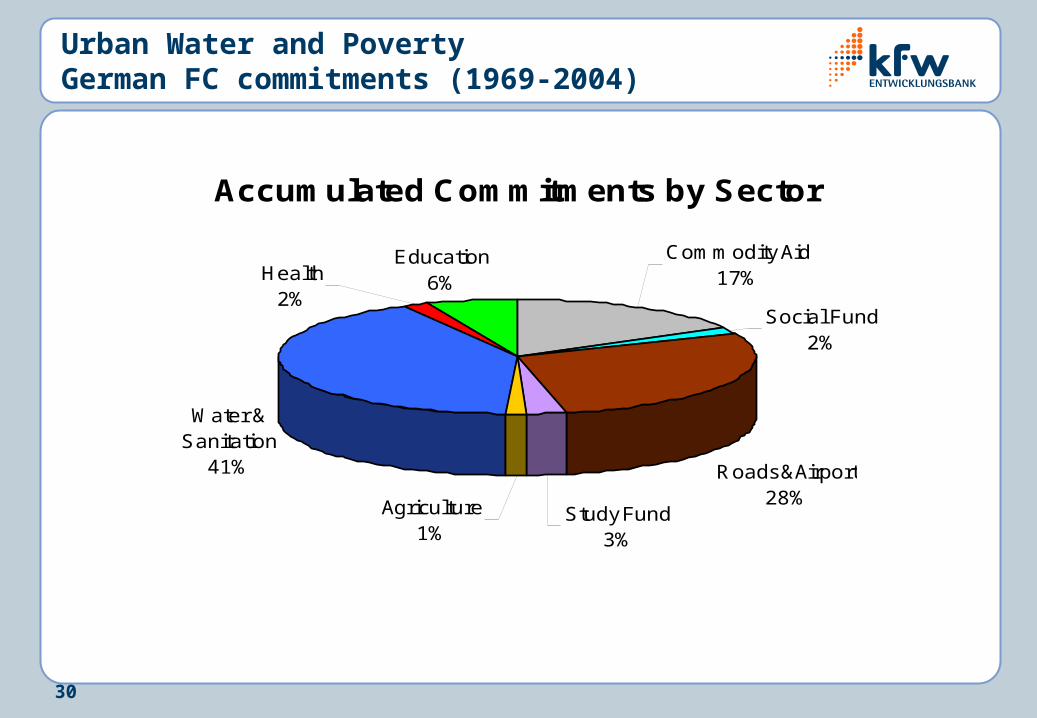
Urban Water and Poverty German FC commitments (1969-2004)
Accumulated Commitments by Sector
Commodity Aid17%
Social Fund 2%
Water & Sanitation
41%
Education6%Health
2%
Roads&Airport28%
Study Fund3%
Agriculture1%

31
Urban Water and Poverty Active German FC commitments (2004)
Active Commitments by Sector - 2004
Education13%
Health6%
Water & Sanitation
71%
Study Funds4%
Social Fund 6%
32
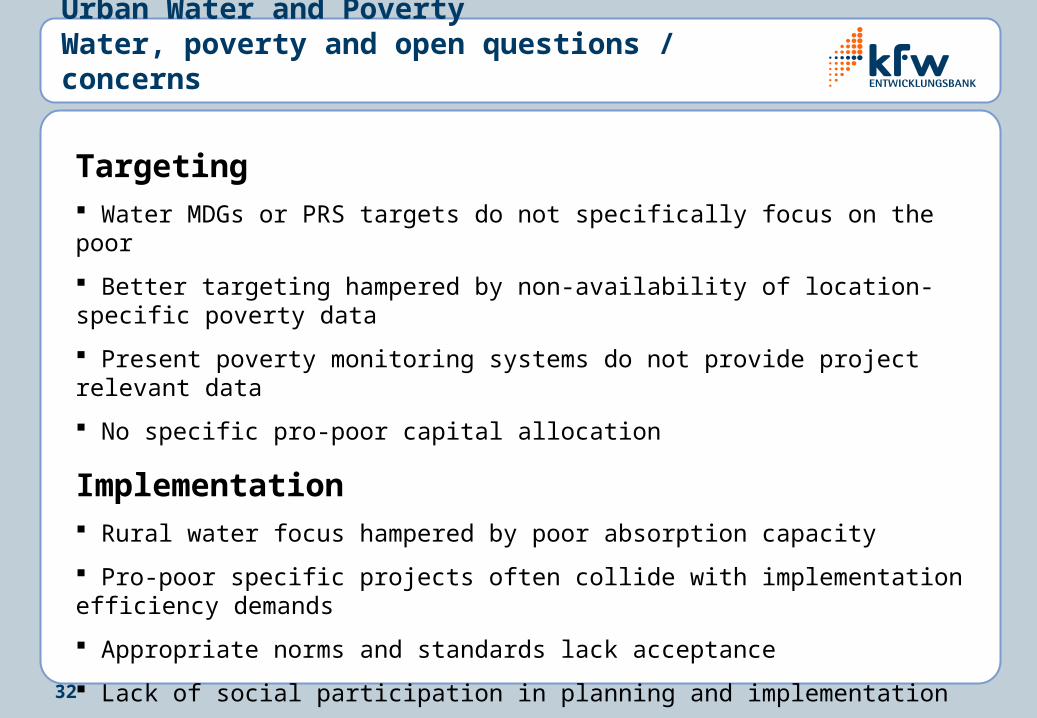
Urban Water and Poverty Water, poverty and open questions / concerns
Targeting Water MDGs or PRS targets do not specifically focus on the poor
Better targeting hampered by non-availability of location-specific poverty data
Present poverty monitoring systems do not provide project relevant data
No specific pro-poor capital allocation
Implementation Rural water focus hampered by poor absorption capacity
Pro-poor specific projects often collide with implementation efficiency demands
Appropriate norms and standards lack acceptance
Lack of social participation in planning and implementation
Highly dependant on external consultants and contractors
Lack of local contractor promotion (by sizing of tender lots)
33
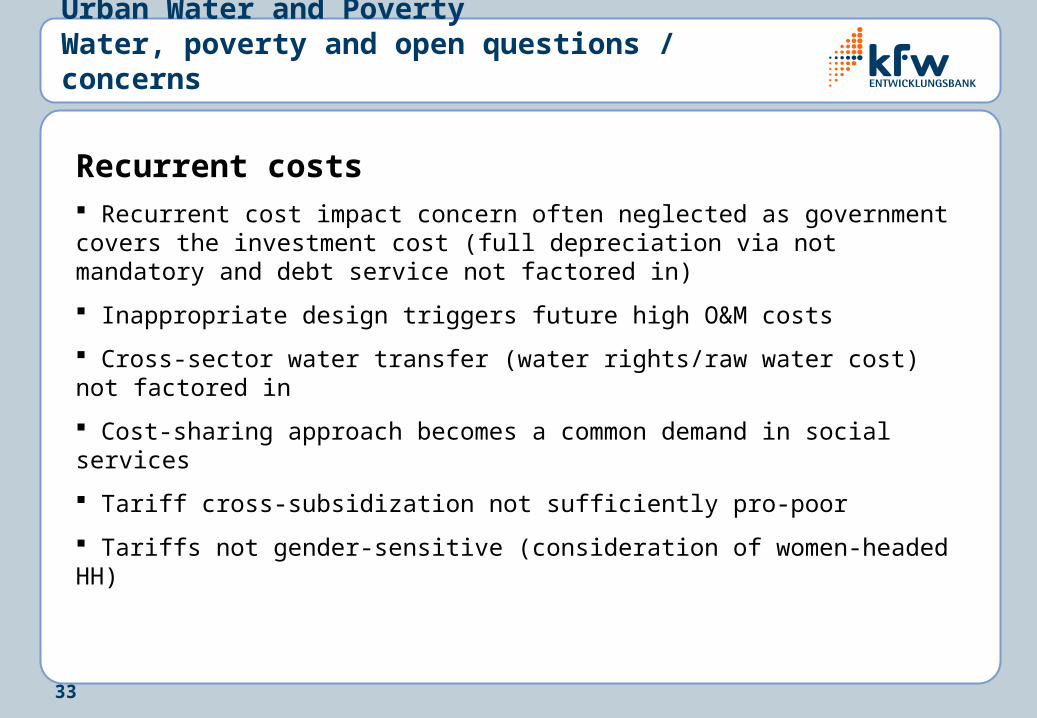
Urban Water and Poverty Water, poverty and open questions / concerns
Recurrent costs Recurrent cost impact concern often neglected as government covers the investment cost (full depreciation via not mandatory and debt service not factored in)
Inappropriate design triggers future high O&M costs
Cross-sector water transfer (water rights/raw water cost) not factored in
Cost-sharing approach becomes a common demand in social services
Tariff cross-subsidization not sufficiently pro-poor
Tariffs not gender-sensitive (consideration of women-headed HH)