Yellowfin tuna: assessment for 2017 - iattc.org · SAC-09-06 – Yellowfin tuna: assessment for...
12
SAC-09-06 – Yellowfin tuna: assessment for 2017 1 INTER-AMERICAN TROPICAL TUNA COMMISSION SCIENTIFIC ADVISORY COMMITTEE NINTH MEETING La Jolla, California (USA) 14-18 May 2018 DOCUMENT SAC-09-06 STATUS OF YELLOWFIN TUNA IN THE EASTERN PACIFIC OCEAN IN 2017 AND OUTLOOK FOR THE FUTURE Carolina V. Minte-Vera, Mark N. Maunder, and Alexandre Aires-da-Silva EXECUTIVE SUMMARY 1. The assessment of yellowfin tuna in the eastern Pacific Ocean in 2017 uses the same model as the previous assessment, and includes new and updated data. 2. There is uncertainty about recent and future levels of recruitment and biomass. There may have been three different recruitment productivity regimes since 1975, and the levels of maximum sustainable yield (MSY) and the biomasses corresponding to the MSY (BMSY, SMSY) may differ among the regimes. The recruitment was below average until 1982, mostly above average from 1983 to 2002, and then mostly below average until 2014. The annual recruitments for 2015 and 2016 were estimated to be at or above average, as is the annual recruitment for 2017. The spawning biomass ratio (SBR) was at or below the MSY level from 2005 through 2017, except during 2008-2010. However, at the start of 2018 it was above the MSY level, following the large recruitments of 2015 and 2016. Under the current (2015-2017 average) fishing mortality, the SBR is predicted to increase in the next two years, and level off at about the MSY level if recruitment is average. 3. The recent fishing mortality (F) is slightly above the MSY level (FMSY; F multiplier = 0.99). The current spawning biomass (S) is estimated to be above that level (Srecent/SMSY = 1.08), as is the recent biomass of fish aged 3 quarters and older (B) (Brecent/BMSY = 1.35). As noted in Document SAC-07-05b, these interpretations are uncertain, and highly sensitive to the assumptions made about the steepness parameter (h) of the stock-recruitment relationship, the average size of the oldest fish (L2), and the rate of natural mortality (M). The results are more pessimistic if a stock-recruitment relationship is assumed, if a higher value is assumed for L2, or if lower rates of M are assumed for adult yellowfin. Previous assessments reported that the data components diverge on their information about abundance levels: results are more pessimistic if the weighting assigned to length-frequency data is decreased, and more optimistic if the model is fitted more closely to the index of relative abundance based on the catch per unit of effort (CPUE) of the northern dolphin-associated purse-seine fishery rather than of the southern longline fishery. 4. The highest fishing mortality (F) has been on fish aged 11-20 quarters (2.75-5 years). The average annual F has been increasing for all age classes since 2009, but in 2017 it showed a slight decline for all age groups. 5. Increasing the average weight of the yellowfin caught could increase the MSY.
-
Upload
truongthuan -
Category
Documents
-
view
216 -
download
0
Transcript of Yellowfin tuna: assessment for 2017 - iattc.org · SAC-09-06 – Yellowfin tuna: assessment for...

SAC-09-06 – Yellowfin tuna: assessment for 2017 1
INTER-AMERICAN TROPICAL TUNA COMMISSION
SCIENTIFIC ADVISORY COMMITTEE
NINTH MEETING La Jolla, California (USA)
14-18 May 2018
DOCUMENT SAC-09-06 STATUS OF YELLOWFIN TUNA IN THE EASTERN PACIFIC OCEAN IN 2017 AND
OUTLOOK FOR THE FUTURE
Carolina V. Minte-Vera, Mark N. Maunder, and Alexandre Aires-da-Silva
EXECUTIVE SUMMARY
1. The assessment of yellowfin tuna in the eastern Pacific Ocean in 2017 uses the same model as theprevious assessment, and includes new and updated data.
2. There is uncertainty about recent and future levels of recruitment and biomass. There may have beenthree different recruitment productivity regimes since 1975, and the levels of maximum sustainableyield (MSY) and the biomasses corresponding to the MSY (BMSY, SMSY) may differ among the regimes.The recruitment was below average until 1982, mostly above average from 1983 to 2002, and thenmostly below average until 2014. The annual recruitments for 2015 and 2016 were estimated to beat or above average, as is the annual recruitment for 2017. The spawning biomass ratio (SBR) was ator below the MSY level from 2005 through 2017, except during 2008-2010. However, at the start of2018 it was above the MSY level, following the large recruitments of 2015 and 2016. Under the current (2015-2017 average) fishing mortality, the SBR is predicted to increase in the next two years, and leveloff at about the MSY level if recruitment is average.
3. The recent fishing mortality (F) is slightly above the MSY level (FMSY; F multiplier = 0.99). The currentspawning biomass (S) is estimated to be above that level (Srecent/SMSY = 1.08), as is the recent biomassof fish aged 3 quarters and older (B) (Brecent/BMSY = 1.35). As noted in Document SAC-07-05b, theseinterpretations are uncertain, and highly sensitive to the assumptions made about the steepnessparameter (h) of the stock-recruitment relationship, the average size of the oldest fish (L2), and therate of natural mortality (M). The results are more pessimistic if a stock-recruitment relationship isassumed, if a higher value is assumed for L2, or if lower rates of M are assumed for adult yellowfin.Previous assessments reported that the data components diverge on their information aboutabundance levels: results are more pessimistic if the weighting assigned to length-frequency data isdecreased, and more optimistic if the model is fitted more closely to the index of relative abundancebased on the catch per unit of effort (CPUE) of the northern dolphin-associated purse-seine fisheryrather than of the southern longline fishery.
4. The highest fishing mortality (F) has been on fish aged 11-20 quarters (2.75-5 years). The averageannual F has been increasing for all age classes since 2009, but in 2017 it showed a slight decline forall age groups.
5. Increasing the average weight of the yellowfin caught could increase the MSY.

SAC-09-06 – Yellowfin tuna: assessment for 2017 2
6. The following topics continue to be a priority for future research to improve the yellowfin stockassessment:a. Analysis of changes in spatial distribution of effort for the southern longline fishery, and potential
changes in targeting, whether they invalidate the use of the CPUE of this fishery as the mainabundance index in the assessment model, and whether a time change in selectivity is needed.
b. Implementation of a large-scale tagging program to address hypotheses about stock structure and regional differences in life-history parameters and depletion.
c. Improved estimates of growth, particularly for older fish.d. Weighting of the different data sets that are fitted in the assessment model.e. Refinement of fisheries definitions within the assessment model.f. Implementation of time-variant selectivity, mainly for the purse-seine fisheries on floating
objects.g. Exploration of alternative assumptions about stock structure within the assessment model.
UPDATE ASSESSMENT
This report presents the key results of an update stock assessment of yellowfin tuna (Thunnus albacares) in the eastern Pacific Ocean (EPO), conducted using an integrated statistical age-structured stock assessment model (Stock Synthesis Version 3.23b). “Update” stock assessment means that the base case model used in this assessment is the same as that used in the previous assessment, conducted in 2017 (Document SAC-08-04b), and that only the data used in the model have been updated. Stock Synthesis produces an extensive series of model output results and fit diagnostics. These are available for the base case model in html and pdf formats.
Yellowfin are distributed across the Pacific Ocean, but the bulk of the catch is made in the eastern and western regions. Purse-seine catches of yellowfin are relatively low in the vicinity of the western boundary of the EPO at 150oW. The majority of the catch in the EPO is taken in purse-seine sets on yellowfin associated with dolphins and in unassociated schools. Tagging studies of yellowfin throughout the Pacific indicate that the fish tend to stay within 1 800 km of their release positions. This regional fidelity, along with the geographic variation in phenotypic and genotypic characteristics of yellowfin shown in some studies, suggests that there might be multiple stocks of yellowfin in the EPO and throughout the Pacific Ocean. This is consistent with the fact that longline catch-per-unit-of-effort (CPUE) trends differ among areas in the EPO. However, movement rates between these putative stocks, as well as across the 150°W meridian, cannot be estimated with currently-available tagging data. This assessment assumes a single stock of yellowfin in the EPO.
The stock assessment requires a substantial amount of information. Data on retained catch, discards, CPUE, and size compositions of the catches from several different fisheries have been analyzed. Several assumptions regarding processes such as growth, recruitment, movement, natural mortality (M), and fishing mortality (F), have also been made. The catch data for the surface fisheries have been updated and new data added for 2017. New or updated longline catch data were available for China (2016), Japan (2015-2017), Korea (2016), Chinese Taipei (2014-2016), the United States (2015-2016), French Polynesia (2016), Vanuatu (2016), and other nations (2010-2016). For longline fisheries with no catch data, catches were assumed to be the same as in the most recent year with available data. Surface fishery CPUE data were updated, and new CPUE data added for 2017. New or updated CPUE data were available for the Japanese longline fleet for 2016-2017. New surface-fishery size-composition data for 2017 were added, and data for the last quarter of 2016 were updated. New or updated length-frequency data for the Japanese commercial longline fleet were available for 2014-2015.
In general, recruitment of yellowfin to the fisheries in the EPO is variable, with a seasonal component. This analysis and previous analyses indicate that the yellowfin population may have experienced three

SAC-09-06 – Yellowfin tuna: assessment for 2017 3
different recruitment productivity regimes (1975-1982, 1983-2002, 2003-2014). The recruitment was below average until 1982, mostly above average from 1983 to 2002, and then mostly below average from 2003 to 2014 (Figure 1). The most recent annual recruitments (2015-2017) were estimated to be at or slightly above average, because of high quarterly recruitments in 2015 (quarters 3 and 4), 2016 (quarters 2 and 4) and 2017 (quarter 1), but these estimates are highly uncertain. The recruitment estimates for 2017 might upwardly biased, because of a retrospective pattern already noticed in previous assessments. The productivity regimes correspond to regimes in biomass, with higher-productivity regimes producing greater biomasses (Figure 2). The existence of a stock-recruitment relationship is also supported by the data from these regimes, but the evidence is weak, and this is probably an artifact of the apparent regime shifts.
The spawning biomass ratio (the ratio of the current spawning biomass to that of the unfished population; SBR) of yellowfin in the EPO was below the level corresponding to the maximum sustainable yield (MSY) during 1977-1983, coinciding with the low-productivity regime, but above that level during most of the following years until 2005 (Figure 2). The different productivity regimes may support different MSY levels and associated SBRs. Since 2005, the SBR has been below the MSY level, except during 2008-2010, following the above-average recruitment of 2006. The 1984 increase in the SBR is attributed to the regime change, and the recent decrease may be a reversion to an intermediate productivity regime. Since 2011 the SBR has been estimated to be slightly below or at the MSY level, following the series of low recruitments since 2007, which coincided with a series of strong La Niña events. However, the SBR at the start of 2018 was estimated to be 0.29, above the MSY level (0.27), due to the above-average recruitments of 2015 and 2016, which coincided with the 2014-2016 El Niño event. With the current (2015-2017 average) fishing mortality and the current estimate of recent recruitment, the SBR is predicted to continue increasing for two years, and then decline and stabilize at the MSY level (Figure 2), assuming recruitment is average.
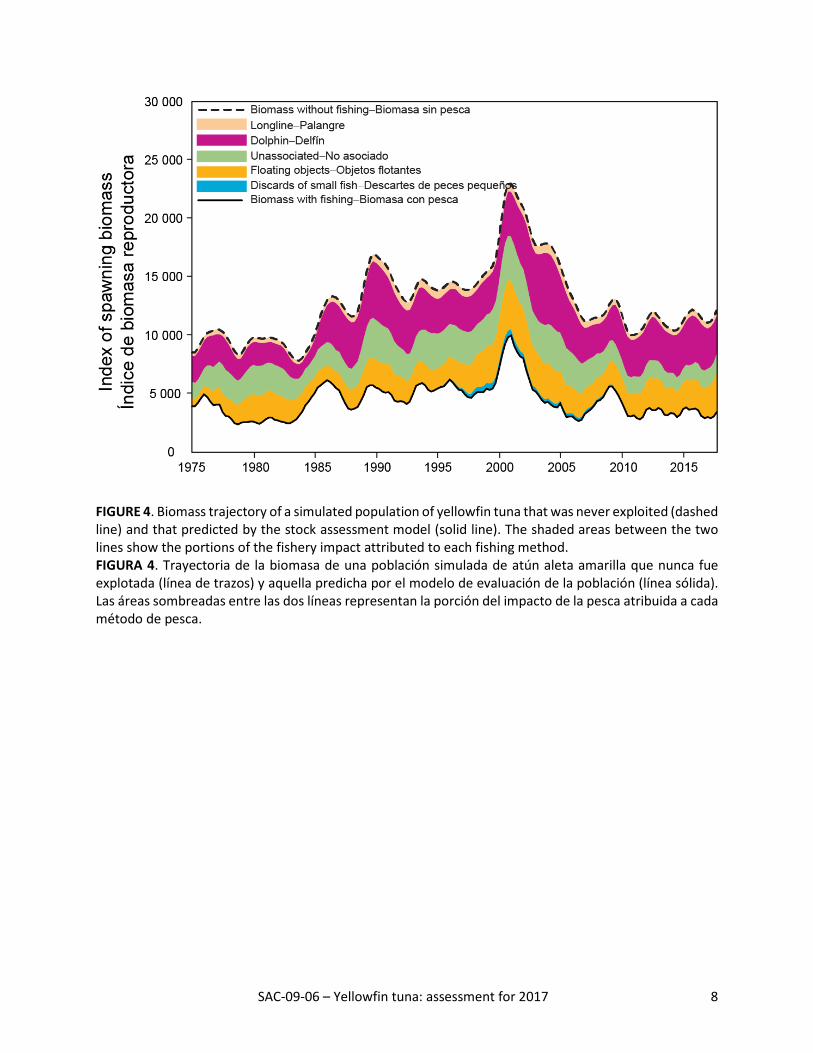
Substantial levels of fishing mortality have been estimated for the yellowfin fishery in the EPO (Figure 3). These levels are highest for yellowfin aged 11-20 quarters (2.75-5 years), and lowest for the younger fish (< 10 quarters/2.5 years). Historically, the dolphin-associated and unassociated purse-seine fisheries have the greatest impact on the spawning biomass of yellowfin, followed by the floating-object fisheries (Figure 4). In more recent years, the impact of the floating-object fisheries has been greater than that of the unassociated fisheries. The impacts of the longline and purse-seine discard fisheries are much less, and have decreased in recent years.
The fishing mortality is estimated to be slightly above the level that would support the MSY, based on the current distribution of effort among the different fisheries (F multiplier = 0.99), but the confidence intervals are wide (Figure 5), and recent catches are below that level (Table 1). The SBR is above the MSY level (Srecent/SMSY = 1.08), as is the biomass of fish aged 3 quarters and older (Brecent/BMSY = 1.35), because of the recent large recruitments. It is important to note that the curve relating the average sustainable yield to the long-term fishing mortality is flat around the MSY level (SAC-08-04b); therefore, moderate changes in the long-term levels of effort will change the long-term catches only marginally, while changing the biomass considerably. Maintaining the fishing mortality below the MSY level would result in only a marginal decrease in the long-term average yield, with the benefit of a relatively large increase in the spawning biomass. In addition, if management is based on the base case assessment, which assumes that there is no stock-recruitment relationship, but in fact there is such a relationship, the loss in yield would be greater than if management were based on assuming a stock-recruitment relationship when in fact there was none (SAC-08-04b).
The average weights of yellowfin taken from the fishery have been consistent over time, but vary substantially among the different fisheries. In general, the floating-object, northern unassociated, and

SAC-09-06 – Yellowfin tuna: assessment for 2017 4
pole-and-line fisheries capture younger, smaller yellowfin than do the southern unassociated, dolphin-associated, and longline fisheries. The longline fisheries and the dolphin-associated fishery in the southern region capture older, larger yellowfin than the northern and coastal dolphin-associated fisheries.
The MSY calculations indicate that, theoretically at least, catches could be increased if the fishing effort were directed toward longlining and purse-seine sets on yellowfin associated with dolphins. This would also increase the SBRs corresponding to MSY.
The MSY has been stable during the assessment period (1975-2017) (Figure 6), which suggests that the overall pattern of selectivity has not varied a great deal through time. However, the overall level of fishing effort has varied with respect to the MSY level.
If a stock-recruitment relationship is assumed, the outlook is more pessimistic: current effort is estimated to be above the MSY level (Table 1), but the spawning biomass is predicted to rise above the MSY level in the next two years (Figure 2). However, the confidence intervals are wide, and there is a moderate probability that the SBR will be substantially above or below this level. If fishing effort continues at recent levels, both the spawning biomass (Figure 2) and the catches of the surface fisheries (Figure 7) are predicted to increase in the near future, and then decrease to below the current level, assuming average recruitment.
Previous assessments (SAC-07-05b) have indicated that the status of the stock is also sensitive to the value assumed for the average size of the oldest fish (L2), and more pessimistic results are obtained when higher values are assumed for this parameter. Results are also more pessimistic if the weighting assigned to the length-frequency data is decreased, and more optimistic if the model is fitted more closely to the index of relative abundance based on the CPUE of the northern dolphin-associated purse-seine fishery rather than of the southern longline fishery.

SAC-09-06 – Yellowfin tuna: assessment for 2017 5
FIGURE 1. Estimated quarterly (top panel) and annual (bottom panel) recruitment at age zero of yellowfin tuna to the fisheries of the EPO. The estimates are scaled so that the average recruitment is equal to 1.0 (dashed horizontal line). The solid line illustrates the maximum likelihood estimates of recruitment, and the shaded area indicates the approximate 95% confidence intervals around those estimates. FIGURA 1. Reclutamiento trimestral (recuadro superior) y anual (recuadro inferior) estimado de atún aleta amarilla de edad cero a las pesquerías del OPO. Se ajusta la escala de las estimaciones para que el reclutamiento medio equivalga a 1.0 (línea de trazos horizontal). La línea sólida ilustra las estimaciones de verosimilitud máxima del reclutamiento, y la zona sombreada los límites de confianza de 95% aproximados de las estimaciones.

SAC-09-06 – Yellowfin tuna: assessment for 2017 6
FIGURE 2. Spawning biomass ratios (SBRs) for yellowfin tuna in the EPO, including projections for 2018-2028 based on average fishing mortality rates during 2015-2017, from the base case (top) and the sensitivity analysis that assumes a stock-recruitment relationship (h = 0.75, bottom). The dashed horizontal line (at 0.27 and 0.35, respectively) identifies the SBR at MSY. The solid curve illustrates the maximum likelihood estimates, and the estimates after 2018 (the large dot) indicate the SBR predicted to occur if fishing mortality rates continue at the average of that observed during 2015-2017, and average environmental conditions occur during the next 10 years. The shaded area indicates the approximate 95% confidence intervals around those estimates. FIGURA 2. Cocientes de biomasa reproductora (SBR) de atún aleta amarilla en el OPO, con proyecciones para 2018-2028 basadas en las tasas de mortalidad por pesca medias durante 2015-2017, del caso base (arriba) y el análisis de sensibilidad que supone una relación población-reclutamiento (h = 0.75, abajo). La línea de trazos horizontal (en 0.27 y 0.35, respectivamente) identifica el SBR correspondiente al RMS. La curva sólida ilustra las estimaciones de verosimilitud máxima, y las estimaciones a partir de 2018 (punto grande) indican el SBR que se predice ocurrirá con tasas de mortalidad por pesca en el promedio de aquellas observadas durante 2015-2017, y con condiciones ambientales medias durante los 10 años próximos. El área sombreada indica los intervalos de confianza de 95% aproximados alrededor de esas estimaciones.

SAC-09-06 – Yellowfin tuna: assessment for 2017 7
FIGURE 3. Average annual fishing mortality (F) by age groups, by all gears, of yellowfin tuna recruited to the fisheries of the EPO. The age groups are defined by age in quarters. FIGURA 3. Mortalidad por pesca (F) anual media, por grupo de edad, por todas las artes, de atún aleta amarilla reclutado a las pesquerías del OPO. Se definen los grupos de edad por edad en trimestres.
SAC-09-06 – Yellowfin tuna: assessment for 2017 8
FIGURE 4. Biomass trajectory of a simulated population of yellowfin tuna that was never exploited (dashed line) and that predicted by the stock assessment model (solid line). The shaded areas between the two lines show the portions of the fishery impact attributed to each fishing method. FIGURA 4. Trayectoria de la biomasa de una población simulada de atún aleta amarilla que nunca fue explotada (línea de trazos) y aquella predicha por el modelo de evaluación de la población (línea sólida). Las áreas sombreadas entre las dos líneas representan la porción del impacto de la pesca atribuida a cada método de pesca.

SAC-09-06 – Yellowfin tuna: assessment for 2017 9
FIGURE 5. Kobe (phase) plot of the time series of estimates of stock size (top: spawning biomass; bottom: total biomass of fish aged 3 quarters and older) and fishing mortality relative to their MSY reference points. The panels represent target reference points (SMSY and FMSY). The dashed lines represent the interim limit reference points of 0.28 *SMSY and 2.42*FMSY, which correspond to a 50% reduction in recruitment from its average unexploited level based on a conservative steepness value (h = 0.75) for the Beverton-Holt stock-recruitment relationship. Each dot is based on the average exploitation rate over three years; the large red dot indicates the most recent estimate. The squares around the most recent estimate represent its approximate 95% confidence interval. The triangle is the first 3-year period (1975-1977). FIGURA 5. Gráfica de Kobe (fase) de la serie de tiempo de las estimaciones del tamaño de la población (arriba: biomasa reproductora; abajo: biomasa total de peces de 3 trimestres o más de edad) y la mortalidad por pesca en relación con sus puntos de referencia de RMS. Los paneles representan puntos de referencia objetivo (SRMS y FRMS). Las líneas descontínuas representan los puntos de referencia límite de 0.28*SRMS y 2.42*FRMS, que corresponden a una reducción de 50% del reclutamiento de su nivel medio no explotado basada en un valor cauteloso de la inclinación de la relación población-reclutamiento de Beverton-Holt (h = 0.75). Cada punto se basa en la tasa de explotación media de tres años; el punto rojo grande indica la estimación más reciente. Los cuadrados alrededor de la estimación más reciente representan su intervalo de confianza de 95% aproximado. El triángulo es el primer período de tres años (1975-1977).

SAC-09-06 – Yellowfin tuna: assessment for 2017 10
FIGURE 6. Estimates of MSY-related quantities calculated using the average age-specific fishing mortality for each year (Si is the index of spawning biomass at the end of the last year in the assessment). FIGURA 6. Estimaciones de cantidades relacionadas con el RMS calculadas a partir de la mortalidad por pesca media por edad para cada año. (Si es el índice de la biomasa reproductora al fin del último año en la evaluación).

SAC-09-06 – Yellowfin tuna: assessment for 2017 11
FIGURE 7. Historic and projected annual catches of yellowfin tuna by surface (top panel) and longline (bottom panel) fisheries from the base case while fishing with the current effort, the base case while fishing at the fishing mortality corresponding to MSY (FMSY), and the analysis of sensitivity to steepness (h = 0.75) of the stock-recruitment relationship while fishing with the current effort. The large dot indicates the most recent catch (2017). FIGURA 7. Capturas históricas y proyectadas de atún aleta amarilla de las pesquerías de superficie (panel superior) y palangre (panel inferior), del caso base con el nivel actual de esfuerzo, del caso base con la mortalidad por pesca correspondiente al RMS (FRMS), y el análisis de sensibilidad a la inclinación (h = 0.75) de la relación población-reclutamiento con el nivel actual de esfuerzo. El punto grande indica la captura más reciente (2017).
SAC-09-06 – Yellowfin tuna: assessment for 2017 12
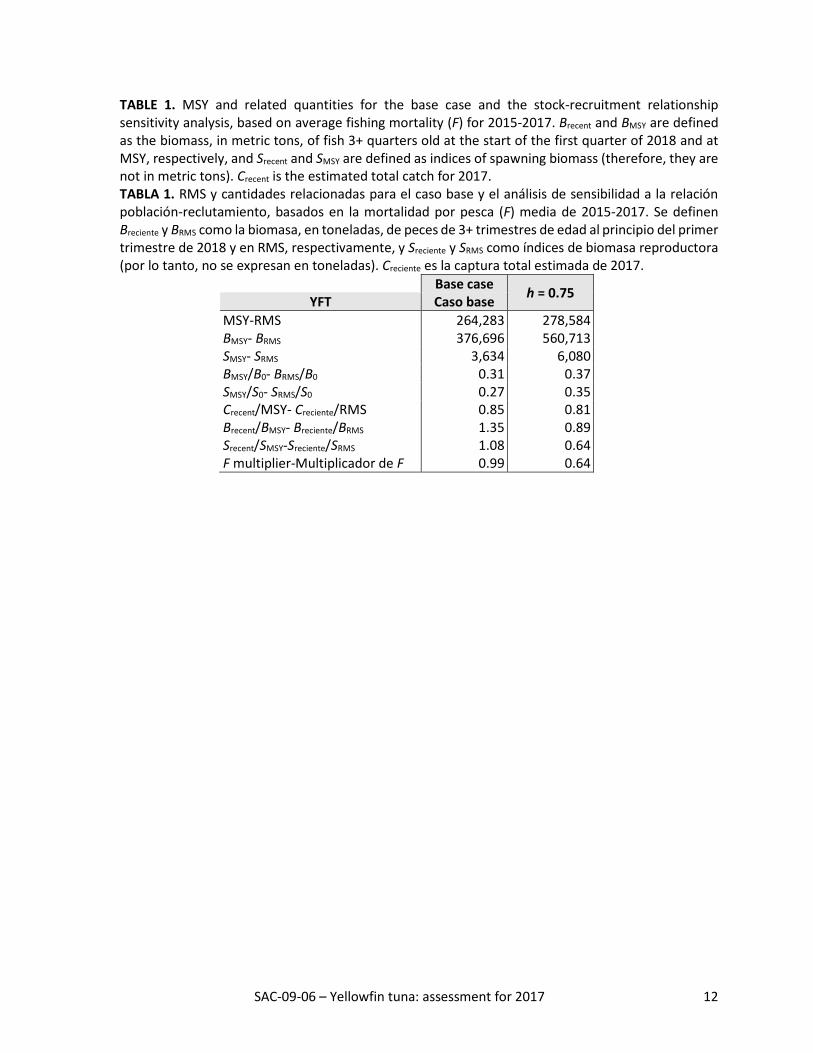
TABLE 1. MSY and related quantities for the base case and the stock-recruitment relationship sensitivity analysis, based on average fishing mortality (F) for 2015-2017. Brecent and BMSY are defined as the biomass, in metric tons, of fish 3+ quarters old at the start of the first quarter of 2018 and at MSY, respectively, and Srecent and SMSY are defined as indices of spawning biomass (therefore, they are not in metric tons). Crecent is the estimated total catch for 2017. TABLA 1. RMS y cantidades relacionadas para el caso base y el análisis de sensibilidad a la relación población-reclutamiento, basados en la mortalidad por pesca (F) media de 2015-2017. Se definen Breciente y BRMS como la biomasa, en toneladas, de peces de 3+ trimestres de edad al principio del primer trimestre de 2018 y en RMS, respectivamente, y Sreciente y SRMS como índices de biomasa reproductora (por lo tanto, no se expresan en toneladas). Creciente es la captura total estimada de 2017.
Base case h = 0.75 YFT Caso base MSY-RMS 264,283 278,584 BMSY- BRMS 376,696 560,713 SMSY- SRMS 3,634 6,080 BMSY/B0- BRMS/B0 0.31 0.37 SMSY/S0- SRMS/S0 0.27 0.35 Crecent/MSY- Creciente/RMS 0.85 0.81 Brecent/BMSY- Breciente/BRMS 1.35 0.89 Srecent/SMSY-Sreciente/SRMS 1.08 0.64 F multiplier-Multiplicador de F 0.99 0.64