Years Lost by Disease
116
2007 Ca nad ia n Ca nc er Sta ti st ics PRODUCED BY : CANADI AN CANCER SOCIETY , NATIONAL CANCER INSTITUTE OF CANADA , STA TISTICS CANADA, PROVINCIAL / TERRI TORIAL CANCER REGI STRIES, PUBLIC HEALTH AGENCY OF CANADA www.cancer.ca
Transcript of Years Lost by Disease

8/14/2019 Years Lost by Disease
http://slidepdf.com/reader/full/years-lost-by-disease 1/116
2007
Canadian Cancer Statistics
PRODUCED BY :
CANADIAN CANCER SOCIETY ,NATIONAL CANCER INSTITUTE OF CANADA ,STATISTICS CANADA , PROVINCIAL / TERRITORIAL CANCER REGISTRIES ,PUBLIC HEALTH AGENCY OF CANADA
www.cancer.ca

8/14/2019 Years Lost by Disease
http://slidepdf.com/reader/full/years-lost-by-disease 2/116
Steering Committee MembersLoraine Marrett (Chair), PhD
Division of Preventive Oncology, Cancer Care Ontario, Toronto, ODagny Dryer, MD, FRCPC
PEI Cancer Treatment Centre and Cancer Registry, Charlottetown, Island
Heather Logan, RN, BScN, MHSc, CHECanadian Cancer Society and National Cancer Institute of Canada,Ontario
Les Mery, M.Sc.Centre for Chronic Disease Prevention and Control, Public Health Canada, Ottawa, Ontario
Howard Morrison, PhDCentre for Chronic Disease Prevention and Control, Public Health
Canada, Ottawa, OntarioBrent Schacter, MD, FRCPC
Canadian Association of Provincial Cancer Agencies and CancerCaWinnipeg, Manitoba
Ghislaine Villeneuve, MPAHealth Statistics Division, Statistics Canada, Ottawa, Ontario
Analytic and Statistical Support
Chris Waters, BSc (Stats)Centre for Chronic Disease Prevention and Control, Public Health Canada, Ottawa, Ontario
Robert Semenciw, MSc
Centre for Chronic Disease Prevention and Control, Public Health Canada, Ottawa, Ontario
Citation: Material appearing in this report may be reproduced or copied withohowever, the following citation to indicate the source must be used:“Canadian Cancer Society/National Cancer Institute of Canada: Canadian C

8/14/2019 Years Lost by Disease
http://slidepdf.com/reader/full/years-lost-by-disease 3/116
Current Incidence and MortalityN An estimated 159,900 new cases of cancer and 72,700 deaths
occur in Canada in 2007.N The total number of lung cancer cases (men and women comb
the number of either prostate or breast cancer cases.N Lung cancer remains the leading cause of cancer death for boN Overall, colorectal cancer is the second leading cause of death
Geographic Patterns of Cancer OccurrenceN Generally, both incidence and mortality rates are higher in At
Quebec and lowest in British Columbia.N Generally, incidence and mortality rates in Ontario are lower
average.
N Lung cancer incidence and mortality rates continue to be highand Quebec and lowest in British Columbia.
Trends in Incidence and MortalityN The increased number of new cases of cancer is primarily due
aging population.N Between 1994 and 2003, incidence rates rose by more than 2%
melanoma and liver cancer in males, and thyroid cancer in boN Between 1994 and 2003, incidence rates declined by 2% or m
males, stomach and larynx cancers in both sexes and cervical N Lung cancer incidence and mortality rates continue to climb a
decreasing among men.
N Mortality rates have declined for all cancers combined and foin both sexes since 1994. Exceptions are lung cancer in femalmales.
N Excluding lung cancer, mortality rates have dropped 20% in w

8/14/2019 Years Lost by Disease
http://slidepdf.com/reader/full/years-lost-by-disease 4/116
Probability of Developing/Dying from CancerN On the basis of current incidence rates, 39% of Canadian women an
will develop cancer during their lifetimes.N On the basis of current mortality rates, 24% of women and 28% of m
approximately 1 out of every 4 Canadians, will die from cancer.
Potential Years of Life Lost Due to CancerN Lung cancer is by far the leading cause of premature death due to ca
N Smoking is responsible for 28% of potential years of life lost (PYLLcancer.
PrevalenceN In 2003, 2.5% of Canadian men and 2.8% of Canadian women had a
cancer in the previous 15 years.
N 1.0% of the female population are survivors of breast cancer, and 0. population are survivors of prostate cancer, diagnosed within the pre
Five-year Relative Cancer Survival in Canada, 1996-1998N Relative survival ratios were lowest for pancreatic, esophageal, liver
cancer.
N Comparison of survival estimates can help to identify gaps and estabfor systemic change that may lead to improvement in survival.N Relative survival for lung cancer tends to decline with increasing agN Relative survival ratios were best for testicular, thyroid, prostate can
melanoma.
Cancer in ChildrenN About 1,300 Canadian children develop cancer each year, but due to
treatment of the most common cancers, the number of deaths is abounumber of cases.
N While cancer incidence in children has been relatively constant since
HIGHLIGHTS
8/14/2019 Years Lost by Disease
http://slidepdf.com/reader/full/years-lost-by-disease 5/116

8/14/2019 Years Lost by Disease
http://slidepdf.com/reader/full/years-lost-by-disease 6/116
T his monograph was developed by members of the Steering Commit by the National Cancer Institute of Canada. The Steering Committ
responsible for developing content, reviewing statistical information, intdata and writing the text. The Steering Committee includes representati National Cancer Institute of Canada, the Canadian Cancer Society, PubAgency of Canada, Statistics Canada, the Canadian Council of Cancer Rthe Canadian Association of Provincial Cancer Agencies as well as univand provincial/territorial cancer agency-based cancer researchers. The p production and distribution of the monograph is the result of collaborat
these groups, with additional assistance and support as noted below.Data sourcesN The Canadian Cancer Registry (CCR), the National Cancer Incidenc
System (NCIRS) and the mortality data files are maintained in HealDivision, Statistics Canada. These represent the primary sources of d Appendix II,Data Sources and Processing).¡ Cancer data in the CCR and NCIRS are supplied by provincial/te
registries. Staff of these registries play a key role in ensuring dat¡ Mortality data are collected by provincial/territorial vital statistic
N Estimates of non-melanoma (basal cell and squamous cell) skin canc by the B.C. Cancer Agency, CancerCare Manitoba and the Departm New Brunswick. Most provincial cancer registries do not collect datcommon cancers.
Review and analysisN Provincial and territorial cancer registries reviewed the cancer estim
incidence and mortality data for their own jurisdictions before publimonograph. (The results of their input are noted in Appendix I,
Estimates for 2007).N The Surveillance Division, Centre for Chronic Disease Prevention an
(CCDPC), Public Health Agency of Canada (PHAC) conducted the for most of the sections. Tables and figures were updated by Bob M
N The Health Statistics Division Statistics Canada provided data for d
ACKNOWLEDGEMENTS

8/14/2019 Years Lost by Disease
http://slidepdf.com/reader/full/years-lost-by-disease 7/116

8/14/2019 Years Lost by Disease
http://slidepdf.com/reader/full/years-lost-by-disease 8/116
T his monograph is part of an annual series that began publication in purpose is to provide health professionals, researchers and policy-m
detailed information regarding incidence and mortality of the most comcancer by age, sex, time period and province or territory. These data manew research and assist decision-making and priority-setting processes aindividual, community, provincial/territorial and national levels. The moalso used by educators, the media and members of the public with an incancer.
The statistics contained herein refer to all types of cancer, defined accostandardized classification that is used worldwide. As is customary in rcancer registries, the statistics exclude basal cell and squamous cell carskin. Benign tumours and carcinoma in situ (except for bladder cancer)excluded. Details of how cancers are classified and definitions of techn provided in the Glossary.It is important to emphasize that the figures provided for 2007 are estima
rather than actual data . Because the most current available data on occurrence/deaths are always a few years old (e.g., actual national data are only to 2003), this publication presents estimates for the current yea projections based on past numbers of cancers and trends. Details of themethods, data sources and terminology used to produce the projections Appendix II: Methods.
Special Topics are included each year, and topics from 1997 onwards athe Canadian Cancer Society’s website (www.cancer.ca); hard copies ofSpecial Topics can be obtained by writing to [email protected]. To see a Special Topics please refer to Appendix III . This year’s Special TopiCancer.
Individuals who require additional information can refer to the section e Further Information.
Related information can also be found in other publications, including r provincial and territorial cancer registries; Cancer Statistics,1 and H published by Statistics Canada; Chronic Diseases in Canadaand thCancer Incidence Atlas,2 published by Health Canada/Public Health ACanada; a collaborative monograph entitled Cancer in North Am
INTRODUCTION

8/14/2019 Years Lost by Disease
http://slidepdf.com/reader/full/years-lost-by-disease 9/116
Current Incidence and Mortality
Geographic Patterns of Cancer Occurrence
Trends in Incidence and Mortality
Age and Sex Distribution of Cancer
Probability of Developing/Dying from Cancer
Potential Years of Life Lost Due to Cancer
Prevalence
Five-year Relative Survival, 1996-1998
Cancer in Children and Youth
Special Topic:
N Breast Cancer Glossary
Appendix I: Actual Data for New Cases and Deaths
Appendix II: Methods
Appendix III: Previous Special Topics
References For Further Information
Evaluation and Order Form
Tables
1. Estimated New Cases and Deaths for Cancers by Sex, Ca2. Estimated Population, New Cases and Deaths for All Can
and Geographic Region, Canada, 2007
3. Estimated New Cases for the Most Common Cancers by Province Canada 2007
TABL
8/14/2019 Years Lost by Disease
http://slidepdf.com/reader/full/years-lost-by-disease 10/116
8.1 Age-Standardized Incidence Rates for Selected Cancers, FemaleCanada, 1978-2007
8.2 Age-Standardized Mortality Rates for Selected Cancers, FemaleCanada, 1978-2007
9. Average Annual Percent Change (AAPC) in Age-Standardized IRates and Mortality Rates (1994-2003) for Selected Cancers, Ca
10. Distribution for All Cancers Combined by Age Group and Sex,Canada, 2007
11. Distribution by Selected Cancers, Age Group and Sex, Canada,
12. Lifetime Probability of Developing and Dying from Cancer andthe Probability of Developing Cancer by Age, Canada
13. Potential Years of Life Lost Due to Cancer, Canada, 2003
14. Prevalence for the Most Common Cancers, by Sex, Canada, 200
15. Five-year Relative Survival Ratio (%) (and 95% Confidence Int by Cancer Type, and by Sex, Canada Excluding Quebec, CasesDiagnosed 1996-1998
16. Age-Standardized Five-year Relative Survival Ratio (%) (and 95Confidence Interval) Both Sexes Combined by Province for SeleCancers, Cases Diagnosed 1996-1998
17. Five-year Relative Survival Ratio (%) (and 95% Confidence Int by Age Group for Selected Cancers, Cases Diagnosed 1996-199Canada Excluding Quebec
18. New Cases and Age-Standardized Cancer Incidence Rates, and Dand Age-Standardized Cancer Mortality Rates by Histologic Celfor Children and Youth Aged 0-19 Years, Canada, 1999-2003
19. Average Annual Percent Change (AAPC) in Age-Standardized Iand Mortality Rates 1969-2003 for Breast Cancer Among Femal by Age at Diagnosis, Canada
20. Breast Cancer, Females, Five-Year Relative Survival Ratio by S1994 1997
TABLE OF CONTENTS

8/14/2019 Years Lost by Disease
http://slidepdf.com/reader/full/years-lost-by-disease 11/116
2.2 Deaths and Age-Standardized Mortality Rates (ASMR) foCanada, 1978-2007
3.1 Trends in New Cases and Deaths Attributed to Cancer RaGrowth and Population Age Distribution, All Cancers, AlMales, Canada, 1978-2007
3.2 Trends in New Cases and Deaths Attributed to Cancer RaGrowth and Population Age Distribution, All Cancers, AlFemales, Canada, 1978-2007
4. Relative Change in Age-Standardized Mortality Rates IncExcluding Lung Cancer, Canada, 1978-2007
5.1 Age-Standardized Incidence Rates (ASIR) for Selected CaMales, Canada, 1978-2007
5.2 Age-Standardized Mortality Rates (ASMR) for Selected CMales, Canada, 1978-2007
6.1 Age-Standardized Incidence Rates (ASIR) for Selected CaFemales, Canada, 1978-2007
6.2 Age-Standardized Mortality Rates (ASMR) for Selected CFemales, Canada, 1978-2007
7.1 Percent Change in Cancer Incidence Burden (total numbeand Risk (age-standardized incidence rates), for Selected Canada, between 1994 and 2003
7.2 Percent Change in Cancer Mortality Burden (total numberand Risk of Death (age-standardized mortality rates), for Cancers, Canada, between 1994 and 2003
8. Age-Specific Incidence and Mortality Rates for All CanceCanada, 2003
9. Age-Standardized Incidence and Mortality Rates by Age All Cancers, Canada, 1978-2007
10. Selected Causes of Potential Years of Life Lost (PYLL), C
11 Fi R l i S i l R i (%) b C T B
TABL

8/14/2019 Years Lost by Disease
http://slidepdf.com/reader/full/years-lost-by-disease 12/116
13.5 Changes in the Pattern of Use of Adjuvant Therapy Among Wom50-69 Years of Age with Node-Positive Stage II or IIIA Breast
13.6 Five-year Relative Survival Ratio (%) (and Confidence Interval) by Year of Diagnosis, Ontario, Breast Cancer, Females, CasesDiagnosed 1975-1999
13.7 Age-specific Five-year Relative Survival Ratio (%) by Five-yearPeriod of Diagnosis, Breast Cancer, Females, Ontario 1975-1999
13.8 Relative Survival Ratio (%) by Number of Years Since Diagnosi
Breast Cancer, Females, Ontario
Tables in Appendix IA1. Actual Data for New Cases of Cancer by Type and Sex, Canada
A2. Actual Data for Cancer Deaths by Type and Sex, Canada, 2003
A3. Actual Data for New Cases for Most Common Cancers by Sex aGeographic Region, Most Recent Year, Canada
A4. Actual Age-Standardized Incidence Rates for Most Common Ca by Sex and Geographic Region, Most Recent Year, Canada
A5. Actual Data for Deaths for Most Common Cancers by Sex andGeographic Region, Canada, 2003
A6. Actual Age-Standardized Mortality Rates for Most Common Ca by Sex and Geographic Region, Canada, 2003
TABLE OF CONTENTS

8/14/2019 Years Lost by Disease
http://slidepdf.com/reader/full/years-lost-by-disease 13/116

8/14/2019 Years Lost by Disease
http://slidepdf.com/reader/full/years-lost-by-disease 14/116
Cancer deaths are those attributed to some form of cancer as the underldeath by the certifying physician. Cancer mortality statistics are derivedrecords maintained by the provincial and territorial registrars of vital st people residing in that province or territory at the time of death.
Although these procedures have been standardized both nationally and isome lack of specificity and uniformity is inevitable. The description ofcancer provided on the death certificate is usually less accurate than thathe cancer registries from hospital and pathology records. These facts maccount, in part, for the numbers of cases and deaths listed under “all o
throughout the Tables. Cancer deaths occurring in a given year will usuresult of cancers diagnosed in previous years.
Estimates for Cancer Incidence and Mortality, Canada, 2007An estimated 159,900 new cases of cancer and 72,700 deaths from cancin Canada in 2007. Men outnumber women for both new cases and deaincidence and 12% for mortality (Table 1).
Three types of cancer account for at least 55% of new cases in each sexlung, and colorectal cancers in males, and breast, lung, and colorectal cfemales. Twenty-nine percent of cancer deaths in men and 26% in womlung cancer alone (Figures 1.1 and 1.2). Comparisons during years priorespect to colorectal cancer mortality should be made with caution becachange in classification practices (see Appendix II for further details
Lung cancer will continue as the leading cause of cancer death in Cana2007, increasing to an estimated 8,900 deaths, compared with the 5,300expected for breast cancer. This reflects the rapid increase in lung cancrates among women over the past three decades, while age-standardizedmortality rates declined slightly. Lung cancer incidence among women to rise. With an estimated 10,900 new cases, lung cancer is the second l
cancer in women, ahead of the 9,400 new cases expected for colorectalranks third. Breast cancer continues to lead in incidence among Canadiawith slightly more than twice as many new cases as lung cancer.
In Canadian men in 2007, prostate cancer will continue as the leading tdiagnosed, with an estimated 22,300 newly diagnosed cases, compared
CURRENT INCIDENCE AND MORTALITY

8/14/2019 Years Lost by Disease
http://slidepdf.com/reader/full/years-lost-by-disease 15/116
CURRENT INCIDENCE A
Table 1Estimated New Cases and Deaths for Cancers by Sex, Canada, 2
New Cases2007 Estimates
Total M F
All Cancers 159,900 82,700 77,200
Lung 23,300 12,400 10,900
Breast 22,500 170 22,300
Prostate 22,300 2 22,300 2 –
Colorectal 20,800 11,400 9,400
Non-Hodgkin Lymphoma 6,800 3,700 3,100
Bladder 1 6,600 5,000 1,700
Kidney 4,900 3,000 1,800
Melanoma 4,600 2,500 2,100
Leukemia 4,200 2,500 1,750
Body of Uterus 4,100 – 4,100
Thyroid 3,700 790 2,900
Pancreas 3,600 1,750 1,850
Oral 3,200 2,100 1,050
Stomach 2,800 1,850 1,000
Brain 2,600 1,450 1,150
Ovary 2,400 – 2,400
Multiple Myeloma 2,000 1,100 900
Esophagus 1,550 1,150 410
Liver 1,350 1,050 310
Cervix 1,350 – 1,350
Larynx 1,150 950 220
Hodgkin Lymphoma 880 480 400
Testis 830 830

8/14/2019 Years Lost by Disease
http://slidepdf.com/reader/full/years-lost-by-disease 16/116
CURRENT INCIDENCE AND MORTALITY
LungType of Cancer
NN
ProstateColorectal
PancreasNon-Hodgkin Lymphoma
Leukemia
Stomach
EsophagusBladder
KidneyBrain
0 5 10 15 20 25
ProstateType of Cancer
LungColorectal
BladderNon-Hodgkin Lymphoma
KidneyLeukemia
MelanomaOral
StomachPancreas
Brain
Multiple MyelomaEsophagus
LarynxTestis
ThyroidHodgkin Lymphoma
All Other Cancers
Liver
15.013.8
6.14.5
3.63.03.0
2.52.22.1
1.81.41.31.31.21.01.0
0.67.6
12.211.2
4.64.4
3.73.43.3
3.02.62.6
Figure 1.1Percentage Distribution of Estimated New Cases and Deaths forSelected Cancers, Males, Canada, 2007

8/14/2019 Years Lost by Disease
http://slidepdf.com/reader/full/years-lost-by-disease 17/116
CURRENT INCIDENCE A
Breast
Lung
Type of Cancer
Type of Cancer
Lung
Breast
Colorectal
Colorectal
Body of Uterus
Pancreas
Non-Hodgkin Lymphoma
Ovary
Ovary
Non-Hodgkin Lymphoma
Melanoma
Leukemia
Pancreas
Stomach
Kidney
Body of Uterus
Leukemia
Brain
Thyroid
Bladder
Kidney
Cervix
Bladder
Brain
StomachOral
Multiple MyelomaEsophagus
Larynx
Hodgkin Lymphoma
All Other Cancers
0 5 10 15 20
Liver
14.112.2
5.34.03.8
3.12.7
2.42.32.32.2
1.81.5
1.41.31.2
0.50.50.40.3
7.8
15.511.7
5.45.0
4.12.92.22.22.1
1.81 5
Figure 1.2Percentage Distribution of Estimated New Cases and Deaths forCancers, Females, Canada, 2007

8/14/2019 Years Lost by Disease
http://slidepdf.com/reader/full/years-lost-by-disease 18/116

8/14/2019 Years Lost by Disease
http://slidepdf.com/reader/full/years-lost-by-disease 19/116
T able 2 presents population projections and estimates of new all cancers combined, by sex and province or territory for 20
present estimates of the number of new cases and the age-standarfor each of the most common cancers, by sex and province/territoage-standardized estimates take into consideration the differencesterritorial age distributions, thus facilitating inter-provincial compTables 5 and 6 present estimates of the number of deaths and themortality rates for each of the most common cancers, by sex and2007. The calculation of age-standardized rates using the 1991 Cthe standard is described in the Glossary, and in more detail inAdjustments were necessary for estimated incident cases in most Tables A3 to A6 in Appendix I provide the most recent actual d provinces/territories.
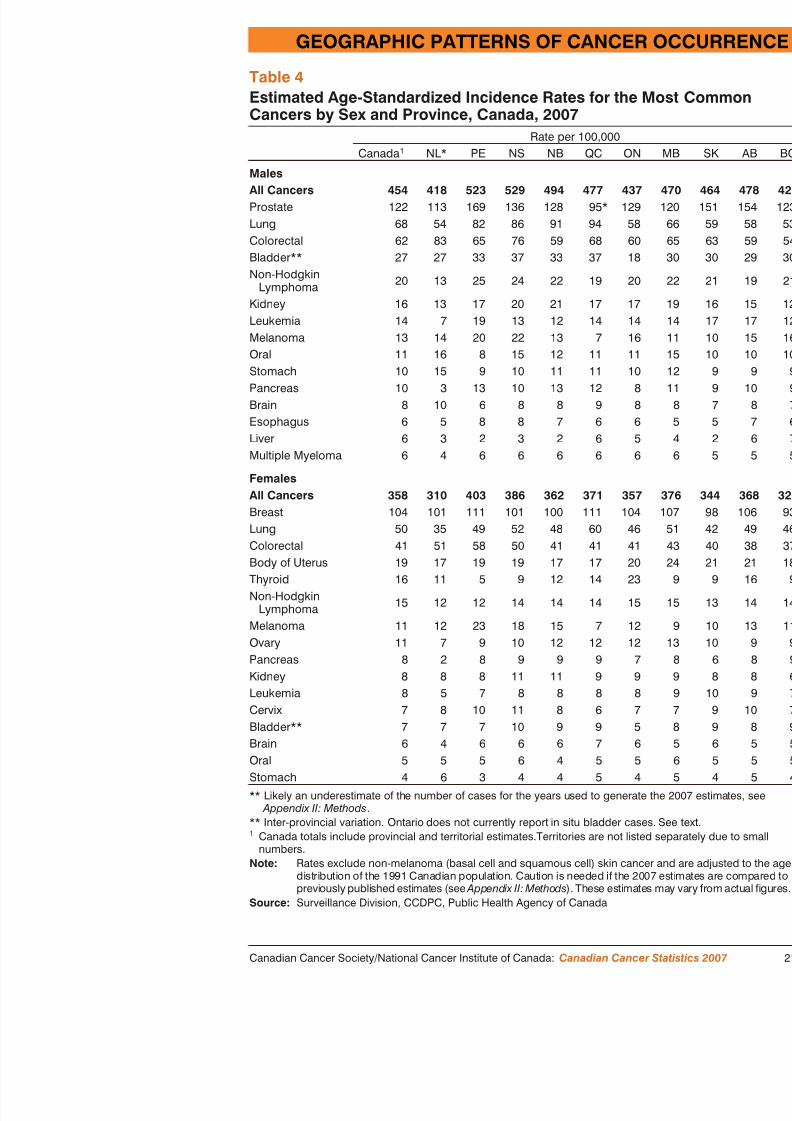
Although the incidence rates of some cancers (e.g., breast) appearconsistent across jurisdictions, the rates of others (e.g., prostate, lumore widely. Overall cancer mortality rates are higher in Atlanticand lowest in British Columbia. A similar pattern was observed fdiscounting the effects of undercounting in Newfoundland and La prostate cancer (which shows large provincial differences due to screening).
Data on provincial/territorial numbers and rates of incident cancedeaths provide valuable information for research, knowledge synt
decision-making at the provincial/territorial level. These data are to researchers, health care workers, planners and policy-makers. Iwill be used for inter-provincial comparisons.
Inter-provincial differences in rates may reflect true underlying dof developing or dying of cancer, which in turn may reflect diffe prevalence of risk factors. For example, historically high tobaccoeastern Canada has contributed to current lung cancer rates that aregions than in other parts of Canada. Lower socio-economic statassociated with higher cancer mortality in general, and with increcertain cancers (e.g., cervical) but decreased incidence of breast cdifferences in socio-economic status may influence regional diffe
H i t i i l i ti t b i t t d ith
GEOGRAPHIC PATTERNS OF CANCER OC

8/14/2019 Years Lost by Disease
http://slidepdf.com/reader/full/years-lost-by-disease 20/116
Fourth, the availability of and the completeness of coverage in target poscreening programs (e.g., for breast and cervical cancer), or of screeninthe absence of formal screening programs (e.g., prostate cancer) differ a provinces/territories. This will result in cancer incidence rates that will elevated through the identification of previously undiagnosed cases in aindividuals (e.g., breast cancer), or reduced through the identification an pre-malignant lesions (e.g., cervical cancer), or permanently elevated byidentification of cancers which would otherwise never be detected (e.g.cancer). As well, the availability of diagnostic procedures may differ re
Finally, there are differences in the reporting procedures used in cancer (e.g., registration of second primary cancers and use of death certificate Appendix II regarding cancer registry methodology). For example, deatinformation has not been available for registry purposes in NewfoundlaLabrador until now, and this falsely lowers the number of incident caseexpectancy, such as cases of lung and pancreatic cancer. The degree to certificate information is actively followed back to hospital records also
different provinces/territories, and this affects the accuracy of incidenceQuebec, because of the registry’s dependence on hospital data, the num prostate, melanoma and bladder cases have been estimated to be underr32%, 35% and 14% respectively. 5 Those who maintain the Quebec tuaware of this and are taking steps to correct the problem. The large intedifferences seen in bladder cancer incidence rates are likely due to differeporting of in situ cases, particularly in Ontario, where in situcase
Even with these cautions, it should be noted that Canada is one of the fwhere cancer patterns can be monitored for the whole population. The pterritorial and national cancer registries are important resources for makcomparisons that generate hypotheses warranting further investigation. Tthat cause these real differences are not well understood, but may includetection of cancer by well-established, population-based screening pro
or more accessible treatment in some regions, clustering of risk factors or region, or increased penetration of a risk factor in a population (e.g.,smoking rates in Quebec and Atlantic Canada). Where true differences and causal associations are demonstrated in subsequent epidemiologic sfindings can be used in planning cancer control programs that aim to reb d f b i d
GEOGRAPHIC PATTERNS OF CANCER OCCURREN

8/14/2019 Years Lost by Disease
http://slidepdf.com/reader/full/years-lost-by-disease 21/116
GEOGRAPHIC PATTERNS OF CANCER OC
Table 2Estimated Population, New Cases and Deaths for All Cancers b
Geographic Region, Canada, 2007Population (000s)2007 Estimates 1
New Cases2007 Estimates 2
Total M F Total M
Canada 32,822 16,251 16,571 159,900 82,700 77,200 7
Newfoundland andLabrador* 515 252 262 2,400 1,300 1,100
Prince EdwardIsland 139 68 71 820 430 380
Nova Scotia 941 461 480 5,600 3,000 2,600
New Brunswick 754 372 382 4,200 2,200 1,950
Quebec 7,684 3,795 3,889 41,000 20,900 20,100Ontario 12,822 6,329 6,493 59,500 30,300 29,200
Manitoba 1,189 591 598 6,000 3,100 2,900
Saskatchewan 989 491 498 5,000 2,700 2,300
Alberta 3,333 1,682 1,650 14,500 7,700 6,800
British Columbia 4,351 2,156 2,195 20,600 10,900 9,700
Yukon 31 16 15 110 60 50
Northwest Territories 44 23 21 100 50 50
Nunavut 30 16 15 65 30 35
* Likely an underestimate of the number of cases for the years used to generate the 2007 e
Appendix II: Methods .1 2007 population projections were provided by the Census and Demographics Branch, St2 Figures exclude non-melanoma (basal cell and squamous cell) skin cancer.Note: Total of rounded numbers may not equal rounded total number. Please refer toSource: Surveillance Division, CCDPC, Public Health Agency of Canada

8/14/2019 Years Lost by Disease
http://slidepdf.com/reader/full/years-lost-by-disease 22/116
8/14/2019 Years Lost by Disease
http://slidepdf.com/reader/full/years-lost-by-disease 23/116
GEOGRAPHIC PATTERNS OF CANCER OC
Table 4Estimated Age-Standardized Incidence Rates for the Most ComCancers by Sex and Province, Canada, 2007
Rate per 100,000Canada 1 NL* PE NS NB QC ON
MalesAll Cancers 454 418 523 529 494 477 437Prostate 122 113 169 136 128 95* 129Lung 68 54 82 86 91 94 58
Colorectal 62 83 65 76 59 68 60Bladder** 27 27 33 37 33 37 18Non-Hodgkin
Lymphoma 20 13 25 24 22 19 20
Kidney 16 13 17 20 21 17 17Leukemia 14 7 19 13 12 14 14Melanoma 13 14 20 22 13 7 16Oral 11 16 8 15 12 11 11Stomach 10 15 9 10 11 11 10Pancreas 10 3 13 10 13 12 8Brain 8 10 6 8 8 9 8Esophagus 6 5 8 8 7 6 6Liver 6 3 2 3 2 6Multiple Myeloma 6 4 6 6 6 6 6
FemalesAll Cancers 358 310 403 386 362 371 357Breast 104 101 111 101 100 111 104Lung 50 35 49 52 48 60 46Colorectal 41 51 58 50 41 41 41Body of Uterus 19 17 19 19 17 17 20Thyroid 16 11 5 9 12 14 23
Non-HodgkinLymphoma 15 12 12 14 14 14 15
Melanoma 11 12 23 18 15 7 12Ovary 11 7 9 10 12 12 12Pancreas 8 2 8 9 9 9 7Kidney 8 8 8 11 11 9 9
GEOGRAPHIC PATTERNS OF CANCER OCCURREN

8/14/2019 Years Lost by Disease
http://slidepdf.com/reader/full/years-lost-by-disease 24/116
GEOGRAPHIC PATTERNS OF CANCER OCCURREN
Table 5Estimated Deaths for the Most Common Cancers by Sex and ProvinceCanada, 2007
DeathsCanada 1 NL PE NS NB QC ON MB
MalesAll Cancers 38,400 760 180 1,400 1,050 10,400 14,000 1,400 1,300Lung 11,000 240 65 430 360 3,600 3,600 350Colorectal 4,700 110 25 180 120 1,300 1,750 180
Prostate 4,300 80 20 150 130 890 1,650 170Pancreas 1,750 30 5 70 50 450 620 65Non–Hodgkin
Lymphoma 1,700 15 5 60 45 400 670 70
Leukemia 1,400 15 5 45 30 300 560 55Esophagus 1,300 20 5 50 30 240 520 55Bladder 1,250 25 5 45 30 290 490 50Stomach 1,150 40 5 35 25 330 420 35Kidney 1,000 20 5 40 30 260 350 50Brain 980 20 – 35 25 290 340 30Oral 740 15 5 30 20 190 270 25Melanoma 560 5 – 20 10 100 280 20Multiple Myeloma 530 5 5 25 15 130 210 20Liver 510 5 – 5 5 160 210 25
FemalesAll Cancers 34,300 600 160 1,200 870 9,100 12,900 1,300 1,10Lung 8,900 140 50 350 190 2,600 3,200 290Breast 5,300 100 25 200 130 1,400 2,000 210Colorectal 4,000 95 25 170 100 1,100 1,500 160Pancreas 1,850 25 10 65 50 480 690 70Ovary 1,700 35 5 55 40 370 670 65
Non–HodgkinLymphoma 1,400 20 5 40 35 330 570 60
Leukemia 980 10 5 30 20 230 390 40Body of Uterus 740 10 5 30 15 190 300 30Brain 740 10 5 25 20 220 250 25Stomach 730 25 – 20 15 220 250 30
GEOGRAPHIC PATTERNS OF CANCER OC

8/14/2019 Years Lost by Disease
http://slidepdf.com/reader/full/years-lost-by-disease 25/116
GEOGRAPHIC PATTERNS OF CANCER OC
Table 6Estimated Age-Standardized Mortality Rates for the Most ComCancers by Sex and Province, Canada, 2007
Rate per 100,000Canada 1 NL PE NS NB QC ON
MalesAll Cancers 212 253 229 248 239 241 204 2Lung 61 76 79 77 81 83 52Colorectal 26 36 31 31 26 30 25
Prostate 25 29 27 27 30 22 24Pancreas 9 10 9 12 11 10 9Non-Hodgkin
Lymphoma 9 6 8 11 11 9 10
Leukemia 8 6 8 8 7 7 8Esophagus 7 6 8 9 6 5 7Bladder 7 9 6 8 7 7 7Stomach 6 13 8 6 6 8 6Brain 5 6 2 6 5 7 5Kidney 5 7 8 7 6 6 5Oral 4 6 5 5 4 4 4Melanoma 3 2 3 4 2 2 4Multiple Myeloma 3 2 5 4 3 3 3Liver 3 2 1 1 1 4 3
FemalesAll Cancers 148 161 153 169 151 156 146 1Lung 40 39 53 50 35 47 38Breast 23 27 27 27 23 24 23Colorectal 16 25 23 22 17 18 16Pancreas 8 7 8 9 8 8 8Ovary 7 9 6 8 7 6 8Non-Hodgkin
Lymphoma 6 5 7 6 6 6 6
Brain 4 4 4 4 4 4 3Leukemia 4 3 4 4 3 4 4Stomach 3 7 1 3 3 4 3Body of Uterus 3 3 3 4 3 3 3
TRENDS IN INCIDENCE AND MORTALITY
8/14/2019 Years Lost by Disease
http://slidepdf.com/reader/full/years-lost-by-disease 26/116
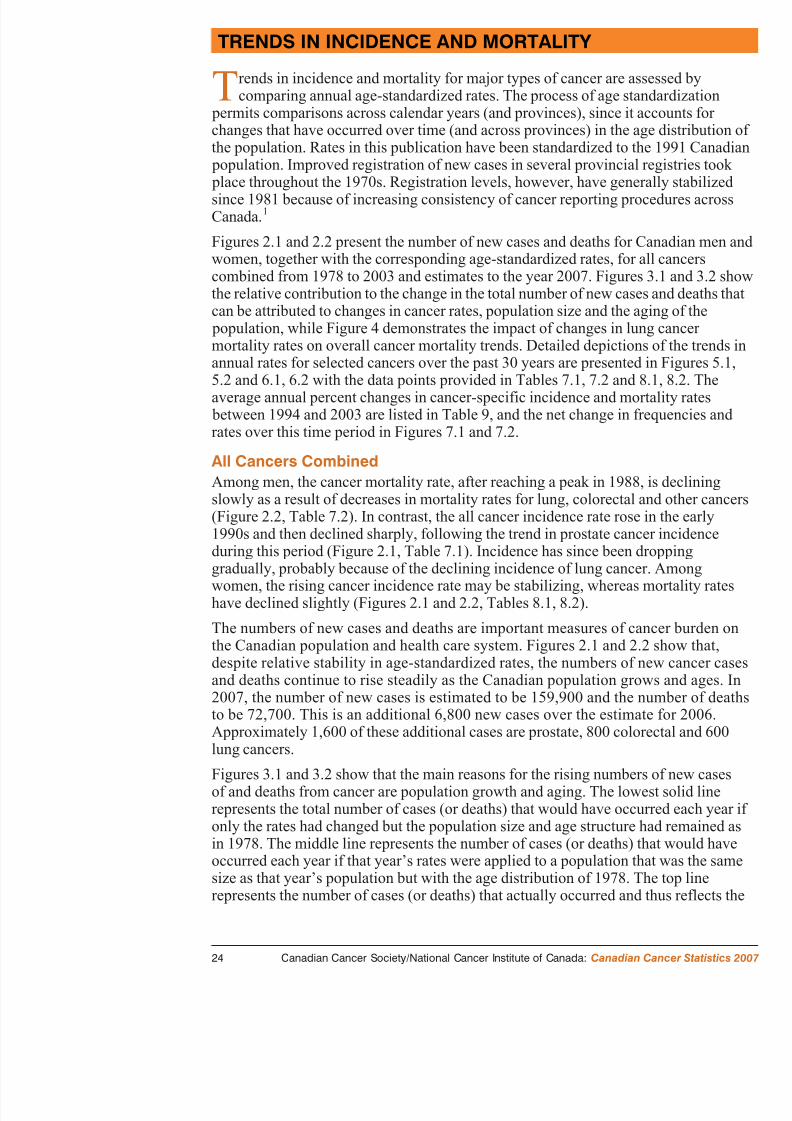
T rends in incidence and mortality for major types of cancer are assecomparing annual age-standardized rates. The process of age standa
permits comparisons across calendar years (and provinces), since it accchanges that have occurred over time (and across provinces) in the age the population. Rates in this publication have been standardized to the 1 population. Improved registration of new cases in several provincial reg place throughout the 1970s. Registration levels, however, have generallsince 1981 because of increasing consistency of cancer reporting procedCanada. 1
Figures 2.1 and 2.2 present the number of new cases and deaths for Canwomen, together with the corresponding age-standardized rates, for all ccombined from 1978 to 2003 and estimates to the year 2007. Figures 3the relative contribution to the change in the total number of new cases acan be attributed to changes in cancer rates, population size and the agin population, while Figure 4 demonstrates the impact of changes in lung mortality rates on overall cancer mortality trends. Detailed depictions o
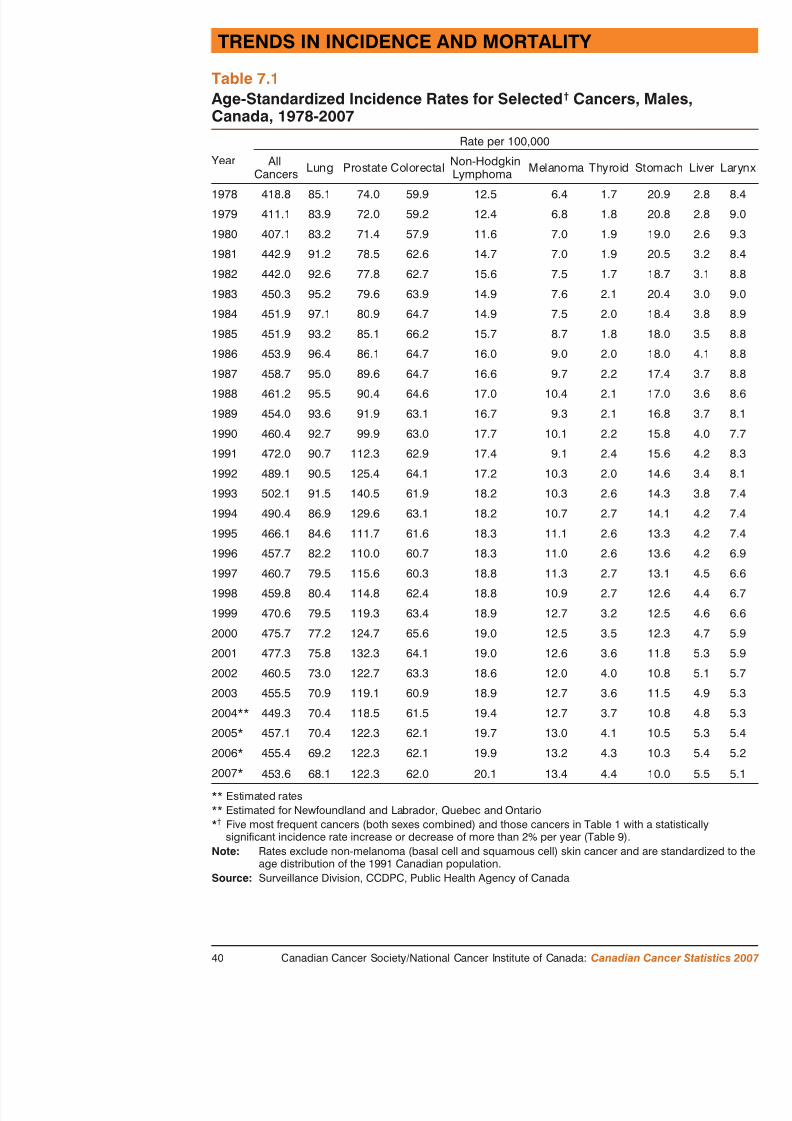
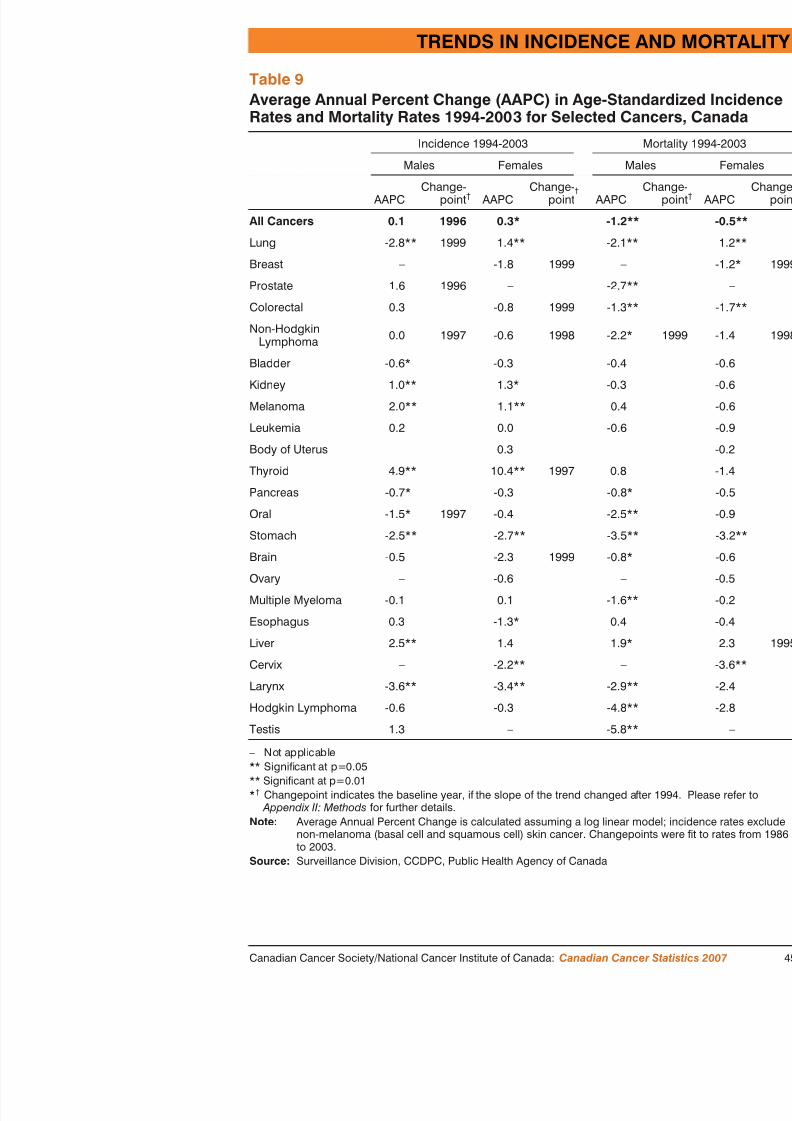
annual rates for selected cancers over the past 30 years are presented in5.2 and 6.1, 6.2 with the data points provided in Tables 7.1, 7.2 and 8.1average annual percent changes in cancer-specific incidence and mortal between 1994 and 2003 are listed in Table 9, and the net change in freqrates over this time period in Figures 7.1 and 7.2.
All Cancers Combined
Among men, the cancer mortality rate, after reaching a peak in 1988, isslowly as a result of decreases in mortality rates for lung, colorectal and(Figure 2.2, Table 7.2). In contrast, the all cancer incidence rate rose in1990s and then declined sharply, following the trend in prostate cancer during this period (Figure 2.1, Table 7.1). Incidence has since been dropgradually, probably because of the declining incidence of lung cancer. Awomen, the rising cancer incidence rate may be stabilizing, whereas mo
have declined slightly (Figures 2.1 and 2.2, Tables 8.1, 8.2).The numbers of new cases and deaths are important measures of cancthe Canadian population and health care system. Figures 2.1 and 2.2 sdespite relative stability in age-standardized rates, the numbers of new
d d th ti t i t dil th C di l ti g
TRENDS IN INCIDENCE AND MORTALITY
TRENDS IN INCIDENCE A

8/14/2019 Years Lost by Disease
http://slidepdf.com/reader/full/years-lost-by-disease 27/116
combined impact of rate change, population growth and the agingAn important implication is that as the Canadian population contin size, there will be a corresponding increase in the numbers of each year unless a major drop in cancer rates occurs. Decreasing cardiovascular disease as the major competing cause of death conincreasing numbers of patients with cancer.
Figure 4 plots an index (see definition in Glossary) of age-stafrom 1978 to 2007 for all cancers combined and for all cancers eThe different pattern in males compared to females is striking an
different state of the lung cancer epidemic in the two sexes (tailinstill having a major impact in females) and partly different mortaimportant cancers (10% lower than 1978 for men and 20% lowercancer mortality trend in males largely reflects the trend in lung two lines are very close through the time period): the declining rsince 1988 is predominantly due to dropping lung cancer mortalihowever, the lung cancer mortality rate is still increasing. Thus,
mortality rate that has been essentially stable since 1978 concealdecline that has occurred for other types of cancer over the 30 yelines diverge).
Trends for Selected CancersThe cancers included in Figures 5.1, 5.2, 6.1 and 6.2 and Tables are those that are most common (lung, breast, prostate, colorectal
lymphoma) plus others from Table 1 that exhibit significantly inctrends in their rates of at least 2% per year over the period 1994-
Incidence rates for only 3 of the 23 cancers included in Table 1 hstatistically significant annual increases of 2% or more for either between 1994 and 2003 (Tables 7.1, 8.1 and 9; Figure 5.1 and 6.liver cancer in males, and thyroid cancer in both sexes. During thincidence rates for 4 cancers have decreased significantly by 2% lung cancer in males (since 1999), stomach and larynx cancers incervical cancer. In contrast, mortality rates have declined for almcancers (Table 9) in both sexes. Exceptions are lung cancer in femmortality rate rose significantly by 1.2% per year, and liver cancer
) St ti ti ll ig ifi t d f 2% ll
TRENDS IN INCIDENCE A

8/14/2019 Years Lost by Disease
http://slidepdf.com/reader/full/years-lost-by-disease 28/116
TRENDS IN INCIDENCE A

8/14/2019 Years Lost by Disease
http://slidepdf.com/reader/full/years-lost-by-disease 29/116
Colorectal cancer:
N In both males and females, incidence rates were stable throug
2003. Prior to 1994, incidence had been increasing slightly inslightly in women.N Mortality rates continue to decline in both sexes, by 1.3% and
men and women, respectively; both are statistically significanfrom improvements in treatment, specifically chemotherapy.
N Screening for colorectal cancer can reduce both incidence and
Opportunistic screening has been occurring in many provincesaccount for some of the mortality decline. Many provinces arehave recently announced establishment of colorectal cancer scfor example Ontario and Manitoba.
Non-Hodgkin lymphoma:
N In both males and females, incidence rates increased by about
and late 1990s. Since that time they have stabilized. Mortalitysimilar pattern, although a statistically significant decline (2.2for males since 1999 (Table 9).
N The reasons for the increasing incidence likely represent a comimproved detection and classification of this complex set of din risk factors. The clearest risk factor for NHL is immunosucan result from immune disorders, immunosuppressive therapyimmunodeficiency virus (HIV)). Other factors that increase risunderstood, but may include occupational exposures to pesticiorganochlorines such as phenoxy herbicides and dioxins. 1
Other types of cancer:
N Incidence rates for kidney cancer increased significantly (by
year in males and females respectively) between 1994 and 200rates remained stable. Increasing incidence is partly due to immay also be related to the rising prevalence of obesity, which for renal cell carcinoma, the major type of kidney cancer.
N Melanomaincidence continues to increase particularly in me
TRENDS IN INCIDENCE A

8/14/2019 Years Lost by Disease
http://slidepdf.com/reader/full/years-lost-by-disease 30/116
TRENDS IN INCIDENCE A

8/14/2019 Years Lost by Disease
http://slidepdf.com/reader/full/years-lost-by-disease 31/116
We have to plan for that part of number of cancer cases which is unmust do a much better job of prim
those cancers which are amen
TRENDS IN INCIDENCE AND MORTALITY

8/14/2019 Years Lost by Disease
http://slidepdf.com/reader/full/years-lost-by-disease 32/116
ASIR (per 100,000) Males
New Cases ASIR
1978 1982 1987 1992 1997 20
600
500
400
300
200
100
ASIR (per 100,000)Females
600
500
400
Figure 2.1New Cases and Age-Standardized Incidence Rates (ASIR) for AllCancers, Canada, 1978-2007
TRENDS IN INCIDENCE A

8/14/2019 Years Lost by Disease
http://slidepdf.com/reader/full/years-lost-by-disease 33/116
ASMR (per 100,000)
Deaths ASMR
Males
ASMR (per 100,000)Females
600
500
400
300
200
100
600
500
400
1978 1982 1987 1992 1997
Figure 2.2Deaths and Age-Standardized Mortality Rates (ASMR) for All Canada, 1978-2007
TRENDS IN INCIDENCE AND MORTALITY

8/14/2019 Years Lost by Disease
http://slidepdf.com/reader/full/years-lost-by-disease 34/116
Age Distrib
Population Gr
Cases (000s)Incidence
1978 1983 1988 1993 1998 0
70
80
90
60
50
40
30
20
10
Rate Change
Year
Age Distribution
MortalityDeaths (000s)
35
40
30
25Population Growth
Figure 3.1Trends in New Cases and Deaths, Attributed to Cancer Rate, PopulatioGrowth, and Population Age Distribution, All Cancers, All Ages, MalCanada, 1978-2007

8/14/2019 Years Lost by Disease
http://slidepdf.com/reader/full/years-lost-by-disease 35/116

8/14/2019 Years Lost by Disease
http://slidepdf.com/reader/full/years-lost-by-disease 36/116
TRENDS IN INCIDENCE AND MO

8/14/2019 Years Lost by Disease
http://slidepdf.com/reader/full/years-lost-by-disease 37/116
Males
1978 1982 1987 1992 1997
1.15
1.10
1.05
1.00
0.95
0.90
0.85
0.80
All canExcluding lung cancer
Females
1.15
1.10
1.05
1.00
0.95
1978 = 1.0
1978 = 1.0
Figure 4Relative Change in Age-Standardized Mortality Rates IncludingExcluding Lung Cancer, Canada, 1978-2007*

8/14/2019 Years Lost by Disease
http://slidepdf.com/reader/full/years-lost-by-disease 38/116
TRENDS IN INCIDENCE A

8/14/2019 Years Lost by Disease
http://slidepdf.com/reader/full/years-lost-by-disease 39/116
Lung
Prostate
Colorectal
Stomach
1980 1983 1986 1989 1992 1995 1998 0
20
40
50
60
70
80
90
10
30
10
15
20
Males
Males
ASMR (per 100,000)
ASMR (per 100,000)
Figure 5.2Age-Standardized Mortality Rates (ASMR) for Selected CanceCanada, 1978-2007
TRENDS IN INCIDENCE AND MORTALITY

8/14/2019 Years Lost by Disease
http://slidepdf.com/reader/full/years-lost-by-disease 40/116
0
20
40
60
80
100
120
140
1980 1983 1986 1989 1992 1995 1998 2001
15
20
25
30
Females
Females
Breast
Lung
Colorectal
CervixN H d ki L h
ASIR (per 100,000)
ASIR (per 100,000)
Figure 6.1Age-Standardized Incidence Rates (ASIR) for Selected Cancers, FemCanada, 1978-2007

8/14/2019 Years Lost by Disease
http://slidepdf.com/reader/full/years-lost-by-disease 41/116
TRENDS IN INCIDENCE AND MORTALITY
8/14/2019 Years Lost by Disease
http://slidepdf.com/reader/full/years-lost-by-disease 42/116
Table 7.1Age-Standardized Incidence Rates for Selected † Cancers, MCanada, 1978-2007
Year
Rate per 100,000
AllCancers Lung Prostate Colorectal Non-Hodgkin
Lymphoma Melanoma Thyroid S
1978 418.8 85.1 74.0 59.9 12.5 6.4 1.7 2
1979 411.1 83.9 72.0 59.2 12.4 6.8 1.8 2
1980 407.1 83.2 71.4 57.9 11.6 7.0 1.9 1
1981 442.9 91.2 78.5 62.6 14.7 7.0 1.9 2
1982 442.0 92.6 77.8 62.7 15.6 7.5 1.7 1
1983 450.3 95.2 79.6 63.9 14.9 7.6 2.1 2
1984 451.9 97.1 80.9 64.7 14.9 7.5 2.0 1
1985 451.9 93.2 85.1 66.2 15.7 8.7 1.8 1
1986 453.9 96.4 86.1 64.7 16.0 9.0 2.0 1
1987 458.7 95.0 89.6 64.7 16.6 9.7 2.2 1
1988 461.2 95.5 90.4 64.6 17.0 10.4 2.1 1
1989 454.0 93.6 91.9 63.1 16.7 9.3 2.1 1
1990 460.4 92.7 99.9 63.0 17.7 10.1 2.2 1
1991 472.0 90.7 112.3 62.9 17.4 9.1 2.4 1
1992 489.1 90.5 125.4 64.1 17.2 10.3 2.0 1
1993 502.1 91.5 140.5 61.9 18.2 10.3 2.6 1
1994 490.4 86.9 129.6 63.1 18.2 10.7 2.7 1
1995 466.1 84.6 111.7 61.6 18.3 11.1 2.6 1
1996 457.7 82.2 110.0 60.7 18.3 11.0 2.6 1
1997 460.7 79.5 115.6 60.3 18.8 11.3 2.7 1
1998 459.8 80.4 114.8 62.4 18.8 10.9 2.7 1
1999 470.6 79.5 119.3 63.4 18.9 12.7 3.2 1
2000 475.7 77.2 124.7 65.6 19.0 12.5 3.5 1
2001 477.3 75.8 132.3 64.1 19.0 12.6 3.6 1
2002 460.5 73.0 122.7 63.3 18.6 12.0 4.0 1
TRENDS IN INCIDENCE A

8/14/2019 Years Lost by Disease
http://slidepdf.com/reader/full/years-lost-by-disease 43/116
Table 7.2Age-Standardized Mortality Rates for Selected † Canc1978-2007
Year
Rate per 100,000
AllCancers Lung Prostate Colorectal Non-Hodgkin
Lymphoma Oral S
1978 236.4 70.1 26.1 32.9 5.9 6.5 16
1979 239.4 71.7 26.7 31.8 5.9 6.2 18
1980 240.7 74.0 25.8 32.3 7.0 5.5 15
1981 239.2 73.2 27.1 32.2 6.9 5.6 15
1982 243.5 77.4 26.0 31.9 6.8 6.0 14
1983 242.9 78.4 26.7 31.8 7.2 6.1 14
1984 247.9 80.2 27.4 32.4 7.0 5.8 13
1985 249.0 78.0 28.9 33.4 7.1 6.2 13
1986 249.0 79.0 29.4 32.0 7.7 6.2 13
1987 248.2 78.6 29.4 32.0 7.1 5.9 12
1988 254.8 81.3 30.7 32.4 7.8 5.8 12
1989 249.6 81.1 29.7 31.9 7.7 5.9 12
1990 246.5 79.6 30.1 30.9 7.9 5.6 11
1991 247.2 78.8 31.2 30.4 8.1 6.0 10
1992 244.7 77.6 31.0 31.1 8.1 5.4 10
1993 242.8 77.9 31.1 29.7 7.7 5.6 9
1994 241.8 75.6 30.7 30.3 8.4 5.3 9
1995 239.0 73.3 31.0 30.2 8.4 5.1 9
1996 236.5 73.0 29.0 29.5 8.4 5.0 9
1997 232.3 70.6 28.7 29.0 8.7 5.0 9
1998 230.5 70.3 28.0 28.9 8.9 4.7 8
1999 229.4 70.4 26.9 28.5 9.2 4.7 8
2000 225.4 64.4 26.8 28.5 9.0 3.9 8
2001 224.0 64.6 26.7 27.1 9.1 4.6 7
2002 219.9 64.5 25.0 27.7 8.5 4.7 7
TRENDS IN INCIDENCE AND MORTALITY

8/14/2019 Years Lost by Disease
http://slidepdf.com/reader/full/years-lost-by-disease 44/116
Table 8.1Age-Standardized Incidence Rates for Selected † Cancers, FCanada, 1978-2007
Year
Rate per 100,000
AllCancers Lung Breast Colorectal Non-Hodgkin
Lymphoma Thyroid Stoma
1978 319.7 20.1 86.1 50.2 9.2 4.8 9.5
1979 314.1 20.3 87.3 49.7 9.6 4.7 9.2
1980 305.8 21.7 83.3 47.4 8.8 4.4 8.6
1981 328.3 24.3 86.5 48.6 11.6 4.6 9.8
1982 321.3 25.9 86.0 48.9 11.7 4.5 8.7
1983 333.2 28.3 89.3 50.2 11.5 4.8 8.7
1984 329.9 29.6 90.4 48.9 11.3 4.9 8.1
1985 336.1 30.9 92.2 50.6 11.4 5.3 8.0
1986 325.5 31.7 88.6 48.2 11.3 5.2 8.3
1987 331.4 33.2 91.1 47.6 11.5 5.2 8.0
1988 336.8 34.8 97.8 46.1 11.7 5.1 7.2
1989 330.7 35.0 96.4 45.3 12.2 5.6 7.2
1990 333.9 36.5 96.0 45.7 12.1 5.8 6.9
1991 337.7 37.7 100.1 44.1 12.4 5.9 6.4
1992 343.3 39.7 101.9 44.2 12.6 6.9 6.5
1993 342.9 40.7 99.1 44.2 12.7 7.1 6.3
1994 343.3 39.8 98.9 43.6 13.3 7.7 6.3
1995 341.6 40.8 98.9 42.5 13.1 7.7 6.0
1996 339.5 42.0 98.6 41.1 13.1 7.8 6.0
1997 343.6 42.0 102.1 41.6 13.8 7.9 5.5
1998 351.4 43.7 103.2 43.9 14.0 8.2 5.6
1999 352.1 43.6 105.1 43.2 13.5 9.4 5.3
2000 354.2 45.1 101.6 44.5 13.8 10.4 5.5
2001 348.7 44.6 99.6 43.2 13.3 11.2 5.1
2002 354.2 45.0 101.5 43.0 13.5 13.2 5.2
TRENDS IN INCIDENCE A

8/14/2019 Years Lost by Disease
http://slidepdf.com/reader/full/years-lost-by-disease 45/116
Table 8.2Age-Standardized Mortality Rates for Selected † CancCanada, 1978-2007
Year
Rate per 100,000
All Cancers Lung Breast Colorectal Non-HodgkLymphom
1978 147.6 15.0 29.5 25.1 4.5
1979 150.2 16.3 29.8 26.1 4.4
1980 148.5 17.1 29.7 25.3 4.6
1981 149.0 17.9 30.1 24.4 4.51982 149.3 19.6 29.7 23.5 4.9
1983 149.4 19.9 30.4 23.1 4.9
1984 151.9 22.2 30.7 23.8 4.7
1985 154.8 23.8 31.8 23.7 5.0
1986 154.4 24.0 32.0 23.5 5.1
1987 154.0 25.3 31.3 23.0 5.2
1988 155.4 26.9 31.4 22.7 5.0
1989 153.1 27.0 31.2 21.3 5.5
1990 153.1 27.6 31.3 21.3 5.5
1991 153.5 29.5 30.1 20.7 5.7
1992 153.1 29.6 30.4 20.2 5.5
1993 154.8 31.7 29.4 20.3 5.5
1994 155.1 31.9 30.0 19.9 5.7
1995 152.0 31.4 28.7 19.8 5.9
1996 155.2 33.7 28.9 19.7 5.8
1997 150.3 32.7 27.7 18.8 5.8
1998 151.3 34.6 26.4 19.3 6.0
1999 149.8 34.9 25.2 18.6 5.7
2000 149.8 34.4 25.1 18.2 6.1
2001 148.2 34.4 25.0 17.8 5.7
2002 149.3 35.3 24.4 17.7 5.7

8/14/2019 Years Lost by Disease
http://slidepdf.com/reader/full/years-lost-by-disease 46/116
TRENDS IN INCIDENCE A
T bl 9
8/14/2019 Years Lost by Disease
http://slidepdf.com/reader/full/years-lost-by-disease 47/116
Table 9Average Annual Percent Change (AAPC) in Age-Standardized IRates and Mortality Rates 1994-2003 for Selected Cancers, Can
Incidence 1994-2003 M
Males Females Mal
AAPCChange-
point † AAPCChange-
point†
AAPC
All Cancers 0.1 1996 0.3* -1.2**
Lung -2.8** 1999 1.4** -2.1**
Breast – -1.8 1999 –
Prostate 1.6 1996 – -2.7**
Colorectal 0.3 -0.8 1999 -1.3**
Non-HodgkinLymphoma 0.0 1997 -0.6 1998 -2.2*
Bladder -0.6* -0.3 -0.4
Kidney 1.0** 1.3* -0.3
Melanoma 2.0** 1.1** 0.4
Leukemia 0.2 0.0 -0.6
Body of Uterus – 0.3 –
Thyroid 4.9** 10.4** 1997 0.8
Pancreas -0.7* -0.3 -0.8*
Oral -1.5* 1997 -0.4 -2.5**
Stomach -2.5** -2.7** -3.5**
Brain -0.5 -2.3 1999 -0.8*
Ovary – -0.6 –
Multiple Myeloma -0.1 0.1 -1.6**
Esophagus 0.3 -1.3* 0.4
Liver 2.5** 1.4 1.9*
Cervix – -2.2** –
TRENDS IN INCIDENCE AND MORTALITY
Figure 7 1

8/14/2019 Years Lost by Disease
http://slidepdf.com/reader/full/years-lost-by-disease 48/116
-30 -20 -10 0 10 20 30 40 50 60 70
LarynxOral
StomachLung
Hodgkin Lymphoma
BladderPancreas
Brain
Leukemia
Multiple Myeloma
Esophagus
Colorectal
Prostate
KidneyNon-Hodgkin Lymphoma
Melanoma
Testis
Decrease Males
Thyroid
Percentage
Decrease Females
Hodgkin Lymphoma
Leukemia
Breast
Bladder
Body of Uterus
Non-Hodgkin Lymphoma
KidneyLung
Melanoma
Thyroid
Liver
Liver
Figure 7.1Percent Change in Cancer Incidence Burden (total number of new caseand Risk (age-standardized incidence rates), for Selected Cancers,
Canada, between 1994 and 2003
TRENDS IN INCIDENCE A
Figure 7 2

8/14/2019 Years Lost by Disease
http://slidepdf.com/reader/full/years-lost-by-disease 49/116
Larynx
Lung
Stomach
Prostate
Multiple Myeloma
Hodgkin Lymphoma
Pancreas
Leukemia
KidneyNon-Hodgkin Lymphoma
Bladder
Testis
Oral
Colorectal
Melanoma
Esophagus
ThyroidDecrease
Males
Percentage
Decrease
-40 -20 -10 0 10 20
Brain
ThyroidBody of Uterus
Ovary
Melanoma
Leukemia
Kidney
Non-Hodgkin Lymphoma
Multiple Myeloma
Lung
Pancreas
-30
Liver
Liver
Females
Figure 7.2Percent Change in Cancer Mortality Burden (total number of deRisk of Death (age-standardized mortality rates), for Selected C
Canada, between 1994 and 2003
C ancer is primarily a disease of older Canadians The estimates for
AGE AND SEX DISTRIBUTION OF CANCER

8/14/2019 Years Lost by Disease
http://slidepdf.com/reader/full/years-lost-by-disease 50/116
C ancer is primarily a disease of older Canadians. The estimates for Table 10 indicate that 70,000 new cases (44%) and 44,000 cancer
will occur in Canadians aged 70 years or more, while an additional 41,0
(25%) and 16,000 deaths (22%) will occur in those aged 60-69. In cont1% of new cases and deaths occur prior to age 20. The median age at cis between 65 and 69 years of age and at death between 70 and 74 for bo
It is important to note though, that 48,000 new cases (30%) and 13,000will occur between ages 20 and 59. These are the most productive yearment and raising families. As well, increasing numbers of those over 65work and made up over 2% of the work force in the 2001 census. 18
has an enormous potential impact on the social fabric and economy of C
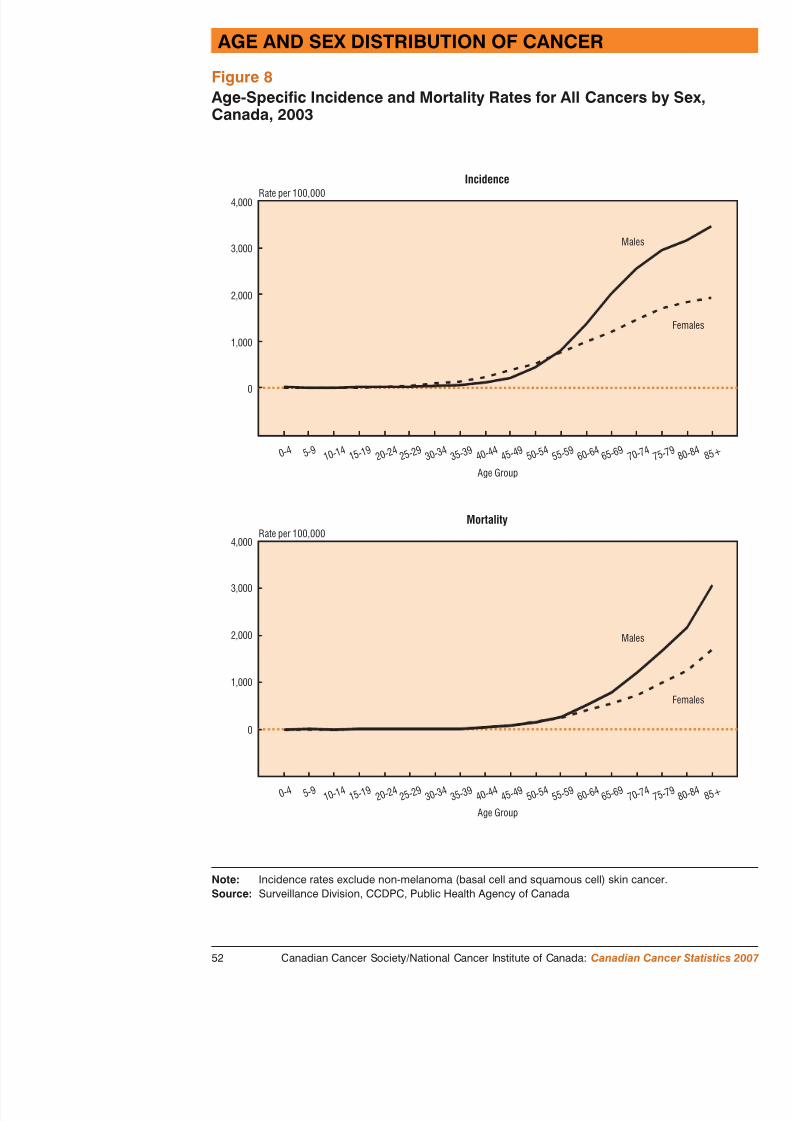
Figure 8 displays age-specific rates of cancer incidence and mortality bgroups for 2003, the most recent year for which complete data are availincidence and mortality rates increase substantially with age in both sexincidence rates are higher for men than women, except between the agemortality rates for men are higher except between ages 25 to 54. The m
particularly great at older ages.The age and sex distributions for the most common cancers in Canadian presented in Table 11. More than half of all newly diagnosed lung and cancers and 47% of prostate cancers will occur among Canadians aged contrast, only 29% of breast cancers are diagnosed at age 70 or later, win women under age 50. It is notable that although the largest number o breast cancer is estimated to occur between age 50 and 59, more deathscancer will occur in the over-80 age group, reflecting the benefits of sctreatment in middle-aged women (see Special Topic). Likewise, theof prostate cancer occur in men between 60 and 79, but more prostate coccur in the 80+ age group. This pattern likely reflects the effect of scryounger men and the long natural history of the disease in many.
Trends in age-standardized incidence and mortality rates for all cancerseight age groups in Figure 9 (Note that each age group has a different saxis because of the wide range in age-specific rates). The female excessincidence and mortality in the age groups 20-29, 30-39, and 40-49 is paobvious. This is largely due to breast cancer, which is the most common
f d th i i th g g ti g f
occurrence. The impact of increased use of the prostate-specific a
AGE AND SEX DISTRIBUTIO

8/14/2019 Years Lost by Disease
http://slidepdf.com/reader/full/years-lost-by-disease 51/116
occurrence. The impact of increased use of the prostate specific aidentify early prostate cancers in the late 1980s and early 1990s imen 60 and over (see Trends in incidence and mortality). Th
in the graphs in Figure 9. The second peak around 2000 is probabPSA testing as well. Cancer is more common among males compyouth under 20 and adults over 60. Sex-specific cancers, such as cancer in particular, as well as lung cancer, melanoma and thyroiaccount for the marked shift in incidence according to sex in age
Mortality rates have been dropping for both sexes for ages up to mortality has been increasing in females, while falling for males thought to reflect the long-term decline in smoking in males and cancer.
From 1994-2003, mortality rates have dropped significantly in allfor men over age 30 by about 2% per year. In females, significanobserved in ages 0-19 (3% per year), 30-49 (>2% per year) and, statistically significant extent, 50-69.
Cancer is primarily a disease of o Notable declines in mortali
occurred in most age gro
AGE AND SEX DISTRIBUTION OF CANCER
Table 10

8/14/2019 Years Lost by Disease
http://slidepdf.com/reader/full/years-lost-by-disease 52/116
Table 10Distribution for All Cancers Combined by Age Group and Sex, Canad2007
AgeGroup
Population (000s)2007 Estimates
New Cases2007 Estimates
Total M F Total M F T
0-19 7,757 3,973 3,784 1,300 700 580 180
20-29 4,509 2,292 2,217 1,850 850 1,000 230
30-39 4,585 2,310 2,275 4,300 1,550 2,800 710
40-49 5,335 2,675 2,660 12,800 4,500 8,300 3,200
50-59 4,539 2,244 2,296 28,800 13,300 15,500 8,900
60-69 2,969 1,446 1,523 40,700 23,500 17,200 15,700
70-79 1,936 886 1,050 41,400 24,300 17,100 21,600
80+ 1,192 426 766 28,800 14,000 14,800 22,300
All Ages 32,822 16,251 16,571 159,900 82,700 77,200 72,700 3
Note: Incidence figures exclude non-melanoma (basal cell and squamous cell) skin cancer. Totanumbers may not equal rounded total number. Please refer to Appendix II: M2007 population projections were provided by the Census and Demographics Branch, StCanada.
Source: Surveillance Division, CCDPC, Public Health Agency of Canada
AGE AND SEX DISTRIBUTIO
Table 11

8/14/2019 Years Lost by Disease
http://slidepdf.com/reader/full/years-lost-by-disease 53/116
Distribution by Selected Cancers, Age Group and Sex, Canada,
AgeGroup
Lung Colorectal
Total M F Total M
New Cases
0-19 10 5 5 10 5
20-29 25 15 10 40 20
30-39 120 50 70 210 110 1
40-49 1,050 410 660 1,050 550 52
50-59 3,500 1,650 1,800 3,200 1,850 1,35
60-69 6,700 3,600 3,100 5,200 3,200 1,95
70-79 7,600 4,300 3,200 6,100 3,500 2,60
80+ 4,400 2,300 2,100 5,000 2,200 2,900
All Ages 23,300 12,400 10,900 20,800 11,400 9,400
Deaths
0-19 – – – 10 –
20-29 5 5 5 10 5
30-39 65 25 40 55 25
40-49 730 300 430 290 160 150-59 2,500 1,300 1,250 960 560 40
60-69 5,300 3,000 2,300 1,750 1,100 63
70-79 6,700 3,900 2,800 2,500 1,500 1,00
80+ 4,600 2,500 2,100 3,200 1,350 1,800
All Ages 19,900 11,000 8,900 8,700 4,700 4,000
– Fewer than 3 cases or deaths.Note: Figures exclude non-melanoma (basal cell and squamous cell) skin cancer. Tota
numbers may not equal rounded total number. Please refer to Appendetails.
Source: Surveillance Division CCDPC Public Health Agency of Canada
AGE AND SEX DISTRIBUTION OF CANCER
Figure 8
8/14/2019 Years Lost by Disease
http://slidepdf.com/reader/full/years-lost-by-disease 54/116
Rate per 100,000Incidence
4,000
3,000
2,000
1,000
0
0 - 4 5 - 9 1 0 - 1 4
3 5 - 3 9
1 5 - 1 9
4 0 - 4 4
2 0 - 2 4
6 0 - 6 4
4 5 - 4 9
2 5 - 2 9
6 5 - 6 9
5 0 - 5 4
3 0 - 3 4
5 5 - 5 9
Age Group
Rate per 100,000Mortality
4,000
3,000
2,000 M
M
Age-Specific Incidence and Mortality Rates for All Cancers by Sex,Canada, 2003
AGE AND SEX DISTRIBUTIO
Figure 9

8/14/2019 Years Lost by Disease
http://slidepdf.com/reader/full/years-lost-by-disease 55/116
Estimated
1978 1983 1988 1993 1998 2003 1978 1983 19
Estimated
0
5
10
15
20
Rate per 100,000Age 0-19
Males, Incidence
Females, Incidence
Males, Mortality
Females, Mortality
Rate per 100,000
10
20
30
40
50
Females
Females, Morta
Rate per 100,000
Females, Incidence
Males, Incidence
150
125
100
75
Rate per 100,000Age 30-39
200
250
300
400
350
Males, Inciden
0
Females, Incid
Age-Standardized Incidence and Mortality Rates by Age GroupAll Cancers, Canada, 1978-2007
AGE AND SEX DISTRIBUTION OF CANCER
Figure 9 (continued)

8/14/2019 Years Lost by Disease
http://slidepdf.com/reader/full/years-lost-by-disease 56/116
Estimated
1978 1983 1988 1993 1998 2003 1978 1983 1988 1
Estimated
100
200
400
600
700
800Rate per 100,000
Age 50-59
Males, Incidence
Females, Incidence
Males, Mortality
Females, Mortality
Rate per 100,000Age 6
Females
Males, Incidence
Females, Mortality
Rate per 100,000Age
Males, Incidence
Males, Mortality
Rate per 100,000Age 70-79
Males, Incidence
Males, Mortality
l id
300
500
700
1,000
1,300
1,600
1,900
400
1,900
2,300
2,700
3,100
2,400
2,800
3,200
4,000
3,600
Age-Standardized Incidence and Mortality Rates by Age Group,All Cancers, Canada, 1978-2007
T able 12 presents the probability (expressed as a percentage) od l i g th ithi ifi d d
PROBABILITY OF DEVELOPING/DYING F

8/14/2019 Years Lost by Disease
http://slidepdf.com/reader/full/years-lost-by-disease 57/116
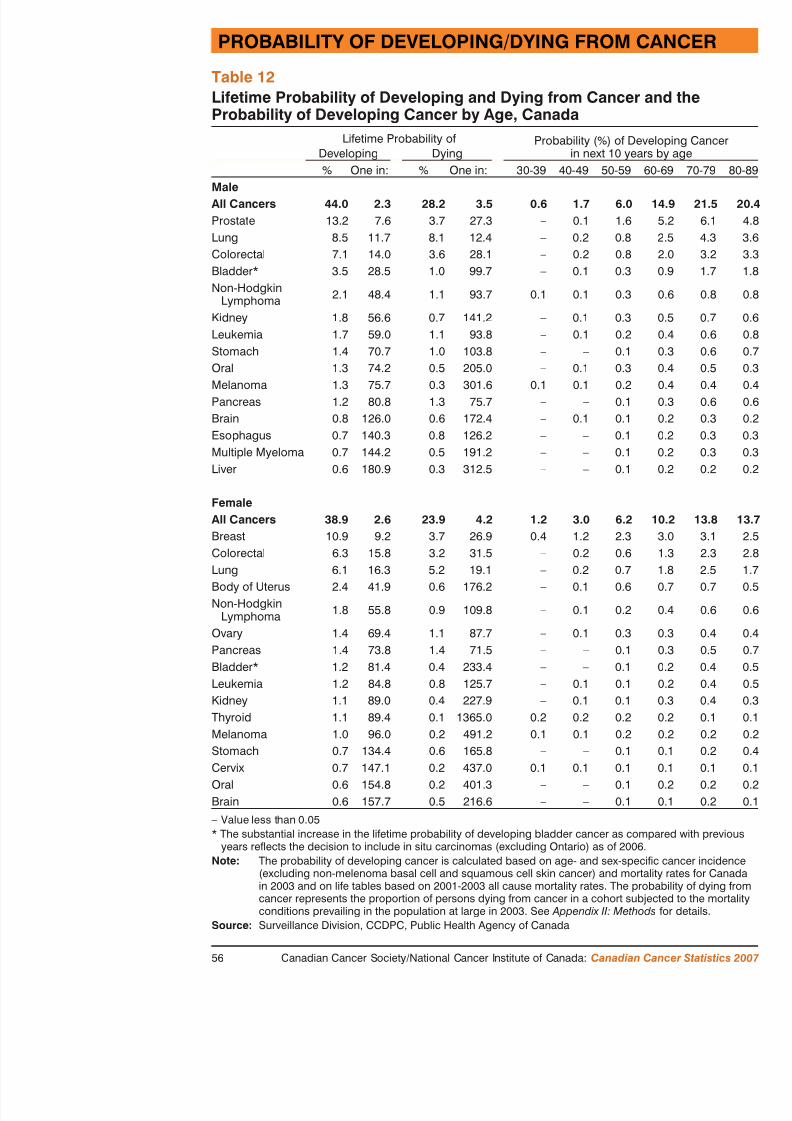
T developing the more common cancers within specific decadethe lifetime probability of developing, or dying from, one of thes
The calculation of these probabilities models the occurrence of chypothetical cohort. For example, if a cohort of 1,000 women of until the end of age 59, 62 of them, or 6 % (1 in 16), will develowithin this 10-year period; this percentage therefore describes, fowoman, the risk of developing some type of cancer before age 60year-old man has a 15% (1 in 7) chance of developing some type70. For the lifetime probability of developing cancer, the data arethe probability of developing cancer expressed as a percentage anthat probability. For example, men have a lifetime probability of developing cancer, and the inverse of that probability is 1 in 2.3. 2 of every 5 men are expected to develop cancer of some type duSimilarly, 1 in 2.6 women (slightly more than 1 of every 3 womecancer during their life. One in 3.5 men and 1 in 4.2 women, or of all Canadians, will die of cancer.
During their lifetimes, 1 in 9 women are expected to develop brecommon cancer (excluding non-melanoma skin cancer) to afflict women are expected to die from it. One in 16 women will develo but only 1 in 32 will die from it. One in 16 will develop lung cadie from this disease, making it the most likely cause of cancer deathOver their lifetimes, 1 in 8 men will develop prostate cancer, but
from it. One in 12 men will develop lung cancer, and 1 in 12 wiltion. Lung cancer is thus by far the leading cause of cancer death
The probability of developing cancer within the next 10 years givof the short-term risk of cancer. Although the lifetime risk of devis 11% (1 in 9), and although the risk increases with age, the chawoman developing breast cancer before age 70 is only 3% (1 in be more meaningful than the lifetime probability statistic for a 6contemplating her risk of breast cancer. Table 12 shows how steedeveloping prostate cancer rises with age. A man has very little pdeveloping prostate cancer by age 50. However, a 70-year-old mchance of developing prostate cancer by age 80; this percentage r
PROBABILITY OF DEVELOPING/DYING FROM CA
Table 12Lif ti P b bilit f D l i g d D i g f C d th
8/14/2019 Years Lost by Disease
http://slidepdf.com/reader/full/years-lost-by-disease 58/116
Lifetime Probability of Developing and Dying from Cancer and theProbability of Developing Cancer by Age, Canada
Lifetime Probability of Probability (%) of Dein next 10 yeDeveloping Dying
% One in: % One in: 30-39 40-49 50-59 6MaleAll Cancers 44.0 2.3 28.2 3.5 0.6 1.7 6.0 14Prostate 13.2 7.6 3.7 27.3 – 0.1 1.6Lung 8.5 11.7 8.1 12.4 – 0.2 0.8
Colorectal 7.1 14.0 3.6 28.1 – 0.2 0.8Bladder* 3.5 28.5 1.0 99.7 – 0.1 0.3Non-Hodgkin
Lymphoma 2.1 48.4 1.1 93.7 0.1 0.1 0.3
Kidney 1.8 56.6 0.7 141.2 – 0.1 0.3Leukemia 1.7 59.0 1.1 93.8 – 0.1 0.2Stomach 1.4 70.7 1.0 103.8 – – 0.1
Oral 1.3 74.2 0.5 205.0 – 0.1 0.3Melanoma 1.3 75.7 0.3 301.6 0.1 0.1 0.2Pancreas 1.2 80.8 1.3 75.7 – – 0.1Brain 0.8 126.0 0.6 172.4 – 0.1 0.1Esophagus 0.7 140.3 0.8 126.2 – – 0.1Multiple Myeloma 0.7 144.2 0.5 191.2 – – 0.1Liver 0.6 180.9 0.3 312.5 – – 0.1
FemaleAll Cancers 38.9 2.6 23.9 4.2 1.2 3.0 6.2 10Breast 10.9 9.2 3.7 26.9 0.4 1.2 2.3Colorectal 6.3 15.8 3.2 31.5 – 0.2 0.6Lung 6.1 16.3 5.2 19.1 – 0.2 0.7Body of Uterus 2.4 41.9 0.6 176.2 – 0.1 0.6Non-Hodgkin
Lymphoma 1.8 55.8 0.9 109.8 – 0.1 0.2Ovary 1.4 69.4 1.1 87.7 – 0.1 0.3Pancreas 1.4 73.8 1.4 71.5 – – 0.1Bladder* 1.2 81.4 0.4 233.4 – – 0.1
F igure 10 shows the rank order of 12 causes of premature deaas represented by potential years of life lost (PYLL) This ill
POTENTIAL YEARS OF LIFE LOST DU

8/14/2019 Years Lost by Disease
http://slidepdf.com/reader/full/years-lost-by-disease 59/116
F as represented by potential years of life lost (PYLL). This illwas the leading cause of PYLL for men and women: 1,006,000 p
lost as a result of cancer (Table 13), representing 32% of the PYLcauses of death. Diseases of the heart were the second leading ca
The PYLL due to specific types of cancer (Table 13) show that luresponsible for 266,800 PYLL, representing 27% of the prematurcancer. For men in 2003, the three leading cancers were lung, coaccounting for 48% of the PYLL due to cancer. The three leadingwere lung, breast and colorectal, accounting for 52% of PYLL duranking by relative importance of these cancers for men and womPYLL has been consistent in recent years. For women, however, life lost due to lung cancer, which are greater than for breast canrates of lung cancer mortality among women aged 50 to 79. Amo prostate cancer is more common than lung cancer, the PYLL duefour times higher than for prostate cancer, reflecting higher mortacancer and the younger age at which men develop and die from t
Potential years of life lost is higher for cancers that are more comage of onset, and more quickly lead to death. With regard to the in women and men, the PYLL from breast cancer (95,300) far ex prostate cancer (33,400), reflecting the relatively young age at w breast cancer. In contrast, the PYLL for Hodgkin lymphoma, at 2cancer that is less common and relatively curable.
Although the number of men who die from cancer each year excwomen, the PYLL for women (520,700) are slightly higher than (485,300). This is because women generally live longer than mendeaths due to female cancers occur at younger ages.
The use of tobacco products is the single most important cause o premature cancer deaths. Many deaths from other diseases also o
smoking (Figure 10). Among men, smoking is responsible for moPYLL due to all cancers, about 30% of PYLL due to diseases of 50% of PYLL due to respiratory disease. Among women, smokinabout one-fifth of PYLL due to all cancers.
POTENTIAL YEARS OF LIFE LOST DUE TO CANCE
Figure 10Selected Causes of Potential Years of Life Lost (PYLL) Canada 2003

8/14/2019 Years Lost by Disease
http://slidepdf.com/reader/full/years-lost-by-disease 60/116
Cancer
Cirrhosis
HIV
Diseases of the heart
Respiratorydisease
Other accidents
Cerebrovasculardisease
Suicide
Motor vehicleaccidents
Diabetes
Perinatal causes
Congenitalanomalies
Males Females
Selected Causes of Potential Years of Life Lost (PYLL), Canada, 2003
POTENTIAL YEARS OF LIFE LOST DU
Table 13Potential Years of Life Lost Due to Cancer Canada 2003

8/14/2019 Years Lost by Disease
http://slidepdf.com/reader/full/years-lost-by-disease 61/116
Potential Years of Life Lost Due to Cancer, Canada, 2003Potential Years of Life Los
Total Males
Years % Years
ALL CAUSES 3,175,900 – 1,702,500
All Cancers 1,006,000 100 485,300 1
Cancer Type
Lung 266,800 26.5 142,000 29
Colorectal 111,300 11.1 58,300 12.
Breast 95,300 9.5 –
Pancreas 50,300 5.0 24,700 5.
Non-Hodgkin Lymphoma 40,600 4.0 22,100 4.6
Leukemia 37,000 3.7 20,800 4
Brain 35,700 3.5 19,600 4
Prostate 33,400 3.3 33,400 6
Stomach 29,000 2.9 17,200 3
Ovary 28,400 2.8 –
Kidney 22,700 2.3 14,100 2
Esophagus 21,700 2.2 16,500 3.4
Oral 17,900 1.8 12,300 2
Bladder 18,000 1.8 12,300 2
Multiple Myeloma 16,100 1.6 8,200 1
Melanoma 14,300 1.4 8,200 1
Body of Uterus 11,700 1.2 –
Liver 10,500 1.0 7,900
Cervix 9,900 1.0 –
Larynx 7,100 0.7 5,700
Hodgkin Lymphoma 2,500 0.2 1,400 0.3
P revalence counts refer to the total number of people who are livingdiagnosis of cancer at a certain point in time. Table 14 reports estim
PREVALENCE

8/14/2019 Years Lost by Disease
http://slidepdf.com/reader/full/years-lost-by-disease 62/116
P g p pnumber of Canadians who were alive in 2003 within 15 years of their c
been diagnosed. These prevalence estimates are reported for the four mcancers, other cancers combined and all cancers. The table shows count percentage of the population and its reciprocal (i.e., the population thatone prevalent case) who were living with a cancer that was diagnosed i preceding 2003. These estimates are based on survival rates from Saskawhich were applied to the Canadian incidence data.
The overall prevalence of cancer in the Canadian population is 2.5% am2.8% among women. In the year 2003, there were an estimated 387,700445,400 female cancer survivors, for a total of approximately 833,100 C(2.6% overall). That means that 1 in 40 Canadian men and 1 in 36 Canhave had cancer diagnosed at some time during the previous 15 years.
Among men, the most prevalent cancer site is the prostate, at 122,400 por 0.8% of the male population, followed by colorectal (53,400) and lun
cancers. Breast cancer is the most common site in women (162,600 casthe female population), which is also followed by colorectal (53,600 ca(19,500) cancers. Prevalence rates are influenced by incidence rates and period of survival, both of which are age-dependent. Therefore, even thadjusted incidence rates and survival rates are higher overall for prostatcancer, the prevalence of breast cancer is higher than that of prostate ca breast cancer is more common in younger age groups. In the case of lu
survival is poor, so even though incidence is high, prevalence is relative National survival data dating back 15 years are not available. In estimarates, it was assumed that survival rates from Saskatchewan were reprethose for Canada. Although there are alternative estimation methods, thlimited in their ability to report national prevalence for specific types oexample, 5.4% of respondents to the Canadian Community Health Surv2005) reported a personal history of cancer, which, as expected, is high prevalence estimate for all Canadians (2.6%). This may be partly becau2005 includes non-melanoma skin cancers, which are common and assovery high survival, but which are not included the Canadian Cancer Statis
A th h l d t th O t i C R gi t t d th
Table 14Prevalence for the Most Common Cancers by Sex Canada 200

8/14/2019 Years Lost by Disease
http://slidepdf.com/reader/full/years-lost-by-disease 63/116
A large number of Canadians liveof cancer, require repeated activ
and have continuing neecancer care resources and supp
Prevalence for the Most Common Cancers, by Sex, Canada, 200
Prevalence Count15 Year Prevalence Percentageof 2003 Population
Both Males Females Both Males Females
All Cancers 833,100 387,700 445,400 2.6 2.5 2.8
Breast – – 162,600 – – 1
Prostate – 122,400 – – 0.8
Colorectal 107,000 53,400 53,600 0.3 0.3 0.3
Lung 37,600 18,100 19,500 0.1 0.1 0.1
All OtherCancers 403,500 193,800 209,700 1.3 1.2 1.3
Note: Survival rates are based on Saskatchewan data from 1986 to 2001 with follow-u
Source: Surveillance Division, CCDPC, Public Health Agency of Canada
Why examine cancer survival?
FIVE-YEAR RELATIVE SURVIVALFOR CANCERS DIAGNOSED IN 1996-1998

8/14/2019 Years Lost by Disease
http://slidepdf.com/reader/full/years-lost-by-disease 64/116
yLike incidence and mortality rates, population-based cancer survival is
the burden of cancer. Its unique contribution is a measure of the severita poor five-year relative survival, such as is the case for lung cancer, m patient has a small probability of living until the fifth anniversary of hiExamined across cancer types and regions, survival estimates can thus bestablish priority areas for improving prognosis. 20 Examined over ticonjunction with incidence and mortality trends, they represent an impoof progress in cancer control. 21
While a population-based survival estimate is a useful “average” indicanot necessarily reflect a specific individual’s chances of surviving for a(e.g., five years) after diagnosis. This is because it is based on the expegroup of people with a heterogeneous mix of disease characteristics. Liconfidence intervals around survival estimates do not represent the rang prognoses for individual patients, but rather statistical variation.
What are the determinants of survival?The prognosis of a cancer patient may be influenced by host factors (e.risk of death from other diseases, socio-economic status and lifestyle farelated factors (e.g., stage of disease, histologic subtype) and system faccancer control (e.g., availability and quality of early detection, diagnosttreatment services). Stage of disease at diagnosis is a very important pr
indicator but is not yet available in Canada at a population level.What is the relative survival ratio? (see Glossary for detailsThe relative survival ratio (RSR) is the preferred measure for assessing cancer patients in a population. It is defined as the ratio of the observedgroup of cancer patients to the survival expected for people in the samelation. 23 A five-year relative survival ratio of 80% means that people w
had 80% of the likelihood of living for 5 years after diagnosis compare people in the general population. An alternative interpretation is that 20with that cancer died within 5 years of diagnosis as a direct or indirect cancer, or the risk factors that predisposed them to developing cancer.
Five-year RSRs were highest for testicular (96%) and thyroid (96
FIVE-YEAR RELAFOR CANCERS DIAGNOSE

8/14/2019 Years Lost by Disease
http://slidepdf.com/reader/full/years-lost-by-disease 65/116
men, prostate cancer also had a very favourable prognosis (92%
melanoma among women (93% RSR) (Table 15). The lowest RSamong those diagnosed with pancreatic cancer (males 6%, femalecancers of the esophagus (males 12%, females 16%) and liver (m15%). For all of the cancers examined, survival was similar or suwith the notable exceptions of larynx (men 68%, women 60%) an(men 80%, women 76%).
Provincial age-standardized RSRs for prostate, breast, colorectal (i.e., the most commonly diagnosed cancer types) are provided insurvival ratios for prostate cancer ranged from a low of 84% in Shigh of 94% in both Nova Scotia and Prince Edward Island. The age-standardized RSR for colorectal cancer was in Prince Edwardthe lowest in Nova Scotia (58%) and Alberta (58%); otherwise peither 60% or 61%. The highest provincial age-standardized RSR89%, was observed for both Prince Edward Island and Saskatchewoccurred in Nova Scotia (84%). There was little provincial variatstandardized lung cancer RSRs.
There are a number of possible explanations for the observed var provinces, some real and some artefactual. Real reasons include duse and diffusion of screening and early detection tests; varying pand availability and access to specialized cancer treatments; or di
tion attributes. For example, breast cancer survival may be signifSaskatchewan compared to Nova Scotia in part because of higherin breast cancer screening in the former. 14 Without data on stagnosis and treatment details, it is difficult to assess which of these
Five-year RSRs were consistent across age groups for colorectal with one exception: at 79%, breast cancer relative survival was lodiagnosed under the age of 40 (Table 17). The best prognosis forapproximately 95%, was observed among those diagnosed at 50 For lung cancer, relative survival was highest in the youngest agegenerally decreased with increasing age from 29% among those 2diagnosis to 13% among those aged 70 to 99 at diagnosis. Relative
FIVE-YEAR RELATIVE SURVIVALFOR CANCERS DIAGNOSED IN 1996-1998
Table 15

8/14/2019 Years Lost by Disease
http://slidepdf.com/reader/full/years-lost-by-disease 66/116
Five-year Relative Survival Ratio (%) (and 95% Confidence Interval)
by Cancer Type, and by Sex, Canada Excluding Quebec*,Cases Diagnosed 1996-1998
Relative Survival Ratio (%) (and 95% Con
Both Sexes Males
All Cancers † 60 (60-60) 58 (58-58)
Testis 96 (94-97) 96 (94-97)Thyroid 96 (95-96) 92 (89-94)
Prostate 92 (91-92) 92 (91-92)
Melanoma 89 (88-90) 86 (84-87)
Breast 86 (86-87) 85 (78-92)
Body of Uterus 86 (85-87)
Hodgkin Lymphoma 86 (84-87) 85 (82-88)
Bladder (including in situ)** 79 (77-80) 80 (78-82)
Cervix 72 (70-74)
Larynx 66 (64-69) 68 (65-70)
Kidney 65 (63-66) 63 (62-65)
Oral 62 (61-64) 61 (60-63)
Colorectal 60 (60-61) 60 (59-61)
Non-Hodgkin Lymphoma 58 (57-59) 55 (53-56)
Leukemia 47 (45-48) 47 (45-49)
Ovary 38 (36-39)
Multiple Myeloma 30 (28-32) 31 (28-33)
Stomach 24 (22-25) 22 (20-23)
Brain 24 (22-25) 22 (20-24)
FIVE-YEAR RELAFOR CANCERS DIAGNOSE
Table 16

8/14/2019 Years Lost by Disease
http://slidepdf.com/reader/full/years-lost-by-disease 67/116
Age-Standardized Five-year Relative Survival Ratio (%) (and 9
Confidence Interval) Both Sexes Combined by Province* for SCancers, Cases Diagnosed 1996-1998Relative Survival Ratio (%) (and 95% Confi
Prostate Breast ColCanada 91 (91-92) 86 (86-87) 6P.E.I.** 94 (88-100) 89 (83-94) 6N.S. 94 (91-97) 84 (82-86) 5
N.B. 93 (90-95) 87 (84-89) 6Ont. 92 (91-92) 86 (86-87) 6Man. 90 (88-93) 87 (85-89) 6Sask. 84 (82-87) 89 (87-91) 6
Alta. 88 (87-90) 85 (84-86) 5B.C. 93 (92-94) 87 (86-88) 6
** NL survival ratios are not shown because they are artefactually high. This is because, istudy, cancers were under-reported as the cancer registry did not receive death certificathe provincial vital statistics office. The survival of such “missed” cases is generally lefrom Quebec have been excluded, in part because the method of ascertaining the date odiffers from the method for other registries and because of issues in correctly ascertainicases.
** All expected survival proportions for Prince Edward Island were derived from Canadiestimates for single ages could not be produced for this province because of small popuRelative survival estimates for Prince Edward Island may be biased to the extent and dpopulation expected survival differed between this province and Canada as a whole.Data from the territories are included in the national survival estimates but age-standardrelative survival ratios are not presented because in each case there were too few casesreliable age-standardized estimates.
Note: Differences in cancer definitions with other sections are described inSource: Statistics Canada. 2006. Cancer Survival Statistics . Statistics Canada C
2006001. Ottawa: Minister of Industry. (Available at: http://www.statcan.ca/engXIE/82-226-XIE2006001.htm).
Table 17Five-year Relative Survival Ratio (%) (and 95% Confidence In
FIVE-YEAR RELATIVE SURVIVALFOR CANCERS DIAGNOSED IN 1996-1998
Figure 11Fi R l i S i l R i (%) b C T B h S

8/14/2019 Years Lost by Disease
http://slidepdf.com/reader/full/years-lost-by-disease 68/116
Pancreas
Esophagus
LiverLung
Brain
Stomach
Multiple Myeloma
OvaryLeukemia
Non-Hodgkin Lymphoma
Colorectal
Oral
Kidney
Larynx
Cervix
Bladder**
Hodgkin Lymphoma
Body of Uterus
BreastMelanoma
Prostate
Thyroid
Testis
Five-year Relative Survival Ratio (%) by Cancer Type, Both Sexes
Combined, Canada Excluding Quebec*, Cases Diagnosed 1996-1998
T able 18 shows the number of new cases of cancer with age-srates, and the number of deaths due to cancer with age-stand
rates (1999-2003) for Canadian children and youth aged 0-19 Fo
CANCER IN CHILDR

8/14/2019 Years Lost by Disease
http://slidepdf.com/reader/full/years-lost-by-disease 69/116
rates (1999-2003) for Canadian children and youth aged 0-19. Fowas diagnosed in an average of 1,289 children every year, and 21from their disease. Leukemia accounted for 25% of new cases anto cancer in children, and remains the most common of the childLymphomas, the second most common group of childhood canceapproximately 17% of new cases and 8% of deaths, and cancers spinal cord accounted for 17% of new cases and 24% of deaths.
An indicator of disease prognosis is provided by the ratio of the nthe number of cases and can be calculated using the data availabdeaths to cases ratio for all childhood cancers combined was apprindicating that the number of deaths was about one-sixth the numhighest ratios (> 0.25) were found in children with liver (hepatic)the sympathetic nervous system (primarily neuroblastoma), tumosome tumours of the brain and spinal cord. The high ratio for neuthe advanced stage at which this disease is frequently diagnosed.sarcomas (0.18), rhabdomyosarcomas (0.26) have a relatively pooratio for acute non-lymphocytic leukemia (0.34) was much highefor acute lymphocytic leukemia (0.10), resulting in a relatively hleukemia. Although the lymphomas have a relatively good prognlymphoma (0.02) has a very low death to cases ratio compared wlymphoma (0.14). The low ratios observed for retinoblastoma andindicate the low fatality rate associated with these tumours.
The low death rates for acute lymphocytic leukemia, Hodgkin’s dtumours reflect the major advances made in treating these cancerFigure 12 demonstrates age-standardized incidence and mortalityleukemia, brain and central nervous system tumours and lymphomyouth aged 0-19 years between 1985 and 2007. While overall increlatively constant over the time period, mortality rates are seen t
major forms of childhood cancer, but particularly for leukemia. Smortality rates for childhood cancer have declined by more than improvement occurring after 1970. Improved survival has been pfor the most common childhood neoplasm, acute lymphocytic leul h d kid Al h h i ll i
CANCER IN CHILDREN AND YOUTH
Table 18New Cases and Age-Standardized Cancer Incidence Rates and Deathsand Age-Standardized Cancer Mortality Rates by Histologic Cell Typ
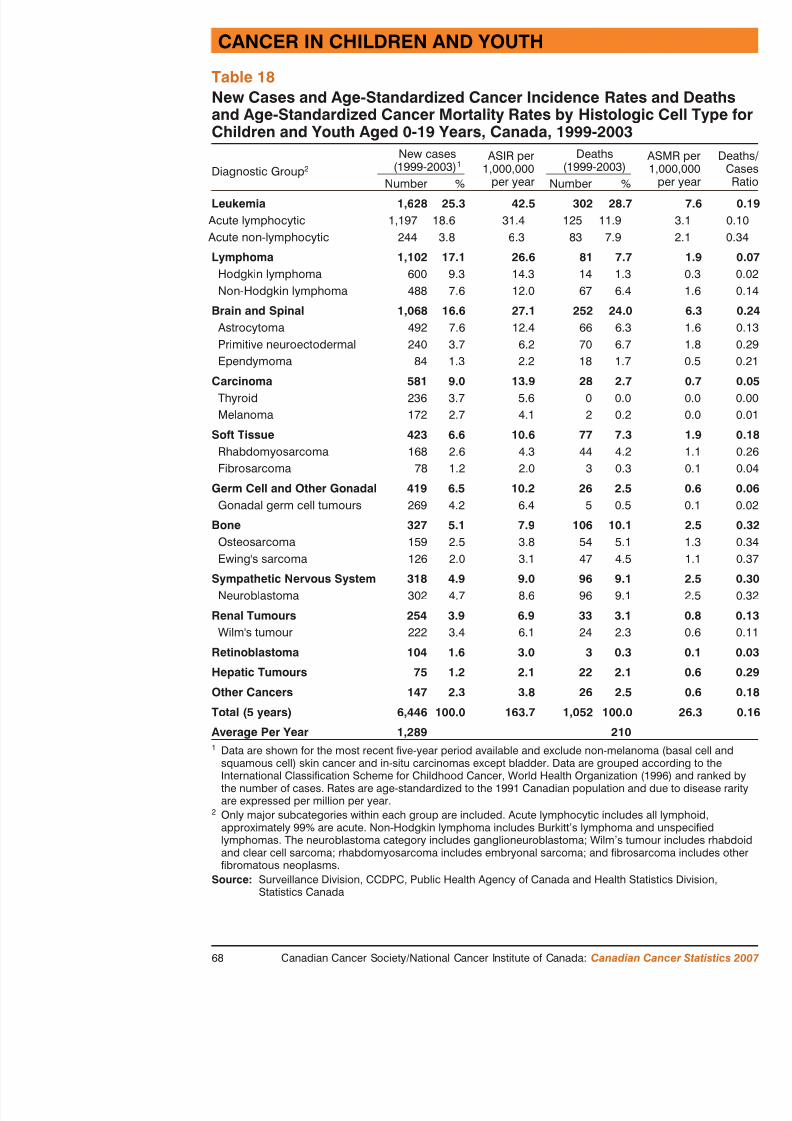
8/14/2019 Years Lost by Disease
http://slidepdf.com/reader/full/years-lost-by-disease 70/116
and Age-Standardized Cancer Mortality Rates by Histologic Cell Typ
Children and Youth Aged 0-19 Years, Canada, 1999-2003
Diagnostic Group 2
New cases(1999-2003) 1
ASIR per1,000,000
per year
Deaths(1999-2003)
Number % Number %
Leukemia 1,628 25.3 42.5 302 28.7Acute lymphocytic 1,197 18.6 31.4 125 11.9
Acute non-lymphocytic 244 3.8 6.3 83 7.9
Lymphoma 1,102 17.1 26.6 81 7.7Hodgkin lymphoma 600 9.3 14.3 14 1.3Non-Hodgkin lymphoma 488 7.6 12.0 67 6.4
Brain and Spinal 1,068 16.6 27.1 252 24.0 Astrocytoma 492 7.6 12.4 66 6.3Primitive neuroectodermal 240 3.7 6.2 70 6.7Ependymoma 84 1.3 2.2 18 1.7
Carcinoma 581 9.0 13.9 28 2.7Thyroid 236 3.7 5.6 0 0.0Melanoma 172 2.7 4.1 2 0.2
Soft Tissue 423 6.6 10.6 77 7.3Rhabdomyosarcoma 168 2.6 4.3 44 4.2Fibrosarcoma 78 1.2 2.0 3 0.3
Germ Cell and Other Gonadal 419 6.5 10.2 26 2.5Gonadal germ cell tumours 269 4.2 6.4 5 0.5
Bone 327 5.1 7.9 106 10.1Osteosarcoma 159 2.5 3.8 54 5.1Ewing's sarcoma 126 2.0 3.1 47 4.5
Sympathetic Nervous System 318 4.9 9.0 96 9.1Neuroblastoma 302 4.7 8.6 96 9.1
Renal Tumours 254 3.9 6.9 33 3.1Wilm's tumour 222 3.4 6.1 24 2.3
Retinoblastoma 104 1.6 3.0 3 0.3
Hepatic Tumours 75 1.2 2.1 22 2.1
CANCER IN CHILDR
Figure 12Age-Standardized Incidence and Mortality Rates for Selected CChildren and Youth Aged 0-19 Years Canada 1985-2007

8/14/2019 Years Lost by Disease
http://slidepdf.com/reader/full/years-lost-by-disease 71/116
Rate per 100,000All cancers
Rate per 100,000
Rate per 100,000Rate per 100,000Brain and spinal cord
20
15
10
5
Estimated
Incidence
Mortality
1987 1990 1993 1996 1999 2002 20050
Estimated
Incidence
Mortality
1 1
1.5 1.5
2 2
2.5 2.5
3 3
3.5 3.5
Incidence
Mortality
1987 1990 0
0.5
1
1.5
2
2.5
3
3.5
4
4.5
5
Incide
M li
Children and Youth Aged 0 19 Years, Canada, 1985 2007
Introduction
Breast cancer is an important public health issue in Canada and around
SPECIAL TOPIC: BREAST CANCER

8/14/2019 Years Lost by Disease
http://slidepdf.com/reader/full/years-lost-by-disease 72/116
Breast cancer is an important public health issue in Canada and around
matter what measure is used: it is common, and represents a major causmortality in women. Because survival is good, many women live for a following a diagnosis of breast cancer. This has implications for resourcand survivorship issues, such as recurrences, long term effects of treatmfamily, etc. Furthermore, considerable resources are expended every yeamammography screening programs to detect breast cancers at an early s
Breast cancer is the most common female malignancy in the world.accounts for 22% of all new cancer diagnoses in women, and approximof all cases when men and women are combined. It represents 7% of th7.6 million cancer-related deaths worldwide.
In Canada, breast cancer is the most common cancer in women, with m22,000 new diagnoses every year (Table 1). It kills more than 5,000 Caevery year, more than any other type of cancer except lung (Table 1). O
women will be diagnosed with and 1 in 27 will die of breast cancer in (Table 12). It accounts for an estimated 95,300 potential years of life loFortunately, largely due to advances in adjuvant therapy and greater parscreening programs in Canada and other developed countries, breast canrates are now declining. This means that increasing numbers of womena diagnosis of breast cancer: an estimated 162,600 Canadian women aliabout one in every 100 females – have had a diagnosis of breast cancer
in the past 15 years (Table 14).Although breast cancer can also occur in men, it is rare: approximately men will be diagnosed with breast cancer in 2007, which represents lesestimated breast cancer cases. Men and women share many of the same breast cancer, including age, family history of breast and/or ovarian canand exposure to radiation of the chest wall, most commonly as a result non-Hodgkin or Hodgkin lymphoma. They also share many of the samestrategies, signs and symptoms of disease, methods of diagnosis, treatmand outcome measures. Given these similarities, much of the informatiospecial topic will apply to both men and women.
International Variation
Female breast cancer rates in Canada are amongst the highest in
SPECIAL TOPIC: BR

8/14/2019 Years Lost by Disease
http://slidepdf.com/reader/full/years-lost-by-disease 73/116
Female breast cancer rates in Canada are amongst the highest in
States, northern Europe and Australia have incidence rates that arCanada’s, while regions of Asia, Latin America and Africa have rates (about 1/3 those in Canada). 2 Within Canada, First Nationhave lower incidence than the population-at-large. 3,4 These di partly attributed to variation in risk factors such as reproductive levels of physical activity, use of hormones, and possibly screenin
Age specific incidence and mortalityThe incidence of breast cancer, like that of most epithelial cancerage. Unlike most epithelial cancers, however, the incidence is alrage 25 (Figure 13.1). Mortality rates also rise steeply with age, blower than incidence rates at every age up to about 85. This is a relatively good survival.
In every adult age group, breast cancer is the most common femafor over 30% of all new diagnoses in women aged 20-49 and 50-older women (Figures 13.2). It is the leading cancer cause of dea(Figure 13.3), and ranks second and third, respectively, at older a
Trends in incidence and mortality
Figures 13.4a-b illustrate the considerable gap between incidencein every age group. Also evident is the rise in the all ages inciden(Figure 13.4a): an increase of 1% per year up until 1999, or 30% period. Since 1999, the all ages incidence has been stable (a non-of 1.8% per year, Table 19).
Incidence trends vary considerably by age at diagnosis (Figures 1the statistical analysis of these trends over the period 1969-2003 arThe figures and analysis indicate the following, according to ageN 20-39: incidence rates have declined slightly (0.2% per year)
i d d h d li i i i ll i ifi
the statistical analysis. It is necessary to wait for additional years ofof the recent trend;
N 70 and over: after many years of rising rates incidence began to dec
SPECIAL TOPIC: BREAST CANCER

8/14/2019 Years Lost by Disease
http://slidepdf.com/reader/full/years-lost-by-disease 74/116
N 70 and over: after many years of rising rates, incidence began to dec
with a statistically significant drop of 0.9% per year between 1991 aThe reasons for these patterns are likely complex. At least part of the loincrease in incidence is probably due to greater participation in screeninamong women in the target age range (aged 50-69) and improved qualiresulting in detection of small tumours that were not yet diagnosable clinito prostate cancer, screening may have eventually exhausted the pool ofcancers in the screened population, resulting in recent declines, as incid back closer to pre-screening levels. It is possible that the same explanatwomen aged 40-49 and 70+, many of whom may have been screened a possible explanations include changing patterns of childbearing and hornumber of children, age at first birth, age at menarche and menopause, contraceptives and combined hormone replacement therapy). For exampat first birth increases a woman’s breast cancer risk; between 1965 and average age at first birth among Canadian women rose from less than 2nearly 28 in 2003. 5
Time trends for mortality are striking: the age-standardized mortality racancer in women in Canada has fallen 25% since 1986 from 32 to 24.1(Table 8.2), corresponding to a 1% decline per year up to 1994 and a mdecline of 2.5% annually thereafter (Table 19). Mortality has been declilong term (i.e., since 1969) in age groups 20-39, 40-49 and 50-59 (Figusignificantly greater rates of decline since the late 1980s or mid-1990s older women, mortality was stable or slightly increasing until more recewomen 60-69, mortality rates dropped steeply between 1990 and 1999 ( but then leveled off, while in women aged 70 and over mortality began1995 and has continued to do so significantly (1.9% per year). These degenerally attributed to two factors: first, improvements in screening, whdevelopment of organized screening programs, increased participation in(by women aged 50-69 in particular) and improved quality of mammoglate 1980s have led to detection of more breast cancers at an earlier statreatment is more effective; and second, advances in therapy.
Alth gh ti g th i t f i g f th t f t t t i
Survival
The five-year relative survival for breast cancer at the national leve
SPECIAL TOPIC: BR
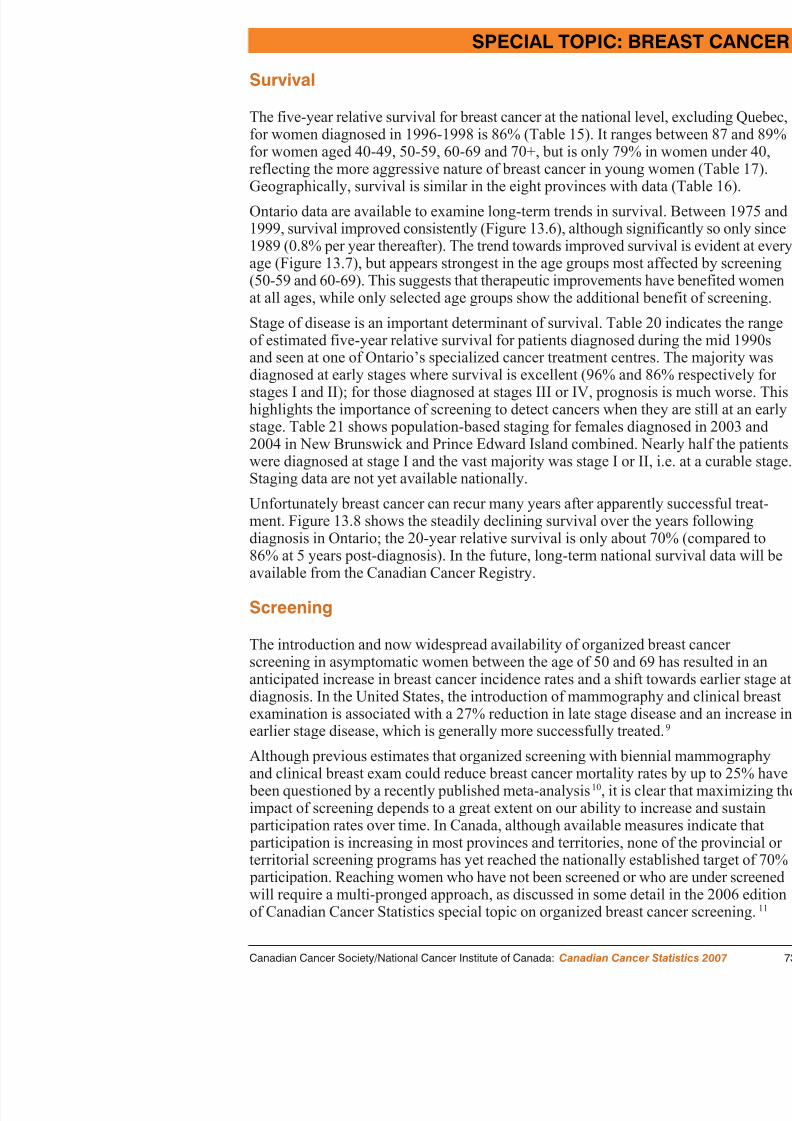
8/14/2019 Years Lost by Disease
http://slidepdf.com/reader/full/years-lost-by-disease 75/116
y
for women diagnosed in 1996-1998 is 86% (Table 15). It ranges for women aged 40-49, 50-59, 60-69 and 70+, but is only 79% inreflecting the more aggressive nature of breast cancer in young wGeographically, survival is similar in the eight provinces with da
Ontario data are available to examine long-term trends in surviva1999, survival improved consistently (Figure 13.6), although signif1989 (0.8% per year thereafter). The trend towards improved surviage (Figure 13.7), but appears strongest in the age groups most a(50-59 and 60-69). This suggests that therapeutic improvements haat all ages, while only selected age groups show the additional be
Stage of disease is an important determinant of survival. Table 20of estimated five-year relative survival for patients diagnosed durand seen at one of Ontario’s specialized cancer treatment centres
diagnosed at early stages where survival is excellent (96% and 86stages I and II); for those diagnosed at stages III or IV, prognosishighlights the importance of screening to detect cancers when thestage. Table 21 shows population-based staging for females diagn2004 in New Brunswick and Prince Edward Island combined. Newere diagnosed at stage I and the vast majority was stage I or II,Staging data are not yet available nationally.
Unfortunately breast cancer can recur many years after apparentlyment. Figure 13.8 shows the steadily declining survival over the diagnosis in Ontario; the 20-year relative survival is only about 786% at 5 years post-diagnosis). In the future, long-term national available from the Canadian Cancer Registry.
Screening
The introduction and now widespread availability of organized brscreening in asymptomatic women between the age of 50 and 69anticipated increase in breast cancer incidence rates and a shift to
Risk factors
Factors known to affect the risk of breast cancer constitute a mixture of
SPECIAL TOPIC: BREAST CANCER

8/14/2019 Years Lost by Disease
http://slidepdf.com/reader/full/years-lost-by-disease 76/116
behaviours and non-modifiable characteristics, including reproductive/hfactors, lifestyle behaviours, and heredity. Truly modifiable factors (sucmass, physical inactivity, alcohol consumption) collectively explain onlfraction of breast cancer incidence (unlike lung cancer, for example, whmajority is known to be caused by tobacco).
Risk factors for breast cancer
Reproductive/hormonal Lifestyle Other
n Fewer birthsn Later age at first full-term
pregnancyn Did not breastfeedn Early age at menarchen Irregular mensesn Late menopausen Use of exogenous hormones
(e.g., oral contraceptives,combined hormone therapy)
n Obesity (post-menopausalbreast cancer)
n Physical inactivityn Alcohol consumption
n Family cancer
n BRCA1n Ionizing
or occun Benign
Adapted from Cancer in Young Adults in Canada (p. 80), Cancer Care Ontario
Opportunities for primary prevention
Based on current knowledge, the best opportunities for reducing breast eating a healthy diet and being physically active throughout life (therebhealthy body weight), minimizing alcohol consumption and avoiding nohormones. Regular participation in high quality screening programs wilthe breast cancer burden by reducing mortality and improving prognosis
Conclusions/Implications
Breast cancer is the most common cancer in Canadian women, both befd i j f t d th Alth h i id
N Increase research to identify further genetic factors so that wotake appropriate actions;
N Continue to disseminate optimal therapies, and develop and te
SPECIAL TOPIC: BR

8/14/2019 Years Lost by Disease
http://slidepdf.com/reader/full/years-lost-by-disease 77/116
p p , p
regimens.
References
1. International Agency for Research on cancer. Handbo Breast cancer screening . Lyon: IARC, 2002.
2. Canadian Cancer Society/National Cancer Institute of CanaCancer Statistics 2004, Toronto, Canada, 2004; (special t
3. Marrett LD, Chaudhry M. Cancer incidence and mo Nations, 1968-1991. Cancer Cause Control 2003; 14:259
4. Miller AB, Gaudette LA. Breast cancer in CircumpoActa Oncologica 1996; 35:577-80.
5. Statistics Canada. 2006. Report on the Demographi2003 and 2004. Statistics Canada Catalogue no. 91-209-XMinister of Industry. (Available at: http://www.statcan.ca/cglistpub.cgi?catno=91-209-XIE2003000).
6. Berry D, Cronin K, Plevritis S et al. Effect of Screenon Mortality from Breast Cancer . NEJM 2005;353,1784
7. Ragaz J, Olivotto I, Spinelli J et al. Locoregional Radwith High-Risk Breast Cancer Receiving Adjuva Results of British Columbia Randomized Trial . JNCI 2005
8. Danish Breast Cancer Cooperative Group, Nielsen HM, Ovet al. Study of failure pattern among high-risk brewithout postmastectomy radiotherapy in addition
long-term results from the Danish Breast Cancer b and c randomized studies. J Clin Ocol. 2006, May; 20;
9. Garfinkel L, Boring CC, Heath CW. Jr. Changing trecancer incidence and mortality.Cancer. Jul 1 1994;74 (1

8/14/2019 Years Lost by Disease
http://slidepdf.com/reader/full/years-lost-by-disease 78/116
SPECIAL TOPIC: BR
Figure 13.1Age-Specific Incidence and Mortality Rates for Breast Cancer, FCanada, 1999-2003

8/14/2019 Years Lost by Disease
http://slidepdf.com/reader/full/years-lost-by-disease 79/116
50
100
150
200
250
300
350
400
Incidence
Rate per 100,000
SPECIAL TOPIC: BREAST CANCER
Figure 13.2Leading Types of Cancer Among Women, Percentage of New Cases,Canada, 2003

8/14/2019 Years Lost by Disease
http://slidepdf.com/reader/full/years-lost-by-disease 80/116
Ages 50-69, N
Body of uterus8%
Colre1
Non-Hodgkinlymphoma
4%
Ovary4%
Other27%
Other19%
Ovary4%
Melanoma6%
Cervix6%
Non-Hodgkinlymphoma
3% Breast36%
Thyroid11%Lung
6%
Colon andrectum
5%
Uterus4%
Ages 20-49, N=11,737
Ages 70+, N=29,141
Other32%
Breast20%
Colon andrectum18%Pancreas
4%
Bladder3%
SPECIAL TOPIC: BR
Figure 13.3Leading Causes of Cancer Death Among Women, Percentage ofCanada, 2003

8/14/2019 Years Lost by Disease
http://slidepdf.com/reader/full/years-lost-by-disease 81/116
Age
Ages 20-49, N=2,300
Stomach3%
Ovary
6%
Colon andrectum
7%
Other25%
Breast26%
Lung19%Cervix
5%
Brain & othernervous system
5%
Leukemia4%
Ovar6%
Pancreas5%
Non-Hodgkinlymphoma
3%
Other29%
Ages 70+, N=18,816
Other33%
Lung21%
Colon andrectum14%Leukemia
4%
SPECIAL TOPIC: BREAST CANCER
Figure 13.4aAge-Standardized Incidence and Mortality Rates by Age Group,Breast Cancer, Females, Canada, 1969-2007

8/14/2019 Years Lost by Disease
http://slidepdf.com/reader/full/years-lost-by-disease 82/116
Rate per 100,000All ages
Rate per 100,000Age 20
Rate per 100,000Age 50
Rate per 100,000Age 40-49
20
25
15
10
80
100
120
60
40
20
200
250
300
150
100
5
1969 1974 1979 1984 1989 1994 1999 20040
1969 1974 1979 1984 190
Incidence
Mortality
Estimated
100
140
160
60
40
80
120
Incidence
Mortality
Incidence
Mortality
Incidence
Mo
Estimated
SPECIAL TOPIC: BR
Figure 13.4bAge-Standardized Incidence and Mortality Rates by Age GroupBreast Cancer, Females, Canada, 1969-2007
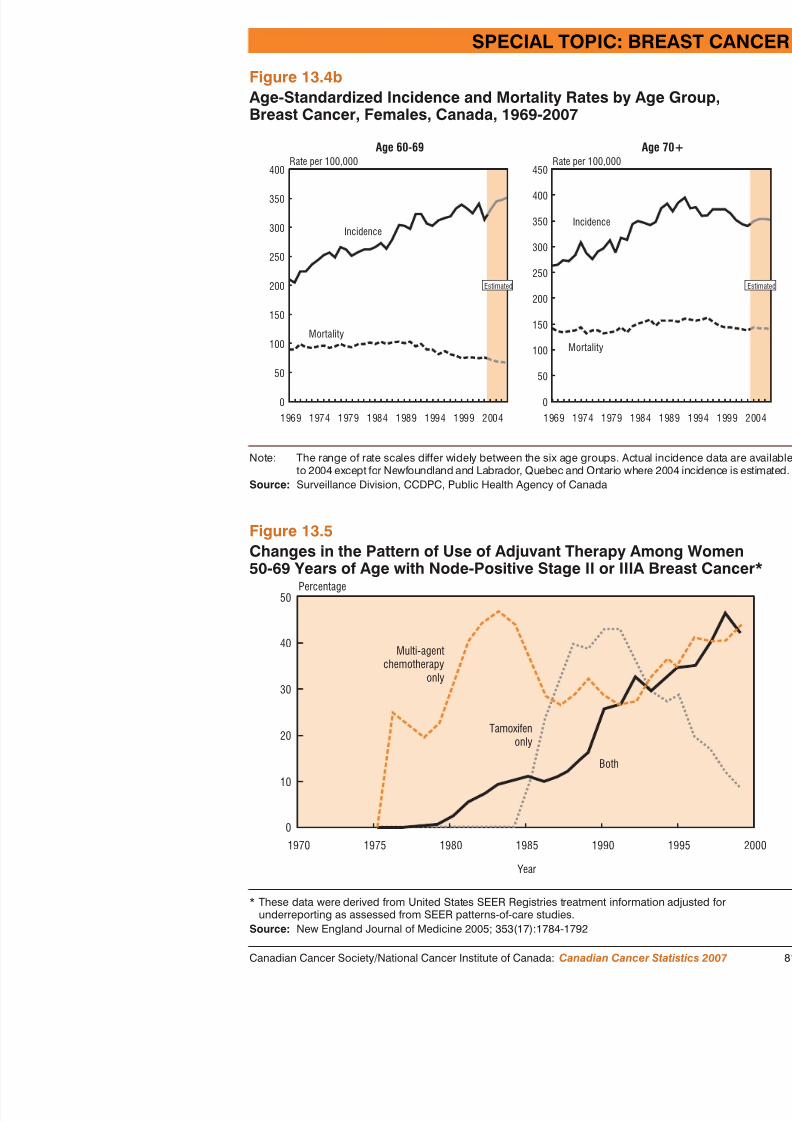
8/14/2019 Years Lost by Disease
http://slidepdf.com/reader/full/years-lost-by-disease 83/116
50
40
Percentage
Multi-agentchemotherapy
only
Figure 13.5Changes in the Pattern of Use of Adjuvant Therapy Among Wo50-69 Years of Age with Node-Positive Stage II or IIIA Breast C
Rate per 100,000Age 60-69
Rate per 100,000
350
450
250
150
300
350
400
250
150
5050
1969 1974 1979 1984 1989 1994 1999 20040
1969 1974 1979 0
Incidence
Mortality
200
100
Estimated
400
300
200
100
Incidence
Mortality
Note: The range of rate scales differ widely between the six age groups. Actual incideto 2004 except for Newfoundland and Labrador, Quebec and Ontario where 2004
Source: Surveillance Division, CCDPC, Public Health Agency of Canada
SPECIAL TOPIC: BREAST CANCER
Figure 13.6Five-year Relative Survival Ratio (%) (and 95% Confidence Interval)
Year of Diagnosis, Ontario, Breast Cancer, Females, Cases Diagnosed1975-1999

8/14/2019 Years Lost by Disease
http://slidepdf.com/reader/full/years-lost-by-disease 84/116
50
60
70
80
90
100
1975 1977 1979 1981 1983 1985 1987 1989 1991 1993
Five-year Relative Survival Ratio (%)
Year of diagnosis
80
90
100Five-year Relative Survival Ratio (%)
Figure 13.7Age-Specific Five-year Relative Survival Ratio (%) by Five-year PeriDiagnosis, Breast Cancer, Females, Ontario 1975-1999
SPECIAL TOPIC: BR
Figure 13.8Relative Survival Ratio (%) by Number of Years Since DiagnosBreast Cancer, Females, Ontario*
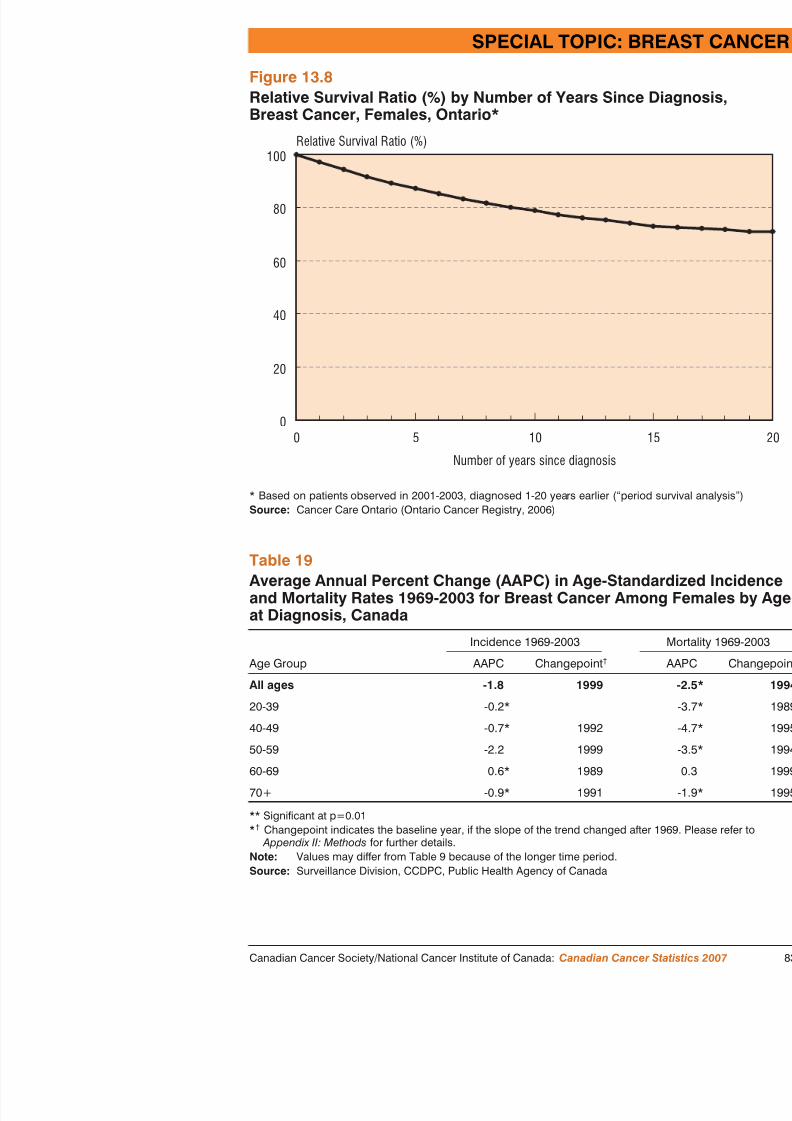
8/14/2019 Years Lost by Disease
http://slidepdf.com/reader/full/years-lost-by-disease 85/116
0 5 10
Number of years since diagnosis
Relative Survival Ratio (%)
0
20
40
60
80
100
* Based on patients observed in 2001-2003, diagnosed 1-20 years earlier (“period survivalSource: Cancer Care Ontario (Ontario Cancer Registry, 2006)
Table 19Average Annual Percent Change (AAPC) in Age-Standardized Iand Mortality Rates 1969-2003 for Breast Cancer Among Fema
at Diagnosis, Canada
Age Group
Incidence 1969-2003
AAPC Changepoint †
SPECIAL TOPIC: BREAST CANCER
Table 20Breast Cancer, Females, Five-Year Relative Survival Ratio by Stage1994-1997

8/14/2019 Years Lost by Disease
http://slidepdf.com/reader/full/years-lost-by-disease 86/116
TNM stage* No. (%)Five-Year Relative
(and 95% Conf
Stage I 812 (42) 96
Stage II 843 (44) 86
Stage III 155 (8) 59
Stage IV 112 (6) 26** Excludes 270 unstaged cases.1 Adapted from Ugnat et al. 2004 which used data from the Ottawa Regional Cancer Centre.Source: Surveillance Division, CCDPC, Public Health Agency of Canada
Table 21Breast Cancer, Females, Stage Distribution, Prince Edward Island andNew Brunswick, 2003-2004
TNM stage 1
Age at diagnosis
0-49 50-59 60-69 70-79 80-
No. (%) No. (%) No. (%) No. (%) No.
Stage I 82 (37) 137 (46) 129 (49) 111 (55) 51 (35
Stage II 104 (46) 110 (37) 103 (40) 59 (29) 58 (40
Stage III 29 (13) 48 (16) 27 (10) 22 (11) 27 (18
Stage IV 9 (4) 4 (1) 2 (1) 11 (5) 11
1 AJCC 6th edition. Excludes 185 unstaged cases.Source: Surveillance Division, CCDPC, Public Health Agency of Canada
Age The age of the patient (in completed years) aor death.
ICDO-3 International Classification of Diseases for O30
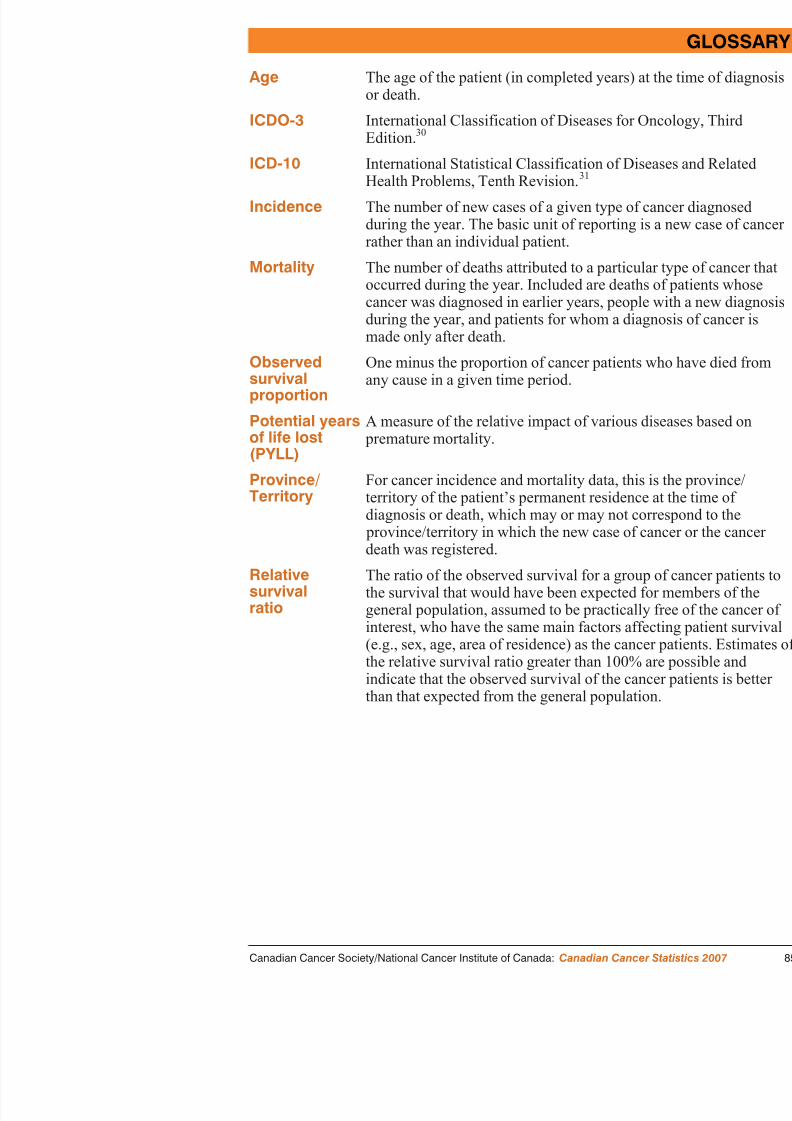
8/14/2019 Years Lost by Disease
http://slidepdf.com/reader/full/years-lost-by-disease 87/116
Edition.ICD-10 International Statistical Classification of Dise
Health Problems, Tenth Revision. 31
Incidence The number of new cases of a given type of cduring the year. The basic unit of reporting israther than an individual patient.
Mortality The number of deaths attributed to a particulaoccurred during the year. Included are deathscancer was diagnosed in earlier years, peopleduring the year, and patients for whom a diagmade only after death.
Observed
survivalproportion
One minus the proportion of cancer patients w
any cause in a given time period.
Potential yearsof life lost(PYLL)
A measure of the relative impact of various d premature mortality.
Province/
Territory
For cancer incidence and mortality data, this
territory of the patient’s permanent residence diagnosis or death, which may or may not co province/territory in which the new case of cdeath was registered.
Relativesurvivalratio
The ratio of the observed survival for a groupthe survival that would have been expected fogeneral population, assumed to be practicallyinterest, who have the same main factors affe(e.g., sex, age, area of residence) as the cancethe relative survival ratio greater than 100% aindicate that the observed survival of the can
Incidence, Mortality and Prevalence Rates
Crude rate The number of new cases of cancer or cancer deathyear, expressed as a rate per 100,000 persons in the
A ifi Th b f f d h
GLOSSARY

8/14/2019 Years Lost by Disease
http://slidepdf.com/reader/full/years-lost-by-disease 88/116
Age-specificrate
The number of new cases of cancer or cancer deathyear, expressed as a rate per 100,000 persons in a g
Age-standardizedrate
The number of new cases of cancer or cancer deaththat would have occurred in the standard populationCanadian population) if the actual age-specific ratesgiven population had prevailed in the standard popu
Index of age-standardizedrates
The age-standardized rate of the base year, 1978, isvalues for subsequent years are derived by dividingstandardized rate for that year by the 1978 rate.
Prevalence The definition of prevalence is the proportion of a pis affected by disease at a given point in time and icomplete prevalence. In this document our estimate is
described as limited-duration prevalence, and the durBy this we mean the prevalence of cases diagnosed before the point in time for which the estimate is caestimate should always be an underestimate of comand the magnitude of the underestimate is dependent
1991 Canadian Population/World Standard PopulationThe population used to standardize rates had the following age distribution:
Population Population
Age
Group Canadian
World
Standard
Age
Group Canadian
World
Standard
Age
Group0-4 6,946.4 12,000 30-34 9,240.0 6,000 60-64
5-9 6,945.4 10,000 35-39 8,338.8 6,000 65-69
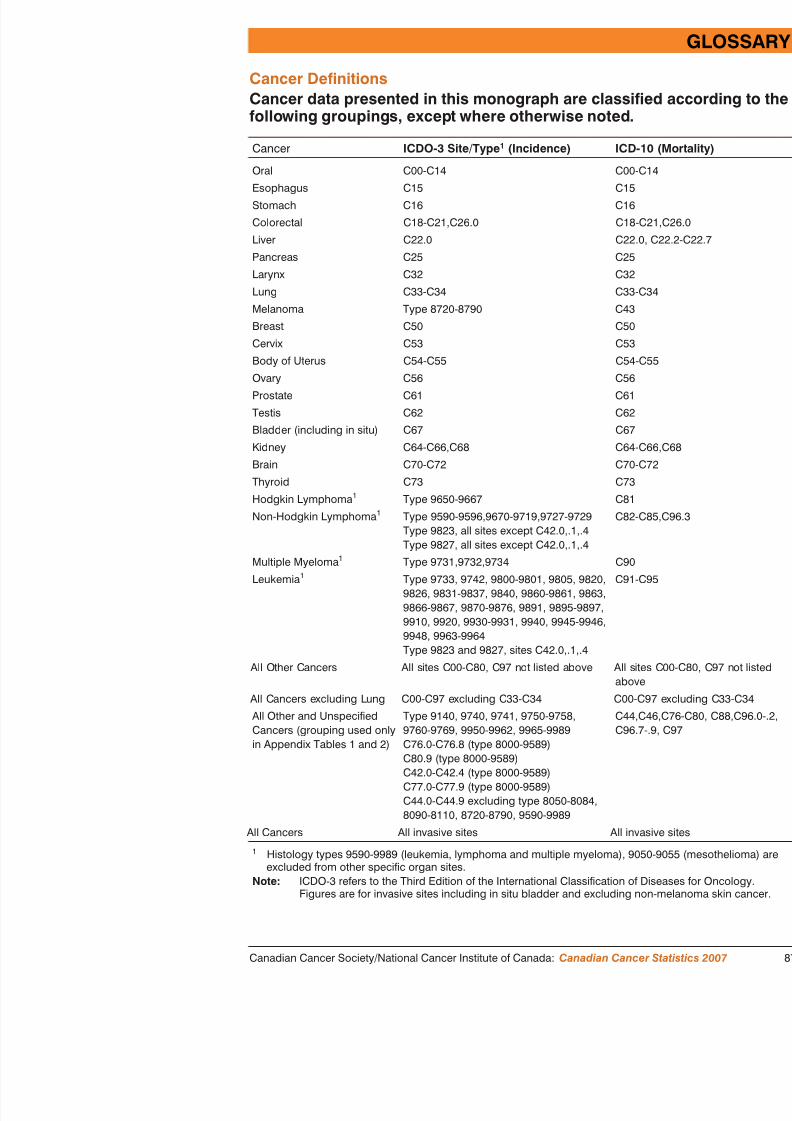
8/14/2019 Years Lost by Disease
http://slidepdf.com/reader/full/years-lost-by-disease 89/116
T he focus of this monograph is on current year estimates that are obanalyzing actual data and making short-term projections using stati
techniques ( see Appendix II ). For users who require actual dataratyear ti t the Tables in this Appendix provide a summary of actu
APPENDIX I: ACTUAL DATA FORNEW CASES AND DEATHS

8/14/2019 Years Lost by Disease
http://slidepdf.com/reader/full/years-lost-by-disease 90/116
year estimates, the Tables in this Appendix provide a summary of actumortality statistics based on the most recently available data for the natrepresent the most recent year in the long series of data used to derive testimates. Appendix Tables A1 and A2 list the actual number of new cadeaths (2003) that occurred in Canada, and specify the ICDO-3 codes ueach diagnostic group. Given the reliability of these actual counts, it is examine the frequency of additional cancer types, thus Appendix Tablelist a larger number of cancer types than the previous Tables. AppendixA6 list actual values for incidence and mortality counts and rates for mtypes, by province and territory.
In addition to the explanations and discussion provided earlier in the moseveral other points need to be made. As noted in Tables A3-A6 of this because of the small populations of the Territories, it was feasible to pr
summaries (five-year average) for the most common cancers. The Appealso indicate that among provinces/territories there was some variation which data were available (as of September 2006 when these analyses bFurthermore, the data sources are dynamic files that are routinely updat become available. Users who require more current, actual data for Canathe Centre for Chronic Disease Prevention and Control at the Public HeCanada, or the Health Statistics Division at Statistics Canada. The most
data for individual provinces/territories can be obtained by contacting thcancer registries (see section For Further Information).
APPENDIX I: ACTNEW CASE
Table A1Actual Data for New Cases of Cancer by Type and Sex, CanadaCancer ICDO-3 Site/Type 1

8/14/2019 Years Lost by Disease
http://slidepdf.com/reader/full/years-lost-by-disease 91/116
All Cancers All invasive sites 14Oral (Buccal Cavity and Pharynx) C00-C14
Lip C00Tongue C01-C02Salivary Gland C07-C08Mouth C03-C06Nasopharynx C11Oropharynx C10Other and Unspecified C09,C12-C14
Digestive Organs C15-C26,C48Esophagus C15Stomach C16Small Intestine C17Large Intestine C18,C26.0 1Rectum and Anus C19-C21Liver C22.0Gallbladder C23Pancreas C25
Other and Unspecified C22.1,C24,C26.1-.9,C48 1,Respiratory System C30-C36,C38.1-.9,C39 2
Larynx C32Lung C33-C34Other and Unspecified C30-31,C35-36,C38.1-.9,C39 3
Bone C40-C41Soft Tissue (including Heart) C38.0,C47,C49Skin (Melanoma) Type 8720-8790Breast C50Genital Organs C51-C63
Cervix C53Body of Uterus C54Uterus, Part Unspecified C55Ovary C56Prostate C61Testis C62Other and Unspecified C51-52,C57,C58,C60,C63
Urinary Organs C64-C68
Bladder C67Kidney and Other Urinary C64-C66,C68 4Eye C69Brain and Central Nervous System C70-C72E d i Gl d
APPENDIX I: ACTUAL DATA FORNEW CASES AND DEATHS
Table A2Actual Data for Cancer Deaths by Type and Sex, Canada, 2003Cancer ICD-10 Tota

8/14/2019 Years Lost by Disease
http://slidepdf.com/reader/full/years-lost-by-disease 92/116
All Cancers C00-C97 65,990Oral (Buccal Cavity and Pharynx) C00-C14 1,018
Lip C00Tongue C01-C02 239Salivary Gland C07-C08 81Mouth C03-C06 185Nasopharynx C11 105Oropharynx C10 91Other and Unspecified C09,C12-C14 301
Digestive Organs C15-C26,C48 17,396Esophagus C15 1,413Stomach C16 1,944Small Intestine C17 155Large Intestine C18,C26.0 6,582Rectum and Anus C19-C21 1,542Liver C22.0,C22.2-.7 609Gallbladder C23 277
Pancreas C25 3,441Other and Unspecified C22.1,C22.9,C24,C26.1-.9,C48 1,433
Respiratory System C30-C36,C38.1-.9,C39 17,938Larynx C32 46Lung C33-C34 17,374Other and Unspecified C30-31,C35-36,C38.1-.9,C39 99
Bone C40-C41 13
Soft Tissue (including Heart) C38.0,C47,C49 346
Skin (Melanoma) C43 74Breast C50 5,09
Genital Organs C51-C63 6,588Cervix C53 37Body of Uterus C54 383Uterus, Part Unspecified C55 348Ovary C56 1,57Prostate C61 3,658Testis C62 3
Other and Unspecified C51-52,C57,C58,C60,C63 211Urinary Organs C64-C68 3,064
Bladder C67 1,586Kidney and Other Urinary C64-C66,C68 1,478
E C69 3

8/14/2019 Years Lost by Disease
http://slidepdf.com/reader/full/years-lost-by-disease 93/116
APPENDIX I: ACTUAL DATA FORNEW CASES AND DEATHS
Table A4Actual Age-Standardized Incidence Rates for Most Common Cancersby Sex and Geographic Region, Most Recent Year 1, Canad
New Cases

8/14/2019 Years Lost by Disease
http://slidepdf.com/reader/full/years-lost-by-disease 94/116
New CasesCanada NL* PE NS NB QC ON MB SK AB B
MalesAll Cancers 455 399 535 524 476 476 448 436 488 434 395Prostate 119 92 160 137 129 100* 123 111 172 135 105Lung 71 62 78 85 83 94 61 65 60 54 5Colorectal 61 82 73 74 56 65 58 62 63 56 5
Bladder** 29 25 36 34 30 37 23 27 31 29 2Non-Hodgkin
Lymphoma 19 9 24 22 24 18 19 18 21 20 18Kidney 16 14 21 19 22 17 16 20 16 14 1Leukemia 15 7 24 14 12 15 16 13 20 12 1Oral 13 16 5 16 12 13 12 14 11 10Melanoma 13 13 15 18 14 7 16 11 8 15 1Stomach 12 15 14 12 11 12 11 13 9 10 10
Pancreas 10 5 16 12 16 12 9 12 9 8Brain 8 8 5 7 8 8 8 6 7 7Esophagus 6 5 7 8 7 5 6 4 5 5Multiple
Myeloma 6 4 10 4 6 7 6 6 6 7Liver 5 2 3 3 3 5 5 4 2 5
FemalesAll Cancers 347 308 360 367 333 351 352 349 326 335 313Breast 96 86 105 95 85 96 97 97 93 97 9Lung 45 27 61 51 49 52 41 48 43 41 4Colorectal 42 59 54 51 38 43 42 42 44 36 3Body of
Uterus 19 15 19 19 16 19 20 25 22 20 1Thyroid 14 10 8 10 16 11 19 11 6 15Non-Hodgkin
Lymphoma 14 11 16 13 15 13 14 16 13 12 13Ovary 12 6 7 8 13 11 13 13 10 10Melanoma 10 8 19 15 11 5 12 7 9 13 1Pancreas 8 2 8 10 9 10 8 9 8 8Cervix 8 8 7 11 10 6 8 8 8 9

8/14/2019 Years Lost by Disease
http://slidepdf.com/reader/full/years-lost-by-disease 95/116

8/14/2019 Years Lost by Disease
http://slidepdf.com/reader/full/years-lost-by-disease 96/116
Data Sources and ProcessingThe actual cancer incidence and mortality data used in this monofrom three sources: mortality data files (1950-2003), 33 the Nareporting System (NCIRS, 1969-1991) and the Canadian Cancer 1992-2004) 1 (the Health Statistics Division at Statistics Canada
APPEND
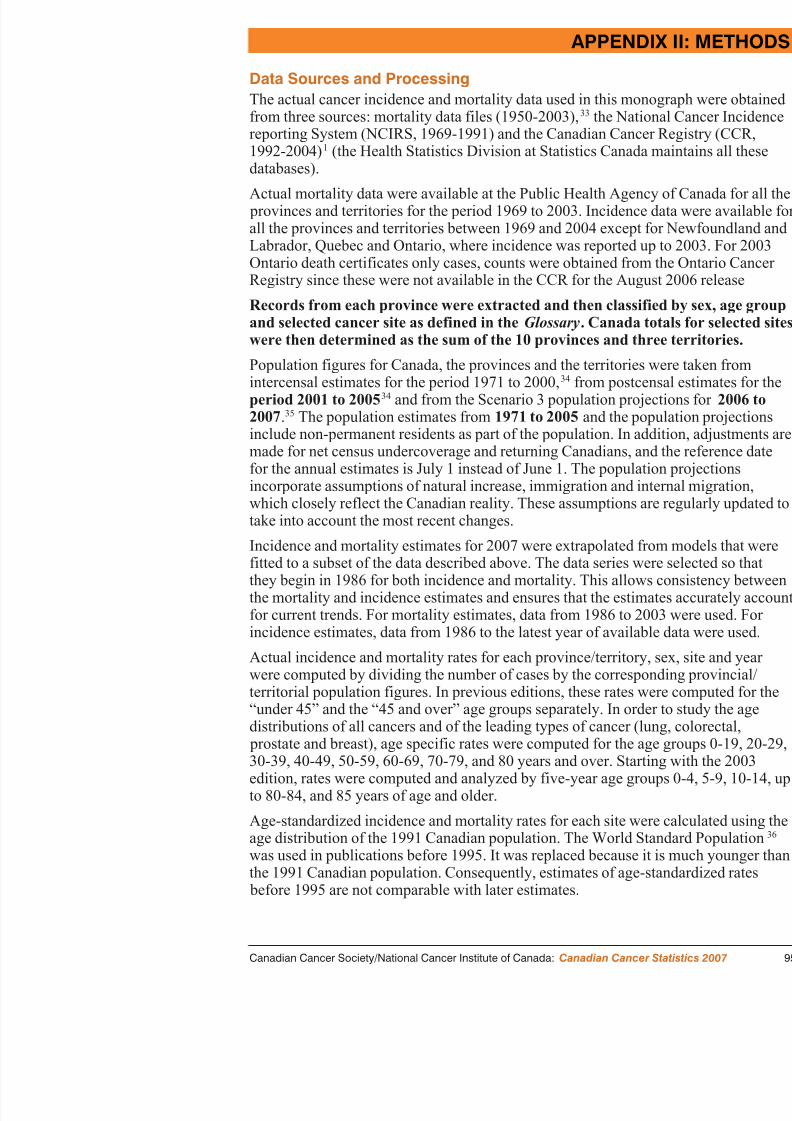
8/14/2019 Years Lost by Disease
http://slidepdf.com/reader/full/years-lost-by-disease 97/116
databases).
Actual mortality data were available at the Public Health Agency provinces and territories for the period 1969 to 2003. Incidence dall the provinces and territories between 1969 and 2004 except foLabrador, Quebec and Ontario, where incidence was reported up
Ontario death certificates only cases, counts were obtained from tRegistry since these were not available in the CCR for the Augus
Records from each province were extracted and then classified by and selected cancer site as defined in the Glossary . Canadawere then determined as the sum of the 10 provinces and three ter
Population figures for Canada, the provinces and the territories w
intercensal estimates for the period 1971 to 2000,34
from postperiod 2001 to 2005 34 and from the Scenario 3 population proj2007 .35 The population estimates from 1971 to 2005 and the pinclude non-permanent residents as part of the population. In addmade for net census undercoverage and returning Canadians, andfor the annual estimates is July 1 instead of June 1. The populatioincorporate assumptions of natural increase, immigration and inte
which closely reflect the Canadian reality. These assumptions aretake into account the most recent changes.
Incidence and mortality estimates for 2007 were extrapolated fromfitted to a subset of the data described above. The data series werthey begin in 1986 for both incidence and mortality. This allows the mortality and incidence estimates and ensures that the estimatfor current trends. For mortality estimates, data from 1986 to 200incidence estimates, data from 1986 to the latest year of available
Actual incidence and mortality rates for each province/territory, swere computed by dividing the number of cases by the correspon
Commencing with the 2000 edition of Canadian Cancer Statistic,Territories represent a different geographic area than in the past. Its geo boundaries were redrawn, reducing the land area representing the NorthTerritories, and a new territory named Nunavut was incorporated. 3
For all cancers, even those with poor survival such as pancreas and lun
APPENDIX II: METHODS

8/14/2019 Years Lost by Disease
http://slidepdf.com/reader/full/years-lost-by-disease 98/116
number of incident cases is expected to be similar to or larger than the deaths. However, there are situations in which the number of deaths, eitor projected, is larger than the corresponding number of new cases. In t Newfoundland and Labrador, this is caused by the Registry not receivinon death certificates that mention cancer. This results in an underestima
number of cases for the years used to generate the estimates. Once the Nand Labrador Registry begins receiving information in order to register difference will disappear. Deaths may correspond to cases diagnosed in years, so year-to-year variation is also a factor for rare cancer sites.
Incidence Estimates (New Cases) for 2007The number of new cases was estimated for each age group, cancer site
fitting Poisson regression models to the provincial and territorial yearlyassumption underlying Poisson regression is that the annual incidence cindependent Poisson random variables with a mean equal to the produc population size for a particular year and the (true) annual incidence rate
A modification to the projection methodology was implemented for theIn editions before 2003, for each province/territory, age group, sex and model for crude incidence rates was used, with year as the only indepenThe latest projection methodology includes age as a factor with 18 leveinclusion of trend terms was evaluated by the stepwise selection algoritS-plus 2000. The estimates for 2007 were obtained by multiplying the ecrude incidence rates by the demographic projections for the same year.data series for some provinces were available, estimates for Canada wethe sum of the estimates for the provinces and territories.
Occasionally, when the original data show large fluctuations, it has beeobtain results of satisfactory precision from the model. For these exceptcases for 2007 were estimated (after consultation with the provinces/terfive-year average of the most recent available data: Newfoundland and
considers borderline ovarian cancer as malignant. Based on the IC both 1998 and 2000 there were actually about 50 additional ovar2000.
Prostate cancer incidence projection methodology was modified fas the anticipated decline in age-standardized rates from a peak i
APPEND

8/14/2019 Years Lost by Disease
http://slidepdf.com/reader/full/years-lost-by-disease 99/116
until 1995, at which point a new and increasing trend was establiobservation in the summary rates does not apply to the age-specithe age-specific rates for Canada among men under 40 have reveshown no trend; among men aged 40-59 a steeply increasing tren1991 and has yet to change course; among men aged 60-74 the rin the age-standardized rates from 1991 on; and among men over brief spike in rates in the early to mid-1990s was followed by a sat or below the 1981 levels. Consequently, age-specific rate projePoisson regression model fit to data between 1981 and 1989 werfavour of Poisson regression models fit to data from 1991 to the incidence data available (2003 for Newfoundland and Labrador, Qelsewhere 2004). However, the models fitted to the 1991 and late
reliable projections because prostate cancer incidence is not lineafive year average method was used to project prostate cancer in a
The estimates of incidence counts for “all cancers” were computeestimated prostate cancer cases plus the estimate of “all cancers lthe standard linear model (based on data from 1986 onwards). Stedition, the incidence classification uses ICDO-3 for the data fromThis results in an additional 1,200 cases per year as compared wiobtained previously using the ICD-9 definition in the other canceall cancers total.
Mortality Estimates (Deaths) for 2007The number of deaths was estimated for each age group, site andsimilar to that used for incidence. For each province and territoryused for death rates, with an 18-level age group factor and trend stepwise algorithm. Mortality counts by cancer site for Canada westimates of the provincial and territorial counts.
In the versions of this booklet published before 2003, mortality d
pancreas, non-Hodgkin lymphoma, kidney; female – stomach, lung); Sa(female – stomach); Northwest Territories (male – All Cancers; female Yukon Territories (male – All Cancers; female – All Cancers) and NunaAll Cancers; female – All Cancers).
Estimated Age-Standardized Incidence Rates (ASIRs) and Mortality
APPENDIX II: METHODS

8/14/2019 Years Lost by Disease
http://slidepdf.com/reader/full/years-lost-by-disease 100/116
g ( ) yRates (ASMRs) for 2007Starting with the 2003 edition, projected age-standardized rates were codirectly from the age-specific projections. This change eliminated the na separate projection methodology for age-specific and age-standardizedAdditionally the new procedure guarantees the definition that age-stand
are a weighted average of the age-specific rates. In editions of this publ2003, incidence and mortality rates were generally estimated using weigsquares regression, with some exceptions. Weights were taken as thestimated variances of the actual age-standardized rates. Variances wereunder the assumption that the age-specific counts used in the computatistandardized rates follow independent Poisson distributions. Regression performed for Canada and each province or territory for each site and slinear model, with year as the only independent variable.Again, when the original data show large fluctuations, it has been impofrom the model results of satisfactory precision. For this reason and to mconsistency between the age-specific and age-standardized estimates, anstandardized incidence rates for 2007 were estimated by actual age-stanincidence rates calculated over a five-year period for each of those case
Incidence Estimates section. Similarly, annual age-standardized mortalit2007 were estimated by actual age-standardized mortality rates calculatyear period for each of the areas and site combinations listed in the MoEstimates section.
Prostate cancer incidence projection methodology was modified, startin2003 edition, as the anticipated decline in age-standardized rates from awas observed until 1995, at which point a new and increasing trend waHowever, this new trend has not aligned with the level that was projectof a linear model fit to the 1981-1989 data. Several options were explor believe the most accurate projections were obtained by simply computi
t d di d t f th j t d ifi t (di d li
use the standard error to create a range of plausible values for theestimated. These values are available upon request from the SurvCentre for Chronic Disease Prevention and Control, Public HealthTogether, these quality measures assess the precision (or imprecis
estimate but not the accuracy of the estimate. Note that any estimerror, and the degree of precision depends primarily on the numb
APPEND

8/14/2019 Years Lost by Disease
http://slidepdf.com/reader/full/years-lost-by-disease 101/116
error, and the degree of precision depends primarily on the numband the population size for each site-sex-province combination, wis related to the adequacy of the model used in the estimation pro
Estimates of incidence and mortality have been rounded as followand 99 to the nearest 5, counts between 100 and 999 to the neare1,000 and 1,999 to the nearest 50 and counts greater or equal to 2100. Percentages, age-standardized and age-specific rates were rotenth except in Tables 4 and 6 and Appendix Tables A4 and A6, restrictions forced rounding to the nearest whole number. Age- ancounts/rates are combined before rounding, so it is possible that tdo not appear to add up. However, any of these discrepancies mu precision of the rounding units described above.
Average Annual Percent Change (AAPC) in Cancer Incidence aMortalityThe AAPC values were calculated for each site by fitting a modeconstant rate of change in the ASIRs or ASMRs, that is, a linear ASIRs and ASMRs after logarithmic transformation. The estimatfrom that fit was then transformed back to represent a percentage
Joinpoint analysis was applied to search for the most recent lineaASMR data points from 1986 to 2003 for both incidence and mominimum of five data points were required to identify a new trenthat a new trend could be detected would be starting in 1999. Dawere used for both incidence and mortality unless the joinpoint anew trend starting later than 1994 in which case the latest linear estimate the AAPC.
Estimates of Non-Melanoma Skin Cancer for 2007 in CanadaFor 2007 non-melanoma skin cancer estimates were the average o by applying British Columbia, Manitoba and New Brunswick rat

8/14/2019 Years Lost by Disease
http://slidepdf.com/reader/full/years-lost-by-disease 102/116

8/14/2019 Years Lost by Disease
http://slidepdf.com/reader/full/years-lost-by-disease 103/116
Relative survivalCancer cases were defined based on the International Classification of DOncology, Third Edition. 45 Surveillance, Epidemiology, and End Resugroups, with mesothelioma and Kaposi sarcoma as separate groupings, wdefine cancer type. 46 There are some differences compared to the cancthe Glossary (see reference 46). Analyses were restricted to first primar
APPENDIX II: METHODS

8/14/2019 Years Lost by Disease
http://slidepdf.com/reader/full/years-lost-by-disease 104/116
y ( ) y ptumour records diagnosed between January 1, 1996 and December 31, 1These incidence years were selected due to the fact that 2003 was the mof mortality data available for analysis. The pre-1992 tumour history, if persons on the CCR was obtained by linking the CCR data with its pre National Cancer Incidence Reporting System, a fixed, tumour oriented containing cases as far back as 1969. Supplementary information availa province of Ontario was also used.
Cases diagnosed in the province of Quebec were not included, in part bmethod of ascertaining the date of diagnosis of cancer cases in this provdiffered from that of the other provincial cancer registries 47 and beccorrectly ascertaining the vital status of cases. Records were excluded w
diagnosis was established either through autopsy only or death certificaSurvival time was calculated as the difference in days between the dateand the date of last observation (date of death or December 31, 2003, wearliest) to a maximum of five years. For a small percentage of subjectsinformation on day/month of diagnosis and/or day/month of death, the swas estimated. 47 Vital status during the first five years was determinedlinkage to the Canadian Mortality Data Base, or from information repor provincial/territorial cancer registries. For deaths reported by a provincinot confirmed by the record linkage process, it was assumed that the inon the date submitted by the reporting province.
The survival analysis was based on an algorithm written by Paul Dickmminor adaptations. Relative survival ratios were estimated as the ratio osurvival of persons with cancer to the expected survival for the general
the same age, sex, province of residence, and time period. Observed sur proportions were estimated using the cohort method. Expected survivalwere derived from sex-specific complete provincial life tables producedCanada using the Ederer II approach 49 All expected survival propor
In past years, other Special Topics included:N progress in cancer control: screening (2006)N progress in cancer prevention: modifiable risk factors (2005);
N international variation in cancer incidence, 1993-1997 (2004);N i b d f i C d 1998 (2004)
APPENDIX III: PREVIOUS SP

8/14/2019 Years Lost by Disease
http://slidepdf.com/reader/full/years-lost-by-disease 105/116
N economic burden of cancer in Canada, 1998 (2004);N non-Hodgkin’s lymphoma (2003);N cancer incidence in young adults (2002);N survival rates (2002, 1995, 1991-1993);N colorectal cancer (2001, 1995);N progress in cancer control (2000);N relative impact of population growth and aging on cancer inci
(1999);N cancer surveillance in Canada (1999);N international comparisons (1998);N 10-year review of Canadian cancer statistics (1997);N evaluation of the accuracy of estimates (1996);N prostate cancer (1996);N economic burden of cancer (1996, 1990);N prevalence estimates (1995);N breast cancer (1993);N smoking prevalence and lung cancer (1991);N cancer in Aboriginal populations (1991);
N age-specific trends among women (1990);N cancer rates by income level (1990).

8/14/2019 Years Lost by Disease
http://slidepdf.com/reader/full/years-lost-by-disease 106/116
17. Ward EM, Tun MJ, Hannan LM, Jemal A. Interpreting cAcad Sci 2006; 1076: 29-53.
18. Duchesne D. Seniors at work . Perspectives on Labour and ICatalogue no. 75-001) 2002; 3(5).
19. Cancer Care Ontario: Cancer in Young Adults in CanaMay 2006.
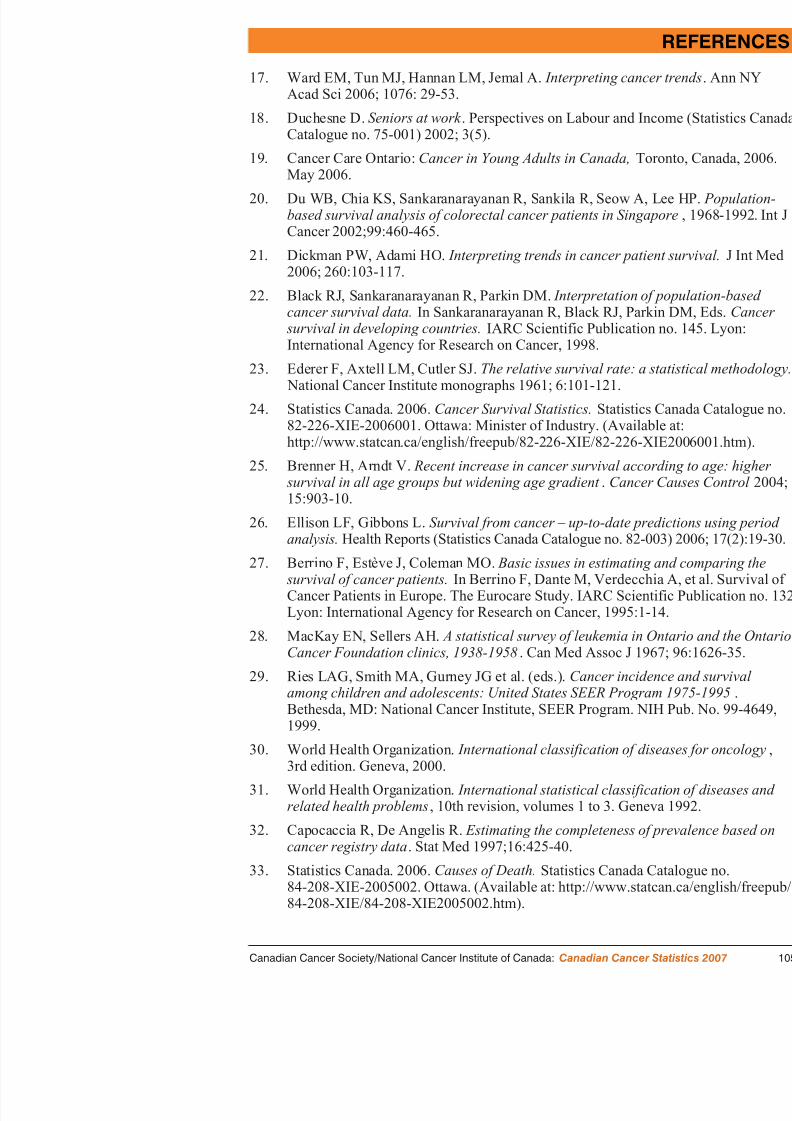
8/14/2019 Years Lost by Disease
http://slidepdf.com/reader/full/years-lost-by-disease 107/116
May 2006.
20. Du WB, Chia KS, Sankaranarayanan R, Sankila R, Seow A, based survival analysis of colorectal cancer patients Cancer 2002;99:460-465.
21. Dickman PW, Adami HO. Interpreting trends in cancer2006; 260:103-117.
22. Black RJ, Sankaranarayanan R, Parkin DM. Interpretatiocancer survival data.In Sankaranarayanan R, Black RJ, Par survival in developing countries.IARC Scientific PublicatioInternational Agency for Research on Cancer, 1998.
23. Ederer F, Axtell LM, Cutler SJ. The relative survival ra
National Cancer Institute monographs 1961; 6:101-121.24. Statistics Canada. 2006. Cancer Survival Statistics.Statist
82-226-XIE-2006001. Ottawa: Minister of Industry. (Availablhttp://www.statcan.ca/english/freepub/82-226-XIE/82-226-XIE
25. Brenner H, Arndt V. Recent increase in cancer surviva survival in all age groups but widening age gradient. Can15:903-10.
26. Ellison LF, Gibbons L. Survival from cancer – up-to-danalysis.Health Reports (Statistics Canada Catalogue no. 82-0
27. Berrino F, Estève J, Coleman MO. Basic issues in estim survival of cancer patients.In Berrino F, Dante M, VerdeccCancer Patients in Europe. The Eurocare Study. IARC ScientiLyon: International Agency for Research on Cancer, 1995:1-1
28. MacKay EN, Sellers AH. A statistical survey of leukemCancer Foundation clinics, 1938-1958. Can Med Assoc J
29 Ries LAG Smith MA Gurney JG et al (eds ) Cancer in
34. Statistics Canada. 2006. Annual Demographic Statistics.Statisticno. 91-213-XIB-2005000. Ottawa: Minister of Industry. (Available awww.statcan.ca/cgi-bin/downpub/listpub.cgi?catno=91-213-XIB2005
35. Statistics Canada. 2006. Population Projections for Canada, Territories.Statistics Canada Catalogue no. 91-520-XIE-2005001. Oof Industry. (Available at: http://www.statcan.ca/english/freepub/91 520 XIE/0010591 520 XIE ht )
REFERENCES

8/14/2019 Years Lost by Disease
http://slidepdf.com/reader/full/years-lost-by-disease 108/116
91-520-XIE/0010591-520-XIE.htm).
36. Parkin DM, Muir CS, Whelan SL, Gao Y et al. (eds.). Cancer icontinents, volume VII.Lyon: IARC Scientific Publication No. 143Agency for Research on Cancer, 1997.
37. Statistics Canada. 1999. Standard Geographical ClassificatioSupplement.Ottawa. (Available at: http://www.statcan.ca/english/Susgc/1996/1996-sgc-supp.htm).
38. Demers A, Nugent Z, Mihalcioiu C, Wiseman M, Kliewer E. Trnonmelanoma skin cancer from 1960 through 2000 in a CAcad Dermatol 2005;53:320-8.
39. Zdeb MS. The probability of developing cancer.Am J Epidemiol 1
40. Seidman H, Silverberg BS, Bodden A. Probabilities of eventudying of cancer. Risk among persons previously undiagnoCancer Journal for Clinicians 1978;28:33-46.
41. Peron Y, Stromenger C. Demographic and health indicators.OtCanada, Catalogue 82-543E, 1985:182-189, 155-157.
42. Canadian Community Health Survey (CCHS) 2003 (CyclCanada and Statistics Canada, 2003.
43. Shultz JM, Novotny TE, Rice DP. Quantifying the disease im smoking with Sammec II software.Public Health Rep 1991;106(3)
44. Illing EM, Kaiserman MJ. Mortality attributable to tobacco uregions, 1991.Can J Public Health 1995;86(4):257-65.
45. Fritz A, et al. (eds). International Classification of Diseases Edition. Geneva, World Health Organization, 2000.
46. Ries LAG, Harkins D, Krapcho M, Mariotto A, Miller BA, Feuer EJEisner MP Horner MJ Howlader N Hayat M Hankey BF Edwards
F or general information regarding cancer statistics or any other ascancer prevention, screening, diagnosis, treatment and care, etc.)
Canadian Cancer Society’s (CCS) Cancer Information Service at 1 88list of the offices of the CCS – the National Office and the Division
on page 110. Your local CCS office is listed in the white pages of thFor information regarding cancer research sponsored by the NatCanada (NCIC) with funds provided by the CCS and The Terry F
FOR FURTHER

8/14/2019 Years Lost by Disease
http://slidepdf.com/reader/full/years-lost-by-disease 109/116
Canada (NCIC) , with funds provided by the CCS and The Terry Fthe NCIC at the address provided on page 110.
For Information from Public Health Agency of Canada:More detailed information on methodology is available from the SurPublic Health Agency of Canada, 120 Colonnade Road, Ottawa, OnTel. (613) 952-3335, Fax. (613) 941-2057.Cancer Surveillance On-Line is an interactive, Web-based tool fsurveillance data. It allows the user to generate data according to a csuch as cancer site, geographic area and period of time, and a choicesuch as tables, charts and maps. See the Public Health Agency of Ca below for the URL.
For Information from Statistics Canada:Detailed standard tables are available on the Statistics Canada websiCustom tabulations are available on a cost recovery basis upon requStatistics Division, Statistics Canada, National Enquiries Line: 1-800Statistics Division: (613) 951-1746. Analytical articles appear regulaStatistics Canada, Catalogue 82-003, quarterly.
For Information from the Provincial/Territorial Cancer Registries:
Cancer incidence data are supplied to Statistics Canada by provincialregistries. Detailed information regarding the statistics for each provavailable from the relevant registry. (See pages 108-109 for addressefax numbers and websites.)
Data contained in this document and additional information is avN Canadian Cancer Society (CCS)
http://www.cancer.ca
N N i l C I i f C d (NCIC)

8/14/2019 Years Lost by Disease
http://slidepdf.com/reader/full/years-lost-by-disease 110/116
MANITOBAGail NoonanManager Manitoba Cancer Registry
CancerCare Manitoba675 McDermot Ave., Room ON2114Winnipeg Manitoba R3E OV9
BRITISH COLUMs. Mary McBriDirector, Cancer BC Cancer Agen
Cancer Control R675 West 10 th AVancouver Britis
FOR FURTHER

8/14/2019 Years Lost by Disease
http://slidepdf.com/reader/full/years-lost-by-disease 111/116
Winnipeg, Manitoba, R3E OV9Tel: (204) 787-2157Fax: (204) 786-0628www.cancercare.mb.ca
SASKATCHEWANMs. Heather StuartProvincial Leader, Cancer RegistrySaskatchewan Cancer AgencyAllan Blair Cancer Centre4101 Dewdney AvenueRegina, Saskatchewan, S4T 7T1Tel: (306) 766-2695Fax: (306) 766-2179www.scf.sk.ca
ALBERTADr. Heather BryantVice President & CIO, Alberta Cancer
BoardDirector, Division of Population Health
& InformationPopulation and Health InformationAlberta Cancer Board1331 29 th Street North WestCalgary, Alberta, T2N 4N2Tel: (403) 521-3901Fax: (403) 270-3898www.cancerboard.ab.ca
Vancouver, BritisTel: (604) 707-59Fax: (604) 877-1www.bccancer.bc
NUNAVUTMs. Sylvia HealyDirector of RegisDepartment of HServicesBox 1000, StatioIqaluit, Nunavut,Tel: (867) 975-57Fax: (867) 975-5
NORTHWEST TDr. André CorrivChief Medical H
Registrar, DiseDepartment of HeGovernment of thBox 1320, 5022 Centre Square ToYellowknife, N.WTel: (867) 920-86Fax: (867) 873-0www.gov.nt.ca
STATISTICS CAJ li M A l
NATIONAL CANCER INSTITUTE OF CANADA &CANADIAN CANCER SOCIETY
National OfficeCanadian Cancer Society &
National Cancer Institute of Canada10 Al A S i 200
Quebec DivisionMaison de la Société can5151 boul. de l’AssompM é l Q éb H1T
FOR FURTHER INFORMATION

8/14/2019 Years Lost by Disease
http://slidepdf.com/reader/full/years-lost-by-disease 112/116
10 Alcorn Avenue, Suite 200Toronto, Ontario M4V 3B1Tel. (416) 961-7223Fax. (416) 961-4189www.cancer.ca andwww.ncic.cancer.ca
Newfoundland & Labrador DivisionCanadian Cancer SocietyViking Building, 2 nd Floor P.O. Box 8921136 Crosbie Road, 2 nd floor St. John’s, Newfoundland A1B 3R9Tel. (709) 753-6520Fax. (709) 753-9314
Prince Edward Island DivisionCanadian Cancer Society1 Rochford Street, Suite #1Charlottetown, Prince Edward Island
C1A 9L2Tel. (902) 566-4007Fax. (902) 628-8281
Nova Scotia DivisionCanadian Cancer Society5826 South Street, Suite 1Halifax, Nova Scotia B3H 1S6Tel. (902) 423-6183
Montréal, Québec H1T Tel. (514) 255-5151Fax. (514) 255-2808
Ontario DivisionCanadian Cancer Socie1639 Yonge StreetToronto, Ontario M4T Tel. (416) 488-5400Fax. (416) 488-2872
Manitoba DivisionCanadian Cancer Socie193 Sherbrook StreetWinnipeg, Manitoba R3Tel. (204) 774-7483Fax. (204) 774-7500
Saskatchewan DivisionCanadian Cancer Socie1910 McIntyre StreetRegina, Saskatchewan Tel. (306) 790-5822Fax. (306) 569-2133
Alberta & N.W.T. DiviCanadian Cancer Socie#200, 2424-4th Street SCalgary, Alberta T2S 2

8/14/2019 Years Lost by Disease
http://slidepdf.com/reader/full/years-lost-by-disease 113/116

8/14/2019 Years Lost by Disease
http://slidepdf.com/reader/full/years-lost-by-disease 114/116

8/14/2019 Years Lost by Disease
http://slidepdf.com/reader/full/years-lost-by-disease 115/116
8/14/2019 Years Lost by Disease
http://slidepdf.com/reader/full/years-lost-by-disease 116/116
Questions about Cancer?When you want to know more about cancercall the Canadian Cancer Society's CANCER INFORMATION SERVICE
1888 939-3333 MONDAY TO FRIDAY : 9AM – 6 PM
DISTRIBUTED BY :
113-055