Years Ended June 30, 2017 & June 30, 2016 yourgateway to ...Years Ended June 30, 2017 & June 30,...
169
2017 Years Ended June 30, 2017 & June 30, 2016 COMPREHENSIVE ANNUAL FINANCIAL REPORT MASSACHUSETTS PORT AUTHORITY The world is nonstop at gateway to the world. your NONSTOP FLIGHTS CONNECT BUSINESS TRAVELERS TO OPPORTUNITY, VACATIONERS TO FUN, AND FAMILIES TO HOME. NEW Madrid, ES Mexico City, MX Montego Bay, JM Montreal-PET, QC, CA Munich, DE Nassau, BS Ottawa, ON, CA Panama City, PA Paris-De Gaulle, FR Paris-De Gaulle, FR Ponta Delgada, PT Port Au Prince, HT Providenciales, TC Puerto Plata, DO Punta Cana, DO Reykjavik, IS Reykjavik, IS Rome-Da Vinci, IT Santiago, DO Santo Domingo, DO Shanghai, CN Shannon, IE Tel Aviv-Yafo, IL Terceira, PT Tokyo-Narita, JP Toronto, ON, CA Toronto, ON, CA Toronto-City, ON, CA Zurich, CH Amsterdam, NL Aruba, AW Beijing, CN Bermuda, BM Bermuda, BM Bogota, CO Bridgetown, BB Cancun, MX Cancun, MX Cancun, MX Copenhagen, DK Doha, QA Dubai, AE Dublin, IE Frankfurt, DE Grand Cayman, KY Halifax, NS, CA Halifax, NS, CA Hong Kong, HK Istanbul, TR Liberia, CR Lisbon, PT London-Gatwick, EN, GB London-Heathrow, EN, GB London-Heathrow, EN, GB London-Heathrow, EN, GB Sao Paulo, BR Montreal-PET, QC, CA NEW
Transcript of Years Ended June 30, 2017 & June 30, 2016 yourgateway to ...Years Ended June 30, 2017 & June 30,...

2017Years Ended June 30, 2017 & June 30, 2016
C O M P R E H E N S I V E A N N U A L F I N A N C I A L R E P O R TMASSACHUSETTS PORT AUTHOR I TY
The world is nonstop at
gateway to the world.
your
NONSTOP FLIGHTS CONNECT BUSINESS TRAVELERS TO OPPORTUNITY, VACATIONERS TO FUN, AND FAMILIES TO HOME.
NEW Madrid, ES
Mexico City, MX
Montego Bay, JM
Montreal-PET, QC, CA
Munich, DE
Nassau, BS
Ottawa, ON, CA
Panama City, PA
Paris-De Gaulle, FR
Paris-De Gaulle, FR
Ponta Delgada, PT
Port Au Prince, HT
Providenciales, TC
Puerto Plata, DO
Punta Cana, DO
Reykjavik, IS
Reykjavik, IS
Rome-Da Vinci, IT
Santiago, DO
Santo Domingo, DO
Shanghai, CN
Shannon, IE
Tel Aviv-Yafo, IL
Terceira, PT
Tokyo-Narita, JP
Toronto, ON, CA
Toronto, ON, CA
Toronto-City, ON, CA
Zurich, CH
Amsterdam, NL
Aruba, AW
Beijing, CN
Bermuda, BM
Bermuda, BM
Bogota, CO
Bridgetown, BB
Cancun, MX
Cancun, MX
Cancun, MX
Copenhagen, DK
Doha, QA
Dubai, AE
Dublin, IE
Frankfurt, DE
Grand Cayman, KY
Halifax, NS, CA
Halifax, NS, CA
Hong Kong, HK
Istanbul, TR
Liberia, CR
Lisbon, PT
London-Gatwick, EN, GB
London-Heathrow, EN, GB
London-Heathrow, EN, GB
London-Heathrow, EN, GB
Sao Paulo, BR
Montreal-PET, QC, CA NEW

Designed and Printed by Millennium Printing Corporation | www.mpcprinting.comDesigned and Printed by Millennium Printing Corporation | www.mpcprinting.com
Cover Photo:
GATEWAY TO THE WORLD
To better serve the needs of New England’s business and leisure travelers, Logan’s international nonstop service has more than doubled in the past 10 years, growing from 26 to 54
destination cities around the world.

Years Ended June 30, 2017 & June 30, 2016
C O M P R E H E N S I V E A N N U A L F I N A N C I A L R E P O R TMASSACHUSETTS PORT AUTHOR I TY
Prepared by the Massachusetts Port Authority
Administration and Finance Department
located in East Boston, MA


TABLE OF CONTENTS
Table of ContentsM A S S A C H U S E T T S P O R T A U T H O R I T Y
F o r F i s c a l Ye a r s E n d e d J u n e 3 0 , 2 0 1 7 a n d J u n e 3 0 , 2 0 1 6
I n t r o d u c t o r y S e c t i o n
Letter of Transmittal Certificate of Achievement for Excellence in Financial Reporting List of Authority Board MembersOrganization Chart Executive Staff
F i n a n c i a l S e c t i o n
Report of Independent Auditors Management’s Discussion and Analysis
Financial Statements:Statements of Net Position Statements of Revenues, Expenses and Changes in Net PositionStatements of Cash Flows Notes To Financial Statements:
1. Summary of Significant Accounting Policies and Practices2. Reconciliation Between Increase in Net Position as Calculated Under GAAP and Net Revenues as Calculated Under Accounting Practices Prescribed by the 1978 Trust Agreement 3. Deposits and Investments 4. Capital Assets 5. Bonds and Notes Payable 6. Pension Plan 7. Other Postemployment Benefits 8. Leases 9. Risk Management 10. Payments in Lieu of Taxes 11. Commitments 12. Litigation 13. Interagency Agreements 14. Subsequent Events
Required Supplementary Information:Schedule of OPEB Funding Progress Schedule of Pension Contributions Schedule of Changes in the Net Pension Liability and Related Ratios
Supplementary Schedules:I. Combining Schedule of Net Position as of June 30, 2017 II. Combining Schedule of Revenues, Expenses, and Changes in Net Position for the year ended June 30, 2017 III. Combining Schedule of Net Position as of June 30, 2016
Pages19111213
1921
545556
57
66677577838991929394949696
979899
100
101102

Supplementary Schedules (Continued):IV. Combining Schedule of Revenues, Expenses, and Changes in Net Position for the year ended June 30, 2016
S t a t i s t i c a l S e c t i o n
S-1 Revenues, Expenses and Changes in Net Position S-2 Most Significant Revenues and Related Rates and Charges S-3 Historical Principal Operating Revenue Payers S-4 Conversion of GAAP Revenues and Expenses to the 1978 Trust Agreement Revenues and Expenses S-5 Calculation of Net Revenues Pledged Under the 1978 Trust Agreement S-6 Calculation of Total PFC Revenue Pledged Under the PFC Trust Agreement and Calculation of Total CFC Revenue Pledged Under the CFC Trust Agreement S-7 Calculation of Debt Service Coverage Under the 1978 Trust Agreement, the PFC Trust Agreement and the CFC Trust Agreement S-8 Debt Metrics Under the 1978 Trust Agreement, the PFC Trust Agreement and the CFC Trust Agreement S-9 Largest Private Sector Employers S-10 Demographics and Employment Data S-11 Number of Employees by Facility S-12 Logan International Airport Traffic Metrics S-13 Logan International Airport Market Share of Total Passenger Traffic S-14 Logan International Airport Passenger Markets S-15 Port of Boston Cargo and Passenger Activity S-16 Port of Boston Principal Customers S-17 Tobin Memorial Bridge S-18 Insurance Coverage S-19 Physical Asset Data
A n n u a l D i s c l o s u r e S e c t i o n
Annual Disclosure Document – 1978 Trust Agreement Annual Disclosure Document – CFC Trust Agreement A p p e n d i c e s Appendix CFC-1-Total Enplaned Passengers, By Type of Passenger Appendix CFC-2-Debt Service Coverage – Rate Covenant
T a b l e o f C o n t e n t s ( C o n t i n u e d )
Pages
103
108110113
114115
118
120
122125126128130132135136139140141142
145157
CFC-1CFC-2

IntroductionThe Terminal E Renovation and Enhancement project, completed in June 2017,
modified three gates at Terminal E to allow flexibility in accommodating larger
aircraft. It also improved the passenger experience for international travelers,
with modern amenities and an additional 95,000 sq. feet of terminal space.
T e r m i n a l E I m p r o v e m e n t s


I N T R O D U C T I O N
1
November 28, 2017*Massachusetts Port AuthorityOne Harborside Drive, Suite 200SEast Boston, MA 02128-2090Telephone (617) 568-5000 www.massport.com
To the Members of the Massachusetts Port Authority:
The past year has been one of extraordinary progress for Massport and our efforts to fulfill our mission to be “a world-class organization that moves people and goods and connects Massachusetts and New England to the world safely and securely while being a good neighbor to people who live near our facilities.”
Our most significant accomplishments did not come without great effort. We have succeeded with strategy, planning, and a strong partnership of government, the private sector, labor, non-profit advocacy, and our neighboring communities. Achieving our goals has required collaboration, creativity, optimism, intuition, tenacity and a willingness to explore new ideas.
We are pleased to submit the Comprehensive Annual Financial Report (“CAFR”) of the Massachusetts Port Authority (the “Authority” or “Massport”) for the fiscal year ended June 30, 2017. This report was prepared by the Authority’s Administration and Finance Department, and presents our financial results for the year as well as selected highlights to illustrate our approach to tackling some of our most complex challenges.
Meeting the challenges of 2017 -- selected highlights
Staying ahead of security threatsSafety and security continue to be Massport’s number one priority, and we are constantly adapting security measures to address new and emerging threats from terrorist attacks and gun violence. This includes making investments in new technology, training, people – and even dogs. At Logan Airport, trained law enforcement officials are using “vapor wake” dogs specially trained to detect vapors in the air from explosives hidden in baggage and cargo.
During the past five years, Massport has conducted over 300 Authority-wide exercises, drills and training events. These events have focused on aviation and maritime security, fire-rescue and life safety, preparing and responding to hostile events, and resiliency. We don’t simply talk about security threats – we practice and prepare for them on a continual basis.
In September 2017, Massport conducted the Logan Emergency Access Plan, its largest scale exercise to date, to simulate an Active Shooter incident in a Logan Airport terminal. This training exercise involved more than 1,300 law enforcement, fire rescue, emergency medical services, airport operations personnel and volunteers. Law enforcement participants included the Massachusetts State Police, Massport Police, MBTA Police, Boston Police, Chelsea and Winthrop Police, the FBI, Customs and Border Patrol, and others. Fire rescue and emergency services included Massport Fire Rescue, Boston Fire, Boston EMS and MEMA (Massachusetts Emergency Management Agency). Airport operations personnel included Massport employees, TSA (Transportation Security Administration) and staff from all of the major airlines serving Logan Airport. All involved agreed that this exercise, and especially the interaction/collaboration between all of the various participants, was extremely beneficial. Since September 11, 2001, Massport security officials, airline representatives and members of all federal, state and local agencies working at the airport have conducted daily briefings to share safety and security information, an approach which has become a model for airport (and transportation) security across the United States.
* The information derived from the Authority’s audited financial statements is as of the dateof such audit, September 29, 2017.

Transforming Logan Airport terminals for the future During the past 10 years, international non-stops from Logan Airport have more than doubled from 26 to 54. And since 2012, Massport has secured non-stop service to 12 international destinations including Tokyo, Beijing, Shanghai, Hong Kong, Tel Aviv, Dubai, Doha, Istanbul, Mexico City, Panama City, Bogota and Sao Paolo. It has been estimated that the annual economic impact to the New England Region from these 12 routes is $1.5 Billion.
After operating since 1974 with 12 gates designed to serve 1.5 million passengers, Logan Airport’s International Terminal E is on the verge of a modernization project which will enable Massport to better serve the more than seven million international passengers who traveled through Logan during fiscal year 2017.
In late March 2017, Massport completed a $170 million renovation, allowing Terminal E to better accommodate the recent growth in international passengers. This renovation to Terminal E was certified LEED Gold by the U.S. Green Building Council in the fall of 2017.
In 2018, Massport will begin phase 1 of the Terminal E Modernization project, which includes the addition of seven gates in two phases (three gates were approved in the late 1990s and never built). The modernization includes an indoor connection between Terminal E and the MBTA Blue Line aimed at encouraging more travelers to take the T. Following a rigorous 120-day review, the Terminal E Modernization project was certified by the Massachusetts Environmental Policy Act (MEPA) in late 2016.
Making Terminal B passenger-friendly. With its horseshoe shape, Terminal B has always operated more like two terminals than one. But when its two principal airlines, American Airlines and U.S. Airways merged in 2013, the layout of Terminal B became an obstacle to customer service and airline operations because the airlines were located on opposite sides of the terminal. In 2017, Massport began a $200 million project to consolidate the gates, baggage operations and passenger checkpoints of the merged airlines to enable a more efficient operation.
Addressing the Logan Airport parking shortage without harming the environmentFor the past three years, as the number of Logan passengers has dramatically increased to a record high of 37.5 million in fiscal year 2017, the airport has been plagued with a chronic parking shortage during busy travel periods. In a survey, 12% of passengers reported they missed their flight because they could not find parking. Based on an in-depth assessment, Massport concluded that an additional 5,000 spaces at the airport will alleviate this issue, and has been working diligently to amend the parking freeze that has been in place since 1975.
In addition to improving customer service, Massport determined that the additional spaces will be beneficial to the environment. The current parking shortage is actually increasing auto emissions at Logan as it is resulting in more vehicle pick-up and drop-offs, and thus the addition of 5,000 parking spaces will reduce harmful vehicle emissions (CO, VOCs, and NOx) by 23 percent as a customer who parks equates to two trips (one arriving, one departing) while one who is dropped off and then picked up equates to four.
In July 2017, after a rigorous review and comment period, the Massachusetts Department of Environmental Protection (DEP) amended the Logan Airport parking freeze to permit the addition of 5,000 spaces.
2

I N T R O D U C T I O N
3
A regional airport stimulates the economy in Worcester and Central MassachusettsFor the fourth year in a row, Worcester Regional Airport has continued its success with more than 400,000 passengers served since JetBlue began flying non-stop to Orlando and Ft. Lauderdale in 2013. This year, JetBlue announced it will begin a daily flight directly to JFK International Airport in New York in early 2018, and Rectrix began non-stop service to Hyannis.
Since taking ownership of Worcester Regional Airport (ORH) in 2010, Massport has made significant investments. A prime example is the $32 million for an upgraded Category III (CAT III) instrument landing system, which will enable aircraft to land at Worcester in low visibility instead of being diverted to Boston or other airports in the region. The CAT III project is scheduled for completion at the end of 2017.
Worcester Regional Airport is an important economic force in Worcester County, the second fastest growing county in Massachusetts. A Massachusetts Department of Transportation economic impact study found that Worcester Regional Airport contributes $46.4 million to the regional economy annually.
Creating a Port for the 21st Century2017 marked another record year for Massport’s Paul W. Conley Container Terminal. With its 7,000 jobs, the Port of Boston is the city’s 6th largest employer and contributes $4.6 billion annually to the Massachusetts economy. More than 1,600 New England businesses depend on Conley Terminal to connect their products to the world, including cranberries, seafood, toys and furniture.
By all measures, the Port of Boston is economically healthy:
Total volume and exports are up. In 2017, volume at Conley Terminal reached a new record, up nearly 4% from 2016 with 257,000 TEUs (twenty-foot equivalent units). Conley Terminal serves 12 of the world’s top 15 shipping lines, and remains the only full-service container terminal in New England.
Cruise ship business is thriving. The 2017 season will set another record by welcoming more than 150 ship calls by 36 different ships and 19 cruise lines to the Raymond L. Flynn Cruiseport at Black Falcon Terminal, a 30% increase in ship calls over the prior year.
Efficiency is up. Massport’s partnership with the International Longshoremen’s Association (ILA) has resulted in a 30% increase in crane productivity. In 2016, the Journal of Commerce (JOC) ranked Conley Terminal #1 in North America for improved efficiency.
Dredging underway. This summer, the Port of Boston rounded a critical turning point in its ambitious effort to make Boston “Big Ship Ready” and to be able to successfully compete with other east coast ports. Now underway, the $350 million Boston Harbor Dredging project is funded by a partnership between the Federal Government (the U.S. Army Corps of Engineers), the Commonwealth of Massachusetts and Massport.
Freight Corridor complete. In September, Massport completed the $75 million Thomas Butler Freight Corridor, a dedicated roadway which includes a 500-foot long bridge over the Reserved Channel to remove Conley Terminal container truck traffic from South Boston neighborhood streets. The Butler Freight Corridor also includes a 16-foot high sound barrier wall and a 4.5 acre Memorial Park.

4
A model commitment to diversity and inclusion in real estate development In May 2017, elected officials and community leaders welcomed the owner of Omni Hotels and Resorts -- and kicked off a Massport project that is expected to bring jobs and a unique commitment to diversity and inclusion in real estate development.
With leadership from the Massport Board and staff, Omni Hotels and its partner New Boston Hospitality agreed to put minority-owned and women-owned businesses at the core of the project from financing to design to construction to hotel operations. It’s a pioneering structure developed for the first time by Massport, and it ensures that an unsurpassed share of the project development roles, equity ownership, hospitality employment contracts and revenue accrue to minority and women-owned businesses.
Located on Massport-owned land, the new 1,054 room Omni Hotel will satisfy a critical need by increasing the inventory of hotel rooms in a part of Boston that has become a prime destination for tourists, business travelers and conventioneers attending events at the Boston Convention and Exhibition Center located directly across the street. The hotel will bring 700-1,000 new, permanent jobs in the hospitality industry and an expected 1,100 construction jobs. In addition, Omni Hotels and Resorts will provide a percentage of hotel profits to a number of non-profit community organizations in Boston. This partnership between Massport and Omni Hotels is good for Omni’s business and good for Massachusetts – truly a win-win.
Giving neighborhoods a voice at the tableMassport is committed to being an economic engine for Massachusetts -- and a good neighbor to communities like East Boston, South Boston and Winthrop. Last year, Massport created a Logan Impact Advisory Group (LIAG) to more deeply engage East Boston community members and their elected officials in decision-making on two significant Logan Airport projects – the modernization of International Terminal E and a proposal to add 5,000 parking spaces.
The LIAG provided valuable input on both projects and prioritized Massport community commitments to enhance the quality of life in East Boston. These include:• A new 4.5 acre park on the East Boston waterfront known as Piers Park II; • Additional funding for the East Boston Foundation; • A new Senior Center;• A traffic study of Neptune Road.
Following an announcement of these new commitments with Boston Mayor Martin J. Walsh, state and local elected officials and neighborhood residents, the East Boston Times wrote “…Massport is truly being a good neighbor.”

I N T R O D U C T I O N
5
Putting science at the core of airport noise solutionsDespite dramatic advances in making aircraft greener and quieter, a few Boston-area communities have grown increasingly vocal about overflights to and from Logan Airport. Improved engine technology has reduced the number of people exposed to “significant noise” from planes by 90% since 1980. And, more than 97% of commercial jets served by Logan Airport meet the strictest Stage 4 international noise and emissions standards.
New Federal Aviation Administration (FAA) navigation procedures for aircraft landing and departing at the nation’s airports called “RNAV” are designed to be more precise, safer, and better for the environment. However, RNAV procedures have resulted in a concentration of flights over some suburban communities. Residents of these communities, along with others nationally, have gathered data during the past three years, and urged the FAA and Massport to take another look at RNAV.
This is a national challenge for the FAA, which is responsible for managing the nation’s airspace. The FAA and Massport are listening to community concerns and taking steps to ensure that no community is bearing more than its share of overflights. In late 2016, the FAA and Massport signed a Memorandum of Understanding (MOU) and agreed to test and study a number of alternatives to reduce noise concentrations without compromising safety. These include using higher altitudes for arrivals and departures, using more over water flight paths, and implementing special procedures over more compatible areas like highways. Many communities and Massachusetts elected officials are encouraged by this first-in-the-nation collaboration between the FAA and an airport operator.
Decision-making in this complex environment requires a safe, balanced, data-driven – and regional -- approach, so that one community is not unfairly bearing more than its share of overflights year round. Safety will always come first, but by working together with the FAA and communities, we believe we can develop a solution that benefits all of us who live and work in the Boston area.
Thank YouI would like to take this opportunity to thank the Members of the Authority and our employees for their dedication and commitment to our mission. Our efforts each day to provide high levels of customer service, safe, sound and reliable infrastructure, a business climate that promotes and encourages investment in our properties, and our strong commitment to our communities, are the characteristics that set this Authority apart. I would also like to thank all the employees of the airlines, shipping and cruise lines, and our tenants and business partners who are also an integral part of Massport’s success. Most importantly, I would like to thank all of our loyal customers, whom we enjoy serving each and every day.
Very truly yours,
Thomas P. Glynn, CEO

SUPPLEMENTAL INFORMATION
The letter of transmittal should be read in conjunction with Management’s Discussion and Analysis (MD&A), which immediately follows the Independent Auditor’s Report and provides a narrative introduction, overview, and analysis of the Authority’s financial statements. Responsibility for the accuracy, completeness, and fairness of the presentation and disclosures rests with management.
Profile of the Massachusetts Port AuthorityThe Authority was created by and exists pursuant to Chapter 465 of the Massachusetts Acts of 1956, as amended to date (the “Enabling Act”) and is a body politic and corporate and a public instrumentality of The Commonwealth of Massachusetts. It is governed by a seven member board. Five members are appointed by the Governor of Massachusetts and one is appointed by the Massachusetts Port Authority Community Advisory Committee. These six members serve staggered terms of seven years each. The seventh member is the Secretary of Transportation and Chief Executive Officer of the Massachusetts Department of Transportation. Members are not compensated for their service.
The Authority owns Logan International Airport (Logan Airport), Hanscom Field, Worcester Regional Airport (Worcester Airport), Conley Terminal, Raymond L. Flynn Cruiseport at Black Falcon Terminal (Flynn Cruiseport) and various other maritime properties (the Port). The Authority has no taxing power and is not taxpayer funded. As a self-sustaining entity, the Authority relies on revenues collected from airline fees, parking fees, terminal, ground and other rents, concessions, and other fees to fund operating expenses. The Authority’s operating revenues along with federal grants, passenger facility charges (PFCs), and customer facility charges (CFCs) fund its capital expenditures. The Authority issues revenue bonds that are secured solely by the Authority’s revenues, as defined by the 1978 Trust Agreement, the PFC Trust Agreement and the CFC Trust Agreement, respectively. The Authority’s bonds do not constitute a debt or a pledge of the full faith and credit of The Commonwealth of Massachusetts or of any other political subdivision thereof. The Authority also receives Federal and State grants for specific capital projects.
Economic EnvironmentThe national economy continues to grow at a steady pace. The preliminary estimate for GDP growth in the third quarter of 2017 is 3.0%, which follows growth of 3.1% in the second quarter. Looking forward, the Bloomberg Survey of Economists projects it will increase in the 2.0-2.5% range in each of the next four quarters. The Commonwealth of Massachusetts enjoyed an even stronger GDP growth rate in the second quarter at 4.0%. The U.S. unemployment rate remains historically low at 4.2% as of September, while the Massachusetts unemployment rate in September was even lower at 3.9%.
6

I N T R O D U C T I O N
The Greater Boston Metropolitan Area is the 10th most populated Metropolitan Area in the country as of 2016. It continues to be a leader in the nation’s technology, biotechnology, healthcare, finance and education sectors, and is widely recognized as one of the premier cities for innovation. This distinction has influenced General Electric and other companies to relocate their corporate headquarters to the Boston area, which benefits the local economy. And as of the writing of this document, Boston is a prime contender for the second headquarters of Amazon as the city has many of the attributes that Amazon is looking for such as proximity to a large international airport, a highly skilled workforce, and other key criteria.
The strong U.S. and local economies have fueled growth at Logan International Airport, which also benefits from a highly competitive environment that is not dominated by one or two carriers, enjoys a high O&D (Origin-Destination) passenger percentage of 95%, and has successfully attracted more international and low cost carriers. This resulted in a robust 7.4% increase in passenger volume in fiscal year 2017 as Logan set another new record by handling 37.5 million passengers. The continued economic strength has also enabled the Authority’s Maritime businesses to produce solid financial results as reflected in a 3.9% increase in Twenty-foot Equivalent Units at Conley Terminal and a 21.7% increase in cruise passengers at Flynn Cruiseport.
Financial Policies and PracticesInternal Control EnvironmentThe Authority’s financial statements are prepared on an accrual basis of accounting. The Authority’s management is responsible for establishing and maintaining an internal control structure designed to ensure that the assets of the Authority are protected from loss, theft or misuse, and to ensure that adequate accounting data are compiled to allow for the complete and accurate preparation of financial statements in conformity with accounting principles generally accepted in the United States of America applicable to governmental enterprise funds. The internal control structure is designed to provide reasonable, but not absolute, assurance that these objectives are met.
The Authority’s Internal Audit function maintains oversight over the key areas of the Authority’s business and financial processes and controls. In addition, the Authority’s Audit and Finance Committee plays a critical role in the oversight of the Authority’s internal control structure. This committee meets with the senior staff of the Authority and has regular communication with the Authority’s independent auditors, Ernst & Young LLP. Internal Audit reports directly to the Authority’s Audit and Finance Committee.
Budgetary ControlsOperating budgetary controls and evaluations are accomplished by comparing actual interim and annual results with the budget. The Authority prepares budget and non-GAAP actual financial statements on a monthly basis and prepares unaudited GAAP financial statements on a quarterly basis.
If significant changes occur in the amounts available from expected funding sources, or if the costs of certain projects increase significantly, the Authority will reduce the scope of proposed projects, the overall capital program or both. Many of the commitments within the Authority’s capital plan have already been authorized by the Authority and extend over several years. Nevertheless, each project within its capital program is a separate “module” that the Authority approves individually along with a separate project budget. This permits the Authority to undertake the construction and financing of each of these additional projects independently of other capital projects. The Authority believes that the modular design of the capital program significantly increases its ability to make adjustments in capital spending when necessary.
7

8
Capital Financing and Debt ManagementAll debt must be issued pursuant to the Debt Issuance and Debt Management Policy adopted in February 2010 and amended in April 2016 by the Members of the Authority. As of June 30, 2017, outstanding debt obligations of the Authority issued pursuant to the Trust Agreements totaled approximately $1.72 billion, including subordinated revenue bonds but excluding commercial paper. Special facilities revenue bonds issued on behalf of and payable by certain borrowers are excluded because they are not obligations of the Authority. In fiscal year 2017, the total amounts applied to pay debt service on obligations issued pursuant to the 1978 Trust Agreement (not including subordinate obligations), the PFC Trust Agreement and the CFC Trust Agreement were $112.5 million, $55.5 million and $15.1 million, respectively.
The rating agencies continue to recognize the value of the Authority’s prudent financial management, revenue diversity and underlying market strengths. Moody’s has rated the Authority’s revenue bonds at Aa2, S&P has rated them at AA, and the Fitch rating is AA. These ratings give Massport the highest rating for all large airports in the country, and the Authority continues to diligently meet its debt service requirements, coverage ratios and other compliance issues related to the Trust Agreements.
Other InformationIndependent AuditThis report, in all material respects, presents fairly and discloses the Authority’s financial position, results of operations and cash flows as of and for the year ended June 30, 2017 in accordance with the requirements of accounting principles generally accepted in the United States of America (“GAAP”). An audit of the Authority’s financial statements as of and for the fiscal year ended June 30, 2017 has been completed by the Authority’s independent auditors, Ernst & Young LLP. Its report is included herein and includes an unmodified opinion on the Authority’s financial statements.
AwardsThe Government Finance Officers Association (“GFOA”) awarded a Certificate of Achievement for Excellence in Financial Reporting to the Authority for its CAFR for the fiscal year ended June 30, 2016. This was the 16th consecutive year that the Authority has received this prestigious award. The Authority believes that its current CAFR continues to meet the requirements of the Certificate of Achievement program, and it will be submitted to the GFOA to determine its eligibility for a Certificate of Achievement for fiscal year 2017.
Requests for InformationFor additional information concerning the Authority, please see the Authority’s website, Financial information can be found in the Financial Publications section of the www.massport.com. Authority’s website at http://www.massport.com/massport/finance/financial-publications. The Retirement CAFR can be found in the Retirement Information section of the website at http://www.massport.com/about-massport/working-at-massport/retirement-information/. Copies of the Annual Statements prepared pursuant to Rule 15c2-12 with respect to the Authority’s bonds issued under the 1978 Trust Agreement, the PFC Trust Agreement and the CFC Trust Agreement for years prior to fiscal year 2017 are available at http://www.emma.msrb.org and from the Authority. The Authority’s executive offices are located at One Harborside Drive, Suite 200S, East Boston, Massachusetts 02128, and the main telephone number is (617) 568-5000. Questions may be directed to John P. Pranckevicius, CPA, Director of Administration and Finance and Secretary-Treasurer of the Massachusetts Port Authority.

I N T R O D U C T I O N
9
for Excellencein FinancialReporting
Massachusetts Port Authority
Financial Report
June 30, 2016


A s o f N o v e m b e r 2 0 1 7
A u t h o r i t y B o a r d M e m b e r s
T h e A u t h o r i t y c o n s i s t s o f s e v e n M e m b e r s ; f i v e a p p o i n t e d b y t h e G o v e r n o r o f M a s s a c h u s e t t s
a n d o n e a p p o i n t e d b y t h e M a s s a c h u s e t t s P o r t A u t h o r i t y C o m m u n i t y A d v i s o r y C o m m i t t e e
t o s t a g g e r e d t e r m s o f s e v e n y e a r s e a c h , a n d t h e S e c r e t a r y a n d C h i e f E x e c u t i v e O f f i c e r o f
M a s s D O T . M e m b e r s s e r v e w i t h o u t c o m p e n s a t i o n .
Seated from left to right: Stephanie L. Pollack, Secretary and Chief Executive Officer of MassDOT, Lewis G. Evangelidis, Chairman, Laura J. Sen
Standing from left to right: L. Duane Jackson, Vice Chairman, Sean M. O’Brien, Patricia A. Jacobs, John A. Nucci
11
I N T R O D U C T I O N

M a s s p o r t O r g a n i z a t i o n C h a r t
Massport Board
Director of Internal Audit
Director of Aviation
Chief Information Officer
Port DirectorDirector of Capital
Programs and Environmental Affairs
Director of Media Relations
Director of Community Relations and
Government Affairs
Director of Diversity and
Inclusion / Compliance
Chief Security Officer Chief Executive Officer Chief of Staff
Chief Legal Counsel
Chief Financial Officer Director of
Administration and Finance / Secretary Treasurer
Director of Strategic and
Business Planning
Chief Development
Officer
Director of Strategic Communications/Marketing
Chief Human Resources Officer
Director of Labor Relations /
Labor Counsel
Director of Public Affairs
Director of Policy
12

Thomas P. Glynn, CEO and Executive Director
Catherine M. McDonald, Chief of Staff
John P. Pranckevicius, CFO, Director of Administration & Finance/Secretary-Treasurer
Francis X. Anglin, Chief Information Officer
Elizabeth D. Becker, Director of Community Relations & Government Affairs
Matthew D. Brelis, Director of Public Affairs
Gordon M. Carr, Deputy Director of Strategic and Business Planning
James P. Doolin, Chief Development Officer
Edward C. Freni, Director of Aviation
David M. Gambone, Chief Human Resources Officer
Joris M. Jabouin, Director of Internal Audit
Michelle N. Kalowski, Acting Chief Legal Counsel
Danny T. Levy, Director of Strategic Communications and Marketing
José C. Massó III, Director of Policy
Jennifer B. Mehigan, Director of Media Relations
George N. Naccara, Chief Security Officer
Houssam H. Sleiman, Director of Capital Programs & Environmental Affairs
Kelly B. Strong, Director of Labor Relations/Labor Counsel
Kenneth L. Turner, Director of Diversity and Inclusion/Compliance
Lisa S. Wieland, Port Director
E x e c u t i v e S t a f f
I N T R O D U C T I O N
13


FinancialThe Omni Hotel on Massport property in South Boston will have 1,050 rooms — the
biggest in the Waterfront District and the fourth largest hotel in Massachusetts.
The hotel will create jobs for the region and generate revenue for Massport.
One of the most respected aspects of the project is that diversity and inclusion
is incorporated in every stage of the hotel development - from investment to
planning, designing, construction, landscaping and management.
O m n i H o t e l D e v e l o p m e n t A g r e e m e n t


Years Ended June 30, 2017 and 2016
Financial Statements, Required Supplementary Information, and Supplementary Schedules
MASSACHUSETTS PORT AUTHOR I TY
(With Report of Independent Auditors)
F I N A N C I A L
17


F I N A N C I A L
19A member firm of Ernst & Young Global Limited
Ernst & Young LLP200 Clarendon StreetBoston, MA 02116
Tel: +1 617 266 2000Fax: +1 617 266 5843ey.com
Report of Independent Auditors
To the Members of the Massachusetts Port Authority
We have audited the accompanying financial statements of the Massachusetts PortAuthority (the Authority), as of and for the years ended June 30, 2017 and 2016, and the
financial statements as listed in the table of contents.
Management is responsible for the preparation and fair presentation of these financialstatements in conformity with U.S. generally accepted accounting principles; this includesthe design, implementation, and maintenance of internal control relevant to the preparationand fair presentation of financial statements that are free of material misstatement, whetherdue to fraud or error.
Our responsibility is to express an opinion on these financial statements based on our audits.We conducted our audits in accordance with auditing standards generally accepted in theUnited States. Those standards require that we plan and perform the audit to obtainreasonable assurance about whether the financial statements are free of materialmisstatement.
An audit involves performing procedures to obtain audit evidence about the amounts and
judgment, including the assessment of the risks of material misstatement of the financialstatements, whether due to fraud or error. In making those risk assessments, the auditor
financial statements in order to design audit procedures that are appropriate in thecircumstances, but not for the purpose of expressing an opinion on the effectiveness of the
evaluating the appropriateness of accounting policies used and the reasonableness ofsignificant accounting estimates made by management, as well as evaluating the overallpresentation of the financial statements.
We believe that the audit evidence we have obtained is sufficient and appropriate to providea basis for our audit opinion.
In our opinion, the financial statements referred to above present fairly, in all materialrespects, the financial position of the Massachusetts Port Authority as of June 30, 2017 and2016, and the changes in financial position and cash flows for the years then ended inconformity with U.S. generally accepted accounting principles.

20A member firm of Ernst & Young Global Limited
analysis, the schedule of OPEB funding progress, the schedule of pension contributions andthe schedule of changes in the net position liability and related ratios, as listed in the tableof contents, be presented to supplement the basic financial statements. Such information,although not a part of the basic financial statements, is required by the GovernmentalAccounting Standards Board which considers it to be an essential part of financial reportingfor placing the basic financial statements in an appropriate operational, economic orhistorical context. We have applied certain limited procedures to the required supplementaryinformation in accordance with auditing standards generally accepted in the United States,which consisted of inquiries of management about the methods of preparing the information
inquiries, the basic financial statements, and other knowledge we obtained during our auditof the basic financial statements. We do not express an opinion or provide any assuranceon the information because the limited procedures do not provide us with sufficient evidenceto express an opinion or provide any assurance.
Our audit was conducted for the purpose of forming an opinion on the financial statements
supplementary schedules, as listed in the table of contents, are presented for purposes ofadditional analysis and are not a required part of the basic financial statements.
The supplementary schedules are the responsibility of management and were derived fromand relate directly to the underlying accounting and other records used to prepare the basicfinancial statements. Such information has been subjected to the auditing proceduresapplied in the audit of the basic financial statements and certain additional procedures,including comparing and reconciling such information directly to the underlying accountingand other records used to prepare the basic financial statements or to the basic financialstatements themselves, and other additional procedures in accordance with auditingstandards generally accepted in the United States. In our opinion, the information is fairlystated, in all material respects, in relation to the basic financial statements as a whole.
The introductory section, statistical section, and annual disclosure section, including therelated appendices, have not been subjected to the auditing procedures applied in the auditof the basic financial statements, and, accordingly, we do not express an opinion or provideany assurance on it.
September 29, 2017

F I N A N C I A L
21
Management’s Discussion and Analysis
The fo l lowing Management’s D is cuss ion and Ana lys is (MD&A) of the ac t iv i t i es and f inanc ia l per formance
of the Massachuset ts Port Author i ty ( the Author i ty) prov ides an in t roduct ion to the f inanc ia l s tatements
of the Author i ty for the f i s ca l years ended June 30, 2017, 2016 and 2015. Th is d i s cuss ion was prepared
by management , and i t shou ld be read in con junc t ion wi th the aud i ted f inanc ia l s tatements and notes that
fo l low th is sec t ion .
Overview of the Financial StatementsThe Authority’s financial statements consist of: (1) the Statements of Net Position; (2) the Statements of Revenues, Expenses and Changes in Net Position; and (3) the Statements of Cash Flows. These financial statements have been prepared in accordance with U.S. generally accepted accounting principles as promulgated by the Governmental Accounting Standards Board (GASB).
The comparative Statements of Net Position depict the Authority’s financial position as of a point in time, specifically June 30, 2017, and 2016, and include all assets, deferred outflows, liabilities and deferred inflows of the Authority. Net position represents the residual interest in the Authority’s assets and deferred outflows after liabilities and deferred inflows are deducted. The Authority’s net position is divided into three components: 1) net investment in capital assets, 2) restricted, and 3) unrestricted. Please see Note 1 in the financial statements attached hereto for a discussion on the Authority’s net position.
The Statements of Revenues, Expenses and Changes in Net Position report operating revenues, operating expenses, non-operating revenue and expenses, and other changes in net position. Revenues and expenses are categorized as either operating or non-operating based upon management’s policies as established in accordance with definitions set forth by the GASB. Certain sources of the Authority’s revenues, including PFCs, CFCs, investment income and capital grants are reported as non-operating revenues, and their uses are restricted and generally are not available for operating purposes.
The Statements of Cash Flows present information showing how the Authority’s cash and cash equivalents changed during the fiscal year. The Statements of Cash Flows classify cash receipts and cash payments resulting from operating activities, capital and related financing activities, and investing activities.

22
Business Activity Highlights
Logan Airport Served 37.5 million passengers - new record
• 7.4% increase versus prior year.
• 30.5 million domestic passengers (+5.6%) due to continued expansion by JetBlue Airways (+10.4%), Delta Air Lines (+12.9%) and Spirit Airlines (+45.8%).
• 7.0 million international passengers (+15.9%) as the result of growth by TAP Portugal, Norwegian Air Shuttle, WestJet Encore, Qatar Airways, Hainan Airlines and JetBlue Airways. New destinations including Bogota, Colombia and Vancouver, Canada were added.
• Completed the Terminal E Renovation project to upgrade hold rooms to accommodate Logan’s growing international travel and modify gates to facilitate larger aircraft including the Airbus A380.
LOGAN INTERNATIONAL AIRPORT
NEW TERM INAL E INTER IORPASSENGERS SERVED (M i l l i o n s )
29.4
4.5 4.7 5.26.0
7.0
24.9 26.2 27.1 28.9 30.5
FY 13 FY 14 FY 15 FY 16 FY 17
30.9 32.334.9
Domestic International
40
30
20
10
0
37.5

F I N A N C I A L
23
Worcester Regional Airport Has Handled 423,000 JetBlue Passengers since Service Began in November 2013
• Load Factors on Orlando and Ft. Lauderdale flights remain above 80%.
• JetBlue announced plans for service between Worcester and their New York JFK hub.
• Rectrix launched service from Worcester to Hyannis and Nantucket.
WORCESTER REGIONAL AIRPORT
CUMULAT IVE JETBLUE PASSENGERS( T hou sand s )
J E TB LUE A I RCRAFT AT WORCESTER
72
FY 14 FY 15 FY 16 FY 17
191
312
423450
375
300
225
150
75
0

24
Conley Terminal Processed 256,951 TEUs (Twenty-foot Equivalent Units) - new record
• 3.9% increase in TEUs versus prior year.
• Larger ships are calling on the terminal as the average ship size in fiscal year 2017 was in the 7,000 TEU range, up from approximately 6,000 TEUs in fiscal year 2016. Ships as large as 9,000 TEUs called on the terminal in fiscal year 2017, and the shipping lines would like to place larger ships in the rotation as soon as Conley Terminal can accommodate them.
• Two new alliances, THE Alliance and the Ocean Alliance, added Conley Terminal to their rotations during FY17. Including these two alliances, the Port of Boston now serves 12 of the world’s 15 largest shipping lines, up from serving five shipping lines four years ago.
• Continued strength of the New England economy, shippers shifting cargo to Boston from other more congested ports, and ongoing actions to improve productivity at Conley Terminal also drove business growth.
• Massport was awarded a $42 million FASTLANE grant from the U.S. Department of Transportation to improve and modernize Conley Terminal.
• Economic Development legislation was signed by Governor Baker authorizing $107.5 million of state funds for improvements to Conley Terminal to accommodate larger container vessels. Funds will be used for the construction of a new deep-water Berth 10 and the procurement of three new cranes capable of servicing the larger ships.
CONLEY CONTAINER TERMINALMSC ADELA IDE
(9 ,000 T EU Ve s s e l ) TEUS PROCESSED
( T hou sand s )
221
FY 15 FY 16 FY 17
247257
250
225
200
175

F I N A N C I A L
25
F I N A N C I A L
Raymond L. Flynn Cruiseport Boston Served 351,914 Passengers
• Significant 21.7% increase versus prior year.
• 10 more Turnarounds and 7 additional Port of Calls driven in part by new incentive program to award cruise lines for new itineraries and larger ships. Total Turnarounds and Port of Calls in fiscal year 2017 of 124 represents a 16% increase over prior year.
• 3 new cruise companies called on Flynn Cruiseport Boston during FY17, including Azamara Club Cruises, Prestige Cruise Holdings and Viking Cruises.
FLYNN CRUISEPORT BOSTON
PASSENGERS( T hou sand s )
THREE CRU ISE SH IPSi n Bo s t o n Ha rbo r
Real Estate Advanced Two Major Projects
• Construction began on the South Boston Waterfront Transportation Center (SBWTC) during fiscal year 2017. This facility will include a 1,500 space garage to support the rapid growth in the Seaport District, and also serve as a mobility hub with a connection to the MBTA and other transportation modes for the community. The facility is expected to open in mid-2018.
• An agreement to construct a 1,000+ room hotel on land owned by the Authority across from the Boston Convention and Exhibition Center was executed with Omni Hotels and Resorts. In addition to providing hotel capacity to support growing convention center demand, the agreement contained unique goals requiring minority-owned businesses to participate in the equity, design, construction, development and hotel operations.
FY 15 FY 16 FY 17
331
289
352350
325
300
275
250

26
Financial Highlights
Revenue Increased $61 million to $761 million
• 8.8% increase versus prior year.
• Logan Revenue up $52.8 million or 9.0% due to recovery of operating and capital costs from airlines, additional parking revenue due to a rate increase, and volume-related revenues such as concessions driven by the 7.4% increase in passengers. This revenue will be used to fund Massport’s strategic initiatives.
• Maritime Revenue up $7.4 million or 9.9% due to container volume and rate increases and higher cruise activity. This revenue will be used to fund Boston Harbor dredging and new cranes for Conley Terminal.
• Real Estate Revenue up $0.5 million or 2.0% due to higher ground rents.
OPERATING REVENUES ($ Millions)
662.9
572.4
68.422.1
FY 15
699.5
600.3
74.724.5
FY 16
760.9
653.8
82.125.0
FY 17
Total Aviation Maritime Real Estate
900800
700
600
500
400
300
200100
0

F I N A N C I A L
27
Expenses Increased $37 million to $726 million
• Higher business activity caused expenses to increase by $5.1 million for items including Stevedoring, Shuttle Bus operation, Ground Transportation staffing, credit card processing fees and airport terminal cleaning.
• Payroll expense increased by $6.7 million due primarily to the annual merit and collectively bargained wage increases.
• Utilities expenses were higher by $3.0 million.
• Airfield Paving, Repairs and Maintenance expense was up by $2.8 million to keep Logan Airport operating in a safe manner.
• Weather-related expenses were up $2.1 million due to 48 inches of snow in fiscal year 2017 versus 36 inches in fiscal year 2016.
• The Authority sponsored the Sail Boston event, which was attended by approximately three million people over a four day period according to event organizers and was estimated to inject $120 million into the local economy. Sail Boston resulted in $1.6 million of additional expense for safety and security personnel, equipment rentals, screening activities and other items.
• Pension and Other Post-Employment Benefits (OPEB) expense increased by $7.9 million or 26.6% due to
a higher pension liability from the impact of a lower discount rate and revisions to the OPEB mortality tables and number of beneficiaries receiving health care coverage, which were previously omitted from the prior year’s actuarial valuation.
• Depreciation and Amortization expense increased $5.3 million or 2.1% due to new investment in the Authority’s assets and a $3.3 million charge to depreciation related to the retirement of terminal baggage system assets that were replaced as part of the Checked Baggage Inspection System (CBIS) initiative throughout Logan Airport.

28
Operating Income was $35.1 million, up from $10.8 million in prior year
• Revenue growth from airline cost recovery, a Logan Airport parking fee increase, and higher business volume revenues exceeded expense growth resulting in operating income margin expansion to be used to fund Massport’s strategic initiatives.
• FY17 operating income margin of 4.6% was higher than FY16 margin of 1.5%, but is still below peer airport levels.
OPERAT ING INCOME($ M i l l i o n s )
OPERAT ING MARGIN
13.4
FY 15 FY 16 FY 17
10.8
35.1
2.0%
FY 15 FY 16 FY 17
1.5%
4.6%30
4.0%
20
102.0%
0 0
40 6.0%

F I N A N C I A L
29
The Authority’s Net Position increased by 4.4% of $91 Million, Down $14 Million Compared to the Prior Year
• Net position is a key indicator of the financial health of the Authority and is comprised primarily of fixed assets owned by the Authority. Growth in these fixed assets as the Authority invests more in its businesses has resulted in a steady increase in net position over the last several years.
• The fiscal year 2017 increase of $90.8 million was due to $35.1 million of operating income, $43.1 million of non-operating income, and $12.6 million of capital grant revenue.
• Expansion of the Authority’s net income will be used to fund critical strategic initiatives such as adding parking capacity at Logan Airport, Terminal E modernization, the dredging of Boston Harbor and other investments in the Maritime business to enable Conley Terminal to handle larger container ships.
Operating RevenuesOperating Expenses Including Depreciation and AmortizationOperating IncomeTotal Non-Operating Revenues (Expenses), Net Capital Grant RevenuesIncrease (Decrease) In Net PositionNet Position, Beginning Of YearNet Position, End Of Year
Operating RevenuesOperating Expenses Including Depreciation and AmortizationOperating IncomeTotal Non-Operating Revenues (Expenses), Net Capital Grant RevenuesIncrease (Decrease) In Net PositionNet Position, Beginning Of YearNet Position, End Of Year
CONDENSED STATEMENT OF REVENUES, EXPENSES AND CHANGES IN NET POSITION(In Millions)
FY 2017
$760.9
$725.8$35.1 $43.1$12.6$90.8
$2,083.9$2,174.7
FY 2016
$699.5
$688.7$10.8$38.5$56.0
$105.3$1978.6
$2,083.9
$ Change
$61.4
$37.1$24.3
$4.6($43.4)($14.5)$105.3$90.8
% Change
8.8%
5.4%225.0%
11.9%-77.5%-13.8%
5.3%4.4%
FY 2016
$699.5
$688.7$10.8 $38.5$56.0
$105.3$1,978.6
$2,083.9
FY 2015
$662.9
$649.5$13.4$38.1$56.0
$107.4$1,871.2$1,978.6
$ Change
$36.6
$39.2(2.6)$0.4$0.0
($2.1)$107.4$105.3
% Change
5.5%
6.0%-19.4%
1.0%0.0%-2.0%5.7%5.3%

30
Deta i led desc r ip t ions of operat ing revenues and expenses , and non-operat ing revenues and expenses are
desc r ibed in the fo l lowing sec t ions .
The Authority’s operating revenues for fiscal year 2017 were $760.9 million, an increase of $61.4 million or 8.8% over fiscal year 2016. This growth was primarily the result of higher parking revenue due to a fee increase to fund strategic initiatives, additional concession revenue driven by the 7.4% increase in passengers at Logan Airport, higher container volume at Conley Terminal, and the recovery of operating and capital investment expenses from the airlines in the form of higher Landing Fees and Terminal Rent.
Aviation RentalsAviation ParkingAviation FeesAviation ConcessionsShuttle BusAviation Operating Grants and OtherTotal Aviation RevenuesMaritime Fees, Rental and OtherReal Estate Fees, Rental and OtherTotal
Operating Revenues
OPERAT ING REVENUES (In Millions)
Aviation RentalsAviation ParkingAviation FeesAviation ConcessionsShuttle BusAviation Operating Grants and OtherTotal Aviation RevenuesMaritime Fees, Rental and OtherReal Estate Fees, Rental and OtherTotal
FY 2017$217.9$169.4$145.4
$98.9$19.3
$2.9$653.8
$82.1$25.0
$760.9
FY 2016$198.1$154.6$139.4
$87.4$18.0
$2.8$600.3
$74.7$24.5
$699.5
$ Change$19.8$14.8
$6.0$11.5
$1.3$0.1
$53.5$7.4$0.5
$61.4
% Change10.0%9.6%4.3%
13.2%7.2%3.6%8.9%9.9%2.0%8.8%
FY 2016$198.1$154.6$139.4
$87.4$18.0
$2.8$600.3
$74.7$24.5
$699.5
FY 2015$186.0$149.2$135.0
$82.7$15.7
$3.9$572.4
$68.4$22.1
$662.9
$ Change$12.1
$5.4$4.4$4.7$2.3
($1.1)$27.9
$6.3$2.4
$36.6
% Change6.5%3.6%3.3%5.7%
14.6%-28.2%
4.9%9.2%
10.9%5.5%

F I N A N C I A L
31
Aviation Revenues
Fiscal Year 2017 Compared to 2016The Authority’s aviation revenues are derived from its three airport facilities: Logan Airport, Hanscom Field and Worcester Regional Airport. The Authority earned $653.8 million in revenues from its aviation operations in fiscal year 2017.
LoganHanscomWorcesterTotal
AVIAT ION REVENUES (In Millions)
FY17 AVIAT ION REVENUE COMPONENTS
FY 2017
$639.3$12.9
$1.6$653.8
FY 2016
$586.5$12.2
$1.6$600.3

32
Logan Airport RevenuesLogan Airport generated $639.3 million in revenues in fiscal year 2017, a $52.8 million, or 9.0% increase over last year due to a record-breaking 37.5 million passengers, a parking rate increase and the recovery of terminal operating and capital costs.
Aviation rentals revenues are earned through terminal building, non-terminal building and ground lease agreements. Revenue from Logan Airport rentals was $211.3 million, a $19.8 million or 10.3% increase over prior year. Terminal rent accounts for 76.5% of this revenue, and increased by $19.5 million. This was driven primarily by the recovery of terminal operating and capital costs from the airlines in the form of higher terminal rental rates. The other major contributor was the 15.9% increase in international passengers as the airlines pay an arrival and departure fee per international passenger to use Terminal E. Aviation parking revenues are primarily generated from the Authority’s on-airport and off-airport parking facilities. This revenue is essential to fund the Authority’s capital investment program. In fiscal year 2017, Logan parking revenue was $168.9 million, up $14.8 million or 9.6% versus prior year due primarily to a rate increase at all Logan parking facilities that was introduced at the beginning of fiscal year 2017. Commercial parking on-site at Logan Airport accounted for $155.0 million and was up $12.9 million or 9.1%. Employee parking revenues were $8.4 million, up $1.3 million or 17.6% due to a rate increase necessary to fund employee bus service and other operating costs in an effort to reduce this subsidy. Parking revenue from the three off-airport Logan Express locations was $5.5 million, up $0.7 million or 14.1% due to a 6% increase in passenger use and a longer duration in the average number of days parked at these facilities.
Revenues from aviation fees consist of revenues earned from aircraft landing fees, utility reimbursements, and other aviation related fees such as aircraft parking and fueling. During fiscal year 2017, Logan Airport aviation fees were $138.9 million, a $5.2 million or 3.9% increase over prior year. Logan Airport aircraft landing fees, which account for more than 80% of Logan aviation fees, were higher by $8.7 million or 8.3% in fiscal year 2017. These landing fees are collected from scheduled and non-scheduled airlines based on the landed weight of aircraft serving Logan Airport. The landing fee rate is determined annually based on full cost recovery of landing field operating and capital costs required to operate and maintain the airfield at Logan Airport in a safe and efficient manner for the Authority’s airline customers. The increase in costs recovered in fiscal year 2017 was driven by higher operating costs for items including repairs, maintenance, snow removal and utilities, as well as an increase in capital costs for items including Logan Airport radar enhancements, airfield replacement equipment and new snow melters.
Logan RentalsLogan ParkingLogan FeesLogan ConcessionsShuttle Bus Logan Operating Grants and OtherTotal
LOGAN AIRPORT REVENUES(In Millions)
FY 2017$211.3$168.9$138.9
$98.0$19.3
$2.9$639.3
FY 2016$191.5$154.1$133.7
$86.6$18.0
$2.6$586.5

The Authority earned $19.2 million of revenue in fiscal year 2017 for the Logan Airport shuttle bus operations, an increase of $1.2 million over last year. Shuttle bus operations are comprised of an on-airport shuttle that links the terminal buildings, rental car center, and public transit station, as well as the bus operations from four off-air-port Logan Express sites in the Boston metropolitan region and Boston’s Back Bay area. Logan Express revenue from the four sites at Braintree, Framingham, Peabody and Woburn increased by $0.8 million or 9.0% primarily as the result of a 6% increase in ridership. Revenues from the Back Bay shuttle and the Silver Line service operated in partnership with the MBTA were both up slightly versus prior year, while revenue from the on-airport shuttle bus was relatively flat in fiscal year 2017 versus prior year. The revenue from the Silver Line bus service is used to offset a portion of the $4.1 million in operating costs paid by the Authority for bus service between Logan Airport and South Station.
During fiscal year 2017, Logan Airport received $2.9 million in revenues from federal operating grants for safety and security compared to $2.6 million in the prior year.
F I N A N C I A L
33
Aviation concessions revenues are earned from airport terminal retail operations, on-airport car rental transac-tions, and the activities of ground transportation and other service providers including taxis, bus, limousine, Transportation Network Companies (TNCs), aircraft ground handling, and in-flight catering. In fiscal year 2017, Logan Airport earned $98.0 million from concessions compared to $86.6 million in fiscal 2016, an increase of $11.4 million or 13.2%. Revenues from in-terminal concessions totaled $40.0 million, an increase of $6.0 million or 17.6% compared to the prior year. This increase was mainly due to a $2.9 million increase in reve-nues from food and beverage and retail concessions resulting from the 7.4% increase in passengers and a $2.6 million increase in Advertising commissions from growth in the volume of ads at Logan Airport. During fiscal year 2017, Logan Airport earned $33.3 million from rental car companies, an increase of $2.0 million or 6.4% primarily due to 5.4% growth in revenue per transaction versus the prior year. Ground transportation and other concession revenues were $24.7 million, an increase of $3.4 million. Fees from ground transportation increased by $2.0 million or 20.6%. These fees are collected from taxis, buses, limos and TNCs, which began operating at Logan Airport in February 2017. Other concession revenues from commercial services and ground servicing increased by $1.4 million or 11.4% due to higher levels of passengers and aircraft operations.
In-TerminalRental CarGround Transportation & OtherTotal
LOGAN AIRPORT CONCESSION FEES(In Millions)
Landing FeesUtilitiesOtherTotal
LOGAN AIRPORT AVIAT ION FEES (In Millions)
FY 2017$113.2
$15.3$10.4
$138.9
FY 2016$104.5
$18.0$11.2
$133.7
FY 2017$40.0$33.3$24.7$98.0
FY 2016$34.0$31.3$21.3$86.6

34
Hanscom Field and Worcester Regional Airport RevenuesHanscom Field revenues were $12.9 million in fiscal year 2017, up $0.7 million or 5.7% from prior year. The increase was mainly due to higher aircraft fuel flowage and landing fees at the airport. Worcester Regional Airport had $1.6 million in operating revenues in fiscal year 2017, equivalent to prior year revenues.
Fiscal Year 2016 compared to 2015The Authority earned $600.3 million in aviation revenues from its operations in fiscal year 2016, up $27.9 million or 4.9% compared to prior year. Revenue from Logan Airport rentals increased by $11.8 million or 6.6% due to increased airline terminal rents for the recovery of operating expenses and capital improvements and growth in international passengers arriving in Terminal E. Logan Airport parking revenues grew by $5.4 million or 3.6% primarily from a 2.7% increase in parking exits. Concession revenues at Logan Airport were up by $4.8 million or 5.9%. Commissions from ground transportation, commercial services and ground servicing increased by $2.3 million, while revenue from in-terminal concessions such as food and beverage, retail, news/gifts and other such items increased by $1.4 million. Commissions on rental cars grew by $1.0 million. Aviation fee revenue at Logan Airport increased by $4.6 million or 3.6%. The majority of the increase was from Landing Fees, which grew by $3.4 million for operating and capital cost recovery. Revenue from the Authority’s shuttle bus operations increased by $2.3 million or 14.6%, primarily due to a $1.1 million increase from off-airport shuttle bus operations due to an 8.0% increase in Logan Express ridership and $0.9 million of revenue received from the MBTA to offset a portion of the costs that the Authority pays for the operation of the Silver Line bus service between Logan Airport and South Station. Aviation operating grants and other revenues were $1.0 million lower than the prior fiscal year.
Shuttles BusOtherTotal
LOGAN AIRPORT SHUTTLE BUS AND OTHER REVENUES(In Millions)
HanscomWorcesterTotal
HANSCOM AND WORCESTER REVENUES(In Millions)
FY 2017$19.2
$2.9$22.1
FY 2016$18.0
$2.6$20.6
FY 2017$12.9
$1.6$14.5
FY 2016$12.2
$1.6$13.8

F I N A N C I A L
35
Maritime Revenues
Fiscal Year 2017 Compared to 2016Maritime fees, rentals and other revenues are collected primarily from container shipping lines, cruise ship lines and other customers that use the Authority’s Port facilities. The Authority’s maritime business includes cargo container ship operations at Conley Terminal, cruise activity at the Flynn Cruiseport, rental facilities for seafood processors and commercial parking at the Boston Fish Pier in South Boston, and the Moran Terminal, which houses an automobile import/export facility and other port properties in Charlestown. The Authority collected $82.1 million in fees, rentals and other income from its maritime operations in fiscal year 2017.
ContainersCruiseSeafoodAutoportTotal
MARIT IME REVENUES(In Millions)
Cruise10%
Seafood6%
Autoport6%
A
FY17 MARIT IME REVENUE COMPONENTS
Container78%
FY 2017$64.1
$7.9$5.1$5.0
$82.1
FY 2016$59.3
$5.8$5.0$4.6
$74.7

36
During fiscal year 2017, the container business at Conley Terminal earned $64.1 million in revenues, which was $4.8 million or 8.1% higher than the prior year. Revenue is generated through the collection of fees from ocean shipping lines for the loading and unloading of containers at Conley Terminal and for related services through tariffs and contracts with the shipping lines and shippers using the Port. Conley Terminal processed a record 256,951 TEUs, a 3.9% increase over the prior year. Revenues from operations at the Flynn Cruiseport were $7.9 million in fiscal year 2017, up $2.1 million or 36.2% versus prior year. The Authority collects per passenger fees as well as dockage, water and equipment rental charges from home-port and port-of-call cruise ships that dock at the Cruiseport. Passenger fees increased in fiscal year 2017 due to the addition of a supplemental security fee to fund the partial recovery of security costs at the Cruiseport. Fiscal year 2017 cruise passengers increased by 21.7% over prior year as the benefits from a new marketing incentive program to reward cruise lines for meeting certain targets began to be realized. Growth was also driven by a full schedule of calls by the Norwegian Cruise Lines’ Norwegian Dawn, which was in dry dock for part of the fiscal year 2016 cruise season.
Seafood revenues grew to $5.1 million in fiscal year 2017, up 2.0% from the prior year. Revenues are earned through space and ground rents from seafood processing and office tenants, commissions, utility charges, fees and parking lots at the Fish Pier. The $0.1 million increase in seafood revenues in fiscal year 2017 is mainly due to an increase in rental income from higher occupancy rates. The occupancy rate for fish processing space at the Fish Pier increased from 94% at the end of fiscal year 2016 to 100% in fiscal year 2017 as all available space for commercial use at the Fish Pier is currently being rented.
The Autoport earned $5.0 million in fiscal year 2017, which was $0.4 million or 8.7% higher than prior year. Autoport revenues are earned from ground leases, subtenant percentage rents, commissions on fuel sales and utility reimbursement fees. The increase in fiscal year 2017 was primarily due to a contractual increase in ground lease revenue and higher utility fee reimbursements.
Fiscal Year 2016 Compared to 2015The Authority collected $74.7 million in fees, rentals and other income from its maritime operations in fiscal year 2016. This was $6.3 million or 9.2% higher than the prior year.
Container revenues were higher by $6.4 million or 12.1% as Conley Terminal set a new record by processing 247,329 TEUs, a 12.0% increase over prior year. Seafood and Autoport revenues increased by a combined $0.2 million primarily due to higher ground lease and parking revenues. Cruiseport revenues declined by $0.4 million due to 12.5% fewer passengers. The reduction in passengers was primarily due to fewer calls by Norwegian Cruise Lines’ Norwegian Dawn, which was in dry dock for a portion of the cruise season.

F I N A N C I A L
37
Real Estate Revenues
Fiscal Year 2017 Compared to 2016The Authority’s commercial real estate line of business earns revenues from ground leases, district service fees and parking on properties owned by the Authority in South Boston, East Boston and Charlestown. Revenues from the Authority’s real estate activities totaled $25.0 million in fiscal year 2017, up $0.5 million or 2.0% versus prior year.
The increase in revenue was primarily due to a $0.3 million increase in ground rent income due to annual adjustments to leases, higher utility fee reimbursements of $0.1 million and other miscellaneous increases of $0.1 million. The Authority received a $5.0 million up-front lease assignment fee related to property located at 88 Black Falcon in South Boston. This revenue will be amortized over the remaining life of the agreement. Parking income in fiscal year 2017 was comparable to prior year as market based rate increases were offset by lower parking revenues caused by construction projects in South Boston. This construction caused a decrease in spaces that generate revenue for the Authority, such as the parking lot for the Waterside Place tenants.
Fiscal Year 2016 Compared to 2015Revenues from the Authority’s real estate activities in fiscal year 2016 totaled $24.5 million and reflected an increase of $2.4 million versus fiscal year 2015. This was primarily due to a $1.0 million increase in general rental income due primarily to annual adjustments to ground leases, a one-time transaction rent fee of $1.0 million related to a property refinancing, and a $0.4 million increase in parking revenue due to higher parking volume and market based rate increases.
FY17 REAL ESTATE REVENUE COMPONENTS
Real Estate
REAL ESTATE REVENUES(In Millions)
FY 2017$25.0
FY 2016$24.5

38
Operating Expenses
The Authority’s total operating expenses in fiscal year 2017 were $725.8 million, an increase of $37.1 million or 5.4% over the prior year. The increase was due primarily to a $20.9 million or 6.4% increase in operations and maintenance expenses to support higher business activity. Pension and other post-employment benefits expense grew by a combined $7.9 million or 26.6% due to a higher pension liability resulting from a reduction in the discount rate, and revisions to the mortality tables and the number of beneficiaries, previously omitted from the prior year’s actuarial valuation. Depreciation and amortization expense increased by $5.3 million or 2.1% as $385 million of assets were placed into service.
Aviation Operations and MaintenanceMaritime Operations and MaintenanceReal Estate Operations and MaintenanceGeneral and AdministrativePayments in Lieu of TaxesPension and Other Post-employment BenefitsOther Depreciation and AmortizationTotal Operating Expenses
Aviation Operations and MaintenanceMaritime Operations and MaintenanceReal Estate Operations and MaintenanceGeneral and AdministrativePayments in Lieu of TaxesPension and Other Post-employment BenefitsOther Depreciation and AmortizationTotal Operating Expenses
OPERAT ING EXPENSES (In Millions)
FY 2017$274.5
$59.6$13.2$59.1$19.3$37.6
$9.6$252.8$725.8
FY 2016$261.1
$53.4$11.9$58.2$19.4$29.7
$7.6$247.5$688.7
$ Change$13.4
$6.2$1.3$0.9
($0.1)$7.9$2.0$5.3
$37.1
% Change5.1%
11.6%10.9%1.5%-0.5%
26.6%26.3%2.1%5.4%
FY 2016$261.1
$53.4$11.9$58.2$19.4$29.7
$7.6$247.5$688.7
FY 2015$256.5
$54.2$10.4$59.1$19.3$14.8
$8.0$227.2$649.5
$ Change$4.6
($0.8)$1.5
($0.9)$0.1
$14.9($0.4)$20.3$39.2
% Change1.8%-1.5%
14.4%-1.5%0.5%
100.7%-5.0%8.9%6.0%

F I N A N C I A L
39
Aviation Operations and MaintenanceIn fiscal year 2017, aviation operations and maintenance expenses were $274.5 million, an increase of $13.4 million or 5.1% more than the previous year. The breakdown of aviation operations and maintenance expenses by each of Massport’s aviation facilities is provided below:
LoganHanscomWorcesterTotal
AVIAT ION OPERAT ING AND MAINTENANCE EXPENSES(In Millions)
FY17 OPERAT ING EXPENSES BY CATEGORY
FY 2017$257.8
$10.2$6.5
$274.5
FY 2016$245.1
$9.3$6.7
$261.1
FY 2015$242.6
$7.4$6.5
$256.5

40
Logan Airport Operations and Maintenance Expenses – FY 2017Operations and maintenance expenses for Logan Airport in fiscal year 2017 were $257.8 million and account-ed for approximately 94% of all aviation operations and maintenance expenses and 74% of the Authority’s total operations and maintenance expenses. In fiscal year 2017, operations and maintenance expenses for Logan Airport increased by $12.7 million, or 5.2% over the prior year. Increased business activity resulted in a $2.6 million cost increase for items including shuttle bus operations, ground transportation staff, terminal building cleaning and credit card processing fees. Airfield and structural repairs along with routine maintenance resulted in a $2.8 million increase, and utility expenses increased by $2.6 million. Payroll expense was higher by $2.5 million due to merit increases and collectively bargained wage adjustments. Security-related costs increased by $2.1 million as the Authority provided more State Police details and incurred more overtime to maintain an appropriate level of security presence at its facilities. Logan Airport Operations and Maintenance Expenses – FY 2016Operations and maintenance expenses for Logan Airport in fiscal year 2016 were $245.1 million, an increase of $2.5 million or 1.0% over fiscal year 2015.
Payroll and benefits expenses increased by $3.7 million or 3.5% due to merit increases and collectively bargained wage adjustments as well as higher health insurance premiums. The demolition of the Hangar 16 facility required an additional $2.7 million of environmental remediation costs. Repair expenses were higher by $2.0 million as portions of the airfield needed to be repaired after the severe winter of fiscal year 2015. The cost increases were partially offset by a $4.9 million reduction for lower snow-related costs as less staff overtime, materials, supplies and services were required in fiscal year 2016 due to a mild winter. The Authority also spent $1.1 million less on the rental of parking spaces at its Logan Express site in Framingham due to the construction of a permanent parking garage.
Hanscom Field and Worcester Airport Operations and Maintenance Expenses – FY 2017In fiscal year 2017, operations and maintenance expenses for Hanscom Field were $10.2 million, an increase of $0.9 million or 10.7% over the prior year. The increase was due to $1.0 million for environmental remediation expenses related to the demolition of a hangar partially offset by a $0.1 million decline in professional fees for engineering consultants.
Operations and maintenance expenses for Worcester Regional Airport were $6.5 million, a decrease of $0.2 million or 4.2% due primarily to lower equipment rental expense of $0.2 million as fire rescue equipment that was rented in fiscal year 2016 was replaced with purchased equipment in fiscal year 2017.
Hanscom Field and Worcester Airport Operations and Maintenance Expenses – FY 2016In fiscal year 2016, operations and maintenance expenses for Hanscom Field were $9.3 million, an increase of $1.9 million or 25.5% over the prior year. The primary reason for the increase was the hiring of Airport Rescue and Fire Fighting (ARFF) personnel to staff a new fire station facility that added $1.8 million in new investment to improve safety and emergency response at Hanscom Field. Operations and maintenance expenses for Worcester Regional Airport increased $0.3 million or 3.8% to $6.8 million in fiscal year 2016. The increase was a result of additional repairs expense of $0.3 million primarily for items damaged by the severe winter in fiscal year 2015, additional security costs of $0.3 million, and an increase in marketing expense of $0.2 million. These increases were partially offset by $0.6 million of lower snow-related costs due to the mild winter.

F I N A N C I A L
41
Maritime Operations and Maintenance Expenses – FY 2017Maritime operations and maintenance expenses were $59.6 million, $6.2 million or 11.6% higher than the prior year. Maritime incurred an additional $2.5 million of stevedoring container handling expense driven by the 3.9% increase in TEUs coupled with additional weekend container ship visits causing higher stevedoring pay. Other expense increases included $1.5 million for the Sail Boston event for overtime, security screening, equipment rental and other expenses, $0.9 million for maintenance improvements to the Flynn Cruiseport, an increase of $0.7 million for additional services related to equipment maintenance and snow removal, and higher payroll and benefits expense of $0.4 million.
Maritime Operations and Maintenance Expenses – FY 2016Maritime operations and maintenance expenses in fiscal year 2016 were $53.4 million, $0.8 million or 1.5% lower than the prior year. The decrease in expenses was due to a $3.1 million reduction in snow clearing, hauling and snow melting to keep Maritime facilities and public streets operational due to the mild winter, $0.4 million of lower utilities expense due primarily to energy costs and a $0.3 million reduction for environmental consulting services. These decreases were partially offset by $1.0 million more for port security and state police allocation costs, $0.9 million higher stevedoring container handling expense due to the 12.0% increase in container volume, an additional $0.6 million in expenses for repairs and parts for the cranes used at Conley Terminal, and higher payroll and benefits expense of $0.4 million. Real Estate Operations and Maintenance Expenses – FY 2017Real Estate operations and maintenance costs in fiscal year 2017 were $13.2 million, up by $1.3 million or 10.9% versus the prior year. The increase was due to higher security costs of $0.3 million for state police growth in the Seaport District, higher payroll and benefits expense of $0.2 million, an additional $0.4 million for repairs primarily related to roadway surfaces and higher public affairs expense for special events, and $0.1 million for increased utilities costs due to higher electricity and water costs.
Real Estate Operations and Maintenance Expenses – FY 2016Real Estate operations and maintenance costs in fiscal year 2016 were $11.9 million, $1.5 million or 14.4% higher than fiscal year 2015. The increase included $0.6 million of additional security costs, the majority of which was for resources provided by Massport related to a strike by Verizon employees in Boston. The reim-bursement for this expense is included in operating revenue. Professional and consulting fees increased by $0.5 million due to an increase in development planning and activity in the South Boston Seaport District. Payroll and benefits expense was higher by $0.3 million.
General and Administrative Expenses – FY 2017The Authority’s general and administrative costs were $59.1 million in fiscal year 2017, $0.9 million or 1.5% higher than fiscal year 2016. The drivers of the increase include additional payroll costs for administrative employees of $1.6 million for merit based pay increases and an increase in benefits expense of $0.5 million. These increases were partially offset by a $1.3 million decrease in Airline Business Incentive Program expenses due primarily to the completion of incentive programs for Turkish Airlines and Emirates Airlines in fiscal year 2016.

42
The following table shows the allocation of the Authority’s general and administrative expenses by business line for fiscal years 2017, 2016 and 2015.
General and Administrative Expenses – FY 2016The Authority’s general and administrative costs in fiscal year 2016 were $58.2 million, $0.9 million or 1.5% lower than fiscal year 2015. The reduction in general and administrative expense consists of a $1.7 million decrease in Airline Business Incentive Program costs and a $1.5 million reduction in professional and consulting fees due mainly to disaster resiliency and disaster recovery analysis work performed in fiscal year 2015. These decreases were partially offset by $1.5 million of additional expenses for Information Technology items including software licenses, equipment maintenance and computer supplies, and a $0.8 million or 2.1% increase in pay-roll and benefits expense for administrative employees. PILOT, Pension & OPEB and Other Expenses – FY 2017In fiscal year 2017, the Authority’s PILOT payments to the City of Boston and the Town of Winthrop totaled $19.3 million and reflect a 0.5%, or $0.1 million, decrease versus fiscal year 2016. The decrease reflects the end of a 10-year agreement that required the Authority to pay a $0.7 million per year supplemental payment to the City of Boston from FY07 through FY16. The City of Boston’s PILOT payments are contractually linked to the annual rise in the Consumer Price Increase (CPI), which added $0.4 million of new costs, and also incorporate an agreement for mitigation payments to the East Boston Foundation for new facilities being constructed at Logan Airport. The amount of these mitigation payments increased by $250,000 in fiscal year 2017.
The Authority’s expenses for pension and OPEB were $37.6 million, an increase of $7.9 million or 26.6% com-pared to fiscal year 2016. The Authority’s pension liability increased $33.4 million, primarily due to a reduction in the plan’s discount rate resulting in a $4.1 million pension expense increase in FY 2017. The Authority’s OPEB expense increased by $3.8 million due to revisions to the mortality tables used in calculating benefits and the addition of approximately 100 beneficiaries previously omitted from the prior year’s actuarial OPEB valuation.
Other operating expenses totaled $9.6 million and were $2.0 million above the prior year primarily due to higher bad debt expense related to two companies that do business with the Authority.
LoganHanscomWorcesterMaritimeReal EstateTotal
GENERAL AND ADMINISTRAT IVE EXPENSES(In Millions)
FY 2017$42.4
$2.0$2.3$8.0$4.4
$59.1
FY 2016$42.3
$1.9$2.0$8.2$3.8
$58.2
FY 2015$43.7
$1.9$1.8$7.1$4.6
$59.1

F I N A N C I A L
43
The following table shows the allocation of PILOT, Pension, OPEB, and Other expenses by business line for fiscal years 2017 and 2016.
PILOT, Pension & OPEB and Other Expenses – FY 2016In fiscal year 2016, the Authority’s PILOT payments to the City of Boston and the Town of Winthrop totaled $19.4 million and reflect a 0.5%, or $0.1 million increase over fiscal year 2015. The Authority’s expenses for pension and OPEB were $29.7 million, an increase of $14.9 million or 100.7% compared to fiscal year 2015. Pension expenses were $13.4 million higher and OPEB expenses were $1.4 million higher due to the lowering of the discount rate from 7.50% to 7.25% for both plans and lower stock market returns on plan assets, which increased the Authority’s required contributions and expense in fiscal year 2016.
Other operating expenses totaled $7.6 million and were $0.4 million lower than the prior year primarily due to fewer workers compensation claims.
LoganHanscomWorcesterMaritimeReal EstateTotal
LoganHanscomWorcesterMaritimeReal EstateTotal
FY17 - P I LOT, PENSION, OPEB, AND OTHER EXPENSES(In Millions)
FY16 - P I LOT, PENSION, OPEB, AND OTHER EXPENSES(In Millions)
Pilot$17.2
$0.0$0.0$1.3$0.8
$19.3
Pension$15.6
$0.7$0.6$1.9$0.9
$19.7
OPEB$14.1
$0.6$0.3$2.2$0.7
$17.9
Other$7.4$0.2$0.2$1.6$0.2$9.6
Total$54.3$1.5$1.1$7.0$2.6
$66.5
Pilot$17.4
$0.0$0.0$1.3$0.7
$19.4
Pension$12.4
$0.4$0.5$1.7$0.6
$15.6
OPEB$11.0
$0.6$0.3$1.7$0.5$14.1
Other$5.9$0.1$0.1$1.5$0.0$7.6
Total$46.7$1.1$0.9$6.2$1.8
$56.7

44
Depreciation and Amortization Expenses – FY 2017The Authority recognized $252.8 million in depreciation and amortization expenses in fiscal year 2017, an increase of $5.3 million or 2.1% compared to fiscal year 2016. This increase is the result of $384.9 million in new assets being placed into service, which added $22.3 million in new current year depreciation expense. During fiscal year 2017, the Authority completed and placed into service projects including the Logan Airport Terminal E Renovation and Enhancement at a cost of $155.8 million, the final portion of the Checked Baggage Inspection System (CBIS) at Logan Airport at a cost of $52.2 million, phase two of the Heating, Ventilation and Air Conditioning (HVAC) system replacement at Logan Airport Terminals B, C and E at a cost of $14.8 million, and the Rehabilitation of Runway 4L/22R at Logan Airport at a cost of $14.7 million. The increase to depreci-ation expense was partially offset by a $6.8 million decrease associated with $65.7 million of assets that were fully depreciated in fiscal year 2017. The Authority also recognized a $3.3 million one-time depreciation charge in fiscal year 2017 related to the retirement of baggage system assets that were replaced as part of the CBIS ini-tiative, which is now fully operational in all terminals at Logan Airport. This charge was $10.1 million lower than a similar charge taken in fiscal year 2016.
DEPRECIATION AND AMORTIZATION EXPENSE (In Millions)
$234.3
$15.2
$3.3
FY 17
$220.8
$13.6
FY 16Net Asset Additions Charge for RetirementsBase (excl. prior year write downs)
Total $247.5Total $252.8
250
200
150
Depreciation and Amortization Expenses – FY 2016The Authority recognized $247.5 million in depreciation and amortization expenses in fiscal year 2016, an increase of $20.3 million or 8.9% compared to fiscal year 2015. This increase is the result of $351.7 million in new assets being placed into service, which added $25.1 million in new current year depreciation expense. During fiscal year 2016, the Authority completed and placed into service portions of the new Checked Baggage Inspection System (CBIS) at a cost of $129.9 million. This project will be fully completed and in service in 2017. Other major projects placed into service in fiscal year 2016 include the addition to the Central Parking Garage at Logan Airport at a cost of $86.6 million; Terminals C to E and Gate 40 connectors at a cost of $52.9 million; electrical substation replacements at a cost of $9.4 million; and runway rehabilitation work at a cost of $6.6 million. The increase to depreciation expense was partially offset by an $11.5 million decrease associated with $93.7 million of assets that were fully depreciated in fiscal year 2016. The Authority also recognized a $13.1 million one-time depreciation charge in fiscal year 2016 related to the retirement of baggage system assets that were replaced as part of the CBIS initiative.
$13.1

F I N A N C I A L
45
Non-Operating Revenues (Expenses) and Capital Contributions
The Authority recognized a net $43.1 million in non-operating revenues in fiscal year 2017, an increase of $4.6 million, or 11.9%, over fiscal year 2016. Non-operating revenues in fiscal year 2016 were $38.5 million, an increase of $0.4 million or 1.0% over the $38.1 million recognized in fiscal year 2015.
For fiscal year 2017, Passenger Facility Charges were $76.3 million, a $5.6 million or 7.9% increase over last year due to increased passenger activity at Logan Airport. Revenues from Customer Facility Charges totaled $33.1 million, $0.8 million higher than the prior year due to a 2.0% increase in rental car transaction days at Logan Airport’s Rental Car Center. The Authority also generated $13.1 million of investment income, an increase of $3.6 million from higher interest rates on fixed income investments and an increase in the Authority’s cash balance available for investment. Other income (expense), which is comprised of settlement claims, gains or losses on short term investments, gains or losses on the sale of equipment, and any other Authority income, was ($0.3) million, a decrease of $1.8 million.
NON-OPERAT ING REVENUES AND EXPENSES AND CAPITAL CONTRIBUT IONS (In Millions)
Passenger Facility ChargesCustomer Facility ChargesInvestment IncomeOther Income (Expense), NetTerminal A Debt Service ContributionsInterest ExpenseTotal Non-Operating Revenues (Expenses)
Capital Contributions
Passenger Facility ChargesCustomer Facility ChargesInvestment IncomeOther Income (Expense), NetTerminal A Debt Service ContributionsInterest ExpenseTotal Non-Operating Revenues (Expenses)
Capital Contributions
FY 2017$76.3$33.1$13.1($0.3)
($11.9)($67.2)
$43.1
$12.6
FY 2016$70.7$32.3
$9.5$1.5
($11.9)($63.6)
$38.5
$56.0
$ Change$5.6$0.8$3.6
($1.8)$0.0
($3.6)
$4.6
($43.4)
% Change7.9%2.5%
37.9%-120.0%
0.0%5.7%
11.9%
-77.5%
FY 2016$70.7$32.3
$9.5$1.5
($11.9)($63.6)
$38.5
$56.0
FY 2015$65.8$30.8
$7.4$9.8
($10.9)($64.8)
$38.1
$56.0
$ Change$4.9$1.5$2.1
($8.3)($1.0)$1.2
$0.4
$0.0
% Change7.4%4.9%
28.4%--84.7%
9.2%-1.9%
1.0%
0.0%

46
The Authority recognized a $4.5 million decrease in the fair market value on its investments as higher interest rates reduced bond prices as of June 30, 2017 compared to a $2.1 million gain at June 30, 2016. This was partially offset by a $4.0 million increase in other revenues related to the use of funds from the Terminal A main-tenance reserve. Also, during fiscal year 2017, the Authority made a voluntary contribution of $11.9 million in PFCs to the Terminal A debt service fund to help reduce terminal rental rates, which was comparable to the contri-bution made in the prior year. Interest expense on long term debt was $67.2 million, which was $3.6 million or 5.7% higher than fiscal year 2016.
For fiscal year 2016, Passenger Facility Charges were $70.7 million, a $4.9 million or 7.4% increase over the prior year due to increased passenger activity at Logan Airport. Revenues from Customer Facility Charges totaled $32.3 million, $1.5 million higher than the prior year due to a 5.1% increase in rental car transaction days at Logan Airport’s Rental Car Center. The Authority also generated $9.5 million of investment income, an increase of $2.1 million from higher interest rates on fixed income investments and an increase in the Authority’s cash bal-ance available for investment. Other income (expense), which is comprised of settlement claims, gains or losses on short term investments, gains or losses on the sale of equipment, and any other Authority income, was $1.5 million, a decrease of $8.3 million. Included in the prior year was a $10.0 million capital contribution from the Terminal A Maintenance Reserve Fund to cover the costs associated with Terminal A improvements. These funds were part of the lease agreement with the tenant to cover such costs. Additionally, the Authority recorded a hold-ing gain of $2.0 million at June 30, 2016 related to the fair value of its investments compared to a $0.5 million holding gain at June 30, 2015. Also, during fiscal year 2016, the Authority made a voluntary contribution of $11.9 million in PFCs to the Terminal A debt service fund to help reduce terminal rental rates, which was $1.0 million higher than the prior year. Interest expense on long term debt was $63.6 million, a decrease of $1.2 million or 1.9% from fiscal year 2015.
Capital ContributionsThe majority of the Authority’s capital contributions are grants awarded by the Federal Aviation Administration (FAA) for the Airport Improvement Program (AIP) to construct runways, taxiways, apron lighting, residential sound proofing projects, and other capital related projects, primarily at Logan Airport. The Authority also receives capital contributions from the Department of Homeland Security, as well as grants from the Federal Emergency Management Administration, the U.S. Department of Transportation, the Environmental Protection Agency and the Massachusetts Executive Office of Public Safety and Security related to the Port Security Grant Program which safeguards the Port of Boston.
Capital contributions in fiscal year 2017 were $12.6 million, a decrease of $43.4 million versus the prior year. The majority of the 2017 revenues were from the FAA AIP grant program for project expenditures related to run-way rehabilitation and improvements at Logan Airport and the CAT III ILS project at Worcester Regional Airport. The $43.4 million decline versus last year was primarily due to the CBIS project as the Authority received $37.8 million of Transportation Security Administration (TSA) reimbursements for this project in fiscal year 2016 versus no reimbursements in fiscal year 2017 as that project is now completed.
In fiscal year 2016, capital contributions were $56.0 million, comparable to the prior year. These revenues were primarily generated from Transportation Security Administration (TSA) reimbursements for the ongoing construction of the new Checked Baggage Inspection System (CBIS) at Logan Airport and the FAA AIP grant program.

F I N A N C I A L
47
The Authority’s Statements of Net Position
The Statements of Net Position present the financial position of the Authority at the end of each fiscal year. The Statements include all assets, deferred outflows, liabilities and deferred inflows of the Authority. Net Position is the difference between total assets plus deferred outflows less total liabilities and deferred inflows and is an indicator of the current fiscal health of the Authority. A summarized comparison of the Authority’s assets, deferred outflows, liabilities, deferred inflows and net position at June 30, 2017, 2016 and 2015 is as follows:
ASSETSCurrent AssetsCapital Assets, NetOther Non-Current AssetsTotal Assets
DEFERRED OUTFLOWS OF RESOURCESDeferred Loss on Refunding of BondsDeferred Loss on expected vs Actual Pension Plan ExperienceDeferred Loss on Pension Plan Changed of AssumptionsDeferred Loss on Pension Plan InvestmentsTotal Deferred Outflows of Resources
LIABILITIESCurrent LiabilitiesBonds Payable, Including Current PortionOther Non-Current LiabilitiesTotal Liabilities
DEFERRED INFLOWS OF RESOURCESDeferred Gain on Refunding of BondsTotal Deferred Inflows of ResourcesTotal Net Position
CONDENSED STATEMENTS OF NET POSIT ION FOR FY 2017 AND FY 2016(In Millions)
FY 2017$803.9
$3,142.5$474.0
$4,420.4
$18.0$2.5
$16.2$18.6$55.3
$308.0$1,850.7
$135.5$2,294.2
$6.8$6.8
$2,174.7
FY 2016$632.3
$3,086.9$496.7
$4,215.9
$17.9$0.3
$20.8$25.9$64.9
$331.9$1,724.5
$132.4$2,188.8
$8.1$8.1
$2,083.9
$ Change$171.6
$55.6($ 22.7)$204.5
$0.1$2.2
($4.6)($7.3)
($ 9.6)
($23.9)$126.2
$3.1$105.4
($1.3)($ 1.3)$90.8
% Change27.1%1.8%-4.6%4.9%
0.6%733.3%-22.1%-28.2%-14.8%
-7.2%7.3%2.3%4.8%
-16.0%-16.0%
4.4%

48
The Authority ended fiscal year 2017 with total assets of $4,420.4 million, an increase of $204.5 million or 4.9%. This increase is primarily due to growth in current assets due to higher investment balances. Deferred outflows of resources for fiscal year 2017 were $55.3 million, a $9.6 million decrease from the previous year due primarily to a reduction in the deferred loss on Pension Plan investments from favorable investment gains on pension plan assets. The Authority’s total assets consist primarily of capital assets, which represent approximately $3,142.5 million or 70.2% of the Authority’s total assets and deferred outflows of resources as of June 30, 2017.
The Authority’s total liabilities as of June 30, 2017 were $2,294.2 million, an increase of $105.4 million or 4.8% due mainly to the growth in the Authority’s debt to finance strategic initiatives. The Authority’s liabilities consist primarily of bonds payable (including current portion), which accounted for 80.4% of the Authority’s total liabilities and deferred inflows at June 30, 2017.
The Authority’s total net position for fiscal year 2017 was $2,174.7 million, a $90.8 million or 4.4% increase over the prior year. This increase reflects the Authority’s net operating income of $35.1 million, net non-operating income of $43.1 million and capital contributions of $12.6 million. The growth in net position will be used to fund the Authority’s strategic initiatives.
ASSETSCurrent AssetsCapital Assets, NetOther Non-Current AssetsTotal Assets
DEFERRED OUTFLOWS OF RESOURCESDeferred Loss on Refunding of BondsDeferred Loss on expected vs Actual Pension Plan ExperienceDeferred Loss on Pension Plan Changed of AssumptionsDeferred Loss on Pension Plan InvestmentsTotal Deferred Outflows of Resources
LIABILITIESCurrent LiabilitiesBonds Payable, Including Current PortionOther Non-Current LiabilitiesTotal Liabilities
DEFERRED INFLOWS OF RESOURCESDeferred Gain on Refunding of BondsDeferred Gain on Pension Plan InvestmentsTotal Deferred Inflows of ResourcesTotal Net Position
CONDENSED STATEMENTS OF NET POSIT ION FOR FY 2016 AND FY 2015(In Millions)
FY 2016$632.3
$3,086.9$496.7
$4,215.9
$17.9$0.3
$20.8$25.9$64.9
$331.9$1,724.5
$132.4$2,188.8
$8.10.0
$8.1$2,083.9
FY 2015$794.2
$2,960.3$394.9
$4,149.4
$17.8$1.8$0.0$0.0
$19.6
$325.0$1,785.2
$66.5$2,176.7
$0.0$13.7$13.7
$1,978.6
$ Change($ 161.9)
$126.6$101.8$66.5
$0.1($1.5)$20.8$25.9$45.3
$6.9($60.7)$65.9$12.1
$8.1($13.7)($5.6)
$105.3
% Change-20.4%
4.3%25.8%
1.6%
0.6%-83.3%
100.0%100.0%231.1%
2.1%-3.4%
99.1%0.6%
100.0%-100.0%-40.9%
5.3%

F I N A N C I A L
49
The Authority ended fiscal year 2016 with total assets of $4,215.9 million, an increase of $66.5 million or 1.6%. This increase is primarily due to the growth in investment in capital assets. Deferred outflows of resourc-es for fiscal year 2016 were $64.9 million, a $45.3 million increase from the previous year due to the change in the assumptions related to the discount rate on pension plan assets and investment gains on pension plan assets that did not achieve their actuarial benchmark. These deferred amounts will be amortized over a five to seven year period. The Authority’s total assets consist primarily of capital assets, which represent approximately $3,086.9 million or 72.1% of the Authority’s total assets and deferred outflows of resources as of June 30, 2016.
The Authority’s total liabilities as of June 30, 2016 were $2,188.8 million, an increase of $12.1 million or 0.6% due to the increase in the pension liability of $63.7 million and an increase in accrued liabilities of $34.1 million, partially offset by the $85.8 million reduction in debt service and note payments made during the year. The Authority’s deferred inflows of resources at June 30, 2016 was the result of a deferred gain on the issuance of the 2015 C refunding bonds to defease the 2005 C bonds. The prior year amount of $13.7 million was related to defer gains on pension investments and this amount was reclassified to the deferred outflow of resources at June 30, 2016. The Authority’s liabilities consist primarily of bonds payable (including current portion), which accounted for 78.5% of the Authority’s total liabilities and deferred inflows at June 30, 2016.
The Authority’s total net position for fiscal year 2016 was $2,083.9 million, a $105.3 million or 5.3% increase over the prior year. This increase reflects the Authority’s net operating income of $10.8 million, net non-operating income of $38.5 million and capital contributions of $56.0 million.
Net PositionThe Authority’s total net position, which represents the residual interest in the Authority’s assets and deferred out-flows less the Authority’s liabilities and deferred inflows, was $2,174.7 million as of June 30, 2017, an increase of $90.8 million, or 4.4% from fiscal year 2016. Of this amount, $1,290.3 million is the net investment in capital assets, a decrease of $20.6 million compared to fiscal year 2016. The Authority’s restricted net position of $585.6 million as of June 30, 2017 is subject to the pledge of the 1978 Trust Agreement, the PFC Trust Agree-ment, the CFC Trust Agreement or custodial agreements in the Authority’s name. The Authority’s restricted net position increased by $56.0 million as of June 30, 2017. This increase is primarily attributable to higher PFC and CFC collections. The Authority’s unrestricted net position for fiscal year ending June 30, 2017 was $298.7 million, an increase of $55.3 million versus the $243.4 million of unrestricted net position reported in fiscal year 2016 due to additional cash generated from operations in fiscal year 2017.
Total net position was $2,083.9 million as of June 30, 2016, an increase of $105.3 million, or 5.3% from fiscal year 2015. Of this amount, $1,310.9 million is the net investment in capital assets, an increase of $38.6 million compared to fiscal year 2015. The Authority’s restricted net position of $529.6 million as of June 30, 2016 is subject to the pledge of the 1978 Trust Agreement, the PFC Trust Agreement, the CFC Trust Agreement or custodial agreements in the Authority’s name. The Authority’s restricted net position increased by $12.7 million as of June 30, 2016. This increase is primarily attributable to higher PFC and CFC collections partially offset by the timing of bond and project funds payments. The Authority’s unrestricted net position for fiscal year ending June 30, 2016 was $243.4 million, an increase of $53.9 million versus the $189.5 million of unrestricted net position reported in fiscal year 2015 due to additional cash generated from operations in fiscal year 2016.

50
Capital Assets and Debt Administration
Capital AssetsAs of June 30, 2017 and 2016, the Authority had $3,142.5 million and $3,086.9 million of capital assets (net of depreciation), respectively. These include land, construction in process, buildings, runways, roadways, machinery and equipment, air rights and parking rights. The Authority’s net capital assets increased by $55.6 million, or 1.8% in fiscal year 2017 primarily as the result of $308.8 million in capital expenditures partially offset by $252.8 million of depreciation expense.
The Authority placed $384.9 million of assets into service for completed capital projects during fiscal year 2017. Major projects included the Logan Airport Terminal E Renovation and Enhancement at a cost of $155.8 million and the final component of the new Checked Baggage Inspection System (CBIS) at a cost of $52.2 million. Other assets placed into service in fiscal year 2017 included a new Heating, Ventilation and Air Conditioning (HVAC) system for Terminals B, C, and E at Logan Airport at a costs of $14.8 million and the rehabilitation of Runway 4L/22R at Logan Airport at a cost of $14.7 million.
During fiscal year 2016, the Authority placed $351.7 million of assets into service for completed capital projects. This included portions of the new Checked Baggage Inspection System (CBIS) at a cost of $129.8 million. Other major projects placed into service in fiscal year 2016 included the Central Parking Garage additional at Logan Airport at a cost of $86.6 million; Terminals C to E and Gate 40 connectors at a cost of $52.9 million; electrical substation replacements at a cost of $9.4 million; and runway rehabilitation work at a cost of $6.6 million.
During fiscal year 2015, the Authority placed into service $225.1 million of completed capital projects, which included a portion of the new Checked Baggage Inspection System (CBIS) at a cost of $34.0 million. Other major projects placed into service in fiscal year 2015 included the completion of the Quick Turn Around areas and roadways related to the Rental Car Center at a cost of $31.2 million, the building of the Framingham Logan Express Parking Garage at a cost of $32.4 million, and the renovation and improvement of Terminal A and B to serve the increase in passenger volumes at a cost of $29.9 million.
Capital assets, net comprised approximately 70.2%, 72.1% and 71.0% of the Authority’s total assets and deferred outflows of resources at June 30, 2017, 2016 and 2015, respectively. During fiscal years 2017, 2016 and, 2015, the Authority spent approximately $322.7 million, $351.0 million and $294.2 million, respectively, constructing new assets and improving existing assets already in service, inclusive of construction in process.
The Authority’s capital assets are principally funded by the proceeds of revenue bonds; Authority generated revenues; PFCs; CFCs; and federal and state grants. The Authority’s aviation facilities account for approximately 91% of all capital assets. The following chart provides a breakdown of total capital assets at June 30 2017, 2016 and 2015.

F I N A N C I A L
51
Debt AdministrationThe Authority’s bond sales must be approved by its Board Members and must comply with the rules and regula-tions of the United States Treasury Department. The Authority, through its 1978 Trust Agreement, has a covenant to maintain a debt service coverage ratio of not less than 1.25. Debt service coverage is calculated based on a formula set forth in the 1978 Trust Agreement. Historically, the Authority has maintained a debt service coverage ratio higher than its 1978 Trust Agreement requirement to maintain its high investment grade bond ratings. As of June 30, 2017, 2016, and 2015, the Authority’s debt service coverage under the 1978 Trust Agreement was 3.27, 2.98, and 2.62, respectively. The 1999 PFC Trust Agreement requires a First Lien Sufficiency covenant ratio in excess of 1.05. As of June 30, 2017, 2016, and 2015, the Authority’s PFC First Lien Sufficiency covenant under the PFC Trust Agreement was 63.44, 10.68, and 5.64, respectively. The ratio is much higher as of June 30, 2017 since the Authority’s re-maining long term PFC debt was paid off in full on July 3, 2017. The CFC Trust Agreement requires that the Authority maintain a debt service coverage ratio of at least 1.3. As of June 30, 2017, 2016, and 2015, the CFC debt service coverage ratio was 2.60, 2.50, and 2.39, respectively.
The Authority had net bonds payable outstanding as of June 30, 2017 in the amount of $1,718.8 million, a net increase of $93.3 million compared to fiscal year 2016. During fiscal year 2017, the Authority issued $230.3 million of Massachusetts Port Authority Revenue Bonds in two series. The proceeds from the Series 2016 A Reve-nue Refunding Bonds, in the principal amount of $50.0 million, were used to refund a portion of the outstanding balance of the Authority’s 2007 Series A and the entire outstanding balance of the 2008 Series A bonds, and resulted in a net present value benefit to the Authority of $6.8 million. The Series 2016 B Revenue Bonds were issued in the amount of $180.3 million and were used to finance capital improvements which included renovations and enhancements to Terminal E and the consolidation of Terminal B. Due to the “private activity” nature of the construction projects, they were sold as Alternative Minimum Tax (AMT) bonds.
LandConstruction in ProgressBuildingsRunways and Other PavingsRoadwaysMachinery and EquipmentAir RightsParking RightsCapital Assets, Net
CAP ITAL ASSETS BY TYPE(In Thousands)
FY 2017
$230,593$149,730
$1,727,657$364,152$327,839$262,306
$58,628$21,588
$3,142,493
FY 2016
$226,497$225,930
$1,594,212$356,538$351,920$243,958
$64,711$23,131
$3,086,897
% Change2017-2016
1.8%-33.7%
8.4%2.1%-6.8%7.5%-9.4%-6.7%1.8%
FY 2015
$211,444$217,689
$1,533,131$372,970$375,002$154,183
$71,265$24,673
$2,960,357
% Change2016-2015
7.1%3.8%4.0%-4.4%-6.2%
58.2%-9.2%-6.2%4.3%

52
The Authority had net bonds payable outstanding as of June 30, 2016 in the amount of approximately $1,625.5 million, a net decrease of approximately $70.3 million compared to fiscal year 2015. During fiscal year 2016, the Authority issued $171.5 million of Massachusetts Port Authority Revenue Bonds in two series. The Series 2015 A Revenue Bonds, in the principal amount of $104.5 million, were issued to finance capital improvements which included the completion of the parking garage at the Framingham Logan Express site, property acquisition and parking improvements at the Braintree Logan Express and construction of 2,050 additional parking spaces at Logan Airport. The Series 2015 B Revenue Bonds were issued in the amount of $67.0 million and were used to finance capital improvements which included construction of a post security corridor between Terminal C and Terminal E, HVAC equipment replacement, HVAC equipment distribution, roof replacements, the creation of new remain overnight parking spaces and Terminal A airline relocation. Due to the “private activity” nature of the construction projects, they were sold as AMT bonds.
The Authority had net bonds payable outstanding as of June 30, 2015 in the amount of approximately $1,695.8 million, a net increase of approximately $182.5 million compared to fiscal year 2014. The increase was the result of new and refunding bonds issued during fiscal year 2015 less the amount of principal paid.
The Official Statements relating to the Authority’s Bond issuances are available from the Authority or by accessing the Authority’s website.
The Authority’s Condensed Cash Flows
The following summary shows the major sources and uses of cash during the following fiscal years:
STATEMENTS OF CASH FLOWS(In Millions)
Net Cash Provided by Operating ActivitiesNet Cash (Used In) Capital and Related Financing ActivitiesNet Cash (Used In) Investing ActivitiesNet (Decrease)/Increase in Cash and Cash EquivalentsCash and Cash Equivalents, Beginning of YearCash and Cash Equivalents, End of Year
Net Cash Provided by Operating ActivitiesNet Cash (Used In) Capital and Related Financing ActivitiesNet Cash (Used In) Investing ActivitiesNet (Decrease)/Increase in Cash and Cash EquivalentsCash and Cash Equivalents, Beginning of YearCash and Cash Equivalents, End of Year
STATEMENTS OF CASH F LOWS(In Millions)
FY 2017$315.1
($164.3)($128.3)
$22.5$250.5
$273.0
FY 2016$280.7
($318.3)($125.1)($162.7)$413.2$250.5
$ Change$34.4
$154.0($3.2)
$185.2($162.7)
$22.5
% Change12.3%-48.4%
2.6%-113.8%-39.4%
9.0%
FY 2016$280.7
($318.3)($125.1)($162.7)$413.2$250.5
FY 2015$255.7($42.8)($21.4)$191.5$221.7$413.2
$ Change$25.0
($275.5)($103.7)($354.2)$191.5
($162.7)
% Change9.8%
643.7%484.6%-185.0%
86.4%-39.4%

F I N A N C I A L
The Authority’s cash and cash equivalents at June 30, 2017 was $273.0 million, an increase of $22.5 million, or 9.0% from the $250.5 million in cash and cash equivalents reported in fiscal year 2016. The Authority gen-erated $315.1 million in cash from operations during fiscal year 2017 compared to $280.7 million in the prior year, an increase of $34.4 million, or 12.3%, primarily from increased business activity at Logan Airport, record container volumes at Conley Terminal, and activity at its other facilities. The Authority used $164.3 million in cash for capital and related financing activities to finance the Authority’s capital program and to pay debt service expenses during the year. This was a $154.0 million decrease in the use of cash from the $318.3 million in cash used for capital and related financing activities in fiscal year 2016, which included a debt refunding payment. The Authority used $128.3 million in cash from investments towards its capital and operating needs, an increase of $3.2 million from the amount of cash used for investing activities in fiscal year 2016.
The Authority’s cash and cash equivalents at June 30, 2016 was $250.5 million, a decrease of $162.7 million, or 39.4% from the $413.2 million in cash and cash equivalents reported in fiscal year 2015. The Authority gen-erated $280.7 million in cash from operations during fiscal year 2016 compared to $255.7 million in the prior year, an increase of $25.0 million, or 9.8%, primarily from increased business activity at Logan Airport and its other facilities. The Authority used $318.3 million in cash for capital and related financing activities to finance the Authority’s capital program and to pay debt service expenses during the year. This was a $275.5 million increase in the use of cash from the $42.8 million in cash used for capital and related financing activities in fiscal year 2015. The Authority used $125.1 million in cash from investments towards its capital and operating needs, an increase of $103.7 million from the amount of cash used for investing activities in fiscal year 2015.
Contacting the Authority’s Financial ManagementFor additional information concerning the Authority and the Retirement System, please see the Authority’s website, www.massport.com. Financial information can be found by clicking on “Finance”. The Authority’s executive offic-es are located at One Harborside Drive, Suite 200S, East Boston, Massachusetts 02128, and the main telephone number is (617) 568-5000. Questions may be directed to John P. Pranckevicius, CPA, Director of Administration and Finance, and Secretary-Treasurer for the Massachusetts Port Authority.
53

54The accompanying notes are an integral part of these financial statements.
CURRENT ASSETS: Cash and cash equivalents Investments Restricted cash and cash equivalents Restricted investments Accounts receivable Trade, net Grants receivable Total receivables, net Prepaid expenses and other assets Total current assets NONCURRENT ASSETS: Investments Restricted investments Prepaid expenses and other assets Investment in joint venture Net OPEB asset Capital assets-not being depreciated Capital assets-being depreciated-net Total noncurrent assets Total assets DEFERRED OUTFLOWS OF RESOURCES Deferred loss on refunding of bonds Deferred loss on expected vs actual Plan experience Deferred loss on Pension Plan Change of Assumptions Deferred loss on Pension Plan Investments Total deferred outflows of resources CURRENT LIABILITIES Accounts payable and accrued expenses Compensated absences Contract retainage Current portion of long-term debt Commercial notes payable Accrued interest on bonds payable Unearned revenues Total current liabilities NONCURRENT LIABILITIES Accrued expenses Compensated absences Net pension liability Contract retainage Long-term debt, net Unearned revenues Total noncurrent liabilities Total liabilities DEFERRED INFLOWS OF RESOURCES Deferred gain on refunding of bonds Total deferred inflows of resourcesNET POSITION Net investment in capital assets Restricted Bond funds Project funds Passenger facility charges Customer facility charges Other purposes Total restricted Unerestricted Total net position
$82,095 $132,021 $190,914 $317,441
$67,630 $5,811
$73,441 $7,964
$803,876
$152,661 $259,040
$5,637 $2,843
$53,850 $380,323
$2,762,170 $3,616,524
$4,420,400
$17,983 $2,446
$16,217 $18,635 $55,281
$133,949 $1,400 $8,729
$123,000 $109,000 $39,015 $15,939
$431,032
$14,621 $17,908 $88,322
$1,236 $1,727,665
$13,374 $1,863,126
$2,294,158
$6,809 $6,809
$1,290,338
$209,333 $196,738 $102,914 $48,550 $28,101
$585,636 $298,740
$2,174,714
$63,497 $82,062
$186,966 $210,006
$60,289 $21,874 $82,163
$7,624 $632,318
$138,482 $293,320
$6,357 $2,595
$55,914 $452,427
$2,634,470 $3,583,565 $4,215,883
$17,868 $290
$20,797 $25,945
$64,900
$149,089 $1,416
$10,843 $90,402
$125,000 $36,093
$9,423 $422,266
$9,756 $18,119 $91,915
$3,483 $1,634,073
$9,141 $1,766,487 $2,188,753
$8,088 $8,088
$1,310,922
$202,619 $186,303
$83,252 $30,051 $27,391
$529,616 $243,404
$2,083,942
20162017
MASSACHUSETTS PORT AUTHORITYSTATEMENTS OF NET POSIT ION JUNE 30, 2017 AND 2016
(In Thousands)

F I N A N C I A L
55
OPERATING REVENUES: Aviation rentals Aviation parking Aviation shuttle bus Aviation fees Aviation concessions Aviation operating grants and other Maritime fees, rentals and other Real estate fees, rents and other Total operating revenuesOPERATING EXPENSES: Aviation operations and maintenance Maritime operations and maintenance Real estate operations and maintenance General and administrative Payments in lieu of taxes Pension and other post-employment benefits Other Total operating expenses before depreciation and amortization Depreciation and amortization Total operating expenses Operating income NONOPERATING REVENUES AND (EXPENSES): Passenger facility charges Customer facility charges Investment income Net (decrease) increase in the fair value of investments Other revenues Settlement of claims Terminal A debt service contribution Other expenses Gain (loss) on sale of equipment / property Interest expense Total nonoperating revenues (expenses), net Increase in net position before capital contributions Capital contributions Increase in net position Net position, beginning of year
Net position, end of year
$217,906 $169,354
$19,278 $145,418
$98,913 $2,909
$82,088 $25,037
$760,903
$274,506 $59,629 $13,215 $59,142 $19,276 $37,603
$9,631
$473,002 $252,846
$725,848 $35,055
$76,296 $33,055 $13,093 ($4,501)$4,062
$248 ($11,941)
($198)$125
($67,157)$43,082
$78,137 $12,635
$90,772
$2,083,942
$2,174,714
$198,103 $154,568 $18,009
$139,425 $87,401
$2,781 $74,654 $24,537
$699,478
$261,115 $53,359 $11,887 $58,232 $19,375 $29,654
$7,595
$441,217 $247,502 $688,719
$10,759
$70,718 $32,335
$9,453 $2,116
$49 $70
($11,903)($116)($595)
($63,613)$38,514
$49,273 $56,033
$105,306
$1,978,636
$2,083,942
The accompanying notes are an integral part of these financial statements.
20162017
MASSACHUSETTS PORT AUTHORITYSTATEMENTS OF REVENUES, EXPENSES, AND CHANGES IN NET POSITION
YEARS ENDED JUNE 30, 2017 AND 2016 (In Thousands)

56
$765,757 ($255,538) ($161,571)
($19,276) ($14,300) $315,072
($322,735) $268,866 ($63,382) ($78,220) ($75,240)
$9,000 ($25,000) ($11,941) $72,039 $33,059 $28,851
$248 $178
($164,277)
($726,630) $586,428
($34) $11,987
($128,249) $22,546
$250,463 $273,009
$35,055
$252,846 $1,642
($4,835) $3,481 $2,063
$10,657 $6,141 ($227)
$8,249
$315,072
($1,314)
$712,999 ($252,764) ($147,651)
($19,875) ($12,000)
$280,709
($350,960) $194,270
($170,485) ($73,726) ($71,315) $44,000
($69,000) ($11,903) $70,204 $31,955 $87,657
$70 $887
($318,346)
($679,365) $545,641
$88 $8,554
($125,082) ($162,719)
$413,182 $250,463
$10,759
$247,502 $186
($2,025) $3,149
$755 $14,897
$4,711 $15
$760
$280,709
$3,154
The accompanying notes are an integral part of these financial statements.
2017 2016
MASSACHUSETTS PORT AUTHORITY STATEMENTS OF CASH FLOWS
YEARS ENDED JUNE 30, 2017 AND 2016 (In Thousands)
CASH FLOWS FROM OPERATING ACTIVITIES: Cash received from customers and operating grants Payments to vendors Payments to employees Payments in lieu of taxes Other post-employment benefits Net cash provided by operating activities
CASH FLOWS FROM CAPITAL AND RELATED FINANCING ACTIVITIES: Acquisition and construction of capital assets Proceeds from the issuance of bonds, net Principal payments on refunded debt Interest paid on bonds and notes Principal payments on long-term debt Proceeds from commercial paper financing Principal payments on commercial paper Terminal A debt service contribution Proceeds from passenger facility charges Proceeds from customer facility charges Proceeds from capital contributions Settlement of claims
Proceeds from sale of equipment Net cash used in capital and related
financing activities CASH FLOWS FROM INVESTING ACTIVITIES:
Purchases of investments, net Sales of investments, net Realized (loss)/gain on sale of investments Interest received on investments Net cash used in investing activities
Net increase (decrease) in cash and cash equivalents Cash and cash equivalents, beginning of year Cash and cash equivalents, end of year RECONCILIATION OF OPERATING INCOME TO NET CASH PROVIDED BY OPERATING ACTIVITIES: Cash flows from operating activities: Operating income Adjustments to reconcile operating income to net cash provided by operating activities: Depreciation and amortization Provision for uncollectible accounts Changes in operating assets and liabilities: Trade receivables Prepaid expenses and other assets Prepaid expenses and other assets – long-term Accounts payable and accrued expenses Net pension liability and deferred inflows/outflows Compensated absences Unearned revenue Net cash provided by operating activities Noncash investing activities: Net increase in the fair value of investments

F I N A N C I A L
57
M A S S A C H U S E T T S P O R T A U T H O R I T Y • N o t e s t o F i n a n c i a l S t a t e m e n t s • J u n e 3 0 , 2 0 1 7 a n d 2 0 1 6
N o t e s t o F i n a n c i a l S t a t e m e n t s J u n e 3 0 , 2 0 1 7 a n d 2 0 1 6M a s s a c h u s e t t s P o r t A u t h o r i t y
1 Summary of Significant Accounting Policies and Practices
Reporting EntityThe Massachusetts Port Authority (the “Authority”) is a body politic and corporate and a public instrumentality of The Commonwealth of Massachusetts (the “Commonwealth”) created and existing pursuant to Chapter 465 of the Acts of 1956, as amended, (the “Enabling Act”). The Authority controls, operates and manages Boston-Logan International Airport (“Logan Airport”), Laurence G. Hanscom Field, Worcester Regional Airport, the Port of Boston and other facilities in the Port of Boston. The Authority has no stockholders or equity holders, and the Authority’s financial statements are not a component unit of the Commonwealth’s financial statements. The provisions of the Enabling Act and the Trust Agreement, dated as of August 1, 1978 as amended and supplemented (the “1978 Trust Agreement”), between the Authority and U.S. Bank National Association (as successor in interest to State Street Bank and Trust Company), as trustee (the “Trustee”), the Passenger Facility Charges (“PFC”) Revenue Bond Trust Agreement dated May 6, 1999, as amended and supplemented (the “PFC Trust Agreement”), between the Authority and The Bank of New York Mellon, as trustee (the “PFC Trustee”) and the Customer Facility Charges (“CFC”) Revenue Bond Trust Agreement dated May 18, 2011, as amended and supplemented (the “CFC Trust Agreement”), between the Authority and U.S. Bank National Association as trustee (the “CFC Trustee”), govern all funds, with limited exceptions, received by the Authority pursuant to the Enabling Act.
In April 1981, the Authority adopted a retiree benefit plan whereby the Authority assumed the full cost of group health insurance including basic life insurance, dental insurance and catastrophic illness coverage to those retirees and surviving spouses (and qualifying dependents) who have retired under the Authority’s retirement system (collectively referred to as the “OPEB Plan”). In June 2009 and May 2016, the Board made changes to the plan benefits to be paid by the Authority for certain existing and future retirees. For additional details see Note 7.
In June 2008, the Authority created the Retiree Benefits Trust (the “RBT” or the “Trust”) to fund its OPEB Plan obligations. It was established as an irrevocable governmental trust under Section 115 of the Internal Revenue Code. In no event shall any part of the principal or income of the RBT be paid or revert back to the Authority or be used for any purpose whatsoever other than for the exclusive benefit of retirees and their beneficiaries. Basis of AccountingThe Authority’s activities are accounted in a manner similar to that often utilized in the private sector. The Authority’s financial statements are prepared using the accrual basis of accounting and the economic resources measurement focus in accordance with U.S. generally accepted accounting principles (“GAAP”).
Revenues from airlines, rentals, parking fees, tolls and concessions are reported as operating revenues. Capital grants, PFC’s, CFC’s and financing or investing related transactions are reported as non-operating revenues and expenses. All expenses related to operating the Authority’s facilities are reported as operating expenses.

58
M A S S A C H U S E T T S P O R T A U T H O R I T Y • N o t e s t o F i n a n c i a l S t a t e m e n t s • J u n e 3 0 , 2 0 1 7 a n d 2 0 1 6
Accounting per Applicable Trust Agreements
Under the 1978 Trust Agreement, cash of the Authority is deposited daily into the Revenue Fund established pursuant to the 1978 Trust Agreement and is transferred to the cash concentration account. All such revenues are then transferred to the various funds established pursuant to the 1978 Trust Agreement. After providing for operating expenses, including pension expense and transfers to the self insurance account, cash revenues are then transferred to the Interest and Sinking Fund, which are applied to debt service on any outstanding revenue bonds, the Maintenance Reserve Fund, the Payment In Lieu of Taxes Fund, the Capital Budget Fund, if applicable, and finally, the Improvement and Extension Fund.
PFC revenue is deposited in the PFC Pledged Revenue Fund established pursuant to the PFC Revenue Bond Trust Agreement and is utilized to pay debt service on PFC Revenue Bonds as required in the PFC Trust Agreement. Any remaining funds are transferred to the PFC Capital Fund.
CFC revenue is deposited in the CFC Revenue Fund established pursuant to the CFC Trust Agreement and are utilized to pay debt service on CFC Special Facilities Bonds as required in the CFC Trust Agreement. Any remaining funds are transferred to the CFC Stabilization Fund.
See Note 2 for a reconciliation between the increase in net position as calculated per GAAP and net revenues as calculated per accounting practices prescribed by the 1978 Trust Agreement.
a) Net PositionThe Authority follows the “business type” activity requirements of GASB Statement No. 34, Basic Financial Statements and Management’s Discussion and Analysis for State and Local Governments, which requires that resources be classified for accounting and reporting purposes into the following three net position components:
• Net investment in capital assets: Capital assets, net of accumulated depreciation and outstanding principal balances of debt and the deferred outflows / inflows attributable to the acquisition, construction or improvement of those assets.
• Restricted: Net position of assets whose use by the Authority is subject to externally imposed stipulations that can be fulfilled by actions of the Authority pursuant to those stipulations or that expire by the passage of time. Such assets include the construction funds held pursuant to the 1978 Trust Agreement, the PFC Trust Agreement, the CFC Trust Agreement and the self insurance fund.
• Unrestricted: Net position of assets that are not subject to externally imposed stipulations. Net amounts of assets, deferred outflows of resources, liabilities and deferred inflows of resources not included in the determination of net investment in capital assets or restricted components of net position. Unrestricted net position may be designated for specific purposes by action of management or the Members of the Authority (the “Board”) or may otherwise be limited by contractual agreements with outside parties. When both restricted and unrestricted resources are available for a particular restricted use, it is the Authority’s policy to use restricted resources first, and then unrestricted resources as needed.
b) Deferred outflows/inflows of resourcesIn addition to assets, the statement of financial position will sometimes report a separate section for deferred outflows of resources. This separate financial statement element, deferred outflows of resources, represents a consumption of net position that applies to a future period and so will not be recognized as an outflow of resources (expense/expenditure) until then. At June 30, 2017 and 2016, the Authority has four items that qualify for reporting in this category. The first deferred outflow results from refunding long term debt and is the difference in the carrying value of refunded debt and its reacquisition price. This amount is deferred and amortized over the shorter of the life of the refunded or refunding debt. The second item is related to the difference in the expected versus actual experience of the Pension Plan. This amount is deferred and amortized over approximately seven years.

M A S S A C H U S E T T S P O R T A U T H O R I T Y • N o t e s t o F i n a n c i a l S t a t e m e n t s • J u n e 3 0 , 2 0 1 7 a n d 2 0 1 6 F I N A N C I A L
59
The third item is related to the change in Pension Plan assumptions, the reduction in the discount rate, which is being amortized over approximately seven years. The fourth item is related to the net deferred loss on Pension Plan investments which is being amortized over a five year period.
In addition to liabilities, the statement of financial position will sometimes report a separate section for deferred inflows of resources. This separate financial statement element, deferred inflows of resources, represents an acquisition of net position that applies to a future period and so will not be recognized as an inflow of resources (revenue) until that time. At June 30, 2017 and 2016, the Authority has one item that qualifies for reporting in this category. The deferred inflow results from refunding long term debt and is the difference in the carrying value of refunded debt and its reacquisition price. This amount is deferred and amortized over the shorter of the life of the refunded or refunding debt.
c) Cash and Cash EquivalentsFor purposes of the statements of cash flows, the Authority considers all highly liquid investments, including restricted assets, with an original maturity date of thirty days or less to be cash equivalents.
d) InvestmentsInvestments with a maturity greater than one year are recorded at their fair value with all investment income, including changes in the fair value of investments, reported as investment income in the financial statements. Investments with a maturity date of less than one year are carried at amortized cost, which approximates fair value. Fair value is determined based on quoted market prices. The Authority recorded an unrealized decrease in the fair value of investments of $4.5 million and a realized gain of $0.03 million at June 30, 2017 and an unrealized increase in the fair value of investments of $2.0 million and a realized gain of $0.1 million at June 30, 2016.
e) Restricted Cash and InvestmentsCertain cash, cash equivalents and investments are restricted for use by the 1978 Trust Agreement, the PFC Trust Agreement, the CFC Trust Agreement, and other external requirements. These amounts have been designated primarily for expenditures related to future construction or asset acquisitions, debt service and debt service reserves.
f) Capital AssetsCapital assets are recorded at historical cost. Such costs include, where appropriate, capitalized interest and related legal costs. The costs of normal upkeep, maintenance, and repairs are not capitalized.
The capitalization threshold is noted below:
The Authority capitalizes certain interest costs associated with taxable and tax exempt borrowing, less any interest earned on the proceeds of those borrowings, during the period of construction. Interest expense of $8.6 million and $6.4 million, reduced by interest income of $282.0 thousand and $150.0 thousand resulted in capitalized interest of $8.3 million and $6.2 million for the years ended June 30, 2017 and 2016, respectively.
ASSET CATEGORYBuildingsMachinery & EquipmentEquipment Repair/Overhaul (Major)Runway, Roadways & Other PavingLand Improvements
DOLLAR THRESHOLD$10,000
$5,000$25,000$50,000$50,000

60
M A S S A C H U S E T T S P O R T A U T H O R I T Y • N o t e s t o F i n a n c i a l S t a t e m e n t s • J u n e 3 0 , 2 0 1 7 a n d 2 0 1 6
g) DepreciationThe Authority provides for depreciation using the straight-line method. Depreciation is intended to distribute the cost of depreciable properties over the following estimated useful lives:
h) Other Assets and Prepaid ItemsOther assets consist of certain payments to vendors reflecting costs applicable to future accounting periods and are recorded as prepaid items in the financial statements.
i) AmortizationRevenue bond premiums and discounts are deferred and amortized on a straight-line basis over the term of the bonds, as this approximates the effective interest method. Unamortized amounts are presented as a (reduction) addition of the face amount of bonds payable.
The difference between the reacquisition price and net carrying amount of defeased bonds is amortized on the straight-line method over the shorter of the maturity of the new debt or the defeased debt and is recorded as deferred inflows/outflows of resources on the statement of net position.
j) Revenue RecognitionFees and other services consist of parking fees, landing fees, and container handling fees. Revenues from parking fees and container handling fees are recognized at the time the service is provided. Landing fees are recognized as part of operating revenue when airline related facilities are utilized and are principally based on the landed weight of the aircraft. The scheduled airline fee structure is determined and approved annually by the Board and is based on full cost recovery pursuant to an arrangement between the Authority and the respective airlines.
Rental and concession fees are generated from airlines, rental car companies, and other commercial tenants. Rental revenue on leases is recognized over the term of the associated lease. Concession revenue is recognized partially based on self-reported concession revenue by the tenants and partially based on minimum rental rates. Unearned revenue consists primarily of amounts received in advance for future rents or other services. These amounts are recognized as revenue as they are earned over the applicable period.
Rates and charges are set annually based on the budgeted operating costs and actual capital costs. A true-up calculation is performed for landing fees, terminal rents, and baggage fees at year-end based on the actual results. In the event the actual costs are more than the budgeted amounts for the year, the Authority will recover additional rates and charges. In the event the actual costs are less than the budgeted amounts, the Authority will issue credits to the respective airlines.
The Authority presents its accounts receivable at the expected net realizable value. Accordingly, the Authority has recorded an allowance for doubtful accounts against its accounts receivable of $3.5 million and $2.0 million at June 30, 2017 and 2016, respectively.
ASSET CATEGORYBuildingsRunways (Original Construction)Other Airfield PavingRoadwayMachinery and EquipmentLand Use Rights
YEARS25251225
5 to1030

F I N A N C I A L
61
M A S S A C H U S E T T S P O R T A U T H O R I T Y • N o t e s t o F i n a n c i a l S t a t e m e n t s • J u n e 3 0 , 2 0 1 7 a n d 2 0 1 6
k) Passenger Facility ChargesIn 1993, the Authority received initial approval from the Federal Aviation Administration (“FAA”) to impose a $3.00 PFC on all outbound tickets purchased at Logan Airport. PFCs collected by the Authority can be used for capital projects determined by the FAA to be eligible in accordance with the Aviation Safety and Capacity Expansion Act of 1990. Effective October 1, 2005, the Authority received approval from the FAA to increase the PFC collection to $4.50. All PFC’s collected by the Authority are presently pledged under the PFC Trust Agreement with The Bank of New York Mellon.
Through June 30, 2017, the Authority had cumulative PFC cash collections of $1,122.3 million, including interest thereon.
As part of the Final Agency Decision issued by the FAA in 2011, the Authority was authorized, but not required, to use up to $14.4 million per year in PFCs to pay approximately one-third of the debt service on the Terminal A Special Facility bonds. The Authority chose to make this use of PFC revenue in order to offset the increase in Terminal A rates and charges that would have resulted from the scheduled increase in Terminal A debt service associated with the beginning of principal payments on January 1, 2012 for the Terminal A bonds. This use of PFCs will maintain the rate consistency across all terminals and facilitate the Authority’s ability to assign carriers to Terminal A.
At June 30, 2017, the Authority’s collection authorization and total use approval is $1.67 billion.
As of June 30, 2017 and 2016, $52.9 million and $75.2 million of PFC bonds were outstanding, respectively. Revenues derived from the collection of PFCs are recognized on the accrual basis, based on the month the charges were levied and collected by the airlines. Due to their restricted use, PFCs are categorized as non-operating revenues. The Authority recognized $76.3 million and $70.7 million in PFC revenue for the fiscal years ended June 30, 2017 and 2016, respectively.
l) Customer Facility ChargesEffective December 1, 2008, the Board established a CFC of $4.00 per day for rental cars which originated out of Logan Airport. Effective December 1, 2009, this charge was increased to $6.00 per day. The proceeds of the CFC are being used to finance the Rental Car Center (the “RCC”) and associated bus purchases. Revenues derived from the collection of CFCs are recognized on the accrual basis, based on the month the charges were levied and collected by the rental car companies. Due to their restricted use, CFCs are categorized as non-operating revenues. Pursuant to the CFC Trust Agreement dated May 18, 2011 between the Authority and U.S. Bank National Association, as trustee, the Authority issued two series of Special Facilities Revenue Bonds in June 2011 (the “Series 2011 Bonds”). The Series 2011 Bonds were issued for the purpose of providing funds sufficient, together with other available funds of the Authority, to finance the development and construction of the RCC and related improvements at Logan Airport, fund certain deposits to the Debt Service Reserve Fund and the Supplemental Reserve Fund, and pay certain costs of issuance of the Series 2011 Bonds. The Series 2011 Bonds and any additional bonds that may be issued under the CFC Trust Agreement on parity with the Series 2011 Bonds are secured by CFC Pledged Revenues and by Contingent Rent, if any, payable by the rental car companies and other funds. Additionally, the Series 2011 Bonds are not secured by any other revenues of the Authority.
The Authority recognized $33.1 million and $32.3 million in CFC revenue for the fiscal years ended June 30, 2017 and 2016, respectively.
As of June 30, 2017 and 2016, $198.2 million and $201.7 million of CFC bonds were outstanding, respectively.

62
M A S S A C H U S E T T S P O R T A U T H O R I T Y • N o t e s t o F i n a n c i a l S t a t e m e n t s • J u n e 3 0 , 2 0 1 7 a n d 2 0 1 6
m) Capital ContributionsThe Authority receives capital contributions from various federal agencies and the Commonwealth in support of specific operational programs and its Capital Program. Grant revenues are recognized as related expenditures are incurred and all eligibility requirements are met. Grants for capital asset acquisition, facility development, runway / airfield rehabilitation and long-term planning are reported as capital contributions. Capital contributions are reported in the Statement of Revenues, Expenses and Changes in Net Position after non-operating revenues and expenses and their use is restricted. In fiscal years 2017 and 2016, the Authority recognized $12.6 million and $56.0 million of capital contributions. The 2017 capital contributions were generated from reimbursements under the FAA AIP grant program and the 2016 capital contributions were primarily generated from Transportation Security Administration (TSA) reimbursements for the Checked Baggage Inspection System at Logan Airport and reimbursements under the FAA AIP grant program.
n) Compensated AbsencesThe Authority accrues for vacation and sick pay liabilities when they are earned by the employee. The liability for vested vacation and sick pay is reflected in the accompanying statements of net position as compensated absences. The current portion of compensated absences at June 30, 2017 and 2016 was $1.4 million. The table below presents the Authority’s compensated absences activity at June 30, 2017 and 2016 and for the years then ended (in thousands):
o) PensionsFor purposes of measuring the net pension liability, deferred outflows of resources and deferred inflows of resources related to pensions, and pension expense, information about the fiduciary net position of the Massachusetts Port Authority Employees Retirement System (the “Plan”) and additions to/deductions from Plan’s fiduciary net position have been determined on the same basis as they are reported by the Plan. For this purpose, benefit payments (including refunds of employee contributions) are recognized when due and payable in accordance with the benefit terms. Investments are reported at fair value.
p) Use of EstimatesThe preparation of financial statements in conformity with GAAP requires management to make estimates and assumptions that affect the reported amounts of assets and liabilities and disclosure of contingent assets and liabilities at the date of the financial statements and the reported amounts of revenues and expenditures during the reporting period. Actual results could differ from those estimates.
q) Interfund TransactionsIn fiscal year 2014, the Authority loaned the CFC Trust Agreement $10.0 million at 6.167% interest to complete the construction of the RCC. During fiscal years 2016 and 2015, the CFC Trust repaid the Authority $6.0 and $4.0 million on this loan, respectively. This transaction generated $0.06 million and $0.6 million in interest income and expense during fiscal years 2016 and 2015, respectively, that has been eliminated in the combining schedules. Additionally, all interfund amounts have been eliminated in the combining statements.
2017$19,536$16,107
($16,335)$19,308
2016$19,520$15,042
($15,026)$19,536
Liability Balance, Beginning of YearVacation and Sick Pay Earned During the YearVacation and Sick Pay Used During the YearLiability Balance, End of Year

F I N A N C I A L
63
M A S S A C H U S E T T S P O R T A U T H O R I T Y • N o t e s t o F i n a n c i a l S t a t e m e n t s • J u n e 3 0 , 2 0 1 7 a n d 2 0 1 6
r) New Accounting PronouncementsIn June 2015, GASB issued Statement No. 75, Accounting and Financial Reporting for Postemployment Benefits Other Than Pensions (“GASB No. 75”). The objective of this Statement is to address reporting by governments that provide OPEB to their employees and for governments that finance OPEB for employees of other governments. The requirements of this Statement are effective for financial statements for periods beginning after June 15, 2017.
The Authority is currently evaluating the impact of the implementation of GASB No. 75 on its financial statements.
In January 2016, GASB issued Statement No. 80, Blending Requirements for Certain Component Units, an amendment of GASB Statement No. 14, (“GASB No. 80”). The objective of this Statement is to improve financial reporting by clarifying the financial statement presentation requirements for certain component units. This Statement amends the blending requirements established in paragraph 53 of Statement No. 14, The Financial Reporting Entity, as amended. The additional criterion requires blending of a component unit incorporated as a not-for-profit corporation in which the primary government is the sole corporate member. The additional criterion does not apply to component units included in the financial reporting entity pursuant to the provisions of Statement No. 39, Determining Whether Certain Organizations are Component Units. The requirements of this Statement are effective for financial statements for periods beginning after June 15, 2016.
The Authority adopted this Statement and there was no impact on its financial statements.
In March 2016, GASB issued Statement No. 81, Irrevocable Split-Interest Agreements, (“GASB No. 81”). The objective of this Statement is to improve accounting and financial reporting for irrevocable split-interest agreements by providing recognition and measurement guidance for situations in which a government is a beneficiary of the agreement. Split-interest agreements are a type of giving agreement used by donors to provide resources to two or more beneficiaries, including governments. Split-interest agreements can be created through trusts –or other legally enforceable agreements with the characteristics that are equivalent to split-interest agreements –in which the donor transfers resources to an intermediary to hold and administer for the benefit of a government and at least one other beneficiary. The requirements of this Statement are effective for financial statements for periods beginning after December 15, 2016.
The Authority does not believe this Statement will have any effect on its financial statements.
In November 2016, GASB issued Statement No. 83, Certain Asset Retirement Obligations, (“GASB No. 83”). This Statement addresses accounting and financial reporting for certain asset retirement obligations (AROs). An ARO is a legally enforceable liability associated with the retirement of a tangible capital asset. A government that has legal obligations to perform future asset retirement activities related to its tangible capital assets should recognize a liability based on the guidance in this Statement.
This Statement establishes criteria for determining the timing and pattern of recognition of a liability and a corresponding deferred outflow of resources for AROs. This Statement requires that recognition occur when the liability is both incurred and reasonably estimable. The determination of when the liability is incurred should be based on the occurrence of external laws, regulations, contracts, or court judgments, together with the occurrence of an internal event that obligates a government to perform asset retirement activities. Laws and regulations may require governments to take specific actions to retire certain tangible capital assets at the end of the useful lives of those capital assets, such as decommissioning nuclear reactors and dismantling and removing sewage treatment plants.

64
M A S S A C H U S E T T S P O R T A U T H O R I T Y • N o t e s t o F i n a n c i a l S t a t e m e n t s • J u n e 3 0 , 2 0 1 7 a n d 2 0 1 6
Other obligations to retire tangible capital assets may arise from contracts or court judgments. Internal obligating events include the occurrence of contamination, placing into operation a tangible capital asset that is required to be retired, abandoning a tangible capital asset before it is placed into operation, or acquiring a tangible capital asset that has an existing ARO.
This Statement requires the measurement of an ARO to be based on the best estimate of the current value of outlays expected to be incurred. The best estimate should include probability weighting of all potential outcomes, when such information is available or can be obtained at reasonable cost. If probability weighting is not feasible at reasonable cost, the most likely amount should be used. This Statement requires that a deferred outflow of resources associated with an ARO be measured at the amount of the corresponding liability upon initial measurement. The requirements of this Statement are effective for financial statements for periods beginning after June 15, 2018.
The Authority does not believe this Statement will have any effect on its financial statements.
In January 2017, GASB issued Statement No. 84, Fiduciary Activities, (“GASB No. 84”). This Statement establishes criteria for identifying fiduciary activities of all state and local governments. The focus of the criteria generally is on (1) whether a government is controlling the assets of the fiduciary activity and (2) the beneficiaries with whom a fiduciary relationship exists. Separate criteria are included to identify fiduciary component units and postemployment benefit arrangements that are fiduciary activities.
An activity meeting the criteria should be reported in a fiduciary fund in the basic financial statements. Governments with activities meeting the criteria should present a statement of fiduciary net position and a statement of changes in fiduciary net position. An exception to that requirement is provided for a business-type activity that normally expects to hold custodial assets for three months or less.
This Statement describes four fiduciary funds that should be reported, if applicable: (1) pension (and other employee benefit) trust funds, (2) investment trust funds, (3) private-purpose trust funds, and (4) custodial funds. Custodial funds generally should report fiduciary activities that are not held in a trust or equivalent arrangement that meets specific criteria.
A fiduciary component unit, when reported in the fiduciary fund financial statements of a primary government, should combine its information with its component units that are fiduciary component units and aggregate that combined information with the primary government’s fiduciary funds. This Statement also provides for recognition of a liability to the beneficiaries in a fiduciary fund when an event has occurred that compels the government to disburse fiduciary resources. Events that compel a government to disburse fiduciary resources occur when a demand for the resources has been made or when no further action, approval, or condition is required to be taken or met by the beneficiary to release the assets. The requirements of this Statement are effective for financial statements for periods beginning after December 15, 2018.
The Authority is currently evaluating the impact of the implementation of GASB No. 84 on its financial statements.

F I N A N C I A L
65
M A S S A C H U S E T T S P O R T A U T H O R I T Y • N o t e s t o F i n a n c i a l S t a t e m e n t s • J u n e 3 0 , 2 0 1 7 a n d 2 0 1 6
In March 2017, GASB issued Statement No. 85, Omnibus 2017 (“GASB No. 85”). The objective of this Statement is to address practice issues that have been identified during implementation and application of certain GASB Statements. This Statement addresses a variety of topics including issues related to blending component units, goodwill, fair value measurement and application, and OPEB.
Specifically, this Statement addresses the following topics:
• Blending a component unit in circumstances in which the primary government is a business-type activity that reports in a single column for financial statement presentation.
• Reporting amounts previously reported as goodwill and “negative” goodwill.
• Classifying real estate held by insurance entities.
• Measuring certain money market investments and participating interest-earning investment contracts at amortized cost.
• Timing of the measurement of pension or OPEB liabilities and expenditures recognized in financial statements prepared using the current financial resources measurement focus.
• Recognizing on-behalf payments for pensions or OPEB in employer financial statements.
• Presenting payroll-related measures in required supplementary information for purposes of reporting by OPEB plans and employers that provide OPEB.
• Classifying employer-paid member contributions for OPEB.
• Simplifying certain aspects of the alternative measurement method for OPEB.
• Accounting and financial reporting for OPEB provided through certain multiple-employer defined benefit OPEB plans.
The requirements of this Statement are effective for financial statements for periods beginning after June 15, 2017.
The Authority is currently evaluating the impact of the implementation of GASB No. 85 on its financial statements.
In May 2017, GASB issued Statement No. 86, Certain Debt Extinguishment Issues, (“GASB No. 86”). The primary objective of this Statement is to improve consistency in accounting and financial reporting for in-substance defeasance of debt by providing guidance for transactions in which cash and other monetary assets acquired with only existing resources—resources other than the proceeds of refunding debt—are placed in an irrevocable trust for the sole purpose of extinguishing debt. This Statement also improves accounting and financial reporting for prepaid insurance on debt that is extinguished and notes to financial statements for debt that is defeased in substance.
The requirements of this Statement are effective for financial statements for periods beginning after June 15, 2017.
The Authority is currently evaluating the impact of the implementation of GASB No. 86 on its financial statements. The Authority does not believe this Statement will have any effect on its financial statements.

66
M A S S A C H U S E T T S P O R T A U T H O R I T Y • N o t e s t o F i n a n c i a l S t a t e m e n t s • J u n e 3 0 , 2 0 1 7 a n d 2 0 1 6
2017$90,772
$252,846$67,157$19,276
$3,785$11,941
$3,603($248)
$6,141
($76,296)($33,055)
($245)($12,635)
$4,501($125)
$3,748($3,864)($5,191)
$332,111
2016$105,306
$247,502$63,613$19,375
$5,025$11,903
$2,093($70)
$4,711
($70,718)($32,335)
($821)($56,033)
($2,116)$595
($1,269)$67
($3,764)
$293,064
Increase in Net Position per GAAPADDITIONS: Depreciation and amortization Interest expense Payments in lieu of taxes Other operating expenses Terminal A bonds - debt service contribution OPEB expenses, net Settlement of claims Pension expenseLESS: Passenger facility charges Customer facility charges Self insurance expenses Capital grant revenue Net decrease (increase) in the fair value of investments Loss (gain) on sale of equipment Other (revenues) expenses Other non-operating revenues Investment income
Net revenue per the 1978 Trust Agreement
In June 2017, GASB issued Statement No. 87, Leases, (“GASB No. 87”).The objective of this Statement is to better meet the information needs of financial statement users by improving accounting and financial reporting for leases by governments. This Statement increases the usefulness of governments’ financial statements by requiring recognition of certain lease assets and liabilities for leases that previously were classified as operating leases and recognized as inflows of resources or outflows of resources based on the payment provisions of the contract. It establishes a single model for lease accounting based on the foundational principle that leases are financings of the right to use an underlying asset. Under this Statement, a lessee is required to recognize a lease liability and an intangible right-to-use lease asset, and a lessor is required to recognize a lease receivable and a deferred inflow of resources, thereby enhancing the relevance and consistency of information about governments’ leasing activities.
The requirements of this Statement are effective for financial statements for periods beginning after December 15, 2019.
The Authority is currently evaluating the impact of the implementation of GASB No. 87 on its financial statements.
2 Reconciliation between increase in net position as calculated under GAAP and net revenues as calculated under accounting practices prescribed by the 1978 Trust Agreement
Presented below are the calculations of the net revenues of the Authority under the 1978 Trust Agreement. Net revenue calculated based on the 1978 Trust Agreement is used in determining the Authority’s compliance with the debt service coverage ratio (in thousands).
Total net revenues, as defined by the 1978 Trust Agreement, pledged for the repayment of bonds issued under the 1978 Trust Agreement were $332.1 million and $293.1 million for the years ended June 30, 2017 and 2016, respectively.

F I N A N C I A L
67
3 Deposits and Investments The Authority’s investments are made in accordance with the provisions of the 1978 Trust Agreement, the PFC Trust Agreement and the CFC Trust Agreement along with the investment policy adopted by the Board (the “Investment Policy”). The goals of the Investment Policy are, in order of importance, to preserve capital, to provide liquidity and to generate interest income.
As of June 30, 2017 and 2016, all investments were held on behalf of the Authority by the Trustee, the PFC Trustee, the CFC Trustee or custodians in the Authority’s name. The 1978 Trust Agreement, the PFC Trust Agreement and the CFC Trust Agreement require that securities collateralizing repurchase agreements must continuously have a fair value at least equal to the cost of the agreement plus accrued interest.
The Authority’s investments in forward delivery agreements are in the form of a guaranteed investment contract (“GIC”) which provides for, among other things, the sequential delivery of securities to be sold to the Trustee, PFC Trustee, or CFC Trustee, as applicable, periodically at a discount from maturity value such that the aggregate discount equals the interest rate previously agreed to between the Authority and the provider of the guaranteed investment contract.
The total accumulated unrealized gain (loss) due to the changes in fair value of investments related to investments with maturities in excess of one year was a loss of approximately $1.3 million as of June 30, 2017 and a gain of approximately $3.2 million as of June 30, 2016.
M A S S A C H U S E T T S P O R T A U T H O R I T Y • N o t e s t o F i n a n c i a l S t a t e m e n t s • J u n e 3 0 , 2 0 1 7 a n d 2 0 1 6

68
M A S S A C H U S E T T S P O R T A U T H O R I T Y • N o t e s t o F i n a n c i a l S t a t e m e n t s • J u n e 3 0 , 2 0 1 7 a n d 2 0 1 6
The following summarizes the Authority’s cash and cash equivalents and investments by type held at June 30, 2017 and 2016 (in thousands):
UnratedAA+ / AaaUnrated (2)AA+ / AaaAA+ / AaaAA+ / Aaa
AA+ / A1 (4)Unrated
AAA / Aaa (3)A-1/ P-1 (5)
AAA / Aaa (5)AAA/ Aa1
UnratedUnrated (2)AA+ / Aaa
AA- / Aa2 (7)
CREDIT RATING (1)
COST
$233,906$97,379
$5,003$50,904$98,923$36,085$43,051
$1,085$58,838
$188,769$31,740
$117,603$3,015$3,263
$33,027$132,894
$1,135,485
$233,906$97,197
$5,003$50,728$98,484$36,025$43,051
$1,085$58,838
$188,769$31,740
$117,498$3,015$3,263
$33,012$132,558
$1,134,172
FAIR VALUE
0.0030.9890.0030.9461.3500.791
10.2290.0030.3510.2710.0031.1790.0030.0030.8622.254
EFFECTIVEDURATION
MMDT (6)Federal Home Loan BankFederally Deposit Insurance CorporationFederal Home Loan Mortgage Corp.Federal National Mortgage AssociationFederal Farm CreditGuaranteed Investment Contracts (GIC) (6)Cash DepositCertificates of DepositCommercial PaperGovernment Fund-Morgan Stanley/Wells FargoMunicipal BondMoney Market FundsInsured Cash SweepTreasury NotesCorporate Bonds
2017

F I N A N C I A L
69
M A S S A C H U S E T T S P O R T A U T H O R I T Y • N o t e s t o F i n a n c i a l S t a t e m e n t s • J u n e 3 0 , 2 0 1 7 a n d 2 0 1 6
CREDIT RATING(1)
COST FAIR VALUE EFFECTIVEDURATION
2016
UnratedAA+ / AaaUnrated (2)AA+ / AaaAA+ / AaaAA+ / AaaAA+ / Aaa
AA+ / Aa3 (4)Unrated
AAA / Aaa (3)A-1/ P-1 (5)
AAA / Aaa (5)AA+ / Aa1
UnratedUnrated (2)AAA / Aaa
Unrated
$204,708$104,380
$5,002$12,329$44,359$95,104$44,062$41,362
$287$38,665
$179,576$24,852
$125,116$1,388
$14,226$34,955
$809$971,180
$204,708$105,185
$5,002$12,329$44,518$95,666$44,308$41,362
$287$38,665
$179,576$24,852
$126,148$1,388
$14,226$35,304
$809$974,333
0.0031.8320.0030.9601.2361.4261.508
10.7900.0030.5760.2400.0031.6240.0030.0031.7840.003
MMDT (6)Federal Home Loan Bank Federally Insured Cash AccountForward Delivery Agreement (FDA) (6) Federal Home Loan Mortgage Corp Federal National Mortgage AssociationFederal Farm CreditGuaranteed Investment Contracts (GIC) (6)Cash Deposit Certificates of DepositCommercial PaperGovernment Fund-Morgan Stanley / Wells FargoMunicipal BondMoney Market FundsInsured Cash Sweep Treasury NotesCommon Stock
1. The ratings are from S&P or Moody’s as of the fiscal year presented. 2. FDIC Insured Deposits Accounts.3. Collateralized by Federal Agency Notes or Letter of Credit backed by each reserve4. Underlying rating of security held. 5. Credit quality of fund holdings.6. MMDT, FDA and GIC are carried at cost, which approximates fair value in the tables. 7. The Authority owns a diverse portfolio of corporate bonds with S&P credit ratings ranging from A to AAA and Moody’s credit ratings ranging from A1 to Aaa These corporate bonds have an average credit rating of AA- / Aa2.
The table below presents the Authority’s cash and cash equivalents and investments based on maturity date (in thousands):
COST
$412,899$449,577$273,009
$1,135,485
FAIR VALUE
$411,701$449,462$273,009
$1,134,172
COST
$428,786$291,931$250,463$971,180
FAIR VALUE
$431,803$292,067$250,463
$974,333
Securities maturing in 1 year or more Securities maturing in less than 1 year Cash and cash equivalentsTOTAL
2017 2016

70
M A S S A C H U S E T T S P O R T A U T H O R I T Y • N o t e s t o F i n a n c i a l S t a t e m e n t s • J u n e 3 0 , 2 0 1 7 a n d 2 0 1 6
Credit RiskCredit risk is the risk that the Authority will be negatively impacted due to the default of the security issuer or investment counterparty.
The Authority’s 1978 Trust Agreement, PFC Trust Agreement and CFC Trust Agreement each stipulate that, in addition to U.S. Treasury and government agency obligations, only certain highly rated securities are eligible investments, including bonds or obligations of any state or political subdivision thereof, rated in the two highest rating categories without regard to gradations within rating categories, by both Moody’s (AAA, Aa1, Aa2 and Aa3) and S&P (AAA, AA+, AA, and AA-); commercial paper of a U.S. corporation, finance company or money market funds rated in the highest rating category, without regard to gradations within categories, by both Moody’s and S&P; and investment contracts with banks whose long-term unsecured debt rating is in one of the two highest rating categories by both Moody’s and S&P. In addition, U.S. dollar denominated corporate bonds, notes or other debt obligations issued or guaranteed by a domestic or foreign corporation, financial institution, non-profit or other entity rated in one of the three highest rating categories, without regard to gradations within such categories by Moody’s and S&P.
a) Custodial Credit Risk – DepositsThe custodial credit risk for deposits is the risk that in the event of a bank failure, the Authority’s deposits may not be recovered. Bank deposits in excess of the insured amount are uninsured and uncollateralized.
The Authority maintains depository accounts with Bank of America, N.A., Wells Fargo Bank, N.A., TD Bank, N.A. and The Bank of New York Mellon, the PFC Trustee. The Authority maintains a payroll disbursement, lockbox and collection accounts (for other than PFCs) with Bank of America, N.A. None of these accounts are collateralized.
The Authority’s cash on deposits in the banks noted above at June 30, 2017 and 2016 was $1.1 million and $0.29 million, respectively, and of these amounts, $1.0 million and $0.75 million was insured in each year, and no amount was collateralized at June 30, 2017 or 2016.
b) Custodial Credit Risk – InvestmentsCustodial credit risk is the risk that, in the event of a failure of the counterparty, the Authority would not be able to recover the value of its investments or collateral securities that were in the possession of an outside party. Investment securities are exposed to custodial credit risk if they are uninsured or not registered in the name of the Authority and are held by either the counterparty or, the counterparty’s trust department or agent, but not in the Authority’s name. The Authority is authorized by the 1978 Trust Agreement, the PFC Trust Agreement, the CFC Trust Agreement and the Investment Policy to invest in obligations of the U.S. Treasury, including obligations of its agencies and instrumentalities, bonds and notes of public agencies or municipalities, bank time deposits, guaranteed investment contracts, money market accounts, commercial paper of a U.S. corporation or finance company and corporate bonds. All investments are held by a third party in the Authority’s name. These investments are recorded at fair value.
Additionally, the Authority is authorized to invest in the Massachusetts Municipal Depository Trust (“MMDT”), a pooled money market like investment fund managed by the Commonwealth of Massachusetts, established under the General Laws, Chapter 29, Section 38A. MMDT investments are carried at amortized cost, which approximates fair value which is the same as the value of the pool. The Authority can purchase and sell its investments at any time without penalty.

F I N A N C I A L
71
M A S S A C H U S E T T S P O R T A U T H O R I T Y • N o t e s t o F i n a n c i a l S t a t e m e n t s • J u n e 3 0 , 2 0 1 7 a n d 2 0 1 6
The following guaranteed investment contracts were in force as of June 30, 2017 and 2016, respectively; they are uncollateralized and recorded at cost:
c) Concentration of Credit Risk – InvestmentsConcentration of credit risk is assumed to arise when the amount of investments that the Authority has with any one issuer exceeds 5% of the total value of the Authority’s investments. The Authority consults with its Investment Advisor to select Commercial Paper Issuers with strong credit ratings. The book values of portions of the Authority-wide portfolio, excluding investments issued by MMDT, the FDIC, or U.S. Government guaranteed obligations and the underlying securities held under forward delivery agreements at cost, that exceed 5% of the portfolio are as follows (in thousands):
d) Credit Ratings– InvestmentsThe 1978 Trust Agreement, the PFC Trust Agreement, the CFC Trust Agreement and the Board approved Investment Policy generally limit the Authority in the types of investments it can purchase to the two highest rating categories without regard to gradations within the rating categories by both Moody’s (Aaa, Aa1, Aa2, and Aa3) and S&P (AAA, AA+, AA, and AA-) and in corporate bonds rated in one of the three highest rating categories without regard to gradations within such categories by Moody’s and S&P.
Investments in bank certificates of deposits were fully collateralized. Also, the Authority invested in MMDT, managed by the State Treasury, which is not rated.
e) Interest Rate Risk – InvestmentsInterest rate risk is the risk that changes in interest rates will adversely affect the fair value of an investment. The Authority has set targets for the preferred maturity structure of the investments held in each fund and account, and also sets targets each quarter for the effective duration for each fund that reflect the need for liquidity and the expected tradeoffs between yield and term for each different fund and account. It is the Authority’s practice to hold investments until maturity in order to insulate the Authority’s investment earnings from interest rate risk. The Authority mitigates interest rate risk by managing the weighted average maturity of each portfolio type to best meet its liquidity needs.
RATE
4.357%3.808%
INVESTMENT AGREEMENT PROVIDER
Trinity Plus Funding Company GE Funding Capital Markets
MATURITY
1/2/203112/31/2030
TOTAL
2017
$19,003$24,048$43,051
2016
$18,199$23,163$41,362
COMMERCIAL PAPER ISSUER
Bank of Tokyo Mitsubishi UFJ JP Morgan ChaseCredit AgricoleToyota Motor CorporationUBSTOTAL% OF PORTFOLIO
2017
$54,819$47,832$31,843$54,275
$0$188,769
16.70%
2016
$46,859$45,902$28,990$47,841
$9,984$179,576
18.54%

72
M A S S A C H U S E T T S P O R T A U T H O R I T Y • N o t e s t o F i n a n c i a l S t a t e m e n t s • J u n e 3 0 , 2 0 1 7 a n d 2 0 1 6
f) Cash, Cash Equivalents and Investments by FundThe following summarizes cash and investments, at cost and fair value, as of June 30, by the various funds and accounts established by the Authority for debt covenant requirements and other purposes. In the following table, the fair value of MMDT, FDA and GIC approximate their costs (in thousands):
g) Fair Value MeasurementFair value is the price that would be received to sell an asset or paid to transfer a liability in an orderly transaction between market participants at the measurement date. Fair value is a market-based measurement, not an entity-specific measurement. For some assets and liabilities, observable market transactions or market information might be available; for others, it might not be available. However, the objective of a fair value measurement in both cases is the same—that is, to determine the price at which an orderly transaction to sell the asset or to transfer the liability would take place between market participants at the measurement date under current market conditions. Fair value is an exit price at the measurement date from the perspective of a market participant that controls the asset or is obligated for the liability.
The fair value hierarchy categorizes the inputs to valuation techniques used to measure fair value into three levels. Level 1 inputs are quoted prices (unadjusted) for identical assets or liabilities in active markets that a government can access at the measurement date. Level 2 inputs are inputs other than quoted prices included within Level 1 that are observable for an asset or liability, either directly or indirectly. Level 3 inputs are unobservable inputs for an asset or liability. The fair value hierarchy gives the highest priority to Level1 inputs and the lowest priority to Level 3 inputs.
COST
$277,639$68,323
$114,717$77,137
$172,845$89,765$45,449$31,492
$0$16,749$53,912$20,409
$551$54,388$37,544
$27,977$1,696
$0$9,402
$35,490$1,135,485
1978 TrustImprovement and Extension FundCapital Budget Account Debt Service Reserve Funds Debt Service Funds Maintenance Reserve Fund Operating/Revenue FundSubordinated Debt FundsSelf-Insurance Account2014 B Project Fund 2015 B Project Fund2016 B Project FundOther Funds1999 PFC TrustDebt Service Reserve FundsDebt Service Funds Other PFC Funds2011 CFC TrustDebt Service Reserve Funds CFC Maintenance Reserve Fund 2011 A & B CFC Project FundsDebt Service Reserve Funds Other CFC FundsTOTAL
FAIR VALUE
$277,012$68,323
$114,509$77,137
$172,539$89,764$45,449$31,474
$0$16,749$53,908$20,409
$551$54,388$37,517
$27,959$1,696
$0$9,402
$35,386$1,134,172
COST
$213,820$54,565
$108,295$74,083
$181,697$69,272$43,759$30,672
$4,431$37,941
$0$19,340
$20,108$24,259$33,095
$28,059$826
$84$9,281
$17,593$971,180
FAIR VALUE
$214,769$54,565
$109,144$74,083
$182,422$69,272$43,759$30,969
$4,431$37,957
$0$19,340
$20,120$24,259$33,148
$28,274$826$84
$9,281$17,360
$974,333
2017 2016

73
F I N A N C I A LM A S S A C H U S E T T S P O R T A U T H O R I T Y • N o t e s t o F i n a n c i a l S t a t e m e n t s • J u n e 3 0 , 2 0 1 7 a n d 2 0 1 6
The following tables show the fair value and the fair value measurements for our cash and cash equivalents and investments, subject to the provisions of GASB No. 72:
Cash, Cash Equivalents and Investments Measured at Fair Value (in thousands)
Cash, Cash Equivalents and Investments Measured at Fair Value (in thousands)
FAIR VALUE
$97,197$5,003
$50,728$98,484$36,025
$1,085$58,838
$188,769$31,740
$117,498$3,015$3,263
$33,012$132,558
$857,215
AS OF JUNE 30, 2017
Federal Home Loan Bank Federally Insured Cash AccountFederal Home Loan Mortgage Corp. Federal National Mortgage Association Federal Farm Credit Cash Deposit Certificates of Deposit Commercial Paper Government Fund-Morgan Stanley / Wells FargoMunicipal BondMoney Market Funds Insured Cash Sweep Treasury Notes Corporate BondsTotal Cash, Cash equivalents and Investments Measured at Fair Value
LEVEL 1
$0$5,003
$0$0$0
$1,085$58,838
$0$31,740
$0$3,015$3,263
$0$0
$102,944
LEVEL 2
$97,197$0
$50,728$98,484$36,025
$0$0
$188,769$0
$117,498$0$0
$33,012$132,558
$754,271
LEVEL 3
$0$0$0$0$0$0$0$0$0$0$0$0$0$0
$0
FAIR VALUE
$105,185$5,002
$44,518$95,666$44,308
$287$38,665
$179,576$24,852
$126,148$1,388
$14,226$35,304
$809
$715,934
AS OF JUNE 30, 2016
Federal Home Loan Bank Federally Insured Cash AccountFederal Home Loan Mortgage Corp. Federal National Mortgage Association Federal Farm Credit Cash Deposit Certificates of Deposit Commercial Paper Government Fund-Morgan Stanley / Wells FargoMunicipal BondMoney Market Funds Insured Cash Sweep Treasury Notes Common StockTotal Cash, Cash equivalents and Investments Measured at Fair Value
LEVEL 1
$0$5,002
$0$0$0
$287$38,665
$0$24,852
$0$1,388
$14,226$0
$809
$85,229
LEVEL 2
$105,185$0
$44,518$95,666$44,308
$0$0
$179,576$0
$126,148$0$0
$35,304$0
$630,705
LEVEL 3
$0$0$0$0$0$0$0$0$0$0$0$0$0$0
$0

74
M A S S A C H U S E T T S P O R T A U T H O R I T Y • N o t e s t o F i n a n c i a l S t a t e m e n t s • J u n e 3 0 , 2 0 1 7 a n d 2 0 1 6
Cash and Money Market FundsAs of June 30, 2017 and 2016, the Authority held positions in various cash and money market funds and the fair values of those funds were $102.9 million and $84.4 million, respectively. The fair values of the cash and money market funds were valued using quoted market prices (Level 1).
Federal Agency NotesAs of June 30, 2017 and 2016, the Authority held positions in federal agency notes and the fair values were $282.4 million and $289.7 million, respectively. The fair values of the federal agency notes were based on a market approach using quoted prices by a third party for markets that are not active (Level 2).
Commercial Paper NotesAs of June 30, 2017 and 2016, the Authority held positions in commercial paper notes and the fair values were $188.8 million and $179.6 million, respectively. The fair values of the commercial paper notes were based on a market approach using quoted prices by a third party for markets that are not active (Level 2).
Municipal Bonds As of June 30, 2017 and 2016, the Authority held positions in municipal bonds and the fair values were $117.5 million and $126.1 million, respectively. The fair values of the municipal bonds were based on a market approach using quoted prices by a third party for markets that are not active (Level 2).
Treasury Notes As of June 30, 2017 and 2016, the Authority held positions in Treasury Notes and the fair values were $33.0 million and $35.3 million, respectively. The fair values of the Treasury Notes were based on a market approach using quoted prices by a third party for markets that are not active (Level 2).
Corporate Bonds As of June 30, 2017, the Authority held positions in corporate bonds and the fair value was $132.6 million. The fair values of the corporate bonds was based on a market approach using quoted prices by a third party for markets that are not active (Level 2).
Common StockAs of June 30, 2016, the Authority held a position in common stock and the fair value was $0.8 million. The fair value of the common stock was valued using a quoted market price (Level 1).

F I N A N C I A L
75
M A S S A C H U S E T T S P O R T A U T H O R I T Y • N o t e s t o F i n a n c i a l S t a t e m e n t s • J u n e 3 0 , 2 0 1 7 a n d 2 0 1 6
Capital assets consisted of the following at June 30, 2017 and 2016 (in thousands):
Depreciation and amortization for fiscal year 2017 and 2016 was $252.8 million and $247.5 million, respectively.
4 Capital Assets
CAPITAL ASSETS NOT BEING DEPRECIATED:LandConstruction In ProgressTotal Capital Assets Not Being Depreciated
CAPITAL ASSETS BEING DEPRECIATED:BuildingsRunway And Other PavingRoadwayMachinery And EquipmentAir RightsParking RightsTotal Capital Assets Being Depreciated
LESS ACCUMULATED DEPRECIATION:BuildingsRunway And Other PavingRoadwayMachinery And EquipmentAir RightsParking Rights
Total Accumulated Depreciation Total Capital Assets Being Depreciated, Net
Capital Assets, Net
JUNE 30, 2016
$226,497$225,930
$452,427
$3,187,058$830,546$713,641 $565,267$184,173
$46,261$5,526,946
$1,592,846 $474,008 $361,721 $321,309 $119,462
$23,130
$2,892,476
$2,634,470
$3,086,897
ADDITIONS AND TRANSFERS IN
$4,388$308,789 $313,177
$260,994 $47,678
$4,649 $66,547
$732 $0
$380,600
$124,246 $40,064 $28,730 $48,146
$6,815 $1,543
$249,544
$131,056
$444,233
DELETIONS AND TRANSFERS OUT
$292 $384,989 $385,281
$7,622 $0$0
$1,060 $0$0
$8,682
$4,319 $0$0
$1,007 $0$0
$5,326
$3,356
$388,637
JUNE 30, 2017
$230,593 $149,730
$380,323
$3,440,430 $878,224 $718,290 $630,754 $184,905
$46,261$5,898,864
$1,712,773 $514,072 $390,451 $368,448 $126,277
$24,673
$3,136,694
$2,762,170
$3,142,493

76
M A S S A C H U S E T T S P O R T A U T H O R I T Y • N o t e s t o F i n a n c i a l S t a t e m e n t s • J u n e 3 0 , 2 0 1 7 a n d 2 0 1 6
Capital assets (excluding construction in progress) at June 30 comprised the following (in thousands):
During fiscal years 2017 and 2016, the Authority completed and placed into service portions of its new Checked Baggage Inspection System (“CBIS”). The write off of the old CBIS generated a current period expense of $3.3 million and $13.1 million in fiscal years 2017 and 2016, respectively, which is included in depreciation expense.
ADDITIONS AND TRANSFERS IN
$16,495 $359,923 $376,418
$189,185 $23,322
$5,549 $132,714
$418 $0
$351,188
$115,028 $39,754 $28,631 $42,541
$6,972 $1,542
$234,468
$116,720
$493,138
CAPITAL ASSETS NOT BEING DEPRECIATEDLandConstruction In ProgressTotal Capital Assets Not Being Depreciated
CAPITAL ASSETS BEING DEPRECIATED:BuildingsRunway And Other PavingRoadwayMachinery And EquipmentAir RightsParking RightsTotal Capital Assets Being Depreciated
LESS ACCUMULATED DEPRECIATION:BuildingsRunway And Other PavingRoadwayMachinery And EquipmentAir RightsParking Rights
Total Accumulated Depreciation Total Capital Assets Being Depreciated, net
Capital Assets, Net
JUNE 30, 2015
$211,444 $217,689 $429,133
$3,026,969 $807,224 $708,092 $434,295 $183,755 $46,261
$5,206,596
$1,493,838 $434,254 $333,090 $280,112 $112,490
$21,588
$2,675,372
$2,531,224
$2,960,357
DELETIONS AND TRANSFERS OUT
$1,442 $351,682 $353,124
$29,096 $0$0
$1,742 $0$0
$30,838
$16,020 $0$0
$1,344 $0$0
$17,364
$13,474
$366,598
JUNE 30, 2016
$226,497 $225,930
$452,427
$3,187,058 $830,546 $713,641 $565,267 $184,173
$46,261 $5,526,946
$1,592,846 $474,008 $361,721 $321,309 $119,462
$23,130
$2,892,476
$2,634,470
$3,086,897
Facilities completed by operation:AirportsPortCapital assets (excluding construction in progress)
2017
$ 5,592,547 $ 536,910
$6,129,457
2016
$ 5,223,876$513,567
$ 5,737,443

77
F I N A N C I A LM A S S A C H U S E T T S P O R T A U T H O R I T Y • N o t e s t o F i n a n c i a l S t a t e m e n t s • J u n e 3 0 , 2 0 1 7 a n d 2 0 1 6
5 Bonds and Notes Payable
Long-term debt at June 30, 2017 consisted of the following and represents maturities on the Authority’s fiscal year basis (in thousands):
Revenue Bonds:SENIOR DEBT-1978 TRUST AGREEMENT:2007, Series A, 4.00% to 4.50%, issued May 31, 2007 due 2016 to 20382007, Series C, 4.00% to 5.00%, issued May 31, 2007 due 2016 to 20282008, Series A Multi-Modal, variable issued June 19, 2008 due 2016 to 20392008, Series C, 4.60% to 5.00%, issued July 9, 2008 due 2016 to 20212010, Series A, 3.00% to 5.00%, issued August 5, 2010 due 2016 to 20412010, Series B, 3.00% to 5.00%, issued August 5, 2010 due 2016 to 20412010, Series C, 4.00% to 5.00%, issued August 5, 2010 due 2016 to 20192010, Series D, Multi-Modal variable, issued August 5, 2010 due 2016 to 20302012, Series A, 3.00% to 5.00%, issued July 11, 2012 due 2016 to 20432012, Series B, 3.00% to 5.00%, issued July 11, 2012 due 2017 to 20332014, Series A, 2.00% to 5.00%, issued July 17, 2014 due 2017 to 20452014, Series B, 4.00% to 5.00%, issued July 17, 2014 due 2017 to 20452014, Series C, 2.00% to 5.00%, issued July 17, 2014 due 2016 to 20362015, Series A, 5.00%, issuedJuly 15, 2015 due 2019 to 20452015, Series B, 5.00%, issuedJuly 15, 2015 due 2019 to 20452015, Series C, 2.12% to 2.83%, issued June 30, 2015 due 2026 to 20302016, Series A, 3.00% to 5.00%, issued July 20, 2016 due 2017 to 20382016, Series B, 4.00% to 5.00%, issued July 20, 2016 due 2043 and 2046
Subtotal Senior Debt
BEGINNINGBALANCE
$43,305
$25,200
$21,455
$17,625
$92,210
$129,985
$10,615
$84,165
$104,305
$158,830
$45,455
$48,230
$150,995
$104,480
$67,005
$170,730
$0
$0
$1,274,590
ADDITIONS
$0
$0
$0
$0
$0
$0
$0
$0
$0
$0
$0
$0
$0
$0
$0
$0
$49,970
$180,285
$230,255
REDUCTIONS
$42,030
$1,585
$21,455
$4,775
$2,050
$1,810
$3,275
$5,475
$8,000
$0
$0
$0
$6,975
$0
$0
$13,765
$0
$0
$111,195
ENDING BALANCE
$1,275
$23,615
$0
$12,850
$90,160
$128,175
$7,340
$78,690
$96,305
$158,830
$45,455
$48,230
$144,020
$104,480
$67,005
$156,965
$49,970
$180,285
$1,393,650
DUE WITHINONE YEAR
$1,275
$1,660
$0
$5,020
$2,135
$1,865
$3,530
$13,080
$5,975
$2,425
$825
$855
$7,180
$0
$0
$14,070
$290
$0
$60,185

78
M A S S A C H U S E T T S P O R T A U T H O R I T Y • N o t e s t o F i n a n c i a l S t a t e m e n t s • J u n e 3 0 , 2 0 1 7 a n d 2 0 1 6
The Authority’s bonds payable at June 30, 2017 and 2016 include $78.7 million and $105.6 million of variable rate demand bonds (“VRDB”) consisting of Series 2008 A and Series 2010 D, respectively. The VRDBs have remarketing features which allow bondholders the right to return, or put, the bonds to the Authority. On August 7, 2013, the Authority entered into a five year irrevocable letter of credit agreement with State Street Bank, in support of the VRDBs. This agreement requires repayment of the tendered, unremarketed VRDBs and any associated obligations on the bonds tendered. Should the VRDBs be tendered and the letter of credit utilized to pay the purchase price of such bonds, the tendered bonds would be converted to bank bonds, possibly requiring one tenth of the tendered bonds to become due within 270 days. The Authority would look to identify an alternative financing arrangement in advance of the bank bonds debt service payment becoming due to satisfy this obligation.
SUBORDINATED DEBT- 1978 TRUST AGREEMENT:2000, Series A,B & C, 6.45%, issuedDecember 29, 2000 due 20312001, Series A,B & C, 6.45%, issuedJanuary 2, 2001 due 2032
Subtotal Subordinate Debt
SENIOR DEBT - PFC TRUST AGREEMENT:2007, Series B, 4.00% to 5.00%, issuedMay 31, 2007 due 2016 to 20182007, Series D, 5.00%, issuedMay 31, 2007 due 2016 to 2018
Subtotal PFC Senior Debt SENIOR DEBT - CFC TRUST AGREEMENT:2011, Series A, 5.125%, issuedJune 8, 2011 due 2038 to 20422011, Series B, 3.53% to 6.352%, issuedJune 8, 2011 due 2016 to 2038
Subtotal CFC Senior Debt
Total Bonds Payable
LESS UNAMORTIZED AMOUNTS:Bond premium (discount), net
Total Bonds Payable, net
BEGINNINGBALANCE
$40,000
$34,000
$74,000
$14,815
$60,420
$75,235
$58,030
$143,650
$201,680
$1,625,505
$98,970
$1,724,475
ADDITIONS
$0
$0
$0
$0
$0
$0
$0
$0
$0
$230,255
$39,777
$270,032
REDUCTIONS
$0
$0
$0
$5,055
$17,270
$22,325
$0
$3,485
$3,485
$137,005
$6,837
$143,842
ENDING BALANCE
$40,000
$34,000
$74,000
$9,760
$43,150
$52,910
$58,030
$140,165
$198,195
$1,718,755
$131,910
$1,850,665
DUE WITHINONE YEAR
$0
$0
$0
$9,760
$43,150
$52,910
$0
$3,620
$3,620
$116,715
$6,285
$123,000
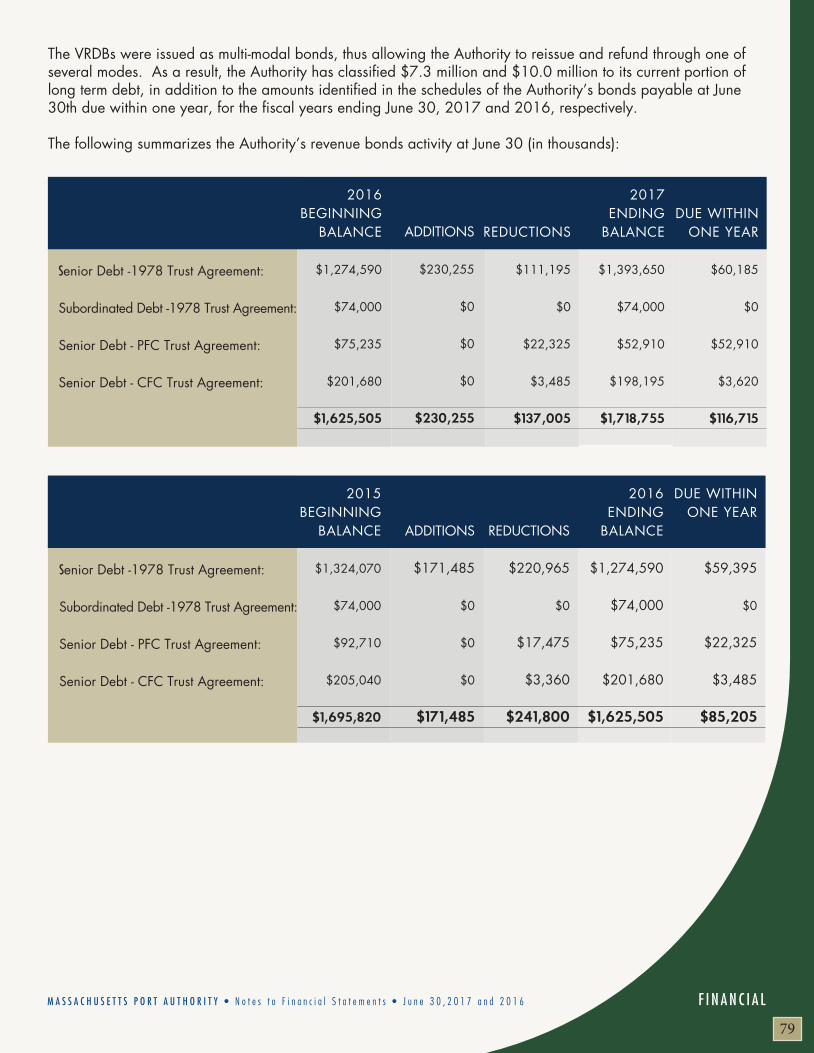
F I N A N C I A L
79
M A S S A C H U S E T T S P O R T A U T H O R I T Y • N o t e s t o F i n a n c i a l S t a t e m e n t s • J u n e 3 0 , 2 0 1 7 a n d 2 0 1 6
The VRDBs were issued as multi-modal bonds, thus allowing the Authority to reissue and refund through one of several modes. As a result, the Authority has classified $7.3 million and $10.0 million to its current portion of long term debt, in addition to the amounts identified in the schedules of the Authority’s bonds payable at June 30th due within one year, for the fiscal years ending June 30, 2017 and 2016, respectively.
The following summarizes the Authority’s revenue bonds activity at June 30 (in thousands):
Senior Debt -1978 Trust Agreement:
Subordinated Debt -1978 Trust Agreement:
Senior Debt - PFC Trust Agreement:
Senior Debt - CFC Trust Agreement:
2016BEGINNING
BALANCE
$1,274,590
$74,000
$75,235
$201,680
$1,625,505
ADDITIONS
$230,255
$0
$0
$0
$230,255
REDUCTIONS
$111,195
$0
$22,325
$3,485
$137,005
2017ENDING
BALANCE
$1,393,650
$74,000
$52,910
$198,195
$1,718,755
DUE WITHIN ONE YEAR
$60,185
$0
$52,910
$3,620
$116,715
Senior Debt -1978 Trust Agreement:
Subordinated Debt -1978 Trust Agreement:
Senior Debt - PFC Trust Agreement:
Senior Debt - CFC Trust Agreement:
2015BEGINNING
BALANCE
$1,324,070
$74,000
$92,710
$205,040
$1,695,820
ADDITIONS
$171,485
$0
$0
$0
$171,485
REDUCTIONS
$220,965
$0
$17,475
$3,360
$241,800
2016ENDING
BALANCE
$1,274,590
$74,000
$75,235
$201,680
$1,625,505
DUE WITHIN ONE YEAR
$59,395
$0
$22,325
$3,485
$85,205

80
M A S S A C H U S E T T S P O R T A U T H O R I T Y • N o t e s t o F i n a n c i a l S t a t e m e n t s • J u n e 3 0 , 2 0 1 7 a n d 2 0 1 6
Debt service requirements on revenue bonds (1978 Trust, PFC Trust and CFC Trust outstanding at June 30, 2017 are as follows (in thousands):
a) Senior Debt - 1978 Trust Agreement On July 20, 2016, the Authority issued $230.3 million of Massachusetts Port Authority Revenue Bonds in two series. The Series 2016 A Revenue Refunding Bonds were issued in the principal amount of $50.0 million with an original issue premium of approximately $12.6 million and interest rates ranging from 3.0% to 5.0%. The 2016 A Bonds were issued to refund a portion of the currently outstanding Revenue Bonds, Series 2007 A Bonds on an advance basis and all of the currently outstanding variable rate demand revenue bonds, Series 2008 A.
The Series 2016 B Revenue Bonds were issued in the principal amount of $180.3 million with an original issue premium of approximately $26.8 million and interest rates ranging from 4.0% to 5.0%. The 2016 B Bonds were issued to finance a portion of the Authority’s FY16-FY20 Capital Program in part through the repayment of $25.0 million of then outstanding Tax Exempt Commercial Paper notes, Series 2012 B which had been used to finance a portion of the Authority’s FY16-FY20 Capital Program prior to the date of issuance of the Series 2016 B Bonds. Due to the “private activity” nature of the construction projects, these bonds were sold as AMT bonds.
On July 15, 2015, the Authority issued $171.5 million of Massachusetts Port Authority Revenue Bonds in two series. The Series 2015 A Revenue Bonds were issued in the principal amount of $104.5 million with an original issue premium of approximately $15.4 million and an interest rate of 5.0%. The projects financed with Series A bond proceeds include the completion of the parking garage at the Framingham Logan Express site, property acquisition and parking improvements at the Braintree Logan Express and construction of 2,050 additional parking spaces at Logan Airport.
Year ending June 30:
201720182019202020212022-20262027-20312032-20362037-2041 2042-2046Total
PRINCIPAL
$109,425 $58,400 $56,390 $58,830 $58,130
$310,850 $358,350 $250,210 $238,615 $219,555
$1,718,755
INTEREST
$78,025 $74,233 $72,279 $70,271 $68,198
$305,867 $237,135 $148,512
$88,154 $27,262
$1,169,936
TOTAL
$187,450 $132,633 $128,669 $129,101 $126,328 $616,717 $595,485 $398,722 $326,769 $246,817
$2,888,691

F I N A N C I A L
81
M A S S A C H U S E T T S P O R T A U T H O R I T Y • N o t e s t o F i n a n c i a l S t a t e m e n t s • J u n e 3 0 , 2 0 1 7 a n d 2 0 1 6
The Series 2015 B Revenue Bonds were issued in the principal amount of $67.0 million with an original issue premium of approximately $8.0 million and an interest rate of 5.0%. The projects financed with Series B bond proceeds include construction of a post security corridor between Terminal C and Terminal E, HVAC equipment replacement, HVAC equipment distribution, roof replacements, the creation of new remain overnight parking spaces, and Terminal A airline relocation. Due to the “private activity” nature of the construction projects, these bonds were sold as AMT bonds.
On June 30, 2015, the Authority issued $170.7 million of Massachusetts Port Authority Revenue Refunding Bonds. The Series 2015 C Revenue Refunding Bonds were issued in the principal amount of $170.7 million as two fixed rate direct placement bonds of $131.0 million and $39.7 million, due to mature in 2025 and 2029, respectively. This competitive bank bid process resulted in a net present value savings of nearly $27.5 million and the proceeds were used to refund the entire outstanding balance of the 2005 Series C Revenue Bonds on July 1, 2015.
The Authority, through its 1978 Trust Agreement, has covenanted to maintain a debt service coverage ratio of not less than 1.25. Debt service coverage is calculated based on a formula set forth in the 1978 Trust Agreement. Historically, the Authority has maintained a debt service coverage ratio higher than its Trust Agreement requirement to maintain its investment grade bond ratings. As of June 30, 2017 and 2016, the Authority’s debt service coverage under the 1978 Trust Agreement was 3.27 and 2.98, respectively.
b) Subordinate Debt - 1978 Trust Agreement Subordinate debt is payable solely from funds on deposit in the Improvement and Extension Fund and is not subject to the pledge of the 1978 Trust Agreement, the PFC Trust Agreement or the CFC Trust Agreement. The Authority invested $12.0 million in January 2001 which at maturity will provide for the $74.0 million principal payments of the subordinate debt at their respective maturities on December 31, 2030 and January 1, 2031. As of June 30, 2017, the value of the two GICs was approximately $43.1 million as compared to $41.4 million as of June 30, 2016.
c) Senior Debt - PFC Trust AgreementThe Authority’s outstanding PFC debt continues to be backed by a pledge of the $4.50 PFC collections. The Authority earned PFC Revenues, as defined by the PFC Trust Agreement, of approximately $76.3 million and $71.0 million during fiscal years 2017 and 2016, respectively. These amounts include approximately $0.5 and $0.3 million of investment income on PFC receipts during each of fiscal years 2017 and 2016, respectively.
The PFC Trust Agreement requires a First Lien Sufficiency covenant ratio in excess of 1.05. As of June 30, 2017 and 2016, the Authority’s PFC First Lien Sufficiency covenant ratio under the PFC Trust Agreement was 63.44 and 10.68, respectively.
d) Senior Debt - CFC Trust AgreementThe Authority’s outstanding CFC debt continues to be backed by a pledge of the $6.00 CFC collections. The Authority earned CFC Revenues, as defined by the CFC Trust Agreement, of approximately $33.1 million and $32.8 million during fiscal years 2017 and 2016, respectively. These amounts include approximately $0.4 and $0.5 million of investment income on CFC receipts during each of the fiscal years 2017 and 2016, respectively.
The CFC Trust Agreement requires that the Authority maintain a debt service coverage ratio of at least 1.3. As of June 30, 2017 and 2016, the CFC debt service coverage ratio was 2.60 and 2.50, respectively.

82
M A S S A C H U S E T T S P O R T A U T H O R I T Y • N o t e s t o F i n a n c i a l S t a t e m e n t s • J u n e 3 0 , 2 0 1 7 a n d 2 0 1 6
e) Special Facility Bonds To provide for the construction and improvement of various facilities at Logan Airport, the Authority has issued eight series of special facilities revenue bonds. The Authority’s special facilities revenue bonds are all special limited obligations of the Authority, and are payable and secured solely from and by certain revenues of a separate trustee. The Authority’s special facilities revenue bonds do not constitute a debt or pledge of the full faith and credit of the Authority, or the Commonwealth of Massachusetts or any subdivision thereof and, accordingly, have not been reflected in the accompanying financial statements. As of June 30, 2017 and 2016, the aggregate principal amount of the Authority’s special facilities revenue bonds outstanding was approximately $529.4 million and $550.7 million, respectively. The Authority has no obligation for $131.4 million of Special Facility Bonds and only limited obligation for the remaining $398.0 million of special facility bonds related to Terminal A described below
Approximately $398.0 million of the Authority’s outstanding special facility bonds as of June 30, 2017 relate to the Delta Airlines Series 2001 A, B, and C bonds issued in connection with Delta Airlines construction of Terminal A. During September 2005, Delta Airlines entered into bankruptcy and as of April 2007 re-emerged out of bankruptcy. The Authority is under no obligation to assume any liability for the Terminal A Special Facility Bonds or to direct revenue, other than an obligation to remit to the trustee of the Terminal A bonds a portion of the Terminal A airline revenue, to service the debt. The Authority and Delta Airlines negotiated a restated and amended lease (the “Amended Lease”) for Terminal A pursuant to which Delta Airlines reduced the number of gates that it occupied in Terminal A. The Amended Lease was approved by the bankruptcy court and was effective as of July 1, 2006 for an initial term of ten years. Effective July 1, 2016, the lease was amended to extend the term with automatic one year extensions until terminated by either party.
f) Commercial Notes Payable The Authority’s commercial notes payable as of June 30, 2017 and 2016 were as follows (in thousands):
In March 2014, the Authority expanded its commercial paper program to $150 million. Commercial notes payable have been issued under the terms of the 1978 Trust Agreement and are backed by the proceeds of the Improvement and Extension Fund or anticipated bond funds. The allowable maximum principal amount outstanding at any time, in the aggregate principal amount, cannot exceed the lesser of 10% of the Authority’s outstanding long-term debt or $150.0 million, and is backed by a Letter of Credit Agreement with the TD Bank N.A. expiring in June 2022.
2017
$109,425 $58,400 $56,390 $58,830
2016
$78,025 $74,233 $72,279 $70,271
Commercial paper notesCommercial paper notes issuedPrincipal paid on commercial paper notesCommercial paper notes
2017
$125,000 $9,000
($25,000)$109,000
2016
$150,000 $44,000
($69,000)$125,000

F I N A N C I A L
83
M A S S A C H U S E T T S P O R T A U T H O R I T Y • N o t e s t o F i n a n c i a l S t a t e m e n t s • J u n e 3 0 , 2 0 1 7 a n d 2 0 1 6
The $100 million of the commercial notes payable as of June 30, 2017 and 2016 have been used to fund PFC eligible projects; therefore the Authority anticipates that PFC revenues will be the source to pay such redemptions. The additional $9.0 million and $25.0 million of commercial paper notes payable outstanding at June 30, 2017 and 2016, respectively, represent general revenue bond anticipation notes. The blended interest rate on Series 2012 A Notes was 1.106% and 0.588% during fiscal years 2017 and 2016, respectively. The blended interest rate on the Series 2012 B Notes was 1.189% and 0.570% during fiscal years 2017 and 2016, respectively. The Authority’s commercial notes payable mature in October and December 2017 and January and February 2018.
During fiscal year 2017 and fiscal year 2016, the Authority did not have any interest rate swaps or other interest rate hedging arrangements.
g) Arbitrage – Rebate LiabilityThe United States Treasury has issued regulations on calculating the rebate due to the United States Government on arbitrage liability and determining compliance with the arbitrage rebate provisions of the Tax Reform Act of 1986. Arbitrage liability arises when the Authority temporarily invests the proceeds of tax exempt debt in securities with higher yields. The Authority has no estimated liability on June 30, 2017 and 2016, respectively.
a) Plan Description The Massachusetts Port Authority Employees’ Retirement System (the Plan) is a single employer plan established on July 18, 1978, effective January 1, 1979, by enactment of Chapter 487 (an amendment to Chapter 32) of the General Laws of The Commonwealth of Massachusetts to provide retirement benefits for substantially all employees of the Massachusetts Port Authority (the Authority), and incidental benefits for their surviving spouses, beneficiaries and contingent annuitants. Prior to this enactment, Authority employees were members of the Commonwealth of Massachusetts Contributory Retirement System and the funding of the pension liability was on a “pay as you go” method. Pursuant to this enactment, the employees’ then present rights and benefits were transferred to the new retirement system. The Plan is a contributory defined benefit plan to which the Authority and its employees contribute such amounts as are necessary to provide assets sufficient to meet benefits to be paid to plan participants. The Plan is administered by the Massachusetts Port Authority Employees’ Retirement System Board (the Board).
6 Pension Plan

84
M A S S A C H U S E T T S P O R T A U T H O R I T Y • N o t e s t o F i n a n c i a l S t a t e m e n t s • J u n e 3 0 , 2 0 1 7 a n d 2 0 1 6
b) Benefits providedBenefits are paid by the Plan from plan assets available for plan benefits. Plan participants are entitled at normal retirement age to benefit payments based upon length of service and earnings levels. Vesting occurs after 10 years of service.
Benefits to participants who retired prior to January 1, 1979 are paid by the Massachusetts State Board of Retirement. The Massachusetts State Board of Retirement is reimbursed for all such benefits paid after December 31, 1978 as these benefits represent obligations of the Plan.
Under Chapter 32, Section 3(8)(c), of the General Laws of The Commonwealth of Massachusetts (Chapter 32), the Plan is reimbursed for benefits paid to participants entitled to receive benefits for previous participation in other Massachusetts Chapter 32 plans. The Plan is also obligated to pay a proportionate share of benefits to participants entitled to receive benefits for subsequent participation in other Massachusetts Chapter 32 plans.
Also under Chapter 32, for members leaving the Authority’s employment to work for other Massachusetts governmental units, the Plan transfers their accumulated account balances and creditable service to the retirement system of the new employer. Other such retirement systems are in turn required to make comparable transfers to the Plan for employees coming to work for the Authority.
Optional payment methods may be elected, including the contingent annuitant method, which provides for reduced payments during the life of the plan participant and continued payments to the participant’s beneficiary after the death of the participant.
At January 1, 2016 and 2015, the Plan’s membership consisted of:
Retirees and beneficiaries receiving benefitsTerminated employees entitled to benefits but not yet receiving them
CURRENT MEMBERS: ActiveInactive
Total Membership
2016
74978
1,245115
2,187
2015
71871
1,19174
2,054

c) Contributions required and contributions madeContributions are made by the Authority based on amounts required to be funded as determined by annual actuarial valuations and are designed to fund the Plan on a level cost basis, as a percentage of pay, over the average remaining working lifetime of the active participants and to fund operating costs of the Plan. For the years ended June 30, 2017 and 2016, the Authority was required and did contribute to the Plan $13.6 million and $10.8 million, respectively. The Authority’s annual contribution is made in July of each fiscal year therefore eliminating any deferred outflows related to the timing of contributions. The Authority bears the risk that plan assets might decline due to fluctuations in the fair value of the Plan’s investments and contributions by the Authority will increase as part of its annual assessment.
Employees who became members prior to January 1, 1975 contribute 5% of their regular compensation through payroll deductions. Employees whose membership commenced on or after January 1, 1975 but prior to January 1, 1984 contribute 7%. Those employees whose membership began on or after January 1, 1984 but prior to July 1, 1996 contribute 8%. Employees hired after July 1, 1996 contribute 9% of their regular compensation. Employees who are hired after December 31, 1978 contribute an additional 2% of regular compensation over $30,000. These contributions accumulate and, subject to certain restrictions set forth in Chapter 32, are refundable to employees upon termination of employment by the Authority or payable to another retirement system should the employee transfer to another government unit covered by Chapter 32 of the General Laws of The Commonwealth of Massachusetts.
Contributions totaling $24.2 million ($13.6 million employer and $10.6 million employee) and $20.8 million ($10.8 million employer and $10.0 million employee) were recognized by the Plan for plan years 2016 and 2015, respectively.
M A S S A C H U S E T T S P O R T A U T H O R I T Y • N o t e s t o F i n a n c i a l S t a t e m e n t s • J u n e 3 0 , 2 0 1 7 a n d 2 0 1 6 F I N A N C I A L
85

86
M A S S A C H U S E T T S P O R T A U T H O R I T Y • N o t e s t o F i n a n c i a l S t a t e m e n t s • J u n e 3 0 , 2 0 1 7 a n d 2 0 1 6
d) Investment valuationInvestments are reported at fair value. Securities traded on a national or international securities exchange are valued at the last reported sales price on the last business day of the plan year; investments traded on a national securities exchange for which no sale was reported on that date and investments in common and preferred stocks traded in over-the-counter markets are valued at the mean of the last reported bid and asked prices, or the last reported bid price. Mutual funds and commingled funds, including real estate and alternative investments, are valued based on net asset or unit value at year end.
e) Pension plan fiduciary net positionDetailed information about the Plan’s fiduciary net position is available in a separately issued report. The report may be obtained by writing to the Massachusetts Port Authority Employees’ Retirement System, One Harborside Drive, Suite 200S, East Boston, MA 02128-2909 or please see the Authority’s website, www.massport.com.
f) Net Pension LiabilityThe components of the net pension liability of the System as of December 31, 2016 and 2015, is as follows:
g) Actuarial AssumptionsThe total pension liability was determined by an actuarial valuation as of January 1, 2016 and update procedures were used to roll forward the total pension liability forward from the valuation date (1/1/16) to the measurement date (12/31/16). The following actuarial assumptions were applied to the periods included in the measurement for 2016 and 2015:
• Inflation – 3.0%• Salary increases – 4.5%• Investment rate of return – 7.25%, net of plan investment expense• Cost–of–living increases – 3.0% on a maximum base of $13,000• Mortality:
- Healthy – RP 2000 Table (sex distinct) projected with Scale BB and Generational Mortality. Post – retirement the RP 2000 healthy annuitant Table (sex distinct) projected with Scale BB Generational Mortality.- Disabled – RP 2000 healthy annuitant Table (sex distinct) and Generational Mortality set – forward 2 years. Mortality for accidental disability is assumed to be 50% from the same cause as the disability.
Total pension liabilityFiduciary net positionPlan’s net pension liability
Fiduciary net position as a percentage of the total pension liability
2016
$651,927,383$563,605,422
$88,321,961
86.5%
2015
$618,536,913 $526,621,766
$91,915,147
85.1%

F I N A N C I A L
87
M A S S A C H U S E T T S P O R T A U T H O R I T Y • N o t e s t o F i n a n c i a l S t a t e m e n t s • J u n e 3 0 , 2 0 1 7 a n d 2 0 1 6
• Long-term Expected Rate of Return: The long-term expected rate of return on plan investments was determined using a building block method
in which best estimate ranges of expected future real rates of return (expected returns, net of pension plan investment expense and inflation) are developed for each major asset class. These ranges are combined to produce the long-term expected rate of return by weighting the expected future real rates of return by the target asset allocation percentage and by adding expected inflation. The best estimates of geometric long-term expected real rates of return for each major asset class are summarized in the following table:
h) Discount RateThe discount rate used to measure the total pension liability as of December 31, 2016 and 2015 was 7.25% and 7.25%, respectively. The projection of cash flows used to determine the discount rate assumed that plan member contributions will be made at the current contribution rate and that employer contributions will be made at rates equal to the difference between actuarially determined contribution rates and the member rate. Based on those assumptions, the Plan’s fiduciary net position was projected to be available to make all projected further benefit payments of current plan members. Therefore, the long term expected rate of return on the plan investments was applied to all periods of projected benefit payments to determine the total pension liability.
LONG-TERMEXPECTED REAL RATE OF RETURN
*amounts are net of inflation assumption of 2.32% **amounts are net of inflation assumption of 2.35%
Asset Class
Domestic equityInternational equityFixed incomeReal estatePrivate equity
2016*
5.10%5.29%2.38%4.90%7.90%
2015**
5.32%5.52%2.33%4.96%8.19%

88
M A S S A C H U S E T T S P O R T A U T H O R I T Y • N o t e s t o F i n a n c i a l S t a t e m e n t s • J u n e 3 0 , 2 0 1 7 a n d 2 0 1 6
Differences between expected and actual experience
Differences arising from the recognition of changes in assumptions
Net difference between projected and actual earnings on pension Plan investments
i) Sensitivity of the net pension liability to changes in the discount rateThe following presents the net pension liability of the Plan as of December 31, 2016 and 2015, calculated using the discount rate of 7.25% for 2016 and 2015, as well as what the net pension liability (asset) would be if it were calculated using a discount rate that is one percentage point lower (6.25% for 2016 and 2015) or one percentage point higher (8.25% for 2016 and 2015) than the current rate (in thousands):
j) Pension expense and deferred outflows of resources and deferred inflows of resources related to pensionsFor the years ended June 30, 2017 and 2016, the Authority recognized pension expense of $19.7 million and $15.6 million, respectively.
At June 30, 2017 and 2016 the Authority reported deferred outflows of resources and deferred inflows of resources related to pensions from the following sources (in thousands):
FISCAL YEAR
2017
1% DECREASE (6.250%)
$166,752
CURRENT DISCOUNT RATE
(7.250%)
$88,322
1% INCREASE(8.250%)
$23,780
FISCAL YEAR
2016
1% DECREASE (6.250%)
$168,310
CURRENT DISCOUNT RATE
(7.250%)
$91,915
1% INCREASE(8.250%)
$31,768
DEFERRED OUTFLOWS
OF RESOURCES
$2,446
$16,217
$18,635
DEFERRED INFLOWS
OF RESOURCES
$0
$0
$0
DEFERRED OUTFLOWS
OF RESOURCES
$290
$20,797
$25,945
DEFERRED INFLOWS
OF RESOURCES
$0
$0
$0
2017 2016

F I N A N C I A L
89
M A S S A C H U S E T T S P O R T A U T H O R I T Y • N o t e s t o F i n a n c i a l S t a t e m e n t s • J u n e 3 0 , 2 0 1 7 a n d 2 0 1 6
Amounts reported as deferred outflows of resources and deferred inflows of resources related to pensions will be recognized in pension expense as follows (in thousands):
a) Plan Description In addition to providing the pension benefits described in Note 6, the Authority provides post employment health care and life insurance benefits (“OPEB”) for retired employees. The benefit levels, employer contributions and future employee contributions are governed by the Authority and can be amended by the Authority. As of June 30, 2016, approximately 864 retirees and 1,336 active and inactive employees meet the eligibility requirements.
In June 2009, the Board made changes to the plan benefits to be paid by the Authority for certain existing and future retirees. All current retired members of the Authority and all existing Authority employees who were vested as of October 1, 2009 would be eligible to have 100% of their premium cost subsidized. Employees not yet vested but employed by the Authority on October 1, 2009 would, upon retirement be eligible to receive 85% of the premium cost for benefits with the balance paid for by the retiree. For employees hired on or after October 1, 2009, the Board voted to implement a sliding scale subsidy for retiree health care premiums (ranging from 0%-85%) based on creditable service at retirement age (retirees must be age 60 or older to receive the subsidy), and whether or not the employee retired within sixty days after leaving the Authority. The Board also voted to eliminate retiree dental and life insurance coverage, as well as Medicare Part B premium subsidy for this group of employees.
In May 2016, the Board made changes to the plan benefits to be paid by the Authority for certain future retirees. Persons who commenced employment with the Authority during the period from October 1, 2009 through May 25, 2016, and who, as of the date such employment commenced, had accrued ten (10) years or more of credit-able service pursuant to M.G.L.c. 32, would upon retirement, be eligible to receive 80% of the premium cost for those benefits with the balance paid for by the retiree; provided, however, that employees who retire with at least thirty (30) years of creditable service would be eligible to receive 85% of the premium cost of such benefits with the balance paid for by the retiree. For purposes of calculating the percentage of the subsidy (80% or 85%), years of creditable service shall be calculated at separation from employment with the Authority. The spouse and dependents of eligible retirees will qualify for the same premium subsidy and retiree health benefits as the retiree. Eligible retirees, but not their spouse or dependents, will also qualify for a 100% subsidy from the Authority for retiree basic life insurance.
7 Other Postemployment Benefits
Year ended June 30:
20182019202020212022
Thereafter
$6,260 $12,620$11,283
$2,620$3,371
$1,144

90
M A S S A C H U S E T T S P O R T A U T H O R I T Y • N o t e s t o F i n a n c i a l S t a t e m e n t s • J u n e 3 0 , 2 0 1 7 a n d 2 0 1 6
The OPEB Plan is a single-employer plan and offers retirees a choice of medical plans, as well as two dental plans, and basic life insurance. The medical plans are either HMOs, PPOs or indemnity plans, and some are designed to work with Medicare benefits, such a Medicare supplement or Medicare HMO plans. The basic life insurance provides a $5,000 death benefit to the retiree. Spouses and dependents are not eligible for this death benefit upon their death. To comply with the requirements of GASB No. 45, the Authority performed an actuarial valu-ation at January 1, 2017. The Authority issues publicly available audited financial statements for the Trust. The report may be obtained by writing to the Massachusetts Port Authority, Attn: John P. Pranckevicius, CPA, Director of Administration and Finance and Secretary-Treasurer, One Harborside Drive, Suite 200S, East Boston, MA 02128-2909. These statements are prepared on the accrual basis of accounting. Employer contributions are recognized when the employer has made formal commitments to provide the contributions and benefits are recorded when due and payable in accordance with the terms of the Trust. Investments are reported at fair value. Mutual funds and commingled funds and alternative investments, are valued based on net asset or unit value at year end. The Trust did not own any individual securities and no long term contracts for contributions to the Trust existed at June 30, 2017 or 2016.
b) Annual OPEB Costs and Net OPEB ObligationThe Authority’s 2017 and 2016 OPEB expense is calculated based on the ARC, an amount actuarially deter-mined in accordance with the parameters of GASB No. 45. The ARC represents a level of funding that, if paid on an ongoing basis, is projected to cover the normal cost each year and amortize the unfunded actuarial liabili-ty over a period of thirty years. The following table shows the components of the Authority’s annual OPEB cost for the years ending June 30, 2017, 2016 and 2015, the amount actually contributed to the plan, and the change in the Authority’s net OPEB obligation based on an actuarial valuation as of January 1, 2017 (in thousands).
During the preparation of the January 1, 2017 OPEB actuarial valuation, it was realized that two corrections to previous actuarial valuations were required. The valuation reports for January 1, 2015 and 2016 incorrectly identified the use of mortality projection scale BB when the actual valuation used mortality projection scale AA. This correction resulted in an understatement of the OPEB expense in fiscal years 2015 and 2016 of approximately $1.43 million per year. Furthermore, the January 1, 2016 valuation omitted approximately 100 spouses of insured retirees and this omission resulted in the OPEB expense being understated by $655.0 thousand. Collectively, these two corrections resulted in $3.5 million of additional expense which has been recorded in the 2017 financial statements.
Annual Required Contribution (ARC)Interest on net OPEB obligationAdjustment to ARCAnnual OPEB cost
SubsidyContributions madeChange in net OPEB obligation
Net OPEB Asset – beginning of yearNet OPEB Asset – end of year% of Annual OPEB cost contributed
2017
$18,084 ($4,054)$3,873
$17,903
$1,540 $14,300
($2,063)
$55,914 $53,851
79.9%
2016
$14,390 ($4,109)$3,812
$14,093
$1,338 $12,000
($755)
$56,669 $55,914
85.1%
2015
$13,187 ($4,156)$3,623
$12,654
$1,905 $12,000
$1,251
$55,418 $56,669
94.8%

F I N A N C I A L
91
c) Funded Status and Funding ProgressThe funded status of the plan, based on an actuarial valuation as of January 1, 2017, was as follows (in thousands):
Rent expense and other operating lease related payments were $16.0 million and $29.6 million for fiscal years 2017 and 2016, respectively.
8 Leases
Actuarially accrued liability (“AAL”)Actuarial value of plan assetsUnfunded actuarial accrued liability (“UAAL”)Funded ratio (actuarial value of plan assets/AAL)Covered payroll (active plan members)UAAL as a percentage of covered payroll
$306,243 $163,496 $142,747
53.4%$119,646
119.3%
Actuarial valuations of an ongoing plan involve estimates of the value of reported amounts and assumptions about the probability of occurrence of events far into the future. Examples include assumptions about future employment, mortality, and the healthcare cost trend. Amounts determined regarding the funded status of the plan and the annual required contributions of the Authority are subject to continual revision as actual results are compared with past expectations and new estimates are made about the future. The schedule of funding prog-ress, presented as required supplementary information following the notes to the financial statements, presents multi year trend information that shows whether the actuarial value of plan assets is increasing or decreasing over time relative to the actuarial accrued liabilities for benefits.
d) Actuarial Methods and AssumptionsProjections of benefits for financial reporting purposes are based on the plan as understood by the Authority and the plan members and include the types of benefits provided at the time of each valuation and the histor-ical pattern of sharing of benefit costs between the Authority and Plan members. The actuarial methods and assumptions used include techniques that are designed to reduce short-term volatility in actuarial accrued liabil-ities and the actuarial value of assets, consistent with the long-term perspective of the calculations. The actuar-ial value of assets on January 1, 2017 was $163.5 million and the actuarial assumptions included a 7.25% investment rate of return (reduced from 7.5% for the January 1, 2016 valuation) and an initial annual health care cost trend rate range of -1.08% to 9.0% which decreases to a long-term trend rate between 5.0% and 6.0% for all health care benefits after ten years. The initial annual dental cost trend rates range from 5.0% to 7.0% which decrease to a long term trend rate between 5.0% and 5.25% for all dental benefits after ten years. The inflation rate is 3.00% per year.
a) CommitmentsThe Authority has commitments under various operating leases, which contain escalation clauses, as lessee. The following is a schedule by years of minimum rental payments under noncancelable operating leases as of June 30, 2017 (in thousands):
YEARS
20182019202020212022
2023 – 20272028 – 20322033 – 2037
AMOUNT
$13,147 $9,990 $5,135 $2,429 $1,217 $4,880 $4,880 $4,880
YEARS
2038 – 20422043 – 20472048 – 20522053 – 20572058 – 20622063 – 20672068 – 2071
Total
AMOUNT
$4,880 $4,880 $4,880 $4,880 $4,880$4,880 $2,603
$78,441
M A S S A C H U S E T T S P O R T A U T H O R I T Y • N o t e s t o F i n a n c i a l S t a t e m e n t s • J u n e 3 0 , 2 0 1 7 a n d 2 0 1 6

92
b) Rental IncomeThe Authority leases a major portion of its Aviation and Port properties to various tenants. Many of these oper-ating leases provide for periodic adjustments to rental rates, including certain provisions for contingent payments based on specified percentages of the tenant’s gross revenue.
The following is a schedule by years of minimum future rental income on noncancelable operating leases as of June 30, 2017 (in thousands):
Rental income and concession income, including contingent payments received under these provisions, were approximately $341.9 million and $309.7 million for the fiscal years 2017 and 2016, respectively.
The Authority, as mandated by the 1978 Trust Agreement, maintains a self insurance account for general liability and workers compensation within the Operating Fund. The self insurance accruals are determined based on in-surance claim history and actuarial estimates needed to pay prior and current-year claims. The accrued liability was approximately $8.1 million and $8.0 million as of June 30, 2017 and 2016, respectively, and is included as a component of accrued expenses in the accompanying financial statements. This liability is fully funded as of June 30, 2017 and 2016.
Changes in the accrued liability accounts, related to self insurance, in fiscal year 2017, 2016 and 2015 were as follows (in thousands):
9 Risk Management
YEARS
20182019202020212022
2023 – 20272028 – 20322033 – 20372038 – 20422043 – 20472048 – 2052
AMOUNT
$103,958 $89,784 $76,936 $71,600 $63,081
$213,639 $116,990 $94,790$93,081 $81,569 $64,617
YEARS
2053 – 20572058 – 20622063 – 20672068 – 20722073 – 20772078 – 20822083 – 20872088 – 20922093 – 20972098 – 21022103 – 2107
Total
AMOUNT
$61,201 $63,903 $66,684 $69,882 $73,269 $76,987 $71,288 $69,576$73,214$12,140
$1,784 $1,709,973
Liability balance, beginning of yearProvision to record estimated lossesPaymentsLiability balance, end of year
2017
$7,986 $3,308
($3,241)$8,053
2016
$7,625 $2,706
($2,345)$7,986
2015
$8,015 $2,955
($3,345) $7,625
As part of its normal operations, the Authority encounters the risk of accidental losses stemming from third party liability claims, property loss or damage, and job related injuries and illnesses. In managing these loss exposures, a combination of risk management measures is applied, including safety and loss prevention programs, emergency planning, contractual risk transfer, self insurance, and insurance.

F I N A N C I A L
93
M A S S A C H U S E T T S P O R T A U T H O R I T Y • N o t e s t o F i n a n c i a l S t a t e m e n t s • J u n e 3 0 , 2 0 1 7 a n d 2 0 1 6
In connection with the self insurance and insurance programs, the Authority retains part of the losses incurred and internally manages the self insured claims. The self insured retention currently includes: $1.0 million for worker’s compensation per job related accident for Massport employees and International Longshoreman’s Asso-ciation Members; $1,000 per occurrence for automobile liability; aviation general liability and airport terrorism insurance; $0.25 million for airside incidents and for non-airside auto losses; $25 thousand for Comprehensive Marine Liability, Terminal Operator’s Liability, Stevedore’s liability; and $0.25 million for property losses per occurrence. Insurance is purchased above the self-insured amounts, subject to availability and the reasonable-ness of cost. Liabilities for self insured claims are reported if it is probable that a loss has been incurred and the amount can be reasonably estimated. These losses include an estimate of claims that have been incurred but not reported at year end and are based on the historical cost of settling similar claims. The Authority records such liabilities as accrued expenses. The Authority from time to time is engaged in various matters of routine litigation. These matters include personal injury and property damage claims for which the Authority’s liability is covered in whole or in part by insurance. The Authority does not expect that these matters will require any amounts to be paid which in the aggregate would materially affect the financial statements.
Settled claims resulting from the risks discussed above have not exceeded the amount of insurance coverage in force in any of the past three fiscal years. Further, insurance maintained in fiscal years 2017 and 2016 has not changed significantly from prior periods.
The Authority’s Enabling Act, the 1978 Trust Agreement and the PILOT Agreements authorize and directs the Authority, subject to certain standards and limitations, to enter into agreements (collectively, the “PILOT Agreements”) to make annual payments in lieu of taxes to the City of Boston and the Town of Winthrop.
The PILOT Agreements provide that annual payments may not exceed the balance of revenues remaining after deposits to pay operating expenses, required deposits to the Interest and Sinking Fund and required deposits to the Maintenance Reserve Fund.
Pursuant to the terms of the amended Boston PILOT Agreement (the “Amended Boston PILOT Agreement”), the term of the Amended Boston PILOT Agreement terminates on June 30, 2022 subject to (1) mutual rights annual-ly to terminate the Amended Boston PILOT Agreement and (2) automatic one year extensions of the term each July 1. In November 2016, the City of Boston notified the Authority of its election to terminate the Boston PILOT Agreement on June 30, 2022, and the parties expect to commence negotiations on a successor agreement or an amendment to the existing agreement. The Amended Boston PILOT Agreement provides for the Authority to pay (i) an annual base amount (the “Base Amount”) of $14.0 million, which, commencing in fiscal year 2007, increases annually by the annual percentage change in the consumer price index, provided that such increase shall be no less than 2% nor greater than 8% per year, (ii) for ten years ending in fiscal year 2016, an amount of $700,000, which shall not be increased or adjusted, and (iii) a community portion (the “Community Portion”).
In fiscal year 2006, the Authority and the Town of Winthrop entered into an Amended and Restated Payment-In-Lieu-Of-Taxes Agreement (the “Amended Winthrop PILOT Agreement”), which extended the base in-lieu-of-tax payments through fiscal year 2025. The Amended Winthrop PILOT Agreement provides for the Authority to make an annual payment of $900,000.
PILOT expenses to the City of Boston for fiscal years 2017 and 2016 were $18.4 million and $18.5 million, respectively. PILOT expenses to the Town of Winthrop for fiscal years 2017 and 2016 were $0.9 million for each year.
10 Payments in Lieu of Taxes

94
M A S S A C H U S E T T S P O R T A U T H O R I T Y • N o t e s t o F i n a n c i a l S t a t e m e n t s • J u n e 3 0 , 2 0 1 7 a n d 2 0 1 6
a) Events of September 11, 2001The Authority has been engaged in routine litigation as well as litigation involving the terrorist attacks of September 11, 2001.
On September 11, 2001, terrorists hijacked American Airlines flight 11 and United Airlines flight 175 and flew them into the World Trade Center in New York, N.Y. The terrorist acts caused the deaths of approximately 3,000 persons, unknown numbers of personal injuries, and massive property damage. Both flights originated at Logan Airport. In September 2001, Congress passed the Air Transportation Safety and System Stabilization Act of 2001 (“ATSSSA”), which provides, among other things, a limitation on liability of various entities, including airport sponsors such as the Authority, for the events of 9/11. Specifically, the liability of an airport sponsor for those events “shall not be in an amount greater than the limits of liability insurance coverage maintained by that airport sponsor”. The Authority has insurance in effect to cover these incidents in the amount of $500.0 million per occurrence and consequently, under ATSA the Authority’s liability, if any, would be limited to such amounts. To the Authority’s knowledge, the Authority’s insurer has received copies of all complaints and Notices of Claim and/or any other form of notification to the Authority by an individual or entity claiming to have suffered a loss.
Furthermore, to the Authority’s knowledge, its insurer has agreed to defend any such claims and has not reserved its rights to deny coverage with respect to any of those claims although the insurer has reserved its rights with respect to (i) the number of occurrences, (ii) indemnification of the Authority against any award of punitive dam-ages, and (iii) the Authority’s rights as a named additional insured under other policies of insurance, including policies of the Authority’s tenants and licensees.
On July 18, 2013, the Authority was dismissed from the remaining property damage lawsuits, both brought by the World Trade Center Properties, LLC, (“WTCP”). WTCP has appealed this ruling. All other wrongful death and property damage lawsuits against the Authority and other defendants have been settled or dismissed.
a) Contractual Obligations for ConstructionThe Authority enters into construction contracts with various construction and engineering companies. Construction contracts outstanding were approximately $304.5 million and $249.5 million as of June 30, 2017 and 2016, respectively.
b) Seaport Bond BillThe Seaport Bond Bill was enacted in 1996 and among other things, provides for funding improvements to the Massachusetts rail transportation network allowing rail shipment of double stack cargo from Allston Yards in Boston to points west, which is anticipated to encourage expanded container shipments through the Port of Boston. The Seaport Bond Bill requires that the Authority provides up to fifty percent (50%) of the cost of improvements to the rail line from Framingham to the Allston Yard in Boston permitting double stack shipments. Expenditure of funds will not occur until the execution of a Master Agreement, as defined by the statute, between the Commonwealth and the participating railroads. The Authority believes that the likelihood that any such Master Agreement will be executed and Authority funds committed for double stack improvements within the next fiscal year is remote.
11 Commitments
12 Litigation

F I N A N C I A L
95
M A S S A C H U S E T T S P O R T A U T H O R I T Y • N o t e s t o F i n a n c i a l S t a t e m e n t s • J u n e 3 0 , 2 0 1 7 a n d 2 0 1 6
These settlements have been achieved without any financial contribution from the Authority or its insurer. WTCP appealed this ruling to the United States Court of Appeals for the Second Circuit, and on September 17, 2015, the Second Circuit vacated the judgment in part and remanded the case to the District Court to recalculate the loss in value of WTCP leasehold interest. On December 1, 2015, the Second Circuit denied WTCP’s petition requesting an en banc hearing, asking for reconsideration of the issues reviewed by the Second Circuit as described above. The case is ongoing in the District Court.
b) Other LitigationOn July 2, 2014, the Authority was served with a lawsuit in which the Authority is the named defendant. The lawsuit arises out of the Authority’s taking by eminent domain on January 6, 2014 of the property commonly referred to as the Logan Express parking and shuttle facility in Braintree, MA (the “Property”) for which the Authority paid what it determined was just compensation. The lawsuit claims that the Authority failed to award just compensation to the former owner Tara Investment Holdings LLC f/k/a The Flatley 06 LLC for the Property.
In September 2016, on the first day of trial, the Authority and the former owner, Tara Investment Holdings LLC f/k/a The Flatley 06 LLC settled the litigation related to the Authority’s taking by eminent domain on January 6, 2014 of the property commonly referred to as the Logan Express parking and shuttle facility in Braintree, MA.
On May 27, 2016, May 18, 2016, March 16, 2016, and March 16, 2014, the Authority and several other co-defendants were named in complaints arising out of an incident on May 31, 2014, which involved seven fatalities when an aircraft attempted, but failed, to take flight from Hanscom Field. All of the cases settled during fiscal year 2017 with no financial contribution from the Authority.
The Authority also is engaged in numerous matters of routine litigation. These matters include personal injury and property damage claims for which the Authority’s liability is covered in whole or in part by insurance. Others include such matters as disputes with contractors, subcontractors, engineers and others arising out of construction and maintenance of the Authority’s properties; disputes over leases and concessions; property, theft and damage claims arising from the Authority’s operations, employment matters and workers compensation, as to which the Authority is self-insured. The Authority does not expect that these matters will require any amounts to be paid which, in the aggregate, will be material to the results of operations.
c) Pollution Remediation ObligationThe Authority is currently involved in six separate pollution remediation obligations that meet the requirements for accounting treatment under GASB Statement No. 49, Accounting and Financial Reporting for Pollution Remediation Obligations (“GASB No. 49”). These obligations are generally related to the removal and/or treatment of contaminated soil, groundwater and petroleum products associated with fuel storage and conveyance. GASB No. 49 dictates that for each obligating event, an estimate of the expected pollution remediation outlays is required to be accrued as a liability and expensed in the current period. Re-measurement of the liability is required when new information indicates increases or decreases in estimated outlays. The estimated liability as of June 30, 2017 and 2016 is $1.2 million and $0.6 million, respectively, which represents the approximate amounts the Authority expects to pay for future remediation activities. The Authority paid approximately $1.1 million and $2.0 million in fiscal years 2017 and 2016, respectively. This estimate was generated using input and guidance from internal management and professional consultants, and represents a wide array of remediation activities ranging from onetime events to longer-term sustained monitoring activity. The Authority will continue to closely monitor each of these obligations, working toward regulatory closure, and will make any necessary adjustments to the potential liability as new information becomes available.
96
M A S S A C H U S E T T S P O R T A U T H O R I T Y • N o t e s t o F i n a n c i a l S t a t e m e n t s • J u n e 3 0 , 2 0 1 7 a n d 2 0 1 6
a) Investment in Joint VentureIn May 1996, the Authority entered into an interagency agreement with the Massachusetts Highway Department (“MHD”) and Massachusetts Bay Transportation Authority (“MBTA”) for the construction of a Regional Transpor-tation Center (“RTC”) in Woburn, Massachusetts (“Interagency Agreement”). Under the terms of the Interagency Agreement, the Authority has paid one third of the costs of acquiring the site and constructing the RTC, and will share in a like proportion in the profits and losses of the RTC. During fiscal years 2017 and 2016, the Authority recognized income of approximately $0.2 million, respectively, representing its share of the earnings of the RTC.
b) Logan Airport Silver Line Transportation AgreementIn December 2005, the Authority entered into a ten year agreement with the MBTA to provide public transpor-tation between South Station in Boston, Massachusetts and Logan Airport along a route called the Silver Line. Pursuant to this agreement, the Authority purchased eight buses at a cost of $13.3 million and the MBTA agreed to operate and maintain the Authority’s Silver Line buses for a cost of $2.0 million per year, paid in equal monthly installments. In August 2015, this agreement was extended for an additional five year period and modified to provide that the Authority would be responsible for paying the FAA approved rate of 76.06% of the costs to operate and maintain the Silver Line buses and the Authority will be responsible for 76.06% of the future rebuild of the Silver Line buses. During fiscal year 2017, the estimated costs to operate and maintain the Silver Line buses was increased to $3.0 million and the Authority also incurred expenses of $2.5 million to rebuild four Silver Line Buses.
a) Bond issueOn July 20, 2017, the Authority issued $169.5 million of Massachusetts Port Authority Revenue Bonds. The Series 2017 A Revenue Bonds were issued in the principal amount of $169.5 million with an original issue premium of approximately $27.2 million and an interest rate of 5.0%. The 2017 A Bonds were issued, in part, to refund a portion of the currently outstanding Series 2007 C Revenue Refunding Bonds and all of the currently outstanding variable rate Series 2010 D Multi-Modal Revenue Refunding Bonds and resulted in a net present value savings of $3.2 million.
Additionally, the Authority expects to use approximately $91.0 million of the proceeds of the 2017 A Bonds to finance a portion of the Authority’s FY18-22 Capital Program. Due to the “private activity” nature of the construction projects, these bonds were sold as AMT bonds.
b) Maturity of PFC BondsOn July 3, 2017, the Authority paid the final maturities outstanding of $52.9 million related to the Series 2007 A and Series 2007 D PFC Bonds issued under the PFC Trust Agreement.
13 Interagency Agreement
14 Subsequent Events

F I N A N C I A L
97
1/1/20171/1/20161/1/20151/1/20131/1/2011
6/30/20097/01/2006
$163,496 $149,845 $148,501 $105,622 $76,693 $48,931
$0
$306,243 $253,339 $237,133 $224,488 $237,462 $219,619 $167,521
$142,747 $103,494
$88,632 $118,866 $160,768 $170,688 $167,521
53.4% 59.1% 62.6% 47.1% 32.3% 22.3%
-
$119,646 $116,263 $108,508
$95,400 $95,400 $95,749 $87,630
119.3% 89.0% 81.7%
124.6% 168.6% 178.3% 191.2%
(1) ACTUARIAL VALUATION
DATE
(2)ACTUARIALVALUE OF
PLAN ASSETS
(3)ACTUARIALACCRUEDLIABILITY
(AAL)
(4)(OVERFUNDED)
UNFUNDED(UAAL)
AAL(2) – (3)
(5)ACTUARIALVALUE OF
ASSETS AS APERCENTAGE OF
AAL (FUNDEDRATIO) (2)/(3)
(6)ANNUALCOVEREDPAYROLL
(7)(UAAL)
AAL AS APERCENTAGEOF COVERED
PAYROLL(4)/(6)
REQUIRED SUPPLEMENTARY INFORMATION SCHEDULE OF OPEB FUNDING PROGRESS, JUNE 30,2017
(In Thousands)
Analysis of the dollar amounts of net assets available for benefits, Actuarial Accrued Liability (AAL), and assets in excess of AAL in isolation can be misleading. Expressing the Actuarial Value of Assets available for benefits as a percentage of the AAL provides one indication of the Plan’s funding status on a going-concern basis. Analysis of this percentage over time indicates whether the Plan is AAL and annual covered payroll are both affected by inflation. Expressing the AAL in excess of assets as a percentage of annual covered payroll approximately adjusts for the effects of inflation and aids analysis of progress made in accumulating sufficient assets to pay benefits when due. Generally, the lower this percentage, the stronger the Plan.
The comparability of trend information is affected by changes in actuarial assumptions, benefit provisions, actuarial funding methods, accounting policies, the size or composition of the population covered by the Plan, and other changes. Those changes usually affect trends in contribution requirements and in ratios that use the AAL as a factor.

98
M A S S A C H U S E T T S P O R T A U T H O R I T Y • N o t e s t o F i n a n c i a l S t a t e m e n t s • J u n e 3 0 , 2 0 1 7 a n d 2 0 1 6
Actuarially determined contribution
Actual contribution in relation to the actuarially determined contribution
Contribution deficiency (excess)
Covered employee payroll
Contributions as a percentage of covered employee payroll
2017 $13,552
$13,552
$0
$106,444
12.7%
2016 $10,845
$10,845
$0
$99,190
10.9%
2015 $11,146
$11,146
$0
$94,340
11.8%
2014 $11,960
$ 11,960
$0
$90,042
13.3%
2013 $9,594
$9,594
$0
$87,476
11.0%
2012 $5,710
$5,710
$0
$85,941
6.6%
2011 $4,924
$4,924
$0
$89,950
5.5%
2010 $7,621
$7,621
$0
$89,704
8.5%
2009 $401
$401
$0
$85,120
0.5%
2008 $1,006
$1,006
$0
$79,075
1.3%
Notes to ScheduleValuation date:
Methods and assumptions used to determine contribution rates:Actuarial cost methodAmortization methodRemaining amortization periodAsset valuation method
Inflation rateSalary increasesInvestment rate of return
Retirement age
Disability and withdrawal mortality
Other information
Actuarially determined contribution rates are calculated annually as of January 1, 18 months prior to the end of the fiscal year in which the contributions are reported. Contributions are made on July 1, of each year.
Frozen entry age 20 Level dollar, closedMultiple bases with remaining periods from 8 to 20 yearsBeginning in 2008, fair value of assets using a five year smoothing period. Prior to 2008, used four year asset smoothing period. 3.0% 2013 valuation: 4.5%; 2009 valuation: 4.75%; prior to 2009: 5.00%2016 valuation 7.25%; 2015 valuation: 7.5%; 2012 valuation: 7.625%; 2010 valuation: 7.5%; 2009 valuation: 8.0%; prior to 2009: 7.75% In the 2013 valuation, additional retirement assumptions were added for employees hired after April 1, 2012 and subject to pension reform and the assumption was changed due to an experience study. In the 2008 valuation the retirement assumption was extended to age 70 for Group 1 employees.
Changed in the 2013 valuation due to an experience study. In the 2013 valuation, mortality was changed to RP2000 projected generationally with scale BB.In the 2012 valuation, mortality was changed to RP2000 projected 22 years using scale AA. In the 2009, 2010 and 2011 valuations mortality was changed to RP2000 projected nine, ten and eleven years, respectively, using scale AA.
As of January 1, 2016, employees hired after September 30, 2009 and not eligible for post-retirement medical insurance until age 60, retirement age begins at age 60 with 10 years of service.
As of January 1, 2013, the mortality assumption was changed to the RP2000 Generational Table and the retirement, disability and withdrawal assumptions were changed based on an experience study. As of January 1, 2012, the mortality assumption was changed to the RP2000 Table projected forward 22 years with Scale AA, interest rate changed to 7.625% (from 7.75%) and salary rate to 4.50% (from 4.75%). Vacation buyback factor was increased from 1.00% to 1.25%.
As of January 1, 2011, the mortality assumption was changed to the RP2000 Table projected forward 11 years with Scale AA. As of January 1, 2010, the mortality assumption was changed to the RP2000 Table projected forward 10 years with Scale AA, interest rate was changed to 7.75% (from 8.00%). As of January 1, 2009, the mortality assumption was changed to the RP2000 Table projected forward 9 years with Scale AA, interest rate was changed to 8.00% (from 7.75%), salary rate was changed to 4.75% (from 5.00%), contribution timing was changed to the beginning of the fiscal year from monthly. As of January 1, 2008, the retirement age assumption was extended to age 70 for Group 1 employees, disabled mortality changed to a 2 year set forward and the asset valuation method was changed to a 5 year smoothing.
REQUIRED SUPPLEMENTARY INFORMATION SCHEDULE OF PENSION CONTRIBUT IONS
JUNE 30, 2017(In Thousands)

99
F I N A N C I A L
$15,920 $44,961
$0
$2,592 ($1,479)
($28,604)
$33,390
$618,537 $651,927
$13,552 $10,660 $42,565
($28,604) ($1,189)
$36,984
$526,622
$563,606
$88,321
86.5%
$106,444
83.0%
2017
$14,875 $41,160
$0
($1,395) $24,098
($26,106)
$52,632
$565,905 $ 618,537
$10,845 $ 9,948
($4,572) ($26,106)
($1,189)
($11,074)
$537,696
$526,622
$91,915
85.1%
$99,190
92.7%
2016
$13,056 $40,956
$0
$1,929 $0
($24,357)
$31,584
$534,321 $565,905
$11,146 $9,628
$32,062 ($24,357) ($1,417)
$27,062
$510,634
$537,696
$28,209
95.0%
$94,340
29.9%
2015
REQUIRED SUPPLEMENTARY INFORMATION SCHEDULE OF CHANGES IN THE NET PENSION L IAB I L I TY AND RELATED RAT IOS
JUNE 30, 2017(In Thousands)
TOTAL PENSION LIABILITYService costInterestChange of benefit termsDifferences between expected and actual experienceChange of assumptionsBenefit payments, including refunds of employee contributions
Net change in total pension liability
Total pension liability - beginningTotal pension liability - ending
PLAN FIDUCIARY NET POSITIONContributions - employerContributions - employeeNet Investment IncomeBenefit payments, including refunds of employee contributionsAdministrative expense
Net change in plan fiduciary net position
Plan fiduciary net position - beginning
Plan fiduciary net position - end
Massport net pension liability - ending
Plan fiduciary net position as a percentage of the total pension liability
Covered-employee payroll
Massport’s net pension liability as a percentage of covered employee payroll

100 See accompanying independent auditors’ report.
COMBINING SCHEDULE OF NET POSIT IONYEAR ENDED JUNE 30, 2017
(In Thousands)
AUTHORITYOPERATIONS
PFC PROGRAM
CFC PROGRAM
COMBINED TOTALS
$82,095 $132,021 $190,914 $317,441
$67,630
$5,811 $73,441
$7,964 $803,876
$152,661 $259,040
$5,637 $2,843
$53,850 $380,323
$2,762,170 $3,616,524
$4,420,400
$17,983 $2,446
$16,217 $18,635 $55,281
$133,949 $1,400 $8,729
$123,000 $109,000
$39,015 $15,939
$431,032
$14,621 $17,908 $88,322
$1,236 $1,727,665
$13,374 $1,863,126 $2,294,158
$6,809 $6,809
$1,290,338
$209,333 $196,738 $102,914
$48,550 $28,101
$585,636 $298,740
$2,174,714
$0 $0
$16,303 $17,901
$3,175 $0
$3,175 $57
$37,436
$0 $40,238 $1,087
$0$0 $0
$264,807 $306,132 $343,568
$0$0 $0$0 $0
$8 $0$0
$3,569 $0
$5,731 $0
$9,308
$503 $0$0 $0
$193,411 $0
$193,914 $203,222
$0$0
$91,796
$0 $0$0
$48,550 $0
$48,550 $0
$140,346
$0 $0
$60,952 $21,283
$11,749 $0
$11,749 $0
$93,984
$0$10,220
$0$0 $0
$12 $374,201 $384,433 $478,417
$0$0 $0$0 $0
$0$0 $0
$52,910 $0
$1,290 $0
$54,200
$0$0 $0$0$0 $0$0
$54,200
$0$0
$321,303
$0$0
$102,914 $0$0
$102,914 $0
$424,217
$82,095 $132,021 $113,659 $278,257
$52,706 $5,811
$58,517 $7,907
$672,456
$152,661 $208,582
$4,550 $2,843
$53,850 $380,311
$2,123,162 $2,925,959 $3,598,415
$17,983 $2,446
$16,217 $18,635 $55,281
$133,941 $1,400 $8,729
$66,521 $109,000 $31,994 $15,939
$367,524
$14,118 $17,908 $88,322 $1,236
$1,534,254 $13,374
$1,669,212 $2,036,736
$6,809 $6,809
$877,239
$209,333 $196,738
$0 $0
$28,101 $434,172 $298,740
$1,610,151
CURRENT ASSETS: Cash and cash equivalents Investments Restricted cash and cash equivalents Restricted investments Accounts receivable Trade, net Grants Total receivables (net) Prepaid expenses and other assets Total current assetsNONCURRENT ASSETS: Investments Restricted investments Prepaid expenses and other assets Investment in joint venture Net OPEB asset Capital assets-not being depreciated Capital assets-being depreciated-net Total noncurrent assets Total assets
DEFERRED OUTFLOWS OF RESOURCES Deferred loss on refunding of bonds Deferred loss on expected vs actual Plan experience Deferred loss on Pension Plan Change of Assumptions Deferred loss on Pension Plan Investments Total deferred outflows of resources CURRENT LIABILITIES: Accounts payable and accrued expenses Compensated absences Contract retainage Current portion of long term debt Commercial notes payable Accrued interest on bonds payable Unearned revenues Total current liabilities
NONCURRENT LIABILITIES: Accrued expenses Compensated absences Net pension liability Contract retainage Long-term debt, net Unearned revenues Total noncurrent liabilities Total liabilities DEFERRED INFLOWS OF RESOURCES Deferred gain on refunding of bonds Total deferred inflows of resources Net investment in capital assets Restricted Bond funds Project funds Passenger facility charges Customer facility charges Other purposes Total restricted Unrestricted Total net position
Schedule I

101
F I N A N C I A L
COMBINING SCHEDULE OF REVENUES, EXPENSES, AND CHANGES IN NET POSIT ION
YEAR ENDED JUNE 30, 2017(In Thousands)
OPERATING REVENUES:Aviation rentalsAviation parkingAviation shuttle busAviation feesAviation concessionsAviation operating grants and otherMaritime fees, rentals and otherReal estate fees, rents and other
Total operating revenues
OPERATING EXPENSES:Aviation operations and maintenanceMaritime operations and maintenanceReal estate operations and maintenanceGeneral and administrative Payments in lieu of taxesPension and other post-employment benefits Other
Total operating expenses before depreciation and amortization
Depreciation and amortizationTotal operating expenses Operating income (loss)
NONOPERATING REVENUES AND (EXPENSES):Passenger facility chargesCustomer facility chargesInvestment incomeNet (decrease)/increase in the fair value of investmentsOther revenuesSettlement of claimsTerminal A debt service contributionOther expensesGain on sale of equipmentInterest expense
Total nonoperating (expense) revenue, net
Increase in net position before capital contributions
Capital contributionsIncrease in net position
Net position, beginning of year
Net position, end of year
AUTHORITYOPERATIONS
PFC PROGRAM
CFC PROGRAM
COMBINED TOTALS
$217,906 $169,354
$19,278 $145,418
$98,913 $2,909
$82,088 $25,037
$760,903
$274,506 $59,629 $13,215 $59,142 $19,276 $37,603
$9,631
$473,002
$252,846 $725,848
$35,055
$76,296 $33,055 $13,093 ($4,501) $4,062
$248 ($11,941)
($198) $125
($67,157) $43,082
$78,137
$12,635 $90,772
$2,083,942
$2,174,714
$0$0$0$0$0$0$0$0$0
$0$0$0$0$0$0$0
$0
$14,183 $14,183
($14,183)
$0$33,055
$774 ($404)
$93 $0$0
($198) $0
($11,569) $21,751
$7,568
$0$7,568
$132,778
$140,346
$0$0$0$0$0$0$0$0$0
$0$0$0$0$0$0$0
$0
$43,768 $43,768
($43,768)
$76,296 $0
$1,226 ($92)
$0$0
($11,941) $0$0
(4,118) $61,371
$17,603
$0$17,603
$406,614
$424,217
$217,906 $169,354
$19,278 $145,418
$98,913 $2,909
$82,088 $25,037
$760,903
$274,506 $59,629 $13,215 $59,142 $19,276 $37,603 $9,631
$473,002
$194,895 $667,897
$93,006
$0$0
$11,093 ($4,005) $3,969
$248 $0$0
$125 ($51,470)
($40,040)
$52,966
$12,635 $65,601
$1,544,550
$1,610,151
See accompanying independent auditors’ report.
Schedule II

102
COMBINING SCHEDULE OF NET POSIT IONYEAR ENDED JUNE 30, 2016
(In Thousands)
AUTHORITYOPERATIONS
PFC PROGRAM
CFC PROGRAM
COMBINED TOTALS
$63,497 $82,062
$186,966 $210,006
$60,289 $21,874 $82,163
$7,624 $632,318
$138,482 $293,320
$6,357 $2,595
$55,914 452,427
$2,634,470 $3,583,565 $4,215,883
$17,868 $290
$20,797 $25,945 $64,900
$149,089 $1,416
$10,843 $90,402
$125,000 $36,093
$9,423 $422,266
$9,756 $18,119 $91,915
$3,483 $1,634,073
$9,141 $1,766,487 $2,188,753
$8,088 $8,088
$1,310,922
$202,619 $186,303 $83,252 $30,051 $27,391
$529,616 $243,404
$2,083,942
$0 $0
$18,264 $4,959
$3,285 $0
$3,285 $57
$26,565
$0$32,871 $1,144
$0$0
$18 $278,989 $313,022 $339,587
$0$0$0$0$0
$49 $0
$0$3,434
$0$5,792
$0$9,275
$553 $0$0$0
$196,981 $0
$197,534 $206,809
$0$0
$102,727
$0$0$0
$30,051 $0
$30,051 $0
$132,778
$0 $0
$43,375 $24,737
$7,492 $0
$7,492 $98
$75,702
$0$9,415
$0 $0$0$0
$398,848 $408,263
$483,965
$314 $0
$0 $0
$314
$0$0$0
$22,889 $0
$1,866 $0
$24,755
$0$0$0$0
$52,910 $0
$52,910 $77,665
$0$0
$323,362
$0$0
$83,252 $0$0
$83,252 $0
$406,614
$63,497 $82,062
$125,327 $180,310
$49,512 $21,874 $71,386 $7,469
$530,051
$138,482 $251,034
$5,213 $2,595
$55,914 $452,409
$1,956,633 $2,862,280 $3,392,331
$17,554 $290
$20,797 $25,945 $64,586
$149,040 $1,416
$10,843 $64,079
$125,000 $28,435 $9,423
$388,236
$9,203 $18,119 $91,915 $3,483
$1,384,182 $9,141
$1,516,043 $1,904,279
$8,088 $8,088
$884,833
$202,619 $186,303
$0$0
$27,391 $416,313 $243,404
$1,544,550
See accompanying independent auditors’ report.
CURRENT ASSETS: Cash and cash equivalents Investments Restricted cash and cash equivalents Restricted investments Accounts receivable Trade, net Grants Total receivables (net) Prepaid expenses and other assets Total current assetsNONCURRENT ASSETS: Investments Restricted investments Prepaid expenses and other assets Investment in joint venture Net OPEB asset Capital assets-not being depreciated Capital assets-being depreciated-net Total noncurrent assets Total assets
DEFERRED OUTFLOWS OF RESOURCES Deferred loss on refunding of bonds Deferred loss on expected vs actual Plan experience Deferred loss on Pension Plan Change of Assumptions Deferred loss on Pension Plan Investments Total deferred outflows of resources CURRENT LIABILITIES: Accounts payable and accrued expenses Compensated absences Contract retainage Current portion of long-term debt Commercial notes payable Accrued interest on bonds payable Unearned revenues Total current liabilities
NONCURRENT LIABILITIES: Accrued expenses Compensated absences Net pension liability Contract retainage Long-term debt, net Unearned revenues Total noncurrent liabilities Total liabilities DEFERRED INFLOWS OF RESOURCES Deferred gain on refunding of bonds Total deferred inflows of resources Net investment in capital assets Restricted Bond funds Project funds Passenger facility charges Customer facility charges Other purposes Total restricted Unrestricted Total net position
Schedule III
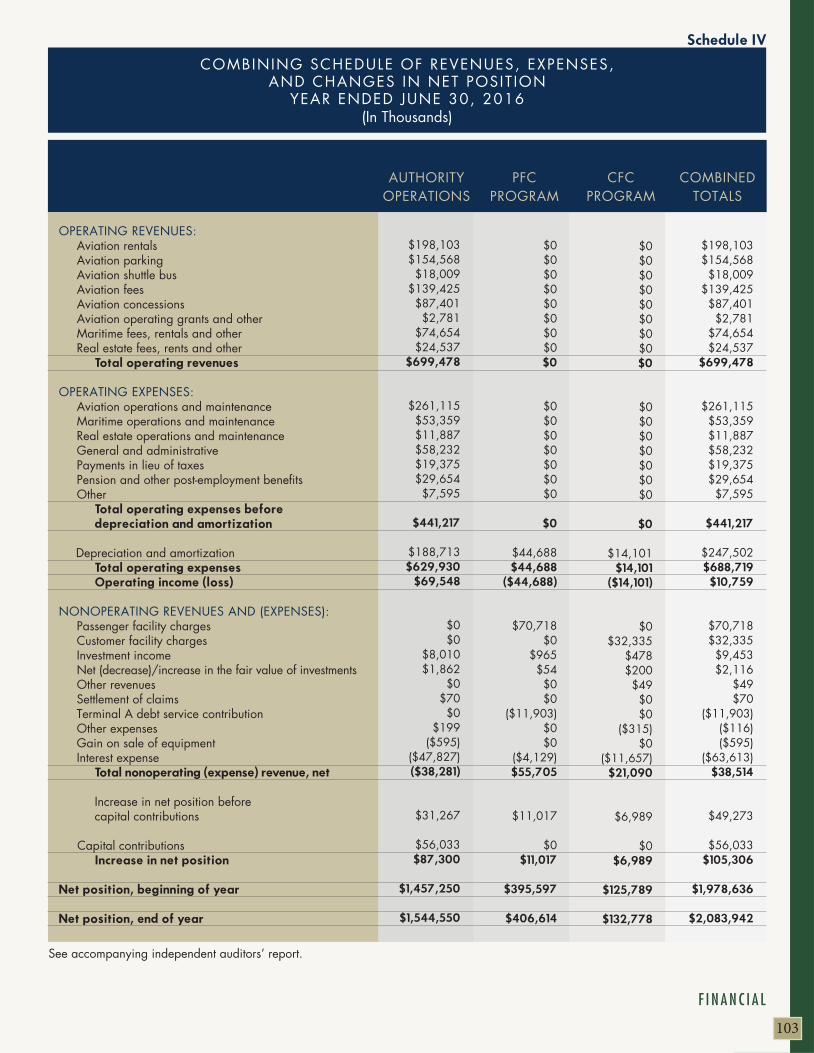
103
F I N A N C I A L
COMBINING SCHEDULE OF REVENUES, EXPENSES, AND CHANGES IN NET POSIT ION
YEAR ENDED JUNE 30, 2016(In Thousands)
OPERATING REVENUES:Aviation rentalsAviation parkingAviation shuttle busAviation feesAviation concessionsAviation operating grants and otherMaritime fees, rentals and otherReal estate fees, rents and other
Total operating revenues
OPERATING EXPENSES:Aviation operations and maintenanceMaritime operations and maintenanceReal estate operations and maintenanceGeneral and administrative Payments in lieu of taxesPension and other post-employment benefits Other
Total operating expenses before depreciation and amortization
Depreciation and amortizationTotal operating expenses Operating income (loss)
NONOPERATING REVENUES AND (EXPENSES):Passenger facility chargesCustomer facility chargesInvestment incomeNet (decrease)/increase in the fair value of investmentsOther revenuesSettlement of claimsTerminal A debt service contributionOther expensesGain on sale of equipmentInterest expense
Total nonoperating (expense) revenue, net
Increase in net position before capital contributions
Capital contributionsIncrease in net position
Net position, beginning of year
Net position, end of year
AUTHORITYOPERATIONS
PFC PROGRAM
CFCPROGRAM
COMBINED TOTALS
$198,103 $154,568
$18,009 $139,425
$87,401 $2,781
$74,654 $24,537
$699,478
$261,115 $53,359 $11,887 $58,232 $19,375 $29,654
$7,595
$441,217
$247,502 $688,719
$10,759
$70,718 $32,335
$9,453 $2,116
$49 $70
($11,903) ($116) ($595)
($63,613) $38,514
$49,273
$56,033 $105,306
$1,978,636
$2,083,942
$0$0$0$0$0$0$0$0$0
$0$0$0$0$0$0$0
$0
$14,101 $14,101
($14,101)
$0$32,335
$478 $200 $49 $0$0
($315) $0
($11,657) $21,090
$6,989
$0$6,989
$125,789
$132,778
$0$0$0$0$0$0$0$0$0
$0$0$0$0$0$0$0
$0
$44,688 $44,688
($44,688)
$70,718 $0
$965 $54 $0$0
($11,903) $0$0
($4,129) $55,705
$11,017
$0$11,017
$395,597
$406,614
$198,103 $154,568 $18,009
$139,425 $87,401 $2,781
$74,654 $24,537
$699,478
$261,115 $53,359 $11,887 $58,232 $19,375 $29,654 $7,595
$441,217
$188,713 $629,930
$69,548
$0$0
$8,010 $1,862
$0$70 $0
$199 ($595)
($47,827) ($38,281)
$31,267
$56,033 $87,300
$1,457,250
$1,544,550
See accompanying independent auditors’ report.
Schedule IV


The 37.5 million passengers served at Logan International Airport during fiscal year
2017 was another record year and represented a 7.4% increase versus the prior
year. Conley Terminal had another record-breaking year for container shipping
in fiscal year 2017, transporting nearly 257,000 TEUs (container volume metric),
including calls by high-volume vessels such as the MSC Adelaide. Flynn Cruiseport
Boston also broke records in 2017 for both passengers (388,222) and ship calls
(150) during the April to November cruise season.
StatisticalA v i a t i o n a n d M a r i t i m e R e c o r d s


S TAT I S T I C A L
107
This part of the Massachusetts Port Author i ty’s Comprehensive Annual F inanc ia l Report presents detai led informat ion as a context for understanding what the informat ion in the f inanc ia l statements, note d isc losures and required supplementary informat ion says about the Author i ty’s overal l f inanc ia l health and performance.
Financial Trends:These schedules present trend information on how the Authority’s financial position changed over time. S-1 Revenues, Expenses and Changes in Net Position S-4 Conversion of GAAP Revenues and Expenses to the 1978 Trust Agreement Revenues and ExpensesS-5 Calculation of Net Revenues Pledged Under the 1978 Trust AgreementS-6 Calculation of Total PFC Revenue Pledged Under the PFC Trust Agreement and Calculation of Total CFC Revenue Pledged Under the CFC Trust Agreement
Revenue Capacity: These schedules present trend information on the Authority’s most significant revenue sources. S-2 Most Significant Revenues and Related Rates and Charges S-3 Historical Principal Operating Revenue Payers Debt Capacity: These schedules present information on the Authority’s current levels of outstanding debt and its ability to support existing or issue additional debt. S-7 Calculation of Debt Service Coverage Under the 1978 Trust Agreement, the PFC Trust Agreement and the CFC Trust Agreement S-8 Debt Metrics Under the 1978 Trust Agreement, the PFC Trust Agreement and the CFC Trust Agreement Demographic and Economic Information: These schedules provide demographic and economic indicators to help the reader understand the environment within the Authority’s financial activities take place. S-9 Largest Private Sector Employers S-10 Demographics and Employment Data Operations and Other Information: These schedules provide operating data to help the reader understand how the information in the Authority’s financial report relates to the services it provides and the activities it performs. S-11 Number of Employees by Facility S-18 Insurance Coverage S-19 Physical Asset Data Other Information: S-12 Logan International Airport Traffic Metrics S-13 Logan International Airport Market Share of Total Passenger Traffic S-14 Logan International Airport Passenger Market S-15 Port of Boston Cargo and Passenger Activity S-16 Port of Boston Principal Customers S-17 Tobin Memorial Bridge
S t a t i s t i c a l S e c t i o n

108
2017 2016 2015 2014 2013
(1) PFC accrued revenue exclusive of PFC interest earnings.(2) CFC accrued revenue exclusive of CFC interest earnings.(3) Effective 1/1/2010, Tobin Bridge was transferred to the MassDOT pursuant to the Transportation Reform Act.(4) The Authority revised the Net Position at July 1, 2010 in the amount of $10.8 million to correct an understatement of certain revenue related to fiscal years 2007 through 2010.(5) In accordance with the requirements of GASB No.65, the Authority’s Net position was restated as for fiscal years 2011 and 2012 to reflect the required adjustments. (6) In accordance with the requirements of GASB No.68, the Authority’s Net position and Pension expense were restated for fiscal year 2014 to reflect the required adjustments.
Source: Authority’s audited financial statements.
OPERATING REVENUES Aviation rentals Aviation parking Aviation shuttle bus Aviation fees Aviation concessions Aviation operating grants and other Maritime fees, rentals and other Real estate fees, rents and other Bridge (3) Total operating revenues OPERATING EXPENSES Aviation operations and maintenance Maritime operations and maintenance Real estate operations and maintenance Bridge operations and maintenance (3) General and administrative Payments in lieu of taxes Pension and other post-employment benefits Other Total operating expenses before depreciation and amortization Depreciation and amortization Total operating expensesOperating income NONOPERATING REVENUES AND (EXPENSES) Passenger facility charges (1) Customer facility charges (2) Investment income Net increase / (decrease) in the fair value of investments Other revenues Gain / (loss) on sales of assets Settlement of claims Terminal A debt service contributions (PFC) Other expense Interest expenseTotal nonoperating (expense) revenue, net Increase in net position before capital contributions
Capital contributions Tobin Bridge transfer
Increase in net positionNet position, beginning of year Net position, end of year TOTAL NET POSITION COMPOSED OF:
Invested in capital assets, net of debt Restricted Unrestricted
Total Net Position
$217,906 $169,354 $19,278
$145,418 $98,913 $2,909
$82,088 $25,037
$0$760,903
$274,506 $59,629$13,215
$0 $59,142 $19,276$37,603 $9,631
$473,002
$252,846 $725,848
$35,055
$76,296 $33,055$13,093 ($4,501) $4,062 $125 $248
($11,941) ($198)
($67,157) $43,082
$78,137
$12,635 $0
$90,772$2,083,942$2,174,714
$1,290,338$585,636$298,740
$2,174,714
$198,103$154,568$18,009
$139,425 $87,401$2,781
$74,654$24,537
$0$699,478
$261,115 $53,359 $11,887
$0$58,232$19,375$29,654 $7,595
$441,217
$247,502 $688,719
$10,759
$70,718$32,335$9,453$2,116
$49($595)
$70($11,903)
($116)($63,613)
$38,514
$49,273
$56,033 $0
$105,306$1,978,636
$2,083,942
$1,310,922 $529,616$243,404
$2,083,942
$185,953$149,155$15,717
$135,044$82,662$3,894
$68,435$22,069
$0$662,929
$256,519 $54,231 $10,428
$0 $59,064 $19,282$14,844 $8,005
$422,373
$227,158 $649,531
$13,398
$65,807 $30,768 $7,405
$527 $10,091
$180$0
($10,918)($956)
($64,829)$38,075
$51,473
$55,953$0
$107,426 $1,871,210
$1,978,636
$1,272,271 $516,906 $189,459
$1,978,636
$165,107 $132,170
$8,443 $114,360
$72,504 $2,547 $56,393 $20,299
$0$571,823
$217,792 $46,433
$8,825 $0
$48,511 $18,090 $23,064
$7,667 $370,382
$199,046 $569,428
$2,395
$60,105 $29,354
$8,336 ($2,821)
$187 ($64) $567
($12,114) ($1,279)
($61,071) $21,200
$23,595
$20,234 $0
$43,829 $1,784,732 $1,828,561
$1,131,577 $515,458 $181,526
$1,828,561
M A S S AC H U S E T T S P O RT A U T H O R I T Y
Revenues, Expenses and Changes in Net Position Years Ended June 30,2008 through June 30,2017 (In Thousands)
S-1 Changes in Net Position
$181,007 $136,733$12,283
$124,718$77,838$3,763
$62,148$23,981
$0$622,471
$237,235 $49,974 $9,477
$0$53,809 $18,444 $16,814 $9,454
$395,207
$217,767 $612,974
$9,497
$62,682 $29,963 $6,642$1,976
$10,547 $90
$1,792 ($11,839) ($1,407)
($64,973)$35,473
$44,970
$56,124 $0
$101,094 $1,770,116 $1,871,210
$1,227,358 $509,520 $134,332 $1,871,210
(6)
(6)
(6)

109
2017 2016 2015 2014 2013
(1) PFC accrued revenue exclusive of PFC interest earnings.(2) CFC accrued revenue exclusive of CFC interest earnings.(3) Effective 1/1/2010, Tobin Bridge was transferred to the MassDOT pursuant to the Transportation Reform Act.(4) The Authority revised the Net Position at July 1, 2010 in the amount of $10.8 million to correct an understatement of certain revenue related to fiscal years 2007 through 2010.(5) In accordance with the requirements of GASB No.65, the Authority’s Net position was restated as for fiscal years 2011 and 2012 to reflect the required adjustments. (6) In accordance with the requirements of GASB No.68, the Authority’s Net position and Pension expense were restated for fiscal year 2014 to reflect the required adjustments.
Source: Authority’s audited financial statements.
OPERATING REVENUES Aviation rentals Aviation parking Aviation shuttle bus Aviation fees Aviation concessions Aviation operating grants and other Maritime fees, rentals and other Real estate fees, rents and other Bridge (3) Total operating revenues OPERATING EXPENSES Aviation operations and maintenance Maritime operations and maintenance Real estate operations and maintenance Bridge operations and maintenance (3) General and administrative Payments in lieu of taxes Pension and other post-employment benefits Other Total operating expenses before depreciation and amortization Depreciation and amortization Total operating expensesOperating income NONOPERATING REVENUES AND (EXPENSES) Passenger facility charges (1) Customer facility charges (2) Investment income Net increase / (decrease) in the fair value of investments Other revenues Gain / (loss) on sales of assets Settlement of claims Terminal A debt service contributions (PFC) Other expense Interest expenseTotal nonoperating (expense) revenue, net Increase in net position before capital contributions
Capital contributions Tobin Bridge transfer
Increase in net positionNet position, beginning of year Net position, end of year TOTAL NET POSITION COMPOSED OF:
Invested in capital assets, net of debt Restricted Unrestricted
Total Net Position
$160,433 $126,177
$9,790 $117,541
$68,205 $2,332
$55,168 $18,808
$0$558,454
$211,018 $44,781 $9,808
$0$43,987$17,642 $23,560 $9,144
$359,940 $181,166 $541,106
$17,348
$59,212 $28,749 $10,176
$255 $618
$354 $640
($9,105) ($398)
($59,307) $31,194
$48,542
$40,750 $0
$89,292 $1,695,440 $1,784,732
$1,059,110 $583,272 $142,350
$1,784,732
$154,401 $116,465
$9,572 $119,765 $63,971 $2,448
$53,913 $17,107
$0$537,642
$210,087 $44,372 $7,952
$0 $45,988 $17,327 $21,451 $ 7,738
$354,915 $169,365 $524,280
$13,362
$58,531 $26,203 $11,676 ($3,503) $1,725
$88$1 $0
($6,070) ($60,649)
$28,002
$41,364
$22,484 $0
$63,848 $1,631,592
$1,695,440
$1,055,161 $486,041 $154,238
$1,695,440
$147,883 $107,092
$9,651 $118,174 $62,218 $2,785
$49,420 $15,516$15,154
$527,893
$196,041 $43,353 $ 7,146 $3,093
$41,646 $17,547 $25,129$9,347
$343,302 $164,141 $507,443 $20,450
$58,598 $20,668 $14,890
$248 $2,659 ($110)
$8$0
($312) ($66,870)
$29,779
$50,229
$34,340 ($78,058)
$6,511 $1,617,286$1,623,797
$999,312$538,211$86,274
$1,623,797
$146,756 $102,961
$8,637 $123,156 $60,588 $3,041 $52,762$15,983
$28,882 $542,766
$211,727 $46,838 $8,286
$9,220 $42,022 $18,460 $17,139 $9,034
$362,726 $156,745 $519,471
$23,295
$50,102 $5,211
$22,613 $3,312
$11,995 ($1)
$3,987 $0
($11,418) ($73,710)
$12,091
$35,386
$42,998 $0
$78,384 $1,538,902
$1,617,286
$988,026 $504,505 $124,755
$1,617,286
$146,772 $110,758
$9,665 $124,606
$65,104 $2,794
$57,702 $17,520 $30,570 $565,491
$211,582 $48,256
$8,221 $7,765 $45,495 $17,108 $16,856
$8,706
$363,989 $162,388 $526,377
$39,114
$53,740N/A
$29,920 $2,739 $2,099
$49 $84
$0 ($1,027)
($80,862)$6,742
$45,856
$41,818 $0
$87,674 $1,451,228
$1,538,902
$903,001 $503,646 $132,255
$1,538,902
2012 2011 2010 2009 2008
M A S S AC H U S E T T S P O RT A U T H O R I T Y
Revenues, Expenses and Changes in Net Position Years Ended June 30,2008 through June 30,2017 (In Thousands)
S-1 Changes in Net Position (Continued)
(5)
(5)
(5)
(4)
(5)
(3)

110
(1) Rates approved by the Members of the Authority each fiscal year. (2) Excludes Terminal A facility rent rate.
Source: Authority reports.
$113,162 $161,816 $168,919
$4.78
$117.29 $122.10
$178.30 $118.51
$1.31
$12.82 $3.19
$12.82 $7.34
$32.00
2017 2016 2015 2014 2013
$104,489
$142,176 $154,068
$4.84
$101.38 $110.99 $134.05 $105.46
$1.35
$11.98 $2.66
$11.98 $7.05
$29.00
$101,123 $133,897 $148,653
$4.64
$93.99 $110.63 $132.79 $111.40
$1.34
$10.36 $2.52
$10.36 $6.67
$29.00
$92,896 $129,487 $136,307
$4.57
$93.94 $106.55 $118.31 $112.66
$1.34
$10.17 $2.74
$10.17 $7.00
$27.00
$86,533
$117,891 $131,873
$4.34
$93.68 $106.23 $109.71 $116.96
$1.45
$10.92 $3.12
$10.92 $7.93
$27.00
Logan Airport Revenues (In Thousands)Landing Fees Terminal Rentals and FeesParking Fees
Logan Airport Rates and Charges (1)
Landing Fee (per 1,000 lbs)
Terminal Rental Rates (per square foot - annual rate)
Terminal A (2)Terminal BTerminal C - Main TerminalTerminal E - Type 3 Space
Baggage Fee (per checked bag)
Terminal E Passenger Fees (Per Passenger)
Inbound InternationalOutboundInbound DomesticCommon Use Check-in Fee
Central Parking Garage (maximum 24 hours)
M A S S AC H U S E T T S P O RT A U T H O R I T Y
Most Significant Revenues and Related Rates and Charges Fiscal Years Ended June 30, 2008 through June 30, 2017
S-2 Principal Revenues and Rates as of June 30

S TAT I S T I C A L
111
(1) Rates approved by the Members of the Authority each fiscal year. (2) Excludes Terminal A facility rent rate.
Source: Authority reports.
$88,287 $115,567 $125,771
$4.36
$89.90 $98.14
$112.90 $117.16
$1.27
$11.40 $3.36
$11.40 $8.31
$27.00
2012 2011 2010 2009 2008
$91,515
$110,267 $116,059
$4.61
$84.62 $95.89
$101.47 $109.48
$1.23
$12.17 $3.26
$10.84 $8.06
$24.00
$89,718 $106,079 $106,918
$4.82
$83.34 $95.31
$104.59 $105.28
$1.49
$14.06 $3.35 $8.37 $8.33
$24.00
$89,041 $106,021 $102,778
$4.82
$84.04 $91.47 $98.56
$115.76
$1.38
$12.32 $2.62 $1.07 $8.39
$24.00
$87,065
$107,260 $110,602
$4.41
$87.43 $95.91
$110.17 $117.49
$1.15
$13.31 $2.79 $1.07 $9.06
$24.00
Logan Airport Revenues (In Thousands)Landing Fees Terminal Rentals and FeesParking Fees
Logan Airport Rates and Charges (1)
Landing Fee (per 1,000 lbs)
Terminal Rental Rates (per square foot - annual rate)
Terminal A (2)Terminal BTerminal C - Main TerminalTerminal E - Type 3 Space
Baggage Fee (per checked bag)
Terminal E Passenger Fees (Per Passenger)
Inbound InternationalOutboundInbound DomesticCommon Use Check-in Fee
Central Parking Garage (maximum 24 hours)
M A S S AC H U S E T T S P O RT A U T H O R I T Y
Most Significant Revenues and Related Rates and Charges Fiscal Years Ended June 30, 2008 through June 30, 2017
S-2 Principal Revenues and Rates as of June 30 (Continued)

112
Logan International AirportPercentage of Terminal Rent and Fee Revenues in FY2017
Logan International AirportPercentage of Landing Fee Revenues in FY2017
JETBLUE23%
AMERICAN15%
DELTA11%
UNITED8%
SOUTHWEST6%
BRITISH AIRWAYS3%
FEDERAL EXPRESS3%
SPIRIT3%
LUFTHANSA2%
ALL OTHERS26%
JETBLUE19%
AMERICAN16%
DELTA15%
UNITED8%
BRITISH AIRWAYS4%
SOUTHWEST4%
LUFTHANSA3%
AIR FRANCE2%
EMIRATES2%
ALL OTHERS27%

113
CustomerJetblue AirwaysAmerican Airlines (6)Delta Airlines (1)United Airlines, Inc. (2)Southwest Airlines Co (3); (4)British Airways, PlcFederal Express Corp.Spirit AirlinesLufthansa German AirlinesSignature Flight Support CorpUs Airways, Inc. (6)Airtran Airlines (4)Northwest Airlines (1)Continental Airlines (2)Comair Inc. (5) All Other PayersTotal Landing Fees
Landing Fee
Revenue$26,222
$17,284$12,700
$9,317$7,141$3,295$2,924$2,762 $2,295$2,114
- - - --
$27,108$113,162
Rank123456789
10------
Ratio: Top Customers
to Total Landing Fees
23.17%15.27%11.22%
8.23%6.31%2.91%2.58%
2.44%2.03%1.87%
-----
23.96%100.00%
Landing Fee
Revenue$9,953
$10,891 $9,462 $6,919
- $2,228 $2,811
$524 $1,615 $1,836
$11,331 $3,911$3,833$3,282$2,628
$15,841$87,065
Rank3245-
119
271413
1678
10-
Ratio: Top Customers
to Total Landing Fees
11.43%12.51%10.87%
7.95%-
2.56%3.23%0.60%
1.85%2.11%
13.01%4.49%4.40%
3.77%3.02%
18.19%100.00%
LANDING FEE REVENUE FOR THE FISCAL YEAR ENDEDJUNE 30, 2017
FOR THE FISCAL YEAR ENDEDJUNE 30, 2008
CustomerJetblue AirwaysAmerican Airlines (6)Delta Airlines (1)United Airlines, Inc. (2)British Airways, PlcSouthwest Airlines Co (3)Lufthansa German AirlinesAir FranceEmiratesIcelandairUs Airways, Inc. (6)Northwest Airlines (1)Aer LingusAll Other PayersTotal Terminal Rental and Fees
Terminal Rents
and Fee $30,717
$26,000$23,820$13,739
$7,111$5,691$5,249$3,094$2,498$2,372
--
$489$41,036$161,816
Rank123456789
10--
39-
Ratio: Top Customers to Total
Terminal Rents and Fees
18.98%16.07%14.72%
8.49%4.39%3.52%
3.24%1.91%1.54%1.47%
--
0.30% 25.36%
100.00%
Terminal Rents
and Fee $7,393
$14,106 $14,393 $6,287 $6,730
-$4,668
$3,950 -
$1,636$10,563
$8,436$4,285
$24,813$107,260
Rank52176-
810
-16
349-
Ratio: Top Customers to Total
Terminal Rents and Fees
6.89%13.15%13.42%
5.86%6.27%
-4.35%3.68%
- 1.53%
9.85%7.87%3.99%
23.13% 100.00%
TERMINAL RENTS AND FEES FOR THE FISCAL YEAR ENDEDJUNE 30, 2017
FOR THE FISCAL YEAR ENDEDJUNE 30, 2008
CustomerPublic Parking at AirportTenant Employee ParkingPublic Off-Airport ParkingTotal Parking Revenue
LoganParking
$154,968 $8,428
$5,523 $168,919
Rank123
Ratio: Top Customers
to Total Parking Revenue
91.74%4.99%3.27%
100.00%
LoganParking
$100,964 $6,168 $3,470
$110,602
Rank123
Ratio: Top Customers
to Total Parking Revenue
91.29%5.58%3.14%
100.00%
PARKING REVENUE FOR THE FISCAL YEAR ENDEDJUNE 30, 2017
FOR THE FISCAL YEAR ENDEDJUNE 30, 2008
(1) Delta Airlines and Northwest Airlines closed their merger during 2008 and continued to operate under their separate names until January 2010. (2) United and Continental Airlines closed their merger during October 2010 and continued to operate under their separate names until November 2011. (3) Southwest Airlines commenced service at Logan Airport in August 2009. (4) Southwest Airlines and AirTran Airways closed their merger during May 2011 and continued to operate under their separate names until January 2015. (5) Comair Inc. ceased operations during September 2012.(6) American Airlines and US Airways closed their merger during December 2013 and continued to operate under their separate names until October 2015.Source: Authority’s accounting reports.
M A S S AC H U S E T T S P O RT A U T H O R I T Y
Historical Principal Operating Revenue Payers Current Year and Nine Years Ago (In Thousands)S-3 Principal Operating Revenue Payers
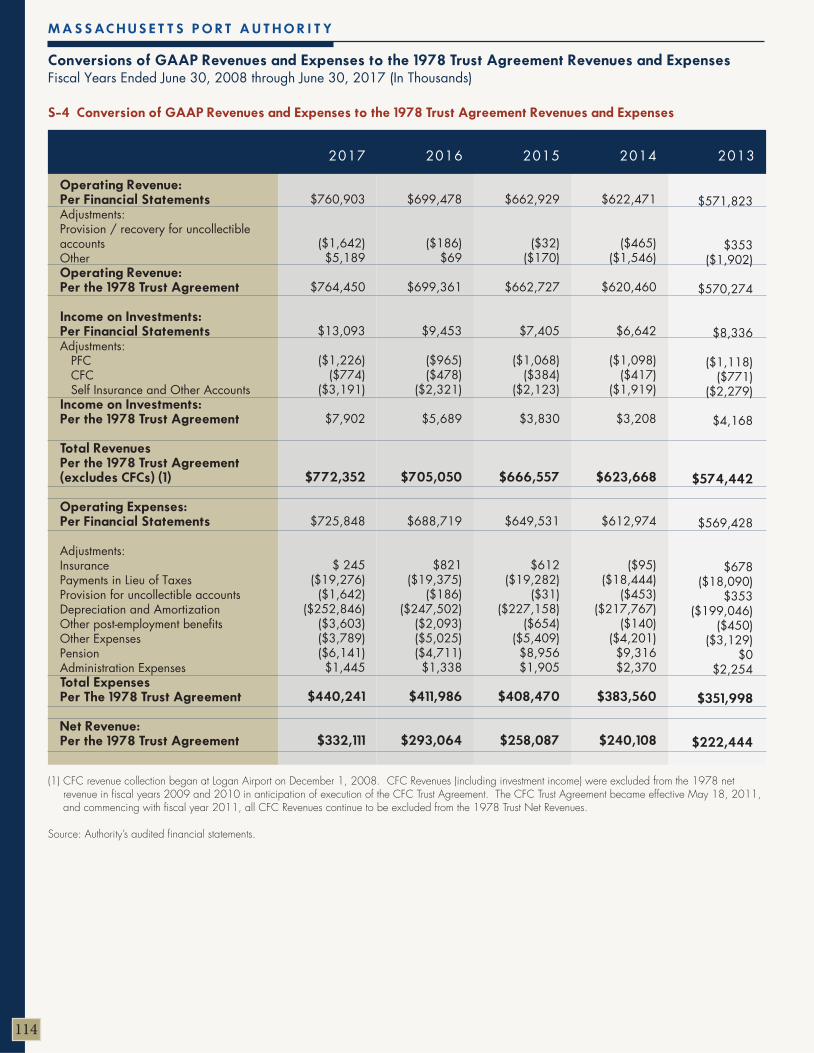
114
(1) CFC revenue collection began at Logan Airport on December 1, 2008. CFC Revenues (including investment income) were excluded from the 1978 net revenue in fiscal years 2009 and 2010 in anticipation of execution of the CFC Trust Agreement. The CFC Trust Agreement became effective May 18, 2011, and commencing with fiscal year 2011, all CFC Revenues continue to be excluded from the 1978 Trust Net Revenues.
Source: Authority’s audited financial statements.
$760,903
($1,642) $5,189
$764,450
$13,093
($1,226) ($774)
($3,191)
$7,902
$772,352
$725,848
$ 245 ($19,276)
($1,642) ($252,846)
($3,603) ($3,789) ($6,141) $1,445
$440,241
$332,111
2017 2016 2015 2014 2013
$699,478
($186) $69
$699,361
$9,453
($965) ($478)
($2,321)
$5,689
$705,050
$688,719
$821 ($19,375)
($186) ($247,502)
($2,093) ($5,025) ($4,711) $1,338
$411,986
$293,064
$662,929
($32) ($170)
$662,727
$7,405
($1,068) ($384)
($2,123)
$3,830
$666,557
$649,531
$612 ($19,282)
($31) ($227,158)
($654) ($5,409) $8,956 $1,905
$408,470
$258,087
$622,471
($465) ($1,546)
$620,460
$6,642
($1,098) ($417)
($1,919)
$3,208
$623,668
$612,974
($95) ($18,444)
($453) ($217,767)
($140) ($4,201) $9,316 $2,370
$383,560
$240,108
$571,823
$353 ($1,902)
$570,274
$8,336
($1,118) ($771)
($2,279)
$4,168
$574,442
$569,428
$678 ($18,090)
$353 ($199,046)
($450) ($3,129)
$0 $2,254
$351,998
$222,444
Operating Revenue: Per Financial Statements Adjustments: Provision / recovery for uncollectible accounts Other Operating Revenue: Per the 1978 Trust Agreement Income on Investments: Per Financial Statements Adjustments: PFC CFC Self Insurance and Other Accounts Income on Investments: Per the 1978 Trust Agreement Total Revenues Per the 1978 Trust Agreement (excludes CFCs) (1) Operating Expenses: Per Financial Statements Adjustments: Insurance Payments in Lieu of Taxes Provision for uncollectible accounts Depreciation and Amortization Other post-employment benefits Other Expenses Pension Administration Expenses Total Expenses Per The 1978 Trust Agreement Net Revenue: Per the 1978 Trust Agreement
M A S S AC H U S E T T S P O RT A U T H O R I T Y
Conversions of GAAP Revenues and Expenses to the 1978 Trust Agreement Revenues and ExpensesFiscal Years Ended June 30, 2008 through June 30, 2017 (In Thousands)
S-4 Conversion of GAAP Revenues and Expenses to the 1978 Trust Agreement Revenues and Expenses

S TAT I S T I C A L
115
(1) CFC revenue collection began at Logan Airport on December 1, 2008. CFC Revenues (including investment income) were excluded from the 1978 net revenue in fiscal years 2009 and 2010 in anticipation of execution of the CFC Trust Agreement. The CFC Trust Agreement became effective May 18, 2011, and commencing with fiscal year 2011, all CFC Revenues continue to be excluded from the 1978 Trust Net Revenues.
Source: Authority’s audited financial statements.
Operating Revenue: Per Financial Statements Adjustments: Provision / recovery for uncollectible accounts Other Operating Revenue: Per the 1978 Trust Agreement Income on Investments: Per Financial Statements Adjustments: PFC CFC Self Insurance and Other Accounts Income on Investments: Per the 1978 Trust Agreement Total Revenues Per the 1978 Trust Agreement (excludes CFCs) (1) Operating Expenses: Per Financial Statements Adjustments: Insurance Payments in Lieu of Taxes Provision for uncollectible accounts Depreciation and Amortization Other post-employment benefits Other Expenses Pension Administration Expenses Total Expenses Per The 1978 Trust Agreement Net Revenue: Per the 1978 Trust Agreement
$558,454
($1,061) $3,979
$561,372
$10,176
($1,141) ($802)
($1,538)
$6,695
$568,067
$541,106
$266 ($17,642)
($1,085) ($181,166)
($5,859) ($4,300)
$0 $2,648
$333,968
$234,099
2012 2011 2010 2009 2008
$537,642
($419) ($533)
$536,690
$11,676
($1,344) ($159)
($1,833)
$8,340
$545,030
$524,280
$1,514 ($17,327)
($412) ($169,365)
($4,505) ($287)
$0 $1,631
$335,529
$209,501
$527,893
($473)$0
$527,420
$14,890
($2,037) ($85)
($1,525)
$11,243
$538,663
$507,443
($1,891) ($17,547)
($473) ($164,141)
($5,570) $1,447
$0 $1,201
$320,469
$218,194
$542,766
(1,632)$0
$541,134
$22,613
($2,271) ($10)
($2,849)
$17,483
$558,617
$519,471
$5,476 ($18,460)
($1,632) ($156,745)
($5,526) ($9,044)
$0 $1,280
$334,820
$223,797
$565,491
($158)$0
$565,333
$29,920
($2,753)$0
($3,164)
$24,003
$589,336
$526,377
($824) ($17,108)
($158) ($162,388)
($6,702) ($2,315)
$0$0
$336,882
$252,454
M A S S AC H U S E T T S P O RT A U T H O R I T Y
Conversions of GAAP Revenues and Expenses to the 1978 Trust Agreement Revenues and ExpensesFiscal Years Ended June 30, 2008 through June 30, 2017 (In Thousands)
S-4 Conversion of GAAP Revenues and Expenses to the 1978 Trust Agreement Revenues and Expenses (Continued)

116
$113,162 $168,919
$15,284 $161,816
$49,641 $98,093 $31,303
$638,218
$12,839 $1,634
$652,691
$81,738 $30,021 $111,759
$0 $764,450
$7,902
$772,352
$0
$772,352
$328,869 $12,530 $9,672
$351,071
$70,088 $19,082 $89,170
$0 $440,241
$332,111 $332,111
2017 2016 2015 2014 2013
$104,489
$154,068 $17,960
$142,176 $49,317 $86,645 $32,061
$586,716
$12,195 $1,572
$600,483
$74,259 $24,619 $98,878
$0$ 699,361
$5,689
$705,050
$0
$705,050
$ 307,394 $ 12,152 $9,408
$328,954
$66,307 $16,725 $83,032
$0 $411,986
$293,064 $293,064
$101,123 $148,653 $18,274
$133,897 $45,756 $81,270 $29,452
$558,425
$12,066 $1,624
$572,115
$68,316 $22,295 $90,611
$0 $662,726
$3,830
$666,556
$0
$666,556
$307,368 $10,043 $9,026
$326,437
$62,020 $20,012 $82,032
$0 $408,469 $258,087 $258,087
$92,896 $136,307 $16,798
$129,487 $46,175 $76,003 $24,895
$522,561
$10,640 $1,538
$534,739
$62,068 $23,653 $85,721
$0 $620,460
$3,208
$623,668
$0
$623,668
$290,641 $10,396 $7,497
$308,534
$59,860 $15,166 $75,026
$0 $383,560 $240,108 $240,108
$86,533 $131,873
$14,867 $117,891
$42,086 $70,082 $19,162
$482,494
$10,377 $ 774
$493,645
$56,334 $20,295 $76,629
$0 $570,274
$4,168
$574,442
$0
$574,442
$267,157 $9,235 $5,012
$281,404
$56,740 $13,854 $70,594
$0 $351,998
$222,444 $222,444
1978 Trust Agreement REVENUES: Airport Properties - Logan Landing Fees Parking Fees Utility Fees Terminal Rentals (1) Non-Terminal Building and Ground Rents Concessions Other (2)
Airport Properties - Hanscom Airport Properties - Worcester (3) Total Airport Properties PORT PROPERTIES Maritime Operations (4) Maritime Business Development/Real Estate Bridge (5) Total Operating Revenue
Investment Income (6)
Total Revenues before CFC CFC Revenues (7) Total Revenues Operating Expenses (8): AIRPORT PROPERTIES Logan Hanscom Worcester (3) PORT PROPERTIES Maritime Operations (4) Maritime Business Development/Real Estate Bridge (5) Total Operating Expenses Net Revenue Net Revenue Excluding CFCs
(1) Excludes the portion of Terminal A rental revenue that is pledge to pay debt service on the Terminal A Bonds.(2) Logan Airport uncollectible accounts have been included in Logan Other Revenue.(3) On July 1, 2010, the Authority acquired Worcester Regional Airport as required under the Transportation Reform Act. (4) Maritime Operations include Auto, Container, Cruise and Seafood Business lines.(5) Effective 1/1/2010, Tobin Bridge was transferred to the MassDOT pursuant to the Transportation Reform Act.(6) Excludes investment income earned by and deposited into Construction, PFC, CFC and other funds not held under the 1978 Trust Agreement.(7) CFC revenue collection began at Logan Airport on December 1, 2008. CFC Revenues (including investment income) were excluded from the 1978 net revenue in fiscal years 2009 and 2010 in anticipation of execution of the CFC Trust Agreement. The CFC Trust Agreement became effective May 18, 2011, and commencing with fiscal year 2011, all CFC Revenues continue to be excluded from the 1978 Trust Net Revenues.(8) Includes allocation of all operating expenses related to Authority General Administration.
Source: Authority’s accounting reports.
M A S S AC H U S E T T S P O RT A U T H O R I T Y
Calculation of Net Revenues Pledged Under the 1978 Trust Agreement Fiscal Years Ended June 30, 2008 through June 30, 2017 (In Thousands)
S-5 Breakdown of Revenues and Expenses Under 1978 Trust Agreement

117
(1) Excludes the portion of Terminal A rental revenue that is pledge to pay debt service on the Terminal A Bonds.(2) Logan Airport uncollectible accounts have been included in Logan Other Revenue.(3) On July 1, 2010, the Authority acquired Worcester Regional Airport as required under the Transportation Reform Act. (4) Maritime Operations include Auto, Container, Cruise and Seafood Business lines.(5) Effective 1/1/2010, Tobin Bridge was transferred to the MassDOT pursuant to the Transportation Reform Act.(6) Excludes investment income earned by and deposited into Construction, PFC, CFC and other funds not held under the 1978 Trust Agreement.(7) CFC revenue collection began at Logan Airport on December 1, 2008. CFC Revenues (including investment income) were excluded from the 1978 net revenue in fiscal years 2009 and 2010 in anticipation of execution of the CFC Trust Agreement. The CFC Trust Agreement became effective May 18, 2011, and commencing with fiscal year 2011, all CFC Revenues continue to be excluded from the 1978 Trust Net Revenues.(8) Includes allocation of all operating expenses related to Authority General Administration.
Source: Authority’s accounting reports.
1978 Trust Agreement REVENUES: Airport Properties - Logan Landing Fees Parking Fees Utility Fees Terminal Rentals (1) Non-Terminal Building and Ground Rents Concessions Other (2)
Airport Properties - Hanscom Airport Properties - Worcester (3) Total Airport Properties PORT PROPERTIES Maritime Operations (4) Maritime Business Development/Real Estate Bridge (5) Total Operating Revenue
Investment Income (6)
Total Revenues before CFC CFC Revenues (7) Total Revenues Operating Expenses (8): AIRPORT PROPERTIES Logan Hanscom Worcester (3) PORT PROPERTIES Maritime Operations (4) Maritime Business Development/Real Estate Bridge (5) Total Operating Expenses Net Revenue Net Revenue Excluding CFCs
$88,287 $125,771 $15,275
$115,567 $40,107 $71,342 $20,467
$476,816
$9,984 $1,238
$488,038
$54,556 $18,778 $73,334
$0 $561,372
$6,695
$568,067
$0
$568,067
$ 251,718 $8,162 $5,048
$264,928
$55,798 $13,242 $69,040
$0 $333,968 $234,099 $234,099
2012 2011 2010 2009 2008
$91,515
$116,059 $16,144
$110,267 $39,547 $62,750 $19,417
$455,699
$ 9,371 $ 911
$465,981
$ 53,589 $17,120 $70,709
$0 $536,690
$8,340
$545,030
$0
$545,030
$253,062 $8,726 $ 5,122
$266,910
$56,687 $11,932 $68,619
$0 $335,529 $209,501 $209,501
$89,718 $106,918 $18,442
$106,079 $37,574 $60,179 $19,908 $438,818
$9,227 N/A
$448,045
$49,493 $14,729 $64,222
$15,153 $527,420
$11,243
$538,663
$20,752
$559,415
$243,180 $8,159
N/A $251,339
$52,453 $11,398 $63,851 $5,279
$320,469 $238,946 $218,194
$89,041 $102,778 $26,005
$106,021 $ 36,693 $58,685 $16,177
$435,400
$9,037 N/A
$444,437
$52,519 $15,296 $67,815
$28,882 $541,134
$17,483
$558,617
$5,221
$563,838
$246,561 $8,710
N/A $255,271
$54,212 $12,708 $66,920 $12,629
$334,820 $229,018
$223,797
$87,065 $110,602
$26,562 $107,260
$35,063 $63,058 $20,208 $449,818
$10,063 N/A
$459,881
$57,580 $17,310 $74,890
$30,562 $565,333
$24,003
$589,336
N/A
$589,336
$247,026 $9,301
N/A $256,327
$55,415 $12,812 $68,227 $12,328
$336,882 $252,454 $252,454
M A S S AC H U S E T T S P O RT A U T H O R I T Y
Calculation of Net Revenues Pledged Under the 1978 Trust Agreement Fiscal Years Ended June 30, 2008 through June 30, 2017 (In Thousands)
S-5 Breakdown of Revenues and Expenses Under 1978 Trust Agreement (Continued)

$76,296 $537
$76,833
$33,055 $774
$33,829
$70,781
$277
$70,995
$32,335 $478
$32,813
$65,807
$82
$65,889
$30,768 $384
$31,152
$62,682
$69
$62,751
$29,963 $417
$30,380
$60,105
$62
$60,167
$29,354 $771
$30,125
PFC Trust AgreementRevenues: Logan Airport Net PFC Collections (1) PFC Investment Income (3) PFC Revenue (4)
CFC Trust Agreement Revenues: CFC Collections (5) CFC Investment Income
CFC Revenue
2017 2016 2015 2014 2013
(1) PFC revenue collection began at Logan Airport on November 1, 1993. The PFC Trust Agreement became effective May 6, 1999.(2) In fiscal year 2010, the Authority changed its accrual policy for calculating PFC revenue.(3) PFC investment income, per federal PFC law, includes only interest income generated by PFC collections. It does not include earnings on PFC bond funds.(4) As of July 2, 2017, there are no PFC Revenue Bonds outstanding under the PFC Trust Agreement, as the final payment amount of $52.9 million matured on July 1, 2017.(5) CFC revenue collection began at Logan Airport on December 1, 2008. The CFC Trust Agreement became effective May 18, 2011.
Source: Authority’s accounting reports.
M A S S AC H U S E T T S P O RT A U T H O R I T Y
Calculation of Total PFC Pledged Under the PFC Trust Agreement and Calculation of Total CFC Revenue Pledged Under the CFC Trust Agreement Fiscal Years Ended June 30, 2008 through June 30, 2017 (In Thousands)
S-6 Breakdown of Revenues by Governing Trust Agreement
118

S TAT I S T I C A L
119
(1) PFC revenue collection began at Logan Airport on November 1, 1993. The PFC Trust Agreement became effective May 6, 1999.(2) In fiscal year 2010, the Authority changed its accrual policy for calculating PFC revenue.(3) PFC investment income, per federal PFC law, includes only interest income generated by PFC collections. It does not include earnings on PFC bond funds.(4) As of July 2, 2017, there are no PFC Revenue Bonds outstanding under the PFC Trust Agreement, as the final payment amount of $52.9 million matured on July 1, 2017.(5) CFC revenue collection began at Logan Airport on December 1, 2008. The CFC Trust Agreement became effective May 18, 2011.
Source: Authority’s accounting reports.
PFC Trust AgreementRevenues: Logan Airport Net PFC Collections (1) PFC Investment Income (3) PFC Revenue (4)
CFC Trust Agreement Revenues: CFC Collections (5) CFC Investment Income
CFC Revenue
$59,258 $81
$59,339
$28,749 $ 802
$29,551
$58,485
$177
$58,662
$26,203 $159
$26,362
$58,598
$469
$59,067
N/A N/A
$0.0
$50,102
$597
$50,699
N/A N/A
$0.0
$53,740
$1,006
$54,746
N/A N/A
$0.0
2012 2011 2010 2009 2008
M A S S AC H U S E T T S P O RT A U T H O R I T Y
Calculation of Total PFC Pledged Under the PFC Trust Agreement and Calculation of Total CFC Revenue Pledged Under the CFC Trust Agreement Fiscal Years Ended June 30, 2008 through June 30, 2017 (In Thousands)
S-6 Breakdown of Revenues by Governing Trust Agreement (Continued)
(2)

120
$332,111
$52,895 $59,636
($11,075) $101,456
3.27
$76,833
$52,910 $2,579
($20,245) $35,244
2.18
63.44
$33,055
$3,620 $11,461
($729) $14,352
2.30
2.60
2017 2016 2015 2014 2013
$293,064
$49,430 $52,429 ($3,639) $98,220
2.98
$70,995
$22,325 $3,731 ($312)
$25,744
2.76
10.68
$32,335
$3,485 $11,584
($397) $14,672
2.20
2.50
$258,087
$50,480 $50,211 ($2,191) $98,500
2.62
$65,889
$17,475 $4,563 ($841)
$21,197
3.11
5.64
$30,768
$3,360 $11,693
($366) $14,687
2.09
2.39
$240,108
$46,910 $48,882 ($5,229) $90,563
2.65
$62,751
$17,720 $5,435
($1,311) $21,844
2.87
4.75
$29,963
$3,260 $11,755 ($2,220) $12,795
2.34
2.64
$222,444
$44,325 $51,089 ($5,330) $90,084
2.47
$60,167
$16,925 $6,236
($1,417) $21,744
2.77
4.37
$29,354
$3,185 $11,796 ($3,564) $11,417
2.57
2.87
1978 Trust Agreement
Net Revenue Debt Service - Principal Debt Service - Interest Credits to Debt Service (1) Annual Debt Service Debt Service Coverage PFC Trust Agreement Net PFC Revenue Debt Service - Principal Debt Service - Interest Credits to Debt Service (2) Annual Debt Service (7) Debt Service Coverage (3) First Lien Sufficiency Covenant CFC Trust Agreement CFC Revenue (4) Debt Service - Principal Debt Service - Interest Credits to Debt Service Annual Debt Service Debt Service Coverage before the benefit of Rolling Cov. Fund and Sup. Reserve Fund balances Debt Service Coverage after the benefit of Rolling Cov. Fund and Sup. Reserve Fund balances
M A S S AC H U S E T T S P O RT A U T H O R I T Y
Calculation of Debt Service Coverage Under the 1978 Trust Agreement, the PFC Trust Agreement and the CFC Trust Agreement Fiscal Years Ended June 30, 2008 through June 30, 2017 (In Thousands - Except Coverage Calculations)
S-7 Debt Service Coverage
(1) Consists of bond proceeds in the form of Capitalized Interest and investment earnings on the Construction Funds.(2) Consists of investment income on the PFC Debt Service Reserve Fund, the PFC Project Funds and investment income generated by the PFC Debt Service Funds that were not received from PFC collections. Fiscal year 2017 credits include $19.6 million released from the Debt Service Reserve Fund.(3) Debt Service Coverage reflects the pledge of revenue at the $4.50 PFC level.(4) CFC revenue collection began at Logan Airport on December 1, 2008. The CFC Trust Agreement became effective May 18, 2011. The CFC Bonds were issued June 15, 2011. Due to the timing of the issuance, no debt service was due or paid in fiscal year 2011 and, accordingly, coverage cannot be calculated for fiscal year 2011.(5) Following the issuance of the June 30, 2015 audited financial statements on September 30, 2015, the CFC Debt Service Coverage calculation was updated from 2.42 to 2.39 for fiscal year 2015. Following the issuance of the June 30, 2014 audited financial statements on September 24, 2014, the CFC Debt Service Coverage calculation was updated from 2.69 to 2.64 for fiscal year 2014.(6) Following the issuance of the June 30, 2016 audited financial statements on September 30, 2016, the 1978 Trust Debt Service Coverage calculations in the fiscal year 2016 MD&A were updated from 2.96 to 2.98 for fiscal year 2016 and from 2.49 to 2.62 for fiscal year 2015, respectively. The PFC First Lien Sufficiency covenant calculation has been updated from 11.03 to 10.68 for fiscal year 2016.(7) As of July 2, 2017, there are no PFC Revenue Bonds outstanding under the PFC Trust Agreement, as the final payment amount of $52.9 million matured on July 1, 2017. Source: Authority’s accounting reports.
(6)
(6)
(5)
(6)
(5)

121
2012 2011 2010 2009 2008
$234,099
$57,010 $50,024 ($1,198)
$105,836
2.21
$59,339
$16,160 $6,999 ($924)
$22,235
2.67
3.73
$28,749
$2,575 $11,814 ($2,796) $11,593
2.48
2.78
$209,501
$54,100 $50,913 ($3,994)
$101,019
2.07
$58,662
$15,735 $7,214
($1,618) $21,331
2.75
4.09
$26,203
$0$0
$0$0
N/A
N/A
$218,194
$53,855 $50,836
$0 $104,691
2.08
$59,067
$17,390 $9,799
($1,642) $25,547
2.31
1.57
N/A
$0$0
$0$0
N/A
N/A
$223,797
$50,780 $55,889
$0 $106,669
2.10
$50,699
$16,540 $10,648 ($2,758) $24,430
2.08
1.63
N/A
$0$0
$0$0
N/A
N/A
$252,454
$48,140 $61,767
$0 $109,907
2.30
$54,746
$15,540 $11,771 ($2,153) $25,158
2.18
1.86
N/A
$0$0 $0$0
N/A
N/A
1978 Trust Agreement
Net Revenue Debt Service - Principal Debt Service - Interest Credits to Debt Service (1) Annual Debt Service Debt Service Coverage) PFC Trust Agreement Net PFC Revenue Debt Service - Principal Debt Service - Interest Credits to Debt Service (2) Annual Debt Service (7) Debt Service Coverage (3) First Lien Sufficiency Covenant CFC Trust Agreement CFC Revenue (4) Debt Service - Principal Debt Service - Interest Credits to Debt Service Annual Debt Service Debt Service Coverage before the benefit of Rolling Cov. Fund and Sup. Reserve Fund balances Debt Service Coverage after the benefit of Rolling Cov. Fund and Sup. Reserve Fund balances
M A S S AC H U S E T T S P O RT A U T H O R I T Y
Calculation of Debt Service Coverage Under the 1978 Trust Agreement the PFC Trust Agreement and the CFC Trust Agreement Fiscal Years Ended June 30, 2008 through June 30, 2017 (In Thousands - Except Coverage Calculations)
S-7 Debt Service Coverage (Continued)
(1) Consists of bond proceeds in the form of Capitalized Interest and investment earnings on the Construction Funds.(2) Consists of investment income on the PFC Debt Service Reserve Fund, the PFC Project Funds and investment income generated by the PFC Debt Service Funds that were not received from PFC collections. Fiscal year 2017 credits include $19.6 million released from the Debt Service Reserve Fund.(3) Debt Service Coverage reflects the pledge of revenue at the $4.50 PFC level.(4) CFC revenue collection began at Logan Airport on December 1, 2008. The CFC Trust Agreement became effective May 18, 2011. The CFC Bonds were issued June 15, 2011. Due to the timing of the issuance, no debt service was due or paid in fiscal year 2011 and, accordingly, coverage cannot be calculated for fiscal year 2011.(5) Following the issuance of the June 30, 2015 audited financial statements on September 30, 2015, the CFC Debt Service Coverage calculation was updated from 2.42 to 2.39 for fiscal year 2015. Following the issuance of the June 30, 2014 audited financial statements on September 24, 2014, the CFC Debt Service Coverage calculation was updated from 2.69 to 2.64 for fiscal year 2014.(6) Following the issuance of the June 30, 2016 audited financial statements on September 30, 2016, the 1978 Trust Debt Service Coverage calculations in the fiscal year 2016 MD&A were updated from 2.96 to 2.98 for fiscal year 2016 and from 2.49 to 2.62 for fiscal year 2015, respectively. The PFC First Lien Sufficiency covenant calculation has been updated from 11.03 to 10.68 for fiscal year 2016.(7) As of July 2, 2017, there are no PFC Revenue Bonds outstanding under the PFC Trust Agreement, as the final payment amount of $52.9 million matured on July 1, 2017. Source: Authority’s accounting reports.
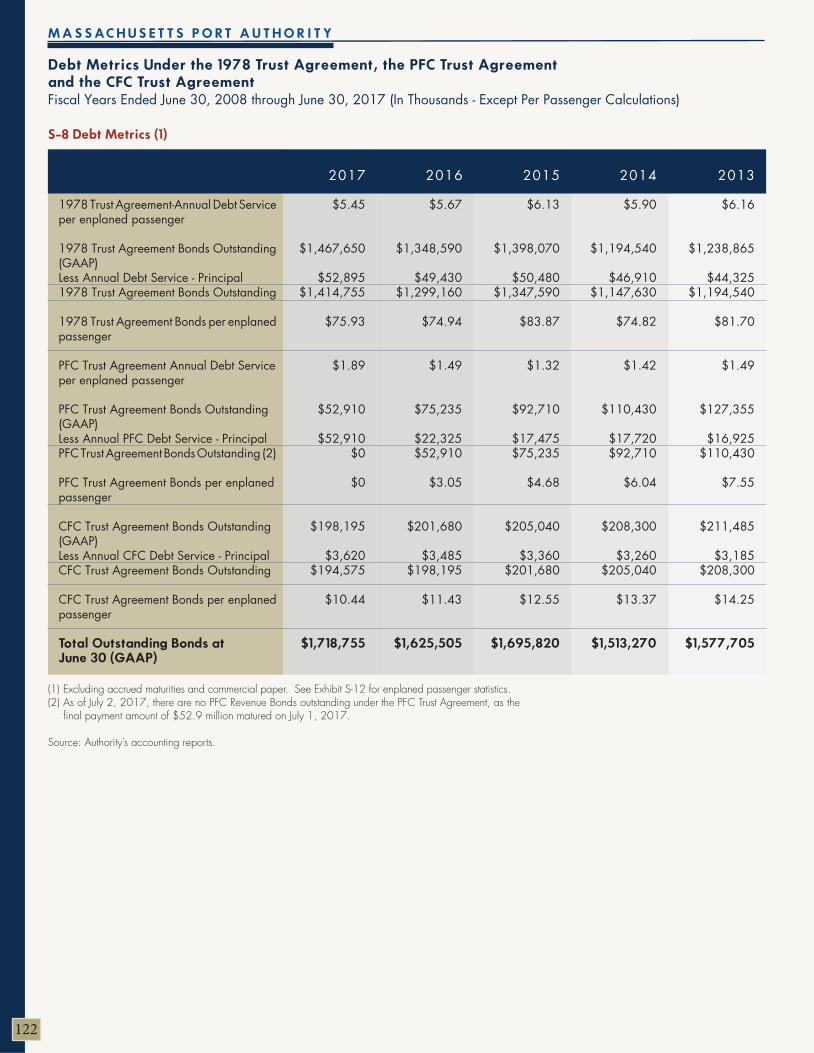
122
$5.45
$1,467,650
$52,895 $1,414,755
$75.93
$1.89
$52,910
$52,910 $0
$0
$198,195
$3,620 $194,575
$10.44
$1,718,755
2017 2016 2015 2014 2013
$5.67
$1,348,590
$49,430 $1,299,160
$74.94
$1.49
$75,235
$22,325 $52,910
$3.05
$201,680
$3,485 $198,195
$11.43
$1,625,505
$6.13
$1,398,070
$50,480 $1,347,590
$83.87
$1.32
$92,710
$17,475 $75,235
$4.68
$205,040
$3,360 $201,680
$12.55
$1,695,820
$5.90
$1,194,540
$46,910 $1,147,630
$74.82
$1.42
$110,430
$17,720 $92,710
$6.04
$208,300
$3,260 $205,040
$13.37
$1,513,270
$6.16
$1,238,865
$44,325 $1,194,540
$81.70
$1.49
$127,355
$16,925 $110,430
$7.55
$211,485
$3,185 $208,300
$14.25
$1,577,705
1978 Trust Agreement-Annual Debt Service per enplaned passenger
1978 Trust Agreement Bonds Outstanding (GAAP)Less Annual Debt Service - Principal 1978 Trust Agreement Bonds Outstanding
1978 Trust Agreement Bonds per enplaned passenger
PFC Trust Agreement Annual Debt Service per enplaned passenger
PFC Trust Agreement Bonds Outstanding (GAAP)Less Annual PFC Debt Service - PrincipalPFC Trust Agreement Bonds Outstanding (2)
PFC Trust Agreement Bonds per enplaned passenger
CFC Trust Agreement Bonds Outstanding (GAAP)Less Annual CFC Debt Service - PrincipalCFC Trust Agreement Bonds Outstanding
CFC Trust Agreement Bonds per enplaned passenger
Total Outstanding Bonds at June 30 (GAAP)
M A S S AC H U S E T T S P O RT A U T H O R I T Y
Debt Metrics Under the 1978 Trust Agreement, the PFC Trust Agreement and the CFC Trust Agreement Fiscal Years Ended June 30, 2008 through June 30, 2017 (In Thousands - Except Per Passenger Calculations)
S-8 Debt Metrics (1)
(1) Excluding accrued maturities and commercial paper. See Exhibit S-12 for enplaned passenger statistics.(2) As of July 2, 2017, there are no PFC Revenue Bonds outstanding under the PFC Trust Agreement, as the final payment amount of $52.9 million matured on July 1, 2017.
Source: Authority’s accounting reports.
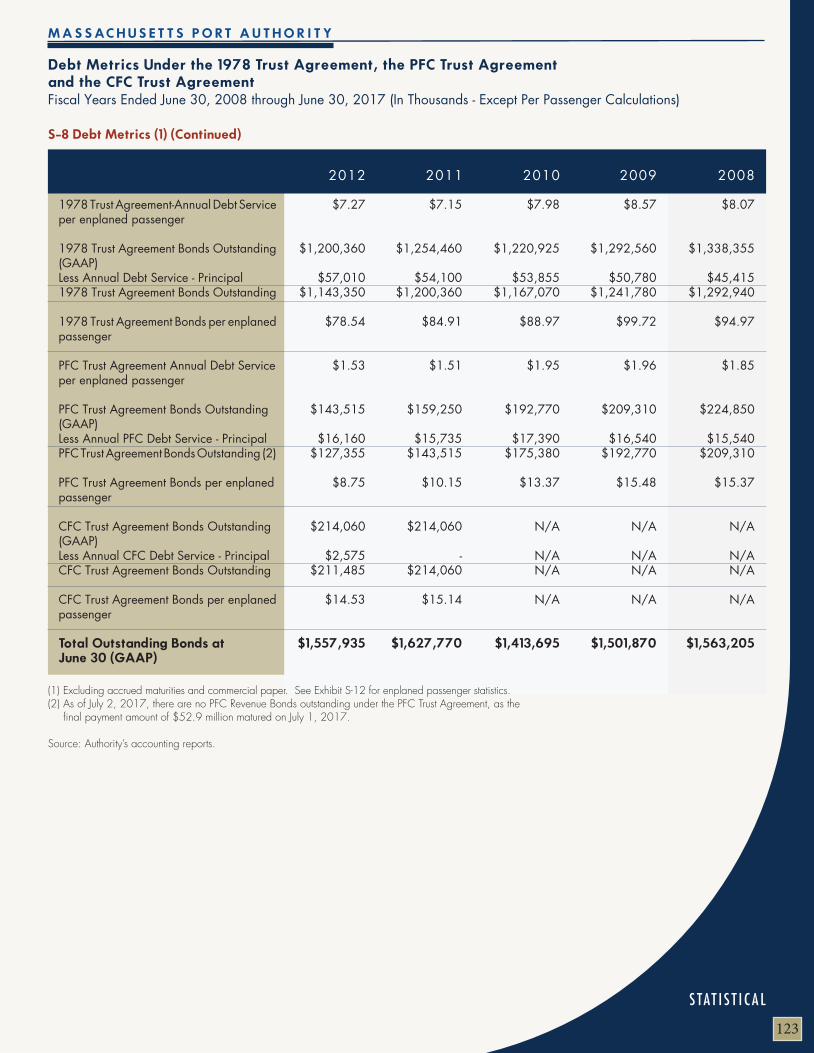
S TAT I S T I C A L
123
1978 Trust Agreement-Annual Debt Service per enplaned passenger
1978 Trust Agreement Bonds Outstanding (GAAP)Less Annual Debt Service - Principal 1978 Trust Agreement Bonds Outstanding
1978 Trust Agreement Bonds per enplaned passenger
PFC Trust Agreement Annual Debt Service per enplaned passenger
PFC Trust Agreement Bonds Outstanding (GAAP)Less Annual PFC Debt Service - PrincipalPFC Trust Agreement Bonds Outstanding (2)
PFC Trust Agreement Bonds per enplaned passenger
CFC Trust Agreement Bonds Outstanding (GAAP)Less Annual CFC Debt Service - PrincipalCFC Trust Agreement Bonds Outstanding
CFC Trust Agreement Bonds per enplaned passenger
Total Outstanding Bonds at June 30 (GAAP)
$7.27
$1,200,360
$57,010 $1,143,350
$78.54
$1.53
$143,515
$16,160 $127,355
$8.75
$214,060
$2,575 $211,485
$14.53
$1,557,935
2012 2011 2010 2009 2008
$7.15
$1,254,460
$54,100 $1,200,360
$84.91
$1.51
$159,250
$15,735 $143,515
$10.15
$214,060
- $214,060
$15.14
$1,627,770
$7.98
$1,220,925
$53,855 $1,167,070
$88.97
$1.95
$192,770
$17,390 $175,380
$13.37
N/A
N/A N/A
N/A
$1,413,695
$8.57
$1,292,560
$50,780 $1,241,780
$99.72
$1.96
$209,310
$16,540 $192,770
$15.48
N/A
N/A N/A
N/A
$1,501,870
$8.07
$1,338,355
$45,415 $1,292,940
$94.97
$1.85
$224,850
$15,540 $209,310
$15.37
N/A
N/A N/A
N/A
$1,563,205
M A S S AC H U S E T T S P O RT A U T H O R I T Y
Debt Metrics Under the 1978 Trust Agreement, the PFC Trust Agreement and the CFC Trust Agreement Fiscal Years Ended June 30, 2008 through June 30, 2017 (In Thousands - Except Per Passenger Calculations)
S-8 Debt Metrics (1) (Continued)
(1) Excluding accrued maturities and commercial paper. See Exhibit S-12 for enplaned passenger statistics.(2) As of July 2, 2017, there are no PFC Revenue Bonds outstanding under the PFC Trust Agreement, as the final payment amount of $52.9 million matured on July 1, 2017.
Source: Authority’s accounting reports.


S TAT I S T I C A L
125
M A S S AC H U S E T T S P O RT A U T H O R I T Y
Largest Private Sector Employers Current Year and Nine Years Ago (Listed in alphabetical order)
S-9 Largest Private Sector Employers - Top 20 Massachusetts Employers with 10,000+ Employees (1)
(1) Largest employers headquartered in MA only, excludes subsidiaries that are headquartered outside of MA.(2) Updated data as of August 2017.
Sources: InfoUSA, Inc. (2017); Massachusetts Department of Unemployment Assistance (March 2008 survey).Verizon New England is a subsidiary of Verizon Communications, headquartered in New York.
EMPLOYER
BJ’S Wholesale Club IncBoston Scientific CorpCare Group IncDe Moulas Market Basket IncFive Star Senior Living IncFMR LLCFresenius Medical CareGeneral Electric CoJohn HancockLiberty Mutual Holding Co IncMassachusetts Mutual Life InsNational Amusements IncPAREXEL International CorpPartners Health Care SystemPhilips Electronics N AmericaRaytheon CoStaples IncState Street CorpThermo Fisher Scientific IncVirtusa Corp
Bay State Medical CenterBeth Israel Deaconess Medical CenterBoston Medical Center CorporationBoston UniversityBrigham and Women’s HospitalDeMoulas Supermarket Inc.EMC CorporationFriendly Ice Cream CorporationGeneral Hospital CorporationJohn HancockMassachusetts Institute of TechnologyNew England Medical CenterPresident and Fellows of Harvard CollegeRaytheon CompanyShaw’s Supermarkets, Inc.Southcoast Hospitals GroupState Street CorpThe Children’s Hospital CorporationUMass Memorial Medical Center, Inc.Verizon New England, Inc.
WestboroughMarlboroughBostonTewksburyNewtonBostonWalthamBostonBostonBostonSpringfieldNorwoodWalthamBostonAndoverWalthamFraminghamBostonWalthamWestborough
SpringfieldBostonBostonBostonBostonTewksburyHopkintonWilbrahamBostonBostonCambridgeBostonBostonLexingtonWest BridgewaterNew BedfordBostonBostonWorcesterBoston
Wholesale ClubsPhysicians & Surgeons Equip & Supls-WhlsHealth ServicesGrocers-RetailHealth Care ManagementFinancial Advisory ServicesDialysisElectronic Equipment & Supplies-MfrsInsuranceInsurance-Holding CompaniesInsuranceTheatres-MoviePharmaceutical Research LaboratoriesHealth Care ManagementHealth Equipment & Supls-ManufacturersAerospace Industries (Mfrs)Office SuppliesHolding Companies (Bank)Laboratory Equipment & Supplies (Whls)Computer Programming Services
HospitalHospitalHospitalUniversityHospitalSupermarketComputer Storage & PeripheralsRestaurantsHospitalInsuranceUniversityHospitalUniversityElectronics/DefenseSupermarketHospitalBankingHospitalHospitalTelecommunications
Calendar Year 2017 (2)
HEADQUARTERS PRODUCT OR SERVICE
EMPLOYER
Calendar Year 2008
HEADQUARTERS PRODUCT OR SERVICE

126
(1) The Metropolitan Statistical Area as defined by the Office of Management and Budget for Federal statistical purposes. (2) U.S. Department of Labor changed its release date for statistical data estimates of personal income for all local areas. Data is expected to be released 11 months after the end of the referenced year.(3) On February 28, 2013, the Office of Management and Budget announced through Bulletin No. 13-01 revised delineations of Metropolitan Statistical Areas. The Local Area Unemployment Statistics implemented these 2010 Census-based delineations on March 17, 2015. Employment figures are reflected as of December 31 each calendar year.(4) Employment data for calendar year 2015 has been revised from what was reflected in Table S-10 of the Authority’s fiscal year 2016 CAFR, reflecting updated data released by the Bureau of Labor Statistics.(5) Population data for calendar year 2015 has been revised from what was reflected in Table S-10 of the Authority’s fiscal year 2016 CAFR, reflecting updated data released by the Bureau of Economic Analysis.
Sources: Bureau of Economic Analysis - U.S. Department of Commerce and Bureau of Labor Statistics - U.S. Department of Labor.
M A S S AC H U S E T T S P O RT A U T H O R I T Y
Demographics and Employment Data Calendar Years Ended 2007 through 2016
S-10 Demographics and Employment Data
4,794,447
N/A
N/A
3.4%
586.0 433.6 475.8 322.8 187.4 260.0 188.6 107.5 100.9
78.8
2,741.4
2016 2015 2014 2013 2012
4,766,755
$326,046
$68,292
4.4%
570.6 434.6 464.9 318.4 189.5 257.1 184.8 107.8 100.1
77.7
2,705.5
4,739,385
$304,329
$64,311
5.2%
558.6 432.4 449.2 320.1 193.1 250.0 180.4
97.9 99.8 76.3
2,657.8
4,698,356
$289,275
$61,754
6.1%
539.9 423.8 439.0 313.5 193.3 242.4 178.9
90.5 98.3 75.1
2,594.7
4,642,095
$280,244
$60,387
6.1%
532.8 419.6 425.8 309.7 193.6 233.6 178.7
86.3 97.6 74.6
2,552.3
Population (5)
Total personal income (in millions)
Per capita personal income
Unemployment rate (annual average) (4)
Employment By IndustryIndustry Type (In thousands) (3, 4)
Educational and Health ServicesTrade, Transportation and UtilitiesProfessional and Business ServicesGovernmentManufacturingLeisure and HospitalityFinancial ActivitiesConstructionOther ServicesInformation
Total
BOSTON METROPOLITAN STATISTICAL AREA (1)
(2) (2)

S TAT I S T I C A L
127
(1) The Metropolitan Statistical Area as defined by the Office of Management and Budget for Federal statistical purposes. (2) U.S. Department of Labor changed its release date for statistical data estimates of personal income for all local areas. Data is expected to be released 11 months after the end of the referenced year.(3) On February 28, 2013, the Office of Management and Budget announced through Bulletin No. 13-01 revised delineations of Metropolitan Statistical Areas. The Local Area Unemployment Statistics implemented these 2010 Census-based delineations on March 17, 2015. Employment figures are reflected as of December 31 each calendar year.(4) Employment data for calendar year 2015 has been revised from what was reflected in Table S-10 of the Authority’s fiscal year 2016 CAFR, reflecting updated data released by the Bureau of Labor Statistics.(5) Population data for calendar year 2015 has been revised from what was reflected in Table S-10 of the Authority’s fiscal year 2016 CAFR, reflecting updated data released by the Bureau of Economic Analysis.
Sources: Bureau of Economic Analysis - U.S. Department of Commerce and Bureau of Labor Statistics - U.S. Department of Labor.
M A S S AC H U S E T T S P O RT A U T H O R I T Y
Demographics and Employment Data Calendar Years Ended 2007 through 2016
S-10 Demographics and Employment Data (Continued)
4,591,112
$265,794
$57,893
6.6%
521.9 417.3 412.3 308.1 192.9 225.8 177.9
80.9 95.8 74.8
2,507.7
4,559,372
$252,729
$55,431
7.6%
512.5 412.8 399.9 309.9 196.2 219.8 179.6
77.9 93.2 72.0
2,473.8
4,588,680
$246,471
$53,713
7.5%
505.0 407.3 389.7 309.9 194.6 210.6 181.3
77.4 90.1 72.6
2,438.5
4,544,705
$250,810
$55,187
5.0%
492.4423.1409.2308.7210.9213.5189.1
91.690.274.8
2,503.5
4,503,921
$243,740
$54,117
4.2%
480.5 432.4 417.1 305.3 219.4 214.3 193.0 100.1
90.6 74.5
2,527.2
Population (5)
Total personal income (in millions)
Per capita personal income
Unemployment rate (annual average) (4)
Employment By IndustryIndustry Type (In thousands) (3, 4)
Educational and Health ServicesTrade, Transportation and UtilitiesProfessional and Business ServicesGovernmentManufacturingLeisure and HospitalityFinancial ActivitiesConstructionOther ServicesInformation
Total
2011 2010 2009 2008 2007BOSTON METROPOLITAN STATISTICAL AREA (1)

(1) Excludes policing services that are provided to the Authority by Troop F of the Massachusetts State Police who are employees of the Commonwealth. In fiscal year 2017, there were 131 State Police positions assigned to the Authority.(2) Effective 1/1/2010, Tobin Bridge was transferred to MassDOT pursuant to the Transportation Reform Act.(3) Effective 7/1/2010, the Authority acquired Worcester Regional Airport pursuant to the Transportation Reform Act.
Source: Authority-Wide Vacancy report as of June 30 each fiscal year.
M A S S AC H U S E T T S P O RT A U T H O R I T Y
Number of Employees by Facility Fiscal Years Ended June 30, 2008 through June 30, 2017
S-11 Number of Employees by Facility (1)
-
780.0
18.0
32.0
121.0
322.0
1,273.0
2017 2016 2015 2014 2013
-
750.5
19.0
31.0
120.5
318.0
1,239.0
-
725.0
19.0
32.0
115.5
311.5
1,203.0
-
707.0
18.0
26.5
121.0
300.5
1,173.0
-
678.5
19.0
21.0
118.0
287.5
1,124.0
Tobin Bridge (2)
Logan Airport
Hanscom Field
Worcester Regional Airport (3)
Maritime
General Administration
Total Employees
FACIL ITY
128
Massachusetts Governor Charlie Baker and New England Patriots owner Robert Kraft at the 2017 Massport “All Hands” meeting,
which is held each year to recognize employees for outstanding achievements.

S TAT I S T I C A L
129
(1) Excludes policing services that are provided to the Authority by Troop F of the Massachusetts State Police who are employees of the Commonwealth. In fiscal year 2017, there were 131 State Police positions assigned to the Authority.(2) Effective 1/1/2010, Tobin Bridge was transferred to MassDOT pursuant to the Transportation Reform Act.(3) Effective 7/1/2010, the Authority acquired Worcester Regional Airport pursuant to the Transportation Reform Act.
Source: Authority-Wide Vacancy report as of June 30 each fiscal year.
M A S S AC H U S E T T S P O RT A U T H O R I T Y
Number of Employees by Facility Fiscal Years Ended June 30, 2008 through June 30, 2017
S-11 Number of Employees by Facility (1) (Continued)
-
696.5
19.0
24.0
114.0
255.0
1,108.5
-
686.5
18.0
5.0
113.0
258.0
1,080.5
-
698.5
19.0
-
115.0
264.5
1,097.0
51.5
705.5
18.0
-
119.0
271.0
1,165.0
53.5
705.0
18.0
-
116.0
297.0
1,189.5
Tobin Bridge (2)
Logan Airport
Hanscom Field
Worcester Regional Airport (3)
Maritime
General Administration
Total Employees
2012 2011 2010 2009 2008FACIL ITY
Massport Fire and Rescue staff run constant drills to prepare for emergency situations.

130
(1) Includes all-cargo flights.(2) Includes domestic flights on jets and charters.(3) Includes international flights on jet, charter and commuter carriers.(4) Excludes general aviation and non-tenant.(5) Data consists of mainline activity only.(6) Source: For fiscal years 2008 through 2010, this statistic was estimated in the market studies published in the Authority’s Official Statements, and was only calculated when the Authority issued bonds. Commencing with fiscal year 2011, all data is as of fiscal year end and the source of this statistic is the Massachusetts Port Authority and U.S. DOT, Air Passenger Origin-Destination Survey, reconciled to Schedule T1, as reported in Appendix CFC-1 to the Authority’s CAFR; this statistic is calculated based on outbound passengers only as of fiscal year end.(7) Data for 12 months ended September 30, 2007.(8) Fiscal year 2017 data is preliminary.(9) Consists of landing fees, terminal rents, certain non-PFC passenger fees and aircraft parking fees.(10) Consists of landing fees, terminal rents, parking, utilities, non-terminal and ground rent, concessions and baggage fees.
Source: Authority reports.
244,857 51,500 68,223 31,300
395,880
24,040,957
14,257,124 14,348,544
3,493,005 3,506,567
881,940 871,399
37,358,579
55,886 55,886
37,470,351
18,632,069
116.8135.9
25.7
JetBlue 27.2%44.3%94.4%
$13.98
$34.25
672,402
2017 2016 2015 2014 2013
237,479 46,687 72,416 30,026
386,608
22,652,895
13,368,762 13,466,887
3,004,322 3,034,210
962,163 952,308
34,788,652
54,883 54,883
34,898,418
17,335,247
113.0129.3
26.4
JetBlue 26.5%40.7%94.8%
$13.45
$33.85
606,101
224,928 41,084 71,233 26,114
363,359
20,784,046
12,551,985 12,591,542
2,611,642 2,634,590
903,180 910,348
32,203,287
47,967 47,967
32,299,221
16,066,807
111.8127.7
25.5
JetBlue 26.9%39.2%94.5%
$13.78
$34.76
625,749
219,534 38,059 79,983 26,286
363,862
20,297,245
11,990,184 12,045,512
2,337,269 2,348,399
1,011,299 1,021,968
30,754,631
47,816 47,816
30,850,263
15,338,752
109.5123.1
25.4
JetBlue 26.5%37.7%94.5%
$13.55
$34.07
572,226
206,566 38,400 79,608 26,924
351,498
19,494,836
11,374,807 11,409,669
2,216,937 2,255,775
1,029,877 1,024,898
29,311,963
48,471 48,471
29,408,905
14,621,621
110.3116.5
25.8
JetBlue 26.2%37.6%95.0%
$13.16
$33.00
552,378
Aircraft Operations (1)Domestic (2)International (3)Regional General Aviation
Total OperationsAircraft Landed Weights (1,000 pounds) (4)Passengers TrafficDomestic (2) Enplaned DeplanedInternational (3) Enplaned DeplanedRegional Enplaned Deplaned
SubtotalGeneral Aviation (“GA”) Enplaned Deplaned
Total PassengersTotal Enplaned Passengers (excluding GA)Average Passengers Per FlightDomestic (2)International (3)Regional
Air Carrier and Passenger MetricsPrimary carrier (5)Primary carrier market share (5)Two top carriers market share (5)Origination & destination share (6)
Compensatory airline payments to Massport per enplaned passenger (9)
Logan Airport revenue per enplaned passenger (10)
Total Cargo & Mail (1,000 pounds)
M A S S AC H U S E T T S P O RT A U T H O R I T Y
Logan International Airport Traffic Metrics Fiscal Years Ended June 30, 2008 through June 30, 2017
S-12 Logan International Airport Activity
(8)
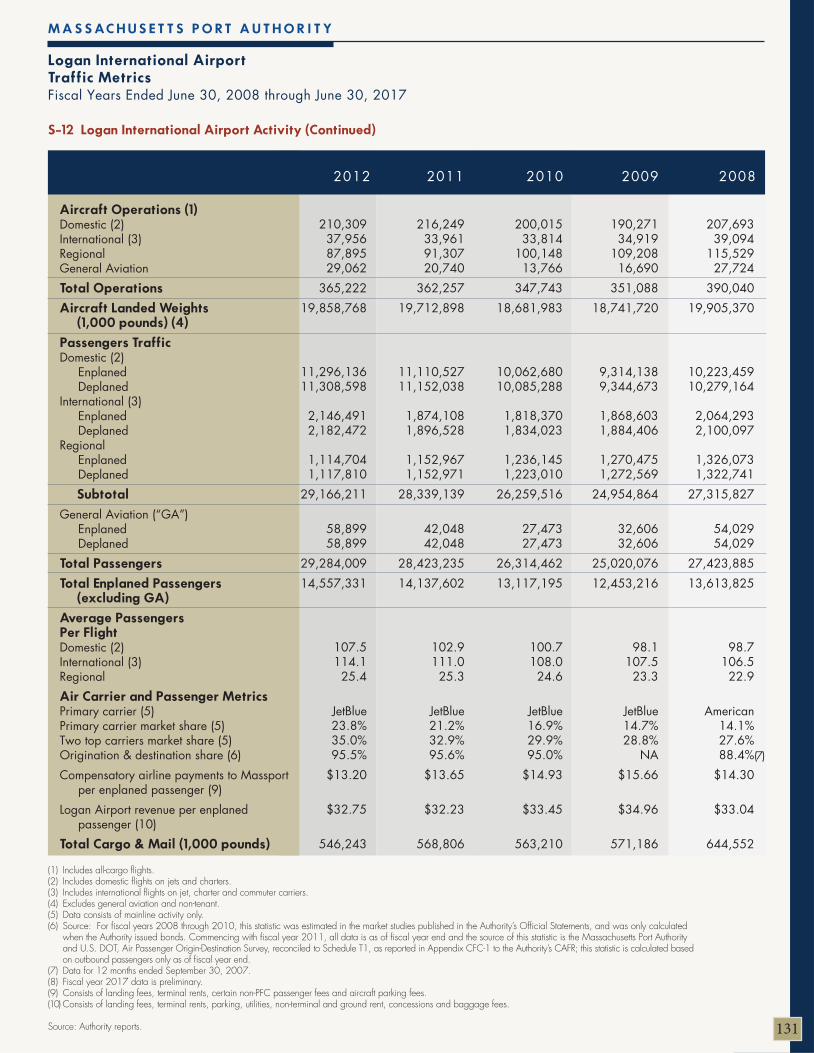
131
(1) Includes all-cargo flights.(2) Includes domestic flights on jets and charters.(3) Includes international flights on jet, charter and commuter carriers.(4) Excludes general aviation and non-tenant.(5) Data consists of mainline activity only.(6) Source: For fiscal years 2008 through 2010, this statistic was estimated in the market studies published in the Authority’s Official Statements, and was only calculated when the Authority issued bonds. Commencing with fiscal year 2011, all data is as of fiscal year end and the source of this statistic is the Massachusetts Port Authority and U.S. DOT, Air Passenger Origin-Destination Survey, reconciled to Schedule T1, as reported in Appendix CFC-1 to the Authority’s CAFR; this statistic is calculated based on outbound passengers only as of fiscal year end.(7) Data for 12 months ended September 30, 2007.(8) Fiscal year 2017 data is preliminary.(9) Consists of landing fees, terminal rents, certain non-PFC passenger fees and aircraft parking fees.(10) Consists of landing fees, terminal rents, parking, utilities, non-terminal and ground rent, concessions and baggage fees.
Source: Authority reports.
210,309 37,956 87,895 29,062
365,222
19,858,768
11,296,136 11,308,598
2,146,491 2,182,472
1,114,704 1,117,810
29,166,211
58,899 58,899
29,284,009
14,557,331
107.5114.1
25.4
JetBlue 23.8%35.0%95.5%
$13.20
$32.75
546,243
216,249 33,961 91,307 20,740
362,257
19,712,898
11,110,527 11,152,038
1,874,108 1,896,528
1,152,967 1,152,971
28,339,139
42,048 42,048
28,423,235
14,137,602
102.9111.0
25.3
JetBlue 21.2%32.9%95.6%
$13.65
$32.23
568,806
200,015 33,814
100,148 13,766
347,743
18,681,983
10,062,680 10,085,288
1,818,370 1,834,023
1,236,145 1,223,010
26,259,516
27,473 27,473
26,314,462
13,117,195
100.7108.0
24.6
JetBlue 16.9%29.9%95.0%
$14.93
$33.45
563,210
190,271 34,919
109,208 16,690
351,088
18,741,720
9,314,138 9,344,673
1,868,603 1,884,406
1,270,475 1,272,569
24,954,864
32,606 32,606
25,020,076
12,453,216
98.1107.5
23.3
JetBlue 14.7%28.8%
NA
$15.66
$34.96
571,186
207,693 39,094
115,529 27,724
390,040
19,905,370
10,223,459 10,279,164
2,064,293 2,100,097
1,326,073 1,322,741
27,315,827
54,029 54,029
27,423,885
13,613,825
98.7106.5
22.9
American 14.1%27.6%88.4%
$14.30
$33.04
644,552
Aircraft Operations (1)Domestic (2)International (3)Regional General Aviation
Total OperationsAircraft Landed Weights (1,000 pounds) (4)Passengers TrafficDomestic (2) Enplaned DeplanedInternational (3) Enplaned DeplanedRegional Enplaned Deplaned
SubtotalGeneral Aviation (“GA”) Enplaned Deplaned
Total PassengersTotal Enplaned Passengers (excluding GA)Average Passengers Per FlightDomestic (2)International (3)Regional
Air Carrier and Passenger MetricsPrimary carrier (5)Primary carrier market share (5)Two top carriers market share (5)Origination & destination share (6)
Compensatory airline payments to Massport per enplaned passenger (9)
Logan Airport revenue per enplaned passenger (10)
Total Cargo & Mail (1,000 pounds)
2012 2011 2010 2009 2008
M A S S AC H U S E T T S P O RT A U T H O R I T Y
Logan International Airport Traffic Metrics Fiscal Years Ended June 30, 2008 through June 30, 2017
S-12 Logan International Airport Activity (Continued)
(7)

132
10,174,855 6,396,446 5,408,394 4,514,749 3,797,446 3,064,506 2,357,878 1,756,077
37,470,351
27.2%17.1%14.4%12.0%10.1%
8.2%6.3%4.7%
100.0%
3,698,108 7,420,125 2,659,305 4,611,250 3,680,049 1,499,008
973,466 2,882,574
27,423,885
13.5%27.1%
9.7%16.8%13.4%
5.5%3.5%
10.5%
100.0%
JetBlue Airways Corp.American Airlines, Inc. (2)Foreign FlagDelta Air Lines, Inc. (3)United Air Lines, Inc. (4)Southwest Airlines Co. (5)OthersRegional Carriers (6)
Total
(1) For purposes of comparison, data for consolidated air carriers (American, Delta, Southwest and United) is presented for all fiscal years. In the case of each such consolidated air carrier, the data provided for each period occurring prior to the consolidation is estimated based on a summation of the individual carrier information for such period. The data provided for period(s) occurring after the consolidation reflects actual data for such period(s). To the extent individual merged carrierscontinue to operate separately, individual carrier information is also shown for the periods occurring post-merger, which information may not add to the consolidated figure.(2) In December 2013, American merged with US Airways, and effective October 1, 2015, the two airlines were fully integrated under the American name.(3) In January 2010, Northwest Airlines merged into Delta and discontinued service as an independent entity. (4) In March 2012, Continental merged into United and discontinued service as an independent entity. (5) In May 2011, Southwest merged with Air Tran Airways, and effective January 1, 2015, the two airlines were fully integrated under the Southwest name. Southwest Airlines commenced service at Logan Airport in August 2009. (6) Includes PenAir, Cape Air, American Eagle (through November 2011), US Airways Shuttle, Delta Shuttle, United Express, Continental Express and associated regional carriers. These figures for passengers traveling on U.S. flag regional carriers include passengers traveling internationally. (7) Includes Alaska Airlines, Spirit Airlines, Sun Country, Virgin America and chartered/non-scheduled domestic service. (8) Includes General Aviation figures. Source: Authority reports.
AIR CARRIER (1) % PASSENGER %
M A S S AC H U S E T T S P O RT A U T H O R I T Y
Logan International Airport Market Share of Total Passenger Traffic Current Year and Nine Years Ago
S-13 Passenger Traffic Market Shares
PASSENGERFISCAL YEAR 2017 FISCAL YEAR 2008
17.1% - -
12.0% - -
27.2%8.2%
- -
10.1% - -
14.4%4.7%6.3%
100.0%
19.4% 14.2
5.2 11.5%
- -
26.5%8.1%
- -
10.3% - -
13.0%5.5%5.7%
100.0%
20.3%9.4
10.9 12.3%
- -
26.9%7.6%
7.3 0.3
10.2% - -
12.0%5.6%5.1%
100.0%
21.0%10.011.0
10.8% - -
26.5%8.2%
1.96.3
11.2% - -
10.9%6.6%4.7%
100.0%
21.7%10.8 10.9
10.7% - -
26.2%8.1%2.9 5.2
11.3% - -
10.3%7.1%4.5%
100.0%
American (2) American US Airways Delta Air Lines (3) Delta Northwest AirlinesJetBlue AirwaysSouthwest (5) AirTran Airways Southwest United Airlines (4) Continental Airlines UnitedForeign FlagRegional U.S. Carriers (6)Other U.S. Carriers (7)
Total (8)
2017 2016 2015 2014 2013AIR CARRIER (1)

S TAT I S T I C A L
133
(1) For purposes of comparison, data for consolidated air carriers (American, Delta, Southwest and United) is presented for all fiscal years. In the case of each such consolidated air carrier, the data provided for each period occurring prior to the consolidation is estimated based on a summation of the individual carrier information for such period. The data provided for period(s) occurring after the consolidation reflects actual data for such period(s). To the extent individual merged carrierscontinue to operate separately, individual carrier information is also shown for the periods occurring post-merger, which information may not add to the consolidated figure.
(2) In December 2013, American merged with US Airways, and effective October 1, 2015, the two airlines were fully integrated under the American name.(3) In January 2010, Northwest Airlines merged into Delta and discontinued service as an independent entity. (4) In March 2012, Continental merged into United and discontinued service as an independent entity. (5) In May 2011, Southwest merged with Air Tran Airways, and effective January 1, 2015, the two airlines were
fully integrated under the Southwest name. Southwest Airlines commenced service at Logan Airport in August 2009. (6) Includes PenAir, Cape Air, American Eagle (through November 2011), US Airways Shuttle, Delta Shuttle, United Express,
Continental Express and associated regional carriers. These figures for passengers traveling on U.S. flag regional carriers include passengers traveling internationally.
(7) Includes Alaska Airlines, Spirit Airlines, Sun Country, Virgin America and chartered/non-scheduled domestic service. (8) Includes General Aviation figures.
Source: Authority reports.
M A S S AC H U S E T T S P O RT A U T H O R I T Y
Logan International Airport Market Share of Total Passenger Traffic Current Year and Nine Years Ago
S-13 Passenger Traffic Market Shares (Continued)
21.9%10.7 11.2 11.1%
- -
23.8%9.4%
3.9 5.5
11.6% 2.6 9.0
9.6%7.3%5.3%
100.0%
22.4%11.3 11.1
11.7% - -
21.2%10.2%
4.4 5.8
11.7%3.8 7.9
9.4%8.3%5.2%
100.0%
25.3%13.6 11.7
10.5% - -
16.3%5.5%
5.1 0.4
12.6%4.0 8.6
9.6%9.7%
10.5%
100.0%
26.7%14.1 12.6
15.9%11.0
4.9 14.7%4.9%
4.9 -
13.6%4.5 9.1
10.4%10.9%2.9%
100.0%
27.1%14.1 12.9
16.8%11.8
5.0 13.5%5.5% 5.5
- 13.4%
4.5 8.9
9.7%10.5%3.5%
100.0%
American (2) American US Airways Delta Air Lines (3) Delta Northwest AirlinesJetBlue AirwaysSouthwest (5) AirTran Airways Southwest United Airlines (4) Continental Airlines UnitedForeign FlagRegional U.S. Carriers (6)Other U.S. Carriers (7)
Total (8)
2012 2011 2010 2009 2008AIR CARRIER (1)
LOGAN INTERNATIONAL AIRPORT MARKET SHARE (1) TOTAL PASSENGER TRAFFIC: FY17 VS FY08
Regional U.S. Carriers
Other U.S. Carriers
Southwest
United
Delta
Foreign Flag
American
JetBlue
FY17 FY08

134
M A S S AC H U S E T T S P O RT A U T H O R I T Y
Logan International Airport
BOSTON LOGAN HAS NONSTOP DOMESTIC SERVICE TO 75 DESTINATIONS

S TAT I S T I C A L
135
5.9%5.6%5.5%5.2%5.2%3.5%3.3%3.1%2.9%2.8%2.7%2.6%2.1%2.1%2.0%1.9%1.9%1.9%1.9%1.9%
63.7%
123456789
1011121314151617181920
6214357
101298
111523201917132114
Chicago, IL (ORD, MDW) (1)Washington DC (IAD, DCA) (2)New York Area (JFK, LGA, EWR) (3)SFO : San Francisco, CALAX : Los Angeles, CAMCO : Orlando, FLATL : Atlanta, GABWI : Baltimore, MDDallas/Fort Worth, TX (DFW & DAL) (4)PHL : Philadelphia, PAFLL : Fort Lauderdale, FLDEN : Denver, CORSW : Fort Myers, FLHouston, TX (IAH & HOU) (5)SEA : Seattle, WARDU : Raleigh/Durham, NCMSP : Minneapolis/St. Paul, MN TPA : Tampa, FLMIA : Miami, FLLAS : Las Vegas, NV
Total for Cities Listed
(1) Includes Chicago O’Hare Airport and Midway Airport.(2) Includes Dulles Airport & National Airport. (3) Includes JFK, La Guardia and Newark Liberty International Airports.(4) Includes Dallas/Fort Worth Airport and Dallas Love Field Airport.(5) Includes Houston Intercontinental Airport and Houston Hobby Airport.
Source: DiiO: USDOT, O&D Survey.
CALENDAR2016 RANK
CALENDAR2007 RANK
M A S S AC H U S E T T S P O RT A U T H O R I T Y
Logan International Airport Passenger Markets Calendar Year 2016 and Nine Years Ago
S-14 Logan International Airport - Passenger Markets
The following table shows the percentage of passengers traveling on U.S. air carrier airlines to orfrom the Airport and other final domestic destinations for calendar year 2016, as reported by the United States Department of Transportation. International passengers are not included. It also shows the comparative ranking of the top 20 domestic destinations for the same period and for calendar year 2007.
MARKETCALENDAR
2016 PERCENTAGE

145,540
351,914
48,983
110,480
140,967
289,076
59,740
110,673
125,809
330,535
57,522
155,415
116,800
338,442
57,662
182,714
110,163
369,428
46,116
121,890
Containers (1)
CruisePassengers
Automobiles (2)
Bulk Tonnage
2017PORT ACTIVITY 2016 2015 2014 2013
(1) Does not include over-the-road volumes.(2) Does not include vehicles entered by over-the-road means.
Source: Authority reports.
M A S S AC H U S E T T S P O RT A U T H O R I T Y
Port of Boston Cargo and Passenger Activity Fiscal Years Ended June 30, 2008 through June 30, 2017
S-15 Port of Boston Cargo and Passenger Activity
136
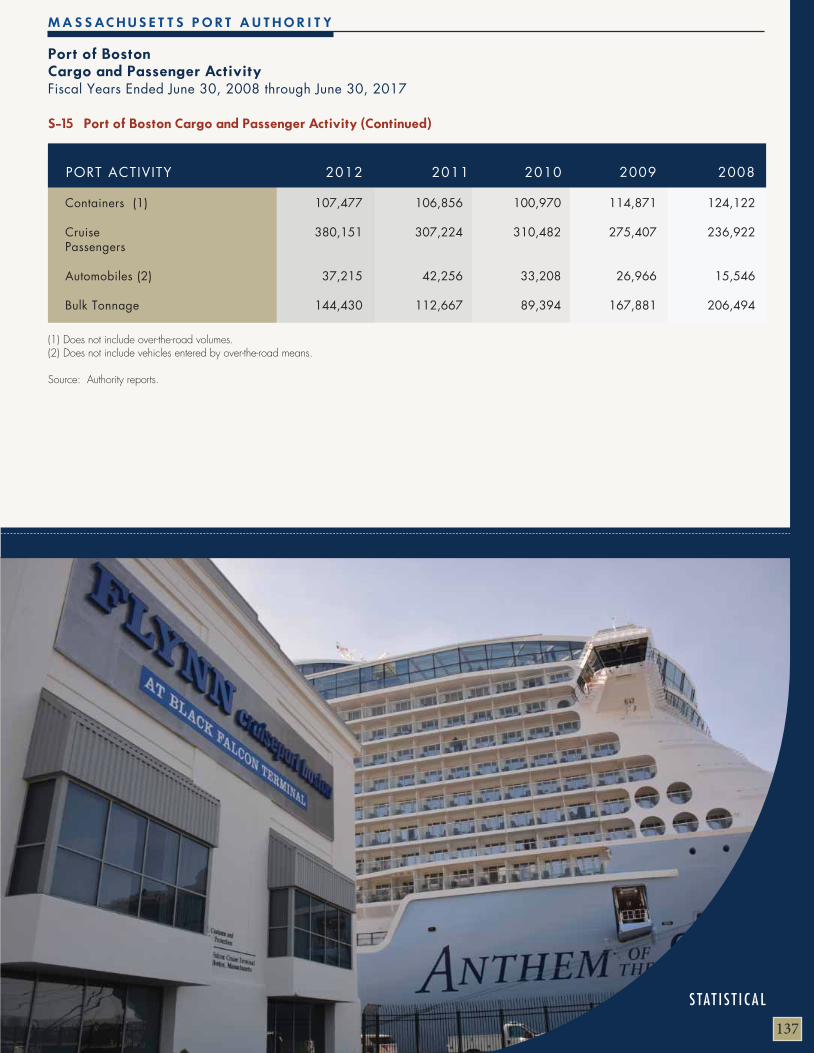
S TAT I S T I C A L
137
107,477
380,151
37,215
144,430
106,856
307,224
42,256
112,667
100,970
310,482
33,208
89,394
114,871
275,407
26,966
167,881
124,122
236,922
15,546
206,494
Containers (1)
CruisePassengers
Automobiles (2)
Bulk Tonnage
(1) Does not include over-the-road volumes.(2) Does not include vehicles entered by over-the-road means.
Source: Authority reports.
M A S S AC H U S E T T S P O RT A U T H O R I T Y
Port of Boston Cargo and Passenger Activity Fiscal Years Ended June 30, 2008 through June 30, 2017
S-15 Port of Boston Cargo and Passenger Activity (Continued)
PORT ACTIVITY 2012 2011 2010 2009 2008


139
M A S S AC H U S E T T S P O RT A U T H O R I T Y
Port of Boston Principal CustomersCurrent Year and Nine Years Ago
S-16 Port of Boston Principal Customers
DIRECT SERVICE SHIPPING LINES CRUISE LINESLARGE CUSTOMS HOUSE BROKERS
Fiscal Year 2017
APLChina Ocean Shipping Co.CMA CGMEvergreen AmericaHapag LloydK-Line MaerskMediterranean Shipping Corp.Mitsui O.S.K. LineNYK Line OOCLYang Ming Line
APLChina Ocean Shipping Co.CMA CGMEvergreen AmericaHapag LloydK-Line MaerskMediterranean Shipping Corp.Mitsui O.S.K. LineNYK Line OOCLSafmarineYang Ming Line
AidaCarnival Cruise LineCelebrityCrystalCunardHapag LloydHolland AmericanNorwegian Cruise LineOceaniaP&OPhoenix ReisenPonantPrincessRegentRoyal CaribbeanSeabournSilverseaTUIViking
A.N. DeringerAlbatrans, Inc.BDP International, Inc.C.H. Powell CompanyDB SchenkerDHL ForwardingDolliff & Company, Inc.Dynasty International, Inc.EGL Eagle Global LogisticsExel Global LogisticsExpeditors Int’lFedex Trade NetworksHellmann Worldwide Logistics, Inc.J.F. Moran Co., Inc.Kuehne & Nagel, Inc.Liberty InternationalMagic Customs Brokers, Inc.OceanAir, IncPanalpina, Inc.Savino Del Bene, Inc.SDV (USA)UPS Supply Chain SolutionsVandegrift Intl.
DIRECT SERVICE SHIPPING LINES CRUISE LINESLARGE CUSTOMS HOUSE BROKERS
Fiscal Year 2008
China Ocean Shipping Co.CMA-CGMColumbia Coastal TransportEimskipHanjin Shipping K-Line Mediterranean Shipping Corp.Yang Ming Line
China Ocean Shipping CoChilean LineCMA-CGMEimskipEvergreenHanjinHapag LloydHatsuK LineMaerskMeditteranean Shipping Co.NYK LineOOCLSafmarineYang MingZim Line
CarnivalCrystal CruisesCunardHapag LloydHolland AmericaNorwegian Cruise LineP&OPhoenix SeereisenPrincess LineRoyal CaribbeanSaga HolidaysSilversea Cruise
A.N. DeringerAlbatrans, Inc.BDP International, Inc.Boston Bay Brokers Inc.C.H. Powell CompanyDHL DanzasDolliff & Company, Inc.Dynasty International, Inc.EGL Eagle Global LogisticsExpeditors Int’lFedex Trade NetworksHellmann Worldwide Logistics, Inc.J.F. Moran Co., Inc.Kuehne & Nagel, Inc.Liberty InternationalMagic Customs Brokers, Inc.OceanAir, IncPanalpina, Inc.Savino Del Bene, Inc.Schenker International, Inc.UPS Supply Chain Solutions
Source: Authority reports.

140
M A S S AC H U S E T T S P O RT A U T H O R I T Y
Tobin Memorial BridgeFiscal Years Ended June 30, 2005 through June 30, 2010
S-17 Bridge Statistics (In-Bound)
Tobin Bridge TollClass 1 - Passenger vehicles
Class 1 Passenger
Resident: Vehicles with Resident Discount
Total Passenger Vehicles
Class 2 - 6 Commercial
Total Paying Vehicles
Massachusetts Bay Transportation Authority (MBTA)
Other Non-Revenue Vehicles
Total Non-Paying Vehicles
Total Vehicles
2010
$3.00
4,498,957
400,356
4,899,313
458,740
5,358,053
34,547
27,468
62,015
5,420,068
2009
$3.00
8,526,559
739,921
9,266,480
901,558
10,168,038
70,609
56,729
127,338
10,295,376
2008
$3.00
8,988,012
702,354
9,690,366
979,516
10,669,882
74,289
48,012
122,301
10,792,183
2007
$3.00
9,203,180
655,520
9,858,700
1,031,598
10,890,298
68,143
39,463
107,606
10,997,904
2006
$3.00
8,384,939
695,357
9,080,296
862,845
9,943,141
54,460
44,039
98,499
10,041,640
2005
$3.00
8,164,954
648,510
8,813,464
796,425
9,609,889
48,231
65,093
113,324
9,723,213
(1) Six months data only, effective 1/1/2010, Tobin Bridge was transferred to MassDOT pursuant to the Transportation Reform Act.
Source: Authority reports.
(1)

S TAT I S T I C A L
141
M A S S AC H U S E T T S P O RT A U T H O R I T Y
Insurance CoverageFiscal Year Ended June 30, 2017
S-18 Insurance Coverage
Lockton/AIG
HUB International/CNA
Aon /Chubb
Marsh/Berkley
Knapp, Schenck/Hanover
HUB International/AIG
Braley & Wellington/Hartford Insurance Company
Braley & Wellington/Hartford Insurance Company
Braley & WellingtonAmerican Casualty Company
Braley & WellingtonWestern Surety Company
$1,000,000,000
Agreed Value
$500,000,000
$100,000,000
$5,000,000
Statutory
$3,000,000
$1,000,000
$50,000
$100,000
PROPERTY INSURANCE
All Risk Property Insurance includingBoiler & Mach., Contractor’s Equip. & Bus. Int. & Terrorism
Hull Insurance - Including Terrorism
LIABILITY INSURANCE
Aviation General LiabilityWar Risk CoveragePrimary and Excess
Marine LiabilityTerminal Operator’s LiabilityProtection & IndemnityIncluding Port & Stevedore LiabilityPrimary and Excess Including Terrorism
Automobile LiabilityPrimary & ExcessComprehensive & Collision Deductible
WORKERS’ COMPENSATION
Excess Workers’ Compensation
OTHER COVERAGE
Crime, DishonestyBurglary and Robbery
Secretary-Treasurer’s Bond
Customs Bond
Marine Terminal Operator’s Bond
BROKER / UNDERWRITER LIMITSPOLICY 7/01/16 - 6/30/2017
$250,000
$1,000 - $50,000
$250,000
$25,000
$1,000
$1,000,000
$10,000-$100,000
$0
$0
$0
RETENTION / UNDERLYING
Source: Authority reports.

142Source: Authority reports.
2017
M A S S AC H U S E T T S P O RT A U T H O R I T Y
Physical Asset DataFiscal Year Ended June 30, 2017
Logan AirportArea of Airport (acres - approximate)
RunwaysRunway 15R/33L (length in feet)Runway 4R/22L (length in feet)Runway 4L/22R (length in feet)Runway 9/27 (length in feet)Runway 15L/33R (length in feet)Runway 14/32 (length in feet)
Terminal BuildingsTerminal A (number of jet contact gates)Terminal B (number of jet contact gates)Terminal C (number of jet contact gates)Terminal E (number of jet contact gates)
ParkingNumber of commercial and employee parking spaces
Cargo Facilities (square feet)
Hanscom FieldArea of Airport (acres - approximate)
RunwaysRunway 11/29 (length in feet)Runway 5/23 (length in feet)
Worcester Regional Airport Area of Airport (acres - approximate)
RunwaysRunway 11/29 (length in feet)Runway 15/33 (length in feet)
Port of Boston
Conley Terminal (101 acres)Berth 11 (length in feet)Berth 12 (length in feet)Berth 14 (length in feet)Berth 15 (length in feet)
Moran Terminal (64 acres)Berth 1 (length in feet)
Black Falcon Terminal10 berths (length in feet (each))
Commercial Real Estate (approximate acres)
2,411
10,083 10,005
7,860 7,000 2,557 5,000
21 37 27 12
21,088
274,627
1,302
7,011 5,107
1,330
7,000 5,000
1,000 1,000
500 500
1,000
500
90.5
S-19 List of Certain Physical Asset Characteristics

Annual DisclosureS o u t h B o s t o n W a t e r f r o n t T r a n s p o r t a t i o n C e n t e r
The “Topping Off” Ceremony was a construction milestone for the South Boston
Waterfront Transportation Center (SBWTC). Scheduled to open in mid-2018,
the center will have 1,500 parking spaces, indoor bicycle racks, and covered
walkways to the MBTA Silver Line. The SBWTC is located adjacent to the Boston
Convention & Exhibition Center and the Omni Hotel currently under construction.


ANNUAL D I SCLOSURE
Of The Massachuset ts Port Author i ty For F i s ca l Year 2017
A N N U A L F I N A N C I A L I N F O R M AT I O N A N D O P E R AT I N G D ATA
STATEMENT OF THE 1978 TRUST AGREEMENT
INTRODUCTIONThis Statement of Annual Financial Information and Operating Data dated as of November 28, 2017 (the “Annual Disclosure Statement”) of the Massachusetts Port Authority (the “Authority”) is prepared and submitted in accor-dance with the requirements of the Continuing Disclosure Agreement, dated as of August 1, 1997 (the “Continuing Disclosure Agreement”), between the Authority and U.S. Bank National Association (successor-in-interest to State Street Bank and Trust Company), as trustee (the “Trustee”). Set forth below is certain financial information and operating data relating to the Authority for the fiscal year ended June 30, 2017 (“fiscal year 2017”) updating the financial information and operating data presented in the Authority’s Statement of Annual Financial Information and Operating Data dated as of November 22, 2016 (the “2016 Annual Disclosure Statement”). Capitalized terms not otherwise defined herein shall have the meanings ascribed to such terms in the Authority’s Official Statement dated July 12, 2017 (the “2017 Official Statement”). This Annual Disclosure Statement is part of the Authority’s Comprehensive Annual Financial Report dated November 28, 2017 (the “CAFR”) for fiscal year 2017 and the remaining sections of the CAFR are incorporated herein by reference. The Authority’s audited financial statements for fiscal year 2017 and comparative information for fiscal year 2016, prepared in accordance with accounting principles generally accepted in the United States of America (“GAAP”), with a report thereon by Ernst & Young LLP, independent auditors, are also included in the financial section of the CAFR. The 2017 Official Statement and the 2016 Annual Disclosure Statement are each on file with the Municipal Securities Rulemaking Board (“MSRB”). For a more complete description of the Authority and the Bonds, reference is made to the 2017 Official Statement.
This Annual Disclosure Statement applies to the following Series of Bonds issued by the Authority and outstanding at June 30, 2017 (collectively, the “Bonds”):
Massachusetts Port Authority Revenue Refunding Bonds, Series 2016-A (Non-AMT)Massachusetts Port Authority Revenue Bonds, Series 2016-B (AMT)Massachusetts Port Authority Revenue Bonds, Series 2015-A (Non-AMT)Massachusetts Port Authority Revenue Bonds, Series 2015-B (AMT)Massachusetts Port Authority Revenue Refunding Bonds, Series 2015-C (Non-AMT)Massachusetts Port Authority Revenue Bonds, Series 2014-A (Non-AMT)Massachusetts Port Authority Revenue Bonds, Series 2014-B (AMT)Massachusetts Port Authority Revenue Refunding Bonds, Series 2014-C (Non-AMT)Massachusetts Port Authority Revenue Bonds, Series 2012-A (AMT)Massachusetts Port Authority Revenue Refunding Bonds, Series 2012-B (Non-AMT)Massachusetts Port Authority Revenue Bonds, Series 2010-A (Non-AMT)Massachusetts Port Authority Revenue Refunding Bonds, Series 2010-B (Non-AMT)Massachusetts Port Authority Revenue Refunding Bonds, Series 2010-C (AMT)Massachusetts Port Authority Multi-Modal Revenue Refunding Bonds, Series 2010-D (AMT)Massachusetts Port Authority Revenue Refunding Bonds, Series 2008-C (Non-AMT)Massachusetts Port Authority Revenue Bonds, Series 2007-A (Non-AMT)Massachusetts Port Authority Revenue Refunding Bonds, Series 2007-C (AMT)
145

146
As of June 30, 2017, the Authority had issued and outstanding 17 series of bonds pursuant to the Trust Agreement dated as of August 1, 1978, as supplemented and amended (the “1978 Trust Agreement”) between the Authority and the Trustee. Please see Note 5 of the Authority’s Financial Statements as of June 30, 2017 for more detailed information.
On July 19, 2017, the Authority issued $169.5 million of Massachusetts Port Authority Revenue Bonds, Series 2017-A, which were issued with an original issue premium of approximately $27.2 million and 5.0% coupon rates. The proceeds were used to finance a portion of the Authority’s FY17-FY21 Capital Program, including partial funding of Terminal B Optimization, full funding of Terminal E West Substation, full funding of Customs and Border Protection Improvements (Terminal E) and partial funding of Terminal C to E Lower Level Interior Renovations. In addi-tion, a portion of the proceeds were used to refund all of the outstanding Series 2007-C Revenue Refunding Bonds and Series 2010-D Multi-Modal Revenue Refunding Bonds on a current basis.
The Authority has issued six series of its Subordinated Revenue Bonds, outstanding in the aggregate principal amount of $74.0 million as of June 30, 2017 (collectively, the “Subordinated Revenue Bonds”). The Subordinated Revenue Bonds are payable solely from amounts on deposit in the Improvement and Extension Fund established under the 1978 Trust Agreement and in a separate account not subject to the pledge of the 1978 Trust Agreement. The Subordinated Revenue Bonds are subordinate to all of the revenue bonds issued prior to the date hereof by the Authority pursuant to the 1978 Trust Agreement.
As of June 30, 2017, the Authority had two outstanding series of PFC Revenue Bonds (collectively, the “PFC Bonds”) issued pursuant to a PFC Revenue Bond Trust Agreement dated as of May 6, 1999, as supplemented and amended (the “PFC Trust Agreement”), between the Authority and The Bank of New York Mellon, as trustee. Please see Note 5 of the Authority’s financial statements as of June 30, 2017 for more detailed information. All of the PFC Bonds matured on July 1, 2017, and accordingly, the Authority is no longer including as part of the CAFR the Statement of PFC Annual Financial Information and Operating Data with respect to the PFC Bonds.
As of June 30, 2017, the Authority has two outstanding series of CFC Revenue Bonds (collectively, the “CFC Bonds”) issued pursuant to a Trust Agreement dated May 18, 2011 (the “CFC Trust Agreement”) between the Authority and U.S. Bank National Association (the “CFC Trustee”). The CFC Bonds were issued for the purpose of providing funds sufficient, together with other available funds, to finance the design and construction of a new consolidated rental car facility and related improvements at Logan Airport, fund certain deposits to the debt service reserve and supplemental reserve funds for the CFC Bonds, and pay certain costs of issuance of the CFC Bonds. Please see Note 5 of the Authority’s financial statements as of June 30, 2017 for more detailed information. Pursu-ant to the Continuing Disclosure Certificate dated as of June 15, 2011 (the “CFC Disclosure Certificate”) delivered by the Authority, the Authority is also including as part of the CAFR its Statement of Annual Financial Information and Operating Data for fiscal year 2017 (the “2017 CFC Disclosure Statement”) with respect to the CFC Bonds.
As of June 30, 2017, the Authority had one outstanding series of BOSFUEL Project Special Facilities Revenue Bonds (the “2007 BOSFUEL Bonds”). The 2007 BOSFUEL Bonds were issued to finance the design and construc-tion of improvements to the integrated jet fuel storage and distribution system at Logan Airport and to currently refund the previously issued 1997 BOSFUEL Bonds. The 2007 BOSFUEL Bonds are not subject to the Authority’s Continuing Disclosure Agreement or the CFC Disclosure Certificate.
The Authority has issued and outstanding three series of special facilities bonds, including the above referenced 2007 BOSFUEL Bonds, in the aggregate principal amount of $529.4 million as of June 30, 2017 (collectively, the “Special Facilities Bonds”). The principal of and interest on the Special Facilities Bonds issued by the Author-ity are special obligations of the Authority, payable solely from the sources provided; none of such Special Facil-ities Bonds are secured by the Revenues of the Authority. Each Special Facility Bond issue is secured differently and under a separate trust agreement.

ANNUAL D I SCLOSURE
147
The Authority is under no obligation to assume the liability for any of the outstanding Special Facilities Bonds or to direct revenue, other than a portion of the Terminal A rental revenues, which are pledged to pay debt service on the special facilities revenue bonds relating to certain Terminal A improvements (the “Terminal A Bonds”). The portion of Terminal A rental revenues pledged to pay debt service on the Terminal A Bonds is calculated based on a formula set forth in the trust agreement governing such debt and the Authority’s lease with Delta Airlines. The portion of Terminal A rental revenues pledged to pay debt service on the Terminal A Bonds is not included in Revenues or Net Revenues of the Authority. In addition, the Authority has received FAA approval to use PFCs to pay a portion of the debt service on the Terminal A Bonds allocable to the public space within Terminal A and applies approximately $12.0 million per year of PFCs for such purpose. For additional information concerning the Authority, please see the Authority’s website, www.massport.com. Financial information can be found in the Financial Publications section of the Authority’s website at http://www.massport.com/massport/finance/financial-publications. Copies of the Annual Statements prepared pursuant to Rule 15c2-12 with respect to the Authority’s bonds issued under the 1978 Trust Agreement, the PFC Trust Agreement and the CFC Trust Agreement for years prior to fiscal year 2017 are available at http://www.emma.msrb.org and from the Authority. The Authority’s principal office is located at One Harborside Drive, Suite 200S, East Boston, Massachusetts 02128. Its telephone number is (617) 568-5000. Questions may be directed to John P. Pranckevicius, CPA, the Authority’s Director of Administration and Finance and Secretary-Treasurer.
Annual Disclosure StatementThis Annual Disclosure Statement is of limited scope. It contains only an updating of certain financial information and operating data described below. Except as expressly noted, all information presented in this Annual Disclosure Statement is on the basis required under the 1978 Trust Agreement, and not on the basis of GAAP. For a comparison of the Authority’s financial results under the 1978 Trust Agreement and GAAP, please refer to Table S-4 (Conversion of GAAP Revenues and Expenses to 1978 Trust Agreement Revenues and Expenses) set forth in the statistical section of the CAFR or to Exhibit I at the end of this section. The information set forth herein does not contain all material information concerning the Bonds or the Authority necessary to make an informed investment decision. This Annual Disclosure Statement does not constitute an offer to sell or the solicitation of an offer to buy the Bonds.
This Annual Disclosure Statement is submitted pursuant to the Continuing Disclosure Agreement. The intent of the Authority’s undertaking under the Continuing Disclosure Agreement is to provide on a continuing basis for the bene-fit of the owners of the Bonds and any other bonds of the Authority that are designated by resolution of the Author-ity as subject to and having the benefits of the Continuing Disclosure Agreement the information described in Rule 15c2-12 (the “Rule”) promulgated by the Securities and Exchange Commission (the “SEC”) under the Securities Exchange Act of 1934. Pursuant to the Continuing Disclosure Agreement, the Authority has agreed with respect to the Bonds to provide, or cause to be provided, certain annual financial information and operating data, prepared on the basis of the 1978 Trust Agreement, and notices of certain listed events. The Authority reserves the right to modify the disclosure required under the Continuing Disclosure Agreement, or the format of such disclosure, so long as any such modification is permitted by the Rule.
The purpose of the Authority’s undertaking is to conform to the requirements of the Rule and not to create new contractual or other rights for the Trustee or for the underwriters of the Bonds, any registered owner or beneficial owner of Bonds, any municipal securities broker or dealer, any potential purchaser of the Bonds, the SEC, or any other person. The sole remedy in the event of any actual or alleged failure by the Authority to comply with any provision of the Continuing Disclosure Agreement shall be an action for the specific performance of the Authority’s obligations thereunder and not for money damages in any amount. Any failure by the Authority to comply with any provision of such undertaking shall not constitute an event of default under the 1978 Trust Agreement or any other instrument relating to the Bonds.

148
Updated Operating Information
Airport PropertiesBoston-Logan International Airport (“Logan Airport”) continues to be the principal source of the Authority’s Revenues, Net Revenues and net income, and is the dominant factor in the determination of the Authority’s financial condition. In fiscal year 2017, Logan Airport accounted for 82.6% of the Authority’s Revenues and 93.1% of the Authority’s Net Revenues, as defined in the 1978 Trust Agreement. For additional information regarding activities at Logan Airport Properties during fiscal year 2017, please refer to Exhibits S-5, S-12, S-13 and S-14 presented in the statistical section of the CAFR. Exhibit S-12 summarizes Logan Airport traffic statistics for the ten most recent fiscal years.
Logan Airport plays a leading role in New England’s air service infrastructure. According to data from the Airports Council International (“ACI”), Logan Airport was the most active airport in New England the 18th most active airport in North America in calendar year 2016, based upon total passenger volume. In calendar year 2016, Logan Airport was the 53rd most active in the world according to data from the ACI. Enplaned plus de-planed passengers at Logan Airport for fiscal year 2017 totaled approximately 37.4 million passengers. This is a 7.4% increase from the 34.8 million passengers that used Logan Airport in fiscal year 2016.
The primary destinations of passengers using Logan Airport for calendar year 2016 were: 15.3% to Florida, 5.9% to Chicago, 5.6% to Washington, D.C. and 5.5% to the New York market, which includes traffic to LaGuardia, JFK and Newark. The proportion of domestic passengers traveling to the West Coast cities of California was 10.4%.
In fiscal year 2017, international passengers (including those traveling on foreign flag and regional carriers) accounted for 18.7% of passenger traffic, or approximately 7.0 million passengers. This is an increase of 15.9% or 961,040 international passengers over last year. The shares of international passengers at Logan Airport were 52.1% for Europe,15.5% for Bermuda and the Caribbean, 13.7% for Canada, 9.4% for the Middle East, 6.7% for Trans-Pacific and 2.6% for Central and South America. In fiscal year 2016, the top five international origin-destination markets were Cancun, Aruba, Santo Domingo, Punta Cana and London. The top five interna-tional direct routes by scheduled seats in fiscal year 2017 were London, Toronto, Dubai, Paris and Dublin. Inter-national passenger traffic grew by 15.9% and 15.1% in fiscal years 2017 and 2016, respectively.
In fiscal year 2017, regional airlines accounted for approximately 4.7% of total passenger traffic at Logan Airport, or approximately 1.8 million passengers. The number of regional passengers (excluding passengers traveling internationally) decreased by 8.4% in fiscal years 2017 because of mainline carriers changing fleet options from regional to jet service on select shuttle routes and reduction of regional fleet service overall. As of June 30, 2017, the top six regional airlines were Endeavor Air with 21.8% of domestic regional passengers, followed by Republic Airlines with 18.2%, GoJet with 12.7%, Shuttle America with 11.1% (merged with Republic effective February 1, 2017), Hyannis Air Service, Inc. with 10.7% and ExpressJet with 10.6% of domestic regional passengers.
During fiscal year 2017, five domestic low-cost carriers (“LCCs”) and ultra-low cost carriers (“ULCCs”) handled 39.9% of Logan Airport’s passengers – JetBlue Airways, Southwest Airlines, Spirit Airlines, Sun Country (MN Airlines) and Virgin America. In addition to these domestic LCCs, five foreign flag LCCs handled 1.5% of Logan Airport’s passengers – Air Berlin, Norwegian Air Shuttle, Thomas Cook, Westjet and WOW Air. As of June 30, 2017, these ten carriers scheduled 129 non-stop destinations. Logan Airport passenger traffic as a whole grew by 7.4% in fiscal year 2017 while passenger traffic for the LCCs and ULCCs serving Logan Airport grew 13.6%.
ANNUAL D I SCLOSURE
149
In fiscal year 2017, total combined cargo and mail volume was approximately 672.4 million pounds. The volume in fiscal year 2017 increased by 10.9% from fiscal year 2016. From fiscal year 2016 to fiscal year 2017, air car-go (small package/express and freight) increased by 11.3%. A large percentage of the total volume of air cargo for the period was attributable to integrated all-cargo companies and small package/express carriers, including Federal Express, United Parcel Service, Air Transport International, LLC, Atlas Air, ABX Air, Inc., and Mountain Air Cargo. Integrated carriers accounted for 54.9% and 56.6% of total domestic and international cargo volume in fiscal years 2017 and 2016, respectively.
Table S-5 set forth in the statistical section of the CAFR reflects Revenues and Operating Expenses for the ten most recent fiscal years, prepared in accordance with accounting principles required by the 1978 Trust Agreement. Information for each of the ten fiscal years is derived from the Authority’s financial statements for the respective fiscal years; note that in certain cases information from prior fiscal years has been conformed to comply with cur-rent GASB standards. Financial statements of the Authority for fiscal year 2017 and comparative data for fiscal year 2016, together with the report thereon of Ernst & Young LLP, independent auditors, are included in the CAFR.
Tables S-7 and S-8 of the CAFR shows the calculation of Annual Debt Service Coverage of the Authority, as provided under the 1978 Trust Agreement, which equals the ratio of the Net Revenues of the Authority divided by the Annual Debt Service. “Net Revenues” is defined in the 1978 Trust Agreement as the excess of Revenues over Operating Expenses; provided that for the purpose of the calculations, proceeds of passenger facility charges (“PFCs”) and customer facility charges (“CFCs”) have been excluded from Revenues because such proceeds have been excluded from Revenues under the 1978 Trust Agreement. PFCs are pledged to secure the PFC Bonds, if and to the extent any PFC Bonds are outstanding under the PFC Trust Agreement, and are required under federal law to be applied to certain FAA-authorized capital projects at the Airport. CFCs are pledged to secure the CFC Bonds, pursuant to the CFC Trust Agreement. Certain specific information pertaining to the CFC Bonds, as re-quired by the CFC Disclosure Certificate, is set forth in the separate 2017 CFC Disclosure Statement. As used in the tables, “Annual Debt Service” is equal to the “Principal and Interest Requirements” on Bonds (other than the Special Facilities Revenue Bonds) outstanding for the applicable fiscal year.
Prepared in Accordance with the 1978 Trust AgreementTotal Operating Revenues in fiscal year 2017 were $772.4 million compared to $705.1 million in fiscal year 2016, while Operating Expenses were $440.2 million in fiscal year 2017 compared to $412.0 million in fiscal year 2016, resulting in Net Revenues of $332.1 million and $293.1 million in fiscal year 2017 and fiscal year 2016, respectively. Logan Airport is the primary source of the Authority’s Revenues, Net Revenues and Operating Expenses. For a discussion of the differences between the accounting principles required by the 1978 Trust Agreement and GAAP, see Note 2 to the Financial Statements or Exhibit I at the end of this section. Revenues and Net Revenues do not include PFC revenues which are required under federal law to be applied to certain FAA authorized capital projects at the Airport and are not pledged for the benefit of holders of the Bonds, or CFC revenues, which are pledged as security for the CFC Bonds. Revenues and Net Revenues also do not include a portion of the Terminal A rental revenues collected by the Authority from air carriers, which amounts have been pledged to pay debt service on the Terminal A Bonds.
Selected Financial Data
Management’s Discussion Of Historical Operating Results

150
Airport PropertiesAirport Properties Net Revenues (Airport Properties Revenues less Airport Properties Operating Expenses) increased by $30.1 million or 11.1% from fiscal year 2016. The number of passengers using Logan Airport (excluding general aviation) in fiscal year 2017 was 7.4% higher than in fiscal year 2016. Landed weights were 6.1% high-er than the prior fiscal year. Logan Airport Parking revenues were 9.6% higher than such revenues in fiscal year 2016, due to the increased passenger traffic at Logan Airport and the $3.00 per day parking rate increase effec-tive July 1, 2016. Logan Airport generated approximately $638.2 million of Operating Revenues and incurred $328.9 million of Operating Expenses in fiscal year 2017 compared to $586.7 million of Operating Revenues and $307.4 million of Operating Expenses in fiscal year 2016. Operating revenue and expense figures for Logan Airport stated in this paragraph do not include certain items, particularly expense items, such as interest, depre-ciation and amortization, properly allocable to Logan Airport, that are excluded from the definition of operating expenses pursuant to the 1978 Trust Agreement.
Unlike many airport operators, the Authority is not constrained by contractual arrangements with the air carriers serving Logan Airport governing the incurrence of aeronautical costs and the recovery of such costs in the landing fee and terminal rentals fee. Instead, the landing fees and terminal rentals are set annually by the Authority on a compensatory basis to cover direct and allocated capital, administration, maintenance and operating costs. The Authority can also make adjustments during the year to the landing fee and to the terminal rental rates, if necessary. Accordingly, each October, the Authority establishes the landing fee per thousand pounds of landed weight and the rental rates for the terminals, based upon historical capital costs and projected landed weights and the budgeted direct and allocable indirect operating costs of providing these facilities for that fiscal year.
Landing Fees. Logan Airport generated $113.2 million in landing fee revenue in fiscal year 2017. This was a $8.7 million or 8.3% increase over the $104.5 million generated in fiscal year 2016. Logan Airport’s 2017 landing fee adjusted rate of $4.64 per thousand pounds was lower than the $4.78 per thousand pounds approved in 2016. Total landed weights in fiscal year 2017 was 24,040,957 pounds, an increase of 1,388,062 pounds compared to fiscal year 2016. The combination of a lower landing fee rate and the increase in landed weight resulted in the overall 8.3% increase in landing fee revenue during fiscal year 2017.
Parking Fees. Logan Airport parking revenues (including Logan Express) increased from $154.1 million in fiscal year 2016 to $168.9 million in fiscal year 2017. This increase is due to the increased passenger traffic at Logan Airport in fiscal year 2017 and the $3.00 per day Logan Airport parking rate increase effective July 1, 2016. The number of commercial parking spaces at Logan Airport is subject to a limitation imposed by the EPA.
Terminal Rentals. Each fiscal year, the Authority establishes terminal building rental rates and fees for all of the Terminals on a compensatory basis. All leases with air carriers for terminal space at the Airport currently provide that the Authority may revise rental rates periodically, at the discretion of the Authority, to recover the actual direct and indirect capital and operating costs for such leased space. The Authority resets these rates each fiscal year to recover its actual capital and budget operating costs. Similar to its policy regarding landing fees, the Authori-ty calculates the variance from the projections after the fiscal year ends, and the adjustment is invoiced to (in the case of a shortfall) or paid to (in the case of a surplus) the air carriers. The Authority’s practice, however, is that the Authority does not recover through its terminal rentals the cost allocable to unrented space. The Authority can also make adjustments during the year to the rates charged to air carriers for terminal usage.
The Authority exercises significant control over Terminal facilities at Logan Airport through the leasing arrangements it has entered into with the carriers operating at the Airport. The Authority uses a combination of short-term leas-es, preferential use provisions, recapture provisions and forced subletting provisions to allow it to allocate its gate resources effectively and accommodate new entrant carriers.

122
ANNUAL D I SCLOSURE
In general, the Authority prefers to lease space on a short term basis-either on a month-to-month or year-to-year basis. This provides the Authority the flexibility to allocate gates so that carriers will maximize usage of these facilities. The Authority also has adopted a preferential gate use policy applicable to all gates at Logan Airport. Under the conditions specified in the policy, the Authority may schedule arrivals and departures at a gate by carriers other than the tenant for any period that the tenant is not using the gate. The tenant carrier must permit the carrier being accommodated under the policy to use the facilities required for the functional use of the gate, and may assess reasonable fees for such use. If a tenant carrier fails to accommodate a carrier under the terms of the preferential use policy, then the Authority may convert the gate to a common use gate.
The table below reflects the Authority’s lease arrangements for contact gates at the Airport as of June 30, 2017. In addition to those listed below, one gate in Terminal C and all of the gates in Terminal E were common use gates as of such date. Effective December 15, 2015, the Authority’s lease with US Airways was assigned to American in connection with the merger of the two airlines and consolidation of operations under the American name.
* The Delta lease was entered into on July 1, 2006, with an original term of ten years. Effective as of July 1, 2016, the lease was amended to extend the term with automatic one-year extensions, until terminated by either party. Delta subleases one gate to WestJet.
** The United lease was entered into on May 1, 2014 with an original term of one year and automatic one-year extensions thereafter, until terminated by either party.
*** The JetBlue lease was entered into on March 18, 2005 with an effective date of May 1, 2005 and an original term of five years with 20 automatic one-year extensions thereafter, until terminated by either party.
† American subleases five gates to other airlines: three to Air Canada and two to the Authority. The Authority currently re-leases these two gates to United.
‡ JetBlue subleases one gate to Cape Air. It also allows Aer Lingus to operate out of three of its gates pursuant to a Facility Use Agreement and allows TAP to operate out of one of its gates pursuant to a Facility Use Agreement.
TERMINAL CARRIER # OF GATES
TERMINAL A
TERMINAL B
TERMINAL C
DELTASOUTHWESTAMERICAN
SPIRITUNITEDALASKA AIRLINESVIRGIN AMERICAJETBLUE
1657†13†7281124‡
84
1 YEARMONTHLY20 YEARS25 YEARSMONTHLYMONTHLY1 YEARMONTHLYMONTHLY1 YEAR
*N/AJUNE 13, 2021SEPTEMBER 30, 2023N/AN/A**N/AN/A***
LEASE TERM EXPIRATION DATE
TOTAL:
151
152
The leases with Delta, American, United and JetBlue provide for the “recapture” of gates by the Authority if the tenant carrier’s average usage (measured in the number of daily operations per gate) falls below a certain Air-port-wide average for such usage. These leases also generally require that, at the request of the Authority, the tenant carrier sublease a certain number of gates, as specified in the lease. The monthly leases with Southwest, Spirit, Alaska Airlines and Virgin America do not contain “recapture” language, but rather provide the Authority with the right to terminate portions of the premises on 30-days’ notice.
The Authority’s preference is to lease space on a short-term basis. The only long-term lease arrangement currently in place is with American (previously US Airways), which lease arrangement was entered into in connection with the significant capital investments the carrier made in the Authority’s Terminal B facilities. Such terminal improve-ments were largely financed with special facilities revenue bonds issued by the Authority for the benefit of US Airways (now American) on a non-recourse basis. American has fully repaid its special facilities revenue bonds. As reflected above, as of June 30, 2017, the Authority leased 84 of its 97 contact gates to various carriers serv-ing the Airport. Rental revenue from Terminals (excluding the portion of Terminal A revenue pledged to pay debt service on the Terminal A Bonds) totaled $161.8 million in fiscal year 2017 and rental income from non-terminal buildings and ground rents other than Terminals totaled $49.6 million in fiscal year 2017.
Concessions. Revenues from concessions increased from $86.6 million in fiscal year 2016 to $98.1 million in fiscal year 2017. The increase is primarily due to the higher passenger volume at the Logan Airport during fiscal year 2017. Concession revenues include payments made by rental car companies that operate at Logan Airport and commissions from the following concessions: food and beverage, news and gifts, duty free shops, specialty shops, ground transportation services and other concessions.
Hanscom Field. During fiscal year 2017, Revenues from operations at Hanscom Field represented approximately 1.7% of the total Revenues of the Authority, and Hanscom Field’s Operating Expenses constituted approximately 2.8% of the Authority’s Operating Expenses. In fiscal year 2017, Hanscom Field contributed $12.8 million of Rev-enue, with Operating Expenses of $12.5 million, yielding an operating surplus before debt service or other capital expenses of approximately $309,000. Operating revenue and expense figures for Hanscom Field stated in this paragraph do not include certain items, particularly expense items, such as interest, depreciation and amortization, properly allocable to Hanscom Field, that are excluded from the definition of operating expenses pursuant to the 1978 Trust Agreement.
Worcester Regional Airport. During fiscal year 2017, Worcester Airport generated $1.6 million of Revenue, with Operating Expenses of $9.7 million, yielding an operating deficit before debt service or other capital ex-penses of approximately $8.1 million. Operating revenue and expense figures for Worcester Airport stated in this paragraph do not include certain items, particularly expense items, such as interest, depreciation and amortization, properly allocable to Worcester Airport, that are excluded from the definition of operating expenses pursuant to the 1978 Trust Agreement.

ANNUAL D I SCLOSURE
Port PropertiesIn fiscal year 2017, the Revenue attributable to the Port Properties totaled approximately $111.8 million, or approx-imately 14.5% of the Revenues of the Authority, and the Port Properties accounted for approximately $89.2 million of Operating Expenses according to the 1978 Trust Agreement, or approximately 20.3% of the Authority’s Oper-ating Expenses. The Port Properties realized a surplus of approximately $22.6 million and $15.8 million in Net Revenues in fiscal years 2017 and 2016, respectively. The Net Revenue from Maritime Operations include Auto, Container, Cruise and Seafood Business lines was $11.7 million for fiscal year 2017, while the Net Revenue from Maritime Real Estate was $10.9 million in fiscal year 2017. Revenues from Maritime Real Estate for fiscal year 2017 include a one-time $5.0 million lease extension payment to the Authority for property at 88 Black Falcon Avenue. Over the period shown, the Authority has pursued a policy of seeking compensatory (or cost recovery) pricing, aggressively negotiating new lease terms when possible, and revenue development through more intense use of the Port Properties and a marketing program designed to increase the volume of containers handled and the number of cruise passengers who embark or disembark in Boston.
Operating revenue and expense figures for the Port Properties stated in this paragraph do not include certain items, particularly expense items such as payments in lieu of taxes, interest and depreciation and amortization, properly allocable to the Port Properties, that are excluded from the definition of operating expenses pursuant to the 1978 Trust Agreement.
OtherInvestment Income. Investment income (excluding CFCs, PFCs and other funds not held under the 1978 Trust Agreement) during fiscal year 2017 was $7.9 million, an increase of $2.2 million from fiscal year 2016, as the Authority had more cash available to invest and was able to take advantage of a higher interest rate environment.
153

154
Presented below are the revenues and operating expenses as determined in accordance with the 1978 Trust Agreement, and a reconciliation to net assets as determined under accounting principles generally accepted in the United States of America (“GAAP”) for the period presented.
Trust revenues: Pledged revenuesOperating grants
Subtotal
Operating interest incomeAdjustment for uncollectible accounts
Total Trust Revenues Trust operating expenses:
Operations and maintenanceAdministrationInsurancePensionOther Postemployment Benefits (1978 Trust)
Total Trust Expenses Excess of revenues over operating expenses as prescribed by the 1978 Trust Agreement ADD: Revenues recognized under GAAP which are excluded under 1978 Trust Agreement:
Investment income self insurance / othersPassenger facility charge (PFC)-LoganInvestment income PFC-FAAInvestment income PFC-Non FAACustomer facility charge (CFC)Investment income CFCCapital grant revenueGain on sale of equipmentRealized net increase in the fair value of investmentsUnrealized net increase in the fair value of investmentsAdministration ExpensesOperating revenuesAdjust for Operating GrantSettlement of claimsNonoperating other revenues
LESS: Expenses recognized under GAAP which are excluded under 1978 Trust Agreement:
PILOTOther Postemployment BenefitsSelf insurance costPensionInterest expenseLoss on sale of equipmentRealized net (decrease) in the fair value of investmentsUnrealized net (decrease) in the fair value of investmentsDepreciation and amortization (1)Operating expensesTerminal A debt service contributions by PFCNonoperating other expenses
Increase / (decrease) in net assets
INVESTMENT INCOME
NET CHANGE IN THE FAIR
VALUE OF INVESTMENTS
6/30/17 FISCAL YEAR
2017 TOTAL
6/30/16 FISCAL YEAR
2016 TOTAL
$651,136 $2,853
$653,989
$0 ($1,298)
$652,691
$273,291 $47,931 $ 6,476
$11,510 $11,863
$351,071
$301,620
$0
$76,296 $0 $0
$33,055 $0.0
$12,165 $89
$0 $0
$1,184 ($212)
$0 $176
$4,062
($17,212) ($2,986)
$16 ($5,268)
($65,956)$0 $0
$0 ($236,067)
($1,462)($11,941)
($198)
$87,361
$112,061 $42
$112,103
$0 ($344)
$111,759
$ 70,270 $12,656
$1,758 $2,049 $2,437
$89,170
$ 22,589
$0 $0 $0 $0 $0 $0
$470 $36 $0.0$0.0
$261 ($4,984)
$ 7 $72
$0
($2,064) ($617) $229
($873) ($1,201)
$0 $0 $0
($16,779) ($2,327)
$0$0
($5,181)
$0 $0 $0
$7,902 $0
$7,902
$0 $0 $0 $0 $0
$0
$7,902
$3,191 $0
$537 $689
$0 $774
$0 $0 $0 $0 $0 $0
$0 $0 $0
$0 $0 $0 $0
$0 $0 $0 $0 $0 $0 $0
$0
$13,093
$0 $0 $0
$0 $0
$0
$0 $0 $0 $0 $0
$0
$0
$0 $0 $0 $0 $0 $0 $0 $0 $0 $0 $0 $0 $0 $0 $0
$0 $0 $0 $0
$0 $0
($34) ($4,467)
$0 $0 $0
$0
($4,501)
$763,197 $2,895
$766,092
$ 7,902 ($1,642)
$772,352
$ 343,561 $60,587
$8,234 $13,559 $14,300
$440,241
$332,111
$3,191 $76,296
$537 $689
$33,055 $774
$12,635 $125
$0 $0
$1,445 ($5,196)
$7 $248
$4,062
($19,276) ($3,603)
$245 ($6,141)
($67,157)$0
($34) ($4,467)
($252,846) ($3,789)
($11,941) ($198)
$90,772
$696,354 $3,193
$699,547
$5,689 ($186)
$705,050
$321,336 $59,570 $8,230
$10,850 $12,000
$411,986
$293,064
$2,321 $70,718
$277 $ 688
$32,335 $478
$56,033 $0.0 $88
$2,028 $1,338
$0 ($69) $70 $ 49
($19,375) ($2,093)
$821 ($4,711)
($63,613) ($595)
$0 $0
($247,502) ($5,025)
($11,903) ($116)
$105,306
AIRPORT PROPERTIES
PORT PROPERTIES
(1) Capital Assets are depreciated under GAAP but not under 1978 Trust Agreement.
Exhibit - 1Unaudited (IN THOUSANDS)

CFC DisclosureG r e e n T r a n s p o r t a t i o n
The LEED© Gold-certified Logan Rental Car Center is served by Massport’s
green airport shuttle. Diesel-powered shuttles were replaced with a clean-
fuel fleet of vehicles. Bus trips through the airport were reduced from 120 to
30 vehicles per hour, improving air quality and reducing curbside congestion.


CFC D I SCLOSURE
Of The Massachuset ts Port Author i ty For F i s ca l Year 2017
A N N U A L F I N A N C I A L I N F O R M AT I O N A N D O P E R AT I N G D ATA
STATEMENT OF CFC
IntroductionThis Statement of Annual Financial Information and Operating Data dated as of November 28, 2017 (the “CFC Annual Disclosure Statement”) of the Massachusetts Port Authority (the “Authority”) is prepared and submitted in accordance with the requirements of the Continuing Disclosure Certificate dated as of June 15, 2011 (the “CFC Disclosure Certificate”) executed and delivered by the Authority for the benefit of the owners of the CFC Bonds. Set forth below is certain financial information and operating data relating to the Authority for the fiscal year ended June 30, 2017 (“fiscal year 2017”) updating the financial information and operating data presented in the Author-ity’s Official Statement dated June 8, 2011 relating to the CFC Bonds (the “2011 CFC Official Statement”). Capi-talized terms not otherwise defined herein shall have the meanings ascribed to such terms in the 2011 CFC Official Statement. This CFC Annual Disclosure Statement is part of the Authority’s Comprehensive Annual Financial Report dated November 28, 2017 (the “2017 CAFR”) for fiscal year 2017. The Authority’s audited financial statements for fiscal year 2017 and comparative information for fiscal years 2016, prepared in accordance with accounting principles generally accepted in the United States of America (“GAAP”), with a report thereon by Ernst & Young LLP, independent auditors, are also included as part of the 2017 CAFR. The 2011 CFC Official Statement is on file with the Municipal Securities Rulemaking Board (“MSRB”). For a more complete description of the Authority and the CFC Bonds, reference is made to the 2011 CFC Official Statement.
This CFC Annual Disclosure Statement applies to the following outstanding Series of Bonds issued by the Authority (collectively, the “CFC Bonds”) pursuant to a Trust Agreement dated as of May 18, 2011, as supplemented and amended (the “CFC Trust Agreement”), between the Authority and U.S. Bank National Association, as trustee (the “CFC Trustee”):
Massachusetts Port Authority Special Facilities Revenue Bonds (ConRAC Project),
Series 2011-A (Non-AMT)
Massachusetts Port Authority Special Facilities Revenue Bonds (ConRAC Project),
Series 2011-B (Federally Taxable)
For additional information concerning the Authority, please see the Authority’s website, www.massport.com. Financial information can be found in the Investor Relations section of the Authority’s website at http://www.massport.com/massport/finance/financial-publications. Copies of the Annual Statements prepared pursuant to Rule 15c2-12 with respect to the Authority’s bonds issued under the 1978 Trust Agreement, the PFC Trust Agreement and the CFC Trust Agreement for years prior to fiscal year 2017 are available at http://www.emma.msrb.org and from the Authority. The Authority’s principal office is located at One Harborside Drive, Suite 200S, East Boston, Massachusetts 02128. Its telephone number is (617) 568-5000. Questions may be directed to John P. Pranckevicius, CPA, the Authority’s Director of Administration and Finance and Secretary-Treasurer.
157

158
Annual Disclosure StatementThis CFC Annual Disclosure Statement is of limited scope. It contains only an updating of certain financial informa-tion and operating data described below. Except as expressly noted, all information presented in this Annual Disclosure Statement is on the basis required under the CFC Trust Agreement, and not on the basis of GAAP. The information set forth herein does not contain all material information concerning the CFC Bonds or the Authority necessary to make an informed investment decision. This CFC Annual Disclosure Statement does not constitute an offer to sell or the solicitation of an offer to buy the CFC Bonds.
This CFC Annual Disclosure Statement is submitted pursuant to the CFC Disclosure Certificate. The intent of the Authority’s undertaking under the CFC Disclosure Certificate is to provide on a continuing basis for the benefit of the owners of the CFC Bonds and any other bonds of the Authority that are designated by resolution of the Authority as subject to and having the benefits of the CFC Disclosure Certificate the information described in Rule 15c2-12 (the “Rule”) promulgated by the Securities and Exchange Commission (the “SEC”) under the Securities Exchange Act of 1934. Pursuant to the CFC Disclosure Certificate, the Authority has agreed with respect to the CFC Bonds to provide, or cause to be provided, certain annual financial information and operating data, prepared on the basis of the CFC Trust Agreement, and notices of material events. The Authority reserves the right to modify the disclosure required under the CFC Disclosure Certificate, or the format of such disclosure, so long as any such modification is permitted by the Rule.
The purpose of the Authority’s undertaking is to conform to the requirements of the Rule and not to create new con-tractual or other rights for the CFC Trustee or for the underwriters of the CFC Bonds, any registered owner or benefi-cial owner of CFC Bonds, any municipal securities broker or dealer, any potential purchaser of the CFC Bonds, the SEC, or any other person. The sole remedy in the event of any actual or alleged failure by the Authority to comply with any provision of the CFC Disclosure Certificate shall be an action for the specific performance of the Authority’s obligations thereunder and not for money damages in any amount. Any failure by the Authority to comply with any provision of such undertaking shall not constitute an event of default under the CFC Trust Agreement or any other instruments relating to the CFC Bonds.
Incorporation by ReferenceTo view the 2017 CAFR on-line, please visit:http://www.massport.com/massport/finance/financial-publications/comprehensive-annual-financial-report-cafr/
The following information is provided with respect to the CFC Bonds pursuant to the CFC Disclosure Certificate.
Historical Total Enplaned Passengers, by Type of PassengerA table presenting historical Total Enplaned Passengers, by Type of Passenger as of June 30, 2017 is attached hereto as APPENDIX CFC-1.
Debt Service Coverage – Rate CovenantA table presenting CFC Revenues (as defined in the CFC Trust Agreement) and debt service coverage on the CFC Bonds as of June 30, 2017 is attached hereto as APPENDIX CFC-2.
Additional InformationThe remaining information required to be included in the Authority’s Annual Filing under subsection 4(a) of the CFC Disclosure Certificate is included in the Authority’s audited financial statements for the fiscal year ended June 30, 2017, which are part of the 2017 CAFR.
This CFC Annual Disclosure Statement has been executed and delivered on behalf of the Authority pursuant to the CFC Disclosure Certificate.
Updated Operating Information
CFC Annual Filing

CFC D I SCLOSURE
CFC-1, CFC-2
FiscalYear2013201420152016
2017*
Passengers7,374 7,631 7,926 8,523 8,947
Passengers6,614 6,904 7,307 7,955 8,698
Total13,988 14,535 15,233 16,47817,645
Total14,717 15,381 16,115 17,39018,688
Percent ofO&D total
52.7% 52.5% 52.0% 51.7% 50.7%
Percent ofO&D total
47.3% 47.5% 48.0% 48.3% 49.3%
Connectingand other
passengers 729 846 882 9121,043
Residents Visitors
Appendix CFC-1 TOTAL ENPLANED PASSENGERS, BY TYPE OF PASSENGER
Boston-Logan International Airport Fiscal Years 2013 through 2016; and Fiscal Year 2017
(Passengers in Thousands)
Outbound O&D Passengers
Rental car transaction daysPercentage change from prior yearCFC Revenues
Plus: Portion of Rolling Coverage Fund balance (a)Plus: Portion of Supplemental Reserve Fund balance (b)Total
Aggregate Debt Service
Debt service coverage
Debt service coverage (without Rolling Coverage Fund and Supplemental Reserve Fund balances)
Fiscal Year 2017 $5,509,106
2.23%$33,054,633
$3,587,966
$ 717,593$ 37,360,192
$ 14,351,865
2.60
2.30
Appendix CFC-2 DEBT SERVICE COVERAGE - RATE COVENANT
Notes: Because foreign-flag carriers are not required to report with respect to the U.S. DOT Air Passenger Origin-Destination Survey, some LeighFisher estimates were used to develop the data in the above table. * U.S. DOT data for 2017 is preliminary.. Source: Massachusetts Port Authority; U.S. DOT, Air Passenger Origin-Destination Survey, reconciled to Schedules T100.
(a) An amount equivalent to not more than 25% of aggregate debt service.(b) An amount equivalent to not more than 5% of aggregate debt service.


One Harborside Drive Suite 200SEast Boston, Massachusetts 02128
THOMAS J. BUTLER MEMORIAL PARK AND FREIGHT CORRIDOR
The Thomas J. Butler Memorial Park was once a thoroughfare for more than 400 rumbling container trucks each day. To bring relief to the community along East First Street and parts
of Summer Street, Massport constructed a dedicated 0.6-mile Freight Corridor to divert truck traffic to Conley Terminal.
The 4.5-acre park is now a place of quiet relaxation with beautiful plantings and seating, lighted paths for walkers and runners, and an enclosed dog park for the enjoyment of all. The dual projects are dedicated to the legacy of Thomas J. Butler, former Director of External
Affairs at Massport and a true son of South Boston.