Yearly Technical Outlook 2019 Technical Outlook...
26
Research Analyst: Dharmesh Shah Nitin Kunte, CMT [email protected] [email protected] Ninad Tamhanekar, CMT [email protected] Pabitro Mukherjee Vinayak Parmar [email protected] [email protected] Yearly Technical Outlook 2019 Yearly 2019 Technical Outlook December 21, 2018
Transcript of Yearly Technical Outlook 2019 Technical Outlook...
Research Analyst:Dharmesh Shah Nitin Kunte, [email protected] [email protected]
Ninad Tamhanekar, CMT [email protected]
Pabitro Mukherjee Vinayak [email protected] [email protected]
Yearly Technical Outlook 2019Yearly 2019 Technical Outlook
December 21, 2018

ICIC
I S
ecurit
ies –
Retail E
quit
y R
esearch
MO
ME
NT
UM
PIC
K
Deciphering Election Noise: Returns are real; nervousness a myth…
December 21, 2018 ICICI Securities Ltd. | Retail Equity Research 1
As 2018 draws to an end, the big question on the investor’s mind is “How to navigate election year volatility?”
“Technical Strategy 2019” is, therefore, centred around complementing empirical inference with a bottom-up model to arrive at the prognosis for CY19;
…the message is amply clear, shrug off the nervousness and embrace the equities as;
in each of the past three election years, Nifty 50 (large caps) and Nifty500 (broad based) have generated returns in excess of 11% and 18%, respectively.
the second half of election years has always witnessed a broad based rally led by cyclicals (double digit returns)
our bottom-up method of prognosis for the Nifty projects an upside towards 12200-12500 in CY19, further validated by conventional chart work
The key inference from the past three election cycles (covering two decades) is that cyclicals have generated above average returns for investors in an election
year, which is concurrent with our bottom-up work. The top two baskets of Nifty constituents, a) Turnaround stocks and b) Outperformer stocks are led by
cyclicals and are likely to generate average returns of 26% and 24%, respectively. Between two of them, they carry 62% weightage of Nifty Index, thus
corroborating our bullish stance, derived from empirical studies.
Technical Outlook for 2019
Technic
al S
trategy –
2019
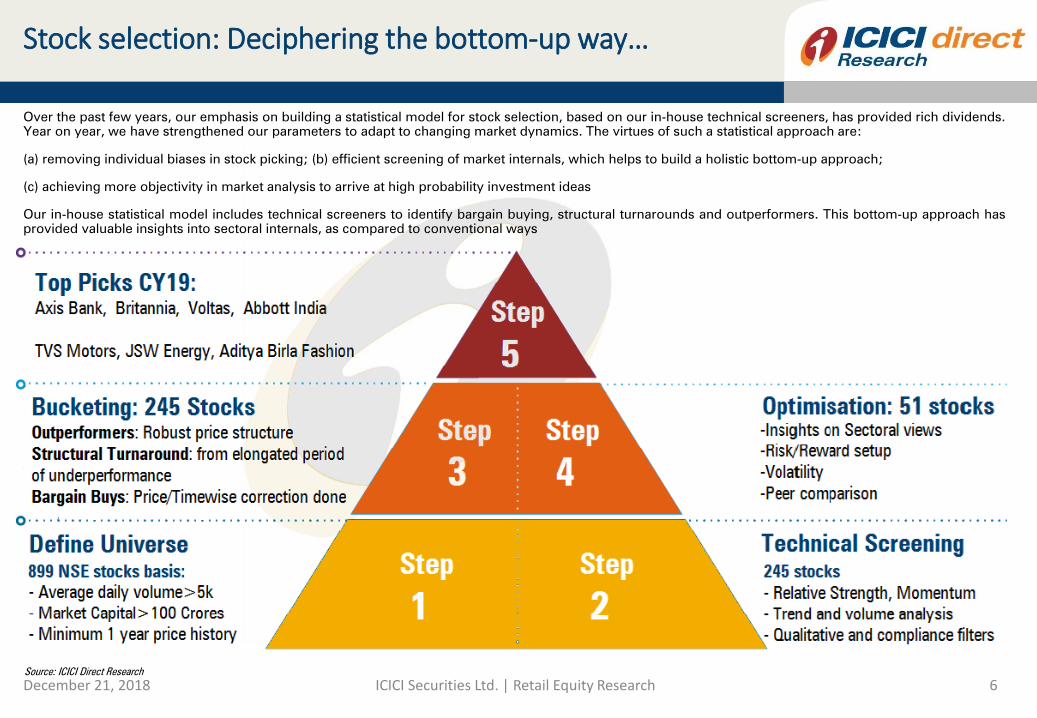
Top Picks CY19
An anxiety around key events (domestic or international) has always triggered
volatility in the past. However, markets always steer clear of them once anxiety
settles down, irrespective of the outcome. Below are a few examples:
Event Outcome Period
6M 12M
2018 State election
Results not in line with market
expectations
December
2018
So far 6% ??
2016 US elections* Results against consensus
November
2016
10% 27%
2004 General Election
Coaliation Govt. perceived negative
for markets
May 2004 9% 16%
* Returns shown are for Dow Jones Industrial Average
Post Event returns Scrip
I-Direct
Code
Buying Range Target Stop loss Upside%
Axis Bank AXISBAN 620-640 755 569 20
Britannia Industries BRIIND 3050-3200 3,790 2,740 22
Abbot India ABBIND 7300-7500 9,368 6,380 27
Voltas VOLTAS 560-580 688 497 20
TVS Motors TVSMOT 570-590 720 495 24
JSW Energy JSWENE 67-73 96 56 37
Aditya Birla Fashion ADIFAS 195-206 263 163 31
Technical Strategy CY18 Performance
No. of
recommendations
Avgerage
Return (%)
Strike Rate
8 26% 57%
Click here to know more..
Source: Bloomberg, ICICI Direct Research

ICIC
I S
ecurit
ies –
Retail E
quit
y R
esearch
MO
ME
NT
UM
PIC
K
Election Year: Cyclicals will drive...
In two out of three occasions, the markets behaved indecisively five
months prior to elections. In contrast, throughout the past three
elections, both Nifty and Nifty 500 indices exhibited a robust
performance seven months post the election phase with average
returns of 27% and 33%, respectively
During all three election years, pharma & BFSI have remained
positive whereas auto, capital goods, construction and infra sectors
have relatively outperformed during an election year
During seven months post elections, all
sectors performed and clocked double
digit gains
December 21, 2018 ICICI Securities Ltd. | Retail Equity ResearchSource: Bloomberg, ICICI Direct Research
Among defensives, FMCG and pharma have
relatively outperformed five months prior to
elections. In contrast, consumer discretionary and
IT have outperformed seven months post elections
2
5 Months Pre -
Election
7 Months Post -
Election
5 Months Pre -
Election
7 Months Post -
Election
5 Months Pre -
Election
7 Months Post -
Election
Index Nifty -8 22 26 43 13 15
Index Nifty 500 -6 26 23 53 14 21
Cyclical Auto & Components -12 45 16 120 28 80
Cyclical BFSI 0 46 5 70 20 43
Cyclical Capital Goods -12 67 6 89 23 44
Cyclical Cement -2 67 10 69 33 53
Cyclical Construction and Infra -8 63 37 112 38 28
Cyclical Energy -11 36 52 58 22 14
Cyclical Metals -25 77 34 123 17 -1
Cyclical Power -14 52 37 45 13 16
Defensive Consumer discretionary -20 83 -5 106 20 36
Defensive FMCG -5 51 38 82 7 27
Defensive IT -27 55 9 119 8 34
Defensive Pharmaceuticals 1 39 28 89 11 31
SectorsSector's Nature
Sectoral Election Year Trend (Returns in %) Universe: Nifty 500
20142004 2009
Click here to go to top

ICIC
I S
ecurit
ies –
Retail E
quit
y R
esearch
MO
ME
NT
UM
PIC
K
Category
No. of
Stock
Aggregate
Weightage
Projected
Returns
Contribution
to Nifty
Nifty Target 12230
Market
Performer
8
23
7.4%
25.8%Neutral
2553
5503
919
3255
Turnaround 6 16.6% 26%
Outperformer 12 44.9% 24%
17%
1%
December 21, 2018 ICICI Securities Ltd. | Retail Equity Research 3Source: ICICI Direct Research
…Nifty @ 12200-12500, reiterated via bottom up way…-------- P
otentia
l R
eturns (
%) --------
-5
-10
-15
-20
0
5
10
15
20
25
30
35
40
1 2 4 5
-------- Technical Ranking --------
3
Returns RankingReturns Ranking
Returns Ranking RankingReturns
Outperformers
Reliance, Titan, HDFC,
HDFC Bank, TCS,
Hindustan Unilever…
Turnaround
Axis, SBI, Wipro,
ITC, L&T and Tech
Mahindra
Market Performers
UltraTech, Maruti, Zee,
Bharti Airtel…
Underperformers
IndusInd Bank, Eicher
Motors, Sun Pharma,
Tata Motors, HCL Tech
Bottom up prognosis indicates bullish
undertone for 69% constituents
Turnaround: Attempting major breakouts after elongated
period of underperformance, thereby pricing in all negatives
Outperformer: reflects structural uptrend and likely to
outperform. Corrections to offer incremental investment
opportunity
Market Performers: offers favourable risk-reward, likely to
perform in tandem with benchmarks
Underperformers: likely to extend price/time correction and
remain laggards based on technical set-up
* Ranking improves from 1 to 5
Click here to go to top

ICIC
I S
ecurit
ies –
Retail E
quit
y R
esearch
MO
ME
NT
UM
PIC
K
December 21, 2018 ICICI Securities Ltd. | Retail Equity Research 4Source: Bloomberg, ICICI Direct Research
...and conventional practice validates the same
138.2% external retracement and upper
band of channel @ 12400-12500
2539
6338
9119
Major long term support area around 9500-
9300
the long term trend line support joining
major lows since 2011
50% retracement of the CY16-18 rally
the long term 50 months EMA, which
has historically acted as strong support
at 9300
50 retracement
@ 4531
50 retracement @
6825
50 Months EMA
Monthly bar chart
Election year index return
In the last three
election years, the
Nifty has always
given strong returns
Conventional chart
method remarkably
corroborates the path
projected by the
bottom-up model
Year % Gain/Decline
May-04 11%
May-09 76%
May-14 31%
Click here to go to top
ICIC
I S
ecurit
ies –
Retail E
quit
y R
esearch
MO
ME
NT
UM
PIC
K
December 21, 2018 ICICI Securities Ltd. | Retail Equity Research 5Source: Bloomberg, ICICI Direct Research
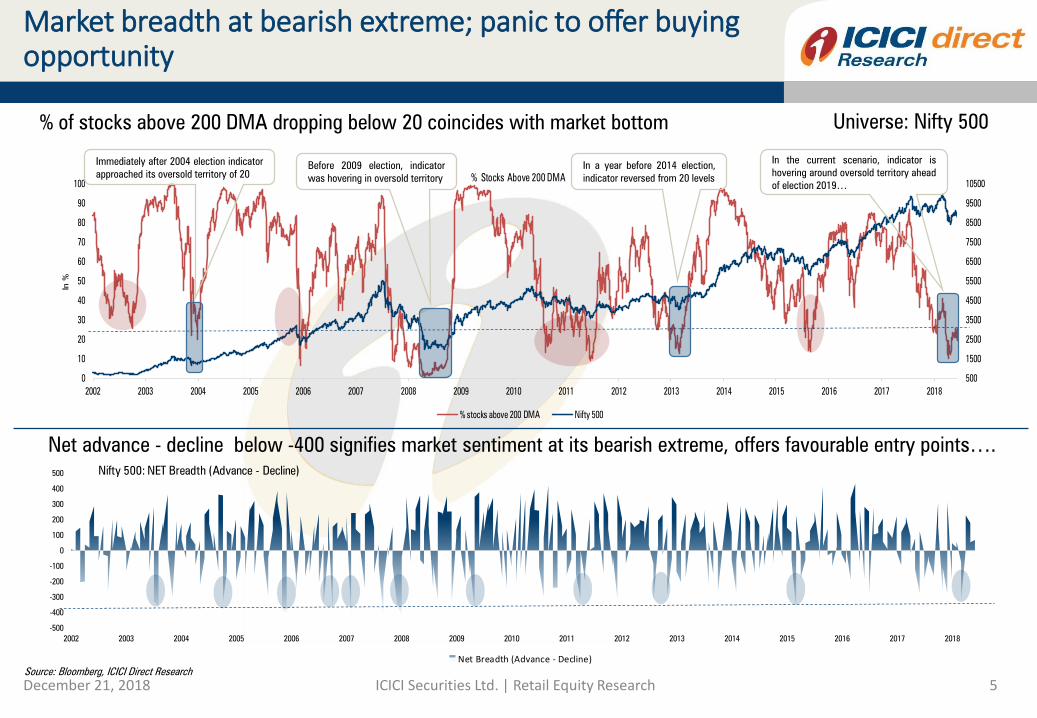
Market breadth at bearish extreme; panic to offer buying opportunity
500
1500
2500
3500
4500
5500
6500
7500
8500
9500
10500
0
10
20
30
40
50
60
70
80
90
100
2002 2003 2004 2005 2006 2007 2008 2009 2010 2011 2012 2013 2014 2015 2016 2017 2018
In %
% Stocks Above 200 DMA
% stocks above 200 DMA Nifty 500
-500
-400
-300
-200
-100
0
100
200
300
400
500
2002 2003 2004 2005 2006 2007 2008 2009 2010 2011 2012 2013 2014 2015 2016 2017 2018
Nifty 500: NET Breadth (Advance - Decline)
Net Breadth (Advance - Decline)
% of stocks above 200 DMA dropping below 20 coincides with market bottom
Net advance - decline below -400 signifies market sentiment at its bearish extreme, offers favourable entry points….
Immediately after 2004 election indicator
approached its oversold territory of 20
Before 2009 election, indicator
was hovering in oversold territory
In a year before 2014 election,
indicator reversed from 20 levels
In the current scenario, indicator is
hovering around oversold territory ahead
of election 2019…
Universe: Nifty 500
ICIC
I S
ecurit
ies –
Retail E
quit
y R
esearch
MO
ME
NT
UM
PIC
K
December 21, 2018 ICICI Securities Ltd. | Retail Equity Research 6Source: ICICI Direct Research
Stock selection: Deciphering the bottom-up way…
Over the past few years, our emphasis on building a statistical model for stock selection, based on our in-house technical screeners, has provided rich dividends.
Year on year, we have strengthened our parameters to adapt to changing market dynamics. The virtues of such a statistical approach are:
(a) removing individual biases in stock picking; (b) efficient screening of market internals, which helps to build a holistic bottom-up approach;
(c) achieving more objectivity in market analysis to arrive at high probability investment ideas
Our in-house statistical model includes technical screeners to identify bargain buying, structural turnarounds and outperformers. This bottom-up approach has
provided valuable insights into sectoral internals, as compared to conventional ways
ICIC
I S
ecurit
ies –
Retail E
quit
y R
esearch
MO
ME
NT
UM
PIC
K
December 21, 2018 ICICI Securities Ltd. | Retail Equity Research 7Source: Bloomberg, ICICI Direct Research
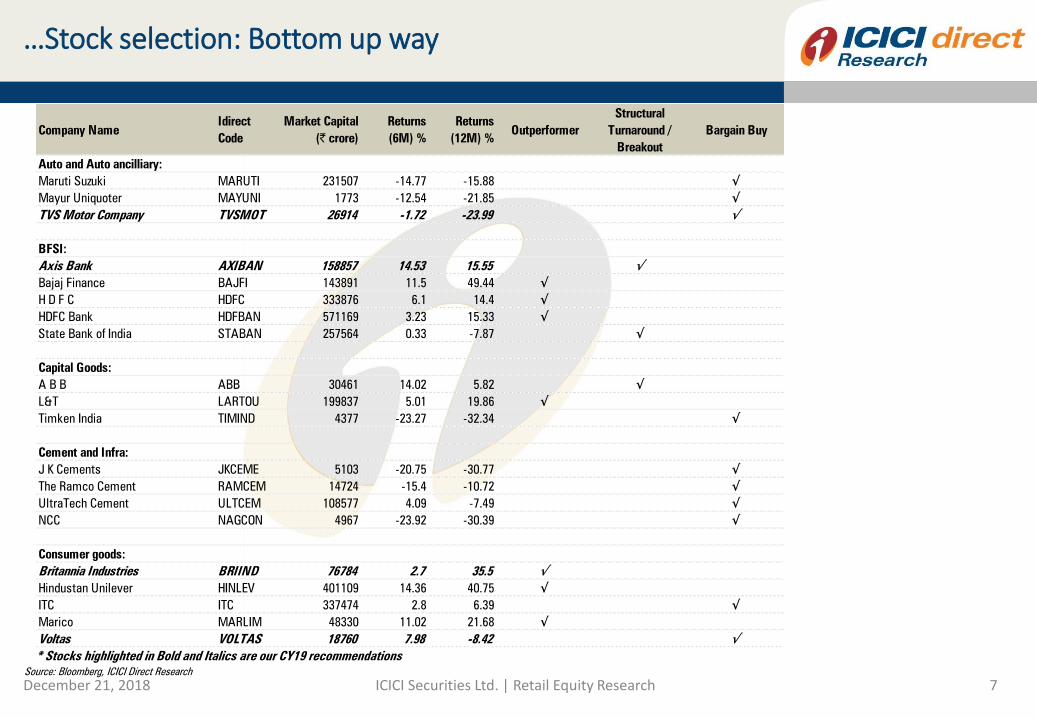
…Stock selection: Bottom up way
Company Name
Idirect
Code
Market Capital
(| crore)
Returns
(6M) %
Returns
(12M) %Outperformer
Structural
Turnaround /
Breakout
Bargain Buy
Auto and Auto ancilliary:
Maruti Suzuki MARUTI 231507 -14.77 -15.88 √
Mayur Uniquoter MAYUNI 1773 -12.54 -21.85 √
TVS Motor Company TVSMOT 26914 -1.72 -23.99 √
BFSI:
Axis Bank AXIBAN 158857 14.53 15.55 √
Bajaj Finance BAJFI 143891 11.5 49.44 √
H D F C HDFC 333876 6.1 14.4 √
HDFC Bank HDFBAN 571169 3.23 15.33 √
State Bank of India STABAN 257564 0.33 -7.87 √
Capital Goods:
A B B ABB 30461 14.02 5.82 √
L&T LARTOU 199837 5.01 19.86 √
Timken India TIMIND 4377 -23.27 -32.34 √
Cement and Infra:
J K Cements JKCEME 5103 -20.75 -30.77 √
The Ramco Cement RAMCEM 14724 -15.4 -10.72 √
UltraTech Cement ULTCEM 108577 4.09 -7.49 √
NCC NAGCON 4967 -23.92 -30.39 √
Consumer goods:
Britannia Industries BRIIND 76784 2.7 35.5 √
Hindustan Unilever HINLEV 401109 14.36 40.75 √
ITC ITC 337474 2.8 6.39 √
Marico MARLIM 48330 11.02 21.68 √
Voltas VOLTAS 18760 7.98 -8.42 √
* Stocks highlighted in Bold and Italics are our CY19 recommendations
ICIC
I S
ecurit
ies –
Retail E
quit
y R
esearch
MO
ME
NT
UM
PIC
K
December 21, 2018 ICICI Securities Ltd. | Retail Equity Research 8Source: Bloomberg, ICICI Direct Research
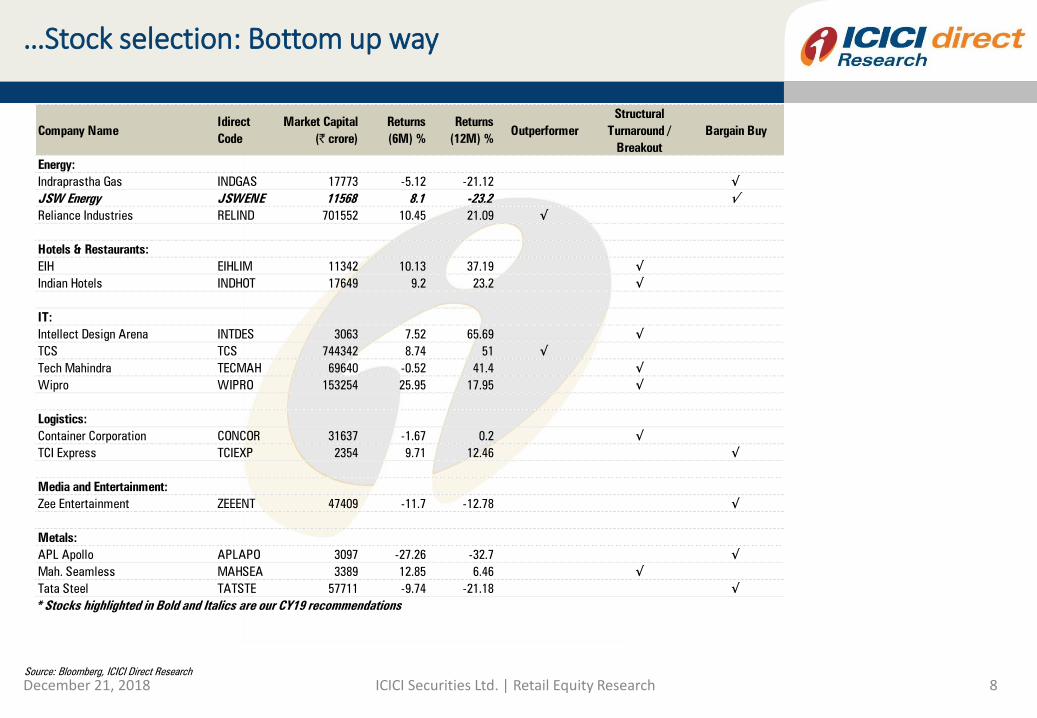
…Stock selection: Bottom up way
Company Name
Idirect
Code
Market Capital
(| crore)
Returns
(6M) %
Returns
(12M) %Outperformer
Structural
Turnaround /
Breakout
Bargain Buy
Energy:
Indraprastha Gas INDGAS 17773 -5.12 -21.12 √
JSW Energy JSWENE 11568 8.1 -23.2 √
Reliance Industries RELIND 701552 10.45 21.09 √
Hotels & Restaurants:
EIH EIHLIM 11342 10.13 37.19 √
Indian Hotels INDHOT 17649 9.2 23.2 √
IT:
Intellect Design Arena INTDES 3063 7.52 65.69 √
TCS TCS 744342 8.74 51 √
Tech Mahindra TECMAH 69640 -0.52 41.4 √
Wipro WIPRO 153254 25.95 17.95 √
Logistics:
Container Corporation CONCOR 31637 -1.67 0.2 √
TCI Express TCIEXP 2354 9.71 12.46 √
Media and Entertainment:
Zee Entertainment ZEEENT 47409 -11.7 -12.78 √
Metals:
APL Apollo APLAPO 3097 -27.26 -32.7 √
Mah. Seamless MAHSEA 3389 12.85 6.46 √
Tata Steel TATSTE 57711 -9.74 -21.18 √
* Stocks highlighted in Bold and Italics are our CY19 recommendations

ICIC
I S
ecurit
ies –
Retail E
quit
y R
esearch
MO
ME
NT
UM
PIC
K
December 21, 2018 ICICI Securities Ltd. | Retail Equity Research 9Source: Bloomberg, ICICI Direct Research
…Stock selection: Bottom up way
Company Name
Idirect
Code
Market Capital
(| crore)
Returns
(6M) %
Returns
(12M) %Outperformer
Structural
Turnaround /
Breakout
Bargain Buy
Other:
Balrampur Chini BALCHI 2399 47.27 -27.81 √
GE Shipping Company GESHIP 5143 6.74 -12.04 √
JK Paper JKPAP 2814 28.53 18.23 √
Kajaria Ceramics KAJCER 7150 -17.83 -35.36 √
Pharmaceuticals and Healthcare:
Abbott India ABBIND 15947 18.67 35.45 √
Astrazeneca Pharma ASTPHA 3530 9.21 27.04 √
Dr Reddy's Labs DRREDD 43107 15.28 14.83 √
Ipca Labs. IPCLAB 10150 17.18 45.72 √
Apollo Hospitals APOHOS 17021 25.29 3.12 √
Realty:
Godrej Properties GODPRO 15349 -12.78 -4.91 √
Phoenix Mills PHOMIL 9477 -3.42 11.34 √
Retail:
Aditya Birla Fashion ADIFAS 15304 42.56 17.69 √
Shoppers Stop SHOSTO 4469 -10.44 -4.69 √
Titan Company TITIND 83882 2.85 15.23 √
Textiles:
Raymond RAYMON 5306 -12.67 -10.92 √
Rupa & Co RUPACO 2528 -27.54 -33.39 √
* Stocks highlighted in Bold and Italics are our CY19 recommendations
ICIC
I S
ecurit
ies –
Retail E
quit
y R
esearch
MO
ME
NT
UM
PIC
K
December 21, 2018 ICICI Securities Ltd. | Retail Equity Research 10Source: Bloomberg, ICICI Direct Research
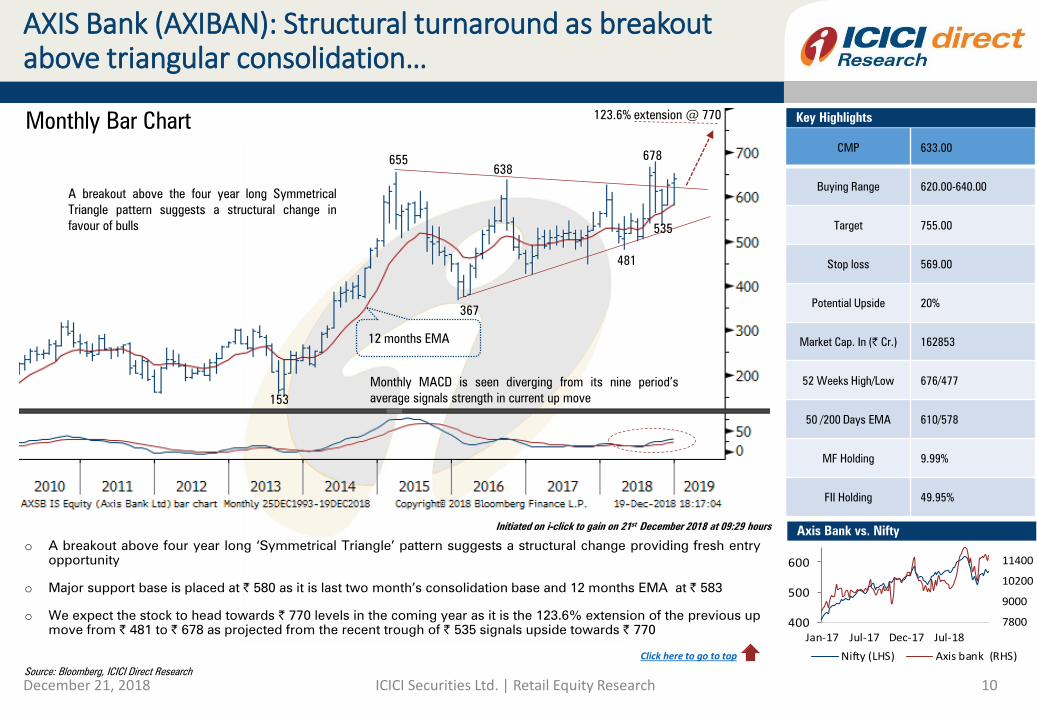
o A breakout above four year long ‘Symmetrical Triangle’ pattern suggests a structural change providing fresh entry
opportunity
o Major support base is placed at | 580 as it is last two month’s consolidation base and 12 months EMA at | 583
o We expect the stock to head towards | 770 levels in the coming year as it is the 123.6% extension of the previous up
move from | 481 to | 678 as projected from the recent trough of | 535 signals upside towards | 770
123.6% extension @ 770
367
638
678
153
CMP 633.00
Buying Range 620.00-640.00
Target 755.00
Stop loss 569.00
Potential Upside 20%
Market Cap. In (| Cr.) 162853
52 Weeks High/Low 676/477
50 /200 Days EMA 610/578
MF Holding 9.99%
FII Holding 49.95%
A breakout above the four year long Symmetrical
Triangle pattern suggests a structural change in
favour of bulls
AXIS Bank (AXIBAN): Structural turnaround as breakout above triangular consolidation…
Monthly Bar ChartKey Highlights
Axis Bank vs. Nifty
655
Monthly MACD is seen diverging from its nine period’s
average signals strength in current up move
481
535
12 months EMA
400
500
600
7800
9000
10200
11400
Jan-17 Jul-17 Dec-17 Jul-18
Nifty (LHS) Axis bank (RHS)
Initiated on i-click to gain on 21st
December 2018 at 09:29 hours
Click here to go to top
ICIC
I S
ecurit
ies –
Retail E
quit
y R
esearch
MO
ME
NT
UM
PIC
K
December 21, 2018 ICICI Securities Ltd. | Retail Equity Research 11Source: Bloomberg, ICICI Direct Research
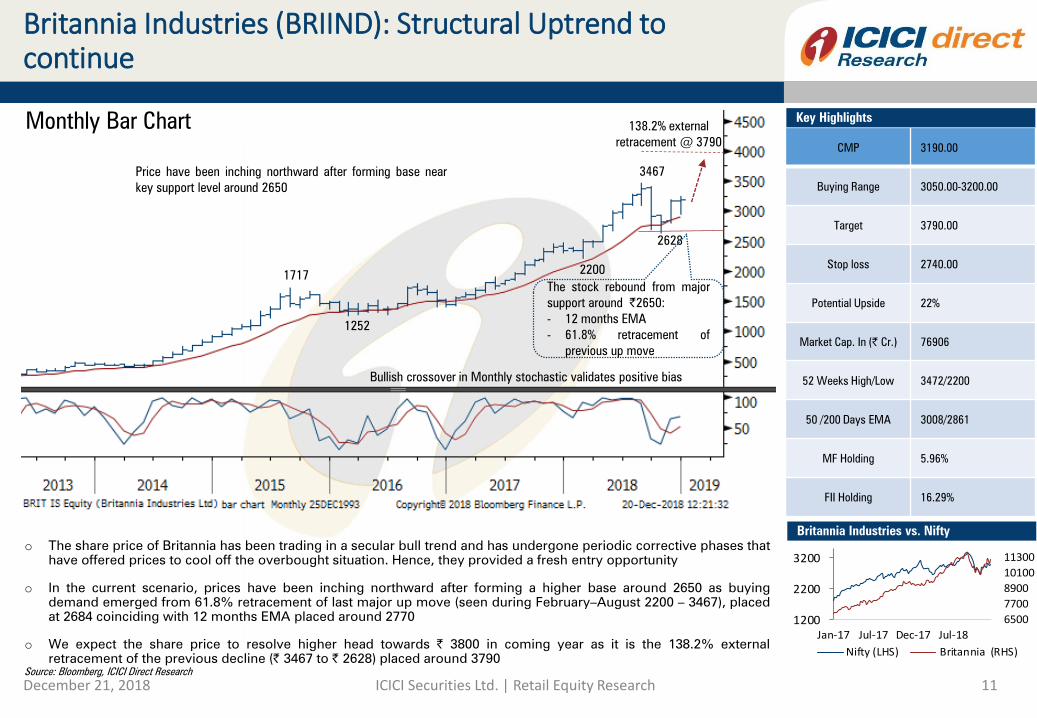
o The share price of Britannia has been trading in a secular bull trend and has undergone periodic corrective phases that
have offered prices to cool off the overbought situation. Hence, they provided a fresh entry opportunity
o In the current scenario, prices have been inching northward after forming a higher base around 2650 as buying
demand emerged from 61.8% retracement of last major up move (seen during February–August 2200 – 3467), placed
at 2684 coinciding with 12 months EMA placed around 2770
o We expect the share price to resolve higher head towards | 3800 in coming year as it is the 138.2% external
retracement of the previous decline (| 3467 to | 2628) placed around 3790
CMP 3190.00
Buying Range 3050.00-3200.00
Target 3790.00
Stop loss 2740.00
Potential Upside 22%
Market Cap. In (| Cr.) 76906
52 Weeks High/Low 3472/2200
50 /200 Days EMA 3008/2861
MF Holding 5.96%
FII Holding 16.29%
Britannia Industries (BRIIND): Structural Uptrend to continue
Monthly Bar ChartKey Highlights
Britannia Industries vs. Nifty
3467Price have been inching northward after forming base near
key support level around 2650
Bullish crossover in Monthly stochastic validates positive bias
1200
2200
3200
6500
7700
8900
10100
11300
Jan-17 Jul-17 Dec-17 Jul-18
Nifty (LHS) Britannia (RHS)
2628
22001717
1252
The stock rebound from major
support around |2650:
- 12 months EMA
- 61.8% retracement of
previous up move
138.2% external
retracement @ 3790

ICIC
I S
ecurit
ies –
Retail E
quit
y R
esearch
MO
ME
NT
UM
PIC
K
December 21, 2018 ICICI Securities Ltd. | Retail Equity Research 12Source: Bloomberg, ICICI Direct Research
o The stock is in a secular uptrend as it has registered a breakout above multiyear highs around | 6170 during the
middle of the previous year and is seen maintaining a higher peak and higher trough on the long term chart
o The last two year’s up move is well channelled signalling sustained buying demand at elevated levels. The stock after
the last three month’s corrective decline is currently seen rebounding from the lower band of the channel
o We expect the stock to resume its fresh up move and test | 9370 in the coming year as it is the 123.6% external
retracement of the previous decline (| 8820-6900) at | 9370
CMP 7450.00
Buying Range 7300.00-7500.00
Target 9368.00
Stop loss 6380.00
Potential Upside 27%
Market Cap. In (| Cr.) 15982
52 Weeks High/Low 8834/5210
50 /200 Days EMA 7510/7010
MF Holding 5.28%
FII Holding 2.15%
Abbott India (ABBIND): Likely to accelerate secular up move in CY19…
Monthly Bar ChartKey Highlights
Abbott India vs. Nifty 500
The stock in structural up trend trading in a rising channel highlighting
sustained buying demand at elevated levels
Monthly MACD remain in up trend thus supports the positive bias
123.6% external
retracement @ 9368
4001
5430
6900
8820
6177
50% retracement &
Lower band of channel
4000
6000
8000
6500
7700
8900
Jan-17 Jul-17 Dec-17 Jul-18
NSE 500 (LHS) Abbott (RHS)

ICIC
I S
ecurit
ies –
Retail E
quit
y R
esearch
MO
ME
NT
UM
PIC
K
December 21, 2018 ICICI Securities Ltd. | Retail Equity Research 13Source: Bloomberg, ICICI Direct Research
o The primary uptrend in Voltas remain intact as the stock is seen consolidating above the multiyear trendline breakout
joining the high of CY10 (| 262) and CY16 (| 402) signalling a Change of Polarity as the previous resistance has
reversed its role and acting as support
o A slower retracement of the previous up move signals corrective nature of current decline and positive price structure
o We expect the stock to head towards | 695 in the medium term as it is the 138.2% external retracement of the
previous major decline (| 637-472) at | 695
CMP 572.00
Buying Range 560.00-580.00
Target 688.00
Stop loss 497.00
Potential Upside 20%
Market Cap. In (| Cr.) 18992
52 Weeks High/Low 675/471
50 /200 Days EMA 551/558
MF Holding 22.20%
FII Holding 15.92%
Initiated on i-click to gain on 20th
December 2018 at 15:11 hrs
Voltas (VOLTAS): Change of polarity of previous multiyear trendline breakout acting as support…
Monthly Bar ChartKey Highlights
Voltas vs. Nifty 500
Change of Polarity as the previous trendline resistance has reversed its
role and acting as support. The primary up trend is intact
63
402
211
262
472
637
138.2% external
retracement @ 695
Monthly 14 periods RSI is seen rebounding from its November 2016
lows highlighting overall strength
A slower retracement of the
previous up move signals
corrective nature of the current
decline and overall positive
price structure
300
500
6500
7700
8900
Jan-17 Jul-17 Dec-17 Jul-18
NSE500 (LHS) Voltas (RHS)

ICIC
I S
ecurit
ies –
Retail E
quit
y R
esearch
MO
ME
NT
UM
PIC
K
December 21, 2018 ICICI Securities Ltd. | Retail Equity Research 14Source: Bloomberg, ICICI Direct Research
o The share price of TVS Motors has registered a breakout above the 12 months downward sloping channel signalling a
reversal of the corrective trend and offers a fresh entry opportunity to ride the next up move in the stock
o The stock is seen rebounding in the last two months from the major support area of | 500-520 as it is confluence of
lower band of the last five months consolidation and 61.8% retracement of previous up move (| 355-794)
o We expect the recent corrective decline to have approached maturity. The stock is likely to resolve higher from here
on and head towards | 730 in medium term as it is the 80% retracement of the previous major decline (| 794-507)
CMP 584.00
Buying Range 570.00-590.00
Target 720.00
Stop loss 495.00
Potential Upside 24%
Market Cap. In (| Cr.) 27664
52 Weeks High/Low 794/478
50 /200 Days EMA 553/574
MF Holding 10.25%
FII Holding 18.37%
Initiated on i-click to gain on 21st
December 2018 at 09:31 hours
TVS Motors (TVSMOT): Corrective phase approaches maturity…
Monthly Bar ChartKey Highlights
TVS Motors vs. Nifty 500
794
508
355
322
201
A falling channel breakout suggests a reversal of the
corrective trend and offers fresh entry opportunity
80% retracement
@ 730
Major support around | 500 levels being the
lower band of last five months consolidation
and 61.8% retracement (355-794)
360
560
760
6500
7700
8900
Jan-17 May-17 Oct-17 Mar-18 Aug-18
NSE500 (LHS) TVS Motors (RHS)
ICIC
I S
ecurit
ies –
Retail E
quit
y R
esearch
MO
ME
NT
UM
PIC
K
December 21, 2018 ICICI Securities Ltd. | Retail Equity Research 15Source: Bloomberg, ICICI Direct Research
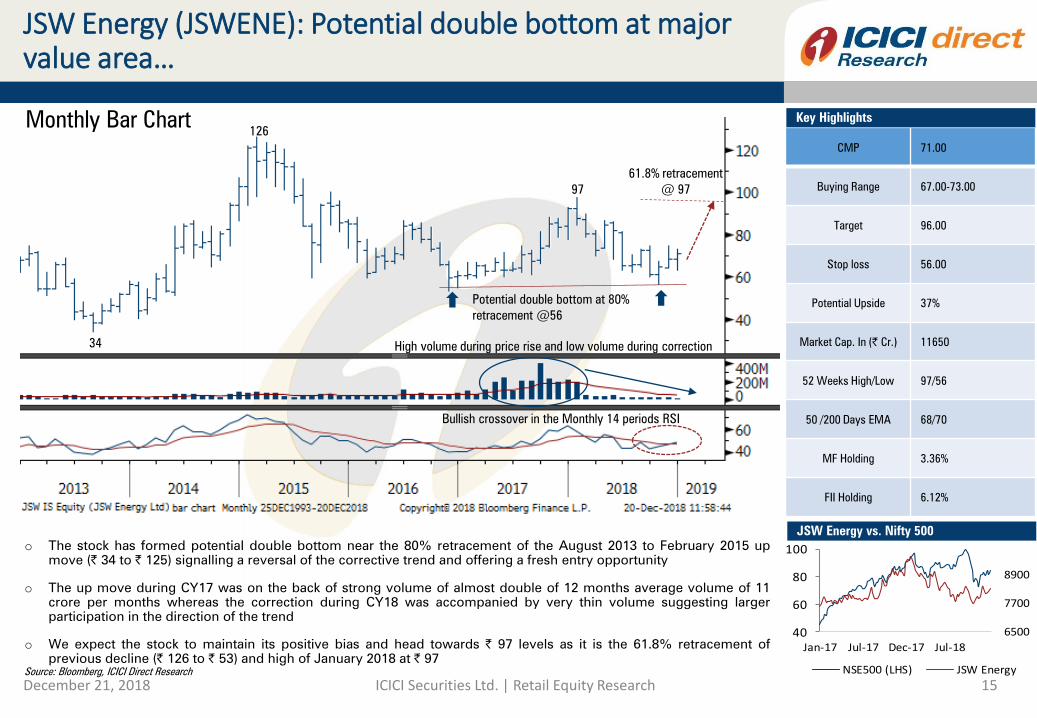
o The stock has formed potential double bottom near the 80% retracement of the August 2013 to February 2015 up
move (| 34 to | 125) signalling a reversal of the corrective trend and offering a fresh entry opportunity
o The up move during CY17 was on the back of strong volume of almost double of 12 months average volume of 11
crore per months whereas the correction during CY18 was accompanied by very thin volume suggesting larger
participation in the direction of the trend
o We expect the stock to maintain its positive bias and head towards | 97 levels as it is the 61.8% retracement of
previous decline (| 126 to | 53) and high of January 2018 at | 97
CMP 71.00
Buying Range 67.00-73.00
Target 96.00
Stop loss 56.00
Potential Upside 37%
Market Cap. In (| Cr.) 11650
52 Weeks High/Low 97/56
50 /200 Days EMA 68/70
MF Holding 3.36%
FII Holding 6.12%
JSW Energy (JSWENE): Potential double bottom at major value area…
Monthly Bar Chart Key Highlights
JSW Energy vs. Nifty 500
97
Potential double bottom at 80%
retracement @56
126
34 High volume during price rise and low volume during correction
Bullish crossover in the Monthly 14 periods RSI
61.8% retracement
@ 97
40
60
80
100
6500
7700
8900
Jan-17 Jul-17 Dec-17 Jul-18
NSE500 (LHS) JSW Energy
ICIC
I S
ecurit
ies –
Retail E
quit
y R
esearch
MO
ME
NT
UM
PIC
K
December 21, 2018 ICICI Securities Ltd. | Retail Equity Research 16Source: Bloomberg, ICICI Direct Research
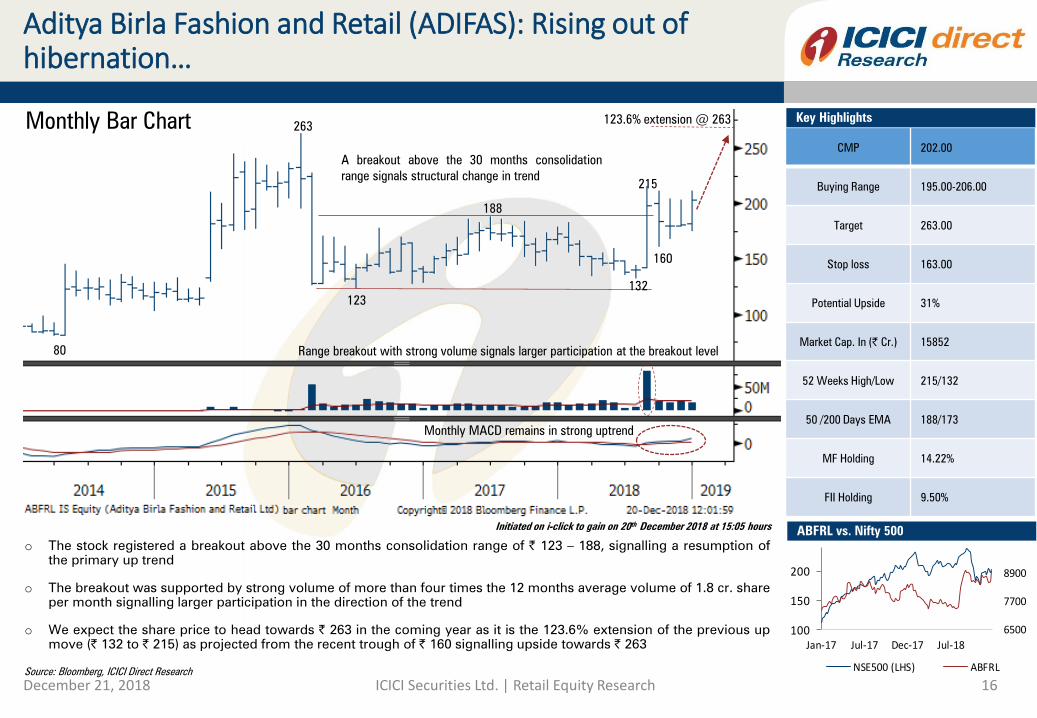
o The stock registered a breakout above the 30 months consolidation range of | 123 – 188, signalling a resumption of
the primary up trend
o The breakout was supported by strong volume of more than four times the 12 months average volume of 1.8 cr. share
per month signalling larger participation in the direction of the trend
o We expect the share price to head towards | 263 in the coming year as it is the 123.6% extension of the previous up
move (| 132 to | 215) as projected from the recent trough of | 160 signalling upside towards | 263
CMP 202.00
Buying Range 195.00-206.00
Target 263.00
Stop loss 163.00
Potential Upside 31%
Market Cap. In (| Cr.) 15852
52 Weeks High/Low 215/132
50 /200 Days EMA 188/173
MF Holding 14.22%
FII Holding 9.50%
Initiated on i-click to gain on 20th
December 2018 at 15:05 hours
Aditya Birla Fashion and Retail (ADIFAS): Rising out of hibernation…
Monthly Bar ChartKey Highlights
ABFRL vs. Nifty 500
123.6% extension @ 263
80
188
132
263
A breakout above the 30 months consolidation
range signals structural change in trend
123
215
160
Range breakout with strong volume signals larger participation at the breakout level
Monthly MACD remains in strong uptrend
100
150
200
6500
7700
8900
Jan-17 Jul-17 Dec-17 Jul-18
NSE500 (LHS) ABFRL

ICIC
I S
ecurit
ies –
Retail E
quit
y R
esearch
MO
ME
NT
UM
PIC
K
December 21, 2018 ICICI Securities Ltd. | Retail Equity Research 17
Commodity and Currency Outlook

ICIC
I S
ecurit
ies –
Retail E
quit
y R
esearch
MO
ME
NT
UM
PIC
K
Gold ($ 1255): Set to retest upper band of consolidation @ 1375
Monthly Bar chart
December 21, 2018 ICICI Securities Ltd. | Retail Equity Research 18Source: Bloomberg, ICICI Direct Research
1921
1350-1375 range
1046
1167
Gold prices are undergoing an elongated time correction, which is
approaching maturity. We expect prices to trade with a positive bias and test
the upper band of the last five years’ consolidation around $1375 in CY19
Higher base formed at the 50% retracement of the
2001-11 multifold rally
2001-2011 multifold rally
1124
Monthly RSI is seen sustaining above the bull market support level of 40

ICIC
I S
ecurit
ies –
Retail E
quit
y R
esearch
MO
ME
NT
UM
PIC
K
Brent ($55): Upsides capped…
December 21, 2018 ICICI Securities Ltd. | Retail Equity Research 19Source: Bloomberg, ICICI Direct Research
128
86.75
116
147.5
Upside in Brent prices looks capped as it has major hurdle
around $68-70 levels:
- recent trendline breakdown area
- 50% retracement of previous decline (86-57)
Confluence of the
multiple retracement
around $50-makes it a
major support in
medium term
Monthly MACD giving bearish crossover signaling loss of positive momentum
Brent prices uptrend of last two years has reversed as
breakdown below rising trendline. We expect it to consolidate in
medium term and oscillate in the broad range of $ 50-70
Monthly Bar Chart
44
27

ICIC
I S
ecurit
ies –
Retail E
quit
y R
esearch
MO
ME
NT
UM
PIC
K
LME Aluminium ($1927): Consolidating with corrective bias…
Monthly Bar chart
December 21, 2018 ICICI Securities Ltd. | Retail Equity Research 20Source: Bloomberg, ICICI Direct Research
1251
1424
75% retracement
@ 2772
3292
Monthly MACD developed negative cross over indicating waning bullish momentum
Aluminium prices forming lower high and lower low signalling a
corrective bias. Upside looks capped around $2500 and pull
backs to be short lived given weak price structure. Key support
around 1650-1700 levels
80% retracement
@ 2602
Major support @ 1650
-80% retracement
- Long term trendline support

ICIC
I S
ecurit
ies –
Retail E
quit
y R
esearch
MO
ME
NT
UM
PIC
K
LME Copper ($ 5990): Slower pace of rally indicates structural weakness…
Monthly Bar chart
December 21, 2018 ICICI Securities Ltd. | Retail Equity Research 21Source: Bloomberg, ICICI Direct Research
2768
50 retracement
@ 7323
4310
10179
2017-18 rally being reversed. Slower pace and magnitude of rally resulted
in lower top on longer duration and indicates benign prices ahead.
Upsides capped at 7000 with key support around 5000-5200 levels
Major support around 5000
-80% retracement
- long term trend line support

ICIC
I S
ecurit
ies –
Retail E
quit
y R
esearch
MO
ME
NT
UM
PIC
K
Rupee (70): Consolidation in range of 67-74 likely...
Monthly bar chart (Inverted scale)
December 21, 2018 ICICI Securities Ltd. | Retail Equity Research 22Source: Bloomberg, ICICI Direct Research
52.2
39.2
68.8
43.8
The rupee in a General Election year usually consolidates after sharp
depreciation in a pre-election year. The same rhythm is likely to follow in the
coming year as we expect the rupee to consolidate in the range of 67-75. The
recent low of 74.50 is likely to be a major support in the coming year
Key hurdle at 67 levels
- Rising trendline joining lows since
2011
- Recent breakdown area
- 61.8% retracement of previous
decline (63.20-74.45)
Key support at 74.50
Consolidation during
2004 General Election
Consolidation during
2009 General Election
Consolidation during
2014 General Election
Election Month
% Return 6 M prior to
General Election
% Return 6 M post
to General Election
May-14 1.89 4.49
May-09 -1.28 -7.12
May-04 1.81 -2.34
Rupee Returns 6 Months Prior & Post to General Election Month
68.8
63.2
46.5

ICIC
I S
ecurit
ies –
Retail E
quit
y R
esearch
MO
ME
NT
UM
PIC
K
December 21, 2018 ICICI Securities Ltd. | Retail Equity Research 23Source: ICICI Direct Research
Performance Scorecard
Yearly Technical Recommendation 2018 follow up
Rec. Date Stock Recommended Rec Price Target Stop loss % Profit/Loss Comment
21-Dec-17 Bharti Airtel 520.00 668.00 410.00 -21.0 Stoploss triggered
21-Dec-17 Axis Bank 540.00 638.00 485.00 10.0 Booked profit at 592.00
21-Dec-17 Punjab National Bank 167.00 230.00 138.00 16.0 Booked profit at 194.00
21-Dec-17 Tata Chemicals 722.00 878.00 634.00 0.0 Closed near cost at 718.00
21-Dec-17 RCF 91.00 130.00 68.00 -25.0 Stoploss triggered
21-Dec-17 EIH Ltd 145.00 228.00 125.00 57.0 Target Achieved
21-Dec-17 Brigade Enterprises 305.00 420.00 231.00 -24.0 Stoploss triggered
13-Dec-16 Zee Media 37.00 54.00 31.00 21.0 Booked profit at 44.80
23%
27%
33%
25%
28%26%
79%
0
20
40
60
80
100
10
15
20
25
30
35
2013 2014 2015 2016 2017 2018
Strik
e R
ate (%
)
Avg. R
eturn o
n P
ositiv
e C
alls (%
)
Avg. return on positive calls Avg. Strike Rate
Year
Click here to go to top

ICIC
I S
ecurit
ies –
Retail E
quit
y R
esearch
MO
ME
NT
UM
PIC
K
Pankaj Pandey Head – Research [email protected]
ICICI Direct Research Desk,
ICICI Securities Limited,
1st Floor, Akruti Trade Centre,
Road No 7, MIDC,
Andheri (East)
Mumbai – 400 093
December 21, 2018 ICICI Securities Ltd. | Retail Equity Research 24

ICIC
I S
ecurit
ies –
Retail E
quit
y R
esearch
MO
ME
NT
UM
PIC
K
We /I, Dharmesh Shah, Nitin Kunte, Ninad Tamhanekar, Pabitro Mukherjee, Vinayak Parmar Research Analysts, authors and the names subscribed to this report, hereby certify that all of the views expressed in this research report accurately reflect our views about the subject
issuer(s) or securities. We also certify that no part of our compensation was, is, or will be directly or indirectly related to the specific recommendation(s) or view(s) in this report.
Terms & conditions and other disclosures:
ICICI Securities Limited (ICICI Securities) is a full-service, integrated investment banking and is, inter alia, engaged in the business of stock brokering and distribution of financial products. ICICI Securities Limited is a SEBI registered Research Analyst with SEBI Registration
Number – INH000000990. ICICI Securities Limited Sebi Registration is INZ000183631 for stock broker. ICICI Securities is a wholly-owned subsidiary of ICICI Bank which is India’s largest private sector bank and has its various subsidiaries engaged in businesses of housing
finance, asset management, life insurance, general insurance, venture capital fund management, etc. (“associates”), the details in respect of which are available on www.icicibank.com
ICICI Securities is one of the leading merchant bankers/ underwriters of securities and participate in virtually all securities trading markets in India. We and our associates might have investment banking and other business relationship with a significant percentage of companies
covered by our Investment Research Department. ICICI Securities generally prohibits its analysts, persons reporting to analysts and their relatives from maintaining a financial interest in the securities or derivatives of any companies that the analysts cover.
The information and opinions in this section have been prepared by ICICI Securities and are subject to change without any notice. The report and information contained herein is strictly confidential and meant solely for the selected recipient and may not be altered in any way,
transmitted to, copied or distributed, in part or in whole, to any other person or to the media or reproduced in any form, without prior written consent of ICICI Securities. While we would endeavour to update the information herein on reasonable basis, ICICI Securities is under
no obligation to update or keep the information current. Also, there may be regulatory, compliance or other reasons that may prevent ICICI Securities from doing so. Non-rated securities indicate that rating on a particular security has been suspended temporarily and such
suspension is in compliance with applicable regulations and/or ICICI Securities policies, in circumstances where ICICI Securities might be acting in an advisory capacity to this company, or in certain other circumstances.
The research recommendations are based on information obtained from public sources and sources believed to be reliable, but no independent verification has been made nor is its accuracy or completeness guaranteed. These research recommendations and information
herein is solely for informational purpose and shall not be used or considered as an offer document or solicitation of offer to buy or sell or subscribe for securities or other financial instruments. ICICI Securities will not treat recipients as customers by virtue of their receiving
these recommendations. Nothing in this section constitutes investment, legal, accounting and tax advice or a representation that any investment or strategy is suitable or appropriate to your specific circumstances. The securities discussed and opinions expressed herein may
not be suitable for all investors, who must make their own investment decisions, based on their own investment objectives, financial positions and needs of specific recipient. This may not be taken in substitution for the exercise of independent judgment by any recipient. The
recipient should independently evaluate the investment risks. The value and return on investment may vary because of changes in interest rates, foreign exchange rates or any other reason. ICICI Securities accepts no liabilities whatsoever for any loss or damage of any kind
arising out of the use of these recommendations. Past performance is not necessarily a guide to future performance. Investors are advised to see Risk Disclosure Document to understand the risks associated before investing in the securities markets. Actual results may differ
materially from those set forth in projections. Forward-looking statements are not predictions and may be subject to change without notice.
ICICI Securities or its associates might have managed or co-managed public offering of securities for the subject company or might have been mandated by the subject company for any other assignment in the past twelve months.
ICICI Securities or its associates might have received any compensation from the companies mentioned herein during the period preceding twelve months from the date of these recommendations for services in respect of managing or co-managing public offerings, corporate
finance, investment banking or merchant banking, brokerage services or other advisory service in a merger or specific transaction.
ICICI Securities or its associates might have received any compensation for products or services other than investment banking or merchant banking or brokerage services from the companies mentioned herein in the past twelve months.
ICICI Securities encourages independence in research report preparation and strives to minimize conflict in preparation of research report. ICICI Securities or its associates or its Analysts did not receive any compensation or other benefits from the companies mentioned in the
report or third party in connection with preparation of the research report. Accordingly, neither ICICI Securities nor Research Analysts and their relatives have any material conflict of interest at the time of publication of this reports.
It is confirmed that Dharmesh Shah, Nitin Kunte, Ninad Tamhanekar, Pabitro Mukherjee and Vinayak Parmar, Research Analysts giving these recommendations have not received any compensation from the companies mentioned herein in the preceding twelve months.
Compensation of our Research Analysts is not based on any specific merchant banking, investment banking or brokerage service transactions
ICICI Securities or its subsidiaries collectively or Research Analysts or their relatives do not own 1% or more of the equity securities of the company/companies mentioned herein as of the last day of the month preceding the publication of these research recommendations.
Since Associates (ICICI group companies) of ICICI Securities are engaged in various financial service businesses, they might have financial interests or beneficial ownership in various companies including the subject company/companies mentioned herein.
It is confirmed that Research Analysts do not serve as an officer, director or employee or advisory board member of the companies mentioned herein.
ICICI Securities may have issued other reports that are inconsistent with and reach different conclusion from the information presented herein.
Neither the Research Analysts nor ICICI Securities have been engaged in market making activity for the companies mentioned herein.
We submit that no material disciplinary action has been taken on ICICI Securities by any Regulatory Authority impacting Equity Research Analysis activities.
This report or recommendations are not directed or intended for distribution to, or use by, any person or entity who is a citizen or resident of or located in any locality, state, country or other jurisdiction, where such distribution, publication, availability or use would be contrary
to law, regulation or which would subject ICICI Securities and affiliates to any registration or licensing requirement within such jurisdiction. The securities described herein may or may not be eligible for sale in all jurisdictions or to certain category of investors. Persons in
whose possession this document may come are required to inform themselves of and to observe such restriction
December 21, 2018 ICICI Securities Ltd. | Retail Equity Research 25