Yearly survey on milk recording systems in ICAR member ... OF CONTENT COW SURVEY SHEEP SURVEY Table...
131
Yearly survey on the situation of MILK RECORDING SYSTEMS (Years 2014 and 2015) in ICAR member countries for cow, sheep and goats
Transcript of Yearly survey on milk recording systems in ICAR member ... OF CONTENT COW SURVEY SHEEP SURVEY Table...

Yearly survey on the situation of
MILK RECORDING SYSTEMS (Years 2014 and 2015)
in ICAR member countries for cow, sheep and goats

Page 2
Table 1 - National milk production ..........................................................................................................................7Table 2 - Position of milk recording: Methods and Organisations ....................................................................12Table 3 - Costs and financing ................................................................................................................................18Table 4.1 - All breeds together - All recorded cows ............................................................................................21Table 4.2 - All breeds together - Cows in herdbook ............................................................................................26Table 4.2 - All breeds together - Cows in herdbook ............................................................................................27Table 4.2 - All breeds together - Cows in herdbook ............................................................................................28Table 4.3 - Main breeds - All recorded cows ........................................................................................................29Table 4.4 - Main breeds - Cows in herdbook ........................................................................................................51
TABLE OF CONTENT
COW SURVEY
SHEEP SURVEYTable 1A - Milk recording and management of the lactation ..............................................................................68Table 1B - Methods of milk recording ...................................................................................................................74Table 2A - Type of lactation calculation for milk yield ........................................................................................77Table 2B - Milk yield results ...................................................................................................................................81Table 3 - Optional tests for milk composition ......................................................................................................84Table 4 - Recording of non-milking traits .............................................................................................................88Table 5 - Milk recording equipment used in case of machine milking ..............................................................90Table 6 - Breeding programme using artificial insemination .............................................................................91Table 7 - Molecular information .............................................................................................................................94

Page 3
GOAT SURVEYTable 1A - Milk recording and management of the lactation ..............................................................................98Table 1B - Methods of milk recording .................................................................................................................104Table 2A - Type of lactation calculation for milk yield ......................................................................................107Table 2B - Milk yield results ................................................................................................................................. 111Table 3 - Optional tests for milk composition .................................................................................................... 114Table 4 - Recording of non-milking traits ........................................................................................................... 117Table 6 - Breeding programme using artificial insemination ...........................................................................121Table 7 - Molecular information ...........................................................................................................................122
ICAR Member Organisations participating in the survey .................................................................................123

Page 4
Preface
Billions of people consume milk and dairy products worldwide. Milk is no longer viewed solely as a source of nutrients for new-born children and, alongside dairy products, is now viewed as a fundamental source of protein and energy for all consumers. Milk and dairy products also offer significant opportunities for farmers, processors, retailers and other stakeholders within the dairy value chain.
At the primary level of the sector is raw production, which requires consumers, industry and governments to understand the complex relations between its various components. In order to facilitate this understanding, up-to-date information on the contribution to the economy of milk and dairy products must be provided, including how best to develop the dairy industry to effectively increase food security and generate maximum income for the entire value chain.
ICAR has been collecting data since 1996 on national milk production, milk recording and the cost of the whole milk production chain, together with information about the source of its funding. Particularly relevant in this publication are the sections in which the productivity of each of the many breeds that comprise the national sector is assessed, so that even minor breeds can be described and their contributions to the national statistics can be evaluated at the correct scale. This data was initially collected only for the cow milking sector but since 2008 the sheep and goat milking sectors have been included in the survey.
This publication incorporates dairy sector primary production information from a wide range of sources in a unique manner that examines the existing relationships between farmers, dairying and dairy-industry development. This collaboration by ICAR’s many national Members, including leading and coordinating the planning, preparation and publication process, has made this booklet possible.

Page 5
In producing this booklet, ICAR aims to provide:
• an in-depth look at the most sensitive step in the dairy chain and nutrition within the national primary production dairy sector,
going from milk production to consumption
• a realistic picture of the various national distinctions and the differences in scale of the dairy sector in the analysed countries
• insights into dairy’s potential by presenting specific stakeholder actions to improve future production and planning
The technical editorial team wishes to thank all who gave so generously of their expertise, time and energy, particularly the following ICAR Members who supported the production of this booklet::
• Australia (by ADHIS)• Austria• Belgium (Wallonia Region)• Canada (by Canadian DHI)• Chile• China (by Shanghai Dairy Breeding Center Co)• China (Dairy Cattle Research Centre of Shandong)• Croatia• Czech Rep. (by CMSCH)• Estonia• Finland• France• Germany (by ADR)• Hungary (by LPT)
• Hungary (by NEBIH)• Ireland• Israel• Italy• Latvia• Lithuania• Morocco• New Zealand (by DairyNZ)• New Zealand (by LIC)• Norway• Poland (by PFHB)• Serbia• Slovak Republic• Slovenia

Page 6
• South Africa (by ARC)• South Korea (by DCIC Centre)• South Korea (by KAI Assoc.)• Spain• Sweden• Switzerland• Taiwan• The Netherlands (by CRV)
• Tunisia• Turkey (by Cattle Breed. Assoc.)• UK (by CIS)• UK (by NMR)• UK (by Royal Jersey Agricultural and Horticultural Society,
Royal Jersey Showground)• Uruguay• USA
NOTE:
This publication is based on the data submitted by each ICAR Member Organisation and that are available on the on-line ICAR database at: www.icar.org > Publications > On-line databases ...
The database is available at: www.icar.org/survey/pages/tables.php
ICAR also advices that data hereby collected were downloaded for each species on:
• 20 August for the Cow survey
• 10 September for the Goat survey
• 15 September for the Sheep survey
ICAR Member Organisations are encouraged to submit and complete the missing data by 15 November 2016, i.e. before the finalisation of the present booklet and its distribution to the
competent authorities

Page 7
Cow Survey (Years 2014 and 2015)
Cow survey (Years 2014 and 2015)

Page 8
Cow survey (Years 2014 and 2015)

Page 9
Table 1 - National milk production
Country Year
Total number of dairy cows
Total number of dairy herds
Average of cows per
herd
Average milk production per
cow per year (kg)
Percent of fat production per
cow per year (%)
Percent of protein production per
cow per year (%) Australia (ADHIS) 2014 1.690.000 6.314 268 5.471 4,07 3,37 Australia (ADHIS) 2015 1.740.000 6.128 284 5.731 4,11 3,38 Austria 2014 534.000 31.500 17 6.542 4,12 3,39 Austria 2015 Belgium (Wallonia Region)
2014 207.102 3.409 61 6.772 3,96 3,35
Belgium (Wallonia Region)
2015 202.825 3.252 62
Canada (Canadian DHI)
2014 959.300 11.962 80 8.984 4,00 3,27
Chile 2015 420.000 12.500 33 5.900 3,88 3,52 China (Shanghai Dairy Breeding Center Co)
2014 74.869 99 757 4.660 3,59 3,18
China (Shanghai Dairy Breeding Center Co)
2015 81.718 96 852 4.560 3,61 3,19
China (Dairy Cattle Research Centre of Shandong)
2014 49.870 106 470 25 3,87 3,31
China (Dairy Cattle Research Centre of Shandong)
2015 70.447 121 582 27 3,88 3,26
Croatia 2014 164.347 10.003 16 4.235 4,08 3,40 Croatia 2015 159.268 8.746 18 4.269 4,05 3,39
COW SURVEY
Cow survey (Years 2014 and 2015)

Page 10
Table 1 - National milk production
Country Year
Total number of dairy cows
Total number of dairy herds
Average of cows per
herd
Average milk production per
cow per year (kg)
Percent of fat production per
cow per year (%)
Percent of protein production per
cow per year (%) Czech Rep. 2014 370.721 7.921 3,87 3,42 Czech Rep. 2015 Estonia 2014 97.267 2.637 37 8.233 4,00 3,40 Estonia 2015 95.611 2.303 42 8.337 3,90 3,40 Finland 2014 285.246 8.567 33 8.645 4,28 3,48 Finland 2015 284.140 7.893 36 8.808 4,32 3,47 France 2014 3.697.000 63.581 58 6.990 Germany 2014 4.295.680 76.469 56 7.541 4,07 3,41 Germany 2015 4.284.639 73.255 59 7.600 4,07 3,40 Hungary 2014 256.000 12.400 20 7.200 3,65 3,23 Hungary 2014 256.000 12.400 20 7.200 3,65 3,23 Ireland 2014 1.140.000 17.000 67 5.200 3,98 3,43 Ireland 2015 1.295.000 17.500 74 4,03 3,50 Israel1 2014 111.786 578 193 12.083 3,64 3,27 Israel1 2015 107.212 553 194 11.772 3,71 3,30 Italy 2014 1.923.000 Latvia 2014 165.167 21.545 8 5.812 Lithuania 2014 318.184 61.770 5 Lithuania 2015 310.035 55.936 6 Morocco 2015 360.000 104.000 4 5.200 3,80 3,40 New Zealand (by DairyNZ)
2015 5.018.333 11.970 419 377 4,78 3,84
New Zealand (by LIC)
2014 5.018.333 11.970 419 4.371 4,87 3,75
1 Cows in herdbook
Cow survey (Years 2014 and 2015)

Page 11
Table 1 - National milk production
Country Year
Total number of dairy cows
Total number of dairy herds
Average of cows per
herd
Average milk production per
cow per year (kg)
Percent of fat production per
cow per year (%)
Percent of protein production per
cow per year (%) Norway 2014 229.600 9.364 25 7.599 4,24 3,44 Norway 2015 228.400 8.889 26 7.748 4,29 3,46 Poland (by PFHB) 2014 2.247.785 285.705 8 5.682 4,01 3,27 Poland (by PFHB) 2015 2.134.091 264.897 8 5.841 4,01 3,28 Serbia2 2014 85.000 4.459 Serbia2 2015 80.000 4.463 Slovak Republic 2014 144.984 6.505 3,82 3,35 Slovak Republic 2015 140.837 6.733 3,77 3,30 South Africa 2014 680.000 1.690 403 4.617 South Africa 2015 670.000 1.660 404 4.984 South Korea (by DCIC Centre)
2015 233.118 5.498 42 9.301 3,92 3,26
South Korea (by KAI Assoc.)
2014 248.248 5.693 44 9.223 3,96 3,21
South Korea (by KAI Assoc.)
2015 233.118 5.498 75 10.285 3,76 3,22
Spain 2014 844.791 21.699 39 8.298 3,60 3,20 Spain3 2015 844.114 16.399 51 8298 3,60 3,20 Sweden 2014 344.000 4.300 80 8500 4,25 3,42 Sweden 2015 336.000 4.172 81 8730 4,25 3,42 Switzerland 2014 585.501 22.597 26 5832 4,07 3,32 Switzerland 2015 576.517 21.765 27 5838 4,08 3,31 Taiwan 2014 60.103 550 109 6042 3,84 3,29
2 Data relating to the region AP Vojvodina in Serbia 3 Please, notice that there is a change in the total number of dairy herds figures, due to the end of the milk quota, and the change of the parameter used to fill this tables. This change could influence in the whole survey.
Cow survey (Years 2014 and 2015)

Page 12
Table 1 - National milk production
Country Year
Total number of dairy cows
Total number of dairy herds
Average of cows per
herd
Average milk production per
cow per year (kg)
Percent of fat production per
cow per year (%)
Percent of protein production per
cow per year (%) Taiwan 2015 60.932 547 111 6006 3,83 3,30 The Netherlands (by CRV)
2014 1.438.736 15.941 90 8376 4,33 3,53
Tunisia 2014 239.630 11.846 20 5665 3,61 3,17 Tunisia 2015 259.420 12.945 20 5616 3,62 3,11 Turkey (by Cattle Breed. Assoc.)
2014 5.609.240 2.074.439 3 3030
Turkey (by Cattle Breed. Assoc.)
2015 5.535.774 2.074.439 3 3059
UK - England (by CIS)
2014 230.889 1.239 186 8283 4,11 3,28
UK - England (by CIS)
2015 237.133 1.232 192 8412 4,10 3,28
UK - England+Wales (by NMR)
2014 683.132 3.999 170 9490 4,04 3,30
UK - England+Wales (by NMR)
2015 667.819 3.768 177 8390 4,03 3,33
Cow survey (Years 2014 and 2015)

Page 13
Table 1 - National milk production
Country Year
Total number of dairy cows
Total number of dairy herds
Average of cows per
herd
Average milk production per
cow per year (kg)
Percent of fat production per
cow per year (%)
Percent of protein production per
cow per year (%) UK - Jersey Island 2014 2.923 23 127 4743 5,15 3,78 UK - Jersey Island 2015 2.990 23 130 5249 5,25 3,72 UK - N. Ireland (by CIS)
2014 95.581 688 138 7153 4,05 3,30
UK - N. Ireland (by CIS)
2015 91.182 636 143 7463 3,97 3,26
UK - N. Ireland (by NMR)
2014 54.998 385 143 9150 4,03 3,26
UK - N. Ireland (by NMR)
2015 55.380 367 151 8910 4,06 3,26
UK - Scotland (by CIS)
2014 100.674 535 188 8228 3,98 3,25
UK - Scotland (by CIS)
2015 104.967 533 196 8208 4,10 3,28
UK - Scotland (by NMR)
2014 19.512 64 304 10660 3,89 3,26
UK - Scotland (by NMR)
2015 18.075 57 317 10330 3,94 3,31
UK - Wales 2014 32.126 191 168 8027 4,19 3,29 UK - Wales 2015 33.880 190 178 8073 4,18 3,28 Uruguay4 2014 425.150 4.300 99 5270 3,72 3,37 USA5 2014 9.257.000 45.344 204 10096 3,74 USA5 2015 9.317.000 43.584 214 10157
4 Source: MGAP/DIEA 20155 Source: USDA-NASS
Cow survey (Years 2014 and 2015)

Page 14
Table 2 - Position of milk recording: Methods and Organisations
Country Year
Number of recorded
cows
% recorded
cows
Number of recorded
herds
% recorded
herds
Average number of cows per recorded
herd
% recorded
herds per
method A3
% recorded herds per
method A4
% recorded herds per
method A6
% recorded herds per
method AT
% recorded herds per method B
Other methods
Australia 2014 673.099 40 3.023 48 223 Australia 2015 680.537 39 2.880 47 240 Austria 2014 416.525 78 21.476 68 19,3 100 Austria 2015 422.777 79 21.055 20 100 Belgium (Wallonia Region)
2014 74.227 36 947 27 78 0 43 34,53 16 1 6
Belgium (Wallonia Region)
2015 72.803 35 909 28 80 0 40 35,2 17 1 7
Canada 2014 702.298 73 9.125 76 77 Chile 2015 175.000 41 610 5 287 0 38 0 60 2 China (Shanghai DBC)
2014 44.172 59 99 99 757 100
China (Shanghai DBC)
2015 50.662 62 96 96 852 100
China (DCRC Shandong)
2014 49.870 106 470 100
China (DCRC Shandong)
2015 70.447 121 582 100
Croatia 2014 100.871 61 5.767 58 17 52 47,6 Croatia 2015 98.567 62 5.480 63 18 50 50 Czech Rep. 2014 354.835 96 1.446 245 64 1 36 Czech Rep. 2015 356.594 1.419 251 61 1 38 Estonia 2014 92.134 95 764 29 120 100 Estonia 2015 91.222 95 709 31 128 100
Cow survey (Years 2014 and 2015)

Page 15
Table 2 - Position of milk recording: Methods and Organisations
Country Year
Number of recorded
cows
% recorded
cows
Number of recorded
herds
% recorded
herds
Average number of cows per recorded
herd
% recorded
herds per
method A3
% recorded herds per
method A4
% recorded herds per
method A6
% recorded herds per
method AT
% recorded herds per method B
Other methods
Finland 2014 231.763 84 6.180 72 37 1 97 C - 2.8 Finland 2015 229.121 81 5.816 74 39 1 96,5 C - 3.1 France 2014 2.572.024 69 46.617 67 55 35 6 19 12,2 27 France 2015 2.562.183 69 45.064 69 56 34 6 20 13,3 27 Germany (ADR)
2014 3.736.928 87 51.600 68 72
Germany 2015 3.749.481 88 49.496 68 758 Hungary 2014 178.642 70 461 4 387 100 Hungary 2014 178.642 70 461 4 387 100 Ireland 2014 565.078 52 6.552 39 91 0 12 24 0 35 A5-4%,
A7-9%, A8-16%
Ireland 2015 646.340 52 6.637 39 97 0 36 Italy 2014 1.341.365 18.036 77 1 98 Italy 2015 1.369.952 17.959 76 0 Latvia 2014 127.454 77 5.721 27 22 Lithuania 2014 144.850 46 4.040 7 35 1 86 4,5 9 Lithuania 2015 147.560 48 3.930 7 37 1 86 4,6 10 Luxembourg 2014 37.571 83 591 84 63 14 28 38,8 20 Morocco 2015 360.000 8 500 1 5 0 100 0 0 0 New Zealand(by LIC)
2014 3.654.447 73 8.724 72 418 0 0 0 24 76 0
Norway 2014 174.788 98 7.040 98 24 100 Norway 2015 174.918 99 6.800 99 25 100
Cow survey (Years 2014 and 2015)

Page 16
Table 2 - Position of milk recording: Methods and Organisations
Country Year
Number of recorded
cows
% recorded
cows
Number of recorded
herds
% recorded
herds
Average number of cows per recorded
herd
% recorded
herds per
method A3
% recorded herds per
method A4
% recorded herds per
method A6
% recorded herds per
method AT
% recorded herds per method B
Other methods
Poland 2014 733.240 33 20.704 7 35 14 80 A8=5,7%;: A4=25,7%
; AT4=70,5
% A8=3,8%
Poland 2015 753.613 36 20.969 8 35 13 83 A8=4,9%: A4=25,2%
; AT4=71,5
% A8=3,3%
Serbia1 2014 44.886 53 3.357 16 13 100 Serbia1 2015 52.747 66 3.378 16 15 100 Slovak Republic
2014 120.217 82 583 206 1 99
Slovak Republic
2015 117.135 82 582 198 1 99
South Africa 2014 36.708 5 213 13 172 South Africa 2015 32.336 5 207 13 156 South Korea (by DCIC Centre)
2014 159.068 64 3.309 58 48 100
South Korea (DCIC Centre)
2015 148.608 64 3.214 59 46 100
South Korea (KAI Assoc.)
2014 159.068 64 3.309 58 48 100
1 Data relating to the region AP Vojvodina in Serbia
Cow survey (Years 2014 and 2015)

Page 17
Table 2 - Position of milk recording: Methods and Organisations
Country Year
Number of recorded
cows
% recorded
cows
Number of recorded
herds
% recorded
herds
Average number of cows per recorded
herd
% recorded
herds per
method A3
% recorded herds per
method A4
% recorded herds per
method A6
% recorded herds per
method AT
% recorded herds per method B
Other methods
South Korea (KAI Assoc.)
2015 148.608 64 3.214 58 46 100
Spain 2014 500.971 59 6.756 31 74 9 91 1 Spain 2015 554.374 66 6.767 41 81 4 96 0,13 Sweden 2014 277.324 84 3.300 80 80 100 Sweden 2015 268.664 81 3.068 70 83 100 Switzerland 2014 459.789 79 23.604 100 19 0 33 0 67 0 Switzerland 2015 461.665 80 23.025 100 20 0 30 0 70 0 Taiwan2 2014 25.699 42 164 30 157 100 Taiwan3 2015 26.784 44 169 31 159 100 The Netherlands (by CRV)
2014 1.438.736 91 15.941 84 90 0,5 43 56,1 0 0 A5 = 7.1
Tunisia 2014 19.338 8 956 8 20 1,8 28 69 Tunisia 2015 19.319 7 964 7 20 1,56 26 73 Turkey 2014 1.911.787 34 159.420 8 12 0 0 0 0 100 Turkey 2015 2.050.555 37 164.577 12 0 0 0 0 100 UK - England(by CIS)
2014 230.889 1.239 186 353 70 328 465
UK - England(by CIS)
2015 237.133 1.232 192 27 6 27 40 19
UK - England+Wales (by NMR)
2014 501.959 74 3.976 170 0,1 70 3,1 43 22 2
2 Highest Milk Yield = 69 Kg/Day; Highest Herd Average = 33.76Kg/Day 3 Highest Milk Yield = 82 Kg/Day; Highest Herd Average = 34.04Kg/Day
Cow survey (Years 2014 and 2015)

Page 18
Table 2 - Position of milk recording: Methods and Organisations
Country Year
Number of recorded
cows
% recorded
cows
Number of recorded
herds
% recorded
herds
Average number of cows per recorded
herd
% recorded
herds per
method A3
% recorded herds per
method A4
% recorded herds per
method A6
% recorded herds per
method AT
% recorded herds per method B
Other methods
UK - England+Wales (by NMR)
2015 503.604 75 3.863 169 0,13 75 3 45 23 2
UK - Jersey Island
2014 2.923 23 127 9 0 11 3 0
UK - Jersey Island
2015 2.927 23 127 52 0 35 13 0
UK - N. Ireland (by CIS)
2014 95.581 688 138 36 6 37 16 36
UK - N. Ireland (by CIS)
2015 91.182 636 143 38 6 36 14 33
UK - N. Ireland (by NMR)
2014 34.548 64 354 143 0 47 9,5 51 16 27
UK - N. Ireland (by NMR)
2015 33.396 60 344 151 0 49 9,7 53 14 27
UK - Scotland (by CIS)
2014 100.674 535 188 340 19 77 82
UK - Scotland (by CIS)
2015 104.967 533 196 62 3 15 16
UK - Scotland (by NMR)
2014 9.997 51 56 304 0 74 6 22 20 0
Cow survey (Years 2014 and 2015)

Page 19
Table 2 - Position of milk recording: Methods and Organisations
Country Year
Number of recorded
cows
% recorded
cows
Number of recorded
herds
% recorded
herds
Average number of cows per recorded
herd
% recorded
herds per
method A3
% recorded herds per
method A4
% recorded herds per
method A6
% recorded herds per
method AT
% recorded herds per method B
Other methods
UK - Scotland (by NMR)
2015 8.610 48 56 317 0 81 3,5 16 12 4
UK - Wales 2014 32.126 191 168 21 6 34 37 UK - Wales 2015 33.880 190 178 21 5 36 35 5 Uruguay 2015 103.000 24 317 13 325 USA - (by NDHIA)4
2014 4.353.277 18.344 237 27 73
USA - (by NDHIA)4
2015 4.383.422 17.984 244 28 73
4 DHI Participation
Cow survey (Years 2014 and 2015)

Page 20
Table 3 - Costs and financing
Country Year
Cost price of milk
recording per cow and per
year - A4
Cost price of milk
recording per cow and per
year - A6
Cost price of milk
recording per cow and per
year - AT
Cost price of milk
recording per cow and per
year - B
Part of the cost price paid by the producer -
A4
Part of the cost price paid by the
producer % - A6
Part of the cost price
paid by the producer % -
AT
Part of the cost price paid by the producer %
- B Chile 2015 18,5 14,5 12 100 100 100
China (Shanghai DBC)
2014 10,5 0
China (Shanghai DBC)
2015 10,5 0
China (DCRC Shandong)1
2014 7
China (DCRC Shandong)1
2015 7
Croatia 2014 35 30 50 50
Croatia 2015 35 30 50 50
Czech Rep. 2014
Czech Rep. 2015
Estonia 2014 18 80
Estonia 2015 25 84
France 2014 50 43 40 100 100 100 100
France 2015 50 43 40 100 100 100
1 Cost price of milk recording per cow and per year method B is 7RMB
Cow survey (Years 2014 and 2015)

Page 21
Table 3 - Costs and financing
Country Year
Cost price of milk
recording per cow and per
year - A4
Cost price of milk
recording per cow and per
year - A6
Cost price of milk
recording per cow and per
year - AT
Cost price of milk
recording per cow and per
year - B
Part of the cost price paid by the producer -
A4
Part of the cost price paid by the
producer % - A6
Part of the cost price
paid by the producer % -
AT
Part of the cost price paid by the producer %
- B Hungary2 2014 30,3 100
Hungary2 2014 30,3 100
Italy 2014
Latvia 2014 9,72 10 0 0
Latvia 2015 9,72 10
Morocco 2015 200 100
New Zealand (by LIC)
2014 0 0 0 11 0 0 0
Serbia3 2014 40 100
Serbia3 2015 40 100
Slovak Republic
2014 57,03 44,66 67 67
Slovak Republic
2015 65,2 51,34 67 67
Spain4 2014 140,3 70
Spain4 2015 141,4 70
2 Cost_cowA4= 10.4 EUR/cow/year; 30,3 kg milk 3 Data relating to the region AP Vojvodina in Serbia 4 140,3 is the cost price of milk recording per cow and per year-A4+AT **70 is the part of the cost price paid by the producer- A4+AT
Cow survey (Years 2014 and 2015)

Page 22
Table 3 - Costs and financing
Country Year
Cost price of milk
recording per cow and per
year - A4
Cost price of milk
recording per cow and per
year - A6
Cost price of milk
recording per cow and per
year - AT
Cost price of milk
recording per cow and per
year - B
Part of the cost price paid by the producer -
A4
Part of the cost price paid by the
producer % - A6
Part of the cost price
paid by the producer % -
AT
Part of the cost price paid by the producer %
- B Sweden5 2014 45 100
Sweden6 2015 55
Switzerland 2014 57 43 30 32
Switzerland 2015 57 43 30 32
Taiwan7 2014 28,2 100
Taiwan 2015 27,7 100
Tunisia 2014 78 78 78 0 0 0
Tunisia 2015 108 108 108 0 0 0
Turkey 2014 0 0 0 15 0 0 0 100
Turkey 2015 0 0 0 18 0 0 0 100
Uruguay 2015 0,18 0,18 100 100
USA - (by NDHIA)
2015 100 100 100
5 Cost expressed as value of kg per cow and year 6 Cost expressed as kg of milk per cow and year. Increase because of new price model which include more. 7 Dairy Association Taiwan
Cow survey (Years 2014 and 2015)

Page 23
Table 4.1 - All breeds together - All recorded cows
Country Year Number of lactations
Length of the lactations (days)
Milk yield per recorded cow (kg)
Milk per cow in305 days (kg)
Percent fat content (%)
Percent protein content (%)
Calving interval (days)
Australia 2014 673.099 327 6.890 6.890 4,00 3,30 Australia 2015 680.537 324 6.976 6.976 4,00 3,30 Austria 2014 345.419 299 7.273 4,12 3,39 398 Austria 2015 353.243 299 7.281 4,13 3,39 398 Belgium (Flemish Region by CRV)
2014 87.412 355 9.328 4,14 3,44 418
Belgium (Wallonia Region)
2014 50.726 356 8.558 7.565 3,93 3,37 419
Belgium (Wallonia Region)
2015 52.582 354 8.635 7.681 3,95 3,37 417
Canada 2014 309.345 305 9.893 3,93 3,22 424 Chile 2015 175.000 324 6.950 7.661 3,71 3,40 416 China (Shanghai DBC)
2014 348 9.078 8.720 3,59 3,18 420
China (Shanghai DBC)
2015 356 9.409 8.830 3,61 3,19 417
China (DCRC Shandong)
2014 2 212 25 7.358 3,87 3,31 449
China (DCRC Shandong)
2015 2 208 27 8.320 3,88 3,26 438
Croatia 2014 70.426 372 6.931 5.895 4,03 3,33 428 Croatia 2015 70.841 368 6.992 5.956 4,00 3,32 423 Czech Rep. 2014 287.502 297 8.370 3,86 3,39 407 Czech Rep. 2015 294.740 297 8.537 3,85 3,40 404 Estonia 2014 92.000 333 8.728 8.758 3,94 3,33 416 Estonia 2015 87.844 339 8.851 8.819 3,94 3,33 416 Finland 2014 231.763 305 9.112 9.187 4,13 3,38 416 Finland 2015 201.521 305 9.438 9.503 4,28 3,50 413
Cow survey (Years 2014 and 2015)

Page 24
Table 4.1 - All breeds together - All recorded cows
Country Year Number of lactations
Length of the lactations (days)
Milk yield per recorded cow (kg)
Milk per cow in305 days (kg)
Percent fat content (%)
Percent protein content (%)
Calving interval (days)
France 2014 2.572.024 340 8.481 7.346 3,93 3,23 420 France 2015 2.562.183 337 8.518 7.410 3,92 3,22 420 Germany 2014 3.704.232 321 8.381 8.224 4,07 3,42 403 Germany 2015 3.713.289 320 8.453 8.315 4,07 3,42 403 Hungary 2014 134.436 298 9.096 3,73 3,30 438 Israel1 2014 78.179 356 13.280 11.795 3,61 3,23 416 Israel1 2015 75.091 358 13.168 11.644 3,62 3,27 417 Italy 2014 835.490 305 8.637 8.637 3,73 3,31 Italy 2015 837.999 305 8.756 8.756 3,71 3,29 Latvia 2014 97.871 377 6.993 6.826 4,12 3,27 Latvia 2015 99.802 376 7.078 7.100 4,10 3,27 Luxembourg 2014 37.571 7.657 4,10 3,40 422 Luxembourg 2015 39.232 7.927 4,10 3,38 422 Morocco 2015 20.000 400 6.000 5.200 3,80 3,40 460 New Zealand (by LIC)
2014 2.586.841 216 4.269 5.391 4,65 3,72 369
Norway 2014 166.999 303 7.599 7.210 4,24 3,44 381 Norway 2015 165.782 303 7.748 7.379 4,29 3,46 381 Poland 2014 733.241 305 7.582 7.582 4,08 3,36 433 Poland 2015 753.613 305 7.771 7.771 4,09 3,36 432 Serbia2 2014 34.579 353 7.098 6.386 3,91 3,21 452 Serbia2 2015 36.338 351 7.202 6.592 3,83 3,23 445 Slovak Republic 2014 86.175 296 7.355 7.522 3,91 3,33 425 Slovak Republic 2015 87.014 296 7.522 7.693 3,84 3,31 423
1 Cows in the herdbook 2 Data relating to the region AP Vojvodina in Serbia
Cow survey (Years 2014 and 2015)

Page 25
Table 4.1 - All breeds together - All recorded cows
Country Year Number of lactations
Length of the lactations (days)
Milk yield per recorded cow (kg)
Milk per cow in305 days (kg)
Percent fat content (%)
Percent protein content (%)
Calving interval (days)
South Africa (by ARC)
2014 54.832 305 6.960 7.400 4,31 3,54 422
South Africa (by ARC)
2015 49.710 232 5.670 7.618 4,19 3,39 431
South Korea (by DCIC Centre)
2014 159.068 10.057 3,79 3,22 464
South Korea (by DCIC Centre)
2015 148.608 10.289 3,76 3,22 466
South Korea (by KAI Assoc.)
2014 305 10.057 3,81 3,21 464
South Korea (by KAI Assoc.)
2015 305 10.289 3,76 3,22 466
Spain 2014 352.795 370 11.415 9.728 3,60 3,20 432 Spain 2015 350.643 368 11.512 9.863 3,60 3,20 430 Sweden3 2014 277.324 365 9.445 4,20 3,47 401 Sweden3 2015 268.664 365 9.611 4,20 3,47 401 Switzerland 2014 352.163 300 7.319 7.429 4,04 3,30 403 Switzerland 2015 350.473 300 7.415 7.509 4,00 3,30 403 Taiwan 2014 25.706 382 9.422 7.523 3,84 3,29 Taiwan 2015 26.785 384 9.933 7.890 3,83 3,30 The Netherlands (by CRV)
2014 949.172 353 9.330 4,36 3,53 417
Tunisia 2014 11.780 369 6.250 5.665 3,61 3,17 449 Tunisia 2015 10.073 368 6.138 5.631 3,62 3,11 454 UK - England (by CIS)
2014 242.118 336 9.384 8.232 4,02 3,21 418
UK - England (by CIS)
2015 260.745 330 9.367 8.279 4,00 3,21 416
3 365 days rolling average
Cow survey (Years 2014 and 2015)

Page 26
Table 4.1 - All breeds together - All recorded cows
Country Year Number of lactations
Length of the lactations (days)
Milk yield per recorded cow (kg)
Milk per cow in305 days (kg)
Percent fat content (%)
Percent protein content (%)
Calving interval (days)
UK - England+Wales (by NMR)
2014 512.576 949 357 8.450 4,04 3,30 413
UK - England+Wales (by NMR)
2015 513.386 353 9.440 8.390 4,03 3,33 410
UK - Jersey Island
2014 3.117 327 5.380 4.894 5,29 3,70 409
UK - Jersey Island
2015 3.382 314 5.357 4.931 5,21 3,71 405
UK - N. Ireland (by CIS)
2014 88.790 331 8.553 7.553 4,00 3,23 414
UK - N. Ireland (by CIS)
2015 93.059 326 8.521 7.582 3,96 3,22 415
UK - N. Ireland (by NMR)
2014 35.438 350 9.150 8.120 4,03 3,26 410
UK - N. Ireland (by NMR)
2015 34.182 340 8.910 7.990 4,06 3,26 408
UK - Scotland (by CIS)
2014 107.521 336 9.347 8.227 3,88 3,12 418
UK - Scotland (by CIS)
2015 115.961 326 9.184 8.182 3,84 3,13 416
UK - Scotland (by NMR)
2014 10.187 363 10.660 9.260 3,89 3,26 411
UK - Scotland (by NMR)
2015 8.750 354 10.330 9.030 3,94 3,31 408
Cow survey (Years 2014 and 2015)

Page 27
Table 4.1 - All breeds together - All recorded cows
Country Year Number of lactations
Length of the lactations (days)
Milk yield per recorded cow (kg)
Milk per cow in305 days (kg)
Percent fat content (%)
Percent protein content (%)
Calving interval (days)
UK - Wales 2014 33.716 335 9.081 7.980 4,11 3,20 420 UK - Wales 2015 38.547 324 8.974 8.963 4,07 3,20 418 USA - (by NDHIA)4
2014 4.353.277 305 10.795 10.795 3,76 3,13
USA - (by NDHIA)3
2015 4.383.422 305 10.928 10.928 3,76 3,12
4 DHI herd averages
Cow survey (Years 2014 and 2015)

Page 28
Table 4.2 - All breeds together - Cows in herdbook
Country YearNumber of lactations
Length of the lactations
(days)
Milk yield per recorded cow
(kg)Milk per cow in 305 days (kg)
Percent fat content
Percent protein content
Calving interval (days)
Australia 2014 76.417 336 6.257 6.257 4,09 3,36Australia 2015 75.580 329 6.244 6.244 4,09 3,38Austria 2014 331.448 299 7.311 4,12 3,40Austria 2015 337.589 299 7.319 4,13 3,39China(ShanghaiDBC)
2014 41.178 348 9.078 8.720 3,59 3,18 420
China(ShanghaiDBC)
2015 44.945 356 9.409 8.830 3,61 3,19 417
Czech Rep. 2014 279.105 297 8.459 3,87 3,39 407Czech Rep. 2015 286.845 296 8.602 3,86 3,41 404Estonia 2014 80.825 338 8.914 8.924 3,93 3,33 416Estonia 2015 77.990 343 9.031 8.972 3,92 3,33 416Finland 2014 43.706 305 9.906 4,11 3,40 416Finland 2015 43.417 305 10.180 4,17 3,44France 2014 2.572.024 340 8.481 7.346 3,93 3,23 420France 2015 2.562.183 337 8.518 7.410 3,92 3,22 420Germany 2014 2.814.266 321 8.609 8.436 4,07 3,43 407Germany 2015 2.828.070 320 8.670 8.514 4,06 3,42 406Hungary 2014 128.220 298 9.166 3,72 3,29 438Italy 2014 835.490 305 8.637 8.637 3,73 3,31Italy 2015 837.999 305 8.756 8.756 3,71 3,29Latvia 2014 37.686 372 7.754 4,14 3,29Latvia 2015 36.027 371 8.144 4,14 3,30Poland 2014 553.831 305 7.578 7.578 4,04 3,30Poland 2015 573.162 305 7.676 7.676 4,01 3,29
Cow survey (Years 2014 and 2015)

Page 29
Table 4.2 - All breeds together - Cows in herdbook
Country YearNumber of lactations
Length of the lactations
(days)
Milk yield per recorded cow
(kg)Milk per cow in 305 days (kg)
Percent fat content
Percent protein content
Calving interval (days)
Serbia 1 2014 26.809 360 7.377 6.624 4,23 3,39 428Serbia1 2015 27.974 357 7.326 6.744 3,89 3,23 433Slovak Rep. 2014 77.636 297 7.491 7.642 3,94 3,34 419Slovak Rep. 2015 76.474 296 8 7.874 3,87 3,32 416South Africa 2014 35.452 305 7.893 8.410 4,28 3,51 437South Africa 2015 32.098 246 6.636 8.563 4,18 3,37 444Spain 2014 352.795 370 11.415 9.728 3,60 3,20 432Spain 2015 350.643 368 11.512 9.863 3,60 3,20 430Switzerland 2014 352.163 300 7.319 7.429 4,04 3,30 403Switzerland 2015 350.473 300 7.415 7.509 4,00 3,30 403Taiwan 2014 35.418Taiwan 2015 34.147TheNetherlands(by CRV)
2014 826.081 353 9.429 4,36 3,54 417
Tunisia 2014 11.780 369 6.250 5.665 3,61 3,17 449Tunisia 2015 10.073 368 6.138 5.631 3,62 3,11 454Turkey 2014 276.244 345 6.966 5.998 3,49 3,22 431UK - England (by CIS)
2014 177.804 338 9.777 8.561 4,01 3,18 419
UK - England (by CIS)
2015 187.522 333 9.793 8.637 3,98 3,18 417
1 Data relating to the region AP Vojvodina in Serbia
Cow survey (Years 2014 and 2015)

Page 30
Table 4.2 - All breeds together - Cows in herdbook
Country YearNumber of lactations
Length of the lactations
(days)
Milk yield per recorded cow
(kg)Milk per cow in 305 days (kg)
Percent fat content
Percent protein content
Calving interval (days)
UK - England+Wales(by NMR)
2014 242.964 360 10.000 8.880 4,03 3,28 416
UK - England+Wales(by NMR)
2015 240.131 355 8.810 8.810 4,02 3,31 414
UK - Jersey Island
2014 3.117 327 5.380 4.894 5,29 3,70 408
UK - Jersey Island
2015 3.379 314 5.359 4.932 5,21 3,71 405
UK - N. Ireland (by CIS)
2014 44.734 338 9.313 8.177 3,97 3,20 421
UK - N. Ireland (by CIS)
2015 47.026 326 8.521 7.582 3,96 3,22 415
UK - N. Ireland (by NMR)
2014 11.905 357 10.170 8.970 4,05 3,24 413
UK - N. Ireland (by NMR)
2015 11.539 346 9.830 8.740 4,09 3,24 416
UK - Scotland (by CIS)
2014 61.296 336 9.725 8.536 3,92 3,16 422
UK - Scotland (by CIS)
2015 64.712 329 9.710 8.614 3,89 3,16 420
UK - Scotland (by NMR)
2014 3.624 373 11.670 9.950 3,93 3,28 425
UK - Scotland (by NMR)
2015 3.347 361 11.470 9.840 3,95 3,31 421
UK - Wales 2014 28.748 337 9.323 8.179 4,08 3,18 422UK - Wales 2015 33.020 326 9.234 8.180 4,05 3,19 419
Cow survey (Years 2014 and 2015)

Page 31
Table 4.3 - Main breeds - All recorded cows
Country Year Breed
Number of
lactations
Length of the lactations
(days)
Milk yield per recorded cow
(kg)
Milk per cow in 305 days
(kg)
Percent fat
content
Percent protein content
Calving interval (days)
Austria 2014 Braunvieh 41.878 301 7.161 4,15 3,46
Austria 2015 Braunvieh 41.620 301 7.185 4,16 3,46
Austria 2014 Fleckvieh 255.315 298 7.172 4,13 3,41
Austria 2015 Fleckvieh 261.989 298 7.176 4,15 3,40
Austria 2014 Grauvieh 2.973 294 4.949 3,97 3,29
Austria 2015 Grauvieh 3.004 294 4.946 3,95 3,27
Austria 2014 Holstein 37.966 300 8.592 4,06 3,28
Austria 2015 Holstein 39.237 300 8.592 4,07 3,28
Austria 2014 Pinzgauer 6.067 298 5.655 3,86 3,27
Austria 2015 Pinzgauer 6.043 298 5.666 3,87 3,25
Belgium(Flemish Region by CRV)1
2014 Holstein Black & White
44.395 359 10.007 8.945 4,09 3,43 418
Belgium(Flemish Region by CRV)
2014 Holstein Red & White
13.708 356 8.948 8.084 4,30 3,50 418
Belgium(WalloniaRegion)
2014 Blanc-BleuBelge
2.301 301 4.362 4.211 3,59 3,27 389
Belgium(WalloniaRegion)
2015 Blanc-BleuBelge
2.313 298 4.378 4.222 3,63 3,26 389
1 753 kgs f+p
Cow survey (Years 2014 and 2015)

Page 32
Table 4.3 - Main breeds - All recorded cows
Country Year Breed
Number of
lactations
Length of the lactations
(days)
Milk yield per recorded cow
(kg)
Milk per cow in 305 days
(kg)
Percent fat
content
Percent protein content
Calving interval (days)
Belgium(WalloniaRegion)
2014 Holstein 40.894 360 8.908 7.837 3,92 3,36 421
Belgium(WalloniaRegion)
2015 Holstein 42.047 358 9.023 7.983 3,93 3,36 420
Belgium(WalloniaRegion)
2014 Montbeliarde 755 343 7.401 6.672 3,81 3,45 406
Belgium(WalloniaRegion)
2015 Montbeliarde 987 344 7.747 7.004 3,87 3,45 404
Belgium(WalloniaRegion)
2014 Normande 268 339 6.766 3.162 4,10 3,56 402
Belgium(WalloniaRegion)
2015 Normande 295 337 6.817 6.211 4,09 3,56 409
Belgium(WalloniaRegion)
2014 Red Holstein 6.508 355 8.054 7.200 4,10 3,42 417
Belgium(WalloniaRegion)
2015 Red Holstein 6.481 350 8.110 7.308 4,11 3,42 413
Belgium(WalloniaRegion)
2015 Rouge-Pie Est de la Belgique
459 304 5.087 5.061 4,19 3,46 393
Canada 2014 Ayrshire 8.146 305 7.781 4,11 2,61
Cow survey (Years 2014 and 2015)

Page 33
Table 4.3 - Main breeds - All recorded cows
Country Year Breed
Number of
lactations
Length of the lactations
(days)
Milk yield per recorded cow
(kg)
Milk per cow in 305 days
(kg)
Percent fat
content
Percent protein content
Calving interval (days)
Canada 2014 Brown Swiss 1.731 305 8.401 4,20 3,49
Canada 2014 Canadienne 194 305 5.752 4,34 3,57
Canada 2014 Guernsey 370 305 6.759 4,69 3,43
Canada 2014 Holstein 287.223 305 10.102 3,87 3,19
Canada 2014 Jersey 11.334 305 6.610 5,00 3,80
Canada 2014 MilkingShorthorn
347 305 6.806 3,94 3,28
China(Shanghai DBC)
2014 Holstein 41.178 348 9.078 8.720 3,59 3,18 420
China(Shanghai DBC)
2015 Holstein 44.945 356 9.409 8.830 3,61 3,19 417
China(DCRC Shandong)
2014 Holstein 212 25 7.358 3,87 3,31 449
China(DCRC Shandong)
2015 Holstein 208 27 8.320 3,88 3,26 438
Croatia 2014 Brown 1.373 375 6.579 5.600 4,01 3,44 436
Croatia 2015 Brown 1.334 367 6.479 5.502 4,00 3,45 447
Croatia 2014 Holstein 28.028 388 8.589 7.160 3,99 3,30 447
Croatia 2015 Holstein 29.219 382 8.757 7.337 3,97 3,30 449
Croatia 2014 Simmental 40.698 361 5.805 5.030 4,01 3,35 411
Croatia 2015 Simmental 39.949 358 5.725 4.967 4,04 3,34 412
Cow survey (Years 2014 and 2015)

Page 34
Table 4.3 - Main breeds - All recorded cows
Country Year Breed
Number of
lactations
Length of the lactations
(days)
Milk yield per recorded cow
(kg)
Milk per cow in 305 days
(kg)
Percent fat
content
Percent protein content
Calving interval (days)
Czech Rep 2014 Fleckvieh 107.686 294 7.016 3,98 3,50 397
Czech Rep 2015 Fleckvieh 108.046 294 7.130 3,98 3,53 394
Czech Rep 2014 Holstein 159.146 299 9.405 3,79 3,32 414
Czech Rep 2015 Holstein 164.769 298 9.582 3,77 3,34 412
Czech Rep 2014 Montbeliarde 1.018 298 8.082 3,92 3,48 394
Czech Rep 2015 Montbeliarde 1.252 297 8.000 3,95 3,52 393
Estonia 2014 EstonianHolstein
72.810 335 8.932 8.978 3,91 3,31 418
Estonia 2015 EstonianHolstein
69.772 341 9.082 9.036 3,90 3,32 418
Estonia 2014 Estonian Red 18.356 328 8.090 8.043 4,07 3,41 406
Estonia 2015 Estonian Red 17.247 330 8.105 8.100 4,08 3,41 407
Finland 2014 Finnish Ayrshire 132.627 305 8.749 8.844 4,27 3,44 415
Finland 2015 Finnish Ayrshire 110.972 305 9.055 9.128 4,41 3,55 411
Finland 2014 Finnish Cattle 2.723 305 6.104 6.270 4,39 3,44 406
Finland 2015 Finnish Cattle 2.276 305 6.272 6.449 4,44 3,48 402
Finland 2014 Holstein 95.839 305 9.707 9.748 3,96 3,31 417
Finland 2015 Holstein 87.515 305 10.017 10.070 4,12 3,44 415
Cow survey (Years 2014 and 2015)

Page 35
Table 4.3 - Main breeds - All recorded cows
Country Year Breed
Number of
lactations
Length of the lactations
(days)
Milk yield per recorded cow
(kg)
Milk per cow in 305 days
(kg)
Percent fat
content
Percent protein content
Calving interval (days)
Finland2 2014 Jersey 420 305 7.958 7.724 4,84 3,63 402
Finland 2015 Jersey 559 305 8.076 7.887 5,07 3,77 402
France 2014 Abondance 23.183 298 5.358 5.048 3,71 3,35 404
France 2015 Abondance 23.412 298 5.390 5.085 3,69 3,33 405
France 2014 Brune 17.191 338 7.224 6.261 4,16 3,42 427
France 2015 Brune 17.344 338 7.367 6.364 4,16 3,42 427
France 2014 Montbeliarde 435.538 311 6.961 6.394 3,87 3,30 400
France 2015 Montbeliarde 439.609 308 7.079 6.514 3,87 3,29 399
France 2014 Normande 225.836 324 6.496 5.821 4,21 3,46 406
France 2015 Normande 217.642 322 6.488 5.828 4,21 3,46 405
France 2014 Pie Rouge des Plaines
10.249 331 7.751 6.935 4,25 3,32 414
France 2015 Pie Rouge des Plaines
10.221 330 7.779 6.952 4,25 3,32 411
France 2014 Prim Holstein 1.718.590
353 9.329 7.937 3,91 3,19 430
France 2015 Prim Holstein 1.706.420
348 9.352 7.996 3,90 3,18 429
2 High proportion of cross-bred animals in this breed
Cow survey (Years 2014 and 2015)

Page 36
Table 4.3 - Main breeds - All recorded cows
Country Year Breed
Number of
lactations
Length of the lactations
(days)
Milk yield per recorded cow
(kg)
Milk per cow in 305 days
(kg)
Percent fat
content
Percent protein content
Calving interval (days)
France 2014 SimmentalFrancoise
16.975 305 6.064 5.659 4,00 3,38 393
France 2015 SimmentalFrançoise
16.938 302 6.159 5.751 3,99 3,37 393
Germany 2014 Braunvieh 165.166 324 7.255 7.103 4,23 3,60 416
Germany 2015 Braunvieh 163.665 324 7.269 7.186 4,24 3,57 414
Germany 2014 Fleckvieh 898.191 318 7.392 7.159 4,15 3,50 393
Germany 2015 Fleckvieh 897.522 317 7.406 7.242 4,14 3,49 392
Germany 2014 Holstein B&W 2.175.488
322 8.994 8.882 4,02 3,38 413
Germany 2015 Holstein B&W 2.182.043
321 9.087 8.975 4,01 3,38 412
Germany 2014 Holstein R&W 247.070 320 8.044 7.930 4,17 3,42 410
Germany 2015 Holstein R&W 245.076 319 8.131 8.059 4,18 3,43 409
Hungary 2014 HungarianHolstein Friesian
125.216 298 9.240 3,71 3,29 439
Hungary 2014 Hungarian Red Spotted
3.004 292 6.061 4,02 3,49 410
Italy 2014 Bruna Italiana (Italian Brown)
53.090 305 7.048 7.048 4,00 3,54
Italy 2015 Bruna Italiana (Italian Brown)
51.013 305 7.095 7.095 4,00 3,52
Italy 2014 Frisona Italiana (Italian Friesian)
666.745 305 9.188 9.188 3,69 3,28
Italy 2015 Frisona Italiana (Italian Friesian)
666.747 305 9.325 9.325 3,67 3,25
Cow survey (Years 2014 and 2015)

Page 37
Table 4.3 - Main breeds - All recorded cows
Country Year Breed
Number of
lactations
Length of the lactations
(days)
Milk yield per recorded cow
(kg)
Milk per cow in 305 days
(kg)
Percent fat
content
Percent protein content
Calving interval (days)
Italy 2014 Grigio Alpina (Grey of Alps)
7.056 305 4.945 4.945 3,72 3,34
Italy 2015 Grigio Alpina (Grey of Alps)
6.930 305 4.938 4.938 3,72 3,33
Italy 2014 Pezzata Rossa Italiana (Italian red spotted)
41.629 305 6.540 6.540 3,89 3,41
Italy 2015 Pezzata Rossa Italiana (Italian red spotted)
42.074 305 6.592 6.592 3,88 3,39
Italy 2014 ValdostanaPezzata Rossa (Valdostana Red Spotted)
9.995 305 3.672 3.672 3,48 3,26
Italy 2015 ValdostanaPezzata Rossa (Valdostana Red Spotted)
9.787 305 3.652 3.652 3,48 3,25
Latvia 2014 Holstein Black and White
6.836 389 8.643 3,88 3,30
Latvia 2015 Holstein Black and White
9.497 388 9.073 3,87 3,34
Latvia 2014 Latvian Blue 439 357 5.002 4,25 3,35
Latvia 2015 Latvian Blue 427 363 5.158 4,26 3,34
Latvia 2014 Latvian Brown 38.698 361 6.129 4,33 3,34
Latvia 2015 Latvian Brown 35.798 358 6.346 4,35 3,34
Cow survey (Years 2014 and 2015)

Page 38
Table 4.3 - Main breeds - All recorded cows
Country Year Breed
Number of
lactations
Length of the lactations
(days)
Milk yield per recorded cow
(kg)
Milk per cow in 305 days
(kg)
Percent fat
content
Percent protein content
Calving interval (days)
Luxembourg 2014 Holstein-SBT 30.086 314 7.849 4,08 3,38 424
Luxembourg 2015 Holstein-SBT 31.443 314 8.129 4,07 3,37 424
Luxembourg 2014 Holstein-RBT 4.883 309 7.018 4,27 3,43 418
Luxembourg 2015 Holstein-RBT 4.872 307 7.239 4,27 3,43 419
Morocco 2015 Holstein and Montbeliarde
20.000 400 6.000 5.200 3,60 3,40 460
New Zealand 2014 Ayrshire 17.438 225 4.235 5.278 4,27 3,52 370
New Zealand 2014 Friesian 901.915 215 4.675 6.011 4,27 3,59 369
New Zealand 2014 Friesian x Jersey
1.349.738
216 4.209 5.395 4,77 3,81 368
New Zealand 2014 Jersey 317.750 217 3.371 4.306 5,49 4,05 368
Norway 2014 Holstein 1.674 324 9.410 8.962 4,11 3,36 395
Norway 2015 Holstein 1.852 324 9.593 9.225 4,15 3,38 399
Norway 2014 Jersey 1.031 319 6.166 5.949 5,96 3,99 403
Norway 2015 Jersey 1.069 312 6.229 6.032 0,01 4,01 398
Norway 2014 Norwegian Red 159.854 303 7.588 7.206 4,24 3,45 381
Norway 2015 Norwegian Red 155.104 303 7.731 7.370 4,30 3,47 381
Poland 2014 Jersey 1.057 305 6.009 6.009 5,10 3,84 414
Poland 2015 Jersey 1.021 305 6.212 6.212 5,04 3,85 412
Poland 2014 Montbeliarde 2.612 305 7.203 7.203 3,97 3,49 421
Poland 2015 Montbeliarde 2.839 305 7.529 305 3,95 3,51 420
Cow survey (Years 2014 and 2015)

Page 39
Table 4.3 - Main breeds - All recorded cows
Country Year Breed
Number of
lactations
Length of the lactations
(days)
Milk yield per recorded cow
(kg)
Milk per cow in 305 days
(kg)
Percent fat
content
Percent protein content
Calving interval (days)
Poland 2014 Polish Black-White
2.080 305 4.710 4.710 4,11 3,30 421
Poland 2015 Polish Black-White
3.668 305 4.471 4.471 4,09 3,23 408
Poland 2015 Polish Black-White
2.015 305 4.653 4.653 4,16 3,29 416
Poland 2015 Polish Holstein Frisian
649.407 305 7.950 7.950 4,07 3,35 435
Poland 2015 Polish Holstein Frisian
25.586 305 7.183 7.183 4,17 3,38 423
Poland 2014 Polish Holstein Frisian
636.226 305 7.742 7.742 4,07 3,35 436
Poland 2014 Polish Holstein-Friesian
24.118 305 7.068 7.068 4,15 3,37 422
Poland 2014 Polish Red-White
3.580 305 4.635 4.635 4,08 3,26 407
Poland 2014 Red Polish 2.787 305 3.588 3.588 4,31 3,38 409
Poland 2015 Red Polish 2.856 305 3.541 3.541 4,25 3,35 416
Poland 2014 Simmental 10.768 305 6.030 6.030 4,12 3,46 407
Poland 2015 Simmental 10.571 305 6.075 6.075 4,15 3,44 409
Serbia3 2015 Brown Swiss 77 359 7.589 6.496 3,84 3,25 463
3 Data relating to the region AP Vojvodina in Serbia
Cow survey (Years 2014 and 2015)

Page 40
Table 4.3 - Main breeds - All recorded cows
Country Year Breed
Number of
lactations
Length of the lactations
(days)
Milk yield per recorded cow
(kg)
Milk per cow in 305 days
(kg)
Percent fat
content
Percent protein content
Calving interval (days)
Serbia1 2014 Holstein-Friesian 27.828 358 7.332 6.521 3,89 3,21 456
Serbia1 2015 Holstein-Friesian 29.015 354 7.524 6.804 3,81 3,22 450
Serbia1 2014 Simmental 6.751 332 6.132 5.828 4,00 3,25 433
Serbia1 2015 Simmental 7.246 341 5.908 5.745 3,91 3,25 428
Slovak Rep. 2014 Holstein 32.771 298 8.601 8.752 3,83 3,27 436
Slovak Rep. 2015 Holstein 26.719 297 9.248 9.434 3,75 3,25 433
Slovak Rep. 2014 SlovakPinzgauer
669 292 4.332 4.476 3,89 3,44 413
Slovak Rep. 2015 SlovakPinzgauer
636 292 4.506 4.655 3,83 3,41 416
Slovak Rep. 2014 SlovakSimmental
13.486 294 6.084 6.254 4,02 3,45 408
Slovak Rep. 2015 SlovakSimmental
12.588 292 6.423 6.636 3,94 3,43 407
South Africa 2014 Ayrshire 1.152 289 6.528 7.481 4,09 3,42 411
South Africa 2015 Ayrshire 1.115 216 5.418 7.891 3,94 3,26 419
South Africa 2014 Guernsey 781 319 6.599 6.644 4,38 3,55 413
South Africa 2015 Guernsey 737 219 5.202 7.103 4,21 3,39 420
South Africa 2014 Holstein 25.070 320 9.445 9.559 3,89 3,35 445
South Africa 2015 Holstein 21.799 251 7.668 9.760 3,82 3,19 451
South Africa 2014 Jersey 27.829 292 5.267 5.915 4,87 3,83 419
South Africa 2015 Jersey 26.059 242 4.392 5.718 4,78 3,71 436
Cow survey (Years 2014 and 2015)

Page 41
Table 4.3 - Main breeds - All recorded cows
Country Year Breed
Number of
lactations
Length of the lactations
(days)
Milk yield per recorded cow
(kg)
Milk per cow in 305 days
(kg)
Percent fat
content
Percent protein content
Calving interval (days)
South Korea (by DCIC Centre)
2014 Holstein 159.068 10.057 3,79 3,22 464
South Korea (by DCIC Centre)
2015 Holstein 148.608 10.289 3,76 3,22 466
South Korea (by KAI Assoc.)
2014 Holstein 305 10.057 3,81 3,21 464
South Korea (by KAI Assoc.)
2015 Holstein 305 10.289 3,76 3,22 466
Spain 2014 Frisona 351.830 370 11.425 9.736 3,62 3,20 432
Spain 2015 Frisona 349.539 368 11.523 9.873 3,59 3,19 430
Spain 2014 Parda Alpina 965 352 7.757 6.706 3,75 3,46 386
Spain 2015 Parda Alpina 1.104 350 7.924 6.825 3,78 3,48 363
Sweden 2014 Swedish Holstein
141.524 365 9.976 4,08 3,39 407
Sweden 2015 Swedish Holstein
138.192 365 10.133 4,09 3,40 407
Sweden 2014 Swedish Jersey 1.845 365 6.820 5,84 4,06 404
Sweden 2015 Swedish Jersey 1.849 365 6.963 5,87 4,09 401
Sweden 2014 Swedish Polled 839 365 5.515 4,40 3,56 401
Sweden 2015 Swedish Polled 892 365 5.548 4,45 3,56 407
Sweden 2014 Swedish Red 103.686 365 8.855 4,35 3,57 395
Sweden 2015 Swedish Red 97.357 365 9.014 4,36 3,57 393
Cow survey (Years 2014 and 2015)

Page 42
Table 4.3 - Main breeds - All recorded cows
Country Year Breed
Number of
lactations
Length of the lactations
(days)
Milk yield per recorded cow
(kg)
Milk per cow in 305 days
(kg)
Percent fat
content
Percent protein content
Calving interval (days)
Switzerland 2014 Black Holstein 72.407 301 8.406 8.496 3,96 3,21 408
Switzerland 2015 Black Holstein 75.541 301 8.498 8.589 3,94 3,23 407
Switzerland 2014 Braunvieh 128.346 300 6.917 7.004 4,06 3,38 416
Switzerland 2015 Braunvieh 124.991 300 7.059 7.147 4,03 3,40 415
Switzerland 2014 Eringer 572 281 3.352 3.563 3,79 3,39 410
Switzerland 2015 Eringer 572 281 3.354 3.565 3,70 3,37 410
Switzerland 2015 Evolener 30 296 2.992 3.060 3,83 3,45
Switzerland 2014 Evolener 25 296 2.992 3.060 3,77 3,46
Switzerland 2014 Grauvieh 289 296 4.405 4.505 3,72 3,22 382
Switzerland 2015 Grauvieh 313 296 4.453 4.554 3,71 3,22 387
Switzerland 2015 Hinterwaelder 136 296 3.991 4.082 4,06 3,40 362
Switzerland 2014 Hinterwaelder 125 291 3.828 3.965 4,08 3,40 368
Switzerland 2014 Jersey 2.795 299 5.466 5.548 5,30 3,84 405
Switzerland 2015 Jersey 2.970 299 5.641 5.726 5,26 3,87 407
Switzerland 2015 Montbeliarde 6.186 299 7.269 7.378 3,72 3,35 393
Switzerland 2014 Montbeliarde 5.879 299 7.269 7.378 3,75 3,32 393
Switzerland 2014 Normande 656 299 6.677 6.777 4,09 3,42 390
Switzerland 2015 Normande 694 299 6.677 6.777 4,04 3,43 390
Switzerland 2014 Pinzgauer 57 299 5.645 5.730 3,83 3,31
Switzerland 2015 Pinzgauer 65 299 5.645 5.730 3,80 3,31
Cow survey (Years 2014 and 2015)

Page 43
Table 4.3 - Main breeds - All recorded cows
Country Year Breed
Number of
lactations
Length of the lactations
(days)
Milk yield per recorded cow
(kg)
Milk per cow in 305 days
(kg)
Percent fat
content
Percent protein content
Calving interval (days)
Switzerland 2014 Red Holstein 80.532 300 7.783 7.880 4,06 3,25 395
Switzerland 2015 Red Holstein 77.281 300 7.783 7.880 4,03 3,27 395
Switzerland 2014 Simmental 15.214 298 5.796 5.898 3,94 3,32 383
Switzerland 2015 Simmental 15.058 298 5.796 5.898 3,93 3,34 383
Switzerland 2014 Swiss Fleckvieh 45.129 299 6.766 6.868 4,05 3,26 385
Switzerland 2015 Swiss Fleckvieh 46.514 299 6.766 6.868 3,93 3,34 385
Switzerland 2014 Water Buffalo 137 298 2.935 2.987 7,45 4,41 402
Switzerland 2015 Water Buffalo 122 298 2.935 2.987 7,46 4,41
Taiwan 2014 Holstein 25.560 383 9.464 7.537 3,84 3,29
Taiwan 2015 Holstein 26.591 385 9.970 7.899 3,83 3,30
Taiwan 2014 Jersey 146 346 6.773 5.971 5,07 3,93
Taiwan 2015 Jersey 194 328 6.447 5.995 4,80 3,78
Tunisia 2014 Brown Swiss 552 357 5.621 5.092 440
Tunisia 2015 Brown Swiss 556 360 5.759 5.113 439
Tunisia 2014 Holstein 10.731 370 6.301 5.665 450
Tunisia 2015 Holstein 9.090 372 6.373 5.754 452
Tunisia 2014 Tarentais 149 319 3.971 3.659 419
Tunisia 2015 Tarentais 117 310 3.882 3.839 413
UK - England (by CIS)
2014 Ayrshire 2.345 320 7.342 6.691 4,14 3,27 410
UK - England (by CIS)
2015 Ayrshire 2.806 312 7.233 6.622 4,09 3,28 414
Cow survey (Years 2014 and 2015)

Page 44
Table 4.3 - Main breeds - All recorded cows
Country Year Breed
Number of
lactations
Length of the lactations
(days)
Milk yield per recorded cow
(kg)
Milk per cow in 305 days
(kg)
Percent fat
content
Percent protein content
Calving interval (days)
UK - England (by CIS)
2014 Brown Swiss 794 337 7.363 6.440 4,24 3,40 425
UK - England (by CIS)
2015 Brown Swiss 1.069 322 7.078 6.237 4,12 3,42 420
UK - England (by CIS)
2014 Friesian 5.709 318 7.004 6.461 4,16 3,34 398
UK - England (by CIS)
2015 Friesian 6.131 314 7.010 6.466 4,14 3,34 396
UK - England (by CIS)
2014 Guernsey 408 303 5.894 5.337 5,02 3,47 418
UK - England (by CIS)
2015 Guernsey 427 331 6.229 5.540 4,82 3,47 406
UK - England (by CIS)
2014 Holstein 217.647 339 9.696 8.481 3,97 3,17 420
UK - England (by CIS)
2015 Holstein 233.197 332 9.682 8.535 3,95 3,19 417
UK - England (by CIS)
2015 Jersey 11.101 312 6.007 5.474 5,33 3,80 401
UK - England (by CIS)
2015 Montbeliarde 2.280 316 7.857 7.123 4,04 3,34 398
UK - England (by CIS)
2015 Other Breeds 501 324 6.857 6.151 4,05 3,37 410
UK - England (by CIS)
2015 Shorthorn 3.233 301 7.076 6.561 4,02 3,32 398
Cow survey (Years 2014 and 2015)

Page 45
Table 4.3 - Main breeds - All recorded cows
Country Year Breed
Number of
lactations
Length of the lactations
(days)
Milk yield per recorded cow
(kg)
Milk per cow in 305 days
(kg)
Percent fat
content
Percent protein content
Calving interval (days)
UK - England+Wales(by NMR)
2014 Ayrshire 9.563 336 7.406 6.871 4,11 3,38 407
UK - England+Wales(by NMR)
2015 Ayrshire 9.365 334 7.377 6.816 4,06 3,41 406
UK - England+Wales(by NMR)
2014 Friesian 9.563 336 7.406 6.871 4,11 3,38 407
UK - England+Wales(by NMR)
2015 Friesian 5.954 333 7.166 6.610 4,08 3,41 392
UK - England+Wales(by NMR)
2014 Holstein 452.386 359 9.799 8.705 3,98 3,27 415
UK - England+Wales(by NMR)
2015 Holstein 452.497 355 9.760 8.646 3,97 3,30 412
UK - England+Wales(by NMR)
2014 Jersey 15.491 339 6.545 5.982 5,32 3,84 402
UK - England+Wales(by NMR)
2015 Jersey 15.159 341 6.532 5.879 5,29 3,88 401
Cow survey (Years 2014 and 2015)

Page 46
Table 4.3 - Main breeds - All recorded cows
Country Year Breed
Number of
lactations
Length of the lactations
(days)
Milk yield per recorded cow
(kg)
Milk per cow in 305 days
(kg)
Percent fat
content
Percent protein content
Calving interval (days)
UK - England+Wales(by NMR)
2014 Montbeliarde 4.565 333 7.715 7.190 3,93 3,38 393
UK - England+Wales(by NMR)
2015 Montbeliarde 5.093 330 7.756 7.153 3,94 3,40 391
UK - England+Wales(by NMR)
2014 Shorthorn 11.122 326 7.371 6.938 4,06 3,39 391
UK - England+Wales(by NMR)
2015 Shorthorn 12.349 327 7.435 6.922 4,07 3,42 390
UK - Jersey Island
2014 All Breeds 3.117 327 5.380 4.894 5,29 3,70 409
UK - Jersey Island
2015 Jersey 3.382 314 5.357 4.931 5,21 3,71 405
UK - N. Ireland (by CIS)
2014 Ayrshires 1.940 311 6.564 6.018 4,07 3,29 416
UK - N. Ireland (by CIS)
2015 Ayrshires 1.749 317 6.897 6.339 4,02 3,30 419
UK - N. Ireland (by CIS)
2015 Brown Swiss 19 290 5.998 5.839 3,92 3,53 378
UK - N. Ireland (by CIS)
2014 Friesian 1.269 310 6.904 6.339 4,13 3,31 387
UK - N. Ireland (by CIS)
2015 Friesian 1.249 309 7.283 6.706 4,15 3,31 390
Cow survey (Years 2014 and 2015)

Page 47
Table 4.3 - Main breeds - All recorded cows
Country Year Breed
Number of
lactations
Length of the lactations
(days)
Milk yield per recorded cow
(kg)
Milk per cow in 305 days
(kg)
Percent fat
content
Percent protein content
Calving interval (days)
UK - N. Ireland (by CIS)
2014 Holstein 83.330 333 8.668 7.642 3,99 3,22 415
UK - N. Ireland (by CIS)
2015 Holstein 87.568 327 8.613 7.653 3,95 3,21 415
UK - N. Ireland (by CIS)
2014 Jersey 640 331 6.348 5.552 5,17 3,76 397
UK - N. Ireland (by CIS)
2015 Jersey 685 327 6.455 5.687 5,12 3,73 403
UK - N. Ireland (by CIS)
2014 Montbeliarde 891 304 7.302 6.673 3,99 3,36 381
UK - N. Ireland (by CIS)
2015 Montbeliarde 1.035 313 7.400 6.804 4,04 3,35 395
UK - N. Ireland (by CIS)
2014 Other Breeds 209 310 6.370 5.850 4,00 3,42 385
UK - N. Ireland (by CIS)
2015 Other breeds 193 298 6.177 5.725 4,00 3,44 390
UK - N. Ireland (by CIS)
2014 Shorthorn 488 319 7.219 6.722 3,97 3,29 391
UK - N. Ireland (by CIS)
2015 Shorthorn 561 317 7.387 6.895 3,94 3,31 393
UK - N. Ireland (by NMR)
2014 Ayrshire 740 317 7.003 6.651 4,01 3,29 410
UK - N. Ireland (by NMR)
2015 Ayrshire 732 322 6.918 6.479 4,13 3,33 404
UK - N. Ireland (by NMR)
2014 Friesian 260 361 8.512 7.197 4,05 3,31 402
UK - N. Ireland (by NMR)
2015 Friesian 165 328 7.459 6.872 4,11 3,39 380
Cow survey (Years 2014 and 2015)

Page 48
Table 4.3 - Main breeds - All recorded cows
Country Year Breed
Number of
lactations
Length of the lactations
(days)
Milk yield per recorded cow
(kg)
Milk per cow in 305 days
(kg)
Percent fat
content
Percent protein content
Calving interval (days)
UK - N. Ireland (by NMR)
2014 Holstein 32.160 352 9.346 8.281 4,01 3,25 411
UK - N. Ireland (by NMR)
2015 Holstein 30.965 342 9.120 8.160 4,03 3,24 410
UK - N. Ireland (by NMR)
2014 Jersey 616 328 6.844 6.288 5,12 3,78 400
UK - N. Ireland (by NMR)
2015 Jersey 490 321 6.394 5.805 5,19 3,84 394
UK - N. Ireland (by NMR)
2014 Montbeliarde 794 340 7.603 6.791 4,03 3,39 385
UK - N. Ireland (by NMR)
2015 Montbeliarde 764 321 7.185 6.753 4,07 3,38 385
UK - N. Ireland (by NMR)
2014 Shorthorn 290 317 7.657 7.231 4,24 3,38 390
UK - N. Ireland (by NMR)
2015 Shorthorn 291 319 7.765 7.229 4,29 3,38 390
UK - Scotland (by CIS)
2014 Ayrshire 8.233 324 7.582 6.894 4,12 3,31 418
UK - Scotland (by CIS)
2015 Ayrshire 8.806 317 7.466 6.835 4,08 3,31 418
UK - Scotland (by CIS)
2014 Brown Swiss 354 385 8.281 6.702 3,91 3,45 404
UK - Scotland (by CIS)
2015 Brown Swiss 406 304 7.036 6.192 4,02 3,46 449
UK - Scotland (by CIS)
2014 Friesian 2.690 325 7.084 6.458 4,24 3,30 409
UK - Scotland (by CIS)
2015 Friesian 2.380 322 7.090 6.508 4,21 3,32 406
Cow survey (Years 2014 and 2015)

Page 49
Table 4.3 - Main breeds - All recorded cows
Country Year Breed
Number of
lactations
Length of the lactations
(days)
Milk yield per recorded cow
(kg)
Milk per cow in 305 days
(kg)
Percent fat
content
Percent protein content
Calving interval (days)
UK - Scotland (by CIS)
2014 Holstein 91.515 339 9.676 8.480 3,83 3,10 419
UK - Scotland (by CIS)
2015 Holstein 98.616 328 9.512 8.438 3,80 3,11 417
UK - Scotland (by CIS)
2014 Jersey 1.309 300 6.155 5.481 5,25 3,74 429
UK - Scotland (by CIS)
2015 Jersey 1.847 295 5.871 5.427 5,03 3,81 391
UK - Scotland (by CIS)
2014 Montbeliarde 2.417 320 8.207 7.501 3,95 3,31 392
UK - Scotland (by CIS)
2015 Montbeliarde 2.740 308 8.109 7.509 3,90 3,32 393
UK - Scotland (by CIS)
2014 Other Breeds 278 302 6.479 6.037 4,14 3,33 388
UK - Scotland (by CIS)
2015 Other Breeds 273 291 6.139 5.826 4,03 3,31 387
UK - Scotland (by CIS)
2014 Shorthorn 725 308 7.517 6.977 4,13 3,37 391
UK - Scotland (by CIS)
2015 Shorthorn 893 302 7.502 7.038 4,04 3,37 392
UK - Scotland (by NMR)
2014 Ayrshire 899 342 8.898 8.229 3,94 3,32 412
UK - Scotland (by NMR)
2015 Ayrshire 398 333 8.055 7.363 3,86 3,37 394
UK - Scotland (by NMR)
2014 Friesian 81 420 11.194 8.107 3,72 3,20 394
UK - Scotland (by NMR)
2015 Friesian 28 343 8.267 7.487 4,04 3,39 441
Cow survey (Years 2014 and 2015)

Page 50
Country Year Breed
Number of
lactations
Length of the lactations
(days)
Milk yield per recorded cow
(kg)
Milk per cow in 305 days
(kg)
Percent fat
content
Percent protein content
Calving interval (days)
UK - Scotland (by NMR)
2014 Holstein 8.762 366 11.022 9.530 3,84 3,23 411
UK - Scotland (by NMR)
2015 Holstein 7.828 356 10.624 9.267 3,89 3,28 408
UK - Scotland (by NMR)
2014 Jersey 261 337 6.249 5.761 5,43 3,92 427
UK - Scotland (by NMR)
2015 Jersey 253 353 7.361 6.606 5,59 3,91 427
UK - Scotland (by NMR)
2014 Montbeliarde 53 334 8.663 8.077 4,00 3,39 388
UK - Scotland (by NMR)
2015 Montbeliarde 65 318 8.448 7.811 3,97 3,39 387
UK - Scotland (by NMR)
2014 Shorthorn 81 344 8.557 7.742 4,07 3,41 395
UK - Scotland (by NMR)
2015 Shorthorn 111 322 8.042 7.614 4,09 3,42 388
UK - Wales 2014 Ayrshire 376 325 7.609 6.782 4,69 3,26 419
UK - Wales 2015 Ayrshire 467 270 6.174 5.710 4,48 3,26 422
UK - Wales 2014 Brown Swiss 303 328 7.274 6.610 4,25 3,46 426
UK - Wales 2015 Brown Swiss 362 313 7.218 6.621 4,14 3,44 423
UK - Wales 2014 Friesian 525 317 6.735 6.246 4,11 3,35 393
UK - Wales 2015 Friesian 697 313 6.262 5.829 4,32 3,41 392
UK - Wales 2014 Guernsey 41 311 6.782 6.351 5,13 3,53 408
UK - Wales 2015 Guernsey 51 286 5.720 5.409 5,05 3,48 394
Table 4.3 - Main breeds - All recorded cows
Cow survey (Years 2014 and 2015)

Page 51
Country Year Breed
Number of
lactations
Length of the lactations
(days)
Milk yield per recorded cow
(kg)
Milk per cow in 305 days
(kg)
Percent fat
content
Percent protein content
Calving interval (days)
UK - Wales 2014 Holstein 31.237 337 9.274 8.129 4,07 3,17 421
UK - Wales 2015 Holstein 35.372 327 9.232 8.170 4,04 3,19 419
UK - Wales 2014 Jersey 1.019 308 5.802 5.377 5,45 3,66 396
UK - Wales 2015 Jersey 1.284 269 5.501 5.094 5,20 3,67 394
UK - Wales 2014 Montbeliarde 27 308 8.091 7.483 4,17 3,46 380
UK - Wales 2015 Montbeliarde 33 287 6.132 5.768 4,09 3,43 377
UK - Wales 2014 Other Breeds 32 325 6.932 6.258 4,03 3,48 377
UK - Wales 2015 Other Breeds 30 314 7.160 6.677 4,00 3,41 371
UK - Wales 2014 Shorthorn 156 305 8.014 7.384 4,23 3,32 392
UK - Wales 2015 Shorthorn 251 293 6.888 6.453 4,09 3,30 392
USA - (by NDHIA)4
2014 Ayrshire 3.903 305 6.720 6.720 3,93 3,21
USA - (by NDHIA)4
2015 Ayrshire 3.643 305 6.861 6.861 3,93 3,19
USA - (by NDHIA)4
2014 Brown Swiss 10.944 305 8.396 8.396 4,20 3,44
USA - (by NDHIA)4
2015 Brown Swiss 10.921 305 8.637 8.637 4,15 3,42
USA - (by NDHIA)4
2014 Guernsey 4.335 305 7.046 7.046 4,65 3,38
USA - (by NDHIA)4
2015 Guernsey 4.427 305 7.096 7.096 4,63 3,38
4 DHI herd averages
Table 4.3 - Main breeds - All recorded cows
Cow survey (Years 2014 and 2015)

Page 52
Country Year Breed
Number of
lactations
Length of the lactations
(days)
Milk yield per recorded cow
(kg)
Milk per cow in 305 days
(kg)
Percent fat
content
Percent protein content
Calving interval (days)
USA - (by NDHIA)4
2014 Holstein 3.638.177
305 11.169 11.169 3,77 3,08
USA - (by NDHIA)4
2015 Holstein 3.642.037
305 11.321 11.321 3,68 3,08
USA - (by NDHIA)4
2014 Jersey 271.849 305 8.151 8.151 4,80 3,65
USA - (by NDHIA)4
2015 Jersey 291.725 305 8.183 8.183 4,81 3,65
USA - (by NDHIA)4
2014 MilkingShorthorn
1.558 305 6.475 6.475 3,64 3,14
USA - (by NDHIA)4
2015 MilkingShorthorn
1.563 305 6.476 6.476 3,64 3,12
Table 4.3 - Main breeds - All recorded cows
Cow survey (Years 2014 and 2015)

Page 53
Table 4.4 - Main breeds - Cows in herdbook
Country Year BreedNumber of lactations
Length of the lactations (days)
Milk yield per recorded cow
(kg)Milk per cow in 305 days (kg)
% fat content
% protein content
Calving interval (days)
Austria 2014 Braunvieh 40.985 301 7.185 4,16 3,46Austria 2015 Braunvieh 40.628 301 7.207 4,16 3,46Austria 2014 Fleckvieh 246.135 298 7.214 4,13 3,41Austria 2015 Fleckvieh 251.536 298 7.220 4,15 3,40Austria 2014 Grauvieh 2.891 294 4.953 3,97 3,29Austria 2015 Grauvieh 2.927 294 4.947 3,94 3,27Austria 2014 Holstein 34.572 300 8.694 4,06 3,28Austria 2015 Holstein 35.564 300 8.686 4,07 3,28Austria 2014 Pinzgauer 5.778 298 5.666 3,86 3,27Austria 2015 Pinzgauer 5.756 298 5.677 3,87 3,25China(ShandongDCRC)
2014 Holstein 201 25 7.358 3,87 3,31 449
China(ShandongDCRC)
2015 Holstein 208 27 8.320 3,88 3,26 438
China(ShanghaiDBC)
2015 Holstein 348 9.078 8.720 3,59 420
China(ShanghaiDBC)
2015 Holstein 356 9.409 8.830 6,61 417
Czech Rep. 2014 Fleckvieh 114.365 294 7.059 3,98 3,50 396Czech Rep. 2015 Fleckvieh 114.590 294 7.174 3,98 3,52 393Czech Rep. 2014 Holstein 164.740 299 9.431 3,79 3,32 414Czech Rep. 2015 Holstein 172.255 298 9.594 3,77 3,34 411
Cow survey (Years 2014 and 2015)

Page 54
Table 4.4 - Main breeds - Cows in herdbook
Country Year BreedNumber of lactations
Length of the lactations (days)
Milk yield per recorded cow
(kg)Milk per cow in 305 days (kg)
% fat content
% protein content
Calving interval (days)
Estonia 2014 EstonianHolstein
64.376 341 9.095 9.125 3,90 3,31 418
Estonia 2015 EstonianHolstein
62.496 346 9.242 9.171 3,89 3,32 418
Estonia 2014 Estonian Red 16.098 330 8.282 8.223 4,06 3,41 405Estonia 2015 Estonian Red 15.122 333 8.272 8.259 4,06 3,41 406Finland 2015 Brown Swiss 24 305 8.529 4,49 3,63Finland 2014 Finnish
Ayrshire 23.277 305 9.586 4,24 3,45
Finland 2015 FinnishAyrshire
22.623 305 9.830 4,31 3,49
Finland 2014 Finnish Cattle 1.583 305 6.174 4,40 3,46Finland 2015 Finnish Cattle 1.375 305 6.244 4,39 3,44Finland 2014 Holstein 18.762 305 10.628 3,95 3,33Finland 2015 Holstein 19.290 305 10.883 4,01 3,38Finland 2014 Jersey 65 305 7.788 5,09 3,80Finland 2015 Jersey 105 305 8.114 5,10 3,79France 2014 Abondance 23.183 298 5.358 5.048 3,71 3,35 40France 2015 Abondance 23.412 298 5.390 5.085 3,69 3,33 405France 2014 Brune 17.191 338 7.224 6.203 4,16 3,42 427France 2015 Brune 17.344 338 7.367 6.364 4,16 3,42 427France 2014 Montbeliarde 435.538 311 6.961 6.305 3,87 3,30 400France 2015 Montbeliarde 439.609 308 7.079 6.514 3,87 3,29 399France 2014 Normande 225.836 324 6.496 5.766 4,21 3,46 406France 2015 Normande 217.642 322 6.488 5.828 4,21 3,46 405
Cow survey (Years 2014 and 2015)

Page 55
Table 4.4 - Main breeds - Cows in herdbook
Country Year BreedNumber of lactations
Length of the lactations (days)
Milk yield per recorded cow
(kg)Milk per cow in 305 days (kg)
% fat content
% protein content
Calving interval (days)
France 2014 Pie Rouge des Plaines
10.249 331 7.751 6.867 4,25 3,32 414
France 2015 Pie Rouge des Plaines
10.221 330 7.779 6.952 4,25 3,32 411
France 2014 Prim Holstein 1.718.590 353 9.329 7.905 3,91 3,19 430France 2015 Prim Holstein 1.706.420 348 9.352 7.996 3,90 3,18 429France 2014 Simmental
Françoise16.975 305 6.064 5.522 4,00 3,38 393
France 2015 SimmentalFrançoise
16.938 302 6.159 5.751 3,99 3,37 393
Germany 2014 Braunvieh 139.156 319 7.428 7.248 4,23 3,60 414Germany 2015 Braunvieh 138.394 319 7.430 7.323 4,24 3,57 412Germany 2014 Fleckvieh 730.823 318 7.574 7.310 4,14 3,51 391Germany 2015 Fleckvieh 735.953 317 7.586 7.390 4,13 3,49 390Germany 2014 Holstein B&W 1.721.623 323 9.206 9.082 4,01 3,38 413Germany 2015 Holstein B&W 1.731.534 322 9.291 9.156 4,00 3,38 412Germany 2014 Holstein
R&W162.689 322 8.441 8.306 4,15 3,42 411
Germany 2015 HolsteinR&W
162.715 320 8.527 8.415 4,15 3,43 409
Hungary 2014 HungarianHolsteinFriesian
125.216 298 9.240 3,71 3,29 439
Hungary 2014 HungarianRed Spotted
3.004 292 6.061 4,02 3,49 410
Cow survey (Years 2014 and 2015)

Page 56
Table 4.4 - Main breeds - Cows in herdbook
Country Year BreedNumber of lactations
Length of the lactations (days)
Milk yield per recorded cow
(kg)Milk per cow in 305 days (kg)
% fat content
% protein content
Calving interval (days)
Italy 2014 Bruna Italiana (ItalianBrown)
53.090 305 7.048 7.048 4,00 3,54
Italy 2015 Bruna Italiana (ItalianBrown)
51.013 305 7.095 7.095 4,00 3,52
Italy 2014 FrisonaItaliana(ItalianFriesian)
666.745 305 9.188 9.188 3,69 3,28
Italy 2015 FrisonaItaliana(ItalianFriesian)
666.747 305 9.325 9.325 3,67 3,25
Italy 2014 Grigio Alpina (Grey of Alps)
7.056 305 4.945 4.945 3,72 3,34
Italy 2015 Grigio Alpina (Grey of Alps)
6.930 305 4.938 4.938 3,72 3,33
Italy 2014 PezzataRossaItaliana(Italian Red Spotted)
41.629 305 6.540 6.540 3,89 3,41
Cow survey (Years 2014 and 2015)

Page 57
Table 4.4 - Main breeds - Cows in herdbook
Country Year BreedNumber of lactations
Length of the lactations (days)
Milk yield per recorded cow
(kg)Milk per cow in 305 days (kg)
% fat content
% protein content
Calving interval (days)
Italy 2014 ValdostanaPezzataRossa(ValdostanaRed Spotted)
9.995 305 3.672 3.672 3,48 3,26
Italy 2015 ValdostanaPezzataRossa(ValdostanaRed Spotted)
9.787 305 3.652 3.652 3,48 3,25
Latvia 2014 HolsteinBlack&White
3.785 388 9.461 3,87 3,29
Latvia 2015 HolsteinBlack&White
4.757 390 9.859 3,85 3,30
Latvia 2014 LatvianBrown
14.141 361 6.838 4,33 3,36
Latvia 2015 LatvianBrown
12.784 359 7.143 4,37 3,37
New Zealand (by LIC)
2014 Ayrshire 13.672 260 4.807 5.659 4,29 3,53 370
New Zealand (by LIC)
2014 Friesian 39.420 267 3.265 10.008 2,49 3,46 369
Poland 2015 Red Polish 2.433 305 3.627 3.627 4,24 3,35Poland 2014 Simmental 8.155 305 5.965 5.965 4,12 3,43Poland 2015 Simmental 7.948 305 5.998 5.998 4,10 3,42Poland (by PFHB)
2014 Montbeliarde 1.982 305 7.290 7.290 3,94 3,47
Poland (by PFHB)
2015 Montbeliarde 2.108 305 7.484 7.484 3,89 3,46
Cow survey (Years 2014 and 2015)

Page 58
Table 4.4 - Main breeds - Cows in herdbook
Country Year BreedNumber of lactations
Length of the lactations (days)
Milk yield per recorded cow
(kg)Milk per cow in 305 days (kg)
% fat content
% protein content
Calving interval (days)
Poland (by PFHB)
2014 Polish Black-White
1.712 305 4.655 4.655 4,10 3,25
Poland (by PFHB)
2015 Polish Black-White
1.672 305 4.664 4.664 4,10 3,25
Poland (by PFHB)
2014 PolishHolstein-Friesian
477.478 305 7.766 7.766 4,03 3,29
Poland (by PFHB)
2014 PolishHolstein-Friesian
18.277 305 7.036 7.036 4,11 3,33
Poland (by PFHB)
2015 PolishHolstein-Friesian
489.885 305 7.876 7.876 4,00 3,28
Poland (by PFHB)
2015 PolishHolstein-Friesian
19.296 305 7.113 7.113 4,11 3,32
Poland (by PFHB)
2014 Polish Red-White
3.022 305 4.516 4.516 4,11 3,24
Poland (by PFHB)
2015 Polish Red-White
3.182 305 4.499 4.499 4,06 3,23
Poland (by PFHB)
2014 Red Polish 2.299 305 3.677 3.677 4,35 3,37
Serbia 2015 Brown Swiss 77 359 7.589 6.496 3,84 3,25 463Serbia 2014 Holstein-
Friesian22.092 366 7.677 6.792 4,11 3,33 428
Serbia 2015 Holstein-Friesian
22.741 362 7.579 6.955 3,83 3,22 420
Serbia 2014 Simmental 4.717 332 6.255 5.839 4,18 3,37 420Serbia 2015 Simmental 5.156 333 6.206 5.818 4,21 3,31 417
Cow survey (Years 2014 and 2015)

Page 59
Table 4.4 - Main breeds - Cows in herdbook
Country Year BreedNumber of lactations
Length of the lactations (days)
Milk yield per recorded cow
(kg)Milk per cow in 305 days (kg)
% fat content
% protein content
Calving interval (days)
SlovakRepublic
2014 Holstein 53.464 298 8.180 8.324 3,90 3,31 428
SlovakRepublic
2015 Holstein 53.021 297 8.408 8.577 3,82 3,28 424
SlovakRepublic
2014 SlovakPinzgauer
1.406 293 4.729 4.873 3,91 3,40 413
SlovakRepublic
2015 SlovakPinzgauer
840 292 4.981 5.146 3,86 3,38 412
SlovakRepublic
2014 SlovakSimmental
22.766 294 6.044 6.213 4,03 3,42 402
SlovakRepublic
2015 SlovakSimmental
22.613 293 6.135 6.322 3,98 3,41 402
South Africa 2014 Ayrshire 980 316 7.534 8.219 4,06 3,38 429South Africa 2015 Ayrshire 1.020 254 6.407 8.179 3,96 3,27 433South Africa 2014 Geurnsey 213 295 6.883 7.498 4,40 3,55 425South Africa 2015 Geurnsy 239 250 6.377 8.046 4,21 3,37 417South Africa 2014 Holstein 17.852 330 11.901 11.717 3,81 3,33 462South Africa 2015 Holstein 15.339 247 9.385 12.140 3,76 3,14 465South Africa 2014 Jersey 16.407 278 5.253 6.207 4,85 3,79 431South Africa 2015 Jersey 15.500 233 4.374 5.886 4,78 3,66 460Spain 2014 Frisona 351.830 370 11.425 9.736 3,62 3,20 432Spain 2015 Frisona 349.539 368 11.523 9.873 3,59 3,19 430Spain 2014 Parda Alpina 965 352 7.757 6.706 3,75 3,46 386Spain 2015 Parda Alpina 1.104 350 7.924 6.825 3,78 3,48 363Switzerland 2014 Black
Holstein72.407 301 8.406 8.496 3,96 3,21 408
Switzerland 2015 BlackHolstein
75.541 301 8.498 8.589 3,94 3,23 407
Cow survey (Years 2014 and 2015)

Page 60
Table 4.4 - Main breeds - Cows in herdbook
Country Year BreedNumber of lactations
Length of the lactations (days)
Milk yield per recorded cow
(kg)Milk per cow in 305 days (kg)
% fat content
% protein content
Calving interval (days)
Switzerland 2014 Braunvieh 128.346 300 6.917 7.004 4,06 3,38 416Switzerland 2015 Braunvieh 124.991 300 7.059 7.147 4,03 3,40 415Switzerland 2014 Eringer 572 281 3.352 3.563 3,79 3,39 410Switzerland 2015 Eringer 572 281 3.354 3.565 3,70 3,37 410Switzerland 2014 Evolener 25 296 2.992 3.060 3,77 3,46Switzerland 2015 Evolener 30 296 2.992 3.060 3,83 3,45Switzerland 2014 Grauvieh 289 296 4.405 4.505 3,72 3,22 382Switzerland 2015 Grauvieh 313 296 4.453 4.554 3,71 3,22 387Switzerland 2014 Hinterwaelder 125 291 3.828 3.965 4,08 3,40 368Switzerland 2015 Hinterwaelder 136 296 3.991 4.082 4,06 3,40 362Switzerland 2014 Jersey 2.795 299 5.466 5.548 5,30 3,84 405Switzerland 2015 Jersey 2.970 299 5.641 5.726 5,26 3,87 407Switzerland 2014 Montbeliarde 5.879 299 7.269 7.378 3,75 3,32 393Switzerland 2015 Montbeliarde 6.186 299 7.269 7.378 3,72 3,35 393Switzerland 2014 Normande 656 299 6.677 6.777 4,09 3,42 390Switzerland 2015 Normande 694 299 6.677 6.777 4,04 3,43 390Switzerland 2014 Pinzgauer 57 299 5.645 5.730 3,83 3,31Switzerland 2015 Pinzgauer 65 299 5.645 5.730 3,80 3,31Switzerland 2014 Red Holstein 80.532 300 7.783 7.880 4,06 3,25 395Switzerland 2015 Red Holstein 77.281 300 7.783 7.880 4,03 3,27 395Switzerland 2014 Simmental 15.214 298 5.796 5.898 3,94 3,32 383Switzerland 2015 Simmental 15.058 298 5.796 5.898 3,93 3,34 383Switzerland 2014 Swiss
Fleckvieh 45.129 299 6.766 6.868 4,05 3,26 385
Switzerland 2015 Swiss Fleckvieh
46.514 299 6.766 6.868 3,93 3,34 385
Switzerland 2014 Water Buffalo 137 298 2.935 2.987 7,45 4,41 402Switzerland 2015 Water Buffalo 122 298 2.935 2.987 7,46 4,41
Cow survey (Years 2014 and 2015)

Page 61
Table 4.4 - Main breeds - Cows in herdbook
Country Year BreedNumber of lactations
Length of the lactations (days)
Milk yield per recorded cow
(kg)Milk per cow in 305 days (kg)
% fat content
% protein content
Calving interval (days)
TheNetherlands(by CRV)
2014 HolsteinBlack & White
601.038 356 9.717 8.785 4,31 3,51 417
TheNetherlands(by CRV)
2014 HolsteinBlack & White
122.246 349 8.904 8.187 4,54 3,62 417
TheNetherlands(by CRV)
2014 MRY 7.515 330 6.787 6.464 4,46 3,68 417
Tunisia 2014 Brown Swiss 552 357 5.621 5.092 440Tunisia 2015 Brown Swiss 556 360 5.759 5.113 439Tunisia 2014 Holstein 10.731 370 6.301 5.665 450Tunisia 2015 Holstein 9.090 372 6.373 5.754 452Tunisia 2014 Tarentais 149 319 3.971 3.659 419Tunisia 2015 Tarentais 117 310 3.882 3.839 413Turkey 2014 Brown Swiss 14.160 321 4.431 3.981 3,66 3,46 424Turkey 2014 Holstein
Friesian(Black and White)
239.514 348 7.280 6.244 3,48 3,22 433
Turkey 2014 HolsteinFriesian (Red and White)
614 346 7.820 6.747 3,44 3,31 418
Turkey 2014 Simmental 21.956 330 5.156 4.592 3,63 3,40 421UK - England (by CIS)
2014 Ayrshire 1.651 321 7.107 6.486 4,19 3,27 414
UK - England (by CIS)
2015 Ayrshire 2.052 312 6.918 6.351 4,14 3,29 421
Cow survey (Years 2014 and 2015)

Page 62
Table 4.4 - Main breeds - Cows in herdbook
Country Year BreedNumber of lactations
Length of the lactations (days)
Milk yield per recorded cow
(kg)Milk per cow in 305 days (kg)
% fat content
% protein content
Calving interval (days)
UK - England (by CIS)
2014 Brown Swiss 373 359 7.869 6.684 4,26 3,41 443
UK - England (by CIS)
2015 Brown Swiss 474 344 7.566 6.532 4,16 3,43 440
UK - England (by CIS)
2014 Friesian 2.370 323 7.170 6.620 4,15 3,34 402
UK - England (by CIS)
2015 Friesian 2.465 314 7.107 6.616 4,13 3,34 400
UK - England (by CIS)
2015 Guernsey 335 327 6.165 5.509 4,83 3,47 410
UK - England (by CIS)
2014 Holstein 164.847 339 10.033 8.769 3,96 3,16 420
UK - England (by CIS)
2015 Holstein 173.547 334 10.052 8.850 3,93 3,16 418
UK - England (by CIS)
2014 Jersey 7.425 310 5.941 5.388 5,53 3,80 403
UK - England (by CIS)
2015 Jersey 7.766 318 6.120 5.545 5,46 3,82 403
UK - England (by CIS)
2014 Montbeliarde 779 344 8.434 7.464 3,93 3,31 412
UK - England (by CIS)
2015 Montbeliarde 879 329 8.042 7.255 3,91 3,34 405
UK - England (by CIS)
2014 Other Breeds 4 209 5.563 5.385 3,88 3,19 212
UK - England (by CIS)
2015 Other Breeds 2 361 8.988 7.909 3,64 3,11 0
Cow survey (Years 2014 and 2015)

Page 63
Table 4.4 - Main breeds - Cows in herdbook
Country Year BreedNumber of lactations
Length of the lactations (days)
Milk yield per recorded cow
(kg)Milk per cow in 305 days (kg)
% fat content
% protein content
Calving interval (days)
UK - England (by CIS)
2014 Shorthorn 1 372 11.809 10.306 3,58 3,21 428
UK - England (by CIS)
2015 Shorthorn 2 459 9.480 7.456 4,25 3,42 673
UK - England+Wales(by NMR)
2014 Ayrshire 5.916 338 7.498 6.949 4,09 3,37 411
UK - England+Wales(by NMR)
2015 Ayrshire 2.775 322 6.666 6.191 3,92 3,37 399
UK - England+Wales(by NMR)
2014 Friesian 3.588 331 7.481 7.018 4,08 3,37 395
UK - England+Wales(by NMR)
2015 Friesian 610 334 7.369 6.828 4,07 3,40 410
UK - England+Wales(by NMR)
2014 Holstein 213.965 362 10.400 9.218 3,95 3,24 417
UK - England+Wales(by NMR)
2015 Holstein 211.226 357 10.364 9.159 3,94 3,26 415
UK - England+Wales(by NMR)
2014 Jersey 10.322 344 6.718 6.090 5,50 3,88 403
UK - England+Wales(by NMR)
2015 Jersey 10.073 346 6.659 5.948 5,46 3,92 402
Cow survey (Years 2014 and 2015)

Page 64
Table 4.4 - Main breeds - Cows in herdbook
Country Year BreedNumber of lactations
Length of the lactations (days)
Milk yield per recorded cow
(kg)Milk per cow in 305 days (kg)
% fat content
% protein content
Calving interval (days)
UK - England+Wales(by NMR)
2014 Montbeliarde 1.206 339 7.938 7.315 3,82 3,40 402
UK - England+Wales(by NMR)
2015 Montbeliarde 1.290 331 7.694 7.095 3,81 3,41 401
UK - England+Wales(by NMR)
2014 Shorthorn 2.851 326 6.746 6.351 3,94 3,35 399
UK - England+Wales(by NMR)
2015 Shorthorn 3.658 332 7.286 6.755 4,05 3,41 391
UK - Jersey Island
2014 Jersey 3.117 327 5.380 4.894 5,29 3,70 409
UK - Jersey Island
2015 Jersey 3.379 314 5.359 4.932 5,21 3,71 405
UK - N. Ireland (by CIS)
2014 Ayrshire 1.397 317 6.592 6.045 4,07 3,29 419
UK - N. Ireland (by CIS)
2015 Ayrshire 1.406 319 6.843 6.313 4,01 3,29 421
UK - N. Ireland (by CIS)
2015 Brown Swiss 1 348 7.853 7.050 4,01 3,56 0
UK - N. Ireland (by CIS)
2014 Friesian 311 321 7.137 6.618 4,23 3,34 386
UK - N. Ireland (by CIS)
2015 Friesian 340 316 7.327 6.863 4,21 3,37 397
Cow survey (Years 2014 and 2015)

Page 65
Table 4.4 - Main breeds - Cows in herdbook
Country Year BreedNumber of lactations
Length of the lactations (days)
Milk yield per recorded cow
(kg)Milk per cow in 305 days (kg)
% fat content
% protein content
Calving interval (days)
UK - N. Ireland (by CIS)
2014 Holstein 42.617 339 9.444 8.282 3,97 3,20 422
UK - N. Ireland (by CIS)
2015 Holstein 44.891 332 9.321 8.250 3,92 3,19 421
UK - N. Ireland (by CIS)
2014 Jersey 342 346 6.482 5.516 5,38 3,86 414
UK - N. Ireland (by CIS)
2015 Jersey 339 341 6.547 5.676 5,43 3,88 424
UK - N. Ireland (by CIS)
2014 Montbeliarde 67 316 7.505 6.773 3,93 3,29 365
UK - N. Ireland (by CIS)
2015 Montbeliarde 48 281 6.977 6.516 3,79 3,25 396
UK - N. Ireland (by CIS)
2015 Shorthorn 1 265 5.244 6.244 3,24 3,32 401
UK - N. Ireland (by NMR)
2014 Ayrshire 490 317 7.137 6.775 4,04 3,26 406
UK - N. Ireland (by NMR)
2015 Ayrshire 532 324 6.979 6.558 4,11 3,31 408
UK - N. Ireland (by NMR)
2014 Brown Swiss 70 359 7.514 6.703 3,79 3,37 401
UK - N. Ireland (by NMR)
2015 Brown Swiss 74 320 6.269 5.897 3,90 3,33 412
UK - N. Ireland (by NMR)
2014 Friesian 63 313 7.603 7.286 3,93 3,33 389
UK - N. Ireland (by NMR)
2015 Friesian 65 339 8.059 7.369 4,04 3,44 388
Cow survey (Years 2014 and 2015)

Page 66
Table 4.4 - Main breeds - Cows in herdbook
Country Year BreedNumber of lactations
Length of the lactations (days)
Milk yield per recorded cow
(kg)Milk per cow in 305 days (kg)
% fat content
% protein content
Calving interval (days)
UK - N. Ireland (by NMR)
2014 Holstein 10.916 360 10.450 9.196 4,02 3,22 414
UK - N. Ireland (by NMR)
2015 Holstein 10.495 348 10.127 8.990 4,05 3,21 417
UK - N. Ireland (by NMR)
2014 Jersey 319 329 6.927 6.436 5,34 3,87 408
UK - N. Ireland (by NMR)
2015 Jersey 308 322 6.644 6.007 5,31 3,86 395
UK - N. Ireland (by NMR)
2014 Montbeliarde 28 341 8.133 7.395 4,00 3,40 406
UK - N. Ireland (by NMR)
2015 Montbeliarde 24 339 7.975 7.389 3,99 3,44 371
UK - Scotland (by CIS)
2014 Ayrshire 6.087 324 7.675 6.983 4,12 3,31 418
UK - Scotland (by CIS)
2015 Ayrshire 6.612 317 7.612 6.970 4,09 3,30 419
UK - Scotland (by CIS)
2014 Brown Swiss 264 399 8.272 6.490 3,98 3,56 406
UK - Scotland (by CIS)
2015 Brown Swiss 332 300 6.822 5.965 4,06 3,52 459
UK - Scotland (by CIS)
2014 Friesian 436 324 7.586 7.034 4,31 3,33 404
UK - Scotland (by CIS)
2015 Friesian 407 315 7.365 6.930 4,23 3,36 393
UK - Scotland (by CIS)
2014 Holstein 53.384 339 10.060 8.801 3,90 3,15 422
UK - Scotland (by CIS)
2015 Holstein 56.645 330 10.019 8.862 3,85 3,14 420
Cow survey (Years 2014 and 2015)

Page 67
Table 4.4 - Main breeds - Cows in herdbook
Country Year BreedNumber of lactations
Length of the lactations (days)
Milk yield per recorded cow
(kg)Milk per cow in 305 days (kg)
% fat content
% protein content
Calving interval (days)
UK - Scotland (by CIS)
2014 Jersey 1.105 295 6.083 5.417 5,34 3,77 434
UK - Scotland (by CIS)
2015 Jersey 693 340 7.301 6.376 5,29 3,78 421
UK - Scotland (by CIS)
2014 Montbeliarde 20 316 7.132 6.718 4,26 3,38 392
UK - Scotland (by CIS)
2015 Montbeliarde 23 302 6.822 6.527 3,98 3,36 382
UK - Scotland (by NMR)
2014 Ayrshire 141 356 6.707 5.990 3,94 3,37 410
UK - Scotland (by NMR)
2015 Ayrshire 137 325 6.189 5.727 3,93 3,40 406
UK - Scotland (by NMR)
2014 Friesian 3 353 11.440 10.642 2,86 3,13 319
UK - Scotland (by NMR)
2014 Holstein 3.264 376 12.257 10.437 3,82 3,23 425
UK - Scotland (by NMR)
2015 Holstein 2.982 363 12.031 10.297 3,82 3,25 421
UK - Scotland (by NMR)
2014 Jersey 216 334 6.244 5.782 5,58 3,95 434
UK - Scotland (by NMR)
2015 Jersey 227 357 7.447 6.645 5,67 3,93 427
UK - Wales 2014 Ayrshire 309 319 7.331 6.653 4,70 3,26 424UK - Wales 2015 Ayrshire 407 263 5.989 5.602 4,50 3,25 420UK - Wales 2014 Brown Swiss 243 328 7.200 6.533 4,27 3,49 432UK - Wales 2015 Brown Swiss 275 317 7.348 6.732 4,14 3,45 424UK - Wales 2014 Friesian 324 318 6.954 6.442 3,91 3,32 389UK - Wales 2015 Friesian 402 321 6.894 6.383 4,15 3,34 383
Cow survey (Years 2014 and 2015)

Page 68
Table 4.4 - Main breeds - Cows in herdbook
Country Year BreedNumber of lactations
Length of the lactations (days)
Milk yield per recorded cow
(kg)Milk per cow in 305 days (kg)
% fat content
% protein content
Calving interval (days)
UK - Wales 2014 Guernsey 39 311 6.785 6.347 5,15 3,53 412UK - Wales 2015 Guernsey 49 287 5.696 5.380 5,09 3,49 403UK - Wales 2014 Holstein 27.315 338 9.467 8.292 4,06 3,16 423UK - Wales 2015 Holstein 31.312 328 9.398 8.315 4,02 3,19 420UK - Wales 2014 Jersey 518 308 5.631 5.102 5,47 3,72 408UK - Wales 2015 Jersey 574 288 5.417 4.834 5,32 3,72 411UK - Wales 2015 Other Breeds 1 298 8.356 8.356 3,76 3,42 0
Cow survey (Years 2014 and 2015)

Page 69
Sheep Survey (Years 2014 and 2015)

Page 70
SHEEP SURVEYTable 1A - Milk recording and management of the lactation
Country Year
Breed or population
(Name)
Number of flocks in
the populatio
n
Number of ewes in the population
Number of flocks in
milk recording
Number of ewes in milk recording1
Recorded flocks
milking after
suckling period2
If system (2).
average length of
the suckling period (in
days)
% of official recorded flocks in machine milking
Number of flocks in D recording
Number of ewes in D recording
Canada 2014 7 1.158 Croatia 2014 East Frisian 50 2.000 9 390 2 55 Croatia 2015 East Frisian 50 2.000 9 364 2 37 Croatia 2014 Istrian Sheep 41 3 33 2.154 2 48 Croatia 2015 Istrian Sheep 41 2.000 23 1.357 2 42 Croatia 2014 Paska Sheep 600 30 52 3.934 2 40 Croatia 2015 Paska Sheep 600 30.000 50 4.388 2 39 Czech Rep.
2014 All Breeds 47 1.606
Czech Rep.
2015 All Breeds 40 1.570
Germany 2014 Lacaune 2 150 1 100 Germany 2015 Lacaune 3 217 (1)=100% 100
Germany 2014 Ostfriesisches Milchschaf 30 566
(1)=97%(2)=3% 43 60
Germany 2015 Ostfriesisches Milchschaf 31 715 (1)=100% 65
France 2015 Basco-Bearnaise
400 78 80 24.039 2 35 85 26 6.625
France 2015 Corse 375 83 53 16.172 2 35 95 49 13.294 France 2015 Lacaune 2.500 890 363 172.836 2 25 100 1.126 486.083 France 2015 Manech Tete
Noire 480 80 37 11.747 2 35 95 35 9.300
France 2015 Manech Tete Rousse
1.300 274 215 80.935 2 35 95 65 20.543
Italy 2014 Comisana 392 24.667 2 30 Italy 2014 Delle Langhe 46 2.303 2 30
Sheep survey (Years 2014 and 2015)

Page 71
Country Year
Breed or population
(Name)
Number of flocks in
the populatio
n
Number of ewes in the population
Number of flocks in
milk recording
Number of ewes in milk recording1
Recorded flocks
milking after
suckling period2
If system (2).
average length of
the suckling period (in
days)
% of official recorded flocks in machine milking
Number of flocks in D recording
Number of ewes in D recording
Italy 2014 Massese 96 8.248 2 30 Italy 2014 Pinzirita 164 13.642 2 30 Italy 2014 Sarda 1.032 212.941 2 30 Italy 2014 Valle del
Belice 833 117.437 2 30
Slovak Rep.
2014 East Friesian 6 35 2 40 38
Slovak Rep.
2015 East Friesian 4 23 2 55 50
Slovak Rep.
2014 Hybrids1 11 2 2 53 93
Slovak Rep.
2015 Hybrids1 14 2 2 48 93
Slovak Rep.
2014 Improved Valachian
22 4 2 45 71
Slovak Rep.
2015 Improved Valachian
20 3 2 44 55
Slovak Rep.
2014 Lacaune 16 969 2 53 88
Slovak Rep.
2015 Lacaune 17 899 2 45 94
Slovak Rep.
2014 Tsigai 26 3 2 57 77
Slovak Rep.
2015 Tsigai 21 2 2 57 76
1 Synthetic population Slovak Dairy Sheep
Table 1A - Milk recording and management of the lactation
Sheep survey (Years 2014 and 2015)

Page 72
Country Year
Breed or population
(Name)
Number of flocks in
the populatio
n
Number of ewes in the population
Number of flocks in
milk recording
Number of ewes in milk recording1
Recorded flocks
milking after
suckling period2
If system (2).
average length of
the suckling period (in
days)
% of official recorded flocks in machine milking
Number of flocks in D recording
Number of ewes in D recording
Slovak Rep.
2015 Valachian 3 47 2 64 -
Slovenia 2014 Bovec sheep 1175 1 and 2 100 Slovenia 2015 Bovec sheep 1197 1 and 2 100
Slovenia 2014 Istrian Pramenka 197 1 and 2 100
Slovenia 2015 Istrian Pramenka 266 1 and 2 100
Slovenia 2014 Improved Bovec sheep 431 1 and 2 100
Slovenia 2015 Improved Bovec sheep 416 1 and 2 100
Spain 2014 Carranzana 902 11.658 10 1.574 2) Milking after a
suckling period
30
Spain 2014 Castellana 20 18.000 9 7.000 2) Milking after a
suckling period
30 100
Table 1A - Milk recording and management of the lactation
Sheep survey (Years 2014 and 2015)

Page 73
Country Year
Breed or population
(Name)
Number of flocks in
the populatio
n
Number of ewes in the population
Number of flocks in
milk recording
Number of ewes in milk recording1
Recorded flocks
milking after
suckling period2
If system (2).
average length of
the suckling period (in
days)
% of official recorded flocks in machine milking
Number of flocks in D recording
Number of ewes in D recording
Spain 2014 Churra 870 390.000 66 35.094 2) Milking after a
suckling period
25 98
Spain 2015 Churra 800 360.000 64 41.093 2) Milking after a
suckling period
25 100
Spain 2014 Colmenareña 20 7.507 3 2.695 2) Milking after a
suckling period
30 100
Spain 2015 Colmenareña 21 5.748 3 2.755 2) Milking after a
suckling period
30 100
Spain 2014 Lacaune 300 200.000 32 47.497 1) Milking from
kidding
10
Spain 2014 Latxa 8.249 331.770 177 67.060 2) Milking after a
suckling period
30 86
Table 1A - Milk recording and management of the lactation
Sheep survey (Years 2014 and 2015)

Page 74
Country Year
Breed or population
(Name)
Number of flocks in
the populatio
n
Number of ewes in the population
Number of flocks in
milk recording
Number of ewes in milk recording1
Recorded flocks
milking after
suckling period2
If system (2).
average length of
the suckling period (in
days)
% of official recorded flocks in machine milking
Number of flocks in D recording
Number of ewes in D recording
Spain 2014 Manchega 776 526.952 130 122.589 2) Milking after a
suckling period
30 100
Spain 2015 Manchega 762 529.505 137 136.182 2) Milking after a
suckling period
30 100
Spain 2015 Merina de Grazalema
36 4.851 9 1.735 1) Milking from
kidding 5 %, 2) Milking after a
suckling period 95 %
55 100
Spain 2014 Merino de Grazalema
36 4.611 11 1.883 (1) Milking from
lambing 5%, (2) Milking after a
suckling period 95%
55 82
Table 1A - Milk recording and management of the lactation
Sheep survey (Years 2014 and 2015)

Page 75
Country Year
Breed or population
(Name)
Number of flocks in
the populatio
n
Number of ewes in the population
Number of flocks in
milk recording
Number of ewes in milk recording1
Recorded flocks
milking after
suckling period2
If system (2).
average length of
the suckling period (in
days)
% of official recorded flocks in machine milking
Number of flocks in D recording
Number of ewes in D recording
Spain 2014 Rubia de el Molar
8 1.817 1 127 2) Milking after a
suckling period
30 100
Spain 2015 Rubia de El Molar
9 1.817 1 146 2) Milking after a
suckling period
30 100
__________________ NOTE 1 Inventory at lambing in case of one lambing per year or inventory at a fixed date in the other cases 2 Answer (1) or (2), if only one system is used (per breed or in the country) as regards lactation ; or percentage of ewes in system (1) and system (2), if
used simultaneously.
Table 1A - Milk recording and management of the lactation
Sheep survey (Years 2014 and 2015)

Page 76
Table 1B - Methods of milk recording
Country Year Breed or
population (Name)
Percentage of A4, A5, A6, B4, B5, B6, C4, C5, C6 (precise
if necessary) 1
Percentage of AT , BT, CT (precise if
necessary) 1
Percentage of AC, BC, CC (precise if
necessary) 1
Percentage of E4, E5, E6, ET, EC
(precise if necessary) 1
Croatia 2014 East Frisian - AT=100% Croatia 2015 East Frisian " AT=100%" Croatia 2014 Istrian Sheep - AT=100% Croatia 2015 Istrian Sheep AT=100% Croatia 2014 Paska Sheep - " AT=100%" Croatia 2015 Paska Sheep " AT=100%" Czech Rep. 2014 All Breeds AT=100% Czech Rep. 2015 All Breeds AT=100%
Germany 2014 Ostfriesisches Milchschaf 86 14
Germany 2015 Ostfriesisches Milchschaf 59 30 11
Germany 2014 Lacaune 100 France 2015 Basco-Bearnaise AC = 100 France 2015 Corse AC = 100 France 2015 Lacaune AC = 100 France 2015 Manech Tete Noire AC = 100 France 2015 Manech Tete
Rousse AC = 100
Italy 2014 Comisana AT Italy 2014 Delle Langhe AT Italy 2014 Massese AT Italy 2014 Pinzirita AT Italy 2014 Sarda AT AC Italy 2014 Valle del Belice AT Slovak Rep. 2014 East Friesian AC=100% Slovak Rep. 2015 East Friesian AC=100%
Sheep survey (Years 2014 and 2015)

Page 77
Country Year Breed or
population (Name)
Percentage of A4, A5, A6, B4, B5, B6, C4, C5, C6 (precise
if necessary) 1
Percentage of AT , BT, CT (precise if
necessary) 1
Percentage of AC, BC, CC (precise if
necessary) 1
Percentage of E4, E5, E6, ET, EC
(precise if necessary) 1
Slovak Rep. 2014 Hybrids1 AC=100% Slovak Rep. 2015 Hybrids1 AC=100% Slovak Rep. 2014 Improved Valachian AC=100% Slovak Rep. 2015 Improved Valachian AC=100% Slovak Rep. 2014 Lacaune AC=100% Slovak Rep. 2015 Lacaune AC=100% Slovak Rep. 2014 Tsigai AC=100% Slovak Rep. 2015 Tsigai AC=100% Slovak Rep. 2015 Valachian AC=100% Slovenia 2014 Istrian Pramenka 0 100% AT4 0 0 Slovenia 2015 Istrian Pramenka 0 100% AT4 0 0 Slovenia 2014 Improved Bovec 0 100% AT4 0 0 Slovenia 2015 Improved Bovec 0 100% AT4 0 0 Slovenia 2014 Bovec 0 100% AT4 0 0 Slovenia 2015 Bovec 0 100% AT4 0 0 Spain 2014 Carranzana AT= 100 % Spain 2014 Castellana AT4= 100% Spain 2014 Churra AT= 100 % Spain 2015 Churra AT 100 % Spain 2014 Colmenareña AT4 100% Spain 2015 Colmenareña AT4= 100% Spain 2014 Lacaune A4= 100 % Spain 2014 Latxa AT= 43 % AC= 57 %
1 Synthetic population Slovak Dairy Sheep
Table 1B - Methods of milk recording
Sheep survey (Years 2014 and 2015)

Page 78
Country Year Breed or
population (Name)
Percentage of A4, A5, A6, B4, B5, B6, C4, C5, C6 (precise
if necessary) 1
Percentage of AT , BT, CT (precise if
necessary) 1
Percentage of AC, BC, CC (precise if
necessary) 1
Percentage of E4, E5, E6, ET, EC
(precise if necessary) 1
Spain 2014 Manchega AT= 100% Spain 2015 Manchega AT 100 % Spain 2014 Merina de
Grazalema AT= 100%
Spain 2015 Merina de Grazalema
AT 100 %
Spain 2014 Rubia de el Molar AT4 100% Spain 2015 Rubia de el Molar AT= 100%
__________________ NOTE 1 See the definition of official milk recording method on the ICAR website (www.icar.org) in the part dedicated to the milk recording of sheep WG : “Recording guidelines”, Section 2.2
Table 1B - Methods of milk recording
Sheep survey (Years 2014 and 2015)

Page 79
Table 2A - Type of lactation calculation for milk yield
Country Year Breed or population (Name) TSMM2 TMM3 TMY4 TSMM1 TMM2 TMY3 Croatia 2014 East Frisian Yes Yes No No No No Croatia 2015 East Frisian Yes Yes No No No No
Croatia 2014 Istrian Sheep Yes Yes No No No No
Croatia 2015 Istrian Sheep Yes Yes No No No No
Croatia 2014 Paska Sheep Yes Yes No No No No
Croatia 2015 Paska Sheep Yes Yes No No No No
Czech Rep. 2014 All Breeds
Czech Rep. 2015 All Breeds
Germany 2014 Lacaune Yes Yes. 150
Germany 2015 Lacaune Yes Yes. 150
Germany 2014 Ostfriesisches Milchschaf Yes Yes. 150
Germany 2015 Ostfriesisches Milchschaf Yes Yes. 150 France 2015 Basco-Bearnaise No Yes No No No No
France 2015 Corse No Yes No No No No
France 2015 Lacaune No Yes No No No No
France 2015 Manech Tet Rousse No Yes No No No No
France 2015 Manech Tete Noire No Yes No No No No
Italy 2014 Comisana Yes Yes No No From day 30 from
lambing to reference
length
No
Sheep survey (Years 2014 and 2015)

Page 80
Country Year Breed or population (Name) TSMM2 TMM3 TMY4 TSMM1 TMM2 TMY3 Italy 2014 Delle Langhe Yes Yes No No From day
30 from lambing to reference
length
No
Italy 2014 Massese Yes Yes No No From day 30 from
lambing to reference
length
No
Italy 2014 Pinzirita Yes Yes No No From day 30 from
lambing to reference
length
No
Italy 2014 Sarda Yes Yes No No From day 30 from
lambing to reference
length
No
Italy 2014 Valle del Belice y y n No From day 30 from
lambing to reference
length
No
Slovak Republic 2014 East Friesian No Yes No No Yes. 150 No
Slovak Republic 2015 East Friesian No Yes No No Yes. 150 No
Slovak Republic 2014 Hybrids (synthetic population Slovak Dairy Sheep)
No Yes No No Yes. 150 No
Table 2A - Type of lactation calculation for milk yield
Sheep survey (Years 2014 and 2015)

Page 81
Country Year Breed or population (Name) TSMM2 TMM3 TMY4 TSMM1 TMM2 TMY3 Slovak Republic 2015 Hybrids (synthetic population
Slovak Dairy Sheep) No Yes No No Yes. 150 No
Slovak Republic 2014 Improved Valachian No Yes No No Yes. 150 No
Slovak Republic 2015 Improved Valachian No Yes No No Yes. 150 No
Slovak Republic 2014 Lacaune No Yes No No Yes. 150 No
Slovak Republic 2015 Lacaune No Yes No No Yes. 150 No
Slovak Republic 2014 Tsigai No Yes No No Yes. 150 No
Slovak Republic 2015 Tsigai No Yes No No Yes. 150 No
Slovak Republic 2015 Valachian No Yes No No Yes. 150 No
Slovenia 2014 Bovec sheep Yes Yes Yes No No No
Slovenia 2015 Bovec Yes Yes Yes No No No
Slovenia 2014 Improved Bovec Yes Yes Yes No No No
Slovenia 2015 Improved Bovec Yes Yes Yes No No No
Slovenia 2014 Istrian Pramenka Yes Yes Yes No No No
Slovenia 2015 Istrian Pramenka Yes Yes Yes No No No Spain 2014 Carranzana Yes Yes Yes Yes Yes. 120
Spain 2014 Castellana Yes No Yes No Yes. 120 Days
No
Spain 2014 Churra Yes Yes No No Yes, 0-120 No
Spain 2015 Churra Yes Yes No No Yes 120 days
No
Table 2A - Type of lactation calculation for milk yield
Sheep survey (Years 2014 and 2015)

Page 82
Country Year Breed or population (Name) TSMM2 TMM3 TMY4 TSMM1 TMM2 TMY3 Spain 2014 Colmenareña No Yes No No Yes 120
days No
Spain 2015 Colmenareña No Yes No No Yes. 120 Days
No
Spain 2014 Lacaune No No Yes No No
Spain 2014 Latxa Yes Yes Yes Yes Yes. 120
Spain 2014 Manchega Yes Yes No Yes Yes. 120 Days
No
Spain 2015 Manchega Yes Yes No Yes Yes 120 days
No
Spain 2015 Merina de Grazalema Yes No No Yes, 157 days
No No
Spain 2014 Merina de Grazalema No Yes No No Yes, 162 days
No
Spain 2014 Rubia de El Molar No Yes No No Yes 120 days
No
Spain 2015 Rubia de El Molar No Yes No No Yes. 120 Days
__________________ NOTE
1 See the definition of the terms on the ICAR website (www.icar.org) in the part dedicated to the milk recording of sheep WG : “Recording guidelines”, Section 2.2.
2 TSMM: total suckled and milked milk (case of milking after a suckling period). 3 TMM: total milked milk (case of milking after a suckling period). 4 TMY: total milk yield (case of milking from lambing, i.e. without a suckling period).
Table 2A - Type of lactation calculation for milk yield
Sheep survey (Years 2014 and 2015)

Page 83
Table 2B - Milk yield results
Country Year Breed or population
(Name) Yearlings 1 Adults2 All ewes Notes Croatia 2014 East Frisian 199 185 189 Croatia 2014 Istrian Sheep 132 163 156 Croatia 2014 Paska Sheep 76 105 102 Czech Rep. 2014 All Breeds 255 Czech Rep. 2015 All Breeds 277 Germany 2014 Lacaune 353 The kg are the used unit Germany 2015 Lacaune 372 The kg are the used unit Germany 2014 Ostfriesisches Milchschaf 261 The kg are the used unit Germany 2015 Ostfriesisches Milchschaf 249 The kg are the used unit France 2015 Basco-Bearnaise 140 (107 days) 204 (159 days) 194 (151 days) Litres are used as unit France 2015 Corse 92 (127 days) 154 (197 days) 143 (184 days) Litres are used as unit France 2015 Lacaune 246 (152 days) 316 (176 days) 299 (170 days) Litres are used as unit France 2015 Manech Tet Noire 138 (126 days) 163 (151 days) 161 (149 days) Litres are used as unit France 2015 Manech Tete Rousse 184 (142 days) 220 (163 days) 215 (161 days) Litres are used as unit Italy 2014 Comisana 103 187 183 From day 30 from
lambing to reference length
Italy 2014 Delle Langhe 104 158 148 From day 30 from lambing to reference
length Italy 2014 Massese 110 129 127 From day 30 from
lambing to reference length
Italy 2014 Sarda 141 208 201 Yields from day 30 from lambing to reference
length Italy 2014 Valle del Belice 120 188 186 From day 30 from
lambing to reference length
Sheep survey (Years 2014 and 2015)
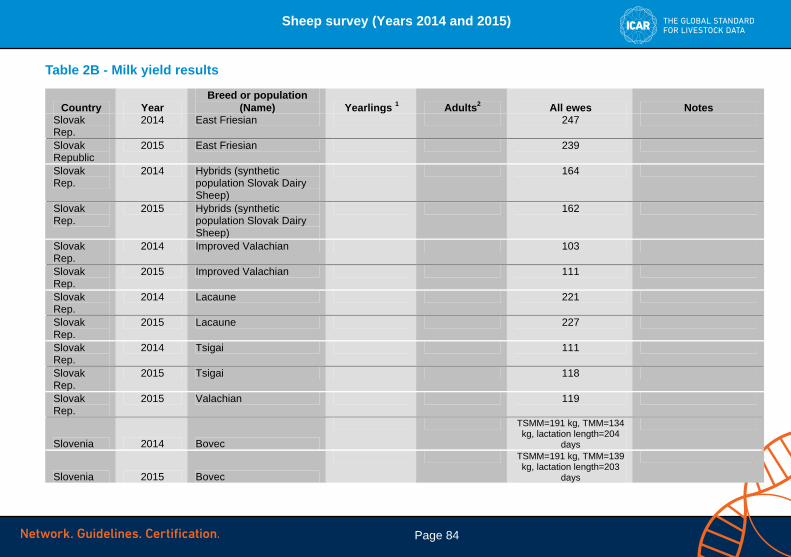
Page 84
Table 2B - Milk yield results
Country Year Breed or population
(Name) Yearlings 1 Adults2 All ewes Notes Slovak Rep.
2014 East Friesian 247
Slovak Republic
2015 East Friesian 239
Slovak Rep.
2014 Hybrids (synthetic population Slovak Dairy Sheep)
164
Slovak Rep.
2015 Hybrids (synthetic population Slovak Dairy Sheep)
162
Slovak Rep.
2014 Improved Valachian 103
Slovak Rep.
2015 Improved Valachian 111
Slovak Rep.
2014 Lacaune 221
Slovak Rep.
2015 Lacaune 227
Slovak Rep.
2014 Tsigai 111
Slovak Rep.
2015 Tsigai 118
Slovak Rep.
2015 Valachian 119
Slovenia 2014 Bovec
TSMM=191 kg, TMM=134 kg, lactation length=204
days
Slovenia 2015 Bovec
TSMM=191 kg, TMM=139 kg, lactation length=203
days
Sheep survey (Years 2014 and 2015)

Page 85
Table 2B - Milk yield results
Country Year Breed or population
(Name) Yearlings 1 Adults2 All ewes Notes
Slovenia 2014 Improved Bovec
TSMM=252 kg, TMM=204 kg, lactation length=212
days
Slovenia 2015 Improved Bovec
TSMM=289 kg, TMM=244 kg, lactation length=230
days
Slovenia 2014 Istrian Pramenka
TSMM=149 kg, TMM=95 kg, lactation length=192
days
Slovenia 2015 Istrian Pramenka
TSMM=155 kg, TMM=99 kg, lactation length=196
days
Spain 2014 Carranzana 153 160 170 Spain 2014 Castellana 50 67 62 Spain 2014 Churra 122 129 127 Spain 2015 Churra 131 133 133 Spain 2014 Colmenareña 77 99 95 Spain 2015 Colmenareña 79 99 95 Spain 2014 Lacaune 306 363 333 Spain 2014 Latxa 148 195 173 Spain 2014 Manchega 165 188 176 Spain 2015 Manchega 200 225 215 Milk yield during the
whole lactation period. Spain 2015 Merina de Grazalema 102 125 122 Spain 2014 Merina de Grazalema 109 131 123 Spain 2014 Rubia de el Molar 57 65 64 Spain 2015 Rubia de El Molar 54 65 64
__________________ NOTE 1 Yearling : 12-18 month-old 2 Adults : >18 month-old
Sheep survey (Years 2014 and 2015)

Page 86
Table 3 - Optional tests for milk composition
Country Year
Breed or population
(Name)
Categories or classes of
age or parity concerned
Method used for recording
milk composition 1 Fat Protein SCC
Other Analysis Notes
Croatia 2014 East Frisian 348 AT Yes Yes Yes Lactose Croatia 2015 East Frisian 364 AT Yes Yes Yes Lactose Croatia 2014 Istrian Sheep 2.154 AT Yes Yes Yes Lactose Croatia 2015 Istrian Sheep 1.357 AT Yes Yes Yes Lactose Croatia 2014 Paska Sheep 3.934 AT Yes Yes Yes Lactose Croatia 2015 Paska Sheep 4.388 AT Yes Yes Yes Lactose Czech Rep.
2015 All Breeds AT Yes Yes Yes Lactose
Czech Rep.
2015 All Breeds AT Yes Yes Yes Lactose
Germany 2014 Lacaune 150 A4, B4 Yes Yes Germany 2015 Lacaune 217 A4, B4 Yes Yes Germany
2014 Ostfriesisches Milchschaf 566
A4, B4, E4, AT, BT Yes Yes
Germany 2015
Ostfriesisches Milchschaf 715
A4, B4, E4, AT, BT Yes Yes
France 2015 Lacaune Parities 1 & 2 (65.091 ewes)
Part-lactation sampling
Yes Yes Yes
Italy 2014 Sarda Primiparous ewes: 17.777
AC,AT Yes, 5,6 Yes, 5,25
Slovak Rep.
2014 East Friesian Parity 1 to 3 (35 ewes)
AC Yes Yes Lactose
Slovak Rep.
2015 East Friesian Parity 1 to 3 (23 ewes)
AC Yes Yes Lactose
Sheep survey (Years 2014 and 2015)

Page 87
Table 3 - Optional tests for milk composition
Country Year
Breed or population
(Name)
Categories or classes of
age or parity concerned
Method used for recording
milk composition 1 Fat Protein SCC
Other Analysis Notes
Slovak Rep.1
2014 Hybrids Parity 1 to 3 (1525 ewes)
AC Yes Yes Lactose
Slovak Rep. 1
2015 Hybrids Parity 1 to 3 (1641 ewes)
AC Yes Yes Lactose
Slovak Rep.
2014 Improved Valachian
Parity 1 to 3 (3,565 ewes)
AC Yes Yes Lactose
Slovak Rep.
2015 Improved Valachian
Parity 1 to 3 (2,548 ewes)
AC Yes Yes Lactose
Slovak Rep.
2014 Lacaune Parity 1 to 3 (969 ewes)
AC Yes Yes Lactose
Slovak Rep.
2015 Lacaune Parity 1 to 3 (899 ewes)
AC Yes Yes Lactose
Slovak Rep.
2014 Tsigai Parity 1 to 3 (3,154 ewes)
AC Yes Yes Lactose
Slovak Rep.
2015 Tsigai Parity 1 to 3 (2,439 ewes)
AC Yes Yes Lactose
Slovak Rep.
2015 Valachian Parity 1 to 3 (47 ewes)
AC Yes Yes Lactose
Slovenia 2014 Bovec All ewes =1175 AT4 Yes, 6,4 Yes, 5,3
Slovenia 2015 Bovec All ewes =
1197 AT4 Yes, 6,4 Yes, 5,3
1 Synthetic population Slovak Dairy Sheep
Sheep survey (Years 2014 and 2015)

Page 88
Country Year
Breed or population
(Name)
Categories or classes of
age or parity concerned
Method used for recording
milk composition 1 Fat Protein SCC
Other Analysis Notes
Slovenia 2014 Improved Bovec All ewes =
431 AT4 Yes, 5,9 Yes, 5,3
Slovenia 2014 Istrian Pramenka
All ewes = 291 AT4 Yes, 7,2 Yes, 5,7
Slovenia 2015 Istrian Pramenka
All ewes = 266 AT4 Yes, 7,3 Yes, 5,70
Spain 2014 Carranzana AC Yes Yes Yes Lactose, Dry
matter
(Lekunberri) Laboratory accredited by ENAC (174/le 381)
Spain 2014 Castellana AT Yes Yes Yes Spain 2014 Churra AT Yes, 7,06 Yes, 5,72 Yes,
995.000 cells/m
Lactose
Spain 2015 Churra AT Yes, 7,01 Yes, 5,79 Yes Lactose Spain 2014 Colmenareña AT4 Yes, 6,8 Yes, 5,3 Yes Dry
matter, lactose
Spain 2015 Colmenareña AT4 Yes, 6,8 Yes, 5,3 Yes Dry matter, lactose
Spain 2014 Lacaune A4 Yes. 7,04 Yes. 5,56 Yes Spain 2014 Latxa AC Yes, 6,23 Yes, 5,17 Yes Lactose,
Dry matter
(Lekunberri) Laboratory accredited by ENAC (174/le 381)
Table 3 - Optional tests for milk composition
Sheep survey (Years 2014 and 2015)

Page 89
Country Year
Breed or population
(Name)
Categories or classes of
age or parity concerned
Method used for recording
milk composition 1 Fat Protein SCC
Other Analysis Notes
Spain 2014 Manchega AT Yes, 7,3 Yes, 5,5 Yes Dry matter
Spain 2015 Manchega AT Yes, 7,7 Yes, 5,6 Yes Dry matter
Spain 2015 Merina de Grazalema
AT4 Yes, 8,12 Yes, 6,39 Yes Dry matter
Spain 2014 Merino de Grazalema
AT4 Yes. 7,57 Yes. 6 Yes. 52.4920
cells
Dry matter
(19,15), Spain 2014 Rubia de el
Molar AT4 Yes, 6,4 Yes, 5,3 Yes Dry
matter, lactose
Spain 2015 Rubia de El Molar AT4 Yes. 6,4 Yes. 5,3 Yes
Dry matter, lactose
__________________ NOTE 1 A4, A5, A6, AT, AC , E4, EC, ET (see appendix A of the ICAR regulations for milk recording in sheep). If other method used, please describe it.
Table 3 - Optional tests for milk composition
Sheep survey (Years 2014 and 2015)

Page 90
Table 4 - Recording of non-milking traits
Reproductive traits, weights and growths, udder score, longevity
Country Year Breed or population Traits On-farm recording Breeding evaluation Croatia 2014 East Frisian Reproductive traits and birth weight Yes No Croatia 2015 East Frisian Reproductive traits and birth weight Yes No Croatia 2014 Istrian Sheep Reproductive traits and birth weight Yes No Croatia 2015 Istrian Sheep Reproductive traits and birth weight Yes No Croatia 2014 Paska Sheep Reproductive traits and birth weight Yes No Czech Rep. 2014 All Breeds Weight, reproductive traits Yes Yes Czech Rep. 2015 All Breeds Weight, reproductive traits Yes Yes France 2015 All Breeds Reproductive traits (all); udder
scoring (except Corse); resistance to gastrointestinal strongyles (Pyrenean
breeds only)
Yes Yes
Italy 2014 All breeds Udder score, morphological evaluation
Yes No
Slovak Rep. 2014 All Breeds Reproductive traits, weight Yes Yes
Slovenia 2014 Bovec Offspring birth weight, offspring
weaning weight, litter size Yes
Slovenia 2015 Bovec Offspring birth weight, offspring
weaning weight, litter size Yes
Slovenia 2014 Improved Bovec Offspring birth weight, offspring
weaning weight, litter size Yes
Slovenia 2015 Improved Bovec
Offspring birth weight, offspring weaning weight, litter size
Yes
Slovenia 2014 Istrian Pramenka Offspring birth weight, offspring
weaning weight, litter size Yes
Slovenia 2015 Istrian Pramenka
Offspring birth weight, offspring weaning weight, litter size
Yes
Slovak Rep. 2015 All Breeds Reproductive traits, weight Yes Yes
Sheep survey (Years 2014 and 2015)

Page 91
Table 4 - Recording of non-milking traits
Reproductive traits, weights and growths, udder score, longevity
Country Year Breed or population Traits On-farm recording Breeding evaluation Spain 2014 Carranzana Weights and growths, longevity (since
1982), prolificity (since 1982), mortality (since 1982)
Yes No
Spain 2014 Castellana Milk production Yes Yes Spain 2014 Churra Udder score Yes Yes Spain 2015 Churra Udder Score Yes Yes Spain 2014 Colmenareña Reproductive traits, udder score,
Weights and growths, longevity Yes (Reproductive
traits) No
Spain 2015 Colmenareña Udder Score, weights and growths, longevity and reproductive traits
Yes (Reproductive traits)
No
Spain 2014 Lacaune Udder score Yes No Spain 2014 Latxa Weights and growths, Udder score
(since 2001), logevity (since 1982), prolificity (since 1982), mortality
(since 1982)
Yes (All) Yes (Udder score)
Spain 2014 Manchega Udder score (since 2002, 28137 animals)
Yes Yes
Spain 2015 Manchega Udder Score 21.338 Yes Yes Spain 2015 Merina de Grazalema Scrapie resistance Yes No Spain 2014 Merino de Grazalema Scrapie resistance Yes No Spain 2014 Rubia de El Molar Reproductive traits, udder score,
Weights and growths, longevity Yes (Reproductive
traits) No
Spain 2015 Rubia de El Molar Udder Score, weights and growths, longevity and reproductive traits
Yes (Reproductive traits)
No
Sheep survey (Years 2014 and 2015)

Page 92
Table 5 - Milk recording equipment used in case of machine milking
Country Year Breed or population
(Name) Indicate jars/meter Name of the
manufacturer Measurement
(weight/volume) Approximate
number in use Croatia 2014 East Frisian Jars Cartel Germany Volume, Sampler 6 Croatia 2015 East Frisian Jars Cartel Germany Volume, Sampler 6 Croatia 2014 Istrian Sheep Jars Cartel Germany Volume, Sampler 13 Croatia 2015 Istrian Sheep Jars Cartel Germany Volume, Sampler 16 Croatia 2014 Paska Sheep Jars Cartel Germany Volume, Sampler 15 Croatia 2015 Paska Sheep Jars Cartel Germany Volume, Sampler 20 Czech Rep. 2015 All Breeds Tru-Test TRU-TEST MINI France 2015 All breeds Jars only Etablissement Gely Volume. Sampler 3.000 Italy 2014 All breeds Mibo-Girotech; Royal;
- Volume; Sampler, Tru-Test Mod. Hi ; Waikato Mk5 4,5
Liters; Afifree; Mm25-27
Afifree - MM25-27 Weight; Waikato Volume; All have
sampler
Slovak Rep. 2014 All breeds Fisher Slovakia - Volume, 21
Berango, Milkovis Volume, sampler no Berango 189, Milkovis 143
Slovak Rep. 2015 All Breeds Fisher Slovakia - Volume
Berango, Milkovis Volume, sampler no Berango 167, Milkovis 143
Slovenia 2014 Bovec Weight Slovenia 2015 Bovec Weight Slovenia 2014 Improved Bovec Weight Slovenia 2015 Improved Bovec Weight Slovenia 2014 Istrian Pramenka Weight Slovenia 2015 Istrian Pramenka Weight Spain 2014 Carranzana Meter Westfalia Volume 30 Spain 2014 Castellana Meter Esneder (Berango) Volume Sampler 120 Spain 2014 Churra Meter Berango Volume 150 Spain 2015 Churra Meters Berango Volume Sampler 150
Sheep survey (Years 2014 and 2015)

Page 93
Table 5 - Milk recording equipment used in case of machine milking
Country Year Breed or population
(Name) Indicate jars/meter Name of the
manufacturer Measurement
(weight/volume) Approximate
number in use Spain 2014 Colmenareña Meters Alfa Laval/Schneder Weight/volume 24 Spain 2015 Colmenareña Meters Alfa Laval/Schneder Weight/volume 24 Spain 2014 Lacaune Meters Berango, Trutest,
Delaval, Gea, Afiquim Weight sampler 320
Spain 2014 Latxa Meter Westfalia Volume 220 Spain 2014 Manchega Meters DeLaval, Westfalia,
Flaco Volume sampler. YES 900
Spain 2015 Manchega Meters DeLaval, Westfalia, Flaco
Volume Sampler 950
Sheep survey (Years 2014 and 2015)

Page 94
Table 6 - Breeding programme using artificial insemination
Progeny test
Country Year Breed or
population Fresh semen Frozen semen
Selection criteria
AI progeny-tested rams per year
Number of AI per progeny-tested
rams Croatia1 France 2015 Basco-
Bearnaise 14.802 No Milk Yield, Fat
& Protein content (100%)
44 130
France 2015 Corse 6.633 No Milk Yield 20 130 France 2015 Lacaune 407.787 No Milk yield, fat &
protein content (50%) ; Udder morphology (3
scores) (2
290 (after genomic) 120
France 2015 Manech Tete Noire
11.063 No Milk yield, fat & protein content
(100%)
29 130
France 2015 Manech Tete Rousse
61.458 No Milk yield, fat & protein content
(100%)
172 120
Italy 2014 Sarda 6.500 MIlk 15 at least
Slovenia 2014 All recorded breeds AI is not in use
Slovenia 2015 All recorded breeds AI is not in use
Spain 2014 Carranzana 185 0 Morphology 3 120 Spain 2014 Castellana 290 Milk production 1 150
1 In Croatia there is no AI service
Sheep survey (Years 2014 and 2015)

Page 95
Table 6 - Breeding programme using artificial insemination
Progeny test
Country Year Breed or
population Fresh semen Frozen semen
Selection criteria
AI progeny-tested rams per year
Number of AI per progeny-tested
rams Spain 2014 Churra 7.455 769 Morphology,
Milk production and milk
composition
35 170
Spain 2015 Churra 6.341 440 Milk production and
morphology of goats
28 170
Spain 2014 Colmenareña Spain 2015 Colmenareña Spain 2014 Lacaune 8.000 230 Milk production 21 >150 Spain 2014 Latxa 21.236 0 Morphology,
Milk composition and Udder
score
83 120
Sheep survey (Years 2014 and 2015)

Page 96
Table 7 - Molecular information
Country Year Breed or
population Type of genotyping 1
Number of analysis, Number of flocks
involved
Use in experimental
program
Effective use in selection
program Notes Croatiaaa 2014 Istrian Sheep Croatiaa 2015 Istrian Sheep Croatiaa 2014 Paska Sheep Croatiaa 2015 Paska Sheep Czech Rep.
2014 All breeds PrP Yes
Czech Rep.
2015 All Breeds PrP Yes
France 2015 Basco-Bearnaise
PrP 1.502
France 2015 Corse PrP 2.130 France 2015 Corse OvineBeadChip 54k
Illumina 529
France 2015 Lacaune Prp 5.833 France 2015 Lacaune OvineBeadChip 54k
Illumina 1.850
France 2015 Manech Tete Noire
PrP 1.128
France 2015 Manech Tete Rousse
PrP 2.758
Slovak Rep.
2014 All breeds PrP genotyping 1.434 analysis Yes
Slovak Rep.
2015 All breeds PrP genotyping 2.427 analysis Yes
a Samples have been collected but none was analyzed
Sheep survey (Years 2014 and 2015)

Page 97
Table 7 - Molecular information
Country Year Breed or
population Type of genotyping 1
Number of analysis, Number of flocks
involved
Use in experimental
program
Effective use in selection
program Notes
Slovenia 2014 All recorded breeds PRP genotyping Yes
Slovenia 2015 All recorded breeds PRP genotyping Yes
Spain 2014 Carranzana Filiation Test (20 markers), PNRP
Filiation test: 62 analysis in 3 flocks. PNRP 57
analysis in 11 floc
No Yes
Spain 2014 Castellana PNRP 2.108 analysis in 9 flocks
No Yes
Spain 2014 Churra Filiation test, PNRP Filiation test: 509 analysis in 26 flocks. PNRP 661
analysis in 94 f
No Yes
Spain 2015 Churra Filiation Test, PNRP Filiation test: 601 analysis in 38 flocks. PNRP 450
analysis in 50 f
No Yes
Spain 2014 Colmenareña Filiation Test 413 analysis in 20 flocks No No Spain 2015 Colmenareña Filiation Test Filiation test: 1.136
analysis in 21 flocks. No No
Spain 2014 Lacaune Filiation Test, PNRP Filiation test: 7.080 analysis in 21 flocks.
PNRP: 3.600 analysis in 3
No Yes
Spain 2014 Latxa Filiation Test (20 markers), PNRP
Filiation test: 3.914 analysis in 64 flocks.
PNRP: 1103 analysis in 1
No Yes
Spain 2014 Manchega Filiation Test (19-21 markers), PNRP
Filiation test: 29.516 analysis in 117 flocks.
PNRP: 4067 analysis in
No Yes
Sheep survey (Years 2014 and 2015)

Page 98
Country Year Breed or
population Type of genotyping 1
Number of analysis, Number of flocks
involved
Use in experimental
program
Effective use in selection
program Notes Spain 2015 Manchega Filiation Test (19-21
markers), PNRP Filiation test: 33.342
analysis in 124 flocks. PNRP: 2.706 analysis in
No Yes
Spain 2015 Merina de Grazalema
Filiation Test (11 markers), PNRP
Filiation test: 770 analysis in 31 flocks. PNRP 31
analysis in 17 fl
No Only by culling vrq rams (PNRP),
filiation test Yes
Spain 2014 Merino de Grazalema
Filiation Test (11 markers), PNRP
Filiation test: 715 analysis in 22 flocks. PNRP: 46
analysis in 25 f
No Only by culling vrq rams (PNRP),
filiation test (Yes)
Spain 2014 Rubia de el Molar
Filiation Test 193 analysis in 8 flocks No Yes
Spain 2015 Rubia de El Molar
Filiation Test Filiation test: 61 analysis in 7 flocks.
No Yes
__________________ NOTE 1 Every kind of genotyping:
Filiation tests (precise number of markers), PrP genotyping, Protein (precise : αs1casein, β lactoglobulin ... ), Markers for QTL detection program, Markers for MAS, Other (precise).
Table 7 - Molecular information
Sheep survey (Years 2014 and 2015)

Page 99
Goat Survey (Years 2014 and 2015)

Page 100
Table 1A - Milk recording and management of the lactation
Country Year
Breed or population
(Name)
Number of flocks in
the population
Number of ewes in
the population
Number of flocks in milk
recording
Number of ewes in
milk recording1
Recorded flocks
milking after
suckling period2
If system
(2). average length of
the suckling period
(in days)
% of official
recorded flocks in machine milking
Number of flocks
in D recording
Number of ewes
in D recording
Canada 2014 All breeds 36 7.226 Croatia 2014 Alpine 300 15 61 3.544 2 27 Croatia 2015 Alpine 300 15.000 59 3.233 2 27 Croatia 2014 Saanen 50 3 13 480 2 45 Croatia 2015 Saanen 50 3.000 16 594 2 40 Czech Rep.
2014 All Breeds 4.466
Czech Rep.
2015 All Breeds 5.144
France 2014 Alpine 1.242 171.366 1.221 155.821 France 2015 Alpine 1.198 168.611 1.176 150.072 France 2014 Poitevine 34 607 29 509 France 2015 Poitevine 33 563 30 483 France 2014 Saanen 963 125.568 944 110.645 France 2015 Saanen 896 120.215 871 105.088 Italy 2014 Argentata
dell'Etna 33 1.120 2 40
Italy 2014 Aspromontana 130 13.018 2 40 Italy 2014 Camosciata
delle Alpi 268 11.486 2 40
Italy 2014 Garganica 54 2.000 2 40 Italy 2014 Maltese 37 1.618 2 40 Italy 2014 Messinese 41 3.750 2 40
GOAT SURVEY
Goat survey (Years 2014 and 2015)

Page 101
Table 1A - Milk recording and management of the lactation
Country Year
Breed or population
(Name)
Number of flocks in
the population
Number of ewes in
the population
Number of flocks in milk
recording
Number of ewes in
milk recording1
Recorded flocks
milking after
suckling period2
If system
(2). average length of
the suckling period
(in days)
% of official
recorded flocks in machine milking
Number of flocks
in D recording
Number of ewes
in D recording
Italy 2014 Murciana 12 1.596 2 40 Italy 2014 Nicastrese 27 1.901 2 40 Italy 2014 Saanen 225 12.023 2 40 Italy 2014 Sarda 131 13.590 2 40 Latvia 2014 All breeds 19 1.100 1 Serbia1 2014 Alpine 1.923 2.665 946 946 Intensive 45 100 946 946 Serbia1 2015 Alpine 2.554 3.378 1.409 1.409 Intensive 45 100 1.409 1.409 Serbia1 2014 Saanen 359 468 293 Intensive 0 100 293 293 Serbia1 2015 Saanen 246 442 203 Intensive 0 100 203 203 Slovak Republic
2015 Anglo Nubian 5 12 2 40 0
Slovak Rep 2015 Brown Shorthaired Goat
1 25 2 40 100
Slovak Rep 2015 Saanen 1 4 2 40 0
1 Data relating to the region AP Vojvodina in Serbia
Goat survey (Years 2014 and 2015)

Page 102
Table 1A - Milk recording and management of the lactation
Country Year
Breed or population
(Name)
Number of flocks in
the population
Number of ewes in
the population
Number of flocks in milk
recording
Number of ewes in
milk recording1
Recorded flocks
milking after
suckling period2
If system
(2). average length of
the suckling period
(in days)
% of official
recorded flocks in machine milking
Number of flocks
in D recording
Number of ewes
in D recording
Slovak Rep 2014 White Shorthaired Goat
6 456 2 40 57
Slovak Rep 2015 White Shorthaired Goat
5 493 2 40 60
Spain 2014 Cabra Malagueña
2.500 200.000 46 18.400 1) Milking
from kidding
(80%) 2) Milking
after suckling period (20%)
45 days 100 0 0
Spain 2014 Florida 69 24.249 1) Milking
from kidding
100
Spain 2015 Florida 42 12.758 1) Milking
from kidding
100
Goat survey (Years 2014 and 2015)

Page 103
Table 1A - Milk recording and management of the lactation
Country Year
Breed or population
(Name)
Number of flocks in
the population
Number of ewes in
the population
Number of flocks in milk
recording
Number of ewes in
milk recording1
Recorded flocks
milking after
suckling period2
If system
(2). average length of
the suckling period
(in days)
% of official
recorded flocks in machine milking
Number of flocks
in D recording
Number of ewes
in D recording
Spain 2014 Guadarrama 28 8.857 28 6.262 2) Milking after a
suckling period
30 100
Spain 2015 Guadarrama 28 9.186 28 5.573 2) Milking after a
suckling period
30 100
Spain 2014 Majorera 11 708 2) Milking
after suckling period
40
Spain 2015 Majorera 12 602 2) Milking after a
suckling period
40
Spain 2014 Murciano-Granadina
187 99.335 1) Milking
from kidding
100
Goat survey (Years 2014 and 2015)

Page 104
Table 1A - Milk recording and management of the lactation
Country Year
Breed or population
(Name)
Number of flocks in
the population
Number of ewes in
the population
Number of flocks in milk
recording
Number of ewes in
milk recording1
Recorded flocks
milking after
suckling period2
If system
(2). average length of
the suckling period
(in days)
% of official
recorded flocks in machine milking
Number of flocks
in D recording
Number of ewes
in D recording
Spain 2014 Payoya 40 9.000 17 4.993 2) Milking after a
suckling period
45 95
Spain 2015 Payoya 40 9.000 21 6.384 2) Milking after a
suckling period
45
Spain 2015 Verata 37 9.907 12 4.564 2) Milking after a
suckling period
38 100
Switzerland 2014 Anglo Nubian 280 120 1 + 2 75 Switzerland 2015 Anglo Nubian 55 280 25 120 1 + 2 75 Switzerland 2014 Appenzell 3.800 1.640 1 + 2 75 Switzerland 2015 Appenzell 310 2.960 135 1.270 1 + 2 75 Switzerland 2014 Grisons
striped 1.400 2.600 1 + 2 75
Switzerland 2015 Grisons striped
795 5.180 340 2.220 1 + 2 75
Goat survey (Years 2014 and 2015)

Page 105
Table 1A - Milk recording and management of the lactation
Country Year
Breed or population
(Name)
Number of flocks in
the population
Number of ewes in
the population
Number of flocks in milk
recording
Number of ewes in
milk recording1
Recorded flocks
milking after
suckling period2
If system
(2). average length of
the suckling period
(in days)
% of official
recorded flocks in machine milking
Number of flocks
in D recording
Number of ewes
in D recording
Switzerland 2014 Nera Verzasca
2.600 1.090 1 + 2 75
Switzerland 2015 Nera Verzasca
200 1.820 80 780 1 + 2 75
Switzerland 2014 Peacock 3.000 1.270 1 + 2 75 Switzerland 2015 Peacock 420 2.470 180 1.060 1 + 2 75 Switzerland 2014 Saanen 19.000 8.150 1 + 2 75 Switzerland 2015 Saanen 1.700 13.100 730 5.612 1 + 2 75 Switzerland 2014 Swiss Alpine 22.250 9.540 1 + 2 75 Switzerland 2015 Swiss Alpine 1.785 17.885 770 7.665 1 + 2 75 Switzerland 2014 Toggenbourg 10.100 4.320 1 + 2 75 Switzerland 2015 Toggenbourg 1.160 7.370 500 3.160 1 + 2 75
__________________ NOTE 1 Inventory at lambing in case of one lambing per year or inventory at a fixed date in the other cases 2 Answer (1) or (2), if only one system is used (per breed or in the country) as regards lactation ; or percentage of ewes in system (1) and system (2), if
used simultaneously.
Goat survey (Years 2014 and 2015)

Page 106
Table 1B - Methods of milk recording
Country Year Breed or
population (Name)
Percentage of A4, A5, A6, B4, B5, B6, C4, C5, C6 (precise
if necessary) 1
Percentage of AT , BT, CT (precise if
necessary) 1
Percentage of AC, BC, CC (precise if
necessary) 1
Percentage of E4, E5, E6, ET, EC
(precise if necessary) 1
Croatia 2014 Alpine B4=20% AT=80% Croatia 2015 Alpine B4=22% AT=78% Croatia 2014 Saanen AT=100% Croatia 2015 Saanen B4=36% AT=64% Czech Rep. 2014 All Breeds Czech Rep. 2015 All Breeds Italy 2014 Argentata dell'Etna AT 100% Italy 2014 Aspromontana AT 100% Italy 2014 Camosciata delle
Alpi AT 100%
Italy 2014 Garganica AT 100% Italy 2014 Maltese AT 100% Italy 2014 Messinese AT 100% Italy 2014 Murciana AT 100% Italy 2014 Nicastrese AT 100% Italy 2014 Saanen AT 100% Italy 2014 Sarda AT 100% Latvia 2014 All breeds 100 Serbia1 2014 Alpine AT4 Serbia1 2015 Alpine AT4 Serbia1 2014 Saanen AT4 Serbia1 2015 Saanen AT4 Slovak Rep. 2015 Anglo Nubian AC=100%
1 Data relating to the region AP Vojvodina in Serbia
Goat survey (Years 2014 and 2015)

Page 107
Table 1B - Methods of milk recording
Country Year Breed or
population (Name)
Percentage of A4, A5, A6, B4, B5, B6, C4, C5, C6 (precise
if necessary) 1
Percentage of AT , BT, CT (precise if
necessary) 1
Percentage of AC, BC, CC (precise if
necessary) 1
Percentage of E4, E5, E6, ET, EC
(precise if necessary) 1
Slovak Rep. 2015 Brown Shorthaired Goat
AC=100%
Slovak Rep. 2015 Saanen AC=100% Slovak Rep. 2014 White Shorthaired
Goat AC=100%
Slovak Rep. 2015 White Shorthaired Goat
AC=100%
Spain 2014 Cabra Malagueña A4- 50%, A6- 50% Spain 2014 Florida A4= 72,5 %. A6=
27,5 %. AT=85%
Spain 2015 Florida A4 (7,14%), A6 (7,14%)
AT4=61,9% AT6=23,81%
Spain 2014 Guadarrama A6= 90 % AT6=10% Spain 2015 Guadarrama A6= 90 % AT6=10% Spain 2014 Majorera A6= 100% Spain 2015 Majorera A6= 100% Spain 2014 Murciano-
Granadina A4= 63 %. A6=
37 %
Spain 2014 Payoya A4= 42 %, A6= 31 %.
AT4=26%, AT6=1%
Spain 2015 Payoya A4= 63 %. A6= 37 %.
AT6=37%
Spain 2015 Verata 20% 80% Switzerland 2014 Anglo Nubian A4 AT Switzerland 2015 Anglo Nubian A4 AT Switzerland 2014 Appenzell A4 AT Switzerland 2015 Appenzell A4 AT
Goat survey (Years 2014 and 2015)

Page 108
Table 1B - Methods of milk recording
Country Year Breed or
population (Name)
Percentage of A4, A5, A6, B4, B5, B6, C4, C5, C6 (precise
if necessary) 1
Percentage of AT , BT, CT (precise if
necessary) 1
Percentage of AC, BC, CC (precise if
necessary) 1
Percentage of E4, E5, E6, ET, EC
(precise if necessary) 1
Switzerland 2014 Grisons striped A4 AT Switzerland 2015 Grisons striped A4 AT Switzerland 2014 Nera Verzasca A4 AT Switzerland 2015 Nera Verzasca A4 AT Switzerland 2014 Peacock A4 AT Switzerland 2015 Peacock A4 AT Switzerland 2014 Saanen A4 AT Switzerland 2015 Saanen A4 AT Switzerland 2014 Swiss Alpine A4 AT Switzerland 2015 Swiss Alpine A4 AT Switzerland 2014 Toggenbourg A4 AT Switzerland 2015 Toggenbourg A4 AT
__________________ NOTE 1 See the definition of official milk recording method on the ICAR website (www.icar.org) in the part dedicated to the milk recording of sheep WG :
“Recording guidelines”, Section 2.2
Goat survey (Years 2014 and 2015)

Page 109
Table 2A - Type of lactation calculation for milk yield
Country Year Breed or population
(Name) TSMM2 TMM3 TMY4 TSMM1 TMM2 TMY3 Croatia 2014 Alpine Yes Yes No No No No
Croatia 2015 Alpine Yes Yes No No No No
Croatia 2014 Saanen Yes Yes No No No No
Croatia 2015 Saanen Yes Yes No No No No
Czech Rep. 2014 All Breeds
Czech Rep. 2015 All Breeds
France 2014 Alpine No No Yes No
France 2015 Alpine No No Yes No
France 2014 Poitevine No No Yes No
France 2015 Poitevine No No Yes No
France 2014 Saanen No No Yes No
France 2015 Saanen No No Yes No
Italy 2014 Aspromontana Yes Yes No Yes Yes No
Italy 2014 Camosciata delle Alpi Yes Yes No Yes Yes No
Italy 2014 Garganica Yes Yes No Yes Yes No
Italy 2014 Maltese Yes Yes No Yes Yes No
Italy 2014 Messinese Yes Yes No Yes Yes No
Italy 2014 Messinese Yes Yes No Yes Yes No
Italy 2014 Murciana Yes Yes No Yes Yes No
Italy 2014 Saanen Yes Yes No Yes Yes No
Italy 2014 Sarda Yes Yes No Yes Yes No
Goat survey (Years 2014 and 2015)

Page 110
Table 2A - Type of lactation calculation for milk yield
Country Year Breed or population
(Name) TSMM2 TMM3 TMY4 TSMM1 TMM2 TMY3 Latvia 2014 All breeds No No Yes Yes. 305
Serbia1 2014 Alpine Yes Yes Yes Yes 216 261
Serbia1 2015 Alpine Yes Yes Yes Yes 216 216
Serbia1 2015 Saanen Yes No Yes 286 286
Serbia1 2015 Saanen Yes No Yes 277 277
Slovak Rep. 2015 Anglo Nubian No Yes No No Yes. 240
Slovak Rep. 2015 Brown Shorthaired Goat No Yes No No Yes. 240
Slovak Rep. 2015 Saanen No Yes No No Yes. 240
Slovak Rep. 2014 White Shorthaired Goat No Yes No No Yes. 240
Slovak Rep. 2015 White Shorthaired Goat No Yes No No Yes. 240
Spain 2014 Cabra Malagueña No Yes Yes No Yes Yes
Spain 2014 Florida No No Yes No No Yes
Spain 2015 Florida No No Yes
Spain 2014 Guadarrama No Yes No No Yes. 210 d No
Spain 2015 Guadarrama No Yes No No Yes. 210 d
Spain 2014 Majorera Yes No No Yes. 210 Days
No No
Spain 2015 Majorera Yes No No Yes. 210 Days
No No
1 Data relating to the region AP Vojvodina in Serbia
Goat survey (Years 2014 and 2015)

Page 111
Table 2A - Type of lactation calculation for milk yield
Country Year Breed or population
(Name) TSMM2 TMM3 TMY4 TSMM1 TMM2 TMY3 Spain 2014 Murciano-Granadina No No Yes No No 1st calve=
150 days. 2nd or more calves= 210 or 240 days
Spain 2014 Payoya No Yes No No Yes. Yearlings: 150 days.
Adults: 210 days.
No
Spain 2015 Payoya No Yes No No Yes. 150 Days
(yearlings), 210 Days (Adults)
No
Spain 2015 Verata Yes No No Yes No No
Switzerland 2014 Anglo Nubian No No Yes 220 days
Switzerland 2015 Anglo Nubian No No Yes 220 days
Switzerland 2014 Appenzell No No Yes 220 days
Switzerland 2015 Appenzell No No Yes 220 days
Switzerland 2014 Grisons striped No No Yes 180 days
Switzerland 2015 Grisons striped No No Yes 180 days
Switzerland 2014 Nera Verzasca No No Yes 120 days
Switzerland 2015 Nera Verzasca No No Yes 120 days
Goat survey (Years 2014 and 2015)

Page 112
Table 2A - Type of lactation calculation for milk yield
Country Year Breed or population
(Name) TSMM2 TMM3 TMY4 TSMM1 TMM2 TMY3 Switzerland 2014 Peacock No No Yes 180 days
Switzerland 2015 Peacock No No Yes 180 days
Switzerland 2014 Saanen No No Yes 220 days
Switzerland 2015 Saanen No No Yes 220 days
Switzerland 2014 Swiss Alpine No No Yes 220 days
Switzerland 2015 Swiss Alpine No No Yes 220 days
Switzerland 2014 Toggenbourg No No Yes 220 days
Switzerland 2015 Toggenbourg No No Yes 220 days
__________________ NOTE
1 See the definition of the terms on the ICAR website (www.icar.org) in the part dedicated to the milk recording of sheep WG : “Recording guidelines”, Section 2.2.
2 TSMM: total suckled and milked milk (case of milking after a suckling period). 3 TMM: total milked milk (case of milking after a suckling period). 4 TMY: total milk yield (case of milking from lambing, i.e. without a suckling period).
Goat survey (Years 2014 and 2015)

Page 113
Table 2B - Milk yield results
Country Year Breed or
population (Name) Yearlings 1 Adults 2 All ewes Notes Croatia 2014 Alpine 460 578 554 Croatia 2014 Saanen 472 564 545 Czech Rep. 2014 All Breeds 746 Czech Rep. 2015 All Breeds 844 France 2014 Alpine 816 kg (302 days) 926 kg (290 days) 891 kg (294 days) Units expressed in kg
France 2015 Alpine 828 (303 days) 949 (293 days) 909 (296 days) Units expressed in kg
France 2014 Poitevine 397 kg (255 days) 557 kg (259 days) 520 kg (258 days) Units expressed in Kg
France 2015 Poitevine 419 (261 days) 552 (258 days) 520 (259 days) Units expressed in kg
France 2014 Saanen 947 kg (327 days) 945 kg (296 days) 945 kg (306 days) Units expressed in Kg
France 2015 Saanen 958 (331 days) 953 (297 days) 954 (308 days) Units expressed in kg
Italy 2014 Argentata dell'Etna 117 178 174 Italy 2014 Aspromontana 177 192 191 Italy 2014 Camosciata delle
Alpi 338 549 508
Italy 2014 Garganica 108 157 156 Italy 2014 Maltese 202 326 309 Italy 2014 Messinese 133 188 187 Italy 2014 Murciana 302 404 383 Italy 2014 Nicastrese 134 121 122 Italy 2014 Saanen 381 562 522 Italy 2014 Sarda 175 209 206 Serbia1 2014 Alpine 742 1.923 2.665 Serbia1 2015 Alpine 824 2.554 3.378 Serbia1 2014 Saanen 109 359 468 Serbia1 2015 Saanen 196 246 442
1 Data relating to the region AP Vojvodina in Serbia
Goat survey (Years 2014 and 2015)

Page 114
Table 2B - Milk yield results
Country Year Breed or
population (Name) Yearlings 1 Adults 2 All ewes Notes Slovak Rep.
2015 Anglo Nubian 876
Slovak Rep.
2015 Brown Shorthaired Goat
698
Slovak Republic
2015 Saanen 601
Slovak Republic
2014 White Shorthaired Goat
530
Slovak Republic
2015 White Shorthaired Goat
517
Spain 2014 Cabra Malagueña 360 510 480 Units expressed in kg
Spain 2014 Florida 444 654 586 Spain 2015 Florida 495 682 614 Spain 2014 Guadarrama 357 400 378 Spain 2015 Guadarrama 303 484 393 Spain 2014 Majorera 270 436 353 Spain 2015 Majorera 271 441 356 Spain 2014 Murciano-Granadina 274 484 416 Units expressed in kg
Spain 2014 Payoya 303 kg (258 days) 431 kg (284 days) 367 Units expressed in kg
Spain 2015 Payoya 274 (236 days) 452 (278 days) 405 (267 days) Spain 2015 Verata 126 205 168,86 Switzerland 2014 Anglo Nubian 345 kg (250 days) 509 kg (243 days) 479 kg (246 days) Switzerland 2015 Anglo Nubian 367 kg (262 days) 476 kg (265 days) 469 kg (264 days) Switzerland 2014 Appenzell 488 kg (255 days) 742 kg (274 days) 695 kg (268 days) Switzerland 2015 Appenzell 476 kg (267 days) 735 kg (284 days) 692 kg (278 days) Switzerland 2014 Grisons striped 379 kg (234 days) 578 kg (245 days) 546 kg (242 days) Switzerland 2015 Grisons striped 387 kg (247 days) 557 kg (254 days) 527 kg (252 days) Switzerland 2014 Nera Verzasca 336 kg (214 days) 382 kg (178 days) 381 kg (190 days) Switzerland 2015 Nera Verzasca 317 kg (219 days) 396 kg (188 days) 393 kg (198 days)
Goat survey (Years 2014 and 2015)

Page 115
Table 2B - Milk yield results
Country Year Breed or
population (Name) Yearlings 1 Adults 2 All ewes Notes Switzerland 2014 Peacock 362 kg (239 days) 536 kg (242 days) 510 kg (241 days) Switzerland 2015 Peacock 345 kg (231 days) 497 kg (236 days) 475 kg (235 days) Switzerland 2014 Saanen 616 kg (268 days) 851 kg (278 days) 799 kg (275 days) Switzerland 2015 Saanen 610 kg (275 days) 855 kg (283 days) 803 kg (281 days) Switzerland 2014 Swiss Alpine 556 kg (262 days) 785 kg (273 days) 742 kg (269 days) Switzerland 2015 Swiss Alpine 561 kg (269 days) 759 kg (276 days) 719 kg (274 days) Switzerland 2014 Toggenbourg 552 kg (270 days) 758 kg (278 days) 710 kg (275 days) Switzerland 2015 Toggenbourg 521 kg (265 days) 757 kg (281 days) 704 kg (275 days)
__________________ NOTE 1 Yearling : 12-18 month-old 2 Adults : >18 month-old
Goat survey (Years 2014 and 2015)

Page 116
Table 3 - Optional tests for milk composition
Country Year
Breed or population
(Name)
Categories or classes of age
or parity concerned
Method used for recording milk composition 1 Fat Protein SCC Other Analysis
Croatia 2014 Alpine 3.544 AT, A4 Yes Yes Yes Lactose Croatia 2015 Alpine 3.233 AT, B4 Yes Yes Yes Lactose Croatia 2014 Saanen 480 AT Yes Yes Yes Lactose Croatia 2015 Saanen 480 AT,B4 Yes Yes Yes Lactose Czech Rep. 2014 All Breeds Yes Yes Yes Czech Rep. 2015 All Breeds Yes Yes Yes France 2014 All breeds All MIR Yes Yes France 2015 All breeds All MIR Yes Yes Yes Italy 2014 Camosciata
delle Alpi All (8.956 lactations)
AT Yes 3.53 Yes 3.37
Italy 2014 Maltese Primiparous (124)
AT Yes 3.88 Yes 3.52
Italy 2014 Saanen All goats (9.047 lactations)
AT Yes 3.38 Yes 3.30
Latvia 2014 All breeds A4 Yes Yes Serbia 2014 Alpine 1923 FTIR FTIR FTIR Flow
citometry No
Serbia 2015 Alpine 2554 FTIR FTIR FTIR Flow citometry
Serbia 2014 Saanen FTIR FTIR FTIR Flow citometry
No
Serbia 2015 Saanen 246 FTIR FTIR FTIR Flow citometry
Slovak Rep.
2015 Anglo Nubian Parity 1 to 3, (12 goats)
AC Yes Yes Lactose
Goat survey (Years 2014 and 2015)

Page 117
Table 3 - Optional tests for milk composition
Country Year
Breed or population
(Name)
Categories or classes of age
or parity concerned
Method used for recording milk composition 1 Fat Protein SCC Other Analysis
Slovak Rep.
2015 Brown Shorthaired Goat
Parity 1 to 3, (25 goats)
AC Yes Yes Lactose
Slovak Rep.
2015 Saanen Parity 1 to 3, (4 goats)
AC Yes Yes Lactose
Slovak Rep.
2014 White Shorthaired Goat
Parity 1 to 3, (456 goats)
AC Yes Yes Lactose
Slovak Rep.
2015 White Shorthaired Goat
Parity 1 to 3, (493 goats)
AC Yes Yes Lactose
Spain 2014 Cabra Malagueña
A4, A6, AT Yes, 4,57 %
Yes, 3,6%
Yes, 1.167.890 cells
Spain 2014 Florida A4, A6 AT Yes, 4,9 %
Yes, 3,4%
Yes Dry matter
Spain 2015 Florida A4, A6, AT4, AT6 Yes 4,9%
Yes 3,4%
Yes Dry matter
Spain 2014 Guadarrama A6, AT6 Yes. 4,6 %
Yes. 3,5%
Yes Dry matter, lactose
Spain 2015 Guadarrama A6, AT6 Yes. 4,6 %
Yes. 3,5%
Yes Dry matter, lactose
Spain 2014 Majorera A6 Yes. 4,7 %
Yes. 4,12%
No Dry matter
Spain 2015 Majorera A6 Yes. 4,77 %
Yes. 4,12%
No Dry matter, lactose
Goat survey (Years 2014 and 2015)

Page 118
Table 3 - Optional tests for milk composition
Country Year
Breed or population
(Name)
Categories or classes of age
or parity concerned
Method used for recording milk composition 1 Fat Protein SCC Other Analysis
Spain 2014 Murciano-Granadina
A4, A6. Yes, 5,21 %
Yes, 3,58%
Yes. 954.000 cells/m
Lactose, Dry matter
Spain 2014 Payoya A4, A6. Yes, 4,8 %
Yes, 3,7%
Yes, 1.335.000 cells
Lactose, Dry matter
Spain 2015 Payoya A4, A6 Yes. 4,2%
Yes. 3,5%
Yes Dry matter, lactose
Spain 2015 Verata A, AT Yes Yes Yes Lactose Switzerland 2014 All breeds A4, AT4 Yes Yes Yes Switzerland 2015 All breeds A4, AT4 Yes Yes Yes
__________________ NOTE 1 A4, A5, A6, AT, AC , E4, EC, ET (see appendix A of the ICAR regulations for milk recording in sheep). If other method used, please describe it.
Goat survey (Years 2014 and 2015)

Page 119
Table 4 - Recording of non-milking traits
Reproductive traits, weights and growths, udder score, longevity
Country Year Breed or population Traits On-farm
recording Breeding evaluation Croatia 2014 Alpine Reproductive traits and birth weight Yes No Croatia 2015 Alpine Reproductive traits and birth weight Yes No Croatia 2014 Saanen Reproductive traits and birth weight Yes No Croatia 2015 Saanen Reproductive traits and birth weight Yes No Czech Rep. 2014 All Breeds Weight, reproductive traits Yes Czech Rep. 2015 All Breeds Weight, reproductive traits Yes Italy 2014 Camosciata delle Alpi,
Saanen Linear evaluation Yes Yes
Latvia 2014 All breeds Udder score Yes Serbia 2015 Alpine Fertility, birth weight, body weight Farm recording Yes Serbia 2015 Saanen Fertility, birth weight, body weight Farm recording Yes Serbia1 2014 Alpine Fertility, birth weight, body weight Farm recording Yes Serbia1 2014 Saanen Fertility, birth weight, body weight Farm recording Yes Slovak Republic
2015 Anglo Nubian Reproductive traits, weight Yes No
Slovak Republic
2015 Brown Shorthaired Goat Reproductive traits, weight Yes No
Slovak Republic
2015 Saanen Reproductive traits, weight Yes No
Slovak Republic
2014 White Shorthaired Goat Reproductive traits, weight Yes No
Slovak Republic
2015 White Shorthaired Goat Reproductive traits, weight Yes No
1 Data relating to the region AP Vojvodina in Serbia
Goat survey (Years 2014 and 2015)

Page 120
Table 4 - Recording of non-milking traits
Reproductive traits, weights and growths, udder score, longevity
Country Year Breed or population Traits On-farm
recording Breeding evaluation Spain 2014 Cabra Malagueña Weights and growths, udder score,
mobility Yes No
Spain 2014 Florida Weights and growths, udder score, reproductive traits, longevity
Yes (Reproductive and udder score
trait
Yes (Udder score)
Spain 2014 Florida Weights and growths, udder score, reproductive traits, longevity
Yes (Reproductive traits)
No
Spain 2015 Florida Reproductive traits, udder score, Weights and growths, longevity
Yes (Reproductive traits and udder
scor
Yes (udder score)
Spain 2014 Guadarrama Reproductive traits, udder score, Weights and growths, longevity
Yes (Reproductive traits)
No
Spain 2015 Guadarrama Reproductive traits, udder score, Weights and growths, longevity
Yes (Reproductive traits)
No
Spain 2014 Majorera Weights and growths, udder score, reproductive traits, longevity
No No
Spain 2015 Majorera Reproductive traits, udder score, Weights and growths, longevity
No No
Spain 2014 Murciano-Granadina Weights and growths, udder score, mobility
Yes Yes
Spain 2014 Payoya Reproductive and udder score traits, longevity
Yes Yes (Reproductive traits)
Spain 2015 Payoya Reproductive and udder score traits, longevity
Spain 2015 Verata Reproductive and udder score traits, weights and growths
Yes Yes
Goat survey (Years 2014 and 2015)
Page 121
Reproductive traits, weights and growths, udder score, longevity
Country Year Breed or population Traits On-farm
recording Breeding evaluation Switzerland 2014 All breeds Reproduction, udder, longevity Yes Yes Switzerland 2015 All breeds reproduction, udder, longevity Yes Yes
Table 4 - Recording of non-milking traits
Goat survey (Years 2014 and 2015)

Page 122
Table 5 - Milk recording equipment used in case of machine milking
Country Year Breed or population
(name) Indicate jars/meter Name of the
manufacturer Measurement
(weight/volume) Approximate
number in use Croatia 2014 Alpine Jars Cartel Germany Volume, Sampler 45 Croatia 2015 Alpine Jars Cartel Germany Volume, Sampler 45 Croatia 2014 Saanen Jars Cartel Germany Volume, Sampler 11 Croatia 2015 Saanen Jars Cartel Germany Volume, Sampler 11 Czech Rep.
2015 All Breeds TruTest Tru-test mini
Serbia1 2014 Alpine Manual and automatic DeLaval, GEA DeLaval, GEA 5 Serbia1 2015 Alpine Manual and automatic DeLaval, GEA DeLaval, GEA 6 Serbia1 2014 Saanen Automatic DeLaval DeLaval 1 Serbia1 2015 Saanen Automatic DeLaval DeLaval 1 Slovak Rep.
2014 All Breeds Fisher Slovakia Volume, Sampler no,
3
Trutest Weight, Sampler No 20
Slovak Rep.
2015 All Breeds Fisher Slovakia - Volume
Trutest Weight, Sampler no 20
Spain 2014 Cabra Malagueña Meter Trutest Weights 30 Spain 2014 Florida Meter True-test Weight 18 Spain 2015 Florida Meters Tru-Test Weight 18 Spain 2014 Guadarrama Meters Alfa Laval/Schneder Weight/volume 24 Spain 2015 Guadarrama Meters Alfa Laval/Schneder Weight/volume 24 Spain 2015 Majorera Spain 2014 Murciano-Granadina Meter De Laval, Westfalia,
Manovac, Flaco Weight and volume 370
Spain 2014 Payoya Spain 2015 Payoya Spain 2015 Verata Meters Tru-Test 96
1 Data relating to the region AP Vojvodina in Serbia
Goat survey (Years 2014 and 2015)

Page 123
Table 6 - Breeding programme using artificial insemination
Progeny test
Country Year Breed or
population Fresh semen Frozen semen Selection
criteria
AI progeny-tested rams per
year
Number of AI per progeny-tested rams
Croatia 2015 Alpine Yes Yes Croatia 2014 Alpine Yes Yes Croatia 2014 Saanen Yes Yes Croatia 2015 Saanen Yes Yes Serbia 2014 Alpine Spain 2014 Cabra
Malagueña 2.713 Genetic value
and Milk composition
10 200-250
Spain 2014 Florida 1.480 50 Genetic value and morphology
of goats
4 150-200
Spain 2015 Florida 1.464 75 Milk production and morphology
of goats
4 250
Spain 2014 Guadarrama Yes No Milk production 2 150 Spain 2015 Guadarrama Yes No Milk production 2 122 Spain 2014 Majorera No No Spain 2015 Majorera Spain 2014 Murciano-
Granadina 4.601 1446 Milk production 25 200
Spain 2014 Payoya 0 279 Milk production 3 males each 2 years
200
Spain 2015 Payoya 390 Milk production 3 males each 2 years
200
Spain 2015 Verata
Goat survey (Years 2014 and 2015)

Page 124
Table 7 - Molecular information
Country Year Breed or
population Type of genotyping a Number of analysis,
Number of flocks involved Use in experimental
program Effective use in
selection program Croatia1 2015 All breeds Croatia1 2014 All breeds
Italy 2015 EMIDA 900 analysis Yes
Spain 2014 Cabra Malagueña Filiation Tests (19 markers) 1.500 analysis in 22 flocks No Yes
Spain 2014 Florida Filiation Test 2.806 analysis in 40 flocks No Yes Spain 2015 Florida Filiation Test 2.574 analysis in 41 flocks No Yes Spain 2014 Guadarrama Filiation Test 985 Analysis in 28 flocks No Yes Spain 2015 Guadarrama Filiation test 671 analisys in 28 flocks No Yes Spain 2014 Majorera Casein 45 analisys Yes No Spain 2015 Majorera Casein 45 analisys Yes No
Spain 2014 Murciano-Granadina Filiation tests (23 markers) 9.440 analysis in 98 flocks No Yes
Spain 2014 Payoya Filiation Test (19 markers) 1.307 analysis in 21 flocks Yes Yes Spain 2015 Payoya Filiation Test (19 markers) 1.046 analysis in 21 flocks Yes Yes Spain 2015 Verata Filiation Test 300 analysis Yes
__________________ NOTE a Every kind of genotyping: Filiation tests (precise number of markers), PrP genotyping, Protein (precise : αs1casein, β lactoglobulin ... ), Markers for QTL detection program, Markers for MAS, Other (precise).
1 No data available
Goat survey (Years 2014 and 2015)

Page 125
ICAR Member Organisations participating in the survey
AustraliaDaniel AbernethyAustralian Dairy Herd Improvement SchemeEmail: [email protected]
AustriaFranz SturmlechnerZentrale Arbeitsgemeinschaft Österreichischer Rinderzüchter (ZAR)Email: [email protected]; [email protected]
Belgium (Wallonie)Jean-François DuckertsService Public de Wallonie (SPW) Direction Générale Agriculture, Ressources naturelles et Environnement (DGARNE) Département du Développement Direction de la QualitéEmail: [email protected]
CanadaNeil PetrenyCanadian DHI, c/o Ontario DHIEmail: [email protected]
ChileJorge LamaCOOPRINSEMEmail: [email protected]
ChinaAn PengpengShanghai Dairy Cattle Breeding Center Co., LtdEmail: [email protected]
ChinaJianbin LiDairy Cattle Research Centre of Shandong Academy of Agricultural SciencesEmail: [email protected]
CroatiaZdravko BaracCroatian Agricultural AgencyEmail: [email protected]; [email protected]
Czech RepublicPavel BucekCzech Moravian Breeder’s Corporation Inc. Email: [email protected]
EstoniaKaivo IlvesEesti Pollumajandusloomade Joudluskontrolli ASEmail: [email protected]
FinlandJuho KyntäjäProAgria GroupEmail: [email protected]
FranceLaurent JournauxFrance Genétique ElevageEmail: [email protected]
The following are the contacts of the ICAR Member Organisations who participated in the surveys and that are responsible for the submission of the data.
Their collaboration is acknowledged and much appreciated

Page 126
GermanyBianca LindArbeitsgemeinschaft Deutscher Rinderzüchter e.V. (ADR)Email: [email protected]
HungaryJulianna Kóti SeengerLivestock Performance Testing Ltd. Hungary, LPT, PF.:258Email: [email protected]
HungaryCsaba NémethNational Food Chain Safety Office (Nemzeti Élelmiszerlánc-biztonsági Hivatal, NÉBIH)Email: [email protected]
IrelandBrian CoughlanIrish Cattle Breeding Federation Society LimitedEmail: [email protected]
IsraelEphraim EzraIsrael Cattle Breeders’ Association (ICBA)Email: [email protected]
Italy Mauro Fioretti Italians’ Breeders Association (AIA) Email: [email protected]
LatviaIvans VorslovsState agency Agricultural data centre (LDC)Email: [email protected]
LithuaniaVilius RekštysState Animal Breeding Supervision Service, Ministry of AgricultureEmail: [email protected]
MoroccoMohamed El KharroussiAssociation Nationale des Eleveurs de Bovins (ANEB)Email: [email protected]
New ZealandTim MackleDairyNZEmail: [email protected]
New ZealandAndrew FearLivestock Improvement CorporationEmail: [email protected]
NorwayTone RoalkvamTINE SAEmail: [email protected]
PolandDanuta RadzioPolish Federation of Cattle Breeders and Dairy FarmersEmail: [email protected]
SerbiaMile pecinarUniversity of Novi Sad, Agricultural Faculty, Dept. of Animal ScinceEmail: [email protected]

Page 127
Slovak RepublicMartina LacováThe Breeding Services of the Slovak RepublicEmail: [email protected]
SloveniaMarija KlopcicUniversity of Ljublijana, Biotechnical Faculty, Dept. of Animal Science, Chair of Biometry and Data ProcessingEmail: [email protected]
South AfricaNorman MaiwasheARC (Agricultural Research Council), Centre for Animal Breeding and Genetics, Animal Improvement InstituteEmail: [email protected]
South KoreaYoung Jun SongKorea Animal Improvement AssociationEmail: [email protected]
South KoreaIn-Geun ChaDairy Cattle Improvement CentreEmail: [email protected]
SpainJosé Luis Urquijo y NarváezFEAGAS (Federación Española de Asociaciones de Ganado Selecto)Email: [email protected]
SwedenNils-Erik LarssonVäxa SverigeEmail: [email protected]
SwitzerlandDirector of ASRASR Arbeitsgemeinschaft Schweizerischer RinderzüchterEmail: [email protected]
TaiwanYu-Shin ChengLivestock Research InstituteEmail: [email protected]
The NetherlandsLouwrens van KeulenCRVEmail: [email protected]
TunisiaDirecteur GénéralMinistère de l’Agriculture, Office de l’Elevage et des Pâturages (OEP)Email: [email protected]
TurkeyHüseyin VelioğluCattle breeders’ association of TurkeyEmail: [email protected]
United KingdomSue CopeCattle Information ServiceEmail: [email protected]

Page 128
United KingdomTony CravenNational Milk Records plcEmail: [email protected]
United KingdomSuzanne HardingHolstein UKEmail: [email protected]
United KingdomRoyal Jersey Agricultural and Horticultural Society-Royal Jersey Showground Milk RecordsEmail: [email protected]
UruguayFernando SoteloInstituto Nacional para el Mejoramiento LecheroEmail: [email protected]
USALeslie ThomanNational Dairy Herd Improvement Association (NDHIA)Email: [email protected]

Page 129

Page 130