YEAR IV VOLUME IV .Jamshedpur Research Review. ISSUE XVII...
150
Transcript of YEAR IV VOLUME IV .Jamshedpur Research Review. ISSUE XVII...

YEAR IV VOLUME IV .Jamshedpur Research Review. ISSUE XVII ISSN-2320-2750
JRR September –November 2016 1
YEAR IV VOLUME IV .Jamshedpur Research Review. ISSUE XVII ISSN-2320-2750
JRR September –November 2016 2
YEAR IV VOLUME IV .Jamshedpur Research Review. ISSUE XVII ISSN-2320-2750
JRR September –November 2016 3
YEAR IV VOLUME IV .Jamshedpur Research Review. ISSUE XVII ISSN-2320-2750
JRR September –November 2016 4
YEAR IV VOLUME IV .Jamshedpur Research Review. ISSUE XVII ISSN-2320-2750
JRR September –November 2016 5
Date: 05-9-2016
YEAR IV VOLUME IV .Jamshedpur Research Review. ISSUE XVII ISSN-2320-2750
JRR September –November 2016 6
GUEST EDITIR
Dr. R.P.P Singh
Vice Chancellor, Kolhan University
Chaibasa, West Singhbhum
Jharkhand
EDITOR –IN –CHIEF
Dr. Mithilesh Kr Choubey
MEMBERS OF EDITORIAL BOARD
Dr. P.Venugopal
Senior Professor, XLRI, Jamshedpur
Dr. A.N Misra
Principal, MGM Medical College, Jamshedpur
Dr. Neha Tiwari
Prof –in-Charge, Dept of Mass Communication &
video Production, Karim City College, Jamshedpur,
Jharkhand
Dr. Vijay Bahadur Singh
Dept. of Commerce, Ranchi University, Ranchi,
Jharkhand
NATIONAL AND INTERNATIONAL
REFEREE
Dr. S.K Sinha
Dept Of English, Jamshedpur Women‘s College,
Jamshedpur
Dr. Vijay Kumar ‘Piyus’
Dept Of Hindi, Jamshedpur Co-operative College,
Jamshedpur
Dr. Raksha Singh
Principal, Sri Sankaracharya Mahavidhyalya, Bhilai,
Chattisgarh
COPY EDITOR
Dr. Sanjive Kumar Singh Dept of Commerce, Jamshedpur Co-operative
College, Jamshepur
GRAPHICS AND CREATIVE ART EDITOR
Mr. Krishna Kumar Choubey
Director, Swastik Infotech, Jamshedpur
Dr. P.K Pani
Examination Controller
Kolhan University, Jamshedpur, Jharkhand
Dr. Sanjiv Chaturvedi
Dept of Commerce, Doranda College Ranchi, Jharkhand
Prof. Sudeep Kumar
Xavior institute of Social Science (XISS), Ranchi,
Jharkhand
Dr. Swati Chakraborty
Royal Thimphu College, Bhutan
Dr. Prakash Chand
Dept of Political Science, Dayal Singh (Ev) College,
Delhi University
Dr. Kh.Tomba Singh
Professor, Department of Commerce, Manipur University
Dr. Danish Ali Khan
Associate Professor, NIT, Jamshedpur, Jharkhand
Dr Abhay Kr Pandey
D.K College, Dumraon, Buxar, Bihar
Dr. S.B Singh
Dept. of preventive and social medicine, Rajendra
Institute of Medical, Sciences (RIMS), Ranchi, Jharkhand
Dr. K.M Mahato
Dept. of Commerce
Jamshedpur Co-operative College, Kolhan University,
Jamshedpur. Jharkhand
Dept of Commerce, Jamshedpur Women‘s College,
Jamshedpur, Jharkhand
Dara Singh Gupta
Dept of Botany, Jamshedpur Co-Operative College
Jamshedpur
*******
YEAR IV VOLUME IV .Jamshedpur Research Review. ISSUE XVII ISSN-2320-2750
JRR September –November 2016 7
JAMSHEDPUR
RESEARCH
REVIEW
ISSN: 2320: 2750
S. No Title Page
Nos
1. WOMEN EMPOWERMENT IN RURAL PALAMU: AN EMPIRICAL ANALYSIS
Anita Sinha, Head, Political Science Department, Janta Shivratri College, Daltonganj,
Palamu, Jharkhand
8-16
2. TRAUMA AND EGO STRENGTH AMONG TRIBAL TRAFFICKED GIRLS AND WOMEN
Dr.Mritunjay Kumar, P.G. Department of Psychology, J.S.College, N.P.University,
Jharkhand
17-24
3. EMPOWERING WOMEN THROUGH SELF HELP GROUPS: ISSUES & CHALLENGES
Dr. Raksha Singh, Principal, Shri Shankaracharya Mahavidyalaya, Bhilai, Chhattisgarh
Mrs. Rashmi Dewangan, Asst Professor, Dept Of Management, Shri Shankaracharya
Mahavidyalaya, Bhilai, Chhattisgarh
25-32
4. RECENT SCENARIO OF ECONOMIC JUSTICE IN THE INDIAN SOCIETY : A CRITICAL ANALYSIS
Dr. Jayanta Kumar Dab, Assistant Professor of political Science, Tamralipta
Mahavidyalaya, West Bengal
33-41
5. IMPACT OF INDUSTRIALIZATION OF WEST SINGHBHUM DISTRICT OF JHARKHAND: AN
EMPIRICAL INVESTIGATION
Gauri Shankar, Research Scholar, Dept of Commerce, Kolhan University, Jharkhand
Dr. Sanjive Kumar Singh, Asst. Professor, Dept of Commerce, Jamshedpur Co-operative
College, Jamshedpur, Jharkhand
42-49
6. CUSTOMERS PERCEPTION TOWARDS THE USE OF E-BANKING SYSTEM IN WEST SHEWA ZONE: AMBO TOWN
Olyad Leta Dano & Ayana Gemechu Bultum, Ambo University, College of Business and Economics, Department of Accounting& Finance, Ethiopia
50-61
7. INTERNET BANKING IN JAMSHEDPUR -A STUDY OF PUBLIC AND PRIVATE SECTOR BANKS IN
JAMSHEDPUR
Mitu Ahuja, Research Scholar, Dept of Commerce, Kolhan University
Dr. Sanjive Kumar Singh, Asst. Professor, Dept of Commerce, Jamshedpur Co-operative
College, Jamshedpur, Jharkhand
62-68
8. CHANGING PATTERN OF BANK DEPOSITS IN BIHAR
Haridwar Yadav, Assistant Adviser, Department of Statistics and Information Management,
Reserve Bank of India, Regional Office, Patna, Bihar
Rahul Kishore, Assistant, Department of Statistics and Information Management, Reserve Bank
of India, Regional Office, Patna, Bihar
69-79
9. CUSTOMER PERSPECTIVE OF SERVICE QUALITY GAP ANALYSIS IN PUBLIC SECTOR BANKS
Bharat Chandra Malik, Ph.D. Scholar, Department of Business Administration,
Utkal University, Bhubaneswar
Dr Sathya Swaroop Debasish, Associate professor, Utkal University, Bhubaneswar
80-87
YEAR IV VOLUME IV .Jamshedpur Research Review. ISSUE XVII ISSN-2320-2750
JRR September –November 2016 8
10. CUSTOMER FOCUSES OF PUBLIC AND NEW GENERATION PRIVATE SECTOR BANKS IN INDIA:
A COMPARISON
Dr.T.P.Vijumon, HOD, PG Department of Commerce, TKMM College, Nangiarkulangara,
Alleppy Dist, Kerala State
88-92
11. SIZE OR EFFICIENCY – WHAT WILL DRIVE THE FUTURE OF INDIAN BANKS
Saurabh Agarwal, Research Scholar, Department of EAFM University of Rajasthan
Prof. Rajiv Upadhayaya, Professor, EAFM Deptt. University of Rajasthan
93-97
12. INSURANCE PENETRATION IN RURAL HOUSEHOLDS: BIHAR MODEL TO BE REPLICATED
Devesh kumar, Research Scholar, Department of Commerce & Management, Vinoba
Bhave University, Hazaribagh, Jharkhand
Dr Amitava Samanta, Asst. Professor, Department of Commerce & Management, Vinoba
Bhave University, Hazaribagh, Jharkhand
98-105
13. A STUDY OF FINANCIAL INCLUSION PLAN & ITS IMPLEMENTATION IN UNBANKED AREA OF
INDIA: AN OVERVIEW
Shyam Jivan Salunkhe, Assistant Professor, Department of Commerce A R B Garud
College, Shendurni,Dist. Jalgaon, Maharastra, India
106-113
14. KNOWLEDGE PROCESS OUTSOURCING IN INDIA
Dr. Ashutosh Priya, Director, Utkarsh Business School, Bareilly
Mrs. Rachna Bamba, Research Scholar, Uttarakhand Technical University, Dehradun,
Uttarakhand
114-119
15. AN APPRAISAL OF PARADIGM SHIFT FROM TRANSACTIONAL MARKETING TO RELATIONSHIP
MARKETING: A CASE OF HOMEAPPLIANCES MARKET IN WEST BENGAL
Dr. Indrani Majumder, Assistant Professor in Economics, Nagar College, Nagar, Post
Office- Nagar, District- Murshidabad, West Bengal
120-130
16. VALUE DRIVER MODEL AS MEAN OF MATERIALIZING SUSTAINABLE DEVELOPMENT: THE
CASE OF PHILIPS ESG STRATEGIES
Dr. Ajai Prakash, Faculty, Department of Business Administration, University of
Lucknow
Kishore Kumar, Research Scholar (JRF), Deptt. Of Business Administration, University
of Lucknow, UP
131-136
17. ROLE OF EDUCATION OF TEACHERS IN 21ST
CENTURY
Dr. Rakesh Prasad, Assistant Professor, Dept of Education, K.O College, Gumla, Jharkhand
137-139
18. CENTRAL AFRICAN MYTHOLOGY
Durlabh Singh, 68 Raynham Avenue, London, N18 2BS, United Kingdom
140-141
19. ASPIRING FOR WORLD UNION ON SPIRITUAL FOUNDATION
Aju Mukhopadhay, 8 Chair, Lodi Street, Pondicherry
142-146
YEAR IV VOLUME IV .Jamshedpur Research Review. ISSUE XVII ISSN-2320-2750
JRR September –November 2016 9
WOMEN EMPOWERMENT IN RURAL PALAMU: AN
EMPIRICAL ANALYSIS Anita Sinha Head, Political Science Department, Janta Shivratri College, Daltonganj, Palamu
_______________________________________________________________________
Abstract
Women's empowerment, referring to the empowerment of women in our present society, has become
a significant topic of discussion in regards to development and economics. In this paper I have
discussed the present status of women empowerment in rural areas of Palamau district of Jharkhand.
Palamau is one of the twenty-four districts of Jharkhand state, India. It was formed in 1892.The
administrative headquarter is Daltonganj, situated on Koel river. Palamu district consists of 21
Blocks. To study the degree of women empowerment in rural Palamau, I randomly picked up 357
samples across the rural areas of Palamau district.
Key words: Women empowerment, Palamau District of Jharkhand, decision making power, financial
independence, involvement in electoral process, Gram Sabha, Health check-up, raising voice against
male dominance, exploitation and social evils.
Women's empowerment, referring to
the empowerment of women in our present
society, has become a significant topic of
discussion in regards to development and
economics. Often, women in India are legally
restricted from economic decision making on
the sole basis of gender. When women
have economic empowerment, it is a way for
others to see them as equal members of
society. Through this, they achieve more self-
respect and confidence by their contributions
to their communities. Simply including women
as a part of a community can have sweeping
positive effects. In the states like Jharkhand
tribal women have greater decision making
power than other contemporary Indian
societies. Women participation in social,
economic, political activities have been argued
to be the most beneficial form of gender
empowerment. Political participation, be it the
ability to vote and voice opinions, or the
ability to run for office with a fair chance of
being elected, plays a huge role in the
empowerment of peoples. Participation in
the household, in schools, and the ability to
make choices for oneself. It can be said that
these latter participations need to be achieved
before one can move onto broader political
participation
The main objective of this paper is to
explain the present status of women
empowerment in Palamau district of
Jharkhand.
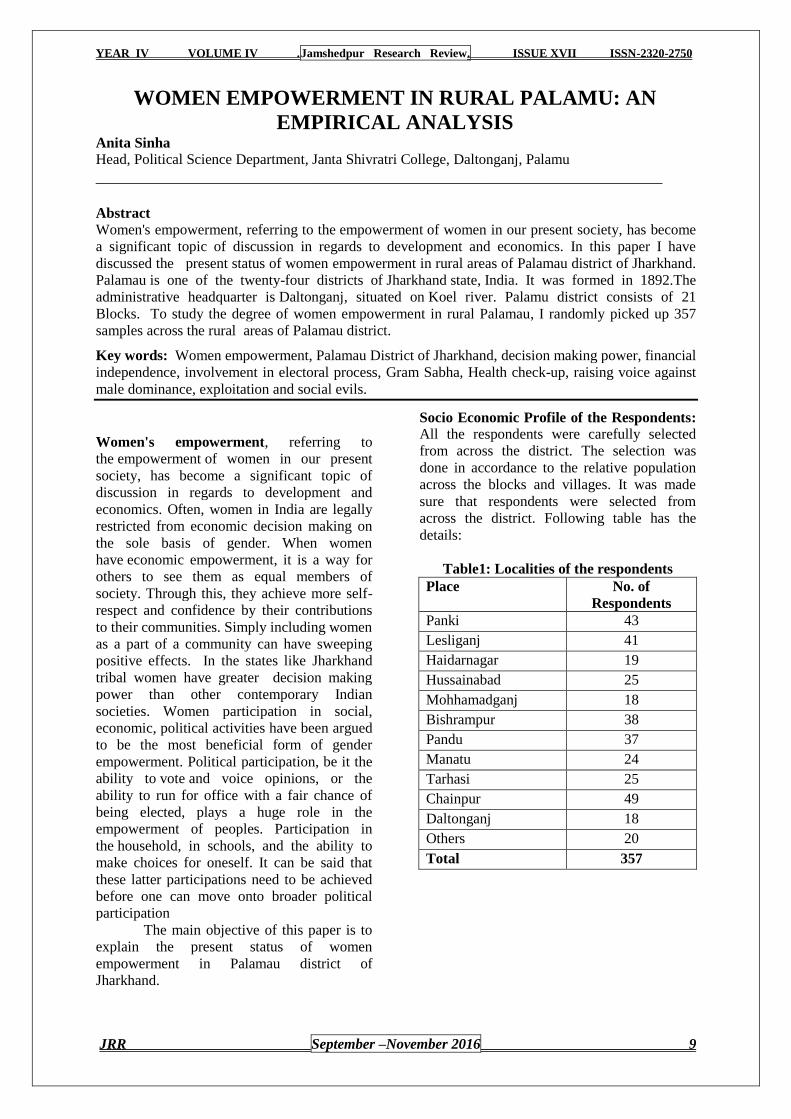
Socio Economic Profile of the Respondents:
All the respondents were carefully selected
from across the district. The selection was
done in accordance to the relative population
across the blocks and villages. It was made
sure that respondents were selected from
across the district. Following table has the
details:
Table1: Localities of the respondents
Place No. of
Respondents
Panki 43
Lesliganj 41
Haidarnagar 19
Hussainabad 25
Mohhamadganj 18
Bishrampur 38
Pandu 37
Manatu 24
Tarhasi 25
Chainpur 49
Daltonganj 18
Others 20
Total 357
YEAR IV VOLUME IV .Jamshedpur Research Review. ISSUE XVII ISSN-2320-2750
JRR September –November 2016 10
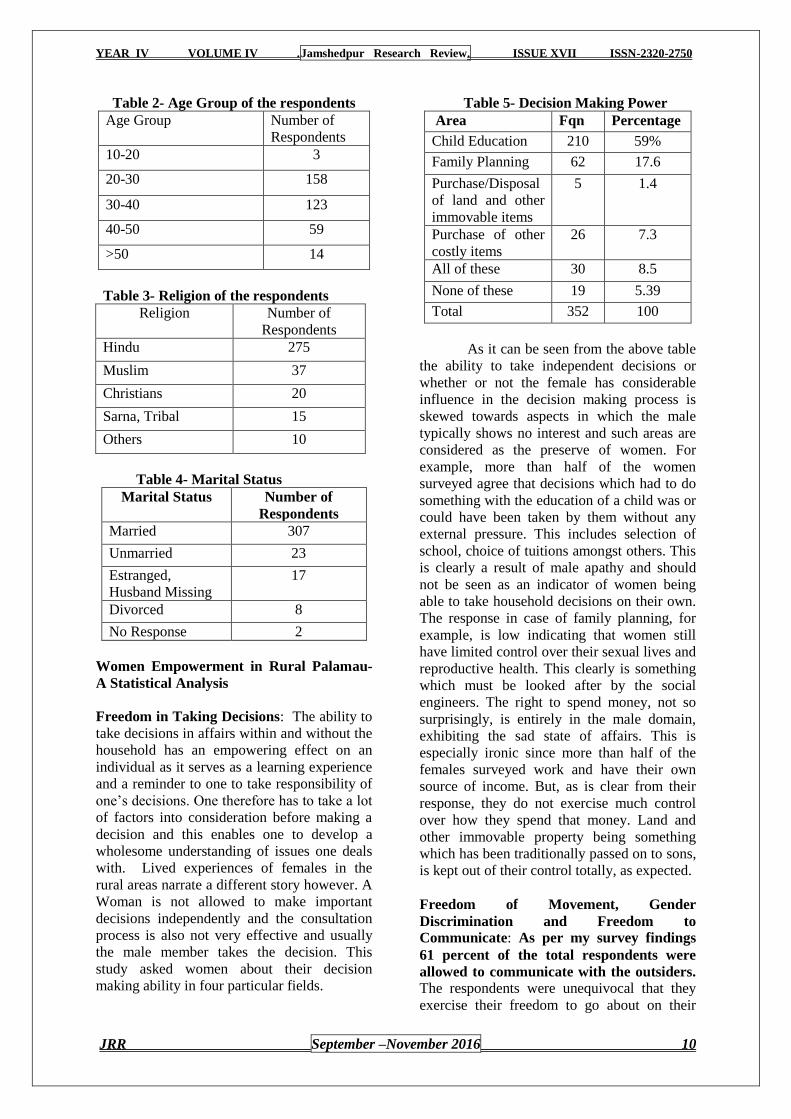
Table 2- Age Group of the respondents
Age Group Number of
Respondents
10-20 3
20-30 158
30-40 123
40-50 59
>50 14
Table 3- Religion of the respondents
Religion Number of
Respondents
Hindu 275
Muslim 37
Christians 20
Sarna, Tribal 15
Others 10
Table 4- Marital Status
Marital Status Number of
Respondents
Married 307
Unmarried 23
Estranged,
Husband Missing
17
Divorced 8
No Response 2
Women Empowerment in Rural Palamau-
A Statistical Analysis
Freedom in Taking Decisions: The ability to
take decisions in affairs within and without the
household has an empowering effect on an
individual as it serves as a learning experience
and a reminder to one to take responsibility of
one‘s decisions. One therefore has to take a lot
of factors into consideration before making a
decision and this enables one to develop a
wholesome understanding of issues one deals
with. Lived experiences of females in the
rural areas narrate a different story however. A
Woman is not allowed to make important
decisions independently and the consultation
process is also not very effective and usually
the male member takes the decision. This
study asked women about their decision
making ability in four particular fields.
Table 5- Decision Making Power
Area Fqn Percentage
Child Education 210 59%
Family Planning 62 17.6
Purchase/Disposal
of land and other
immovable items
5 1.4
Purchase of other
costly items
26 7.3
All of these 30 8.5
None of these 19 5.39
Total 352 100
As it can be seen from the above table
the ability to take independent decisions or
whether or not the female has considerable
influence in the decision making process is
skewed towards aspects in which the male
typically shows no interest and such areas are
considered as the preserve of women. For
example, more than half of the women
surveyed agree that decisions which had to do
something with the education of a child was or
could have been taken by them without any
external pressure. This includes selection of
school, choice of tuitions amongst others. This
is clearly a result of male apathy and should
not be seen as an indicator of women being
able to take household decisions on their own.
The response in case of family planning, for
example, is low indicating that women still
have limited control over their sexual lives and
reproductive health. This clearly is something
which must be looked after by the social
engineers. The right to spend money, not so
surprisingly, is entirely in the male domain,
exhibiting the sad state of affairs. This is
especially ironic since more than half of the
females surveyed work and have their own
source of income. But, as is clear from their
response, they do not exercise much control
over how they spend that money. Land and
other immovable property being something
which has been traditionally passed on to sons,
is kept out of their control totally, as expected.
Freedom of Movement, Gender
Discrimination and Freedom to
Communicate: As per my survey findings
61 percent of the total respondents were
allowed to communicate with the outsiders.
The respondents were unequivocal that they
exercise their freedom to go about on their
YEAR IV VOLUME IV .Jamshedpur Research Review. ISSUE XVII ISSN-2320-2750
JRR September –November 2016 11
own and communicate with people outside the
household on a frequent basis. This has to be
studied in consonance with the fact that most
of the respondents were earning members of
the household and therefore have to commute
and interact on a regular basis with people
around them. The ability to move freely and
interact with people outside the household is
known to have a positive impact on women
empowerment and this has been clearly
brought out by research works across the
globe.
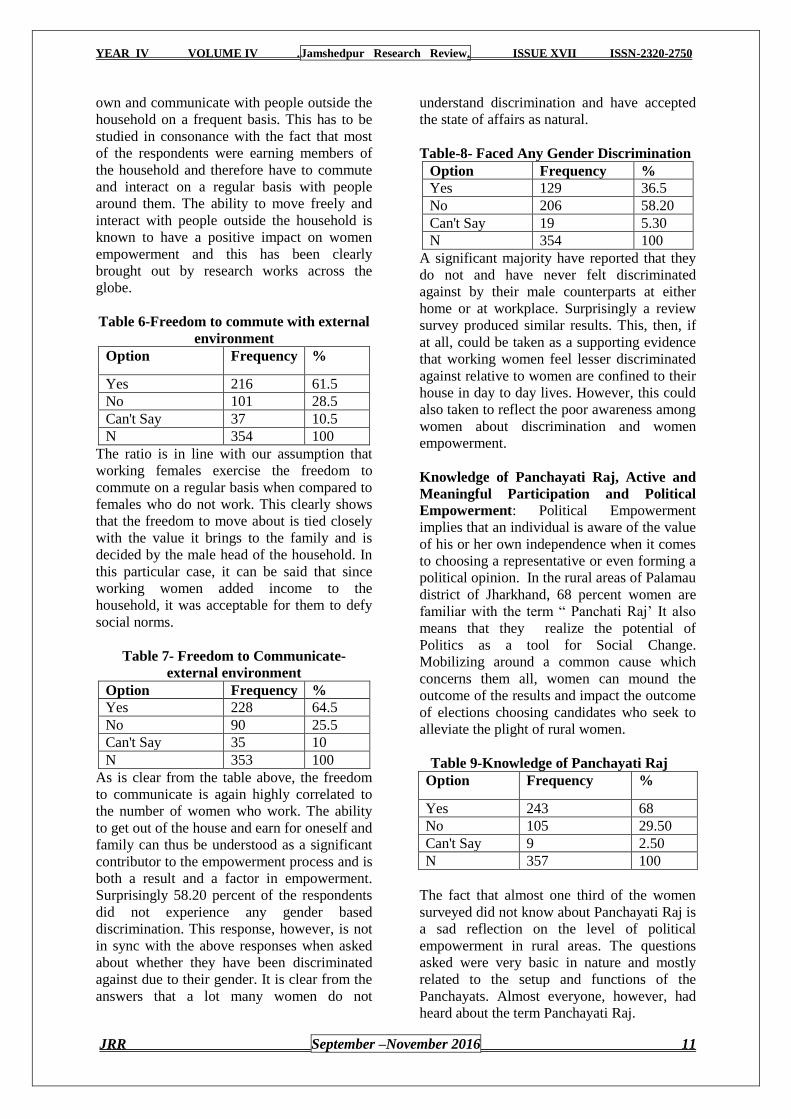
Table 6-Freedom to commute with external
environment
Option Frequency %
Yes 216 61.5
No 101 28.5
Can't Say 37 10.5
N 354 100
The ratio is in line with our assumption that
working females exercise the freedom to
commute on a regular basis when compared to
females who do not work. This clearly shows
that the freedom to move about is tied closely
with the value it brings to the family and is
decided by the male head of the household. In
this particular case, it can be said that since
working women added income to the
household, it was acceptable for them to defy
social norms.
Table 7- Freedom to Communicate-
external environment
Option Frequency %
Yes 228 64.5
No 90 25.5
Can't Say 35 10
N 353 100
As is clear from the table above, the freedom
to communicate is again highly correlated to
the number of women who work. The ability
to get out of the house and earn for oneself and
family can thus be understood as a significant
contributor to the empowerment process and is
both a result and a factor in empowerment.
Surprisingly 58.20 percent of the respondents
did not experience any gender based
discrimination. This response, however, is not
in sync with the above responses when asked
about whether they have been discriminated
against due to their gender. It is clear from the
answers that a lot many women do not
understand discrimination and have accepted
the state of affairs as natural.
Table-8- Faced Any Gender Discrimination
Option Frequency %
Yes 129 36.5
No 206 58.20
Can't Say 19 5.30
N 354 100
A significant majority have reported that they
do not and have never felt discriminated
against by their male counterparts at either
home or at workplace. Surprisingly a review
survey produced similar results. This, then, if
at all, could be taken as a supporting evidence
that working women feel lesser discriminated
against relative to women are confined to their
house in day to day lives. However, this could
also taken to reflect the poor awareness among
women about discrimination and women
empowerment.
Knowledge of Panchayati Raj, Active and
Meaningful Participation and Political
Empowerment: Political Empowerment
implies that an individual is aware of the value
of his or her own independence when it comes
to choosing a representative or even forming a
political opinion. In the rural areas of Palamau
district of Jharkhand, 68 percent women are
familiar with the term ― Panchati Raj‘ It also
means that they realize the potential of
Politics as a tool for Social Change.
Mobilizing around a common cause which
concerns them all, women can mound the
outcome of the results and impact the outcome
of elections choosing candidates who seek to
alleviate the plight of rural women.
Table 9-Knowledge of Panchayati Raj
Option Frequency %
Yes 243 68
No 105 29.50
Can't Say 9 2.50
N 357 100
The fact that almost one third of the women
surveyed did not know about Panchayati Raj is
a sad reflection on the level of political
empowerment in rural areas. The questions
asked were very basic in nature and mostly
related to the setup and functions of the
Panchayats. Almost everyone, however, had
heard about the term Panchayati Raj.
YEAR IV VOLUME IV .Jamshedpur Research Review. ISSUE XVII ISSN-2320-2750
JRR September –November 2016 12
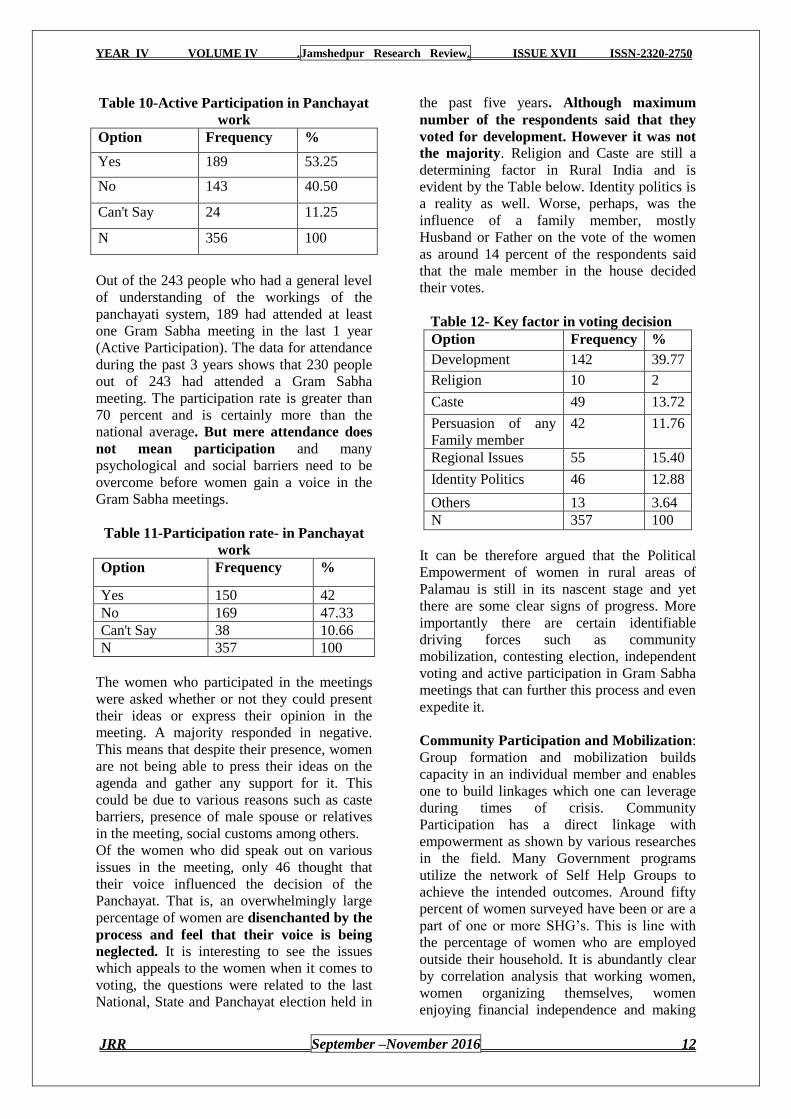
Table 10-Active Participation in Panchayat
work
Option Frequency %
Yes 189 53.25
No 143 40.50
Can't Say 24 11.25
N 356 100
Out of the 243 people who had a general level
of understanding of the workings of the
panchayati system, 189 had attended at least
one Gram Sabha meeting in the last 1 year
(Active Participation). The data for attendance
during the past 3 years shows that 230 people
out of 243 had attended a Gram Sabha
meeting. The participation rate is greater than
70 percent and is certainly more than the
national average. But mere attendance does
not mean participation and many
psychological and social barriers need to be
overcome before women gain a voice in the
Gram Sabha meetings.
Table 11-Participation rate- in Panchayat
work
Option Frequency %
Yes 150 42
No 169 47.33
Can't Say 38 10.66
N 357 100
The women who participated in the meetings
were asked whether or not they could present
their ideas or express their opinion in the
meeting. A majority responded in negative.
This means that despite their presence, women
are not being able to press their ideas on the
agenda and gather any support for it. This
could be due to various reasons such as caste
barriers, presence of male spouse or relatives
in the meeting, social customs among others.
Of the women who did speak out on various
issues in the meeting, only 46 thought that
their voice influenced the decision of the
Panchayat. That is, an overwhelmingly large
percentage of women are disenchanted by the
process and feel that their voice is being
neglected. It is interesting to see the issues
which appeals to the women when it comes to
voting, the questions were related to the last
National, State and Panchayat election held in
the past five years. Although maximum
number of the respondents said that they
voted for development. However it was not
the majority. Religion and Caste are still a
determining factor in Rural India and is
evident by the Table below. Identity politics is
a reality as well. Worse, perhaps, was the
influence of a family member, mostly
Husband or Father on the vote of the women
as around 14 percent of the respondents said
that the male member in the house decided
their votes.
Table 12- Key factor in voting decision
Option Frequency %
Development 142 39.77
Religion 10 2
Caste 49 13.72
Persuasion of any
Family member
42 11.76
Regional Issues 55 15.40
Identity Politics 46 12.88
Others 13 3.64
N 357 100
It can be therefore argued that the Political
Empowerment of women in rural areas of
Palamau is still in its nascent stage and yet
there are some clear signs of progress. More
importantly there are certain identifiable
driving forces such as community
mobilization, contesting election, independent
voting and active participation in Gram Sabha
meetings that can further this process and even
expedite it.
Community Participation and Mobilization:
Group formation and mobilization builds
capacity in an individual member and enables
one to build linkages which one can leverage
during times of crisis. Community
Participation has a direct linkage with
empowerment as shown by various researches
in the field. Many Government programs
utilize the network of Self Help Groups to
achieve the intended outcomes. Around fifty
percent of women surveyed have been or are a
part of one or more SHG‘s. This is line with
the percentage of women who are employed
outside their household. It is abundantly clear
by correlation analysis that working women,
women organizing themselves, women
enjoying financial independence and making

YEAR IV VOLUME IV .Jamshedpur Research Review. ISSUE XVII ISSN-2320-2750
JRR September –November 2016 13
political decisions on their own are highly
correlated.
Table 13-Women in any community
organization including SHG’s under NRLM
Options Frequency %
Yes 174 49.44
No 173 49.14
Can't Say 5 1.42
N 352 100
The communities are also instrumental in
giving the women voice as a collection of
individuals. The groups which are not related
to finance are politically and socially active.
Moreover, the surveyed women meet at a
regular basis and discuss various issues
amongst them. Surprisingly, a few of the
community organization had taken out a
procession sensitizing people on various issues
in the past one year.
Table 14-Women who have participated in
any agitation or procession in the last one
Year
Options Frequency %
Yes 111 31.35
No 204 57.62
Can't Say 39 11
N 354 100
Although only around one third of the women
have been in any agitation or procession, it is
still a good number for rural population. A
comparative study could not be drawn due to
the lack of data from other regions. It is
interesting to know the diversity of topics
discussed during these meetings. As is clear
from the Table below, the topics range from
Politics to various social ills and even issues
such as drug abuse among the youth. This
clearly indicates that women are somewhat
more aware of the surroundings and have an
opinion on things which they think are
important. These include anything which has
an impact on their wellbeing in a broader
sense.
Table 15- Issues/Topics at a meeting or in a
procession
Option Frequency %
Child Marriage 103 27.91
Domestic
Violence
98 26.55
Violence against
Widow, Children
25 6.70
Girl Trafficking 35 9.40
Drug Abuse
among Youth
30 8.13
Alcoholism 54 14.63
All of these 24 6.50
N 369 100
It is heartening to see that women in rural are
waking up to the evil practice of child
marriage. An empowered woman in the family
can go a long way in stopping her children
from being married at a young age. Domestic
violence is another issue which has been
constant discussion as evident from the Table
above. On being questioned further, it was
found that marital rape, which is still legal in
India, was a frequent topic of discussion. It is
therefore clear that women are starting to rise
against such subtle issues which were earlier
not talked about. In recent years the trafficking
of girls from Jharkhand has increased. Most of
the times, the family is duped into sending the
girl child away from home. Therefore
processions and rallies which sensitize people
and make them aware of the issue were taken
up by some women group in the past year.
Alcohol abuse by husbands and drug abuse
among the youth was also a subject of
discussion. The fact that women in groups are
discussing about issues which are relevant for
a better society and a better lives for them is an
indicator of empowerment. Indeed, the
revision survey revealed that the activities of
the groups had increased. News reports
indicated that they had started taking errant
Husbands to the police stations. A big step
forward indeed. In fact successive survey
showed that the awareness related to domestic
violence grew over the years between the
surveys.
Community participation and group
mobilization then emerges as one of the
major driving force of women
empowerment in rural areas of Palamu. The
reasons for it are not so difficult to
comprehend. The loss of identity and therefore
YEAR IV VOLUME IV .Jamshedpur Research Review. ISSUE XVII ISSN-2320-2750
JRR September –November 2016 14
the associated shame and shyness when one
becomes a part of a larger whole could be the
primary reason for it. Apart from it, the
strength and confidence one derives from
fellow members of the group is also one of the
reasons, among others.
Domestic Violence, Legal awareness and
Health issues: Similarly, the avenues to
address the issue of domestic violence have
changed over the years. Taking data from a
previous survey, it is wonderful to see that
institutionalized grievance redressal
mechanism is taking hold and an increasing
number of women are going to police stations
and courts. The increased presence at avenues
of mediation and conciliation such as the
Panchayats has increased the collective voice
of women as the numbers have crossed a
critical threshold. Police stations in two areas
(in the survey region) reported an increased
number of women coming in groups to
complain about incidents. A recent data put
out by the women commission also indicate
that more number of cases are being brought
forward and women are more upfront and less
ashamed to go public with their sufferings.
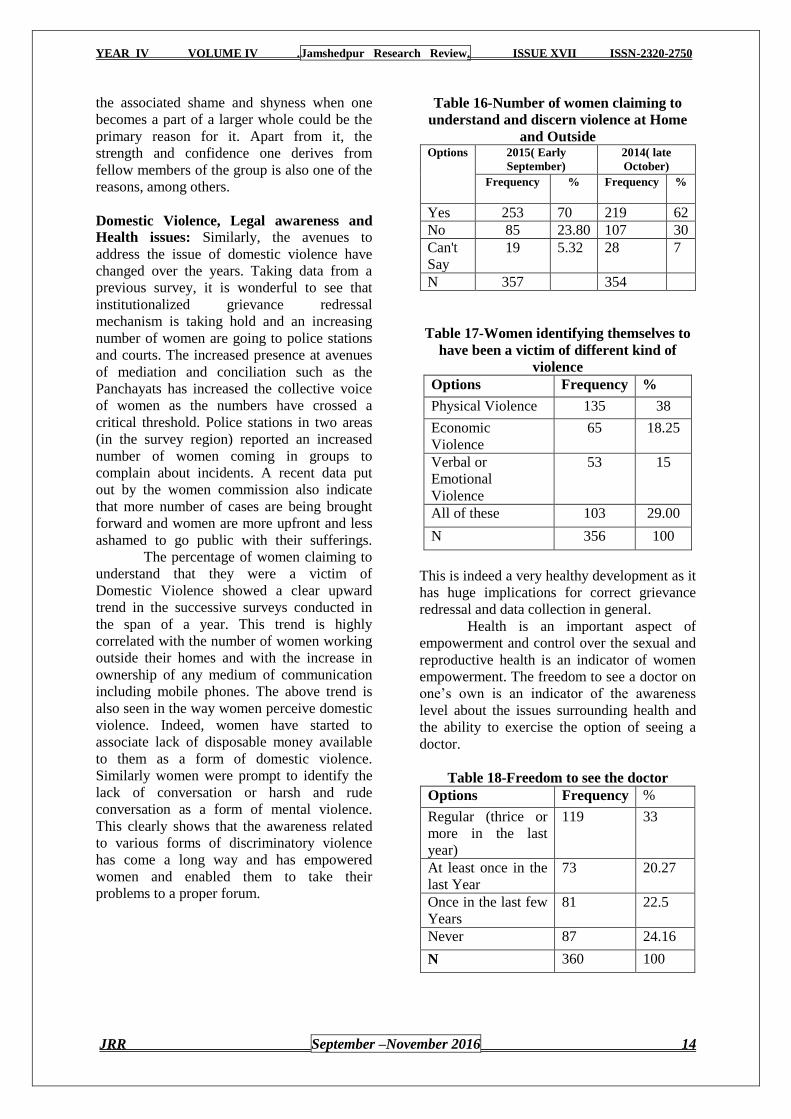
The percentage of women claiming to
understand that they were a victim of
Domestic Violence showed a clear upward
trend in the successive surveys conducted in
the span of a year. This trend is highly
correlated with the number of women working
outside their homes and with the increase in
ownership of any medium of communication
including mobile phones. The above trend is
also seen in the way women perceive domestic
violence. Indeed, women have started to
associate lack of disposable money available
to them as a form of domestic violence.
Similarly women were prompt to identify the
lack of conversation or harsh and rude
conversation as a form of mental violence.
This clearly shows that the awareness related
to various forms of discriminatory violence
has come a long way and has empowered
women and enabled them to take their
problems to a proper forum.
Table 16-Number of women claiming to
understand and discern violence at Home
and Outside Options 2015( Early
September)
2014( late
October)
Frequency % Frequency %
Yes 253 70 219 62
No 85 23.80 107 30
Can't
Say
19 5.32 28 7
N 357 354
Table 17-Women identifying themselves to
have been a victim of different kind of
violence
Options Frequency %
Physical Violence 135 38
Economic
Violence
65 18.25
Verbal or
Emotional
Violence
53 15
All of these 103 29.00
N 356 100
This is indeed a very healthy development as it
has huge implications for correct grievance
redressal and data collection in general.
Health is an important aspect of
empowerment and control over the sexual and
reproductive health is an indicator of women
empowerment. The freedom to see a doctor on
one‘s own is an indicator of the awareness
level about the issues surrounding health and
the ability to exercise the option of seeing a
doctor.
Table 18-Freedom to see the doctor
Options Frequency %
Regular (thrice or
more in the last
year)
119 33
At least once in the
last Year
73 20.27
Once in the last few
Years
81 22.5
Never 87 24.16
N 360 100

YEAR IV VOLUME IV .Jamshedpur Research Review. ISSUE XVII ISSN-2320-2750
JRR September –November 2016 15
The above Table indicates that the women
who have seen a doctor at least once in the
past year are in a majority. The concern
however is the number of women who have
never met a doctor regarding problems of any
sort. There could be various other factors
driving this behavior including poverty and the
distance of the doctor from the home amongst
others. Other factors impacting health of a
woman and her physical safety do not fare
well however. The number of households with
toilets for example is below the national
average meaning women have to defecate in
the open before sunrise and after sunset. In
fact 265 women reported having to defecate in
the open while only 91 women had a toilet in
their house. This could and does have serious
impacts on the health of a woman. It also
means that women living in households
without toilets do not have enough voice to get
a toilet built and that their health is not a
priority form the male earner and spender.
This clearly, therefore indicates a lack of
empowerment.
Palamau is a dry region of Jharkhand
and is susceptible to droughts in case of failure
of monsoons. The level of groundwater has
consistently fallen over the years and this has
meant that the usual sources of easily available
fresh water are decreasing in numbers. This
has huge implications on the day to day life of
a woman as they are forced to go out for
searching potable water. In fact a study put out
by UNDP stated that women in Jharkhand
have to walk for around two hours on a daily
basis just to meet the needs of water for the
family. This again, like the absence of toilet is
the inability of women to convince the male
member to spend for her convenience and
indicates a lack of power equation in the
home.
Economic Empowerment: A person with
his/her own disposable income is far more
empowered in taking decisions about his/her
life than a person who is financially dependent
on someone else. With that in mind, an
analysis of the financial autonomy including
assets owned and independence in disposing
off the assets and spending the income as per
will is an important indicator of the level of
empowerment.
More than three fourth of the surveyed
women had a bank account in their own name.
Of the remaining one fourth around twenty
percent had a joint account with their husband.
The picture however, turns dismal when one
looks at the number of women who regularly
access financial services on their own.
Although still high for a rural area, the number
of women who went to a bank office
themselves and initiated any kind of
transaction is less than half of the total
number.
Table 19- Use of the money withdrawn from
self-account
Options Frequency Percentage
Husband 99 27.73
Children 111 31.09
Self 7 1.96
Remaining
Family
Members
94 26.33
Can't Say 46 12.89
N 357 100
As is clear from the table above, only about 2
percent of women spend the money they
withdraw on their own selves. Most of the
expenditure is on the family including
Husband and Children. This means that while
women have been earning on their own, they
are unable to spend a substantial amount on
themselves. It can be argued that the spending
will be of benefit to the family and therefore to
her. Lack of data on the part of spending by
male also restricts a comparative analysis.
Nonetheless, it can be said that women are not
empowered economically. This has
implications for the policy makers as the
opening of bank accounts and earning does not
translate to being financially better off at an
individual level.
Meaning of Empowerment: The meaning of
empowerment is bound to differ dependent on
the socio economic background, the
surroundings, the family members and
company of an individual. People at every
level of empowerment seek upward mobility
and have different barriers which they seek to
break and therefore their understanding of
being empowered differs. The diversity in
response of the rural women with broadly
similar background is a testament to the fact
that empowerment is personal to one and
subjectivity is inbuilt in the concept.
YEAR IV VOLUME IV .Jamshedpur Research Review. ISSUE XVII ISSN-2320-2750
JRR September –November 2016 16
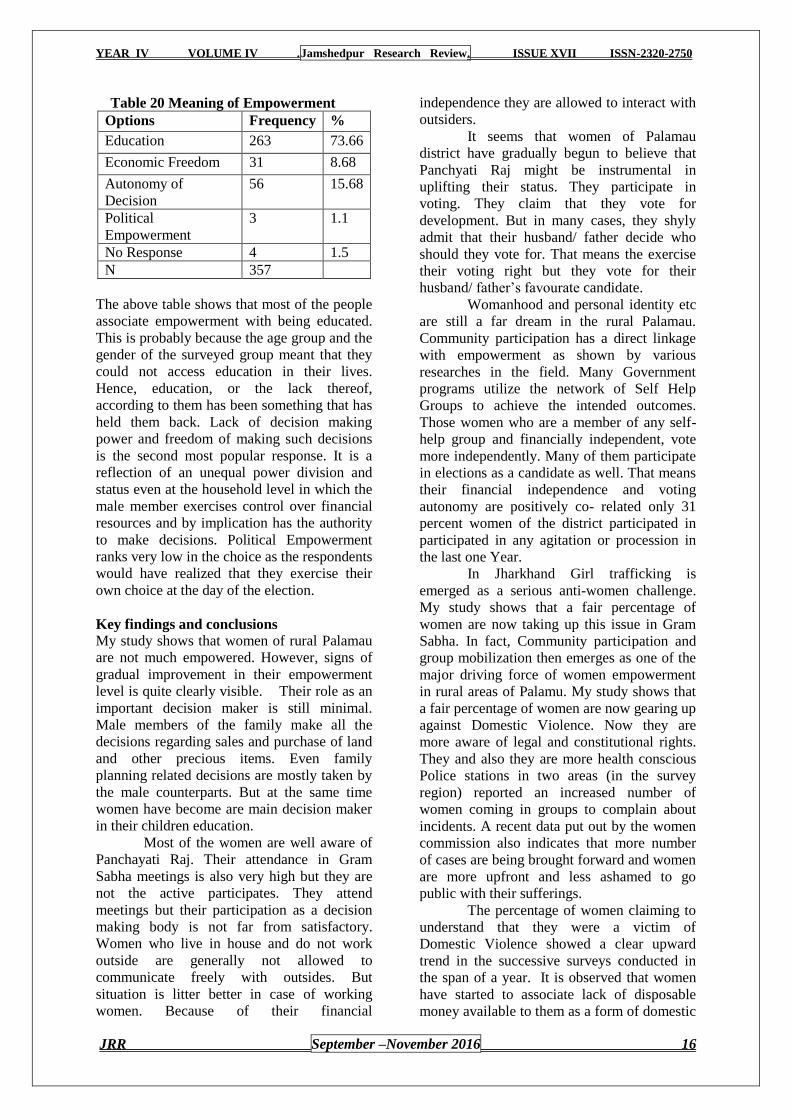
Table 20 Meaning of Empowerment
Options Frequency %
Education 263 73.66
Economic Freedom 31 8.68
Autonomy of
Decision
56 15.68
Political
Empowerment
3 1.1
No Response 4 1.5
N 357
The above table shows that most of the people
associate empowerment with being educated.
This is probably because the age group and the
gender of the surveyed group meant that they
could not access education in their lives.
Hence, education, or the lack thereof,
according to them has been something that has
held them back. Lack of decision making
power and freedom of making such decisions
is the second most popular response. It is a
reflection of an unequal power division and
status even at the household level in which the
male member exercises control over financial
resources and by implication has the authority
to make decisions. Political Empowerment
ranks very low in the choice as the respondents
would have realized that they exercise their
own choice at the day of the election.
Key findings and conclusions
My study shows that women of rural Palamau
are not much empowered. However, signs of
gradual improvement in their empowerment
level is quite clearly visible. Their role as an
important decision maker is still minimal.
Male members of the family make all the
decisions regarding sales and purchase of land
and other precious items. Even family
planning related decisions are mostly taken by
the male counterparts. But at the same time
women have become are main decision maker
in their children education.
Most of the women are well aware of
Panchayati Raj. Their attendance in Gram
Sabha meetings is also very high but they are
not the active participates. They attend
meetings but their participation as a decision
making body is not far from satisfactory.
Women who live in house and do not work
outside are generally not allowed to
communicate freely with outsides. But
situation is litter better in case of working
women. Because of their financial
independence they are allowed to interact with
outsiders.
It seems that women of Palamau
district have gradually begun to believe that
Panchyati Raj might be instrumental in
uplifting their status. They participate in
voting. They claim that they vote for
development. But in many cases, they shyly
admit that their husband/ father decide who
should they vote for. That means the exercise
their voting right but they vote for their
husband/ father‘s favourate candidate.
Womanhood and personal identity etc
are still a far dream in the rural Palamau.
Community participation has a direct linkage
with empowerment as shown by various
researches in the field. Many Government
programs utilize the network of Self Help
Groups to achieve the intended outcomes.
Those women who are a member of any self-
help group and financially independent, vote
more independently. Many of them participate
in elections as a candidate as well. That means
their financial independence and voting
autonomy are positively co- related only 31
percent women of the district participated in
participated in any agitation or procession in
the last one Year.
In Jharkhand Girl trafficking is
emerged as a serious anti-women challenge.
My study shows that a fair percentage of
women are now taking up this issue in Gram
Sabha. In fact, Community participation and
group mobilization then emerges as one of the
major driving force of women empowerment
in rural areas of Palamu. My study shows that
a fair percentage of women are now gearing up
against Domestic Violence. Now they are
more aware of legal and constitutional rights.
They and also they are more health conscious
Police stations in two areas (in the survey
region) reported an increased number of
women coming in groups to complain about
incidents. A recent data put out by the women
commission also indicates that more number
of cases are being brought forward and women
are more upfront and less ashamed to go
public with their sufferings.
The percentage of women claiming to
understand that they were a victim of
Domestic Violence showed a clear upward
trend in the successive surveys conducted in
the span of a year. It is observed that women
have started to associate lack of disposable
money available to them as a form of domestic
YEAR IV VOLUME IV .Jamshedpur Research Review. ISSUE XVII ISSN-2320-2750
JRR September –November 2016 17
violence. Similarly women were prompt to
identify the lack of conversation or harsh and
rude conversation as a form of mental
violence. This clearly shows that the
awareness related to various forms of
discriminatory violence has come a long way
and has empowered women and enabled them
to take their problems to a proper forum.
Health is an important aspect of empowerment
and control over the sexual and reproductive
health is an indicator of women empowerment.
The freedom to see a doctor on one‘s own is
an indicator of the awareness level about the
issues surrounding health and the ability to
exercise the option of seeing a doctor. My
study shows as much as 33 percent of the
respondents never / rarely visit doctor. During
the pregnancy period visiting doctor on regular
basis is important. But in rural Palamau, this
practice is not very popular. Majority of
women visit doctors only once in a year or
two. The number of toilets in the rural
Palamau is less than the national average. It
mean women have to defecate in the open
before sunrise and after sunset. In fact 265
women reported having to defecate in the open
while only 91 women had a toilet in their
house. This could and does have serious
impacts on the health of a woman. Entire issue
becomes more serious when we come to know
that in Palamau district the level of
groundwater has consistently fallen over the
years and women are forced to go out for
searching potable water. This again, like the
absence of toilet is the inability of women to
convince the male member to spend for her
convenience and indicates a lack of power
equation in the home. More than three fourth
of the surveyed women had a bank account in
their own name. Of the remaining one fourth
around twenty percent had a joint account with
their husband. As per my survey findings only
about 2 percent of women spend the money
they withdraw on their own selves. Most of the
expenditure is on the family including
Husband and Children. This has implications
for the policy makers as the opening of bank
accounts and earning does not translate to
being financially better off at an individual
level. My study shows that most of the people
associate empowerment with being educated.
Lack of decision making power and freedom
of making such decisions is the second most
popular response. Political Empowerment
ranks very low in the choice as the respondents
would have realized that they exercise their
own choice at the day of the election.
Finally it can be said that the present
status of Women Empowerment in Rural
Palamau is relatively better when compared to
other areas of the state but much is left to be
done. As the above analysis has shown women
have an understanding of what empowerment
means, although the meaning they attach to the
word is very personal and depends on the
socio economic background of the person in
question apart from others. It can be also said
that women are more aware of their political
rights and the power of voting en bloc. An
average woman in rural area is more aware of
her rights and the discrimination she has to
suffer within and without the house. The good
thing is that she is now raising her voice
against it and is evident by the increasing
number of cases filed by women even against
their own families.
Bibliography
1. Agarwal, Bina. 1994. "Land Rights
for Women: Making the Case," in A
Field of One's Own: Gender and Land
Rights in South Asia, pp. 1-50.
Cambridge: Cambridge Univ. Press.
2. Argawal, Bina. 2010. "Gender and
Green Governance: The Political
Economy of Women's Presence
Within and Beyond Community
Forestry." New York, NY: Oxford
University Press.
3. Deneulin, Séverine, with Lila
Shahani. 2009. An Introduction to the
Human Development and Capability
Approach: Freedom and Agency.
Sterling, VA: Earthscan.
4. www.dailypioneer.com/state.../pms-
women-empowerment-drive-shines-
in-palamu.ht.5.
5. https://en.wikipedia.org/wiki/Palamu_
district
YEAR IV VOLUME IV .Jamshedpur Research Review. ISSUE XVII ISSN-2320-2750
JRR September –November 2016 18
TRAUMA AND EGO STRENGTH AMONG TRIBAL
TRAFFICKED GIRLS AND WOMEN
Dr. Mritunjay Kumar
P.G. Department of Psychology, J.S.College, N.P.University, Daltonganj, Jharkhand.
Email:[email protected], Mob-09507173041
Abstract
Human trafficking is one of the most attentions seeking issue in today‘s world. Trafficking of human
beings, especially of women and children, is an organized crime that violates basic human rights.
Various aspects of Trauma and poor ego strength are overt manifestations of the victim of tribal
trafficked girls and women. Objectives: The objectives of the present study were: 1. To find out and
compare socio demographic characteristics among tribal trafficked girls and women 2.To find out and
assess trauma among tribal trafficked girls and women. 3. To find out and assess ego strength among
tribal trafficked girls and women Participants: The study was conducted on 200 subjects from
Daltonganj, Garhwa and Ranchi city in the age range of 18 to 40 years. The sample was selected on
the basis of purposive sampling technique. Tools: Trauma Assessment Scale, Hasan‘s Ego Strength
Scale, Upadhyay and Saxena socio demographic Scale were used as tools. Result: 1. Lower group of
people in terms of socio economic status (85% with average income.) were more victim of trafficking.
2. Lower age girls and women (60%) were more victim of trafficking.3.Out of 200 participants, 60%
percent had showed the high level of trauma experience and rest 40% had showed the low level of
trauma experience whereas 62% had high negative consequences and rest38% had showed low level
of negative consequences.4. It further showed that majority of women suffer from low ego
strength.(65%).
Key Words: Trauma, Ego strength, Trafficked girls and women, Tribal, Trauma and ego strength
among tribal trafficked girls and women.
Background: Human trafficking is one of the
most attentions seeking issue in today‘s world.
Trafficking of human beings, especially of
women and children, is an organized crime
that violates basic human rights. As per the
UN Protocol (2000) to Prevent, Suppress and
Punish Trafficking in Persons, especially
Women and Children, supplementing the UN
Convention against Transnational Organized
Crime, Trafficking in persons‖ shall mean:
• the recruitment, transportation, transfer,
harbouring or receipt of persons,
• by means of the threat or use of force or
other forms of coercion, of abduction, of
fraud, of deception, of the abuse of power
or of a position of vulnerability or of the
giving or receiving of payments or
benefits to achieve the consent of a person
having control over another person for the
purpose of exploitation. (Article 3,
paragraph (a))
• Exploitation shall include, at a minimum,
the exploitation of the prostitution of
others or other forms of sexual
exploitation, forced labour or services,
slavery or practices similar to slavery,
servitude or the removal of organs;
• The consent of a victim of trafficking in
persons shall be irrelevant where any of
the means above have been used;
• The recruitment, transportation, transfer,
harbouring or receipt of a child for the
purpose of exploitation shall be considered
―trafficking in persons‖ even if this does
not involve any of the means set forth
above.
Thousands of girls and women are
trafficked each year from Jharkhand which
gives the state a top ranking in India. Nearly10
lakh tribal girls have been trafficked since
Jharkhand was formed while seven cases of
girl trafficking are reported everyday
nationwide. The State‘s present data still
sparks concern with 100 per cent rise in
trafficking cases from 2010 to 2012. (The
Times of India 2012).According to data
YEAR IV VOLUME IV .Jamshedpur Research Review. ISSUE XVII ISSN-2320-2750
JRR September –November 2016 19
released by the NCRB, cases of sexual
exploitation of minors has recorded a 186.5
per cent increase. In many cases, the girls
commit suicide or they are sexually exploited
and murdered. The Centre has for long been
concerned at the trafficking
situation in Jharkhand, particularly in the six
districts of Santhal Pargana, Palamau, Garhwa,
Chaibasa, Lohardaga, Khunti, Dhanbad,
Bokaro and Ranchi. According to Action
against Trafficking &Sexual Exploitation of
Children (ATSEC), an NGO working among
women, most of Jharkhand‘s victims often
children, too belonged to the Oraon, Munda,
Santhal and Gond tribes. Of the total number
girls trafficked in the state, 77 per cent were
from Scheduled Tribes.
The word ‗‗trauma‘‘ primarily describes
the damage or injury that is caused by
experiencing and/or witnessing threatening
events such as abuse (sexual, physical, and
emotional), war, illness, drug addiction, loss of
a loved one, and disaster (e.g., natural
disasters, terrorism). These negative events are
often accompanied by negative effects that
have been categorized in diagnosis manuals
and are referred to as posttraumatic stress
disorder (PTSD; e.g., Joseph & Linley, 2006;).
Traumas are often linked with negative
outcomes (i.e., posttraumatic stress disorder or
PTSD), but can also be accompanied by
positive aspects, that is,PTG, whereby a
person undergoes a change in their personal
development that extends beyond their
previous functional level (Va´zquez, Herva´s,
& Ho, 2007). It should be noted that the word
‗‗posttraumatic‘‘ implies that growth is caused
by an extreme event and is not initiated by
other minor stressors, and is not part of a
natural process of personal development
(Zoellner& Maercker, 2006). Posttraumatic
stress disorder (PTSD) refers to an anxiety
disorder that develops in response to a severe
trauma in which an individual experienced,
witnessed, or was confronted by actual or
threatened death, injury, or loss of physical
integrity of self or others. The essential feature
of PTSD is the development of characteristic
symptoms following exposure to an extreme
traumatic stressor (American Psychiatric
Association [APA], 2000). These events elicit
responses of intense fear, helplessness, or
horror and trigger three clusters of PTSD
symptoms: re-experiencing the trauma
(through nightmares, flashbacks, and intrusive
thoughts), persistent avoidance of reminders of
the trauma (i.e., avoidance of situations,
numbing of general responsiveness, and
restricted range of affect), and persistent
increased arousal (sleep difficulties, hyper
vigilance, and irritability). The character of a
traumatic event is perceived as the factor that
has the strongest impact on the victim‘s mental
health (Galea et al., 2002). Numerous studies
have revealed a direct positive relationship
between objective exposure to a traumatic
event and levels of PTS and global distress
(e.g., Norris etal., 2002). It is a common
observation that individuals do differ in the
efficiency of performing the set of functions
attributed to ego. The concept of ego- strength
―is an important factor in determining the
capacity of an individual to perceive a
challenging situation realistically and to
execute the response effectively‖. (Ali 1975).
Maslow (1954) self-actualization and
psychological health seems to have much in
common with the concept of Ego-strength.
Ego strength is an important personality factor
influencing level of aspiration under stress (Ali
1975) .It was found that when the self-esteem
of persons with high ego strength was
threatened by subjecting them to high stress
situation, their refusal to yield was expressed
in the form of higher level goals. In Contrast
low scores on the E-S Scale was found to set
their goals defensively even in the condition
where stress was not severe. Ego strength then
has potentially important implications with
regard to mental health. An IOM (2002) study
involving trafficked women in Kosovo showed
that individuals also may experience a sense of
apathy/resignation, extreme forms of
submissiveness to any authority,
maladaptation in all social situations, and loss
of personal initiative or autonomy. However,
this study also highlighted that victim of
trafficking often possessed resilience and a
quest for meaning that facilitated their healing
and adaptation. Many of the current guidelines
for assistance to victims of trafficking
highlight the significance of psychological
help (e.g., Anti-Slavery International 2005).
The criteria clusters for PTSD are the
witnessing or experiencing of a life threatening
event or a threat of serious injury to oneself or
others; the response involves anxiety, fright
and helplessness, intrusion, avoidance of
stimuli associated with the trauma, numbing,
YEAR IV VOLUME IV .Jamshedpur Research Review. ISSUE XVII ISSN-2320-2750
JRR September –November 2016 20
and hyper arousal (DSM-IV) (American
Psychiatric Association, 2000).
Objectives.
Present study was conducted with following
aims and objectives.
To find out and compare socio
demographic characteristics among
tribal trafficked girls and women.
To find out, compare and assess
trauma among tribal trafficked girls
and women.
To find out, compare and assess ego
strength among tribal trafficked girls
and women.
Hypotheses: For the purpose of study the following
hypotheses were formulated.
1: There is significant difference on
different level of socio economic
strata among tribal
trafficked girls and women.
2: Tribal trafficked girls and women
have traumatic symptoms.
3: Tribal trafficked girls and women
have low ego strength.
Method:
Participants: Participants consisted of 200 trafficked girls
and women who were chosen through
purposive sampling technique. Their age range
was between 18 to 40 years. Venue of the
study was Daltonganj, Garhwa and Ranchi city
in Jharkhand.
Inclusion criteria:
The age varied from 18 to 40
years.
Significant history of trafficking
among tribal girls and women.
The tribal‘s included Christian
tribal and sarana.
Only victims of Sex trafficking
were included.
Exclusion Criteria:
Physically challenged girls and women
were excluded.
Those girls and women were excluded
who were not cooperative for study.
Victims of trafficking such as labor
trafficking, domestic servitude and
organ trafficking were excluded.
Materials: The study consisted of socio-
demographic information and also included
the following inventories to measure trauma,
and ego strength.
1. Trauma Assessment Scale: - It is available
in Hindi. It is developed by Dr.
J.D.Moorjani, Dr.Manik Mohan Saxena &
Dr.Lovely Goyal. This comprehensive
Trauma Assessment Scale measures a
variety of traumatic life events as a result of
spouse abuse, rape, physical assault,
combat, major accidents and natural
disasters. It also aims to capture the lasting
impact of childhood abuse and other
traumatic events. This scale is intended to
capture a broad array of traumatic events,
spanning the interpersonal, intrapersonal
and physical functioning domains.
The present test (TAS) has been
divided into two parts i.e. part- A and Part-
B where, part- A consists of 20 items
related to experiences that are traumatic
while Part- B comprises of 25 items related
to consequences of the traumatic
experiences. It is a ‗five point Likert‘ scale
(fully disagree- 0 score, disagree- 1 score,
uncertain- 2 score, agree- 3 score and fully
agree- 4 score). One has to choose one
alternative out of five for part – A and one
alternative out of three in part B here 0
score for fully disagree, 1 score for never as
well as 2 score for sometimes.
Thus the maximum score would be
80 for part- ‗A‘ and 50 for part- ‗B‘. Higher
score indicates the greater amount of
traumatic experiences and lesser would
show less experiences. While in part- B
higher scores would manifest higher effect
of traumatic experiences and less scores
would denote lesser effect of traumatic
experiences. The odd-even reliability of this
test was 0.80 for part- A, and .79 for part- B
and validity was .52 for part- A, and .66 for
part- B.
2. Hasan’s Ego Strength Scale: It is
available in Hindi. It is adapted by Dr. Q.
Hasan for original ego-strength scale
developed by Barron (1963) to predict the
responses of psychoneurotic patients to
psychotherapy. It consists of 32 items. One
(1) mark is given for each of the ―NO‖
responses. The odd-even reliability of the
adapted scale was found to be 0.78, test-
retest reliability was .86 and in a factor
YEAR IV VOLUME IV .Jamshedpur Research Review. ISSUE XVII ISSN-2320-2750
JRR September –November 2016 21
analytic study, the adapted E-S scale was
found to have a loading of 0.619 on a factor
labeled as psychological health (Hassan
1970:74).
3. Socio Demographic Scale: This scale is
developed by Sunil kumar Upadhyay and
Alka Saxena .It is available in Hindi. This
scale consists of 31 items divided in five
parts related to (a) Personnel information
(b) Family (c) Education (d) Income
(e) others (cultural& material possessions).
The reliability of the SES scale was found
to be 0.83, and validity was 0.78.Responses
are scored according to the scoring key
provided.
Procedure: - Prior Permission was taken by
the appropriate institution. A proper rapport
was established and then subject were exposed
and briefed to above mentions tools. After
administration of Questionnaire data was
obtained and the response sheets were scored
individually for each subject. It is of important
to note here that moderate level is considered
as cut off for high and low level of trauma.
Statistical Treatment: - Statistical Analysis
was performed using the statistical package for
social science (SPSS) version 17. The chi-
square, percentage was used on need basis.
RESULT AND DISCUSSION
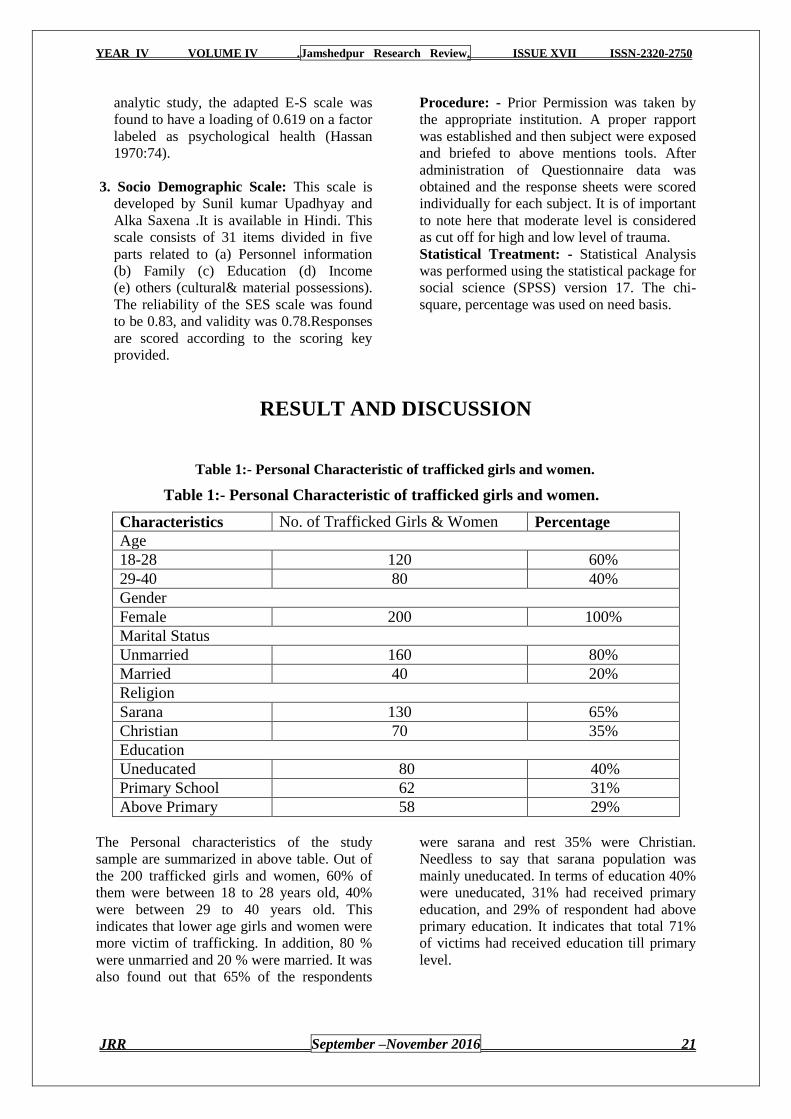
Table 1:- Personal Characteristic of trafficked girls and women.
Table 1:- Personal Characteristic of trafficked girls and women.
Characteristics No. of Trafficked Girls & Women Percentage
Age
18-28 120 60%
29-40 80 40%
Gender
Female 200 100%
Marital Status
Unmarried 160 80%
Married 40 20%
Religion
Sarana 130 65%
Christian 70 35%
Education
Uneducated 80 40%
Primary School 62 31%
Above Primary 58 29%
The Personal characteristics of the study
sample are summarized in above table. Out of
the 200 trafficked girls and women, 60% of
them were between 18 to 28 years old, 40%
were between 29 to 40 years old. This
indicates that lower age girls and women were
more victim of trafficking. In addition, 80 %
were unmarried and 20 % were married. It was
also found out that 65% of the respondents
were sarana and rest 35% were Christian.
Needless to say that sarana population was
mainly uneducated. In terms of education 40%
were uneducated, 31% had received primary
education, and 29% of respondent had above
primary education. It indicates that total 71%
of victims had received education till primary
level.
YEAR IV VOLUME IV .Jamshedpur Research Review. ISSUE XVII ISSN-2320-2750
JRR September –November 2016 22
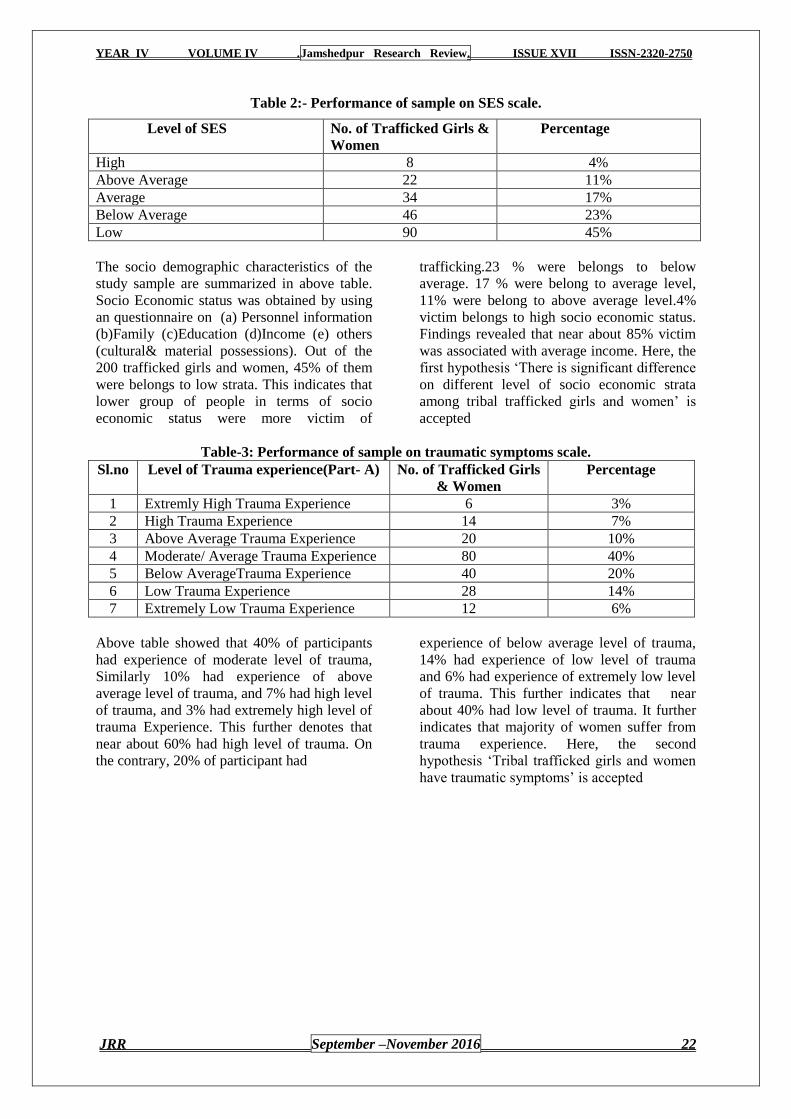
Table 2:- Performance of sample on SES scale.
Level of SES No. of Trafficked Girls &
Women
Percentage
High 8 4%
Above Average 22 11%
Average 34 17%
Below Average 46 23%
Low 90 45%
The socio demographic characteristics of the
study sample are summarized in above table.
Socio Economic status was obtained by using
an questionnaire on (a) Personnel information
(b)Family (c)Education (d)Income (e) others
(cultural& material possessions). Out of the
200 trafficked girls and women, 45% of them
were belongs to low strata. This indicates that
lower group of people in terms of socio
economic status were more victim of
trafficking.23 % were belongs to below
average. 17 % were belong to average level,
11% were belong to above average level.4%
victim belongs to high socio economic status.
Findings revealed that near about 85% victim
was associated with average income. Here, the
first hypothesis ‗There is significant difference
on different level of socio economic strata
among tribal trafficked girls and women‘ is
accepted
Table-3: Performance of sample on traumatic symptoms scale.
Sl.no Level of Trauma experience(Part- A) No. of Trafficked Girls
& Women
Percentage
1 Extremly High Trauma Experience 6 3%
2 High Trauma Experience 14 7%
3 Above Average Trauma Experience 20 10%
4 Moderate/ Average Trauma Experience 80 40%
5 Below AverageTrauma Experience 40 20%
6 Low Trauma Experience 28 14%
7 Extremely Low Trauma Experience 12 6%
Above table showed that 40% of participants
had experience of moderate level of trauma,
Similarly 10% had experience of above
average level of trauma, and 7% had high level
of trauma, and 3% had extremely high level of
trauma Experience. This further denotes that
near about 60% had high level of trauma. On
the contrary, 20% of participant had
experience of below average level of trauma,
14% had experience of low level of trauma
and 6% had experience of extremely low level
of trauma. This further indicates that near
about 40% had low level of trauma. It further
indicates that majority of women suffer from
trauma experience. Here, the second
hypothesis ‗Tribal trafficked girls and women
have traumatic symptoms‘ is accepted

YEAR IV VOLUME IV .Jamshedpur Research Review. ISSUE XVII ISSN-2320-2750
JRR September –November 2016 23
Table-4: Performance of sample on traumatic symptoms scale
Sl.no Level of Trauma Consequences (Part-
B)
No. of Trafficked Girls
& Women
Percentage
1 Extremely High Negative
Consequences
5 2.5%
2 High Negative Consequences 13 6.5%
3 Above Average Negative Consequences 24 12%
4 Moderate/ Average Negative
Consequences
82 41%
5 Low Negative Consequences 40 20%
6 Very Low Negative Consequences 32 16%
7 No Negative Consequences 4 2%
Above table showed that 41% of participants
had experience of moderate negative
consequences of trauma, similarly 12% had
experience of above average level of negative
consequences, 6.5% had high level of negative
consequences, and 2.5% had extremely high
level of negative consequences. This further
denotes that near about 62% had experience of
negative consequences of trauma. On the
contrary, 20% of participant had experience of
low negative consequences of trauma, 16%
had experience of very low level of negative
consequences, and 2% had experience of no
negative consequences of trauma . This further
indicates that near about 38% had low level
of negative consequences. It further indicates
that majority of women suffer from negative
consequences of trauma.
Table-5: Performance of sample on ego strength scale
Options No. of persons Percentage(N=200)
Below cut-off 70 35%
Above cut-off 130 65%
Above table showed that 65% of participants
had low ego strength since they were above
cut off point. On the contrary, 35% of
participant was below cut off point although
they had high ego strength. It further indicates
that majority of women suffer from low ego
strength. Here, the third hypothesis ‗Tribal
trafficked girls and women will have low ego
strength is accepted.
Table 6:- Comparison of High and low groups on age & education variable with respect to
traumatic Experience. (part 1)
Groups Age
X2
df
P 18-28 yrs 29-40yrs
High
90 30
28.12
1
<0.01
Low
30 50
Groups Education
X2
df
P Illiterate Primary Above Primary
High 58 44 18
28.57
02
<0.01 low 22 18 40
It is evident from above table that the high and
low groups differ significantly on age variable.
The obtained chi-square value 28.12 is
significant at 0.01 level of significance. Data
showed that age range of 18-28(Group1) had
more traumatic experience than 29-

YEAR IV VOLUME IV .Jamshedpur Research Review. ISSUE XVII ISSN-2320-2750
JRR September –November 2016 24
40((Group2).Similarly both groups differ
significantly on education variable. The
obtained chi-square value 28.57 is significant
at 0.01 level of significance. Here illiterate
group had more traumatic experience,
followed by primary education group and least
by above primary group.
Table 8:- Comparison of High and low groups on age & education variable with respect to ego
strength.
Groups Age
X2
df
P 18-28 yrs 29-40yrs
High 90
40
13.18
1
<0.01
low 30 40
Groups Education
X2
df
P Illiterate Primary Above Primary
High 65 37 28
17.17
02
<0.01
low 15 25 30
Table showed that both groups differ
significantly (X2 13.18) on age variable. Data
showed that age range of 18-28 (Group1) had
more low ego strength than 29-
40((Group2).Similarly both groups differ
significantly (X2
17.17) on education variable.
Here illiterate group had more low ego
strength , followed by primary education
group and least by above primary group.
Conclusion Conclusion analysis showed that events of
trafficking made negative impact on ego
strength and trauma. It further indicates that
tribal trafficked girls and women had more
traumatic experience and negative
consequences as well as low ego strength.
High and low groups also differed
significantly on age and education variable.
Different level of socio economic strata was
also found responsible for tribal trafficking.
Limitations
Further research is suggested to make a
comparison with the normal population. A
Longitudinal study can be taken in this regard.
Personality dimensions of trafficked women
can be studied.
References:
1. Ali, S.N.(1975). Effect of stress on
level of aspiration as related to ego-
strength and rigidity. Unpublished
doctoral thesis, Aligarh Muslim
university, Aligarh.
2. American Psychiatric Association.
(2000). Diagnostic and statistical
manual of mental disorders (4th rev.
ed.). Washington, DC: Author.
3. Anti-Slavery International. (2005).
Protocol for identification and
assistance to trafficked persons and
training kit. London: Anti-Slavery
International.
4. Galea, S., Resnick, H. S., Ahern, J.,
Gold, J., Bucavlas, M., Kilpatrick, D.
G. , Vlahov, D. (2002). Posttraumatic
stress disorder in Manhattan, New
York City, after the September 11th
terrorist attacks. Journal of Urban
Health: Bulletin of the New York
Academy of Medicine, 79, 340–353.
5. IOM (International Organization for
Migration). (2002). Report of the
counter-trafficking unit: Return and
reintegration project. Brussels:
International Organization for
Migration.
6. Joseph, S., & Linley, P. A. (2006).
Growth following adversity:
Theoretical perspectives and
implications for clinical practice.
Clinical Psychology Review, 26,
1041–1053.
7. Maslow, A.H.(1954); Motivation and
Personality. New York, Harper.
YEAR IV VOLUME IV .Jamshedpur Research Review. ISSUE XVII ISSN-2320-2750
JRR September –November 2016 25
8. Norris, F. H., Friedman, M. J.,
Watson, P. J., Byrne, C. M., Diaz, E.,
& Kaniasty, K. (2002). 60,000 disaster
victims speak: Part 1. An empirical
review of the empirical literature,
1981–2001. Psychiatry, 65, 207–223.
9. The Times of India (2012): Optimism
and human trafficking. 13-5-12, May,
p.n.6
10. Va´zquez, C., Herva´s, G., & Ho,
S.M.Y. (2007). Intervenciones
clı´nicas basadas en la Psicologı´a
Positiva: Fundamentos y aplicaciones.
Psicologı´a Conductual, 13, 401_432.
11. Zoellner, T. M., & Maercker, A.
(2006). Posttraumatic growth in
clinical psychology: A critical review
and introduction of a two component
model. Clinical Psychology Review,
26, 626–653.
(Note: This Research report is a part of Minor Research Project financed by U.G.C.,E.R.O.,
Kolkata.)
YEAR IV VOLUME IV .Jamshedpur Research Review. ISSUE XVII ISSN-2320-2750
JRR September –November 2016 26
EMPOWERING WOMEN THROUGH SELF HELP GROUPS:
ISSUES & CHALLENGES Dr. Raksha Singh
Shri Shankaracharya Mahavidyalaya, Bhilai,
Pt. Ravishankar Shukla University, Raipur,
Chhattisgarh
Mrs. Rashmi Dewangan
Shri Shankaracharya Mahavidyalaya, Bhilai,
Pt. Ravishankar Shukla University, Raipur,
Chhattisgarh
___________________________________________________________________________
Abstract Swarnajayanti Gram SwarozgarYogna (SGSY) is a programme launched by Government of India
which encompasses for self-employment. The concept of Self Help Groups (SHG) is an important
revolution towards poverty alleviation and empowerment of women especially in the rural areas.With
SHG women will be empowered, or they will have to remain in house for household work. They are
not able to go outside to earn. SHG helps to start business in rural areas. The finance is provided with
very reasonable rate of interest and flexible repayment facilities. Poverty alleviation can be expected
by giving them easy loans and work opportunities. Women can work from home and earn a living
which ultimately will empower them. Thus participation of women in these groups contributes
significantly in improving their socioeconomic condition and changing their role in the society. This
paper is an attempt to describe the present status of self-help groups, their role in empowering rural
women, and challenges faced by the members of such group. This paper also highlights the coverage
of Self Help Groups in the state of Chhattisgarh and the challenges faced by rural women in becoming
member of such groups. Secondary sources of data have been used for the purpose of this study.
Keywords: Women Empowerment, Poverty Alleviation, Self Help Group (SHG), SGSY, Socio-
economic Status.
Introduction India is a country where a vast
majority of its population resides in rural areas
(72.18%, as per census 2011). The
socioeconomic status of rural residents is very
poor and condition of women is pathetic.
Women are suppressed miserably by the male
dominant society since ages. Hence for overall
development of the nation it is imperative to
uplift this section of the society. Several
policies were framed for the upliftment of
women, for providing them equal opportunity,
access to resources, right to education,
freedom for taking decisions, for improving
their financial status, for their recognition and
respect in society and the like. With the
continuous efforts and interventions of the
government and other social agencies the
status of women has improved considerably.
The formation of Self Help Group is one such
important measure undertaken by the
Government of India towards women
empowerment and poverty reduction. The
table below depicts the urban and rural poverty
ratio compared for two different time periods.
YEAR IV VOLUME IV .Jamshedpur Research Review. ISSUE XVII ISSN-2320-2750
JRR September –November 2016 27
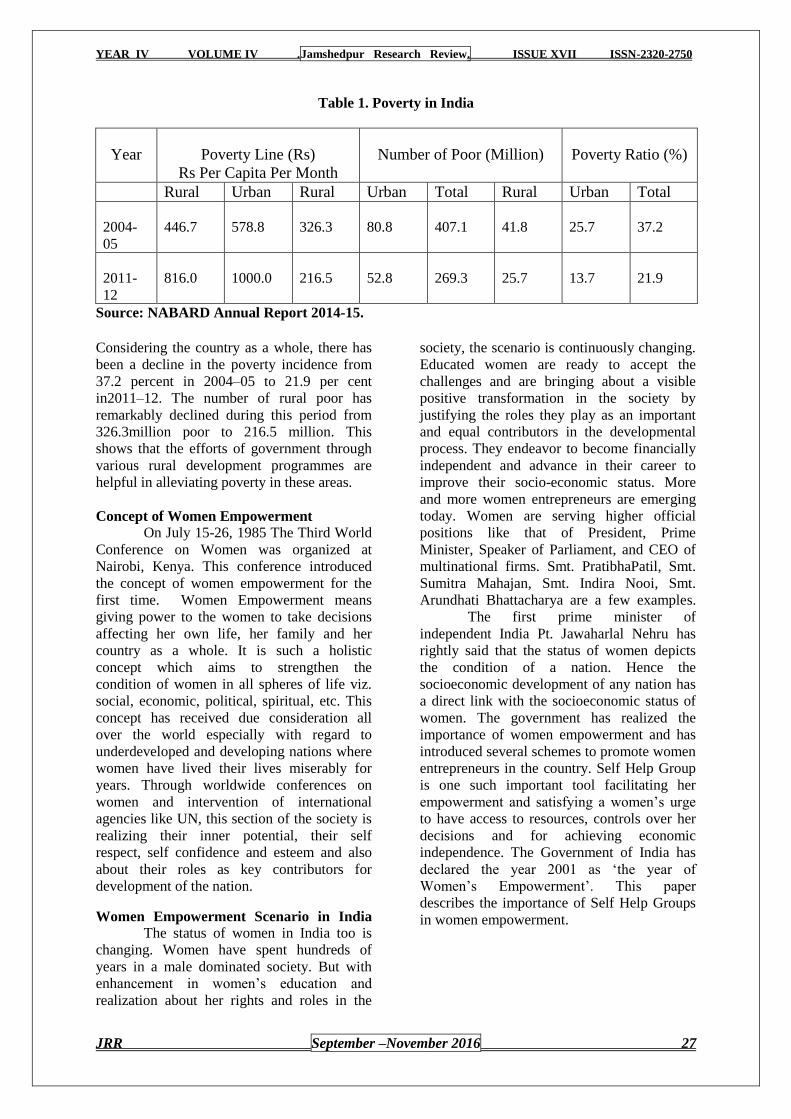
Table 1. Poverty in India
Year
Poverty Line (Rs)
Rs Per Capita Per Month
Number of Poor (Million)
Poverty Ratio (%)
Rural Urban Rural Urban Total Rural Urban Total
2004-
05
446.7
578.8
326.3
80.8
407.1
41.8
25.7
37.2
2011-
12
816.0
1000.0
216.5
52.8
269.3
25.7
13.7
21.9
Source: NABARD Annual Report 2014-15.
Considering the country as a whole, there has
been a decline in the poverty incidence from
37.2 percent in 2004–05 to 21.9 per cent
in2011–12. The number of rural poor has
remarkably declined during this period from
326.3million poor to 216.5 million. This
shows that the efforts of government through
various rural development programmes are
helpful in alleviating poverty in these areas.
Concept of Women Empowerment On July 15-26, 1985 The Third World
Conference on Women was organized at
Nairobi, Kenya. This conference introduced
the concept of women empowerment for the
first time. Women Empowerment means
giving power to the women to take decisions
affecting her own life, her family and her
country as a whole. It is such a holistic
concept which aims to strengthen the
condition of women in all spheres of life viz.
social, economic, political, spiritual, etc. This
concept has received due consideration all
over the world especially with regard to
underdeveloped and developing nations where
women have lived their lives miserably for
years. Through worldwide conferences on
women and intervention of international
agencies like UN, this section of the society is
realizing their inner potential, their self
respect, self confidence and esteem and also
about their roles as key contributors for
development of the nation.
Women Empowerment Scenario in India
The status of women in India too is
changing. Women have spent hundreds of
years in a male dominated society. But with
enhancement in women‘s education and
realization about her rights and roles in the
society, the scenario is continuously changing.
Educated women are ready to accept the
challenges and are bringing about a visible
positive transformation in the society by
justifying the roles they play as an important
and equal contributors in the developmental
process. They endeavor to become financially
independent and advance in their career to
improve their socio-economic status. More
and more women entrepreneurs are emerging
today. Women are serving higher official
positions like that of President, Prime
Minister, Speaker of Parliament, and CEO of
multinational firms. Smt. PratibhaPatil, Smt.
Sumitra Mahajan, Smt. Indira Nooi, Smt.
Arundhati Bhattacharya are a few examples.
The first prime minister of
independent India Pt. Jawaharlal Nehru has
rightly said that the status of women depicts
the condition of a nation. Hence the
socioeconomic development of any nation has
a direct link with the socioeconomic status of
women. The government has realized the
importance of women empowerment and has
introduced several schemes to promote women
entrepreneurs in the country. Self Help Group
is one such important tool facilitating her
empowerment and satisfying a women‘s urge
to have access to resources, controls over her
decisions and for achieving economic
independence. The Government of India has
declared the year 2001 as ‗the year of
Women‘s Empowerment‘. This paper
describes the importance of Self Help Groups
in women empowerment.

YEAR IV VOLUME IV .Jamshedpur Research Review. ISSUE XVII ISSN-2320-2750
JRR September –November 2016 28
Self Help Group promoting Women
Empowerment
As per the census of 2011 women
make up 48.46% of total populace of India.
These resources should be utilized optimally
for development of the nation in general and
her family in particular. Self Help Group plays
a vital role for the welfare and interest of
women particularly in rural and backward
areas. Abdul, 2007, describes Self Help
Groups as a viable structured arrangement that
helps to disburse micro credit to the rural
women and encourage them to take up
entrepreneurial activities. It is also an effective
way to achieve the rural development
objectives through community participation.
Recognizing this significant role of women in
poverty diminution, microfinance programs
and other livelihood support interventions
were started and implemented throughout the
world. Self Help Groups work as a catalyst for
bringing about a change in the status of
women socially and economically, raising
their self-confidence and self-assurance. It
stresses on group ownership, control and
management over activities having similar
objectives and outcomes. Mayoux, 1998
argues that the very process of making
decisions within the group is an empowering
process and can lead to broader development
outcomes such as the greater participation of
women in local governance and community
structures.
Self-help groups (SHGs) are small
voluntary group of people mostly women that
are more informal and homogenous, formed
with a reason, to support each other through
credit delivery system for socio-economic
empowerment. Generally the group consists of
10 to 12 members (but not more than 20,
otherwise then has to be registered under
Indian legal system) who want to improve
their livelihood by setting up their own
reserves and credit fund and taking up
developmental activities for income
generation.They are also known as mutual aid
or support groups. The members of the group
meet every week to collect their savings and to
give the loans to the needy ones. SHG
undeniably brings awareness, sense of
belongingness, self confidence and self-esteem
among women. In fact, what she cannot
achieve as an individual can accomplish as a
member of group with sufficient
understanding about her own rights, roles,
privileges and responsibilities as a dignified
member of society in par with man. Prof. Mohammed Yunus in 1975
founded Grameen Bank of Bangaladesh which
is pioneer in the origin of Self Help Groups
(SHGs) as a new approach to rural credit.
NABARD initiated SHGs in India in the year
1986-87. In the year 1991-92 SHGs were
linked with the banks. Two decades hence the
SHG-Bank Linkage Programme (SHG-BLP)
continues to be the foundation of the Indian
microfinance scene with 74 lakh SHGs
covering over 10 crore households saving with
the formal banking system with savings
balance of over Rs. 7, 000 crore as on 31
March 2011. About 49 lakh of these SHGs
have also accessed bank credit and have over
Rs 31,000 crore as outstanding credit from the
banking system. In other words, the SHG-BLP
has so far been the most preferred and viable
model for financial inclusion of the hitherto
unreached poor.
SHG model in India
Model I- SHGs Formed by NGOs & Other
Agencies but Financed by Banks (72%)
Model II- SHGs Formed and Financed by
Banks (20%)
Model III- Banks Finance SHGs with
NGOs & Other Agencies as Financial
Intermediaries (8%)
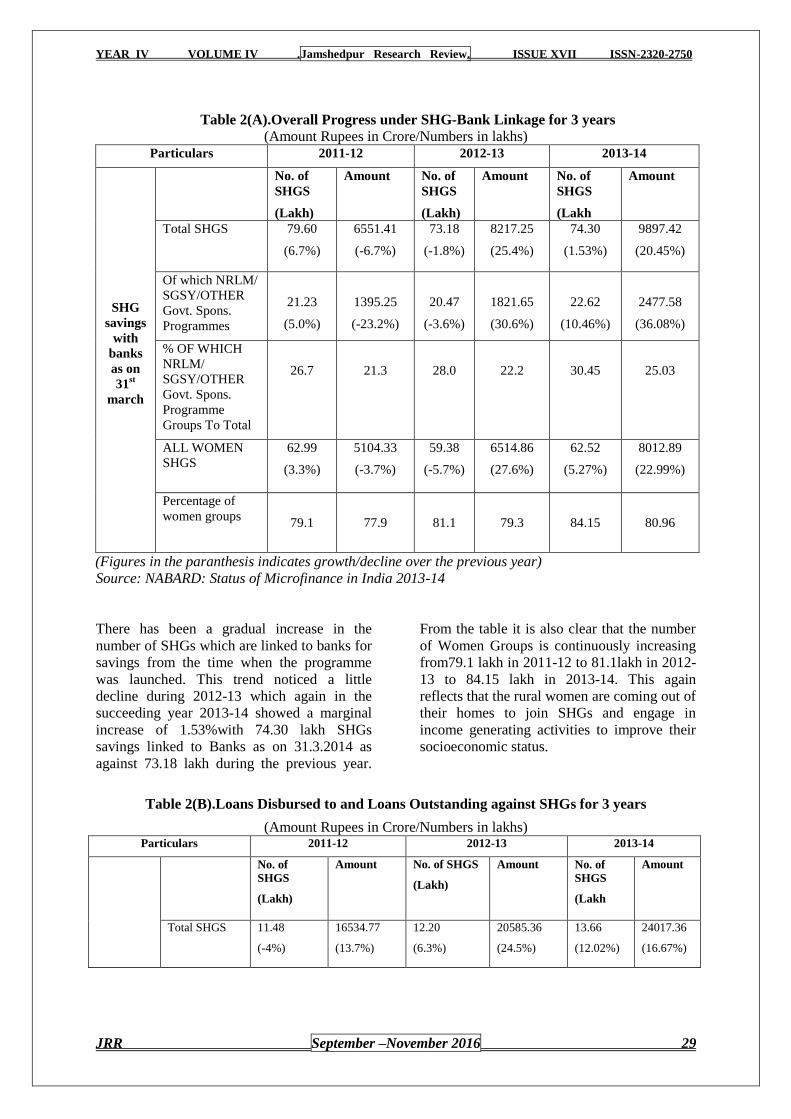
YEAR IV VOLUME IV .Jamshedpur Research Review. ISSUE XVII ISSN-2320-2750
JRR September –November 2016 29
Table 2(A).Overall Progress under SHG-Bank Linkage for 3 years
(Amount Rupees in Crore/Numbers in lakhs) Particulars 2011-12 2012-13 2013-14
SHG
savings
with
banks
as on
31st
march
No. of
SHGS
(Lakh)
Amount No. of
SHGS
(Lakh)
Amount No. of
SHGS
(Lakh
Amount
Total SHGS 79.60
(6.7%)
6551.41
(-6.7%)
73.18
(-1.8%)
8217.25
(25.4%)
74.30
(1.53%)
9897.42
(20.45%)
Of which NRLM/
SGSY/OTHER
Govt. Spons.
Programmes
21.23
(5.0%)
1395.25
(-23.2%)
20.47
(-3.6%)
1821.65
(30.6%)
22.62
(10.46%)
2477.58
(36.08%)
% OF WHICH
NRLM/
SGSY/OTHER
Govt. Spons.
Programme
Groups To Total
26.7
21.3
28.0
22.2
30.45
25.03
ALL WOMEN
SHGS
62.99
(3.3%)
5104.33
(-3.7%)
59.38
(-5.7%)
6514.86
(27.6%)
62.52
(5.27%)
8012.89
(22.99%)
Percentage of
women groups
79.1
77.9
81.1
79.3
84.15
80.96
(Figures in the paranthesis indicates growth/decline over the previous year)
Source: NABARD: Status of Microfinance in India 2013-14
There has been a gradual increase in the
number of SHGs which are linked to banks for
savings from the time when the programme
was launched. This trend noticed a little
decline during 2012-13 which again in the
succeeding year 2013-14 showed a marginal
increase of 1.53%with 74.30 lakh SHGs
savings linked to Banks as on 31.3.2014 as
against 73.18 lakh during the previous year.
From the table it is also clear that the number
of Women Groups is continuously increasing
from79.1 lakh in 2011-12 to 81.1lakh in 2012-
13 to 84.15 lakh in 2013-14. This again
reflects that the rural women are coming out of
their homes to join SHGs and engage in
income generating activities to improve their
socioeconomic status.
Table 2(B).Loans Disbursed to and Loans Outstanding against SHGs for 3 years
(Amount Rupees in Crore/Numbers in lakhs) Particulars 2011-12 2012-13 2013-14
No. of
SHGS
(Lakh)
Amount No. of SHGS
(Lakh)
Amount No. of
SHGS
(Lakh
Amount
Total SHGS 11.48
(-4%)
16534.77
(13.7%)
12.20
(6.3%)
20585.36
(24.5%)
13.66
(12.02%)
24017.36
(16.67%)
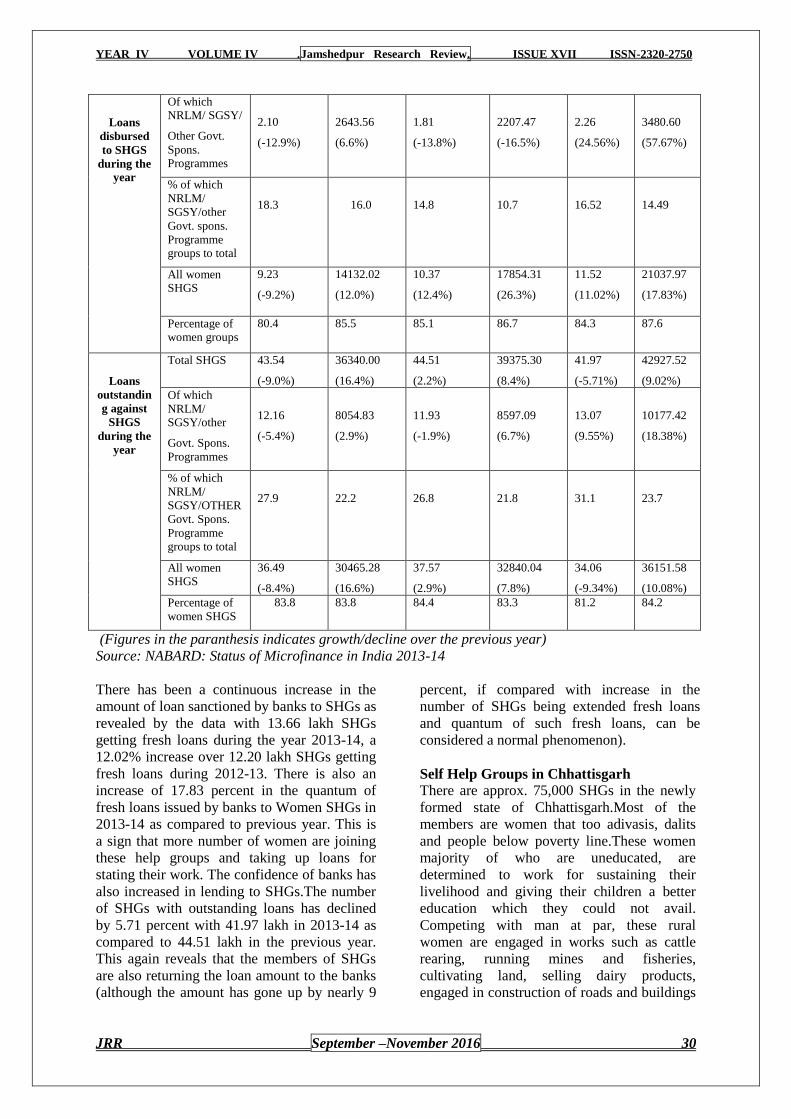
YEAR IV VOLUME IV .Jamshedpur Research Review. ISSUE XVII ISSN-2320-2750
JRR September –November 2016 30
Loans
disbursed
to SHGS
during the
year
Of which NRLM/ SGSY/
Other Govt.
Spons. Programmes
2.10
(-12.9%)
2643.56
(6.6%)
1.81
(-13.8%)
2207.47
(-16.5%)
2.26
(24.56%)
3480.60
(57.67%)
% of which
NRLM/
SGSY/other
Govt. spons.
Programme groups to total
18.3
16.0
14.8
10.7
16.52
14.49
All women SHGS
9.23
(-9.2%)
14132.02
(12.0%)
10.37
(12.4%)
17854.31
(26.3%)
11.52
(11.02%)
21037.97
(17.83%)
Percentage of women groups
80.4
85.5 85.1 86.7 84.3 87.6
Loans
outstandin
g against
SHGS
during the
year
Total SHGS 43.54
(-9.0%)
36340.00
(16.4%)
44.51
(2.2%)
39375.30
(8.4%)
41.97
(-5.71%)
42927.52
(9.02%)
Of which
NRLM/ SGSY/other
Govt. Spons.
Programmes
12.16
(-5.4%)
8054.83
(2.9%)
11.93
(-1.9%)
8597.09
(6.7%)
13.07
(9.55%)
10177.42
(18.38%)
% of which
NRLM/
SGSY/OTHER
Govt. Spons.
Programme groups to total
27.9
22.2
26.8
21.8
31.1
23.7
All women SHGS
36.49
(-8.4%)
30465.28
(16.6%)
37.57
(2.9%)
32840.04
(7.8%)
34.06
(-9.34%)
36151.58
(10.08%)
Percentage of
women SHGS
83.8 83.8 84.4 83.3 81.2 84.2
(Figures in the paranthesis indicates growth/decline over the previous year)
Source: NABARD: Status of Microfinance in India 2013-14
There has been a continuous increase in the
amount of loan sanctioned by banks to SHGs as
revealed by the data with 13.66 lakh SHGs
getting fresh loans during the year 2013-14, a
12.02% increase over 12.20 lakh SHGs getting
fresh loans during 2012-13. There is also an
increase of 17.83 percent in the quantum of
fresh loans issued by banks to Women SHGs in
2013-14 as compared to previous year. This is
a sign that more number of women are joining
these help groups and taking up loans for
stating their work. The confidence of banks has
also increased in lending to SHGs.The number
of SHGs with outstanding loans has declined
by 5.71 percent with 41.97 lakh in 2013-14 as
compared to 44.51 lakh in the previous year.
This again reveals that the members of SHGs
are also returning the loan amount to the banks
(although the amount has gone up by nearly 9
percent, if compared with increase in the
number of SHGs being extended fresh loans
and quantum of such fresh loans, can be
considered a normal phenomenon).
Self Help Groups in Chhattisgarh
There are approx. 75,000 SHGs in the newly
formed state of Chhattisgarh.Most of the
members are women that too adivasis, dalits
and people below poverty line.These women
majority of who are uneducated, are
determined to work for sustaining their
livelihood and giving their children a better
education which they could not avail.
Competing with man at par, these rural
women are engaged in works such as cattle
rearing, running mines and fisheries,
cultivating land, selling dairy products,
engaged in construction of roads and buildings
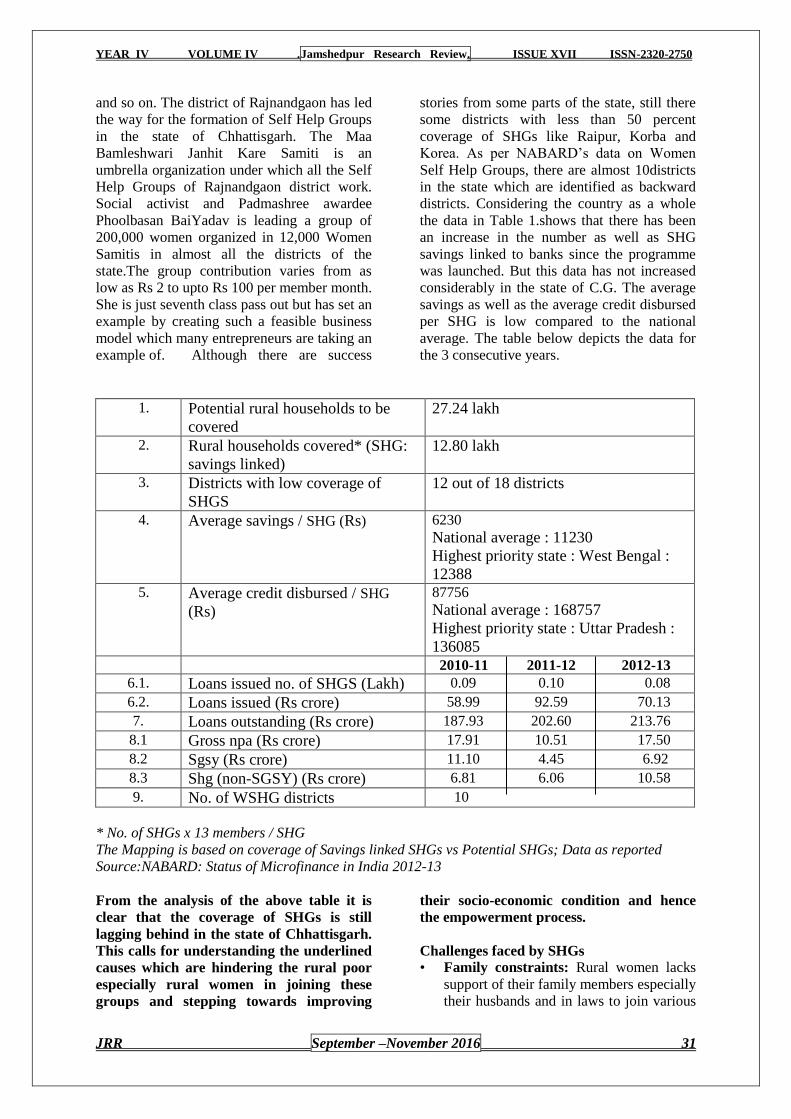
YEAR IV VOLUME IV .Jamshedpur Research Review. ISSUE XVII ISSN-2320-2750
JRR September –November 2016 31
and so on. The district of Rajnandgaon has led
the way for the formation of Self Help Groups
in the state of Chhattisgarh. The Maa
Bamleshwari Janhit Kare Samiti is an
umbrella organization under which all the Self
Help Groups of Rajnandgaon district work.
Social activist and Padmashree awardee
Phoolbasan BaiYadav is leading a group of
200,000 women organized in 12,000 Women
Samitis in almost all the districts of the
state.The group contribution varies from as
low as Rs 2 to upto Rs 100 per member month.
She is just seventh class pass out but has set an
example by creating such a feasible business
model which many entrepreneurs are taking an
example of. Although there are success
stories from some parts of the state, still there
some districts with less than 50 percent
coverage of SHGs like Raipur, Korba and
Korea. As per NABARD‘s data on Women
Self Help Groups, there are almost 10districts
in the state which are identified as backward
districts. Considering the country as a whole
the data in Table 1.shows that there has been
an increase in the number as well as SHG
savings linked to banks since the programme
was launched. But this data has not increased
considerably in the state of C.G. The average
savings as well as the average credit disbursed
per SHG is low compared to the national
average. The table below depicts the data for
the 3 consecutive years.
1. Potential rural households to be
covered
27.24 lakh
2. Rural households covered* (SHG:
savings linked)
12.80 lakh
3. Districts with low coverage of
SHGS
12 out of 18 districts
4. Average savings / SHG (Rs) 6230
National average : 11230
Highest priority state : West Bengal :
12388
5. Average credit disbursed / SHG
(Rs)
87756
National average : 168757
Highest priority state : Uttar Pradesh :
136085
2010-11 2011-12 2012-13
6.1. Loans issued no. of SHGS (Lakh) 0.09 0.10 0.08
6.2. Loans issued (Rs crore) 58.99 92.59 70.13
7. Loans outstanding (Rs crore) 187.93 202.60 213.76
8.1 Gross npa (Rs crore) 17.91 10.51 17.50
8.2 Sgsy (Rs crore) 11.10 4.45 6.92
8.3 Shg (non-SGSY) (Rs crore) 6.81 6.06 10.58
9. No. of WSHG districts 10
* No. of SHGs x 13 members / SHG
The Mapping is based on coverage of Savings linked SHGs vs Potential SHGs; Data as reported
Source:NABARD: Status of Microfinance in India 2012-13
From the analysis of the above table it is
clear that the coverage of SHGs is still
lagging behind in the state of Chhattisgarh.
This calls for understanding the underlined
causes which are hindering the rural poor
especially rural women in joining these
groups and stepping towards improving
their socio-economic condition and hence
the empowerment process.
Challenges faced by SHGs
• Family constraints: Rural women lacks
support of their family members especially
their husbands and in laws to join various

YEAR IV VOLUME IV .Jamshedpur Research Review. ISSUE XVII ISSN-2320-2750
JRR September –November 2016 32
SHGs. Looking after the children, cooking
food and taking care of other household
affairs is considered to be the primary
responsibility of women. Therefore
women do not get enough support from
family to enter into business activities.
The main reason behind this is lack of
education and resistance to change among
the rural population.
• Social Taboo: The constitution of our
country speaks of equality of gender. But a
large section of the society is still
dominated by male member of the family.
He takes all the decisions for women. This
section of society does not give respect to
women who go out to take up economic
activities, to attend training programmes
or participate in group meetings.
• Lack of conveyance facilities: Many a
times the banks are located at far places
from the village. This distance and lack of
proper transport facility creates a big
problem for the self help group women.
They have to cover the distance by
walking which wastes time and affects
their daily work and wages. The problem
increases many folds in case of pregnant
women and old ladies.
• Indifferent attitude of Bankers: There is
apprehension among the bankers whether
the women of self-help groups taking the
loans will be able to return it or not. They
are doubtful whether the members will be
successful in taking up and sustaining
income generating activities. Due to this
reason the bankers hesitate to give loan to
the women members easily. Therefore
women have to visit the banks again and
again to get their loans sanctioned. A lot
of time is wasted in processing of the
applications and disbursement of loans.
• Defaulters in the family: Banks play a
vital role in forming and encouraging the
SHGs to initiate entrepreneurial activities.
Some banks realize this important role of
theirs and always welcome women to
provide with loan and other banking
facilities. But there are women whose
family members have taken loan in the
past and did not return it. Their names are
listed as defaulters with the banks. This
creates problem for women in opening up
of accounts in the bank.
• Lack of awareness: The members of the
self help groups are not fully aware about
the different governmental schemes and
programmes implemented for them and
how they can derive its benefits. Ignorance
on their part results in failure of the
ultimate objective of such programmes.
• Lack of training and capacity building: The members of SHGs lack training in
basic skills and other capacity building
activities needed to start any
entrepreneurial work. They often lack
motivation and leadership qualities to face
the prevailing challenges and gain victory
over them. They also face difficulty in
maintaining proper records such as
accounts book, loan register, attendance
record, pass book etc. Even the office
bearers and other members of the group
who have received training does not
consider it sufficient and feel the need for
attending more training
programmes.Emphasis is to be given to
provide training in the field of accounting,
marketing, entrepreneurship, team
building, personality development, role
and responsibility of and such other topics.
• Lack of adequate marketing
facilities:The SHG members market and
sell their products through melas or
exhibitions organized by DRDA at district
and block level every six monthly. The
members get very limited opportunity to
market their products. There is a need to
explore more markets for their products.
Also the members should be trained in
areas like product designing, packaging,
labeling etc so that their products appear
more attractive and arouse interest in
customers.
Conclusion
Self Help Group plays a significant
role in changing the way women live in
the society. It is indeed the most feasible
option to help improve the socioeconomic
status of rural women. In a developing
country like India it becomes imperative to
develop this poor and downtrodden
section of the nation in order to cope with
the pace of development. SHG helps
women to become independent by
acquiring employability skills, gaining
access to self-employment and
YEAR IV VOLUME IV .Jamshedpur Research Review. ISSUE XVII ISSN-2320-2750
JRR September –November 2016 33
entrepreneurship, and thus provides them
an opportunity to earn their livelihood on a
sustainable basis. Promotion and
formation of SHG is an important tool to
women empowerment in India. The key
towards success of these effort lies in
overcoming the challenges involved in
forming and sustaining these groups,
training them in various field like
accounting, administration, marketing,
raising awareness and literacy level and
monitoring their progress. Author believes
that if proper awareness is spread and
women are strongly motivated then our
45% population, of which at present only
6-7% are employed, will come forward
and start taking up works which will
definitely raise their earning capacity.
Given proper financial support, along with
required knowledge, skills and training in
income generating activities, the rural poor
have abilities to utilize labor and capital in
a better way and contribute in economic
growth by emerging as micro
entrepreneurs.
References
1. Hegde, D. N. Empowerment of Rural
Women through Self Help Groups-
Experience of BAIF. BAIF
Development Research Foundation.
2. Mishra, S. (n.d.). Self Help Group:
Change Agent for Rural Women
Empowerment and Entrepreneurship
Development in Rural Odisha.
3. Narang, D. U. (n.d.). Self Help Group:
An Effective Approach to Women
Empowerment in India.
4. Panwar, D. M. (January 2015).
Challenges in Sustaining Self Help
Groups of Rural Women- A Case
Study of Haryana. XVI Annual
Conference Proceedings, (p. 512).
5. S. Thangamani, S. M. (2013). A Study
on Women Empowerment through
Self Help Groups with special
reference to Mettupalayam Taluk in
Coimbatore District. IOSR Journal of
Business and Management , 17-24.
6. Sahoo, D. A. (2013). Self Help Group
& Women Empowerment: A Study on
Some Selected SHGs. International
Journal of Business and Mangement
Invention , 54-61.
7. Singh, R. (2012). Women
Entrepreneurship Issues, Challenges
and Empowerment through Self Help
Groups: An Overview of Himachal
Pradesh. International Journal of
Democratic and Developmental
Studies , 45-58.
8. https://www.nabard.org/english/home.
aspx
9. Http://www.merinews.com/article/pho
olbasan-bai-yadav-a-social-
entrepreneur-leading-the-women-
brigade-in-
chhattisgarh/15868066.shtml#sthash.s
wre045q.dpuf
YEAR IV VOLUME IV .Jamshedpur Research Review. ISSUE XVII ISSN-2320-2750
JRR September –November 2016 34
RECENT SCENARIO OF ECONOMIC JUSTICE IN THE
INDIAN SOCIETY: A CRITICAL ANALYSIS
Dr. Jayanta Kumar Dab
Assistant Professor of political Science, Tamralipta Mahavidyalaya
Purba Medinipur, West Bengal, Pin.- 721636
Abstract
Economic justice denotes non-discrimination between people with regard to economic factor. It
involves the elimination of glaring inequalities in wealth, income and property. Over the years, the
provisioning of economic justice to the people of India vis-à-vis the nations of equivalent stature has
not been upto the mark. In today‘s India, policies and politics of economic justice have reached a deed
end. In 2013, comparison of data on household spending patterns for 1999-2000 and 2011-12 collected
by the NSSO showed that income disparity is growing and at a rapid space. Every third poor person
and every second malnourished child in the world is an Indian. Despite economic reforms in the early
1990s, India continues to struggle with poverty, poor infrastructure and economic inequality. A
primary manifestation of the insignificant decline in the incidence of poverty is reflected in the rising
level of under-nourishment, child under-weight and child-mortality rate. Recent data for 2015 showed
that the total proportion of under-weight children in India is 29.4% and stunted children are 38%. The
incidences of diseases are very high in rural areas leading to high mortality rate. Recent data showed
that approximately 2 million expired, due to preventable causes such as diarrhea, dengue, typhoid, and
malaria. More than 70% of children under the age of 5 suffer from anemia and 80% of them don‘t get
vitamin supplements. Another vital social parameter where gross inequality occurred is in the
education sector. Every third illiterate person in the world comprises an Indian. Approximately 200
women died for every one lakh childbirth as per latest report. In 2010, the UN recorded one maternal
death at childbirth every ten minutes in India, with a maternal mortality rate higher than that of Sudan,
Ethiopia and Bangladesh.
Introduction
Classical moral philosophy, since the
time of the Greek Philosopher Plato, talked of
four ‗cardinal virtues‘ considered being the
basic essential for a virtuous life. These are
‗Predence‘ defining our ability to judge
amongst actions and identifying appropriate
actions to be implemented at a given time.
‗Justice‘ implying ‗fairness‘, that render
amongst individuals, his/her rights in a
perpetual and constant manner. ‗Temperance‘
or ‗restraint‘ defining the practice of self-
control, abstention, and moderation amongst
all individuals and finally ‗Courage‘ meaning
fortitude, strength, forbearance, endurance,
and the ability to confront fear, uncertainty,
and intimidation. It is noted that virtues or
‗good habits‘ help individuals to develop fully
their human potentials, thus enabling them to
serve their own self- interests as well as work
in harmony with others for their common
good. The ultimate purpose of all the virtues is
to elevate the dignity and sovereignty of the
human person.
Amongst these four virtues, that of
justice has been the most frequently praised
and quoted one in the Sacred Scriptures. All
the Ten Commandments are concerned with
justice. Moreover, the popularity of ‗justice‘
stems from its ubiquitous presence in all the
classes and divisions of society, unlike the
others each of which is specified for a
particular class. Looking at justice from a
practical and present day perspective, one can
define it as a set of universal principles
providing guidance to people in their
judgement for what is right and what is wrong,
irrespective of the culture and society they live
in. Again, for justice to prevail, the moral
principles that guide the economic institutions,
considered indispensable for sustenance of the
basic minimum subsistence of a human being
have to be ensured. These moral principles
form the crux of economic justice.
YEAR IV VOLUME IV .Jamshedpur Research Review. ISSUE XVII ISSN-2320-2750
JRR September –November 2016 35
Economic justice, which touches the
individual person as well as the social order,
encompasses the moral principles which guide
us in designing our economic institutions.
These institutions determine how each person
earns a living, enters into contracts ,
exchanges goods and services with others and
otherwise produces and independent material
foundation for his or her economic sustenance.
Economic justice denotes non-discrimination
between people with regard to economic
factors. It involves the elimination of glaring
inequalities in wealth, income and property.
The ultimate purpose of economic justice is to
free each person to engage creatively in the
unlimited work beyond economics, that of the
mind and the sprit.
In India, ‗Economic Justice‘ has been
one of the foremost objectives of the Indian
Constitution with the Preamble and the
Directive Principles of State Policy frame-
working its domain. While the Preamble talks
of securing economic justice for all the
citizens of India, the means or the tools for
securing the same lie with the Directive
Principle of State Policy. In common parlance,
what is brought out by the Constitution
through economic justice is to ensure equality
of status and making life worth living at its
best besides removing inequality of
opportunities and of status – social, economic
and political. However, over the years, the
provisioning of economic justice to the people
of India vis-a-vis the nations of equivalent
stature has not been up to the mark.
Section – I
Economic Justice: Theoretical Perspective
and Basic Principles
From a theoretical perspective,
Economic Justice encompasses both a set
value and the policies utilized for furthering
those values. Hence, the sole focus of
economic justice is to enhance the welfare of
individuals, groups and nations within the
realm of national, international apart from
intra and inter-generational contexts.
However, in such activities, the domain of
economic justice is liable to get narrowed
down to conceptualizing of an intuition or of
an issue of distribution of resources, including
endowments.
From a functional perspective, the
system of economic justice comprises input
and output, with a feedback mechanism for
restoring harmony or balance between input
and output. For effectuation of such a system,
the requisite framework or interdependent
principles within the system of economic
justice as defined by Louis Kelso and
Mortimer Adler, are primarily of three types :
Participative Justice (the input principle) ,
Distributive Justice (the output principle),and
Social Justice (the feedback principle). Like
the legs of a three-legged stool, if any of these
principles is weakened or missing, the system
of economic justice will collapse.
I. Participative Justice: Through
‗Participative Justice‘, the process of
provisioning ‗input‘ to the economic
process in order to make a living is
ensured. It requires equal opportunity in
gaining access to private property in
productive assets as well as equality of
opportunity to engage in productive
work. Though the principle of
participation does not guarantee equal
results, it ensures for each individual
within the society, equality of human
rights so as to make a productive
contribution to the economy, both
through one‘s labour ( as a worker) and
one‘s productive capital (as an owner).
Thus, this principle rejects monopolies,
special privileges, and other exclusionary
social barriers to economic self-reliance.
II. Distributive Justice: Distributive Justice
ensures the distribution of ‗output‘ of an
economic system in accordance with the
labour and capital inputs of every person.
The principle of distributive justice
ensures the sanctity of property and
contracts. However, in doing so, the free
and open marketplace, not government,
is given credence for determining the just
price, the just wage and the just profit. In
ensuring the distributive justice of private
property within a free and open
marketplace, its lineage with
participative justice gets established.
Many confuse the distributive principles
of justice with those of charity. Charity
involves the concept ―to each according
to his needs‖, whereas distributive justice
is based on the idea ―to each according
to his contribution‖. However, the system
YEAR IV VOLUME IV .Jamshedpur Research Review. ISSUE XVII ISSN-2320-2750
JRR September –November 2016 36
of distributive justice breaks down when
all persons are not given equal
opportunity to acquire and enjoy the
fruits of income-producing property.
III. Social Justice: Social Justice is the
‗feedback‘ principle for detecting any
distortions of the input and/or output and
guiding the corrective stance needed to
restore a just and balanced economic
order for all. This principle is violated by
unjust barriers to participation, by
monopolies or by some using their
property to harm or exploit others.
Moreover, social justice offers guidelines
for controlling monopolies, building
check and balances within social
institutions. It is noted that the first two
principles of economic justice flow from
the eternal human search for justice in
general, which automatically requires a
balance between input and outtake, i.e.
―to each according to what he is due‖.
Social Justice , on the other hand, reflects
the human striving for other universal
values such as Truth, Love and Beauty .
It compels people to look beyond what is,
to what ought to be, and continually
repair and improve their systems for the
good of every person.
In Indian context, Social Justice
means availability of equal social
opportunities for the development of all the
people in society, without any discrimination
on the basis of caste, sex or race. No one
should be deprived, by these differences, those
social conditions that are essential for social
development. The issue of social justice is
associated with social equality and at the time
of independence, our Constitution makers
were highly influenced by the ideas of social
equality and social justice. For the same
reason, they incorporated the words Socialist,
Secular, Democratic, and Republic in the
Preamble. However, Social Justice denotes the
equal treatment of all citizens without any
social distinction. It means absence of
privilege being extended to any particular
section of society, and improvement in the
conditions of backward classes(SCs, STs and
OBCs) and women. A combination of Social
Justice and economic justice constitutes what
is known as distributive justice. Thus, all
three forms of justice guarantee the system of
economic justice. Hence, collapse of one leads
to total breakdown of the entire system.
Section – II
Economic Justice: The Indian Perspective
Ensuring ‗Economic Justice‘ to the
citizens of India has been one of the foremost
objectives of the Indian Constitution with the
Preamble and the Directive Principles of State
Policy frame-working its domain. When
Indian society seeks to meet the challenge of
socio-economic inequality by its legislation
and with the assistance of the rule of law, it
seeks to achieve economic justice without any
violent conflict. It also means that if any group
in society has suffered from structural
inequalities inherent in the social system,
special care should be taken to remove such
structural inequalities. The preamble and
various provisions of the Constitution of India
ensure to all citizens justice – social, economic
and political. But, in today‘s India, policies
and politics of economic justice have reached
a dead end. However, examination of the
impact of equality in contemporary India
revealed gross and astonishingly ‗long‘
preserved inequalities than in any other parts
of the world. A look at inequality from
different angles validates the point.
Prevalence of Stark Income Inequality:
India is a well-established middle-
income country in terms of its gross GDP: at
US $ 1.95 trillion in 2012, India is the tenth
richest country in the world. According to a
2011 report published by the Organization for
Economic Cooperation and Development
(OECD), income inequality has doubled in
India since the early 1990s. The richest 10 per
cent of Indians earn approximately 12 times as
much money as the poorest 10 per cent,
compared to roughly six times in 1990.
Interestingly, India‘s economy is one of the
fastest growing emerging economies of any
newly industrialized nation in the world, but
other countries have made significantly more
progress in addressing income inequality.
While Brazil, Indonesia and Argentina have
recorded significant decline in inequality over
the past 20 years, India along with China, the
Russian Federation and South Africa failed to
keep up with the momentum. According to the
YEAR IV VOLUME IV .Jamshedpur Research Review. ISSUE XVII ISSN-2320-2750
JRR September –November 2016 37
International Monetary Fund (IMF), in a 15
years span, there had been a 12 fold-rise in the
net worth of India‘s billionaire community.
The statistics is significant taking the fact that
if such rise in wealth of the billionaires were
allowed to allocate, a complete elimination of
absolute poverty could have occurred.
In 2013, comparison of data on
household spending patterns for 1999-2000
and 2011-12 collected by the National Sample
Survey Organization (NSSO) showed that
income disparity is growing and at a rapid
pace. Spending and consumption by the
richest 5% zoomed up by over 60% between
2000 and 2012 in rural areas while the poorest
5% saw an increase of just 30%. In urban
areas, the spending of the richest segment
increased by 63% while the poorest saw an
increase of 33%. The effect of inflation was
removed while making these comparisons. As
a result of such income disparity, India‘s Gini
coefficient, the official measure of income
inequality, rose from 0.32 to 0.38, with 0
being the ideal score during the same period.
According to the Forbes list of
billionaires 55 Indians figure in the list.
Amongst them, the estimated net worth of the
top ten amounts to $102.1 billion which is
equivalent to 5.5 per cent of India‘s gross
domestic product. Paradoxically, every third
poor person and every second malnourished
child in the world is also an Indian.
Skyrocketing Incidence of Poverty:
India is the world‘s largest democracy,
with a population of more than 1.2 billion
people. India‘s income per capita ranks at 149
in the world, and the country is home to the
largest number of poor in the world. Using the
most parsimonious definition of the poverty
line, there are at least 300 million extreme
poor in India (living on less than a dollar a
day), and more than 500 million if a broader
definition of the poverty line is used. Despite
making substantial financial gains since the
introduction of market-based economic
reforms in the early 1990s, India continues to
struggle with poverty, poor infrastructure and
economic inequality. However, as a result of
widening income inequality, the ability of the
poorest to come out of the vortex of poverty
declined significantly. Thus, for the major
section of the population in the lower
economic strata, the concept of a ‗meaningful
life‘ worth living, as inscribed in the
Constitution remained a distant dream. As on
2010, an estimated 29.8% of Indians lived
below the poverty line as per the world Bank‘s
standard of survival on less than $ 1.25 a day
(Rs. 56 a day or Rs. 1,680 a month). As per
the World Bank and McKinsey Global
Institute analysis on the trend in the incidence
of poverty of ‗poverty stricken‘ nations, over a
period from 1981 to 2010, Indian population
surviving on less than $ 1.25 a day declined by
a meagre 35 million(8%) against 678 million
(81%) for China. Such a decline is considered
insignificant given the fact that between the
same period, the population growth of India
had not at all been moderate. Between 1981
and 1991, the average annual exponential rate
of population growth was estimated at about
2.16 per cent that fell slightly to 1.97 per cent
in the next decade (1991 to 2001) and
thereafter, to 1.64 per cent in the decade 2001-
2011. A primary manifestation of the
insignificant decline in the incidence of
poverty is reflected in the rising level of
under-nourishment, child under-weight and
child-mortality rate. Global Hunger Index
(GHI) by International Food Policy Research
Institute combines these three equally
weighted indicators into one index. In 2011,
India was placed 73 rd out of 88 countries
listed in the annual Global Hunger Index,
twenty one places down from 2009 and six
places down from 2010, indicating decline in
all the three mentioned parameters. Another
index, Multi-dimensional Poverty Index (MPI)
developed for the Human Development
Report of the United Nations measures the
multiple deprivations that a poor person faces
with respect to education, health and living
standards, as a result of poverty. The Multi-
dimensional Poverty Index (MPI) for 2013
places India uncomfortably above 29 nations,
most considered dwarfs vis-a-vis India, from
an economic angle. It also put India‘s poverty
headcount ratio at 54%, higher than that of
Bangladesh and Nepal. The downswing of the
mentioned parameters assumes weight, taken
the fact that in the same phase, the economic
parameters of India moved upward. India and
China doubled output per capita in less than
20 years, at a scale the UNDP said was
‗unprecedented in speed and scale‘ and ‗never
in history have the living conditions and
prospects of so many people changed so
YEAR IV VOLUME IV .Jamshedpur Research Review. ISSUE XVII ISSN-2320-2750
JRR September –November 2016 38
dramatically as so fast‘. A country-wrise
comparison showed Britain to have taken 150
years to achieve the same growth from the
time, when the seeds were sown during the
industrial Revolution and United States taking
50 years.
Section –III
Inequality and Social Development:
A glimpse of the inequality prevalent
in Indian society can be had from the Social
Progress Index (SPI). It measures the social
progress made by countries on the basis of
three aspects – basic human needs,
foundations of well-being, and opportunity. In
2014, India‘s rank was 102nd among 132
countries on the SPI scale. Furthermore, all
the three aspects of SPI showed low grades
over a 100 point scale. On basic human needs
dimension, e.g., shelter, India‘s count was
39.77, on access to information in the
foundations of well-being dimension, India‘s
score is 39.87 while in tolerance and inclusion
in the opportunity dimension, it is 21.54.
Examination of specific parameters of
social progress revealed the same trend. A
primary indicator, development of health care
status in India and its level of accessibility
brought forth a dismal state. Analyzing
healthcare data between the period 1995 –
2000, the Human Development Report 2002
brought out by UNDP found that lower than
50% of the population has access to essential
drugs, 31% do not have access to adequate
sanitation facilities. According to data from
UNICEF, 28% of Indian children born
between 2006 and 2010 were under-weight at
birth, and approximately 48% of our children
under the age of 5 were affected by moderate
to severe growth stunting as a result of
malnutrition. Recent available data for 2015
showed that India‘s worst performing states
regarding malnutrition among children are UP
(35%), Bihar(37%), Jharkhand(42%),
Odisha(34%), Chhattisgarh(34%) , Gujarat
(34%), and Madhya Pradesh (36%).
Surprisingly, malnutrition in the state of
Gujarat, one of the richest states, is worse than
the average level of malnutrition in sub-
Saharan Africa. And, infant mortality as a
result of malnutrition in the state of Madhya
Pradesh, one of the poorest states, is higher
than in Senegal or Eritrea. The total proportion
of under-weight children in India is 29.4%. On
the other hand, stunting among children in the
states are UP(51%), Bihar(49%),
Jharkhand(47%), Assam(41%), Gujarat(42%),
Chhattisgarh(43%) and Madhya
Pradesh(42%). The total proportion of stunted
children in India is 38.7%. According to the
health minister‘s figures, every second child in
the country is stunted. These deficiencies
arose as a result of declining expenditure on
healthcare facilities by the government
coupled with extremely low medical insurance
penetration (around 11%). In 2007-08, public
medical expenditure was 0.9% of India‘s
GDP. Five years later (2011-12), combined
expenditure on health had doubled in absolute
terms, but as a share of GDP it remained at
1% of GDP. These deficiencies get manifested
in the recent World Health Organisation
(WHO) report that states that India as a whole
accounts for almost 21% of the world‘s global
burden of diseases. As almost 75 per cent of
the Indian population, still live in rural areas,
the incidences of diseases are very high in
rural areas leading to high mortality rate, a
major portion of which could have been
averted, if correctly diagnosed and given
access to proper treatment. Data for 2008
showed that approximately 2 million expired,
due to preventable causes, such as diarrhea,
dengue, measles, typhoid and malaria. Data
for 2009 showed that more than 70% of
children under the age of 5 suffer from
anaemia and 80% of them don‘t get vitamin
supplements. According to the report, the
proportion of anaemic children has actually
increased by 6% in the past six years with 11
out of 19 states having more than 80% of its
children suffering from anaemia.
Besides, a skewed health care system
prevailing in India, another vital social
parameter where gross inequality occurred, is
in the education sector. Extreme disparities
spreading across geographic regions, gender
and socio-economic religious groups
characterize accessibility of education in
India. From a geographical perspective, the
southern and northern Indian states offer better
educational opportunities than the rest of the
country. Coupled with it, de-regulation of the
education system entailed high cost negatively
affecting the quality, thus, causing a majority
to opt out of the same. Thus, every third
illiterate person in the world comprises an
YEAR IV VOLUME IV .Jamshedpur Research Review. ISSUE XVII ISSN-2320-2750
JRR September –November 2016 39
Indian. Out of an approximately 200 million
children in the age-group of 6-14, only about
120 million get enrolled in school. Those
opting-out cite inadequate budget allocation,
dismal school infrastructure in rural area, high
dropout rates, caste-bias, gender-bias etc.
Moreover, budgetary allocations for education
have not only been unplanned but consistently
regressive. As a result of such unplanned
allocation in education, real per capita
allocation declined from a meagre INR 15.40
to INR 14.68 between 2002 and 2003 with
vital educational schemes like the National
Programme for Women‘s Education being
scrapped.
In the field of higher education also,
India‘s declining trend remained. India‘s
Gross Enrolment Ratio (GER) of 16% was
much below the world average of 27% as well
as that of other emerging countries such as
China (26%) and Brazil (36%) in 2010. Also,
there exists wide disparity in Gross
Attendance Ratio (GAR) terms of rural-urban,
gender and across communities. Available
data for 2007-08 showed the GAR in urban
areas was almost three times that in rural
areas. In the same period, male to female GAR
was 19% and 15.2% respectively.
A primary reason for the declining
trends envisaged in education expenditure is
the acute shortage of government funds. Data
showed that education expenditure went down
from 4% in 1991/1992 to 3% in 1996/1997.
The alarming fact is the ‗less than half of the
total‘ amount being spent on primary
education, considered ubiquitously as the
backbone of social progress.
Apart from health and education
inequality, the acute inequality persisting in
the sphere of gender also makes a mockery of
the social progress made by India. Numerous
research findings point towards the adverse
impact on development goals as a result of
gender inequality. As per the Human
Development Report (HDR) 2013, India
ranked a miserable 132nd
position out of total
187 countries on the Gender Inequality Index-
performing behind almost all nations in South
Asia, except Afghanistan. Some neighbouring
countries like Pakistan at 123rd
position,
Bangladesh at 111th position, Nepal at rank
102nd
while Sri Lanka was at 75th position.
Looking at other reports of Multi-national
Agencies, the same picture emerges.
According to the Global Gender Gap Report
released by the World Economic
Forum(WEF) in 2013, India was ranked at
105th position on the Gender Gap Index (GGI)
amongst 136 countries polled. Apart from the
overall low- down position in GGI, what was
found to be most disappointing in GGI, is the
dismal performance of its vital component –
health and survival in which India‘s ranking
was 135 out of 136 with a score of 0.9. Again,
on the OECD‘s new Social Institutions
Gender Index (SIGI), India was ranked at 56th
out of 86 in 2012. As per latest Census data, a
highly skewed sex ratio with 914 females
every 1000 males were observed. The British
medical Journal Lancet brings forth the fact
that twelve million Indian girls have been
aborted in the last three decades. Again, in
terms of absorption in labour force of the
country, UNDP report opines that only 29% of
Indian women are above the age of 15 in
2011. Only 26.6% women above 25 years of
age received a secondary education in 2010.
There also exists a dismal availability of
healthcare facilities for women.
Approximately 200 women died for every one
lakh child births as per latest report.
Percentage of women with chronic energy
deficiency is stagnant at 40% over six years
with the proportion in fact increasing in
Assam, Bihar, Madhya Pradesh and Haryana.
In 2010, the UN recorded one maternal death
at childbirth every ten minutes in India, with a
maternal mortality rate higher than that of
Sudan, Ethiopia and Bangladesh.
Finally, the prevalent caste system
perpetrates inequality. In such a system, the
incidence of inequality varies proportionately
with the level of ritual impurities presumed to
be within a typical caste, with the SC/ST or
the OBC, considered to be aliens in terms of
the societal opportunities, e.g., access to food,
education and health, etc., to be received.
Moreover, these groups are often subjected to
physical, psychological, emotional and
cultural abuse. With these sections of the
society receiving unequal treatment
comprising roughly one-sixth of the Indian
population, the incidence of inequality
assumes considerable weight.

YEAR IV VOLUME IV .Jamshedpur Research Review. ISSUE XVII ISSN-2320-2750
JRR September –November 2016 40
Section – IV
Root Causes of Inequality
At the core of economic injustice
prevailing in India, lay the inequality of status
and lack of appropriate opportunities for the
common folk. As to delving deeper into
practical causes of such inequalities, a
structural deficiency in the economic
framework is laid bare. Such deficiency was
the handiwork of the liberalization of
economic policy implemented since 1991,
wherein the service sector growth was at a
much faster rate vis-a-vis others during the
post- reform period and propelled India to a
higher growth path. Such skewed growth of
the service sector led to a number of
anomalies in the Indian economy. At the first
instance, the present state of education system
is not geared-up to take care of the
requirement of high quality individuals at the
scale necessary to sustain.
Secondly, analysis of available data
revealed that almost 70 per cent of India‘s
population continues to be engaged in
agriculture that contributes around 14 per cent
of GDP. On the other hand, with less than 30
per cent of the population working in the
service sector, the contribution to GDP is
more than 67 per cent. In such a dichotomous
state, average wage in the service sector went
up manifold vis-a-vis agriculture sector over
the years. Despite this huge contribution of
service sector, it failed to wean away people
from agricultural and manufacturing sector,
thus, exacerbating jobless growth and causing
a lop-sided distribution of employment in
India.
Apart from the prevalence of sectoral
inequality in employment, pseudo weights on
policies of the government that reaped only
short-term benefits and entailing political gain
led to abnormal priorities being assigned. On
some of such assigned priorities like subsidies
which failed to reach the lowest strata of the
society, interest payments on various loan, the
government allocation amounted to as high as
5-6% of GDP, whereas, the basic minimum
requirements of healthcare delivery system
and provisioning of education were curtailed
as a result of siphoning of funds. On account
of such skewed vision, inequality prevailed
and hampering capacity building thereby
blunting future growth potential.
The primary causes of caste-based
inequality are the lack of enlightenment
amongst the people. Furthermore,
implementation of several caste-based
advancement schemes launched by the
government lacks the necessary regulatory
framework, needed indispensably for
eradication of caste-based discrimination.
The acute incidence of gender
inequality is primarily due to the persisting
conservatism in Indian society manifested by
preference for boys to girls, thereby,
increasing the incidence of female feticide.
Section –V
Remedial Measures
The Mckinsey Report, ―From Poverty
to Empowerment‖ talks of a huge
‗Empowerment Gap‘ as the one that is the
cause of all evils thus denying economic
justice to a sizeable section of the population.
The report also opined that to narrow down
the gap, channeling of appropriate resources in
the form of creating efficiencies in the
delivery of current services, where till date
50% of government spending failed to reach
its intended recipients. Also, there needs to be
a radical increase in social spending from 21%
to 50% of the budget. And, finally for proper
implementation, reduction of bureaucratic red
tapism is opined as a must to drastically raise
the productivity of manufacturers and the
agriculture sector through innovation,
efficiencies and investment.
Inclusion of the backward castes within
the mainstream flow, through appropriate
policy measures can be effectuated in the
following way:
I. Inclusion by targeting through which the
authorities consciously target the
backward classes and women through a
process that takes care of the most
vulnerable sections of the community,
and thereafter, consciously involving the
entire community for whole-hearted
support of the endeavour.
II. Inclusion through empowerment involves
backward castes and their leaders to
institute, support and lead their own
projects, coordinate the response efforts
and ensure that the government agencies
are made accountable for their rights.
YEAR IV VOLUME IV .Jamshedpur Research Review. ISSUE XVII ISSN-2320-2750
JRR September –November 2016 41
III. Inclusion by transparency ensures that
the humanitarian agencies and
government institutions commit
themselves in ensuring transparency in
data collection, requisite assessments and
information sharing so as to have greater
awareness about the realities of caste
discrimination amongst the general
population.
It has been found that gender
skewness characterizes our societal
framework. Almost among all communities,
e.g., Hindu, Muslim, Christianity or Parsi,
personal laws prevalent are found to be
gender-skewed. Some of their personal laws
provide lesser rights to women than their men
folk, in the same situations. For example, the
Family Law of Usage and Customs of Gentile
Hindus of Goa permit a second marriage for
the husband when there is no son from the
first marriage. Under the Hindu Succession
Act, the property of a Hindu women dying
intestate devolves first upon her children and
husband. Then, it devolves not on her own
family, but upon the heirs of her husband.
There are also laws in some states which do
not allow daughters and widows to inherit
land. These personal laws need to be
appropriately moulded upon so as to ensure
the true spirit of social equality.
Section – VI
In Lieu of Conclusion
In order to implement real change in
results, drastic changes in the existing
methods, are to be implemented. That implies
building of requisite opportunities within the
realm of existing system by embodying the
accrued knowledge about the root causes of
inequalities. Only then shall society progress
in the real sense in line with the maxims of
economic justice. That again can happen only
if, appropriate changes in the existing
administrative machinery besides making and
incorporation of strict laws following the basic
framework of the Directive Principles of State
Policy. Only then can we be a step nearer
towards establishing a welfare state where
acceptable level of economic justice shall
flourish.
References:
1. Ahluwalia, Montek , S. (2000)
―Economic performance of States in
post-reforms period‖ in Economic and
Political Weekly, May 6 -11 , pp. 1637-
48.
2. Bajpai , Hitesh (2015) ― India‘s Worst
Performing States : Malnutrition among
children‖ in India Today, Vol. XL , No.
38, September 15 -21 , p. 50.
3. Bandyopadhyay , S. (2011) ―Rich
States, Poor States : Convergence and
Polarization across Indian States‘‘ in
Scottish Journal of Political Economy ,
57 (3) , June , pp. 414 -36.
4. Bandyopadhyay , S. (2012) ―
Convergence Club Empirics : Evidence
from Indian States‘‘ in Research in
Economic Inequality , Vol .20, pp. 175 -
203.
5. Bhalla, Surjit, S. (2003) . ―Recounting
the poor : Poverty in India, 1983 –
1999‖ in Economic and Political
Weekly, January 25 -31, pp. 338-49.
6. Chadha, G.K, and Sahu, P.P. (2002). ―
Past-reform setbacks in rural
employment issues that need further
scrutiny‖ in Economic and Political
Weekly, May 25, pp. 1998-2026.
7. Chakraborty, Manas and Bhowmik,
Bimalendu Nath (2015) ―Social Justice
and Indian Polity‖ in South Asia
Politics, vol. 13, No.12, April, pp. 37-
42.
8. Chand, Smriti, ―What are the Important
causes of Income Inequality in India?‘‘
Accessed from http://
www.yourarticlelibrary.com/economics/
what - are- the-important - causes- of-
income-inequality – in- India/3041.
Retrieved on 27-09-2015.
9. Deaton, Angus, and Jean Dreze (2002).
― Poverty and inequality in India : A re-
examination‖ in Economic and Political
Weekly, September 7, pp. 3729 -3748.
10. ―Defining Economic Justice and Social
Justice‘‘. Accessed from http:// www.
org/learn/definitions/defining-
economic- justice- and- social- justice.
Retrieved on 27-9-2015.
11. ―Inequality and poverty in India.‘‘
Accessed from
YEAR IV VOLUME IV .Jamshedpur Research Review. ISSUE XVII ISSN-2320-2750
JRR September –November 2016 42
http://www.standrews.ac.uk/dib2/asia/in
equality.html.
12. ‗‗Income inequality : Poor-rich gap
growing in India, Asia – pacifics, says
UNESCAP‘‘. Accessed from
http://archive.
Financialexpress.com/news/income –
inequality – poorrich- gap- growing-in-
India- asiapacific-says-unescap/
1295313. Retrieved on 27-9-2015.
13. Jayaraman, Gayatri (2015). ―Politics of
Food‖ in India Today, Vol.XL,No.38,
September 15-21, pp.48 -49.
14. Kumar, Ravindra (2015). ―Livelihood,
Social Justice and Peace‖ in South Asia
Politics, Vol. 14, No.5, September, pp.
45 -50.
15. Mehta, Aasha Kapur (2013). ‗‗Poverty :
Promises Made and Miles to Go‘‘ in
Yojana, Vol. 57, August, pp. 47-50.
16. Raj, Jaya (2012). ‗‗Grappling with
Poverty‘‘ in Yojana, Vol. 56, August,
pp. 39-41.
17. Razi, Dr. Shahim (2011). ―New
Definition of Poverty‖ in Kurukshetra,
September, pp. 25 -27.
18. Sen, Abhijit and Himanshu
(2005).‖Poverty and inequality in India :
Getting closer to the truth‖ in Angus
Deaton and volerie Kozel (eds.), Data
and Dogma : The Great Indian Poverty
Debate, Macmillan, New Delhi, pp. 306
-370.
19. Seth, Tushar, ―Causes, Consequences
and Measures to Reduce Inequality of
Income Distribution‘‘. Accessed from
http://www.economicsdiscussion.net/inc
ome/causes-conequences-and-measures-
to-reduce-inequality-of-income-
distribution/1843. Retrieved on 27-9-
2015.
20. Sinha, Kounteya (2009). ―India tops
world hunger chart‖ in Times of India,
February 27.
21. Singh, Nirvikar, Bhandari, Lavesh,
Chen, Aoya, and Khare, Aarti (2003).
―Regional inequality in India : A fresh
look‖ in Economic and political Weekly,
March 15, pp.1069-1073.
22. Singh, Rajkumar and Chandra, Prakash
Singh (2015) ‗‗social Justice in India‘‘
in South Asia Politics, vol.14,
No.5,September, pp. 40-44.
23. Sundaram, K. and, Tendulkar, Suresh,
D.(2003) ―Poverty in India in the 1990s
: An analysis of changes in 15 Major
states‖ in Economic and Political
Weekly , April 5 -11, pp. 1385 -1393.
24. Sundaram, K. and, Tendulkar, Suresh,
D.(2003) ―Poverty in India in the 1990s
: Revised Results for all-India and 15
major states for 1993 -94‖ in Economic
and Political Weekly, November 15-22,
pp.4865 -72.
25. ―The Challenge of inequality in India‖.
Accessed from
http://www.livemint.com/opinion/NZAJ
3VHLDhRS2XdLi761/The -challenge-
of-inequality-in-India. html. Retrieved
on March12, 2015.
26. The Gazette of India, Extraordinary,
part -1, Section -1, Cabinet Secretariat
Resolution, January 1, 2015, published
by the Government of India, New Delhi,
pp. 6-9. Accessed from
http://www.egazette.nic.in/write Read
Data/2015/162317.pdf.Retrieved on
March12, 2015.
27. ―The Impact of Economic Inequality in
India‖. Accessed from
http://www.childfund.org/The-Impact-
of-Economic-Inequality-in-India.
Retrieved on March12, 2015.
YEAR IV VOLUME IV .Jamshedpur Research Review. ISSUE XVII ISSN-2320-2750
JRR September –November 2016 43
IMPACT OF INDUSTRIALIZATION OF WEST SINGHBHUM
DISTRICT OF JHARKHAND: AN EMPIRICAL
INVESTIGATION
Gauri Shankar Research Scholar, Dept of Commerce, Kolhan University, Jharkhand
Dr. Sanjive Kumar Singh, Assistant professor, Dept of Commerce, Jamshedpur, Co-operative College
Jamshedpur, Jharkhand
Abstract West Singhbhum district of Jharkhand is famous all over the world for dense Saranda Forest,
primitive tribes and wild animals. West Singhbhum is also famous for abundance of high quality iron
ore and minerals. West Singhbhum district is the richest district of India in terms of ore and minerals
but the, people of this world famous tribal land are still among the poorest in the country. More than
50 percent population of the district is tribal and more than 40 percent population is below poverty
line in the district. As per 2011 census report the population of the district was 1,501,619, density
was 80/km2 (730/sq mi), 59 percent population is literate and sex ration was1001. Now government
desires to improve the socio-economic condition of people of this hilly area through heavy ore and
mineral based industrialization. In last 15 years, many MOUs have been signed between the state
government and private investors, but most of these MoUs could not materialized due to local
protests against land acquisition. It is believe that a significant part of local population of the district
is against the ore and mineral based heavy industrialization. I surveyed 20 villages and 16 blocks of
West Singhbhum and consulted more than 180 persons with the help of formally designed question
and tried to understand their views, attitude and perception regarding the long-term and short-term
impact of industrialization on the socio –economic condition of West Singhbhum. Findings are very
interesting. Most of the respondents believe that industrialization would bring wealth in the district
but its cost might be very heavy in long run, and lead to more serious kind of poverty huge
environmental threats in future. But it is not the end of the road. If government plans the heavy
industrialization in a sustainable manner, negative impacts of industrialization can be minimized and
positive impacts can be optimized
Key Words: Jharkhand, socio-economic condition, West Singhbhum, Tribal population, ore and
mineral based heavy industrialization
Introduction: West Singhbhum of Jharkhand is a
land of wild animals and India‘s densest
forests. More than 50 percent population of
the district is aboriginal and majority of tribal
population is live below poverty line.
Improving the socio economic condition of
this most deprived population of the country is
a big challenge. Development related
challenges are more serious because
unplanned and careless development may lead
to ecosystem disaster and more importantly
annihilation of one of the worlds most
primitive cultural. In last 70 years nothing is
changed in the lives of the inhabitants of dense
forests of Saranda. They are still very poor,
uneducated and full of superstitions. They kill
female members of their own society declaring
them ‗the witch‘. They consume local wine
called ‗Hadia‘ irrationally. Infant mortality
rate is very high. Their female members are
trafficked to the cities like Mumbai, Delhi,
Kolkata and other parts of country where they
work as sex workers, bounded housemaid and
daily wages labour. Male members are
unemployed. As forests are shrinking rapidly
they are unable to get their livelihood from the
forest. The district is one of the richest region
of the world in terms of ore and minerals. The
greater part of West Singhbhum district is
covered by Carmelite, chromite Magnetite,
lime Stone, Asbestos, and many other precious
YEAR IV VOLUME IV .Jamshedpur Research Review. ISSUE XVII ISSN-2320-2750
JRR September –November 2016 44
ore and mnerals. But poverty level is very
high. Due to government initiatives literacy
rate is increased. New schools have been
opened in remote areas. But quality of
education is still a big question mark. Sex ratio
is positive in favour of girl. But child mortality
rate is still very high. There are very few good
health centres. In case of any serious illness,
patients are taken to Jamshedpur and Ranchi.
Unemployment rate is very high. Major part of
local population is unorganized labour.
Women also work as daily wages worker in
local factories. After the superme court order,
many iron ore mines are closed down forcibly
by the state government- has further worsened
the unemployment problem. State government
has been consistently inviting invertors to
invest in Heavy industry in the district. But
land acquisition is a very big challenge due to
local protests and naxal insurgence. In deed it
is not a very happy picture for industries in the
district altogather. For my doctoral level
research I decided to look in to the ground
realities of the West Singhbhum and talked
directly with the locals on this matter. Purpose
was to mind mapping of the tribes and others
on the matter of heavy industrialization.
In this paper I have studied the impact
of ore and mineral based industrialization on
the socioeconomic condition of West
Singhbhum by mind mapping the local
communities. To meet this objective I
personally collected data from 119
respondents. Respondents were essentially the
local villagers of West Singhbhum comprised
of both tribal and non-tribal. Respondents
were requested to give their opinion on a five
point scale. ‗1‘ represented the extremely
negative and ‗5‘ represented extremely
positive impact on the various socio-economic
factors. Factors chosen for study the influence
level were income level, employment
generation, business opportunities, local
industries, overall economic development,
democratic system, tribal life, family structure,
family life style, traditional life style, tribal
culture, relationship between tribal culture &
surrounding environment, relationship
between tribal community and non-tribal
community, overall forest area, wild life, water
resources, air, ore & mineral resources,
naxalite incidents, tribal migration, education
level, standard of living, national &
international contacts.
One-way analysis of variance
(abbreviated one-way ANOVA) technique
used to compare means of three or more
samples (using the F distribution). For the
analysis of variance is used for comparing the
means of short -term and long term impact of
heavy ore and mineral based industrialization
on west singhbhum district of Jharkhand.
Null hypothesis(H0): There is no
significant difference between the short
term and long term impact of
industrialization on the income level,
employment generation opportunities,
business opportunities, standard of living,
local industries, overall economic
development, democratic system, tribal
life, family structure, family life style,
traditional life style, tribal culture,
relationship between tribal culture &
surrounding environment, relationship
between tribal community and non-
tribal community, wild life, water
resources, air, water resources, ore &
mineral resources ,rate of Naxalite
incidents , rate of tribal migration and
education level of West Singhbhum
district of Jharkhand incidents , rate of
tribal migration, and education level of
West Singhbhum district of Jharkhand
Alt hypothesis (H1): there is no
significant difference between the short
term and long term impact of
industrialization on the income level,
employment generation opportunities,
business opportunities, standard of living,
local industries, overall economic
development, democratic system, tribal
life, family structure, family life style,
traditional life style, tribal culture,
relationship between tribal culture &
surrounding environment, relationship
between tribal community and non-
tribal community, wild life, water
resources, air, water resources, ore &
mineral resources ,rate of Naxalite
incidents , rate of tribal migration and
education level of West Singhbhum
district of Jharkhand incidents , rate of
tribal migration, and education level of
West Singhbhum district of Jharkhand.
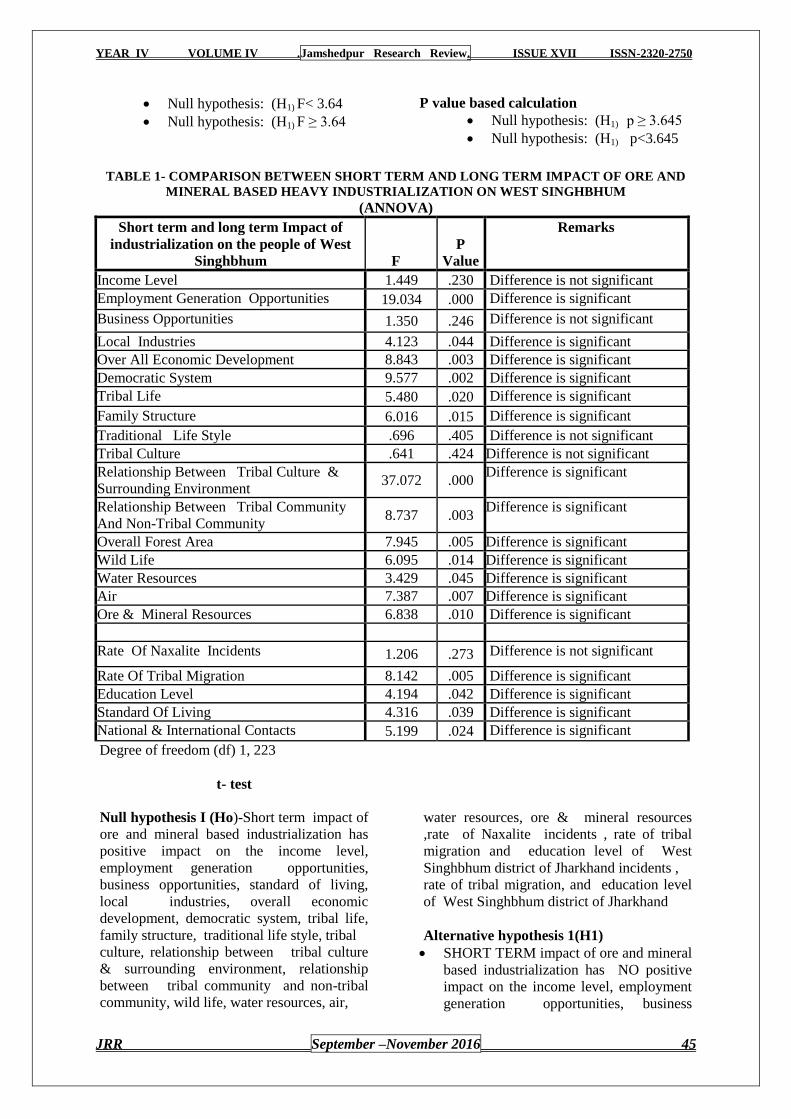
YEAR IV VOLUME IV .Jamshedpur Research Review. ISSUE XVII ISSN-2320-2750
JRR September –November 2016 45
Null hypothesis: (H1) F< 3.64
Null hypothesis: (H1) F ≥ 3.64
P value based calculation
Null hypothesis: (H1) p ≥ 3.645
Null hypothesis: (H1) p<3.645
TABLE 1- COMPARISON BETWEEN SHORT TERM AND LONG TERM IMPACT OF ORE AND
MINERAL BASED HEAVY INDUSTRIALIZATION ON WEST SINGHBHUM
(ANNOVA)
Short term and long term Impact of
industrialization on the people of West
Singhbhum F
P
Value
Remarks
Income Level 1.449 .230 Difference is not significant
Employment Generation Opportunities 19.034 .000 Difference is significant
Business Opportunities 1.350 .246 Difference is not significant
Local Industries 4.123 .044 Difference is significant
Over All Economic Development 8.843 .003 Difference is significant
Democratic System 9.577 .002 Difference is significant
Tribal Life 5.480 .020 Difference is significant
Family Structure 6.016 .015 Difference is significant
Traditional Life Style .696 .405 Difference is not significant
Tribal Culture .641 .424 Difference is not significant
Relationship Between Tribal Culture &
Surrounding Environment 37.072 .000
Difference is significant
Relationship Between Tribal Community
And Non-Tribal Community 8.737 .003
Difference is significant
Overall Forest Area 7.945 .005 Difference is significant
Wild Life 6.095 .014 Difference is significant
Water Resources 3.429 .045 Difference is significant
Air 7.387 .007 Difference is significant
Ore & Mineral Resources 6.838 .010 Difference is significant
Rate Of Naxalite Incidents 1.206 .273 Difference is not significant
Rate Of Tribal Migration 8.142 .005 Difference is significant
Education Level 4.194 .042 Difference is significant
Standard Of Living 4.316 .039 Difference is significant
National & International Contacts 5.199 .024 Difference is significant
Degree of freedom (df) 1, 223
t- test
Null hypothesis I (Ho)-Short term impact of
ore and mineral based industrialization has
positive impact on the income level,
employment generation opportunities,
business opportunities, standard of living,
local industries, overall economic
development, democratic system, tribal life,
family structure, traditional life style, tribal
culture, relationship between tribal culture
& surrounding environment, relationship
between tribal community and non-tribal
community, wild life, water resources, air,
water resources, ore & mineral resources
,rate of Naxalite incidents , rate of tribal
migration and education level of West
Singhbhum district of Jharkhand incidents ,
rate of tribal migration, and education level
of West Singhbhum district of Jharkhand
Alternative hypothesis 1(H1)
SHORT TERM impact of ore and mineral
based industrialization has NO positive
impact on the income level, employment
generation opportunities, business
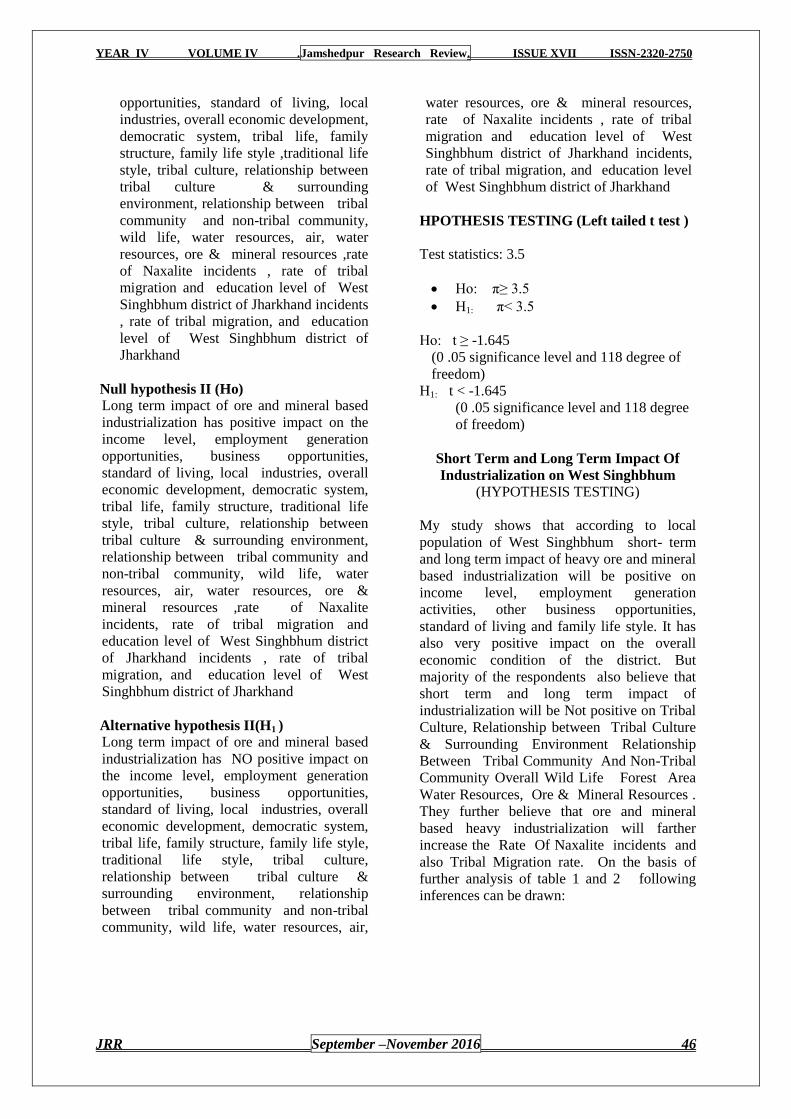
YEAR IV VOLUME IV .Jamshedpur Research Review. ISSUE XVII ISSN-2320-2750
JRR September –November 2016 46
opportunities, standard of living, local
industries, overall economic development,
democratic system, tribal life, family
structure, family life style ,traditional life
style, tribal culture, relationship between
tribal culture & surrounding
environment, relationship between tribal
community and non-tribal community,
wild life, water resources, air, water
resources, ore & mineral resources ,rate
of Naxalite incidents , rate of tribal
migration and education level of West
Singhbhum district of Jharkhand incidents
, rate of tribal migration, and education
level of West Singhbhum district of
Jharkhand
Null hypothesis II (Ho)
Long term impact of ore and mineral based
industrialization has positive impact on the
income level, employment generation
opportunities, business opportunities,
standard of living, local industries, overall
economic development, democratic system,
tribal life, family structure, traditional life
style, tribal culture, relationship between
tribal culture & surrounding environment,
relationship between tribal community and
non-tribal community, wild life, water
resources, air, water resources, ore &
mineral resources ,rate of Naxalite
incidents, rate of tribal migration and
education level of West Singhbhum district
of Jharkhand incidents , rate of tribal
migration, and education level of West
Singhbhum district of Jharkhand
Alternative hypothesis II(H1 )
Long term impact of ore and mineral based
industrialization has NO positive impact on
the income level, employment generation
opportunities, business opportunities,
standard of living, local industries, overall
economic development, democratic system,
tribal life, family structure, family life style,
traditional life style, tribal culture,
relationship between tribal culture &
surrounding environment, relationship
between tribal community and non-tribal
community, wild life, water resources, air,
water resources, ore & mineral resources,
rate of Naxalite incidents , rate of tribal
migration and education level of West
Singhbhum district of Jharkhand incidents,
rate of tribal migration, and education level
of West Singhbhum district of Jharkhand
HPOTHESIS TESTING (Left tailed t test )
Test statistics: 3.5
Ho: π≥ 3.5
H1: π< 3.5
Ho: t ≥ -1.645
(0 .05 significance level and 118 degree of
freedom)
H1: t < -1.645
(0 .05 significance level and 118 degree
of freedom)
Short Term and Long Term Impact Of
Industrialization on West Singhbhum
(HYPOTHESIS TESTING)
My study shows that according to local
population of West Singhbhum short- term
and long term impact of heavy ore and mineral
based industrialization will be positive on
income level, employment generation
activities, other business opportunities,
standard of living and family life style. It has
also very positive impact on the overall
economic condition of the district. But
majority of the respondents also believe that
short term and long term impact of
industrialization will be Not positive on Tribal
Culture, Relationship between Tribal Culture
& Surrounding Environment Relationship
Between Tribal Community And Non-Tribal
Community Overall Wild Life Forest Area
Water Resources, Ore & Mineral Resources .
They further believe that ore and mineral
based heavy industrialization will farther
increase the Rate Of Naxalite incidents and
also Tribal Migration rate. On the basis of
further analysis of table 1 and 2 following
inferences can be drawn:
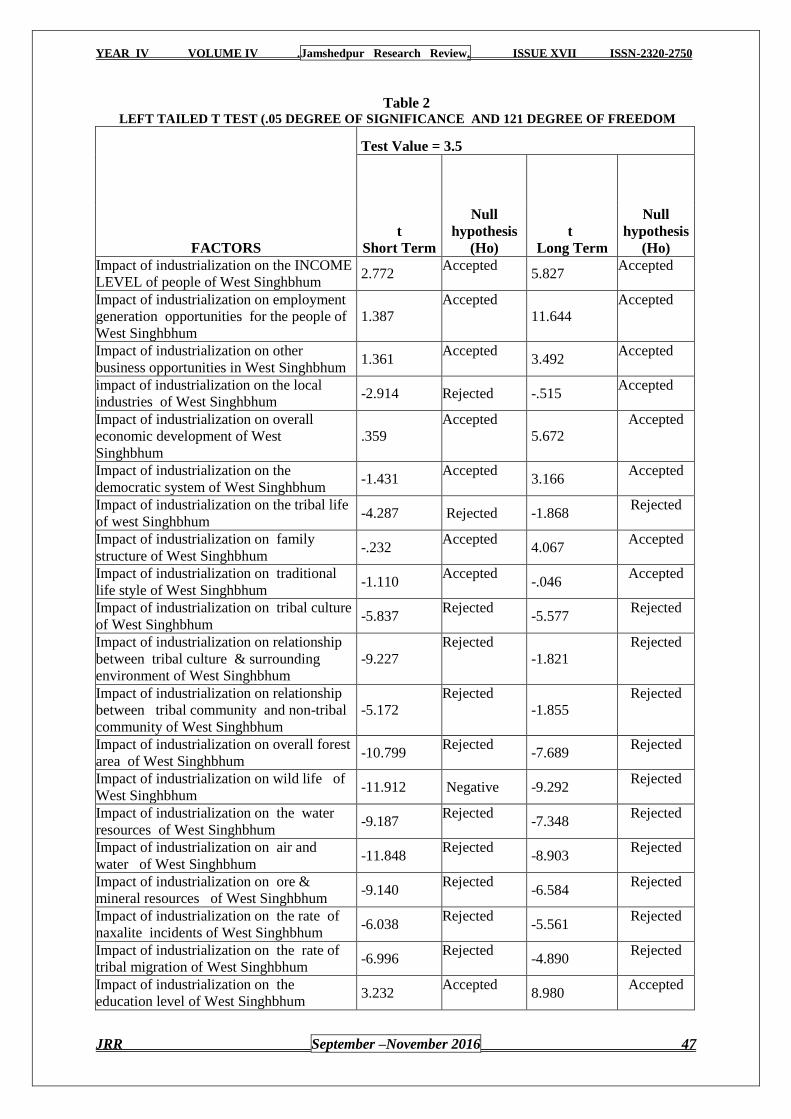
YEAR IV VOLUME IV .Jamshedpur Research Review. ISSUE XVII ISSN-2320-2750
JRR September –November 2016 47
Table 2 LEFT TAILED T TEST (.05 DEGREE OF SIGNIFICANCE AND 121 DEGREE OF FREEDOM
FACTORS
Test Value = 3.5
t
Short Term
Null
hypothesis
(Ho)
t
Long Term
Null
hypothesis
(Ho)
Impact of industrialization on the INCOME
LEVEL of people of West Singhbhum 2.772
Accepted 5.827
Accepted
Impact of industrialization on employment
generation opportunities for the people of
West Singhbhum
1.387
Accepted
11.644
Accepted
Impact of industrialization on other
business opportunities in West Singhbhum 1.361
Accepted 3.492
Accepted
impact of industrialization on the local
industries of West Singhbhum -2.914 Rejected -.515
Accepted
Impact of industrialization on overall
economic development of West
Singhbhum
.359
Accepted
5.672
Accepted
Impact of industrialization on the
democratic system of West Singhbhum -1.431
Accepted 3.166
Accepted
Impact of industrialization on the tribal life
of west Singhbhum -4.287 Rejected -1.868
Rejected
Impact of industrialization on family
structure of West Singhbhum -.232
Accepted 4.067
Accepted
Impact of industrialization on traditional
life style of West Singhbhum -1.110
Accepted -.046
Accepted
Impact of industrialization on tribal culture
of West Singhbhum -5.837
Rejected -5.577
Rejected
Impact of industrialization on relationship
between tribal culture & surrounding
environment of West Singhbhum
-9.227
Rejected
-1.821
Rejected
Impact of industrialization on relationship
between tribal community and non-tribal
community of West Singhbhum
-5.172
Rejected
-1.855
Rejected
Impact of industrialization on overall forest
area of West Singhbhum -10.799
Rejected -7.689
Rejected
Impact of industrialization on wild life of
West Singhbhum -11.912 Negative -9.292
Rejected
Impact of industrialization on the water
resources of West Singhbhum -9.187
Rejected -7.348
Rejected
Impact of industrialization on air and
water of West Singhbhum -11.848
Rejected -8.903
Rejected
Impact of industrialization on ore &
mineral resources of West Singhbhum -9.140
Rejected -6.584
Rejected
Impact of industrialization on the rate of
naxalite incidents of West Singhbhum -6.038
Rejected -5.561
Rejected
Impact of industrialization on the rate of
tribal migration of West Singhbhum -6.996
Rejected -4.890
Rejected
Impact of industrialization on the
education level of West Singhbhum 3.232
Accepted 8.980
Accepted
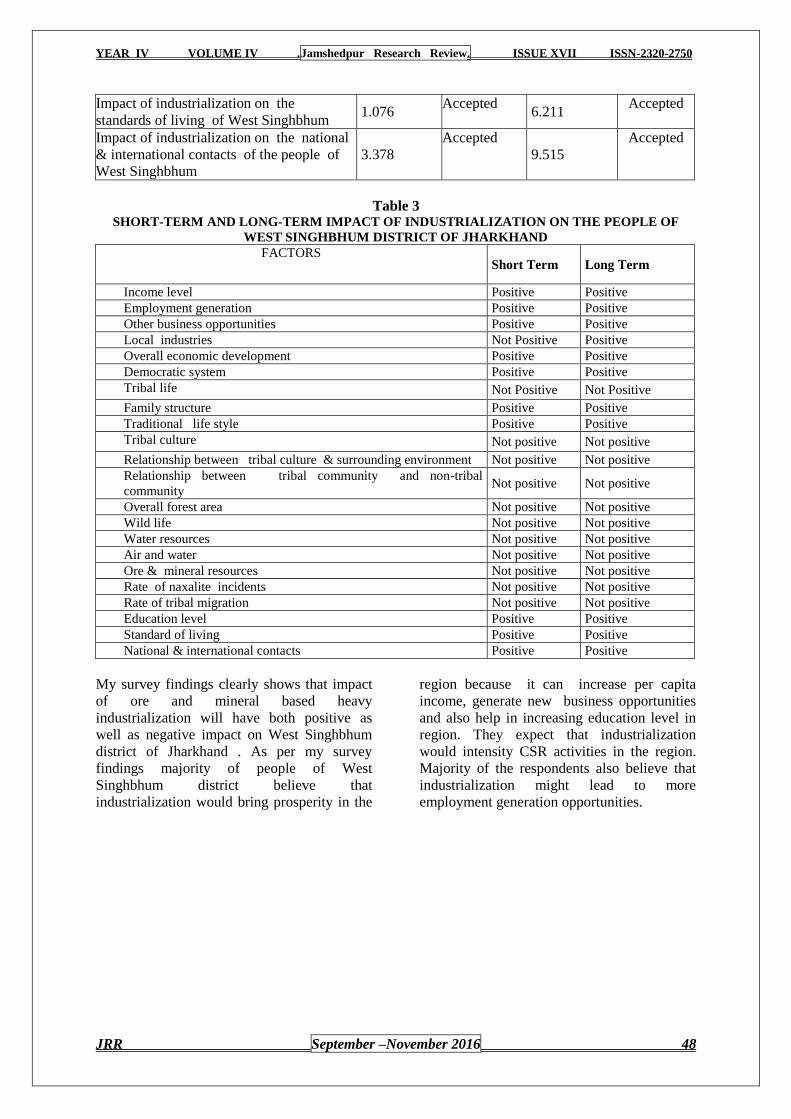
YEAR IV VOLUME IV .Jamshedpur Research Review. ISSUE XVII ISSN-2320-2750
JRR September –November 2016 48
Impact of industrialization on the
standards of living of West Singhbhum 1.076
Accepted 6.211
Accepted
Impact of industrialization on the national
& international contacts of the people of
West Singhbhum
3.378
Accepted
9.515
Accepted
Table 3 SHORT-TERM AND LONG-TERM IMPACT OF INDUSTRIALIZATION ON THE PEOPLE OF
WEST SINGHBHUM DISTRICT OF JHARKHAND
FACTORS Short Term Long Term
Income level Positive Positive
Employment generation Positive Positive
Other business opportunities Positive Positive
Local industries Not Positive Positive
Overall economic development Positive Positive
Democratic system Positive Positive
Tribal life Not Positive Not Positive
Family structure Positive Positive
Traditional life style Positive Positive
Tribal culture Not positive Not positive
Relationship between tribal culture & surrounding environment Not positive Not positive
Relationship between tribal community and non-tribal
community Not positive Not positive
Overall forest area Not positive Not positive
Wild life Not positive Not positive
Water resources Not positive Not positive
Air and water Not positive Not positive
Ore & mineral resources Not positive Not positive
Rate of naxalite incidents Not positive Not positive
Rate of tribal migration Not positive Not positive
Education level Positive Positive
Standard of living Positive Positive
National & international contacts Positive Positive
My survey findings clearly shows that impact
of ore and mineral based heavy
industrialization will have both positive as
well as negative impact on West Singhbhum
district of Jharkhand . As per my survey
findings majority of people of West
Singhbhum district believe that
industrialization would bring prosperity in the
region because it can increase per capita
income, generate new business opportunities
and also help in increasing education level in
region. They expect that industrialization
would intensity CSR activities in the region.
Majority of the respondents also believe that
industrialization might lead to more
employment generation opportunities.
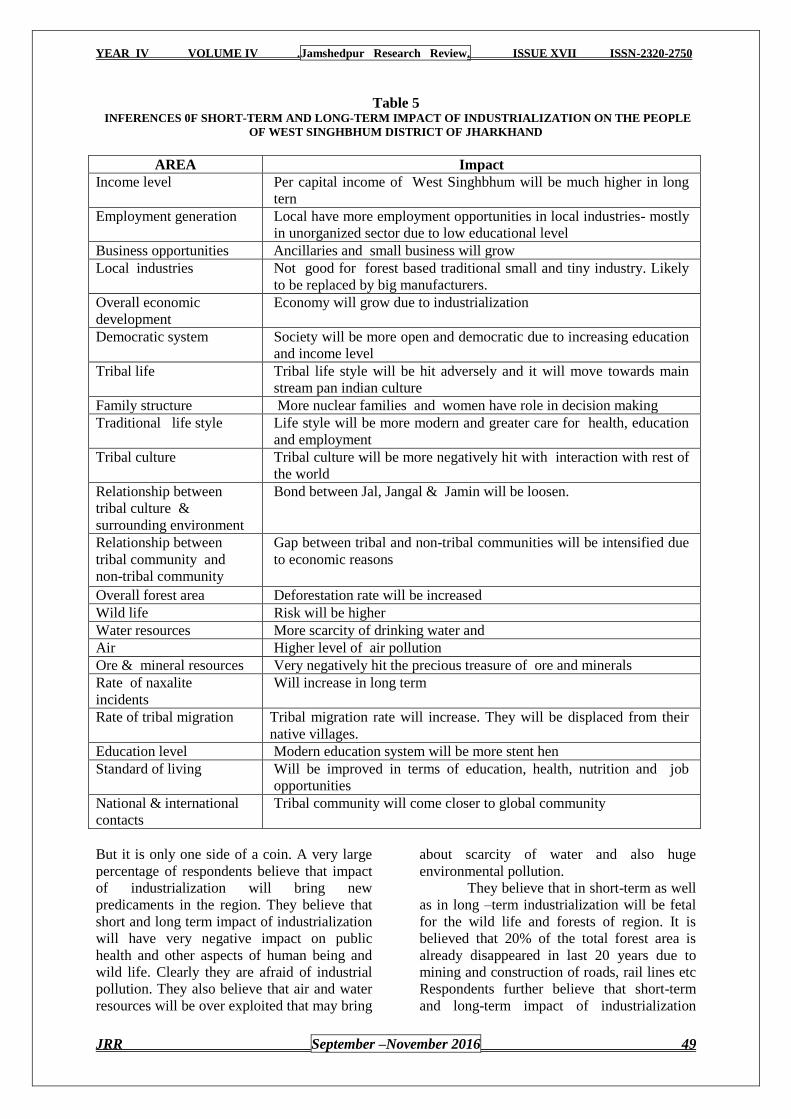
YEAR IV VOLUME IV .Jamshedpur Research Review. ISSUE XVII ISSN-2320-2750
JRR September –November 2016 49
Table 5 INFERENCES 0F SHORT-TERM AND LONG-TERM IMPACT OF INDUSTRIALIZATION ON THE PEOPLE
OF WEST SINGHBHUM DISTRICT OF JHARKHAND
AREA Impact
Income level Per capital income of West Singhbhum will be much higher in long
tern
Employment generation Local have more employment opportunities in local industries- mostly
in unorganized sector due to low educational level
Business opportunities Ancillaries and small business will grow
Local industries Not good for forest based traditional small and tiny industry. Likely
to be replaced by big manufacturers.
Overall economic
development
Economy will grow due to industrialization
Democratic system Society will be more open and democratic due to increasing education
and income level
Tribal life Tribal life style will be hit adversely and it will move towards main
stream pan indian culture
Family structure More nuclear families and women have role in decision making
Traditional life style Life style will be more modern and greater care for health, education
and employment
Tribal culture Tribal culture will be more negatively hit with interaction with rest of
the world
Relationship between
tribal culture &
surrounding environment
Bond between Jal, Jangal & Jamin will be loosen.
Relationship between
tribal community and
non-tribal community
Gap between tribal and non-tribal communities will be intensified due
to economic reasons
Overall forest area Deforestation rate will be increased
Wild life Risk will be higher
Water resources More scarcity of drinking water and
Air Higher level of air pollution
Ore & mineral resources Very negatively hit the precious treasure of ore and minerals
Rate of naxalite
incidents
Will increase in long term
Rate of tribal migration Tribal migration rate will increase. They will be displaced from their
native villages.
Education level Modern education system will be more stent hen
Standard of living Will be improved in terms of education, health, nutrition and job
opportunities
National & international
contacts
Tribal community will come closer to global community
But it is only one side of a coin. A very large
percentage of respondents believe that impact
of industrialization will bring new
predicaments in the region. They believe that
short and long term impact of industrialization
will have very negative impact on public
health and other aspects of human being and
wild life. Clearly they are afraid of industrial
pollution. They also believe that air and water
resources will be over exploited that may bring
about scarcity of water and also huge
environmental pollution.
They believe that in short-term as well
as in long –term industrialization will be fetal
for the wild life and forests of region. It is
believed that 20% of the total forest area is
already disappeared in last 20 years due to
mining and construction of roads, rail lines etc
Respondents further believe that short-term
and long-term impact of industrialization
YEAR IV VOLUME IV .Jamshedpur Research Review. ISSUE XVII ISSN-2320-2750
JRR September –November 2016 50
would negatively hit the tribal culture, tribal
standard of living and overall tribal life. On
economic point they believe that
industrialization might boost the economic
development in long run, But they also believe
that heavy Industrialization will destroy the
traditional local industries. So, it can be said
that heavy industrialization of West
Singhbhum might bring the economic
prosperity in the life of local community but
its impact on ecosystem, traditional tribal
culture, family system, local industries, and
public health might not be positive. The study
further indicates that in long tern rate of
positive impacts of industrialization will be
declined. I believe that safe and sustainable
industrialization is indispensible for the speedy
growth of Singhbhum. Because the district so
poor that almost 50 percent of the population
is still below poverty line. Appropriate
measures can control the negative impacts of
ore and mineral based industrialization on eco
system, tribal life & culture of the region. My
study shows that peoples‘ attitude towards
heavy industrialization is not positive. They
must have some acrimonious past experiences.
Illegal and irresponsible mining has been the
key reason behind. Hence, the government
needs to think other modes of industrialization
along with ore and mineral based heavy
industrialization.
References:
1. "Report of the Commissioner for
linguistic minorities: 50th report (July
2012 to June 2013)" (PDF).
Commissioner for Linguistic
Minorities, Ministry of Minority
Affairs, Government of India.
Retrieved 26 December 2014.
2. Gautam Kumar Bera (2008). The
unrest axle: ethno-social movements
in Eastern India. Mittal Publications.
pp. 32–35. ISBN 978-81-8324-145-8.
3. J.B. Hoffmann (1984). A missionary
social worker in India. Editrice
Pontificia Università Gregoriana.
p. 54. ISBN 978-88-7652-539-1.
4. "Census Population" (PDF). Census
of India. Ministry of Finance India.
5. "Population by religion community -
2011". Census of India, 2011. The
Registrar General & Census
Commissioner, India. Archived
from the original on 25 August 2015.
6. "In Jharkhand's Singhbhum, religion
census deepens divide among
tribals". The Times of India.
Retrieved 20 July 2016.
http://scroll.in/article/754985/in-jharkhands-singhbhum-religion-census-deepens-divide-among-tribals
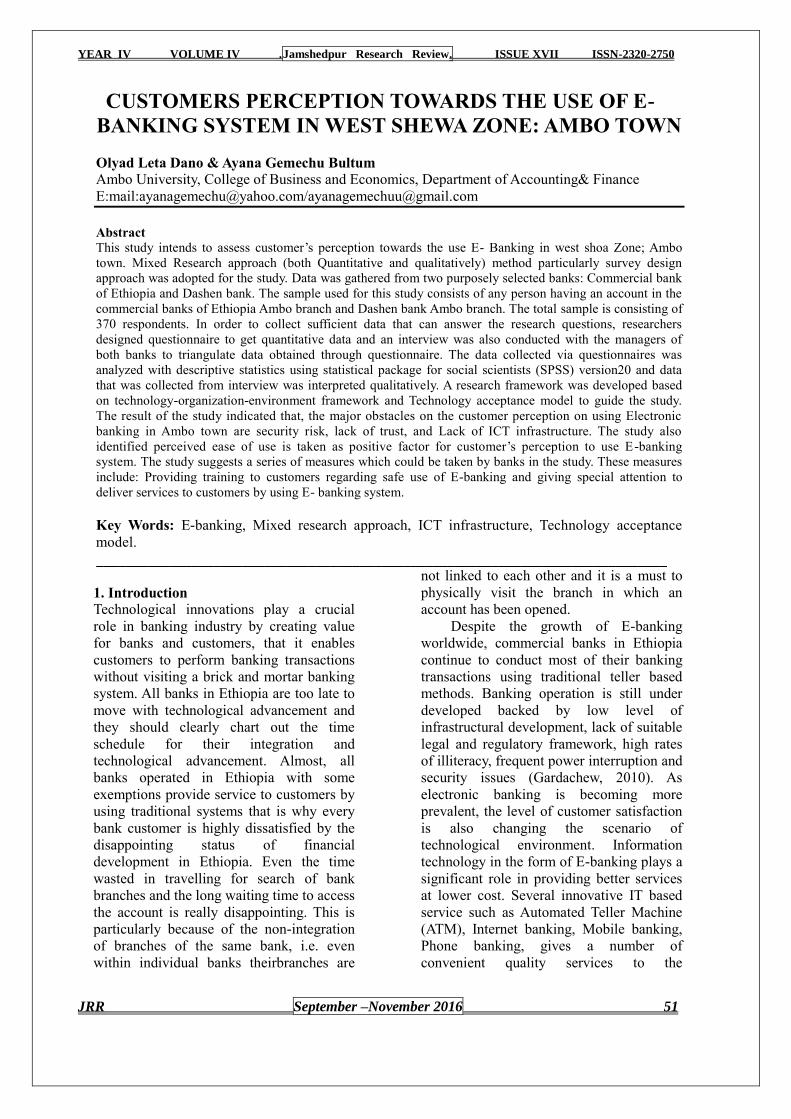
YEAR IV VOLUME IV .Jamshedpur Research Review. ISSUE XVII ISSN-2320-2750
JRR September –November 2016 51
CUSTOMERS PERCEPTION TOWARDS THE USE OF E-
BANKING SYSTEM IN WEST SHEWA ZONE: AMBO TOWN
Olyad Leta Dano & Ayana Gemechu Bultum
Ambo University, College of Business and Economics, Department of Accounting& Finance
E:mail:[email protected]/[email protected]
Abstract
This study intends to assess customer‘s perception towards the use E- Banking in west shoa Zone; Ambo
town. Mixed Research approach (both Quantitative and qualitatively) method particularly survey design
approach was adopted for the study. Data was gathered from two purposely selected banks: Commercial bank
of Ethiopia and Dashen bank. The sample used for this study consists of any person having an account in the
commercial banks of Ethiopia Ambo branch and Dashen bank Ambo branch. The total sample is consisting of
370 respondents. In order to collect sufficient data that can answer the research questions, researchers
designed questionnaire to get quantitative data and an interview was also conducted with the managers of
both banks to triangulate data obtained through questionnaire. The data collected via questionnaires was
analyzed with descriptive statistics using statistical package for social scientists (SPSS) version20 and data
that was collected from interview was interpreted qualitatively. A research framework was developed based
on technology-organization-environment framework and Technology acceptance model to guide the study.
The result of the study indicated that, the major obstacles on the customer perception on using Electronic
banking in Ambo town are security risk, lack of trust, and Lack of ICT infrastructure. The study also
identified perceived ease of use is taken as positive factor for customer‘s perception to use E-banking
system. The study suggests a series of measures which could be taken by banks in the study. These measures
include: Providing training to customers regarding safe use of E-banking and giving special attention to
deliver services to customers by using E- banking system.
Key Words: E-banking, Mixed research approach, ICT infrastructure, Technology acceptance
model.
______________________________________________________________________________
1. Introduction
Technological innovations play a crucial
role in banking industry by creating value
for banks and customers, that it enables
customers to perform banking transactions
without visiting a brick and mortar banking
system. All banks in Ethiopia are too late to
move with technological advancement and
they should clearly chart out the time
schedule for their integration and
technological advancement. Almost, all
banks operated in Ethiopia with some
exemptions provide service to customers by
using traditional systems that is why every
bank customer is highly dissatisfied by the
disappointing status of financial
development in Ethiopia. Even the time
wasted in travelling for search of bank
branches and the long waiting time to access
the account is really disappointing. This is
particularly because of the non-integration
of branches of the same bank, i.e. even
within individual banks theirbranches are
not linked to each other and it is a must to
physically visit the branch in which an
account has been opened.
Despite the growth of E-banking
worldwide, commercial banks in Ethiopia
continue to conduct most of their banking
transactions using traditional teller based
methods. Banking operation is still under
developed backed by low level of
infrastructural development, lack of suitable
legal and regulatory framework, high rates
of illiteracy, frequent power interruption and
security issues (Gardachew, 2010). As
electronic banking is becoming more
prevalent, the level of customer satisfaction
is also changing the scenario of
technological environment. Information
technology in the form of E-banking plays a
significant role in providing better services
at lower cost. Several innovative IT based
service such as Automated Teller Machine
(ATM), Internet banking, Mobile banking,
Phone banking, gives a number of
convenient quality services to the
YEAR IV VOLUME IV .Jamshedpur Research Review. ISSUE XVII ISSN-2320-2750
JRR September –November 2016 52
customers. The banks which are providing
these services at large extent to customers
are more reputed in the eyes of customers.
The most general type of electronic banking
is banking via the Internet, in other words
Internet banking.
In general, E-banking has become an
important method of carrying the banking
transaction and increase customers
satisfaction. With the present research effort
has been made to analyses E-banking on
customers Perception. The aim of this paper
is, therefore, to examine customers‘
Perception towards the use E-banking
service channels in West shoa Zone, Ambo
town.
The remaining parts of the paper are
organized as follows. The second section
presents review of literature. The third
section provides Methods of the study. The
fourth section provides Findings, The final
section, section five presents conclusion.
2. Literature Review
Theoretical Issues
E-banking has a variety of definitions all
refer to the same meaning, the following
section show some of these definitions. E-
banking is a form of banking service where
funds are transferred through an exchange
of electronic signal between financial
institutions, rather than exchange of cash,
checks, or other negotiable instruments
(Kamrul 2009). E-banking, also known as
electronic funds transfer (EFT), is simply
the use of electronic means to transfer funds
directly from one account to another, rather
than by check or cash (Malak 2007).
The term of E-banking often refers to
on line banking/Internet banking which is
the use of the Internet as a remote delivery
channel for banking services (Furst&Nolle
2002, p.5). With the help of the Internet,
banking is no longer bound to time or
geography. Consumers all over the world
have relatively easy access to their accounts
24 hours per day, seven days a week. E-
banking can be also defined as a variety of
platforms such as Internet banking or (on
line banking), TV-based banking, mobile
phone banking, and PC (personal computer)
banking (or off line banking) whereby
customers access these services using an
intelligent electronic device, like PC,
personal digital assistant (PDA), automated
teller machine (ATM), point of sale (POS),
kiosk, or touch tone telephone (Alagheband
2006, p.11).. In the United Kingdom, on line
banking started in 1983 when Nottingham
Building Society (NBS) started to deliver on
line services. Different forms of E- banking
system were discussed as follows:
Automated Teller Machines (ATM) - It is
an electronic terminal which gives
consumers the opportunity to get banking
service at almost any time. To withdraw
cash, make deposits or transfer funds
between accounts, a consumer needs an
ATM card and a personal identification
number (PIN).
Point-of-Sale Transfer Terminals (POS) -
The system allows consumers to pay for
retail purchase with a check card, a new
name for debit card. This card looks like a
credit card but with a significant difference.
The money for the purchase is transferred
immediately from account of debit card
holder to the store's account (Malak 2007).
Internet / extra net banking- It is an
electronic home banking system using web
technology in which Bank customers are
able to conduct their business transactions
with the bank through personal computers.
Mobile banking- Mobile banking is a
service that enables customers to conduct
some banking services such as account
inquiry and funds transfer, by using of short
text message (SMS).
E-banking in Ethiopia
The appearance of E-banking in Ethiopia
goes back to the late 2001, when the largest
state owned, commercial bank of Ethiopia
(CBE) introduced ATM to deliver service to
the local users. In addition to eight ATM
Located in Addis Ababa, CBE has had Visa
membership since November 14, 2005. But,
due to lack of appropriate infrastructure it
failed to reap the fruit of its membership.
Despite being the pioneer in introducing
ATM based payment system and acquired

YEAR IV VOLUME IV .Jamshedpur Research Review. ISSUE XVII ISSN-2320-2750
JRR September –November 2016 53
visa membership, CBE Lagged behind
Dashen bank, which worked aggressively to
maintain its lead in E-payment system. As
CBE continues to move at a snail's pace in
its turnkey solution for Card Based Payment
system, Dashen Bank remains so far the
sole player in the field of E-Banking since
2006. (Gardachew 2010). Dashen bank, a
forerunner in introducing E-banking in
Ethiopia, has installed ATMs at convenient
locations for its own cardholders. Dashen
ATM is available 24 hours a day, seven days
a week and 365 days a year providing
service to Debit Cardholders and
International Visa Cardholders coming to
the country. At the end of June 2009,
Dashen bank has installed more than 40
ATM in its area branches, university
compounds, shopping malls, restaurants and
hotels. In the year 2011 the payment card
services have witnessed significant strides,
Dashens ATM service expanded to 70 and
704 POS terminals (Annual report of the
bank 2011). Available services on Dashen
Bank ATM are: Cash withdrawal, Balance
Inquiry, Mini statement, Fund transfer
between accounts attached to a single card
and Personal Identification Number (PIN)
change. Currently, the bank gives debit card
service only for Visa cards. Dashen bank
clients can withdraw up to 5,000 birr in cash
and can buy goods and services up to 8,000
to 13000 birr per day. Expanding its
leadership, Dashen Bank has begun
accepting MasterCard in addition to Visa
cards. Dashen won the membership license
from MasterCard in 2008. Harnessing its
leadership with advanced banking
technology, Dashen Bank signed an
agreement with I very, a South African E-
payment technology company, for the
introduction of mobile commerce in April
21, 2009. According to the agreement, I
Very Payment Technologies has licensed its
Gateway and Mi Card E-payment
processing solution to Dashen Bank.
Dashens Mod birr users can transfer 500
birr to other Modbirr users in 24 hours a
day. This would make Dashen Bank the first
private bank in Ethiopia to acquire E-
commerce and mobile merchant
transactions (Amanyehun 2011). Although
Dashens new technology is one step ahead
in that it allows transfer of funds from ones
account to others, the first ever E- banking
gateway was signed between Ethiopian
Commodity Exchange (ECX) and Dashen
Bank and CBE.
E-Banking technology According to Ravi (2011:3), banking
technology refers to the use of sophisticated
information and communication
technologies, together with computer
science, to enable banks to offer better
services to their customers in a secure,
reliable and affordable manner, as well as to
sustain a competitive advantage over other
banks. In terms of banking technology, Ravi
(2011:3) states that ‗banking‘ refers to the
economic, financial, commercial and
management aspects of banking, while
‗technology‘ refers to the information and
communications technologies, computer
science and risk qualification and
measurement aspects of banking. During an
earlier investigation of the implications of e-
banking implementation, PIU (Performance
and Innovation Unit) (1999) found that
when a company has adopted a technology
or application, the process of
implementation is generally effected by
three types of factors, namely technological,
organizational and environmental.
Technology-related factors are associated
with the characteristics of the
technology/application itself, including
complexity, compatibility, and relative
advantage. Organizational factors are
primarily concerned with the people
involved in the implementation within
organizations, and impact on issues such as
management support, user resistance and
the level of expertise available.
Environmental factors focus on the
environmental context of the organization
and include factors such as supplier-
customer relationships and competitive
pressure. E-banking relies heavily on
information and communications
technology (ICT) to achieve its promise of
24 hour availability (Bojanet al.,2010:2)
Zaroyda (2009)observed that one key reason
for the slow development of E-banking in
YEAR IV VOLUME IV .Jamshedpur Research Review. ISSUE XVII ISSN-2320-2750
JRR September –November 2016 54
Africa is that there is no overall policy
framework covering aspects such as
technical, economic and political policy
considerations, which help to create an
enabling environment. Despite banks in
developing countries having recently
acknowledged the benefits of e-banking
technology in terms of improving
productivity and efficiency, some countries
(i.e. Nigeria) have struggled to adopt and
integrate e-banking within their existing
banking system (Khalfan& Akbar, 2006).
Technology Acceptance Model (TAM)
For understanding, predicting and
explaining why individuals/consumers
acknowledge or refuse using of information
systems; scholars developed several models
in that regard, by Marina (2009) one of the
most useful model in that regard is given
name of the technology acceptance model
(TAM), actually this model helps a lot in
identifying and categorizing the factors
which affect individuals for accepting or
refusing use of technology applications.
Whereas Sheikhshoaei and Oloumi (2011)
indicated two models, they are the
Technology Acceptance Model (TAM) and
the Task Technology Fit model (TTF) which
is frequently used by entities/organizations
for explaining the acceptance of e-banking
by consumers, actually these models offer
quite dissimilar but occasionally
overlapping point of views on the utilization
behavior of these electronic channels. By
Sheikhshoaei and Oloumi (2011) the Task-
Technology Fit model associates technology
with performance and imagines that level of
performance would go up when a given
technology gives features and support that
correspond with the requirements of the
task. As a result for banks, they would take
on e-banking technologies if it supports in
delivering superior quality services to
consumers. Technology Acceptance Model
(TAM) By main objective offered by TAM
model is to offer comprehensive
clarification of factors which affect
computer-applications‘ acceptance
generally, and it also supports practitioners
for identifying why a precise organism is
intolerable and undesirable. Marina (2009)
proposed that utilizing any type of
information system is in a straight line
determined by the behavioral purpose of
using it, which is in turn affected through
the users' attitudes in the direction of
utilizing the system and the perceived
usefulness of the system, attitude and
perceived usefulness are also affected by the
perceived ease of use.
By Rosenberg (2011) in accordance
with TAM model, bigger level of perceived
usefulness and the perceived ease of using
an information system would optimistically
influence the attitude in the direction of this
system, the attitude, in turn shows the way
to a bigger intention of using the system,
which optimistically influences one's
authentic use of the system.
TAM model actually assumes that,
other-thing being equal, perceived-
usefulness is influenced through the
perceived ease of use for the reason that the
easier a technology system to utilize, the
more constructive and helpful it can be.
Perceived usefulness can be describe like
the extent to which consumers believe that
utilizing a precise system would help to a
great extent in enhancing their job-
performance. Perceived ease of use actually
defines the extent to which consumers
believe that utilizing the technology system
will-be free of effort (Rosenberg, 2011).
Attitude (ATT) gives details about
consumer‘s positive or un favorable
evaluation about the behavior in question,
Intention (INT) can be define as a measure
of the strength of consumers readiness for
using effort while-performing a certain
behavior. According to Marina (2009)
constructs of TAM are almost measured in
the same way in every context, in addition,
TAM model is a consistent tool and
empirically sound. Quite a few meta-
analysis research works have given
adequate amount of data regarding TAM to
be extremely plausible and realistically
explain up to forty percent of the behavioral
intention to use. In addition, quite a lot of
research works have applied TAM for
evaluating consumer‘s adoption in diverse
settings for example e-commerce (Hearn
Y& Hearn, 2008)
YEAR IV VOLUME IV .Jamshedpur Research Review. ISSUE XVII ISSN-2320-2750
JRR September –November 2016 55
Empirical Evidence
Uppal R K (2008) has analyzed the quality
of E- Banking services in the changing
environment on the basis of 5 point liker
type scale with different statistical tools
such as rated average method and ranking.
The study concludes that most of the
customers of E- -banks are satisfied with the
different E-Banking channels and their
services, but the lack of awareness is a
major obstacle in the spread of E-banking
services.
According to Kotler, CRM principally
revolves around marketing. It involves
integrating information gathered from all
the distribution channels and analyzing the
data, with the help of IT, to understand
customer behavior. The continuous analysis
and improvements over a long period
should result in enhancing customers'
lifetime value with the firm. Banking, being
a customer-oriented services industry, the
customer is the center of attention and
customer service has to be the
distinguishing factor. The banking industry
like any other financial services industries is
facing a market that is rapidly changing;
new technologies being introduced, fear of
economic uncertainties, fierce competition
and more demanding customers and the
changing climate have presented an
unparalleled set of challenges (Lovelock,
2001).
Uppal, R.K (2011) threw light on
growth of information technology in various
banks. The objective of this research is to
analyze the extent of technological
developments in various bank groups.
Findings shows as compared to new private
sector banks and foreign banks, in public
sector banks very less IT has taken place.
The maximum technology is taking place in
new generation private sector banks and
foreign.Safeena et al (2010) determines the
consumer‘s perspective on Internet banking
adoption. Finding shows that perceived
usefulness, perceived ease of use, consumer
awareness and perceived risk are the
important determinants of online banking
adoption and have strong and positive effect
on customers to accept on line banking
system. Both behavioral attitudes and
subjective norms lead to behavioral
intentions which ultimately lead to actual
behavior of individual. Internet Banking and
Customer Perceptions Woldie, Hinson,
Iddrisu and Boateng (2008) researched the
influence of Internet services on the
effective delivery of banking services. They
discovered several dimensions of service
quality of Internet banking such as accuracy,
convenience, quality, complaint
management, feedback, efficiency,
customization, accessibility and queue
management. All these service dimensions
influence the acceptability of Internet
banking services by the customers.
Customer attitudes towards Internet
banking are driven by trust, which plays an
important role in increasing usability within
the Internet banking environment. The issue
of trust is more important in online as
opposed to offline banking, because
transactions of this nature contain sensitive
information and parties involved in the
financial transaction are concerned about
access to critical files and information
transferred via the Internet
(Alsajjan&Dennis, 2006).
3. Methods
In order to attain the objective of the study
and answer the research questions;
researcher adopts both quantitative and
qualitative (Mixed) research approach.
Research approach is selected by
researcher(s) based on the research purpose,
the nature of the research, the problem area,
and research questions (Alhamdani et al.
2006). In order to collect sufficient data that
can answer the research questions,
researcher designed one survey and
questionnaire to get quantified results aimed
to collect data from customers. In addition
to questionnaire and survey, data will be
collected from different published and
unpublished materials. Sample population
used for this study consists of any person
having the account in the commercial banks
of Ethiopia Ambo branch and Dashen bank
Ambo branch. With regard to survey,
questionnaire was distributed to 370
YEAR IV VOLUME IV .Jamshedpur Research Review. ISSUE XVII ISSN-2320-2750
JRR September –November 2016 56
customers of 2(two) purposely selected
banks one state owned bank (commercial
bank of Ethiopia) and one private
commercial banks (Dashen bank) to identify
their perception of using E-banking system
in Ambo town. Finally the data collected
via questionnaires was analyzed with
descriptive statistics using statistical
package for social scientists (SPSS) Version
20 and the data that was collected from
questionnaires and reviews of documents
were interpreted quantitatively and
qualitatively. This analysis of Quantitative
and Qualitative data and interpretation was
combined to seek convergence among the
results.
4. Findings
The data has been collected from 370
customers of one state owned bank
(commercial bank of Ethiopia) and one
private banks (Dashen bank) user of E-
banking located in Ambo. The response rate
achieved in this study was 94 % which was
satisfactory for conducting a research. In
this chapter of research, data collected
through survey has been analyzed in an
effective way. For data analysis, the
research findings are reverted back to the
literature review.
Demographic back grounds of Respondents
Age of Participants
The results of the survey explored that
participants from different age groups were
targeted in the sample. It was found that
46.3% of the participants were in the age
range of 18 to 25 years. Only 35.9% of the
total participants were in the age range of
26 to 35 old.
In the sample, 10.9%participants
were between36 to 40 years of age. In the
sample, 6.9% participants were Above 40
years old. As we see from this survey, the
participants between the age of 18-25 are
more the user of E-Banking system than
other user of different age group.
Gender of Participants
The outcome of a survey revealed that
28.4% of the total participants were
females whereas 71.6% were males. The
purpose of asking the gender of the
participants was to look into the
perceptions of males and females towards
E- banking system. There for the Male is
more the user of E-Banking system than the
Female.
Qualification of Participants The respondents were also asked to
mention their qualification. The purpose of
asking this question was to assess that
whether qualification influences the
perceptions of customers to use E- banking.
The results revealed that 12.5% were
qualified with a college Diploma. 65.8%
were qualified with a first Degree. 13.3%
of the total participants were having
Second Degree and 8.3% of the
respondents were others (high school, pre-
high school, …). The results of the survey
indicate that the perception of the
customers on using E-banking is higher
among first degree holder respondents.
Marital status of Participants The respondents were also asked to
mention their marital status. The purpose of
asking this question was to assess that
whether marital status influences the
perceptions of customers to use E- banking.
The results revealed that 63.1% were
Single. 31.9% were married. 2.0% of the
total participants were Divorced and 0.3%
of the respondents were Widowed. From
this we see that single Marital status
participant are more user of E-Banking
system than other marital status of
respondents.
Occupation of Participants The outcome of a survey disclosed that
48.6% of the total participants were
government employee, 13.2% are NGO
Employee, 2.6% are farmer, and 11.5% are
self-employed. Whereas 19.8% were
merchant. The purpose of asking the
occupation of the participants was to look
into the perceptions of occupation towards
the use E- banking system. There for the
governmental employee is more the user of
E-Banking system than any other of
occupation (NGO Employee, Farmer, self-
YEAR IV VOLUME IV .Jamshedpur Research Review. ISSUE XVII ISSN-2320-2750
JRR September –November 2016 57
employed and merchant)
Do you use E- Banking system? The results of the survey revealed that most
of the participants (99.1%) are user of E-
banking system. However, there were 0.9%
participants those do not use E-banking
services. Many earlier studies have
revealed that E-banking system is still not
completely adopted by the customers. In
fact, many earlier studies noted that users
of the traditional banking system are more
than E- banking users.
What kind of E – Banking you are
currently using? The results of the survey revealed that most
of the participants (96.8%) use
ATM,(2%)Mobile banking, However, there
were 0.9% participants use Internet
banking services. From this we understand
most E-Banking user are ATM user than
other main service of E-Banking system in
Ambo town.
Do you think E-Banking has made your
life easier? The results of the survey suggested that
most of the respondents agreed that E-
banking services have made their life easier
(95.1% participants answered yes).
However, 4.9% participants responded that
E- banking has not made their life easier.
The results of this question, when related to
demographics of participants, further
suggested that the people who had higher
levels of education and are of below 30
years of age find convenience in E- banking
services. Here it can be deduced that this
group of participants might have awareness
and knowledge about E- banking
technology which facilitates them in using
E- banking services.
How many times do you visit your bank
per month? The results of the research revealed that
most of the participants (17.5%) visit their
banks frequently (6 to 10 times). 2.6%
participants visit their banks 11 to 15 times
per month. There were 63.8% participants
who used to visit their banks 2 to 5 times in
one month. The same percentage of
participants visits banks for above 16 times
per month. Only 12.4% participants said
that they visit their banks for less than 1
time in one month.
What is the main reason of your bank
visit?
The results of the research revealed that a
large percentage of participants used to
visit the banks for withdrawal of cash
63.5% of total participants. 25% of total
participants pointed out that they visited
their banks for making the deposits. 5.5%
participants visit banks for inquiring about
their bank balance. The percentage of
participants that used to visit the banks for
taking advice regarding investment options
was only 2.3%. The rest of the participants
visit the banks for some other purposes.
4.2. Customers perception to use E-
Banking system in west shoa Zone Ambo
town (commercial banks of Ethiopia and
Dashen bank)
The perception of customers to use E-
Banking system in west shoa Zone Ambo
town in case of commercial
bank(commercial banks of Ethiopia and
Dashen bank),are influenced by different
factors which influence implementation of
the system. In case of Ethiopian banking
industries, many private banks still using
old banking system and don‘t have access to
take advantage from electronic banking
facilities. Wondwossen &T segai (2005)
observed the following reasons which may
be considered as hindrance factors for the
use of electronic payment system in
Ethiopia. Moreover, factors that can affect
customer‘s perception to use E- Banking in
west shoa Zone Ambo town (commercial
banks of Ethiopia and Dashen bank) in the
country regarding the technological factor,
organizational factor, Environmental factor
and Perceived ease of use were analyzed in
the following sections.
4.2.1. Technological factor
The issues elevated in this study in relation
with technological factor are the relative
advantages (perceived benefit) the firm
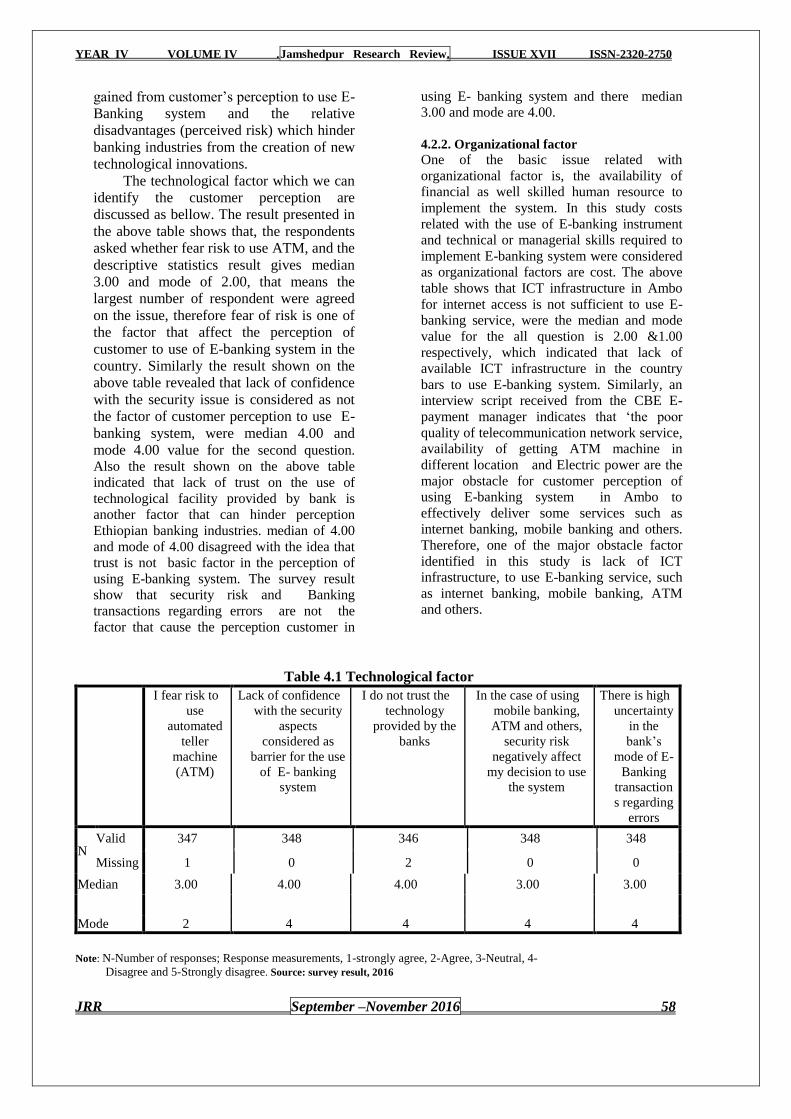
YEAR IV VOLUME IV .Jamshedpur Research Review. ISSUE XVII ISSN-2320-2750
JRR September –November 2016 58
gained from customer‘s perception to use E-
Banking system and the relative
disadvantages (perceived risk) which hinder
banking industries from the creation of new
technological innovations.
The technological factor which we can
identify the customer perception are
discussed as bellow. The result presented in
the above table shows that, the respondents
asked whether fear risk to use ATM, and the
descriptive statistics result gives median
3.00 and mode of 2.00, that means the
largest number of respondent were agreed
on the issue, therefore fear of risk is one of
the factor that affect the perception of
customer to use of E-banking system in the
country. Similarly the result shown on the
above table revealed that lack of confidence
with the security issue is considered as not
the factor of customer perception to use E-
banking system, were median 4.00 and
mode 4.00 value for the second question.
Also the result shown on the above table
indicated that lack of trust on the use of
technological facility provided by bank is
another factor that can hinder perception
Ethiopian banking industries. median of 4.00
and mode of 4.00 disagreed with the idea that
trust is not basic factor in the perception of
using E-banking system. The survey result
show that security risk and Banking
transactions regarding errors are not the
factor that cause the perception customer in
using E- banking system and there median
3.00 and mode are 4.00.
4.2.2. Organizational factor
One of the basic issue related with
organizational factor is, the availability of
financial as well skilled human resource to
implement the system. In this study costs
related with the use of E-banking instrument
and technical or managerial skills required to
implement E-banking system were considered
as organizational factors are cost. The above
table shows that ICT infrastructure in Ambo
for internet access is not sufficient to use E-
banking service, were the median and mode
value for the all question is 2.00 &1.00
respectively, which indicated that lack of
available ICT infrastructure in the country
bars to use E-banking system. Similarly, an
interview script received from the CBE E-
payment manager indicates that ‗the poor
quality of telecommunication network service,
availability of getting ATM machine in
different location and Electric power are the
major obstacle for customer perception of
using E-banking system in Ambo to
effectively deliver some services such as
internet banking, mobile banking and others.
Therefore, one of the major obstacle factor
identified in this study is lack of ICT
infrastructure, to use E-banking service, such
as internet banking, mobile banking, ATM
and others.
Table 4.1 Technological factor
I fear risk to
use
automated
teller
machine
(ATM)
Lack of confidence
with the security
aspects
considered as
barrier for the use
of E- banking
system
I do not trust the
technology
provided by the
banks
In the case of using
mobile banking,
ATM and others,
security risk
negatively affect
my decision to use
the system
There is high
uncertainty
in the
bank‘s
mode of E-
Banking
transaction
s regarding
errors
N Valid 347 348 346 348 348
Missing 1 0 2 0 0
Median 3.00 4.00 4.00 3.00 3.00
Mode 2 4 4 4 4
Note: N-Number of responses; Response measurements, 1-strongly agree, 2-Agree, 3-Neutral, 4-
Disagree and 5-Strongly disagree. Source: survey result, 2016
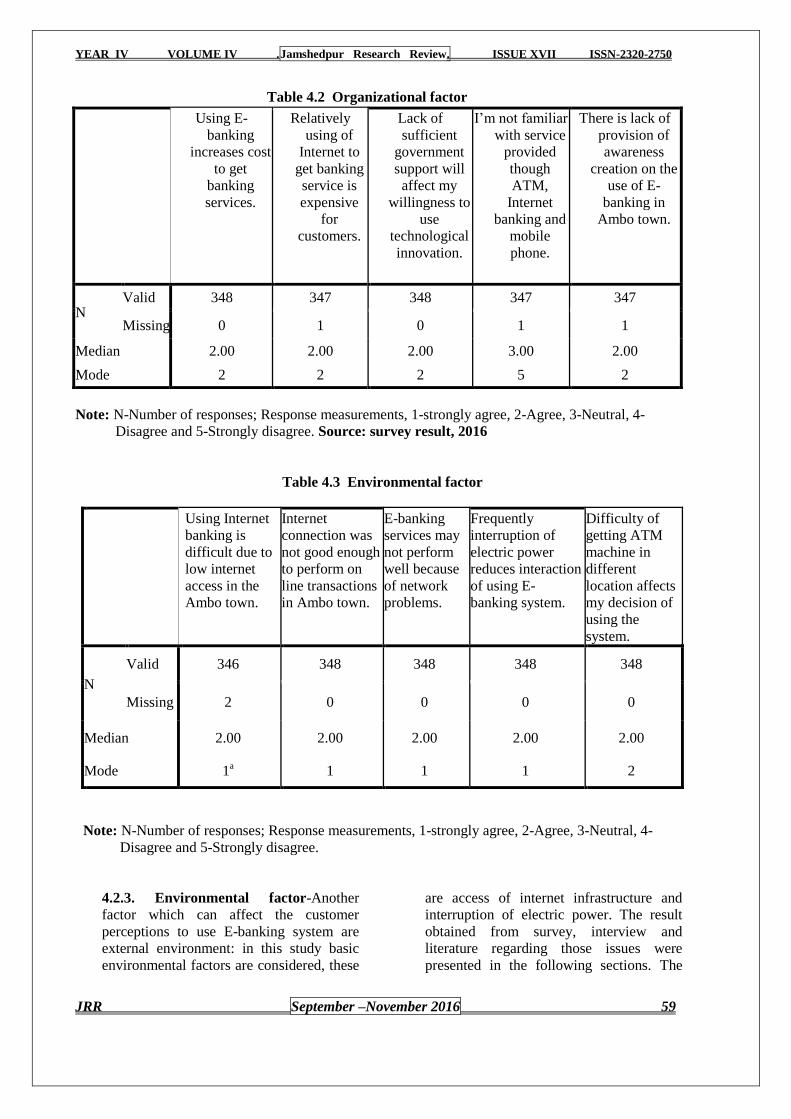
YEAR IV VOLUME IV .Jamshedpur Research Review. ISSUE XVII ISSN-2320-2750
JRR September –November 2016 59
Table 4.2 Organizational factor
Note: N-Number of responses; Response measurements, 1-strongly agree, 2-Agree, 3-Neutral, 4-
Disagree and 5-Strongly disagree. Source: survey result, 2016
Table 4.3 Environmental factor
Using Internet
banking is
difficult due to
low internet
access in the
Ambo town.
Internet
connection was
not good enough
to perform on
line transactions
in Ambo town.
E-banking
services may
not perform
well because
of network
problems.
Frequently
interruption of
electric power
reduces interaction
of using E-
banking system.
Difficulty of
getting ATM
machine in
different
location affects
my decision of
using the
system.
N
Valid 346 348 348 348 348
Missing 2 0 0 0 0
Median 2.00 2.00 2.00 2.00 2.00
Mode 1a 1 1 1 2
Note: N-Number of responses; Response measurements, 1-strongly agree, 2-Agree, 3-Neutral, 4-
Disagree and 5-Strongly disagree.
4.2.3. Environmental factor-Another
factor which can affect the customer
perceptions to use E-banking system are
external environment: in this study basic
environmental factors are considered, these
are access of internet infrastructure and
interruption of electric power. The result
obtained from survey, interview and
literature regarding those issues were
presented in the following sections. The
Using E-
banking
increases cost
to get
banking
services.
Relatively
using of
Internet to
get banking
service is
expensive
for
customers.
Lack of
sufficient
government
support will
affect my
willingness to
use
technological
innovation.
I‘m not familiar
with service
provided
though
ATM,
Internet
banking and
mobile
phone.
There is lack of
provision of
awareness
creation on the
use of E-
banking in
Ambo town.
N Valid 348 347 348 347 347
Missing 0 1 0 1 1
Median 2.00 2.00 2.00 3.00 2.00
Mode 2 2 2 5 2
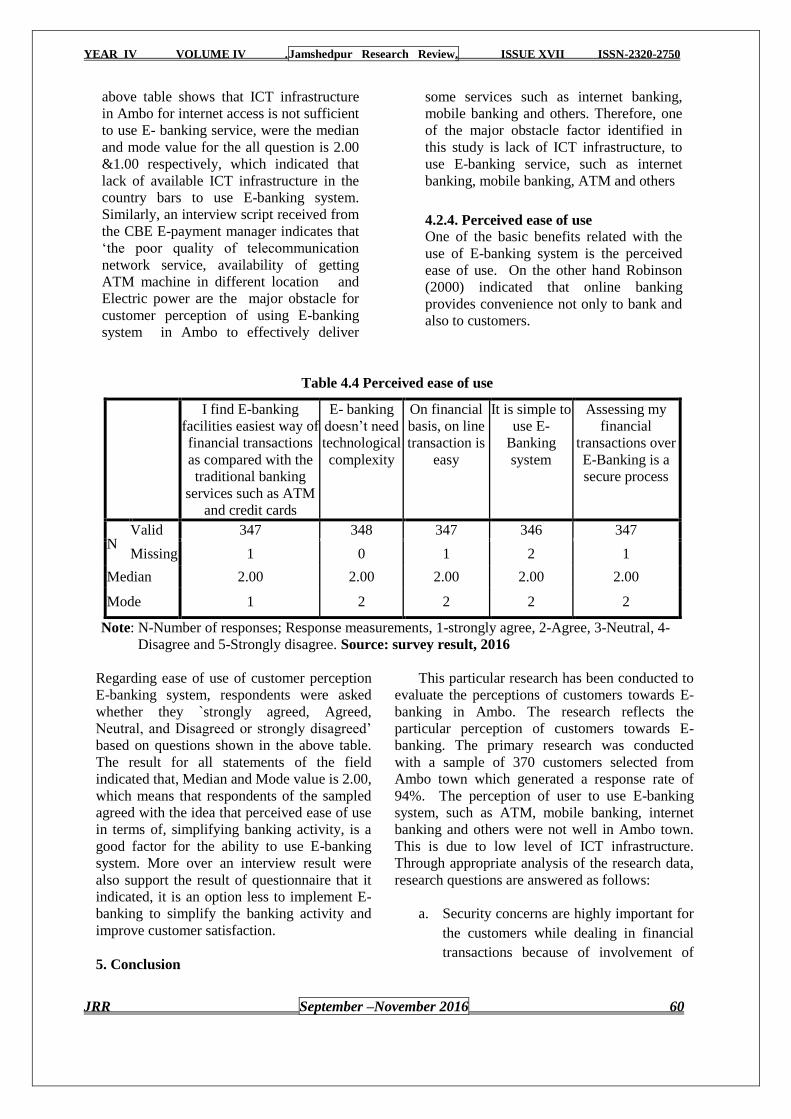
YEAR IV VOLUME IV .Jamshedpur Research Review. ISSUE XVII ISSN-2320-2750
JRR September –November 2016 60
above table shows that ICT infrastructure
in Ambo for internet access is not sufficient
to use E- banking service, were the median
and mode value for the all question is 2.00
&1.00 respectively, which indicated that
lack of available ICT infrastructure in the
country bars to use E-banking system.
Similarly, an interview script received from
the CBE E-payment manager indicates that
‗the poor quality of telecommunication
network service, availability of getting
ATM machine in different location and
Electric power are the major obstacle for
customer perception of using E-banking
system in Ambo to effectively deliver
some services such as internet banking,
mobile banking and others. Therefore, one
of the major obstacle factor identified in
this study is lack of ICT infrastructure, to
use E-banking service, such as internet
banking, mobile banking, ATM and others
4.2.4. Perceived ease of use One of the basic benefits related with the
use of E-banking system is the perceived
ease of use. On the other hand Robinson
(2000) indicated that online banking
provides convenience not only to bank and
also to customers.
Table 4.4 Perceived ease of use
Note: N-Number of responses; Response measurements, 1-strongly agree, 2-Agree, 3-Neutral, 4-
Disagree and 5-Strongly disagree. Source: survey result, 2016
Regarding ease of use of customer perception
E-banking system, respondents were asked
whether they `strongly agreed, Agreed,
Neutral, and Disagreed or strongly disagreed‘
based on questions shown in the above table.
The result for all statements of the field
indicated that, Median and Mode value is 2.00,
which means that respondents of the sampled
agreed with the idea that perceived ease of use
in terms of, simplifying banking activity, is a
good factor for the ability to use E-banking
system. More over an interview result were
also support the result of questionnaire that it
indicated, it is an option less to implement E-
banking to simplify the banking activity and
improve customer satisfaction.
5. Conclusion
This particular research has been conducted to
evaluate the perceptions of customers towards E-
banking in Ambo. The research reflects the
particular perception of customers towards E-
banking. The primary research was conducted
with a sample of 370 customers selected from
Ambo town which generated a response rate of
94%. The perception of user to use E-banking
system, such as ATM, mobile banking, internet
banking and others were not well in Ambo town.
This is due to low level of ICT infrastructure.
Through appropriate analysis of the research data,
research questions are answered as follows:
a. Security concerns are highly important for
the customers while dealing in financial
transactions because of involvement of
I find E-banking
facilities easiest way of
financial transactions
as compared with the
traditional banking
services such as ATM
and credit cards
E- banking
doesn‘t need
technological
complexity
On financial
basis, on line
transaction is
easy
It is simple to
use E-
Banking
system
Assessing my
financial
transactions over
E-Banking is a
secure process
N Valid 347 348 347 346 347
Missing 1 0 1 2 1
Median 2.00 2.00 2.00 2.00 2.00
Mode 1 2 2 2 2

YEAR IV VOLUME IV .Jamshedpur Research Review. ISSUE XVII ISSN-2320-2750
JRR September –November 2016 61
money in the transactions. The literature
findings have revealed that the customer
may have uncertainty regarding delivery
of reliable services and products. The
security in E-banking also impacts the
level of trust of customers on the E-
banking system.
b. The survey results revealed that most of
the respondents agreed that the E- banking
is convenient for them. However, some
respondents (compared older) disagreed
regarding convenience factor. It has been
concluded that these respondents might
not have enough knowledge to use the
internet that creates difficulty for them to
use E-banking. It was also found that most
of the respondents perceived security
while transferring money through E-
banking. In addition, privacy and
reliability in E- banking were also
perceived by most of the respondents. This
particular research has contributed to the
existing literature by demonstrating
different factors affecting the perceptions
of customers towards using E- banking.
Although several previous studies have
also listed these factors regarding E-
banking but these are not demonstrated in
a single study. In this regard, this
particular study adds knowledge in the
field by elaborating privacy, security,
convenience and trust perceptions of
customers towards using E- banking.
Other statistically significant factors that
enhanced the probability of customer
perception to use E- banking were use of the
Technology, educational level, Age,
occupation and marital status The frequency of
ATM use and age were inversely related
online banking. The negative coefficient on
the age variable suggests that younger
individuals are more likely to adopt these
services. The coefficient on the frequency of
ATM use, however, was somewhat surprising.
However, it could indicate that individuals that
have a high intensity of ATM use may be
substituting this service for E- banking.
References;
1. Malak, J 2007, Readiness of the
Palestinian banking sector in adopting
the electronic bankingsystem
:exploratory study, MA thesis, The
Islamic University of Palestine
2. Kamrul, H 2009, E-Banking in
Bangladesh: The Future of Banking,
School of Business
3. Furst, K & Nolle, D 2002, ‗Internet
banking: developments and
prospects‘, working Paper from office
of the comptroller of the currency,
administration of National banks.
4. Alagheband, P 2006, Adoption of
electronic banking services by Iranian
Customers, MA thesis, Lulea
University of Technology,
http://www. epubl.ltu.se/1653-
187/2006/49/LTU-
5. Khalfan, A, Alrefaei, S & Al-Hajery,
M 2006, ‗Factors influencing the
adoption of internet banking in
Oman: a descriptive case study
analysis,‘ international journal of
financial services management,
1(2/3):155-172
6. Marina L G (2009). Utilizing
Information Technology Systems
across Disciplines Advancements in
the Application of Computer Science,
301-314.
7. Sheikhshoaei F & Oloumi V. (2011).
Applying the technology acceptance
model to Iranian engineering faculty
libraries, The Electronic
Library,29(11), 367 -378.
8. Rosenberg, V (2011). Self-service
technologies: understanding customer
satisfaction with technology-based
service encounters. Journal of
Marketing, 64 (3), 50–64
9. Hearn Y & Hearn S (2008). Perceived
security threats to today‘s accounting
information system:A survey of CISA,
Information system audit control
journal, 3, 38-4.
10. Uppal, R.K,(2008), E-delivery
channels in banks-A fresh outlook,
Journal of Arts Science &Commerce
11. Lovelock, C. and Wirtz, J. (2000).
YEAR IV VOLUME IV .Jamshedpur Research Review. ISSUE XVII ISSN-2320-2750
JRR September –November 2016 62
Services marketing. People,
technology, strategy. Upper Saddle
River: Pearson Prentice Hall.
12. Uppal, R.K,(2011), E-delivery
channels in banks-A fresh outlook,
Journal of Arts Science & Commerce
13. Safeena. et al , ―Customer
Perspectives on E-business Value:
Case Study on Internet
Banking‖,JIBC, Vol. 15, No.1, April
2010
14. Woldie A., Hinson R., Iddrisu H. and
Boateng R., (2008). Internet banking:
an initial look at Ghanaian bank
consumer Perceptions, Banks and
Bank Systems, 3 (3), 3546
15. Alsajjan, B., & Dennis, C. (2010).
Internet banking acceptance model:
Cross-market examination. Journal of
Business Research, 63(9), 957–963.
16. Yang, Y 1997, The security of
electronic banking, a research paper
presented at the national formation
systems security conference U.S.A
17. Daniel A. (1994). Provision of
electronic banking in the UK
Ramsay, J. and Smith, M. (1999).
Daniel. E, ―Provision of electronic
banking in the UK and the Republic
of Ireland‖, International Journal of
Bank Marketing, Vol. 17 No. 2,
1999, pp.
18. Ayana, (2012) ‗‘Adoption of E-
Banking system in Ethiopia-Barriers
and drives‖‘,vol 1 No 1, 2012
19. Dashen bank 2011, Annual Report,
available at:
http://www.dashenbank.com
20. Tornatzky, G & Fleischer, M 1990,
The Process of Technology
Innovation, Lexington, MA,
Lexington book.
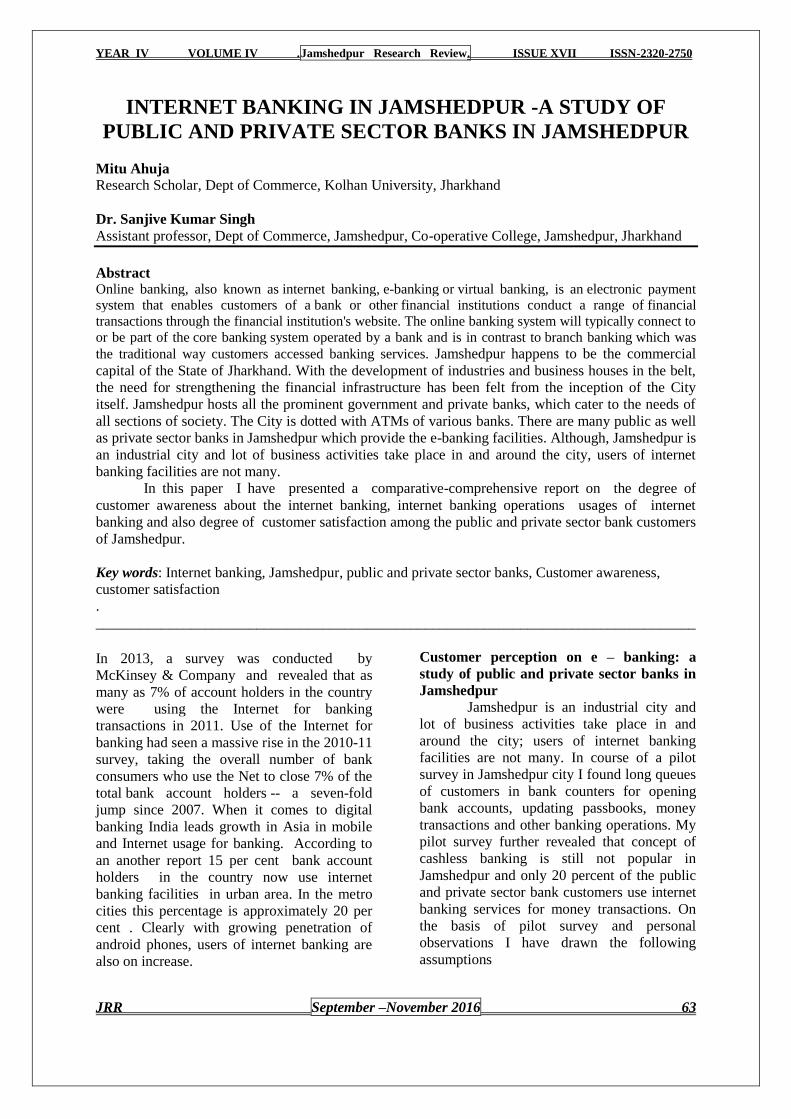
YEAR IV VOLUME IV .Jamshedpur Research Review. ISSUE XVII ISSN-2320-2750
JRR September –November 2016 63
INTERNET BANKING IN JAMSHEDPUR -A STUDY OF
PUBLIC AND PRIVATE SECTOR BANKS IN JAMSHEDPUR
Mitu Ahuja
Research Scholar, Dept of Commerce, Kolhan University, Jharkhand
Dr. Sanjive Kumar Singh
Assistant professor, Dept of Commerce, Jamshedpur, Co-operative College, Jamshedpur, Jharkhand
Abstract Online banking, also known as internet banking, e-banking or virtual banking, is an electronic payment
system that enables customers of a bank or other financial institutions conduct a range of financial
transactions through the financial institution's website. The online banking system will typically connect to
or be part of the core banking system operated by a bank and is in contrast to branch banking which was
the traditional way customers accessed banking services. Jamshedpur happens to be the commercial
capital of the State of Jharkhand. With the development of industries and business houses in the belt,
the need for strengthening the financial infrastructure has been felt from the inception of the City
itself. Jamshedpur hosts all the prominent government and private banks, which cater to the needs of
all sections of society. The City is dotted with ATMs of various banks. There are many public as well
as private sector banks in Jamshedpur which provide the e-banking facilities. Although, Jamshedpur is
an industrial city and lot of business activities take place in and around the city, users of internet
banking facilities are not many.
In this paper I have presented a comparative-comprehensive report on the degree of
customer awareness about the internet banking, internet banking operations usages of internet
banking and also degree of customer satisfaction among the public and private sector bank customers
of Jamshedpur.
Key words: Internet banking, Jamshedpur, public and private sector banks, Customer awareness,
customer satisfaction
.
__________________________________________________________________________________
In 2013, a survey was conducted by
McKinsey & Company and revealed that as
many as 7% of account holders in the country
were using the Internet for banking
transactions in 2011. Use of the Internet for
banking had seen a massive rise in the 2010-11
survey, taking the overall number of bank
consumers who use the Net to close 7% of the
total bank account holders -- a seven-fold
jump since 2007. When it comes to digital
banking India leads growth in Asia in mobile
and Internet usage for banking. According to
an another report 15 per cent bank account
holders in the country now use internet
banking facilities in urban area. In the metro
cities this percentage is approximately 20 per
cent . Clearly with growing penetration of
android phones, users of internet banking are
also on increase.
Customer perception on e – banking: a
study of public and private sector banks in
Jamshedpur
Jamshedpur is an industrial city and
lot of business activities take place in and
around the city; users of internet banking
facilities are not many. In course of a pilot
survey in Jamshedpur city I found long queues
of customers in bank counters for opening
bank accounts, updating passbooks, money
transactions and other banking operations. My
pilot survey further revealed that concept of
cashless banking is still not popular in
Jamshedpur and only 20 percent of the public
and private sector bank customers use internet
banking services for money transactions. On
the basis of pilot survey and personal
observations I have drawn the following
assumptions

YEAR IV VOLUME IV .Jamshedpur Research Review. ISSUE XVII ISSN-2320-2750
JRR September –November 2016 64
Public and private sector bank customers
of Jamshedpur are not well aware of the
concept of internet banking, usages of
internet banking.
Public and private sector bank customers
of Jamshedpur are not satisfied with the
internet banking products, services, and
security measures etc. of their respective
banks.
Public and private sector bank customers
have different level of customer awareness
and, customer satisfaction level with
respect to internet banking.
Methodology: The methodology of my
research work is primarily exploratory and
empirical in nature. The research work is
naturalistic & interpretive in nature as it relies
heavily on gathering customers observations
and behavioral aspects. In an interpretative
approach it is the individual experience which
is valid and important. Two types of data used
for achieving the objectives and testing the
hypotheses. Secondary data used to study the
current status of e- banking in India in general
and Jamshedpur in particular. To study the
behavioral aspects and satisfaction level of
customers, a survey with the help of formally
designed questionnaire was used.
Sample size was 100 from both the sectors
(public and private sector banks). Random
sampling technique used for picking sample
from different public sector bank and private
sector bank Universe of the study. The entire
research including survey was conducted in
Jamshedpur city only. For the statistical
analysis left tailed t test and one way Anova
were used. The sources of secondary data was
RBI websites, local bank websites journals,
news-paper articles, magazines, library books
etc.
Hypothesis testing
Ho: Degree of awareness about the term Internet Banking is satisfactory among private
and public sector bank customers of Jamshedpur
H1 : Degree of awareness about the term Internet Banking is NOT satisfactory among
private and public sector bank customers of Jamshedpur
.
Ho: Public and private sector bank customers of Jamshedpur are satisfied with Internet
Banking services provided by their respective banks
H1: Public and private sector bank customers of Jamshedpur are NOT satisfied with
Internet Banking services provide
TEST HEURISTICS
1-Fully Unaware/ Fully dissatisfied,
2-Unaware/Dissatisfied
3-Moderately Aware/ Moderately satisfied
4- Well Aware/ Well satisfied
5- Fully Aware/Fully Satisfied
Table value of t at 99 degree of
freedom and 95 % confidence level
(one tailed test)=1.645
Null hypothesis: ≥ -1.645
Alternative hypothesis < -1.645
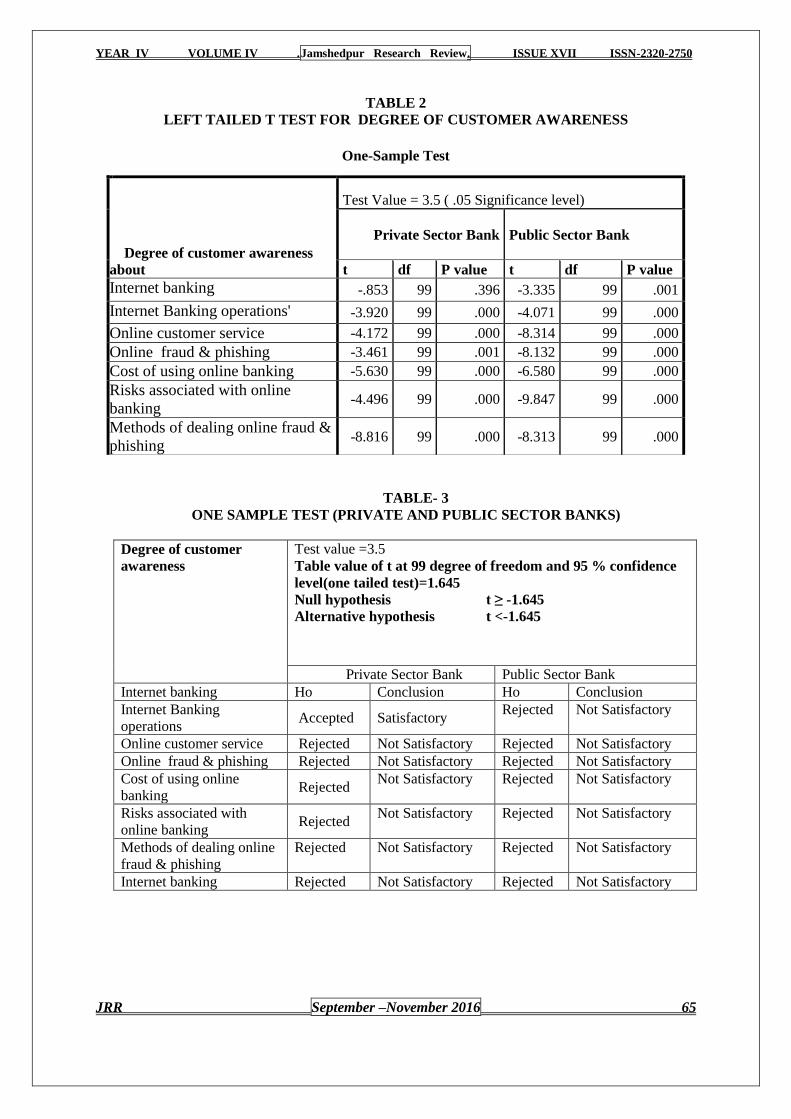
YEAR IV VOLUME IV .Jamshedpur Research Review. ISSUE XVII ISSN-2320-2750
JRR September –November 2016 65
TABLE 2
LEFT TAILED T TEST FOR DEGREE OF CUSTOMER AWARENESS
TABLE- 3
ONE SAMPLE TEST (PRIVATE AND PUBLIC SECTOR BANKS)
Degree of customer
awareness
Test value =3.5
Table value of t at 99 degree of freedom and 95 % confidence
level(one tailed test)=1.645
Null hypothesis t ≥ -1.645
Alternative hypothesis t <-1.645
Private Sector Bank Public Sector Bank
Internet banking Ho Conclusion Ho Conclusion
Internet Banking
operations Accepted Satisfactory
Rejected Not Satisfactory
Online customer service Rejected Not Satisfactory Rejected Not Satisfactory
Online fraud & phishing Rejected Not Satisfactory Rejected Not Satisfactory
Cost of using online
banking Rejected
Not Satisfactory Rejected Not Satisfactory
Risks associated with
online banking Rejected
Not Satisfactory Rejected Not Satisfactory
Methods of dealing online
fraud & phishing
Rejected Not Satisfactory Rejected Not Satisfactory
Internet banking Rejected Not Satisfactory Rejected Not Satisfactory
One-Sample Test
Degree of customer awareness
about
Test Value = 3.5 ( .05 Significance level)
Private Sector Bank Public Sector Bank
t df P value t df P value
Internet banking -.853 99 .396 -3.335 99 .001
Internet Banking operations' -3.920 99 .000 -4.071 99 .000
Online customer service -4.172 99 .000 -8.314 99 .000
Online fraud & phishing -3.461 99 .001 -8.132 99 .000
Cost of using online banking -5.630 99 .000 -6.580 99 .000
Risks associated with online
banking -4.496 99 .000 -9.847 99 .000
Methods of dealing online fraud &
phishing -8.816 99 .000 -8.313 99 .000
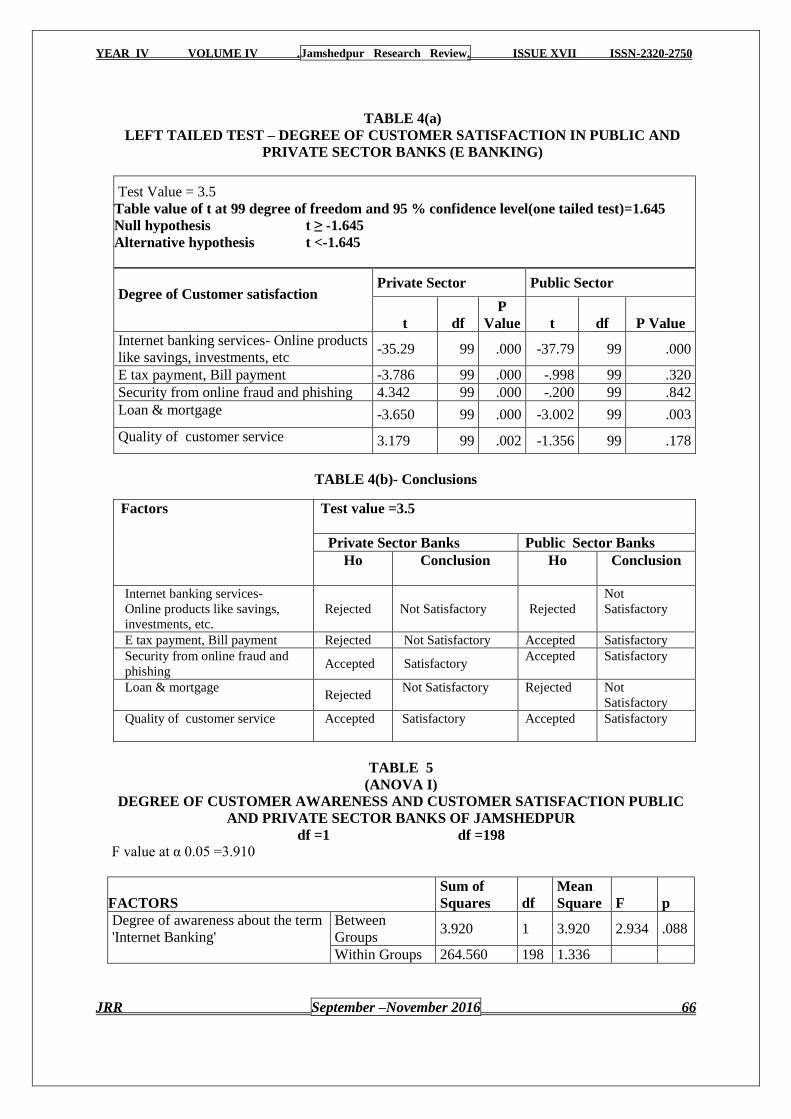
YEAR IV VOLUME IV .Jamshedpur Research Review. ISSUE XVII ISSN-2320-2750
JRR September –November 2016 66
TABLE 4(a)
LEFT TAILED TEST – DEGREE OF CUSTOMER SATISFACTION IN PUBLIC AND
PRIVATE SECTOR BANKS (E BANKING)
Test Value = 3.5
Table value of t at 99 degree of freedom and 95 % confidence level(one tailed test)=1.645
Null hypothesis t ≥ -1.645
Alternative hypothesis t <-1.645
Degree of Customer satisfaction Private Sector Public Sector
t df
P
Value t df P Value
Internet banking services- Online products
like savings, investments, etc -35.29 99 .000 -37.79 99 .000
E tax payment, Bill payment -3.786 99 .000 -.998 99 .320
Security from online fraud and phishing 4.342 99 .000 -.200 99 .842
Loan & mortgage -3.650 99 .000 -3.002 99 .003
Quality of customer service 3.179 99 .002 -1.356 99 .178
TABLE 4(b)- Conclusions
TABLE 5
(ANOVA I)
DEGREE OF CUSTOMER AWARENESS AND CUSTOMER SATISFACTION PUBLIC
AND PRIVATE SECTOR BANKS OF JAMSHEDPUR
df =1 df =198
F value at α 0.05 =3.910
FACTORS
Sum of
Squares df
Mean
Square F p
Degree of awareness about the term
'Internet Banking'
Between
Groups 3.920 1 3.920 2.934 .088
Within Groups 264.560 198 1.336
Factors Test value =3.5
Private Sector Banks Public Sector Banks
Ho Conclusion Ho Conclusion
Internet banking services-
Online products like savings,
investments, etc.
Rejected Not Satisfactory Rejected
Not
Satisfactory
E tax payment, Bill payment Rejected Not Satisfactory Accepted Satisfactory
Security from online fraud and
phishing Accepted Satisfactory
Accepted Satisfactory
Loan & mortgage Rejected
Not Satisfactory
Rejected Not
Satisfactory
Quality of customer service Accepted
Satisfactory
Accepted Satisfactory
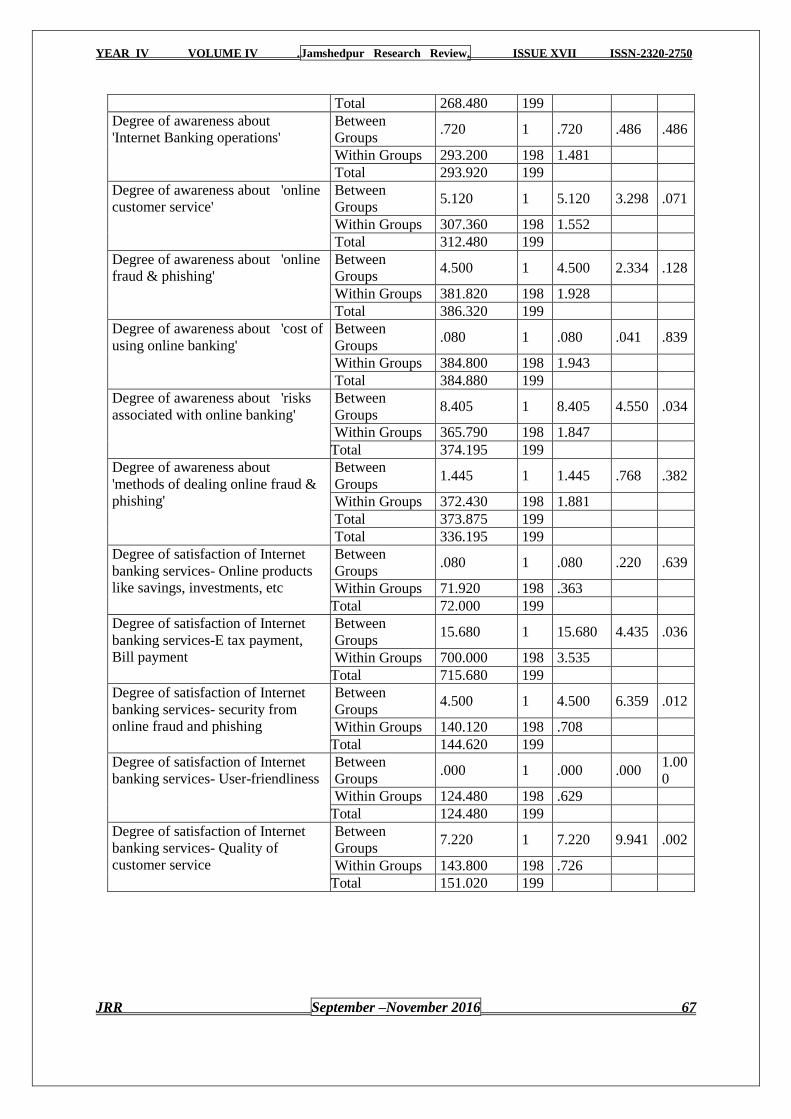
YEAR IV VOLUME IV .Jamshedpur Research Review. ISSUE XVII ISSN-2320-2750
JRR September –November 2016 67
Total 268.480 199
Degree of awareness about
'Internet Banking operations'
Between
Groups .720 1 .720 .486 .486
Within Groups 293.200 198 1.481
Total 293.920 199
Degree of awareness about 'online
customer service'
Between
Groups 5.120 1 5.120 3.298 .071
Within Groups 307.360 198 1.552
Total 312.480 199
Degree of awareness about 'online
fraud & phishing'
Between
Groups 4.500 1 4.500 2.334 .128
Within Groups 381.820 198 1.928
Total 386.320 199
Degree of awareness about 'cost of
using online banking'
Between
Groups .080 1 .080 .041 .839
Within Groups 384.800 198 1.943
Total 384.880 199
Degree of awareness about 'risks
associated with online banking'
Between
Groups 8.405 1 8.405 4.550 .034
Within Groups 365.790 198 1.847
Total 374.195 199
Degree of awareness about
'methods of dealing online fraud &
phishing'
Between
Groups 1.445 1 1.445 .768 .382
Within Groups 372.430 198 1.881
Total 373.875 199
Total 336.195 199
Degree of satisfaction of Internet
banking services- Online products
like savings, investments, etc
Between
Groups .080 1 .080 .220 .639
Within Groups 71.920 198 .363
Total 72.000 199
Degree of satisfaction of Internet
banking services-E tax payment,
Bill payment
Between
Groups 15.680 1 15.680 4.435 .036
Within Groups 700.000 198 3.535
Total 715.680 199
Degree of satisfaction of Internet
banking services- security from
online fraud and phishing
Between
Groups 4.500 1 4.500 6.359 .012
Within Groups 140.120 198 .708
Total 144.620 199
Degree of satisfaction of Internet
banking services- User-friendliness
Between
Groups .000 1 .000 .000
1.00
0
Within Groups 124.480 198 .629
Total 124.480 199
Degree of satisfaction of Internet
banking services- Quality of
customer service
Between
Groups 7.220 1 7.220 9.941 .002
Within Groups 143.800 198 .726
Total 151.020 199
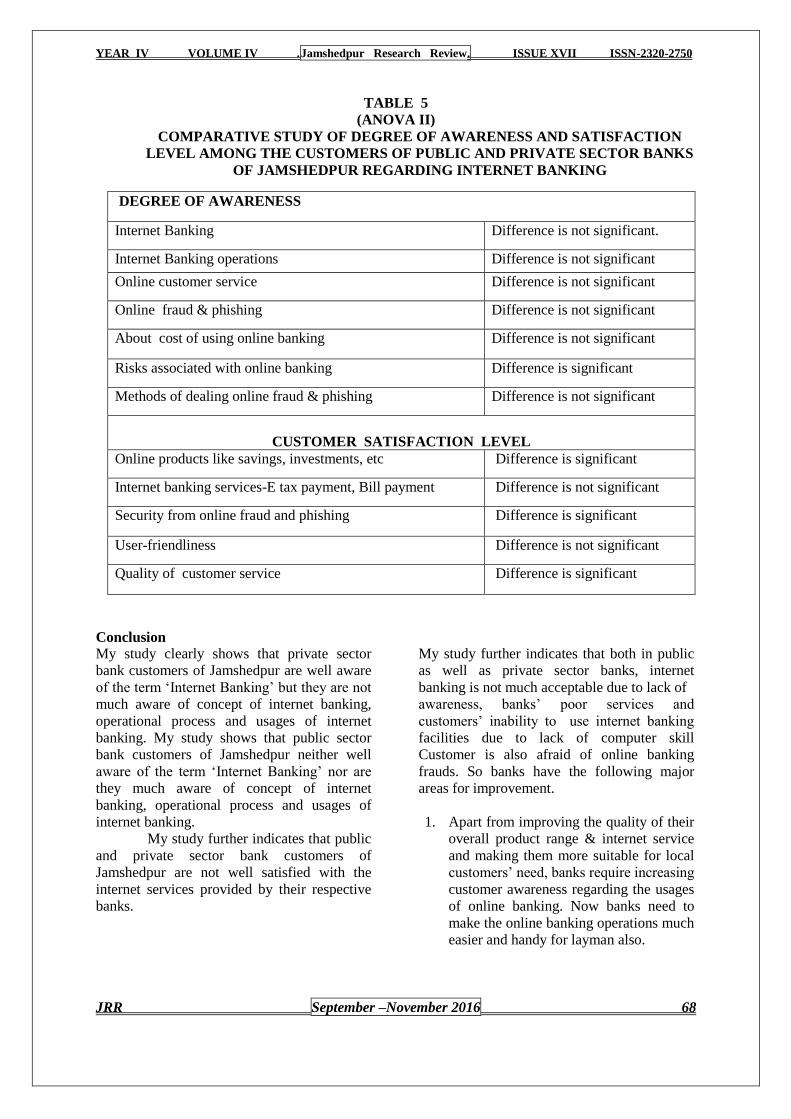
YEAR IV VOLUME IV .Jamshedpur Research Review. ISSUE XVII ISSN-2320-2750
JRR September –November 2016 68
TABLE 5
(ANOVA II)
COMPARATIVE STUDY OF DEGREE OF AWARENESS AND SATISFACTION
LEVEL AMONG THE CUSTOMERS OF PUBLIC AND PRIVATE SECTOR BANKS
OF JAMSHEDPUR REGARDING INTERNET BANKING
DEGREE OF AWARENESS
Internet Banking Difference is not significant.
Internet Banking operations Difference is not significant
Online customer service Difference is not significant
Online fraud & phishing Difference is not significant
About cost of using online banking Difference is not significant
Risks associated with online banking Difference is significant
Methods of dealing online fraud & phishing Difference is not significant
CUSTOMER SATISFACTION LEVEL
Online products like savings, investments, etc Difference is significant
Internet banking services-E tax payment, Bill payment Difference is not significant
Security from online fraud and phishing Difference is significant
User-friendliness Difference is not significant
Quality of customer service Difference is significant
Conclusion
My study clearly shows that private sector
bank customers of Jamshedpur are well aware
of the term ‗Internet Banking‘ but they are not
much aware of concept of internet banking,
operational process and usages of internet
banking. My study shows that public sector
bank customers of Jamshedpur neither well
aware of the term ‗Internet Banking‘ nor are
they much aware of concept of internet
banking, operational process and usages of
internet banking.
My study further indicates that public
and private sector bank customers of
Jamshedpur are not well satisfied with the
internet services provided by their respective
banks.
My study further indicates that both in public
as well as private sector banks, internet
banking is not much acceptable due to lack of
awareness, banks‘ poor services and
customers‘ inability to use internet banking
facilities due to lack of computer skill
Customer is also afraid of online banking
frauds. So banks have the following major
areas for improvement.
1. Apart from improving the quality of their
overall product range & internet service
and making them more suitable for local
customers‘ need, banks require increasing
customer awareness regarding the usages
of online banking. Now banks need to
make the online banking operations much
easier and handy for layman also.
YEAR IV VOLUME IV .Jamshedpur Research Review. ISSUE XVII ISSN-2320-2750
JRR September –November 2016 69
2. Need to take steps to control online bank
frauds by increasing customer awareness
and high tech interventions
3. Need to encourage customers for using
online banking – for that need to be
organizing special training programmer
for customers in the banks
4. Need to give special focus on women and
young girls. In India women have bank
accounts but they are operated by male
family members. Once women begin to
use internet banking from their home,
they will become more financially
independent and empowered. It is more
useful for the women working in
unorganized sector or government
poverty eradication programme like
MANREGA.
5. Apart from above mentioned suggestions
standardization, adaptation of best
security methods, human relations in
computerized environment, legal issues,
technological up gradation, process re-
engineering for controlling cost and
increasing efficiency etc are major
challenges that need to addressed to
make the internet banking more
acceptable, affordable, accountable and
accessible to the millions and millions of
people of India.
References:
1. www.business-
standard.com/article/finance/7-account-
holders-in-india-use-net-banking-study-
111072000193_1.html
2. Radhe Shyam Rungta (1970). The Rise
of Business Corporations in India, 1851-
1900. CUP Archive. p. 221.
GGKEY:NC1SA25Y2CB. Retrieved 12
January 2015.
3. Muthiah S (2011). Madras Miscellany.
Westland. p. 933. ISBN 978-93-80032-
84-9. "The Advent of Modern Banking in
India: 1720 to 1850s". Reserve Bank of
India. Retrieved 12 August 2016.
4. Cronin, Mary J. (1997). Banking and
Finance on the Internet, John Wiley and
Sons. ISBN 0-471-29219-2 page 41
from Banking and Finance on the
Internet.
5. Banking and Finance on the Internet,"
edited by Mary J. Cronin
6. "Stanford Federal Credit Union Pioneers
Online Financial Services." (Press
release). 1995-06-21.
7. Abdou, Hussein, English, John and
Adewunmi, Paul An investigation of risk
management practices in electronic
banking: the case of the UK
bankseprints.hud.ac.uk, University of
Huddersfield, July 22, 2014 (PDF; 474
kB)
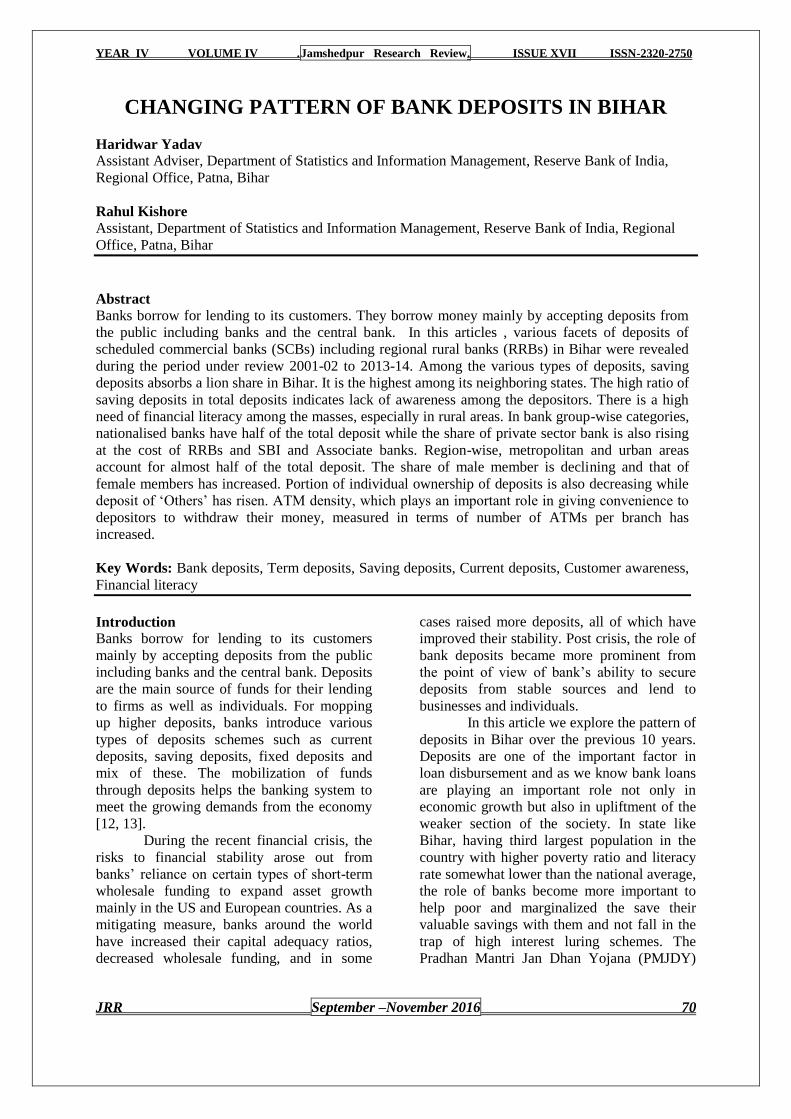
YEAR IV VOLUME IV .Jamshedpur Research Review. ISSUE XVII ISSN-2320-2750
JRR September –November 2016 70
CHANGING PATTERN OF BANK DEPOSITS IN BIHAR
Haridwar Yadav
Assistant Adviser, Department of Statistics and Information Management, Reserve Bank of India,
Regional Office, Patna, Bihar
Rahul Kishore
Assistant, Department of Statistics and Information Management, Reserve Bank of India, Regional
Office, Patna, Bihar
Abstract Banks borrow for lending to its customers. They borrow money mainly by accepting deposits from
the public including banks and the central bank. In this articles , various facets of deposits of
scheduled commercial banks (SCBs) including regional rural banks (RRBs) in Bihar were revealed
during the period under review 2001-02 to 2013-14. Among the various types of deposits, saving
deposits absorbs a lion share in Bihar. It is the highest among its neighboring states. The high ratio of
saving deposits in total deposits indicates lack of awareness among the depositors. There is a high
need of financial literacy among the masses, especially in rural areas. In bank group-wise categories,
nationalised banks have half of the total deposit while the share of private sector bank is also rising
at the cost of RRBs and SBI and Associate banks. Region-wise, metropolitan and urban areas
account for almost half of the total deposit. The share of male member is declining and that of
female members has increased. Portion of individual ownership of deposits is also decreasing while
deposit of ‗Others‘ has risen. ATM density, which plays an important role in giving convenience to
depositors to withdraw their money, measured in terms of number of ATMs per branch has
increased.
Key Words: Bank deposits, Term deposits, Saving deposits, Current deposits, Customer awareness,
Financial literacy
Introduction Banks borrow for lending to its customers
mainly by accepting deposits from the public
including banks and the central bank. Deposits
are the main source of funds for their lending
to firms as well as individuals. For mopping
up higher deposits, banks introduce various
types of deposits schemes such as current
deposits, saving deposits, fixed deposits and
mix of these. The mobilization of funds
through deposits helps the banking system to
meet the growing demands from the economy
[12, 13].
During the recent financial crisis, the
risks to financial stability arose out from
banks‘ reliance on certain types of short-term
wholesale funding to expand asset growth
mainly in the US and European countries. As a
mitigating measure, banks around the world
have increased their capital adequacy ratios,
decreased wholesale funding, and in some
cases raised more deposits, all of which have
improved their stability. Post crisis, the role of
bank deposits became more prominent from
the point of view of bank‘s ability to secure
deposits from stable sources and lend to
businesses and individuals.
In this article we explore the pattern of
deposits in Bihar over the previous 10 years.
Deposits are one of the important factor in
loan disbursement and as we know bank loans
are playing an important role not only in
economic growth but also in upliftment of the
weaker section of the society. In state like
Bihar, having third largest population in the
country with higher poverty ratio and literacy
rate somewhat lower than the national average,
the role of banks become more important to
help poor and marginalized the save their
valuable savings with them and not fall in the
trap of high interest luring schemes. The
Pradhan Mantri Jan Dhan Yojana (PMJDY)
YEAR IV VOLUME IV .Jamshedpur Research Review. ISSUE XVII ISSN-2320-2750
JRR September –November 2016 71
has been instrumental in bringing the people in
lower strata of society under the formal
banking system. Now it‘s an important time
for banks to aware people specially who are
first time account holder to save their saving in
their account for future needs. The overall
growth of deposits in Bihar from 2009-10 Q1
to 2015-16 Q2 stood at 160.60 per cent as
compared to 125 per cent nationally. The
Compounded Annual Growth Rate (CAGR) of
deposits for Bihar also scores better than the
national average, 19.0 per cent for Bihar as
compared to 15.9 per cent for India.
Determinants of Deposit Growth
1. Higher income: Higher the income of the
public higher will be their capacity to do
deposit. Government should try to bring
more working population in organized
sector and to support those in unorganized
sector.
2. Lower and stable inflation: Inflation not
only kill the people‘s ability to save but
also lowers their desire to save because of
lower or negative real return which they
get.
3. More banking outlet: If more bank
branches are opened with greater
penetration people will do more deposit
because it would be convenient to them.
4. New banking alternatives: Several new
alternatives like Business Correspondents
may prove helpful in accruing more and
more deposit.
5. Financial literacy: If people will become
more aware about the benefits of thrift and
saving more deposit can be accrue by
banks hence it is important to aware
people about savings.
6. New deposit schemes: If banks come with
newer term deposit schemes then it will
also lead to increased deposit.
7. Institutions back deposit insurance:
Insurance on bank deposit like that of
DICGC in India plays an important role in
deposit harnessing. Steps can be taken to
increase the insurance on quantum of
deposit and on deposit of other channels
like NBFCs.
Methodology
For the purpose of our study we have taken the
data for Quarterly Statistics of Credit and
Deposits of SCBs in India published by RBI.
In the following sections we will discuss the
trends in deposit growth in Bihar vis-à-vis all-
India over the years, ATM density in Bihar
vis-à-vis All-India, analysis of deposits on the
basis of its type, bank-wise, region-wise and
according to gender.
The method of least squares is used to fit the
regression line between deposits and time
(year) [1, 11]
Log (Deposits) =a + b (year)
Where a and b are constants to be estimated.
The constant ‗b‘ gives the instantaneous rate
of growth (at a point in time) and not the
compound (over a period of time). The
compounded annual growth rate (CAGR) is
the mean annual growth rate of deposits over a
specified period of time longer than one year.
The formula of Compounded Annual Growth
Rate (CAGR) is as follows:
CAGR=(Antilog b – 1)*100
Coefficient of variation (CV) is used to
analyse the extent of variation in deposits. If it
is less, means greater stability, more
consistency, uniformity and homogeneity in
deposits. CV is defined as follows:
CV=Standard Deviation (σ)/
Arithmetic mean (µ)*100
Where σ =Positive Square Root of mean of
square of deviations of the variable from their
mean
µ=Sum of the variable/ Number of
Observations=∑x / N
In regression, R2 is a statistic, known as
coefficient of determination, will give some
information about the goodness of fit of a
model. R2 measure statistically how well the
regression line approximates the real data
points. An R2 of 1 indicates that the regression
line perfectly fits the data. A high R2, between
85% and 100% generally treated as regression
line approximates fit the real data well. A low
R2 at 70% or less indicates the regression line
does not fit well.
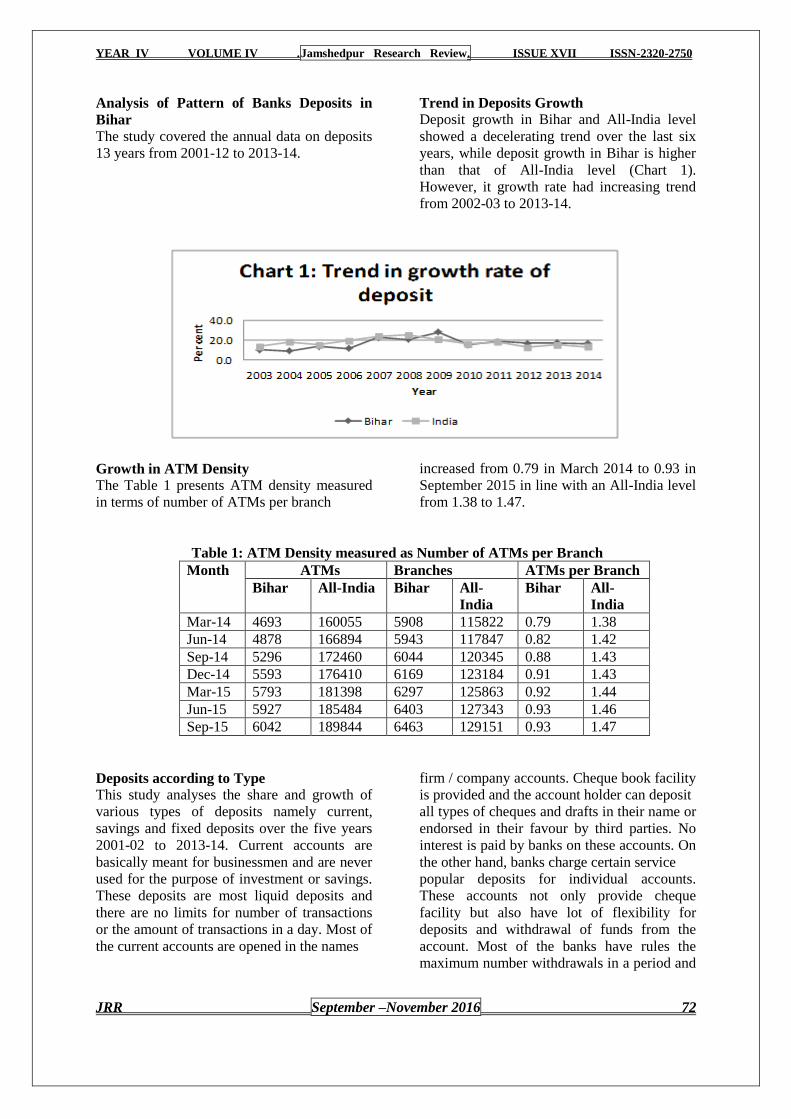
YEAR IV VOLUME IV .Jamshedpur Research Review. ISSUE XVII ISSN-2320-2750
JRR September –November 2016 72
Analysis of Pattern of Banks Deposits in
Bihar
The study covered the annual data on deposits
13 years from 2001-12 to 2013-14.
Trend in Deposits Growth
Deposit growth in Bihar and All-India level
showed a decelerating trend over the last six
years, while deposit growth in Bihar is higher
than that of All-India level (Chart 1).
However, it growth rate had increasing trend
from 2002-03 to 2013-14.
Growth in ATM Density
The Table 1 presents ATM density measured
in terms of number of ATMs per branch
increased from 0.79 in March 2014 to 0.93 in
September 2015 in line with an All-India level
from 1.38 to 1.47.
Table 1: ATM Density measured as Number of ATMs per Branch
Month ATMs Branches ATMs per Branch
Bihar All-India Bihar All-
India
Bihar All-
India
Mar-14 4693 160055 5908 115822 0.79 1.38
Jun-14 4878 166894 5943 117847 0.82 1.42
Sep-14 5296 172460 6044 120345 0.88 1.43
Dec-14 5593 176410 6169 123184 0.91 1.43
Mar-15 5793 181398 6297 125863 0.92 1.44
Jun-15 5927 185484 6403 127343 0.93 1.46
Sep-15 6042 189844 6463 129151 0.93 1.47
Deposits according to Type
This study analyses the share and growth of
various types of deposits namely current,
savings and fixed deposits over the five years
2001-02 to 2013-14. Current accounts are
basically meant for businessmen and are never
used for the purpose of investment or savings.
These deposits are most liquid deposits and
there are no limits for number of transactions
or the amount of transactions in a day. Most of
the current accounts are opened in the names
firm / company accounts. Cheque book facility
is provided and the account holder can deposit
all types of cheques and drafts in their name or
endorsed in their favour by third parties. No
interest is paid by banks on these accounts. On
the other hand, banks charge certain service
popular deposits for individual accounts.
These accounts not only provide cheque
facility but also have lot of flexibility for
deposits and withdrawal of funds from the
account. Most of the banks have rules the
maximum number withdrawals in a period and
YEAR IV VOLUME IV .Jamshedpur Research Review. ISSUE XVII ISSN-2320-2750
JRR September –November 2016 73
the maximum amount of withdrawal, but
hardly any bank enforce these. However,
banks have every right to enforce such
restrictions if it is felt that the account is being
misused as a current account. Till November
24, 2011, the interest rate on savings bank
account was regulated by RBI and it was fixed
at 4.0 per cent on daily basis. With effect from
25th October 2011, RBI has deregulated saving
fund account interest rates and now banks are
free to decide the same within certain
conditions imposed by the RBI. Under RBI‘s
directions, now banks are also required to open
no frill accounts; this term is used for accounts
which do not have any minimum balance
requirements. Although public sector banks
still pay only 4 per cent rate of interest, some
private sector banks like Kotak Bank and Yes
Bank pay between 6 to 7 per cent on such
deposits. From the financial year 2012-13,
interest earned up to Rs.10,000 in a financial
year on saving bank accounts is exempted
from tax.
Fixed deposits are a deposit of definite
some of money for a fixed period at a
fixed/floating rate of interest. The depositors
agree to receive from the bank the principal
amount after stipulated period. Interest may be
received either periodically or on maturity. All
banks in India offer fixed deposits schemes
with a wide range of tenures for periods from
7 days to 10 years. The depositors are
supposed to continue such fixed deposits for a
length of time for which the depositor decides
to keep the money with the bank. However, in
case of need, the depositor can ask for closing
the fixed deposit prematurely by paying a
penalty (usually of 1 per cent, but some banks
either charge less or no penalty). Some banks
introduced variable interest rate fixed deposits.
The rate of interest on such deposits keeps on
varying with the prevalent market rates, that is,
it will go up if market interest rates fall.
However, such type of fixed deposits have not
been popular till date. The rate of interest for
fixed deposits differ from bank to bank (unlike
earlier when the same was regulated by RBI
and all banks used to have the same interest
rate structure. The present trend indicate that
private sector and foreign banks offer higher
rate of interest. Recurring deposits are special
kind term deposits and are suitable for people
who do not have lump sum amount of savings,
but are ready to save a small amount every
month. Normally, such deposits earn interest
on the amount already deposited through
monthly installments at the same rates as are
applicable for Fixed Deposits. These are the
best if you wish to create a fund for your
child‘s education or marriage of your daughter
or buy car without loans or save for the future.
Under these type of deposits, the person has to
usually deposit a fixed amount of money every
month usually a minimum of Rs.100 per
month.. However, some banks besides offering
a fixed installment recurring deposits (RDs),
have also introduced a flexible / variable
recurring deposits. Under these flexible
recurring deposits, the person is allowed to
deposit even higher amounts of installments,
with an upper limit fixed for the same, e.g., ten
times of the minimum amount agreed upon.
These accounts can be funded by giving
standing instructions by which bank by which
bank withdraws a fixed amount on a fixed date
of month from the saving bank of the customer
and the same is credited to RD account.
Recurring deposit accounts are normally
allowed for maturities ranging from 6 months
to 120 months. In case installment is delayed,
the interest payable in the account will be
reduced and some nominal amount permitted
is usually allowed. These accounts can be
opened in single or joint names. Nomination
facility is also available.
Table 2 represents the deposits
mobilized in the form of current, savings and
fixed deposits. It is observed that there was an
increasing trend in deposits mobilized during
the period. The composition of different types
of deposits (current, savings and term
deposits) in Bihar has mixed trend. While
proportion of saving deposits increased during
the period under review, the proportion of
current account deposits and term deposits
decreased. The proportion of current deposit
first increased from 7.7 per cent in 2001-02 to
12.6 per cent in 2008-09 but then it declined
and stood at 8.0 per cent in 2013-14. The
proportion of term deposits in Bihar is 36 per
cent of total deposits, in contrast with that in
developed states like Maharashtra and Gujrat
where more than 76 per cent and 64 per cent
deposits, respectively, are in term deposit
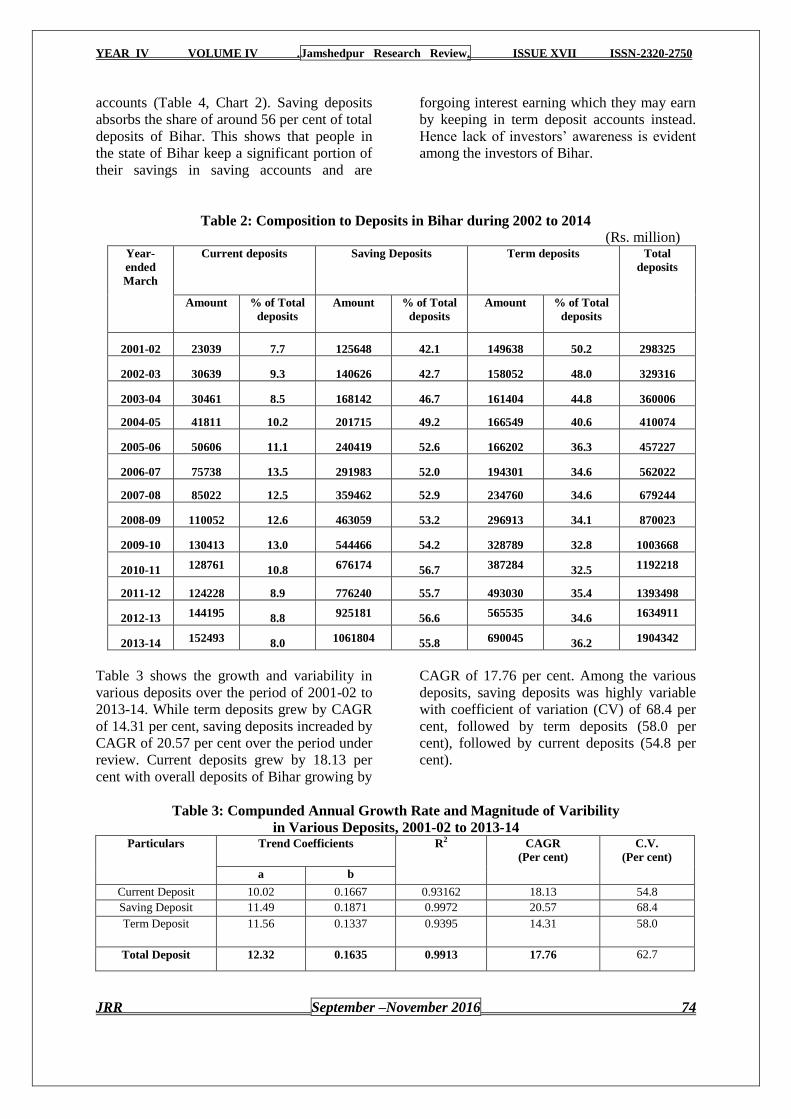
YEAR IV VOLUME IV .Jamshedpur Research Review. ISSUE XVII ISSN-2320-2750
JRR September –November 2016 74
accounts (Table 4, Chart 2). Saving deposits
absorbs the share of around 56 per cent of total
deposits of Bihar. This shows that people in
the state of Bihar keep a significant portion of
their savings in saving accounts and are
forgoing interest earning which they may earn
by keeping in term deposit accounts instead.
Hence lack of investors‘ awareness is evident
among the investors of Bihar.
Table 2: Composition to Deposits in Bihar during 2002 to 2014
(Rs. million) Year-
ended
March
Current deposits
Saving Deposits Term deposits Total
deposits
Amount % of Total
deposits
Amount % of Total
deposits
Amount % of Total
deposits
2001-02 23039 7.7 125648 42.1 149638 50.2 298325
2002-03 30639 9.3 140626 42.7 158052 48.0 329316
2003-04 30461 8.5 168142 46.7 161404 44.8 360006
2004-05 41811 10.2 201715 49.2 166549 40.6 410074
2005-06 50606 11.1 240419 52.6 166202 36.3 457227
2006-07 75738 13.5 291983 52.0 194301 34.6 562022
2007-08 85022 12.5 359462 52.9 234760 34.6 679244
2008-09 110052 12.6 463059 53.2 296913 34.1 870023
2009-10 130413 13.0 544466 54.2 328789 32.8 1003668
2010-11 128761 10.8 676174 56.7 387284 32.5 1192218
2011-12 124228 8.9 776240 55.7 493030 35.4 1393498
2012-13 144195 8.8 925181 56.6 565535 34.6 1634911
2013-14 152493 8.0 1061804 55.8 690045 36.2 1904342
Table 3 shows the growth and variability in
various deposits over the period of 2001-02 to
2013-14. While term deposits grew by CAGR
of 14.31 per cent, saving deposits increaded by
CAGR of 20.57 per cent over the period under
review. Current deposits grew by 18.13 per
cent with overall deposits of Bihar growing by
CAGR of 17.76 per cent. Among the various
deposits, saving deposits was highly variable
with coefficient of variation (CV) of 68.4 per
cent, followed by term deposits (58.0 per
cent), followed by current deposits (54.8 per
cent).
Table 3: Compunded Annual Growth Rate and Magnitude of Varibility
in Various Deposits, 2001-02 to 2013-14 Particulars Trend Coefficients R2 CAGR
(Per cent)
C.V.
(Per cent)
a b
Current Deposit 10.02 0.1667 0.93162 18.13 54.8
Saving Deposit 11.49 0.1871 0.9972 20.57 68.4
Term Deposit 11.56 0.1337 0.9395 14.31 58.0
Total Deposit 12.32 0.1635 0.9913 17.76 62.7
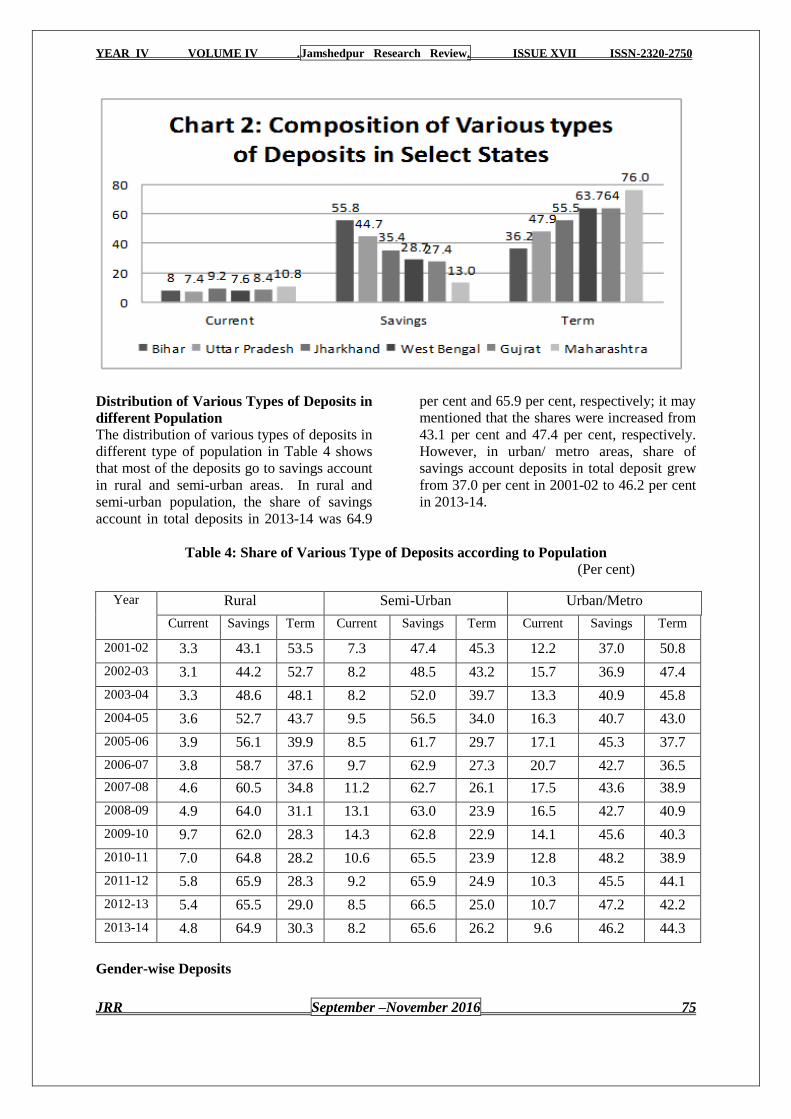
YEAR IV VOLUME IV .Jamshedpur Research Review. ISSUE XVII ISSN-2320-2750
JRR September –November 2016 75
Distribution of Various Types of Deposits in
different Population
The distribution of various types of deposits in
different type of population in Table 4 shows
that most of the deposits go to savings account
in rural and semi-urban areas. In rural and
semi-urban population, the share of savings
account in total deposits in 2013-14 was 64.9
per cent and 65.9 per cent, respectively; it may
mentioned that the shares were increased from
43.1 per cent and 47.4 per cent, respectively.
However, in urban/ metro areas, share of
savings account deposits in total deposit grew
from 37.0 per cent in 2001-02 to 46.2 per cent
in 2013-14.
Table 4: Share of Various Type of Deposits according to Population
(Per cent)
Gender-wise Deposits
Year Rural Semi-Urban Urban/Metro
Current Savings Term Current Savings Term Current Savings Term
2001-02 3.3 43.1 53.5 7.3 47.4 45.3 12.2 37.0 50.8
2002-03 3.1 44.2 52.7 8.2 48.5 43.2 15.7 36.9 47.4
2003-04 3.3 48.6 48.1 8.2 52.0 39.7 13.3 40.9 45.8
2004-05 3.6 52.7 43.7 9.5 56.5 34.0 16.3 40.7 43.0
2005-06 3.9 56.1 39.9 8.5 61.7 29.7 17.1 45.3 37.7
2006-07 3.8 58.7 37.6 9.7 62.9 27.3 20.7 42.7 36.5
2007-08 4.6 60.5 34.8 11.2 62.7 26.1 17.5 43.6 38.9
2008-09 4.9 64.0 31.1 13.1 63.0 23.9 16.5 42.7 40.9
2009-10 9.7 62.0 28.3 14.3 62.8 22.9 14.1 45.6 40.3
2010-11 7.0 64.8 28.2 10.6 65.5 23.9 12.8 48.2 38.9
2011-12 5.8 65.9 28.3 9.2 65.9 24.9 10.3 45.5 44.1
2012-13 5.4 65.5 29.0 8.5 66.5 25.0 10.7 47.2 42.2
2013-14 4.8 64.9 30.3 8.2 65.6 26.2 9.6 46.2 44.3
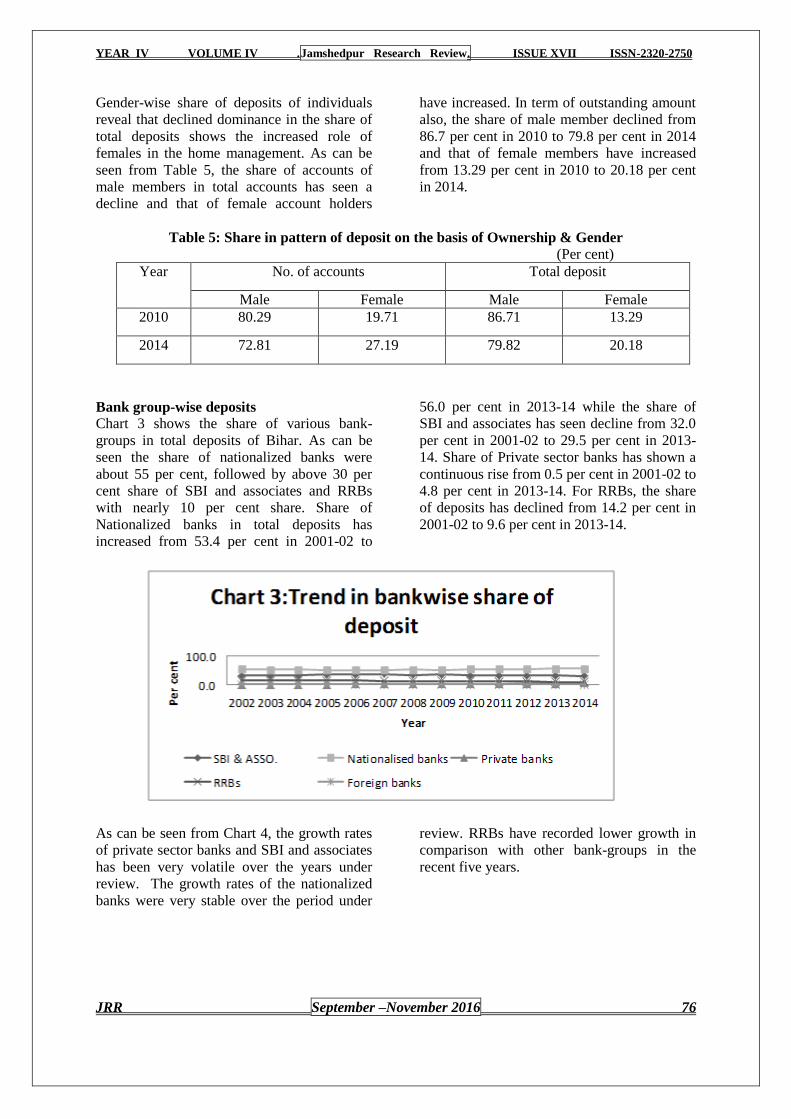
YEAR IV VOLUME IV .Jamshedpur Research Review. ISSUE XVII ISSN-2320-2750
JRR September –November 2016 76
Gender-wise share of deposits of individuals
reveal that declined dominance in the share of
total deposits shows the increased role of
females in the home management. As can be
seen from Table 5, the share of accounts of
male members in total accounts has seen a
decline and that of female account holders
have increased. In term of outstanding amount
also, the share of male member declined from
86.7 per cent in 2010 to 79.8 per cent in 2014
and that of female members have increased
from 13.29 per cent in 2010 to 20.18 per cent
in 2014.
Table 5: Share in pattern of deposit on the basis of Ownership & Gender
(Per cent)
Year No. of accounts Total deposit
Male Female Male Female
2010 80.29 19.71 86.71 13.29
2014 72.81 27.19 79.82 20.18
Bank group-wise deposits
Chart 3 shows the share of various bank-
groups in total deposits of Bihar. As can be
seen the share of nationalized banks were
about 55 per cent, followed by above 30 per
cent share of SBI and associates and RRBs
with nearly 10 per cent share. Share of
Nationalized banks in total deposits has
increased from 53.4 per cent in 2001-02 to
56.0 per cent in 2013-14 while the share of
SBI and associates has seen decline from 32.0
per cent in 2001-02 to 29.5 per cent in 2013-
14. Share of Private sector banks has shown a
continuous rise from 0.5 per cent in 2001-02 to
4.8 per cent in 2013-14. For RRBs, the share
of deposits has declined from 14.2 per cent in
2001-02 to 9.6 per cent in 2013-14.
As can be seen from Chart 4, the growth rates
of private sector banks and SBI and associates
has been very volatile over the years under
review. The growth rates of the nationalized
banks were very stable over the period under
review. RRBs have recorded lower growth in
comparison with other bank-groups in the
recent five years.
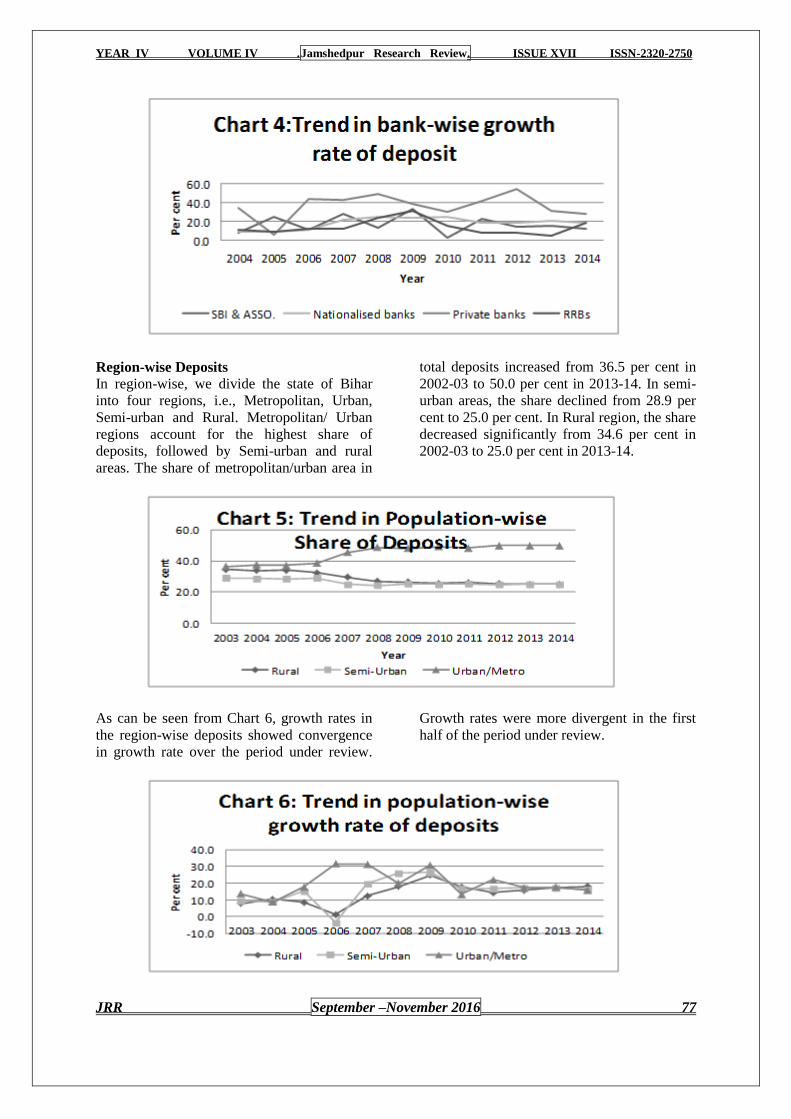
YEAR IV VOLUME IV .Jamshedpur Research Review. ISSUE XVII ISSN-2320-2750
JRR September –November 2016 77
Region-wise Deposits
In region-wise, we divide the state of Bihar
into four regions, i.e., Metropolitan, Urban,
Semi-urban and Rural. Metropolitan/ Urban
regions account for the highest share of
deposits, followed by Semi-urban and rural
areas. The share of metropolitan/urban area in
total deposits increased from 36.5 per cent in
2002-03 to 50.0 per cent in 2013-14. In semi-
urban areas, the share declined from 28.9 per
cent to 25.0 per cent. In Rural region, the share
decreased significantly from 34.6 per cent in
2002-03 to 25.0 per cent in 2013-14.
As can be seen from Chart 6, growth rates in
the region-wise deposits showed convergence
in growth rate over the period under review.
Growth rates were more divergent in the first
half of the period under review.
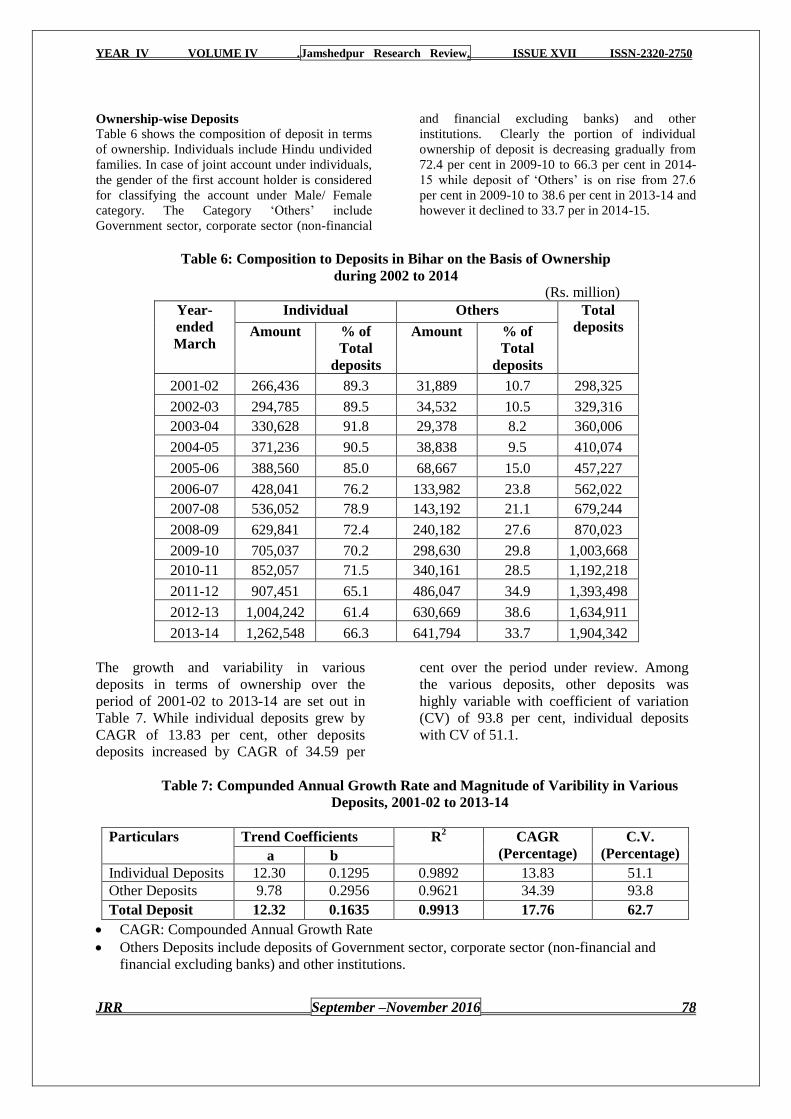
YEAR IV VOLUME IV .Jamshedpur Research Review. ISSUE XVII ISSN-2320-2750
JRR September –November 2016 78
Ownership-wise Deposits Table 6 shows the composition of deposit in terms
of ownership. Individuals include Hindu undivided
families. In case of joint account under individuals,
the gender of the first account holder is considered
for classifying the account under Male/ Female
category. The Category ‗Others‘ include
Government sector, corporate sector (non-financial
and financial excluding banks) and other
institutions. Clearly the portion of individual
ownership of deposit is decreasing gradually from
72.4 per cent in 2009-10 to 66.3 per cent in 2014-
15 while deposit of ‗Others‘ is on rise from 27.6
per cent in 2009-10 to 38.6 per cent in 2013-14 and
however it declined to 33.7 per in 2014-15.
Table 6: Composition to Deposits in Bihar on the Basis of Ownership
during 2002 to 2014
(Rs. million)
Year-
ended
March
Individual Others Total
deposits Amount % of
Total
deposits
Amount % of
Total
deposits
2001-02 266,436 89.3 31,889 10.7 298,325
2002-03 294,785 89.5 34,532 10.5 329,316
2003-04 330,628 91.8 29,378 8.2 360,006
2004-05 371,236 90.5 38,838 9.5 410,074
2005-06 388,560 85.0 68,667 15.0 457,227
2006-07 428,041 76.2 133,982 23.8 562,022
2007-08 536,052 78.9 143,192 21.1 679,244
2008-09 629,841 72.4 240,182 27.6 870,023
2009-10 705,037 70.2 298,630 29.8 1,003,668
2010-11 852,057 71.5 340,161 28.5 1,192,218
2011-12 907,451 65.1 486,047 34.9 1,393,498
2012-13 1,004,242 61.4 630,669 38.6 1,634,911
2013-14 1,262,548 66.3 641,794 33.7 1,904,342
The growth and variability in various
deposits in terms of ownership over the
period of 2001-02 to 2013-14 are set out in
Table 7. While individual deposits grew by
CAGR of 13.83 per cent, other deposits
deposits increased by CAGR of 34.59 per
cent over the period under review. Among
the various deposits, other deposits was
highly variable with coefficient of variation
(CV) of 93.8 per cent, individual deposits
with CV of 51.1.
Table 7: Compunded Annual Growth Rate and Magnitude of Varibility in Various
Deposits, 2001-02 to 2013-14
Particulars Trend Coefficients R2 CAGR
(Percentage)
C.V.
(Percentage) a b
Individual Deposits 12.30 0.1295 0.9892 13.83 51.1
Other Deposits 9.78 0.2956 0.9621 34.39 93.8
Total Deposit 12.32 0.1635 0.9913 17.76 62.7
CAGR: Compounded Annual Growth Rate
Others Deposits include deposits of Government sector, corporate sector (non-financial and
financial excluding banks) and other institutions.
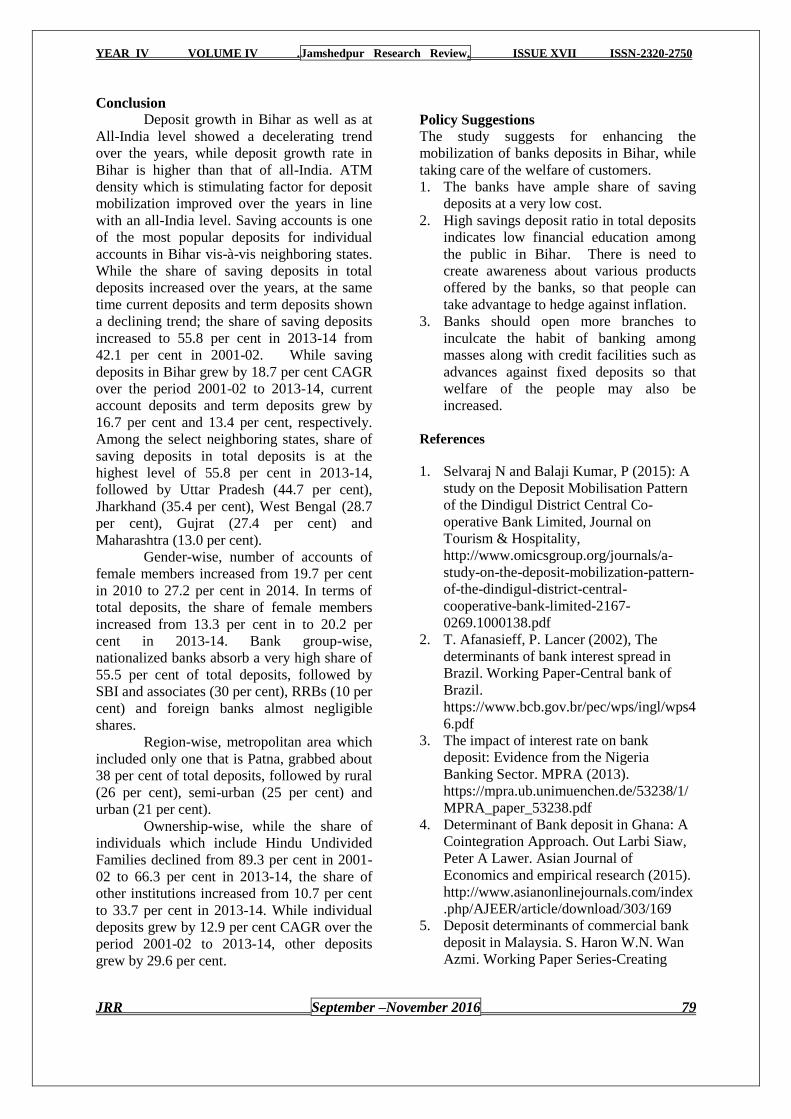
YEAR IV VOLUME IV .Jamshedpur Research Review. ISSUE XVII ISSN-2320-2750
JRR September –November 2016 79
Conclusion
Deposit growth in Bihar as well as at
All-India level showed a decelerating trend
over the years, while deposit growth rate in
Bihar is higher than that of all-India. ATM
density which is stimulating factor for deposit
mobilization improved over the years in line
with an all-India level. Saving accounts is one
of the most popular deposits for individual
accounts in Bihar vis-à-vis neighboring states.
While the share of saving deposits in total
deposits increased over the years, at the same
time current deposits and term deposits shown
a declining trend; the share of saving deposits
increased to 55.8 per cent in 2013-14 from
42.1 per cent in 2001-02. While saving
deposits in Bihar grew by 18.7 per cent CAGR
over the period 2001-02 to 2013-14, current
account deposits and term deposits grew by
16.7 per cent and 13.4 per cent, respectively.
Among the select neighboring states, share of
saving deposits in total deposits is at the
highest level of 55.8 per cent in 2013-14,
followed by Uttar Pradesh (44.7 per cent),
Jharkhand (35.4 per cent), West Bengal (28.7
per cent), Gujrat (27.4 per cent) and
Maharashtra (13.0 per cent).
Gender-wise, number of accounts of
female members increased from 19.7 per cent
in 2010 to 27.2 per cent in 2014. In terms of
total deposits, the share of female members
increased from 13.3 per cent in to 20.2 per
cent in 2013-14. Bank group-wise,
nationalized banks absorb a very high share of
55.5 per cent of total deposits, followed by
SBI and associates (30 per cent), RRBs (10 per
cent) and foreign banks almost negligible
shares.
Region-wise, metropolitan area which
included only one that is Patna, grabbed about
38 per cent of total deposits, followed by rural
(26 per cent), semi-urban (25 per cent) and
urban (21 per cent).
Ownership-wise, while the share of
individuals which include Hindu Undivided
Families declined from 89.3 per cent in 2001-
02 to 66.3 per cent in 2013-14, the share of
other institutions increased from 10.7 per cent
to 33.7 per cent in 2013-14. While individual
deposits grew by 12.9 per cent CAGR over the
period 2001-02 to 2013-14, other deposits
grew by 29.6 per cent.
Policy Suggestions
The study suggests for enhancing the
mobilization of banks deposits in Bihar, while
taking care of the welfare of customers.
1. The banks have ample share of saving
deposits at a very low cost.
2. High savings deposit ratio in total deposits
indicates low financial education among
the public in Bihar. There is need to
create awareness about various products
offered by the banks, so that people can
take advantage to hedge against inflation.
3. Banks should open more branches to
inculcate the habit of banking among
masses along with credit facilities such as
advances against fixed deposits so that
welfare of the people may also be
increased.
References
1. Selvaraj N and Balaji Kumar, P (2015): A
study on the Deposit Mobilisation Pattern
of the Dindigul District Central Co-
operative Bank Limited, Journal on
Tourism & Hospitality,
http://www.omicsgroup.org/journals/a-
study-on-the-deposit-mobilization-pattern-
of-the-dindigul-district-central-
cooperative-bank-limited-2167-
0269.1000138.pdf
2. T. Afanasieff, P. Lancer (2002), The
determinants of bank interest spread in
Brazil. Working Paper-Central bank of
Brazil.
https://www.bcb.gov.br/pec/wps/ingl/wps4
6.pdf
3. The impact of interest rate on bank
deposit: Evidence from the Nigeria
Banking Sector. MPRA (2013).
https://mpra.ub.unimuenchen.de/53238/1/
MPRA_paper_53238.pdf
4. Determinant of Bank deposit in Ghana: A
Cointegration Approach. Out Larbi Siaw,
Peter A Lawer. Asian Journal of
Economics and empirical research (2015).
http://www.asianonlinejournals.com/index
.php/AJEER/article/download/303/169
5. Deposit determinants of commercial bank
deposit in Malaysia. S. Haron W.N. Wan
Azmi. Working Paper Series-Creating

YEAR IV VOLUME IV .Jamshedpur Research Review. ISSUE XVII ISSN-2320-2750
JRR September –November 2016 80
Dynamic leader (2006).
http://klbs.com.my/v1/wp-
content/uploads/2012/04/009-deposits-
determinants-of-Commercial-Banks.pdf
6. The buffer stock theory of savings: some
macroeconomic evidence. Christopher D.
Caroll (1992).
http://www.econ2.jhu.edu/people/ccarroll/
BufferStockBPEA.pdf
7. Lebanon-Determinants of commercial
bank deposits in a Regional Financial
Centre. Harald Finger, Heiko Hesse. IMF
Working Paper-09/195 (2009).
https://www.imf.org/external/pubs/ft/wp/2
009/wp09195.pdf
8. Vibha Batra, Karthik Srinivasan and
Puneet Maheswari ICRA Indian banking
sector: Challenges unlikely to derail the
progress made.
http://www.icra.in/Files/ticker/Banking%2
0note-final.pdf
9. Performance of SCB in India and Manda
district: Recent trends. C.M. Latha, Dr. V.
Shanmugam. IOSR Journal of Humanities
and Social Science (May 2015).
http://iosrjournals.org/iosr-
jhss/papers/Vol20-issue5/Version-
3/B020531321.pdf
10. The Impact of Interest Rate on Bank
Deposits Evidence from the Nigerian
Banking Sector. Paul Ojeaga and Daniel
Ojeaga and Deborah O. Odejimi.
https://mpra.ub.uni-
muenchen.de/53238/1/MPRA_paper_532
38.pdf
11. Gujrati, Damodar N, Porter Dawn C
(Fifth Edition 2009): Basic Econometrics,
The McGraw Hill/Irwin, N. Delhi. pp 163
12. Reserve Bank of India (RBI): Various
Annual Reports.
13. International Monetary Fund (IMF):
Various Reports.
YEAR IV VOLUME IV .Jamshedpur Research Review. ISSUE XVII ISSN-2320-2750
JRR September –November 2016 81
CUSTOMER PERSPECTIVE OF SERVICE QUALITY GAP
ANALYSIS IN PUBLIC SECTOR BANKS
Bharat Chandra Malik
Ph.D. Scholar
Department of Business Administration,
Utkal University, Bhubaneswar
Dr Sathya Swaroop Debasish
Associate professor
Dept. of Business Administration, Utkal University, Bhubaneswar
Abstract
Service quality by the public sector banks in India and establishing a data base which can help the
management improving the quality of services. Service quality is defined as a global judgment or
attitude, relating to the superiority of the service. In today‘s increasing competitive atmosphere
providing service quality is important for any service industry. The present study evaluates the
customer perceptions of service quality in selected public sector banks. Measuring the quality of
service provided by the commercial banks in India and a establishing database which can help the
management improving the quality of services. The entry of new generation tech-savvy public sector
banks the the banking sector has become too competitive. For comparative purposes, five service
quality dimensions are used tangibility, reliability, responsiveness, assurance, empathy. The 22 items
SERVQUAL scale based on gap model proposed by Parasuraman, Zeithmal and Berry was used. The
quality of service was measured by applying the gap model (the difference between the customers
perceived, and their expected quality) data required for this study has been collected by a
questionnaire which was designed for this purpose.
Keywords: service quality, customer perspective, service quality Gap, service quality in public sector
banks.
Introduction
Service quality has been identified as a critical
success factor for banking organizations to
build their competitive advantage and increase
their competitiveness. For banking
organization which provides services as its
product, the most important things are
customer relations, service quality and
satisfaction. Commercial banks in India have a
vital role in the socio-economic development
process. They are the most influencing in the
whole economic system than other institution,
and they had positively contributed in all
development efforts devoted by the Indian
government. As the member of banks are
increasing, customer‘s banking service quality
expectation is growing. It has become crucial
to measure the service quality of the bank, so
that banking service provides can assess their
level of service quality and identify the quality
gaps for improvement. This study has used
SERVQUAL instrument to find out service
quality gap. The five dimensions of
SERVQUAL are tangibility, reliability,
responsiveness, assurance, empathy.
Banking services worldwide can
broadly classified in to investment banking
and commercial banking is primarily
concerned with helping corporate bodies raise
funds at the best possible rates from various
markets. Commercial banking is concerned
with channeling savings to productive uses.
Banking in an intermediary function but one
that is very essential for sustained economic
growth in India. Service quality is a concept
that has a roused considerable interest and
database in the research literature. Service
quality is a comparison of expectations with
performance. From the viewpoint of business
administration, service quality is an
YEAR IV VOLUME IV .Jamshedpur Research Review. ISSUE XVII ISSN-2320-2750
JRR September –November 2016 82
achievement in customer service. Service
quality has become a popular area of academic
investigation and has been recognized as a key
factor in keeping competitive advantage and
sustaining satisfying relationship with
customer‘s (Zeithmal et al …2000). Service
quality can be defined as the difference
between customer‘s expectations for service
performance prior to the service encounter and
their perceptions of the service received
(Asubon teng et al…1996). A customer's
expectation of a particular service is
determined by factors such as
recommendations by peers, personal needs
and past experiences. The expected service
and the perceived service sometimes may not
be equal, thus leaving a gap. The service
quality model or the „GAP model‟ developed
by the authors- Parasuraman, Zeithaml and
Berry at Texas and North Carolina in 1985,
highlights the main requirements for
delivering high service quality. It identifies
„gaps‟ that cause unsuccessful delivery of
service.
LITERATURE REVIEW
Jain, V, Gupta, S and Jain, S (2012) in
their study ―Customer Perception on Service
Quality in Banking Sector: With Special
Reference to Indian Private Banks in
Moradabad Region‖ try to learn and
understand the customer perception regarding
service quality and to learn and understand
the different dimension of service quality in
banks. The Sample size used is 100 and the
sample universe is Moradabad. The service
quality model developed by Zeithamal,
Parsuraman and Berry (1988) has been used
in the present study. The analysis reveals that
among the private sector banks all the
dimensions of service quality are equally
important.
Singh, SP and Khurana, S (2011) in their
research ―Analysis of Service Quality Gap
and Customers‟ Satisfaction in Private
Banks‖ tried to examine Gender wise
customers‟ expectations and perceptions of
service quality provided by the Private Banks
in Hissar District. Secondly, to identify
whether there is difference in expectation &
perception of service quality of male &
female customers. Lastly, to identify the
main attributes of service quality in which
male & female (separately) are more satisfied
or dissatisfied. The Sample Size is 300 with
Sample Universe including Private Banks in
Hissar. The Sampling Technique used was
Quota Sampling. A question SERVQUAL
model was administered on the sample. The
results indicated that the quality of services
private banks provide was below customers
„expectations.
Ananth, A, Ramesh, R and B, Prabaharan
(2010) in their paper ―A Service Gap Analysis
in Private Sector Banks- an Empirical Study
of Customers‟ Expectations vs. Perceptions‖
evaluate the Quality of Service in selected
private sector banks (ICICI & CUB). They
also tried to identify the gap between
customer expectations and their perceptions.
The Sample Universe is CUB and ICICI. The
study followed SERVQUAL as a framework
and one dimension (accessibility) was added
to the previous dimensions to fit into the
study. The gap analysis shows that empathy
shows a bigger gap between customer
expectation and perception of service quality.
Brahmbhatt, M and Panelia, D (2008) in
their study ―An Assessment of Service Quality
in Banks‖ Foremost aim of this research is to
comparatively examine and measure of service
quality and customer satisfaction among
private sector, public sector and foreign bank
and to offer suggestion based on results of
the study. The Sample size was 246 and the
Sample universe included Ahmedabad and
Gandhinagar. The Sampling Technique used
was stratified random. The five dimensions of
SERVQUAL as proposed by Parasuraman et
al. (1988), Othman and Owen (2001, 2002)
and Jabnoun and Al-Tamimi (2003) were
adapted and modified in this study. They
conclude from the study that Foreign Banks is
better than public sector banks and private
sector banks.
Gronroos, (2007), suggest that the Quality of
service as provided by customers is the result
of an evaluation process in which they
compare their respective of service outcome
against what they expected. This is referred to
as the customer gap and what is going to be
applied in measuring the quality of bank
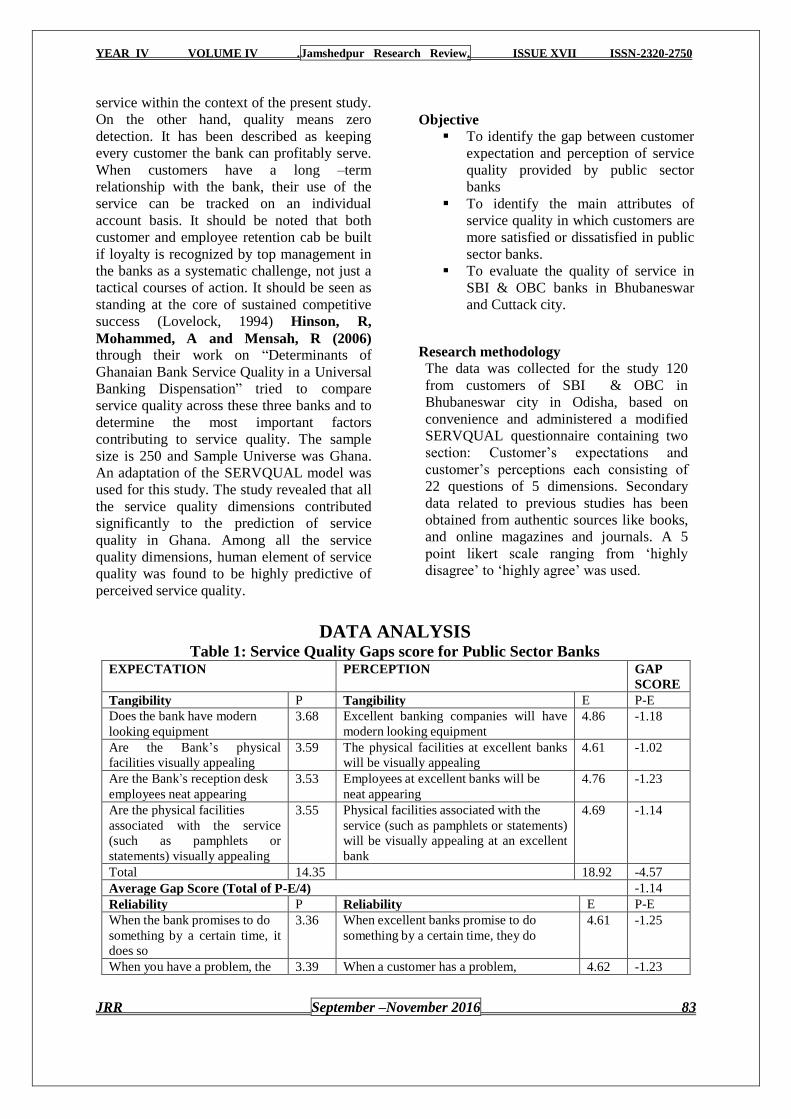
YEAR IV VOLUME IV .Jamshedpur Research Review. ISSUE XVII ISSN-2320-2750
JRR September –November 2016 83
service within the context of the present study.
On the other hand, quality means zero
detection. It has been described as keeping
every customer the bank can profitably serve.
When customers have a long –term
relationship with the bank, their use of the
service can be tracked on an individual
account basis. It should be noted that both
customer and employee retention cab be built
if loyalty is recognized by top management in
the banks as a systematic challenge, not just a
tactical courses of action. It should be seen as
standing at the core of sustained competitive
success (Lovelock, 1994) Hinson, R,
Mohammed, A and Mensah, R (2006)
through their work on ―Determinants of
Ghanaian Bank Service Quality in a Universal
Banking Dispensation‖ tried to compare
service quality across these three banks and to
determine the most important factors
contributing to service quality. The sample
size is 250 and Sample Universe was Ghana.
An adaptation of the SERVQUAL model was
used for this study. The study revealed that all
the service quality dimensions contributed
significantly to the prediction of service
quality in Ghana. Among all the service
quality dimensions, human element of service
quality was found to be highly predictive of
perceived service quality.
Objective
To identify the gap between customer
expectation and perception of service
quality provided by public sector
banks
To identify the main attributes of
service quality in which customers are
more satisfied or dissatisfied in public
sector banks.
To evaluate the quality of service in
SBI & OBC banks in Bhubaneswar
and Cuttack city.
Research methodology
The data was collected for the study 120
from customers of SBI & OBC in
Bhubaneswar city in Odisha, based on
convenience and administered a modified
SERVQUAL questionnaire containing two
section: Customer‘s expectations and
customer‘s perceptions each consisting of
22 questions of 5 dimensions. Secondary
data related to previous studies has been
obtained from authentic sources like books,
and online magazines and journals. A 5
point likert scale ranging from ‗highly
disagree‘ to ‗highly agree‘ was used.
DATA ANALYSIS Table 1: Service Quality Gaps score for Public Sector Banks
EXPECTATION
PERCEPTION GAP
SCORE
Tangibility P Tangibility E P-E
Does the bank have modern
looking equipment
3.68 Excellent banking companies will have
modern looking equipment
4.86 -1.18
Are the Bank‘s physical
facilities visually appealing
3.59 The physical facilities at excellent banks
will be visually appealing
4.61 -1.02
Are the Bank‘s reception desk
employees neat appearing
3.53 Employees at excellent banks will be
neat appearing
4.76 -1.23
Are the physical facilities
associated with the service
(such as pamphlets or
statements) visually appealing
3.55 Physical facilities associated with the
service (such as pamphlets or statements)
will be visually appealing at an excellent
bank
4.69 -1.14
Total 14.35 18.92 -4.57
Average Gap Score (Total of P-E/4) -1.14
Reliability P Reliability E P-E
When the bank promises to do
something by a certain time, it
does so
3.36 When excellent banks promise to do
something by a certain time, they do
4.61 -1.25
When you have a problem, the 3.39 When a customer has a problem, 4.62 -1.23
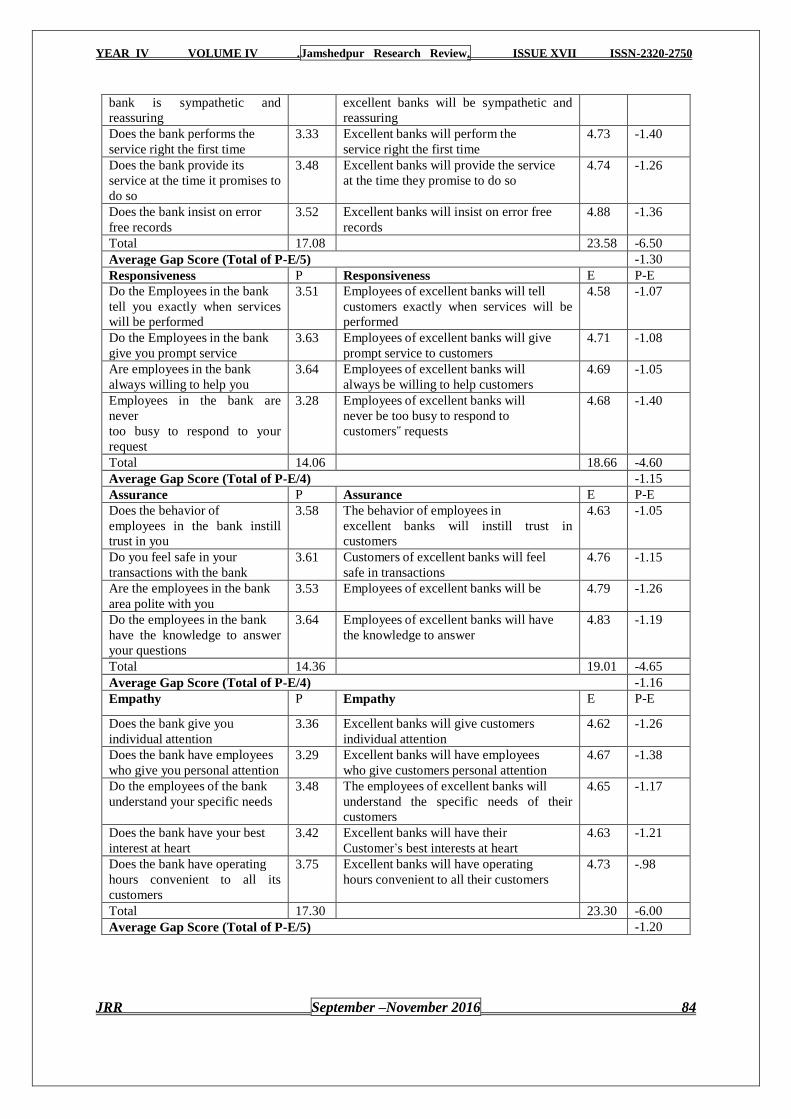
YEAR IV VOLUME IV .Jamshedpur Research Review. ISSUE XVII ISSN-2320-2750
JRR September –November 2016 84
bank is sympathetic and
reassuring
excellent banks will be sympathetic and
reassuring
Does the bank performs the
service right the first time
3.33 Excellent banks will perform the
service right the first time
4.73 -1.40
Does the bank provide its
service at the time it promises to
do so
3.48 Excellent banks will provide the service
at the time they promise to do so
4.74 -1.26
Does the bank insist on error
free records
3.52 Excellent banks will insist on error free
records
4.88 -1.36
Total 17.08 23.58 -6.50
Average Gap Score (Total of P-E/5) -1.30
Responsiveness P Responsiveness E P-E
Do the Employees in the bank
tell you exactly when services
will be performed
3.51 Employees of excellent banks will tell
customers exactly when services will be
performed
4.58 -1.07
Do the Employees in the bank
give you prompt service
3.63 Employees of excellent banks will give
prompt service to customers
4.71 -1.08
Are employees in the bank
always willing to help you
3.64 Employees of excellent banks will
always be willing to help customers
4.69 -1.05
Employees in the bank are
never
too busy to respond to your
request
3.28 Employees of excellent banks will
never be too busy to respond to
customers‟ requests
4.68 -1.40
Total 14.06 18.66 -4.60
Average Gap Score (Total of P-E/4) -1.15
Assurance P Assurance E P-E
Does the behavior of
employees in the bank instill
trust in you
3.58 The behavior of employees in
excellent banks will instill trust in
customers
4.63 -1.05
Do you feel safe in your
transactions with the bank
3.61 Customers of excellent banks will feel
safe in transactions
4.76 -1.15
Are the employees in the bank
area polite with you
3.53 Employees of excellent banks will be
4.79 -1.26
Do the employees in the bank
have the knowledge to answer
your questions
3.64 Employees of excellent banks will have
the knowledge to answer
4.83 -1.19
Total 14.36 19.01 -4.65
Average Gap Score (Total of P-E/4) -1.16
Empathy P Empathy E P-E
Does the bank give you
individual attention
3.36 Excellent banks will give customers
individual attention
4.62 -1.26
Does the bank have employees
who give you personal attention
3.29 Excellent banks will have employees
who give customers personal attention
4.67 -1.38
Do the employees of the bank
understand your specific needs
3.48 The employees of excellent banks will
understand the specific needs of their
customers
4.65 -1.17
Does the bank have your best
interest at heart
3.42 Excellent banks will have their
Customer‘s best interests at heart
4.63 -1.21
Does the bank have operating
hours convenient to all its
customers
3.75 Excellent banks will have operating
hours convenient to all their customers
4.73 -.98
Total 17.30 23.30 -6.00
Average Gap Score (Total of P-E/5) -1.20
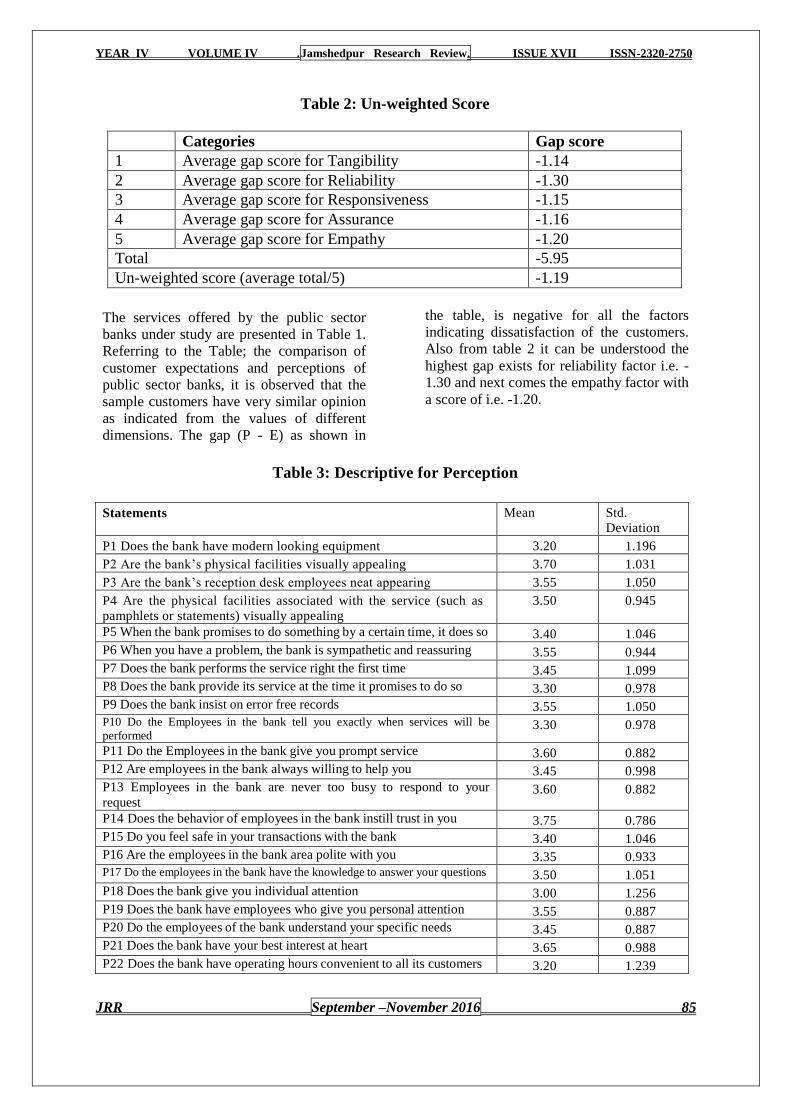
YEAR IV VOLUME IV .Jamshedpur Research Review. ISSUE XVII ISSN-2320-2750
JRR September –November 2016 85
Table 2: Un-weighted Score
Categories Gap score
1 Average gap score for Tangibility -1.14
2 Average gap score for Reliability -1.30
3 Average gap score for Responsiveness -1.15
4 Average gap score for Assurance -1.16
5 Average gap score for Empathy -1.20
Total -5.95
Un-weighted score (average total/5) -1.19
The services offered by the public sector
banks under study are presented in Table 1.
Referring to the Table; the comparison of
customer expectations and perceptions of
public sector banks, it is observed that the
sample customers have very similar opinion
as indicated from the values of different
dimensions. The gap (P - E) as shown in
the table, is negative for all the factors
indicating dissatisfaction of the customers.
Also from table 2 it can be understood the
highest gap exists for reliability factor i.e. -
1.30 and next comes the empathy factor with
a score of i.e. -1.20.
Table 3: Descriptive for Perception
Statements Mean Std.
Deviation
P1 Does the bank have modern looking equipment 3.20 1.196
P2 Are the bank‘s physical facilities visually appealing 3.70 1.031
P3 Are the bank‘s reception desk employees neat appearing 3.55 1.050
P4 Are the physical facilities associated with the service (such as
pamphlets or statements) visually appealing
3.50 0.945
P5 When the bank promises to do something by a certain time, it does so 3.40 1.046
P6 When you have a problem, the bank is sympathetic and reassuring 3.55 0.944
P7 Does the bank performs the service right the first time 3.45 1.099
P8 Does the bank provide its service at the time it promises to do so 3.30 0.978
P9 Does the bank insist on error free records 3.55 1.050 P10 Do the Employees in the bank tell you exactly when services will be
performed 3.30 0.978
P11 Do the Employees in the bank give you prompt service 3.60 0.882
P12 Are employees in the bank always willing to help you 3.45 0.998
P13 Employees in the bank are never too busy to respond to your
request 3.60 0.882
P14 Does the behavior of employees in the bank instill trust in you 3.75 0.786
P15 Do you feel safe in your transactions with the bank 3.40 1.046
P16 Are the employees in the bank area polite with you 3.35 0.933 P17 Do the employees in the bank have the knowledge to answer your questions 3.50 1.051
P18 Does the bank give you individual attention 3.00 1.256
P19 Does the bank have employees who give you personal attention 3.55 0.887
P20 Do the employees of the bank understand your specific needs 3.45 0.887
P21 Does the bank have your best interest at heart 3.65 0.988
P22 Does the bank have operating hours convenient to all its customers 3.20 1.239
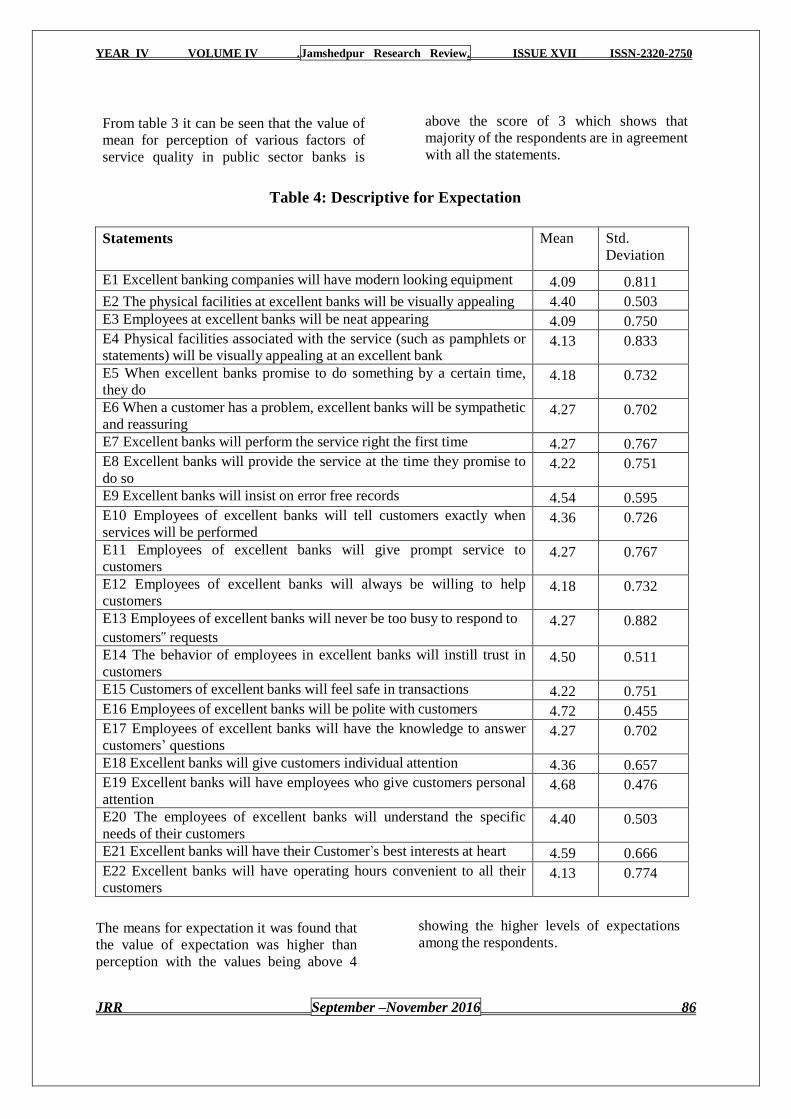
YEAR IV VOLUME IV .Jamshedpur Research Review. ISSUE XVII ISSN-2320-2750
JRR September –November 2016 86
From table 3 it can be seen that the value of
mean for perception of various factors of
service quality in public sector banks is
above the score of 3 which shows that
majority of the respondents are in agreement
with all the statements.
Table 4: Descriptive for Expectation
Statements Mean Std.
Deviation
E1 Excellent banking companies will have modern looking equipment 4.09 0.811
E2 The physical facilities at excellent banks will be visually appealing 4.40 0.503
E3 Employees at excellent banks will be neat appearing 4.09 0.750
E4 Physical facilities associated with the service (such as pamphlets or
statements) will be visually appealing at an excellent bank 4.13 0.833
E5 When excellent banks promise to do something by a certain time,
they do 4.18 0.732
E6 When a customer has a problem, excellent banks will be sympathetic
and reassuring 4.27 0.702
E7 Excellent banks will perform the service right the first time 4.27 0.767
E8 Excellent banks will provide the service at the time they promise to
do so 4.22 0.751
E9 Excellent banks will insist on error free records 4.54 0.595
E10 Employees of excellent banks will tell customers exactly when
services will be performed 4.36 0.726
E11 Employees of excellent banks will give prompt service to
customers 4.27 0.767
E12 Employees of excellent banks will always be willing to help
customers 4.18 0.732
E13 Employees of excellent banks will never be too busy to respond to
customers‟ requests
4.27 0.882
E14 The behavior of employees in excellent banks will instill trust in
customers 4.50 0.511
E15 Customers of excellent banks will feel safe in transactions 4.22 0.751
E16 Employees of excellent banks will be polite with customers 4.72 0.455
E17 Employees of excellent banks will have the knowledge to answer
customers‘ questions 4.27 0.702
E18 Excellent banks will give customers individual attention 4.36 0.657
E19 Excellent banks will have employees who give customers personal
attention 4.68 0.476
E20 The employees of excellent banks will understand the specific
needs of their customers 4.40 0.503
E21 Excellent banks will have their Customer‘s best interests at heart 4.59 0.666
E22 Excellent banks will have operating hours convenient to all their
customers 4.13 0.774
The means for expectation it was found that
the value of expectation was higher than
perception with the values being above 4
showing the higher levels of expectations
among the respondents.
YEAR IV VOLUME IV .Jamshedpur Research Review. ISSUE XVII ISSN-2320-2750
JRR September –November 2016 87
Suggestion
Research should identify expected
antecedents and outcomes of service
quality.
Banks should have a strong customer
relationship management system that
would indicate the worth of the
customer and the ability to
understand his needs while
interacting with him, so as to cross
sell their products.
Banks may follow a feedback
system to know the customers‟
expectations for improving the level
of customer satisfaction to the
maximum level. Responses on
service reliability should be
continuously obtained from
customers.
This would expand our
understanding of the adoption of
service quality to those organizations.
Suggest that more validation the
conclusion derived from this study
could prove to augment many of the
managerial activities such as
recruitment, selection, and training
which would be reflected on the
bank‘s profitability.
Conclusion
The highest gap found in the dimension of
reliability and empathy. The reliability factor
is a positive factor for these banks. Therefore
public sector banks should position themselves
in the market on the basis of this dimension
and promote themselves aggressively. The
banks have to reduce this gap giving
individual personal attention to understand
customer specific needs.
References:
1. Ananth, A, Ramesh, R and B,
Prabaharan (2010) ―A Service Gap
Analysis in Private Sector Banks –
an Empirical Study of Customers‟
Expectations vs. Perceptions‖ pp.44-
53 .
2. Brahmbhatt, M. and Panelia, D.
(2008) ―An Assessment of Service
Quality in Banks‖, Global
Management Review, Vol.2, Issue 4,
Page no. 37-41.
3. Dash, M., Dash, S. and Sharma, J.P.
(2012) ―A Study on the Relationship
between Customer Satisfaction and
Service Attributes Offered by Public
Sector and Private Sector Banks in
India‖, Journal of Money, Investment
and Banking, ISSN 1450-288X,Issue
24, pp.73-86.
4. Hinson, R., Mohammed, A. and
Mensah, R. (2006) ―Determinants of
Ghanaian Bank Service Quality in a
Universal Banking Dispensation‖,
Banks and Bank Systems /
Volume 1, Issue 2, pp.69-81.
5. Jain, V., Gupta, S. and Jain, S.
(2012) ―Customer Perception on
Service Quality in Banking Sector:
With Special Reference to Indian
Private Banks in Moradabad Region‖,
IJRFM (International Journal of
Research in Finance & marketing),
ISSN: 2231-5985, Volume 2, Issue 2,
pp.597-610.
6. Mishra, U. S., Sahoo, K. K.,
Mishra, S. and Patra, S. K. (2010)
―Service Quality Assessment in
Banking Industry of India: A
Comparative Study between Public
and Private Sectors‖, European
Journal of Social Sciences, Volume
16, Number 4, pp.653-669.
7. Rakesh, R. (2012) ―Quality
Assessment of Banking Industry
Using the Servqual Model‖, Indian
Streams Research Journal, ISSN:-
2230-7850, Vol.2, Issue.II, pp.1-4.
8. Roy, R., Vaijayanthi, P. and
Shreenivasan, K.A. (2011) ―Service
Quality Gap of Foreign Banks in
India using PZB Service Quality
Model – an Empirical Study‖,
International Conference on Software
and Computer Applications IPCSIT,
vol.9, pp.142-146.
9. Santhiyavalli, G (2011) ―Customer‘s
perception of service quality of State
Bank of India - A Factor Analysis‖,
YEAR IV VOLUME IV .Jamshedpur Research Review. ISSUE XVII ISSN-2320-2750
JRR September –November 2016 88
International Journal of Management
& Business studies, IJMBs, Vol. 1,
Issue 3, ISSN : 2330-9519 (Online) |
ISSN : 2231-2463 (Print), pp.78-84.
10. Singh, S.P. and Khurana, S. (2011)
―Analysis of Service Quality Gap and
Customers‘ Satisfaction in Private
Banks‖, Gurukul Business Review
(GBR), Vol. 7 (Spring 2011), pp. 13-
18.
11. Rathee, R., Deveshwar, A. and Rajain,
P (2014) ―To identify service quality
gaps in banking sector : A study of
private banks‖, International Journal
of Emerging Research in Management
Technology, Vol. 3, Issue 7, pp.101-
106.
12. Ananth, A., Ramesh, R. and
Prabaharan, B (2011) ―Service Quality
gap analysis in private sector banks-A
Customer Perspective‖, Indian Journal
of Commerce & Management Studies,
Vol. 2, Issue 1, pp. 245-252.
13. Gautam, S. and Singh, A (2014) ―To
Identify Service Quality gaps in
Banking Sector: A Comparative study
of Public Sector Banks and Foreign
Banks‖, Global Journal of Finance and
Management, Vol. 6, Number 5, pp.
439-444.
14. Mualla, N.D(2011) ―Measuring
Quality of Banks Services in Jordan:
Gap Analysis‖, International Journal
of Business and Social Science, Vol.
2, Number 1, pp. 51-58.
YEAR IV VOLUME IV .Jamshedpur Research Review. ISSUE XVII ISSN-2320-2750
JRR September –November 2016 89
CUSTOMER FOCUSES OF PUBLIC AND NEW
GENERATION PRIVATE SECTOR BANKS IN INDIA: A
COMPARISON
Dr. T.P.Vijumon
HOD, PG Department of Commerce, TKMM College, Nangiarkulangara, Alleppy Dist, Kerala state
Abstract
The IT innovations along with the liberalization policies of government have shifted the banking sector to new
heights, which lead to the customer focused banking in the country. Banks became centre of innovative
investment avenues with the introduction of banking products such as new deposit schemes for poor, averages
and high income groups stretched with investment linked with insurance schemes, different types of mutual
funds and bonds for individual and institutional investors. Banks have considerably reduced customer weighting
time by the introduction of computarisation and gone ahead in fund transfers through core banking solutions,
RTGS, etc. However, a new level of competition era has been started between the traditional banks and new
generation private banks in different aspects of customer service and facilities. The present study evaluates the
customer focused strategies of old public sector banks and new generation private sector banks considering 16
aspects of banking in to three major factors such as 1) Upkeep of premises and facilities, 2) Staff attitude and
behaviour and 3) Speed in rendering various services. In comparative analysis with the help of primary data
collected in five point Likert‘s scale, it is seen that NGPB leads in all the three areas, which was substantiated
by the one way ANOVA results.
Key Words: Customer focused banking, IT banking, banking premises, new generation private sector banks,
staff attitude, banking facilities.
The depth of banking services in India
has changed drastically over the last two
decades due to technological innovation,
deregulation of financial services, external
financial liberalisation, and organizational
changes in the corporate sector1. The
traditional face of banks as mere financial
intermediaries has altered because of the
paradigm shift from balance sheet
intermediation to off-balance sheet
intermediation, capital adequacy to capital
efficiency, traditional banking to technology-
based banking, product and bank-centred
banking to customer-focused banking and
banking to financial service. The banking
sector in India is adapting newer technologies
and undergoing changes in the way it
functions and delivers its services to
customers. The traditional brick and mortar
banking is substituted by click and transact
banking. The structure of the banking sector
has turned from a controlled system into a
liberalised one. Banking sector reforms,
prudential norms and internationalisation have
improved the profitability, productivity and
efficiency of banks2.
The advent of economic reforms and
the opening up of banking industry to private
parties, many new private banks and foreign
banks with most modern technology and
global standards started functioning in India
since 1992. At present, there are 90 scheduled
commercial banks (excluding RRBs) in India,
which consist of 27 public sector banks (State
Bank group- SBI and five associate banks,
other nationalized banks – IDBI, Bharathiya
Mahila Bank and other 19 banks), 20 private
sector banks (13 old private banks and 7 new
generation private sector banks) and 43 foreign
banks3. The entry of new banks, together with
FDI relaxation and adoption of technology,
shook the banking sector in India completely
and created tougher competition between the
existing players and the new generation banks.
The public sector banks which controlled about
eighty percent of the deposits, assets and
credits, have been forced to come out of their
laziness and stupor by changing their
marketing strategies, diversifying products and
services, adopting new technology, offering
better customer service and allowing private
investment; this has led to a retail boom in the
banking sector in India. The new generation
banks showed higher growth rate in branches
(from 0.89% of the total branches in 2000 to
9% in 2014), deposits (from 5% to 13%),

YEAR IV VOLUME IV .Jamshedpur Research Review. ISSUE XVII ISSN-2320-2750
JRR September –November 2016 90
advances (5% to 14%), assets (5% to 15%) etc.4
and have been slowly capturing the market
share of public sector banks and old private
banks. Even though new private banks are few
in number, they are a great competitor against
all the other categories of banks in every
respect. Indian banking industry has made
exceptional progress in the last few years, with
.64 trillion asset bases, and are standing stiff
even during the times when the rest of the
world was struggling against financial
meltdown. A statement from RBI has revealed
that bank advances grew at 17.08 per cent
annually as on 16th December, 2014, while
bank deposits raised by 18.03 per cent.5
Statement of the Problem- Though we
have 90 banks categorized in to SBI and
associates, Other Public Sector Banks
(OPSB), New Generation Private Sector
Banks(NGPSB) and Foreign Banks, their
customer performance are found varied in
character. Some banks look good and
attitude of the staff seem attractive but other
may be different. A customer will be delight
when he is getting services in time with
speed and accuracy.
Among the users of
banks, there exists a strong belief that
different categoryof banks vary in customer
satisfaction levels. Therefore, the problem
under study is to arrive the difference in the
level of customer-focused strategies of
different bank groups, when categorizing
them into SBI Group (SBG), Other
Nationalised Bank Group (ONB) and New
Generation Private Banks (NGPB).
Objectives of the Study- Following are the
precise aims of the study.
1. To observe the major practical
ushered and changes in banking
sector of India since post –
liberalisation period.
2. To assess the customer-
centeredness of selected bank
groups of the country and compare
them on the basis of selected
indicators.
Methodology, Sampling and Tools- The
present study is descriptive and analytical in
nature. We have used Primary and secondary
data to arrive and state the finding in logical
manner. The primary data were collected from
100 customers each from three groups of
banks totaling 300 samples. 10 samples were
collected from each branch of a bank. A multi-
stage random sampling procedure is used for
arriving the customers for collecting samples.
In first stage, the state of Kerala is divided in
to three regions-northern, central and southern.
One district has taken from each region
namely-Kozhikode, Ernakulam and
Thiruvananthapuram respectively. Secondly
the sample branches have been arrived to
locate the sample customers. For this purpose,
a lottery sampling procedures was followed.
Finally, sample customers are arrived in
random manner. Statistical tools such as mean,
ranking and one way ANOVA are used by
using SPSS 17 version to arrive conclusions.
Table 1 Sample banks
Sl.No. Sample Banks Bank group Sample Bank sector
2 SBI SBG (2) 100
PSB (6)
2 SBT
3 PNB
ONB (4)
100
4 BOB
5 BOI
6 CB
7 ICICI Bank Ltd. NGPB (2) 100 NGPB (2)
8 HDFC Bank Ltd.
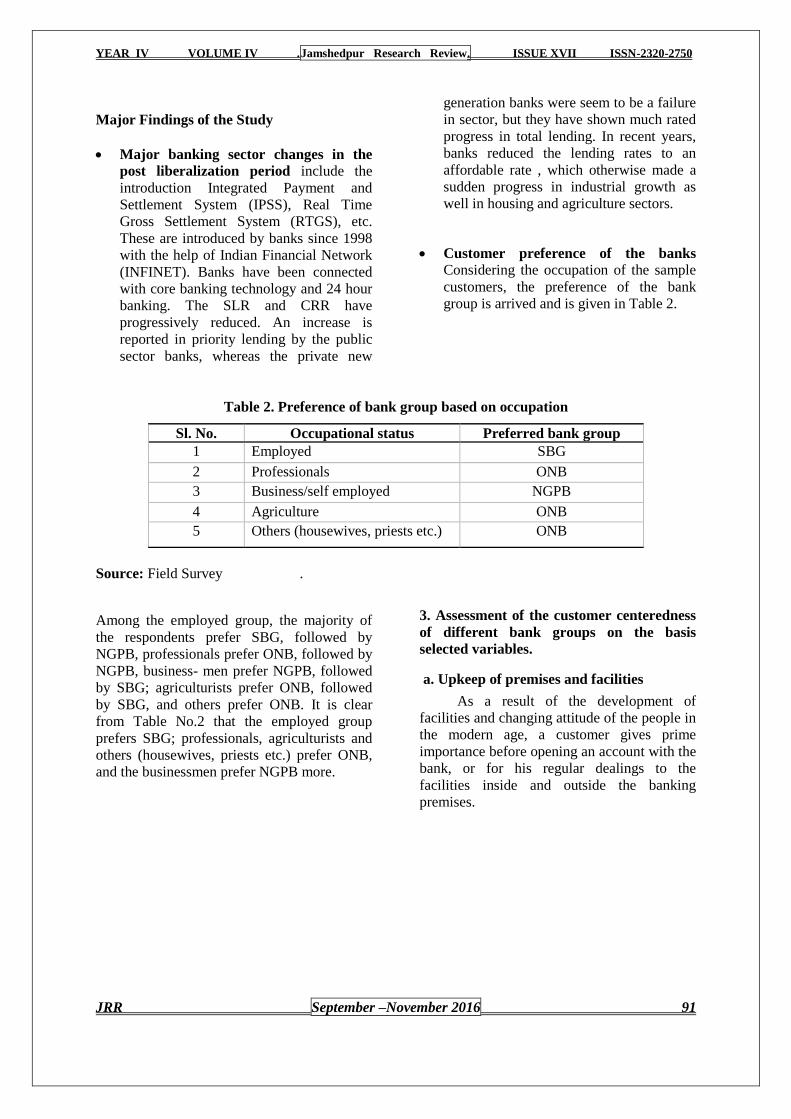
YEAR IV VOLUME IV .Jamshedpur Research Review. ISSUE XVII ISSN-2320-2750
JRR September –November 2016 91
Major Findings of the Study
Major banking sector changes in the
post liberalization period include the
introduction Integrated Payment and
Settlement System (IPSS), Real Time
Gross Settlement System (RTGS), etc.
These are introduced by banks since 1998
with the help of Indian Financial Network
(INFINET). Banks have been connected
with core banking technology and 24 hour
banking. The SLR and CRR have
progressively reduced. An increase is
reported in priority lending by the public
sector banks, whereas the private new
generation banks were seem to be a failure
in sector, but they have shown much rated
progress in total lending. In recent years,
banks reduced the lending rates to an
affordable rate , which otherwise made a
sudden progress in industrial growth as
well in housing and agriculture sectors.
Customer preference of the banks
Considering the occupation of the sample
customers, the preference of the bank
group is arrived and is given in Table 2.
Table 2. Preference of bank group based on occupation
Sl. No. Occupational status Preferred bank group
1 Employed SBG
2 Professionals ONB
3 Business/self employed NGPB
4 Agriculture ONB
5 Others (housewives, priests etc.) ONB
Source: Field Survey .
Among the employed group, the majority of
the respondents prefer SBG, followed by
NGPB, professionals prefer ONB, followed by
NGPB, business- men prefer NGPB, followed
by SBG; agriculturists prefer ONB, followed
by SBG, and others prefer ONB. It is clear
from Table No.2 that the employed group
prefers SBG; professionals, agriculturists and
others (housewives, priests etc.) prefer ONB,
and the businessmen prefer NGPB more.
3. Assessment of the customer centeredness
of different bank groups on the basis
selected variables.
a. Upkeep of premises and facilities
As a result of the development of
facilities and changing attitude of the people in
the modern age, a customer gives prime
importance before opening an account with the
bank, or for his regular dealings to the
facilities inside and outside the banking
premises.
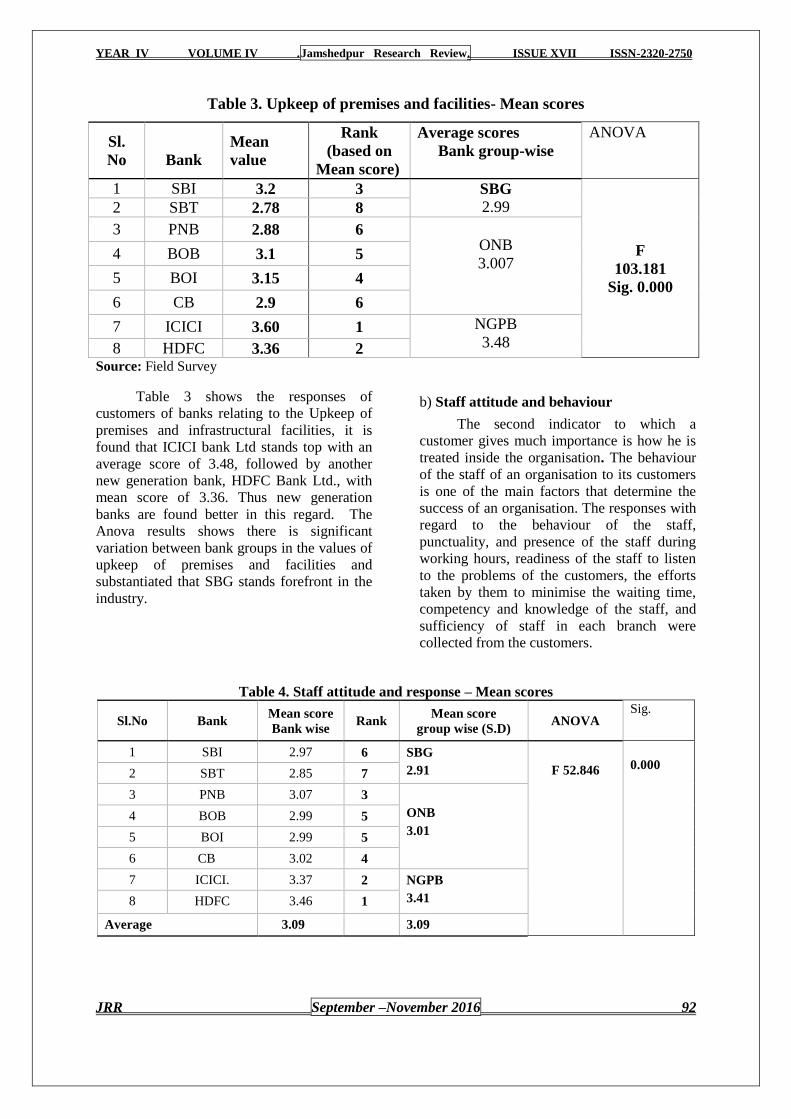
YEAR IV VOLUME IV .Jamshedpur Research Review. ISSUE XVII ISSN-2320-2750
JRR September –November 2016 92
Table 3. Upkeep of premises and facilities- Mean scores
Sl.
No
Bank
Mean
value
Rank
(based on
Mean score)
Average scores
Bank group-wise
ANOVA
1 SBI 3.2 3 SBG
2.99
F
103.181
Sig. 0.000
2 SBT 2.78 8
3 PNB 2.88 6
ONB
3.007 4 BOB 3.1 5
5 BOI 3.15 4
6 CB 2.9 6
7 ICICI 3.60 1 NGPB
3.48 8 HDFC 3.36 2 Source: Field Survey
Table 3 shows the responses of
customers of banks relating to the Upkeep of
premises and infrastructural facilities, it is
found that ICICI bank Ltd stands top with an
average score of 3.48, followed by another
new generation bank, HDFC Bank Ltd., with
mean score of 3.36. Thus new generation
banks are found better in this regard. The
Anova results shows there is significant
variation between bank groups in the values of
upkeep of premises and facilities and
substantiated that SBG stands forefront in the
industry.
b) Staff attitude and behaviour
The second indicator to which a
customer gives much importance is how he is
treated inside the organisation. The behaviour
of the staff of an organisation to its customers
is one of the main factors that determine the
success of an organisation. The responses with
regard to the behaviour of the staff,
punctuality, and presence of the staff during
working hours, readiness of the staff to listen
to the problems of the customers, the efforts
taken by them to minimise the waiting time,
competency and knowledge of the staff, and
sufficiency of staff in each branch were
collected from the customers.
Table 4. Staff attitude and response – Mean scores
Sl.No Bank Mean score
Bank wise Rank
Mean score
group wise (S.D) ANOVA
Sig.
1 SBI 2.97 6 SBG
2.91
F 52.846
0.000 2 SBT 2.85 7
3 PNB 3.07 3
ONB
3.01
4 BOB 2.99 5
5 BOI 2.99 5
6 CB 3.02 4
7 ICICI. 3.37 2 NGPB
3.41
8 HDFC 3.46 1
Average 3.09 3.09
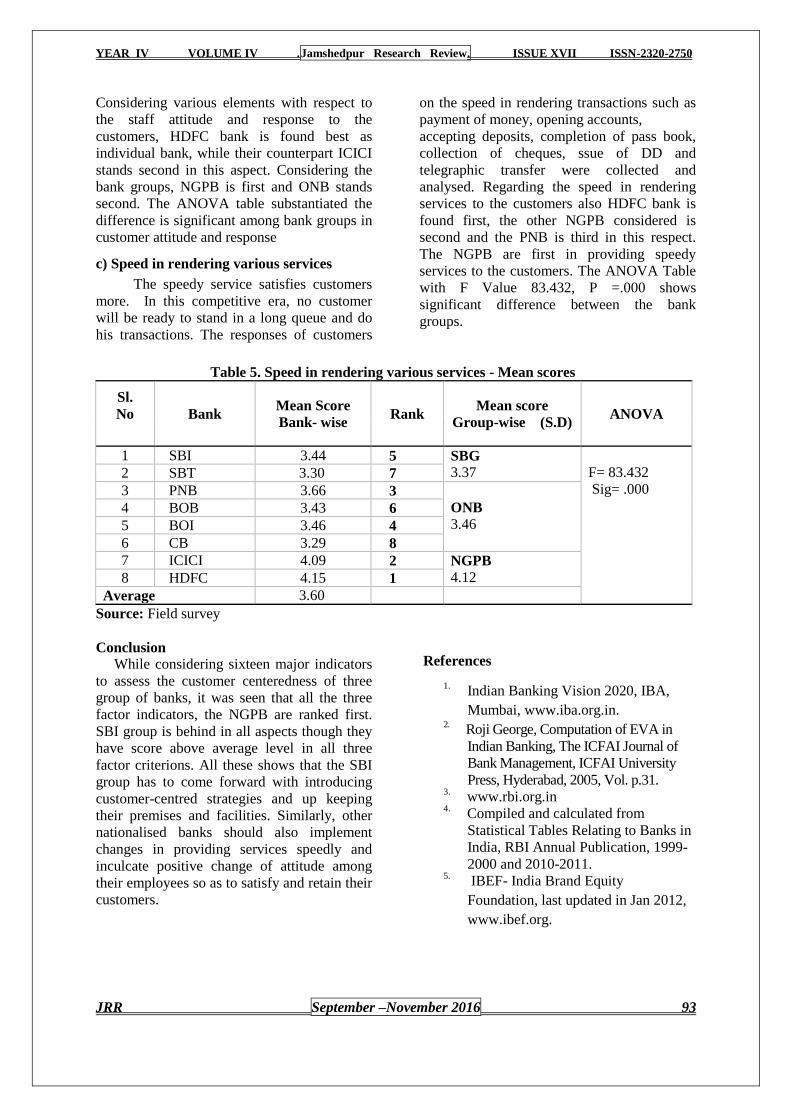
YEAR IV VOLUME IV .Jamshedpur Research Review. ISSUE XVII ISSN-2320-2750
JRR September –November 2016 93
Considering various elements with respect to
the staff attitude and response to the
customers, HDFC bank is found best as
individual bank, while their counterpart ICICI
stands second in this aspect. Considering the
bank groups, NGPB is first and ONB stands
second. The ANOVA table substantiated the
difference is significant among bank groups in
customer attitude and response
c) Speed in rendering various services
The speedy service satisfies customers
more. In this competitive era, no customer
will be ready to stand in a long queue and do
his transactions. The responses of customers
on the speed in rendering transactions such as
payment of money, opening accounts,
accepting deposits, completion of pass book,
collection of cheques, ssue of DD and
telegraphic transfer were collected and
analysed. Regarding the speed in rendering
services to the customers also HDFC bank is
found first, the other NGPB considered is
second and the PNB is third in this respect.
The NGPB are first in providing speedy
services to the customers. The ANOVA Table
with F Value 83.432, P =.000 shows
significant difference between the bank
groups.
Table 5. Speed in rendering various services - Mean scores
Sl.
No
Bank Mean Score
Bank- wise Rank
Mean score
Group-wise (S.D) ANOVA
1 SBI 3.44 5 SBG
3.37
F= 83.432
Sig= .000 2 SBT 3.30 7
3 PNB 3.66 3
ONB
3.46 4 BOB 3.43 6
5 BOI 3.46 4
6 CB 3.29 8
7 ICICI 4.09 2 NGPB
4.12
8 HDFC 4.15 1
Average 3.60
Source: Field survey
Conclusion
While considering sixteen major indicators
to assess the customer centeredness of three
group of banks, it was seen that all the three
factor indicators, the NGPB are ranked first.
SBI group is behind in all aspects though they
have score above average level in all three
factor criterions. All these shows that the SBI
group has to come forward with introducing
customer-centred strategies and up keeping
their premises and facilities. Similarly, other
nationalised banks should also implement
changes in providing services speedly and
inculcate positive change of attitude among
their employees so as to satisfy and retain their
customers.
References
1. Indian Banking Vision 2020, IBA,
Mumbai, www.iba.org.in.
2. Roji George, Computation of EVA in
Indian Banking, The ICFAI Journal of
Bank Management, ICFAI University
Press, Hyderabad, 2005, Vol. p.31. 3. www.rbi.org.in 4. Compiled and calculated from
Statistical Tables Relating to Banks in
India, RBI Annual Publication, 1999-
2000 and 2010-2011. 5. IBEF- India Brand Equity
Foundation, last updated in Jan 2012,
www.ibef.org.
YEAR IV VOLUME IV .Jamshedpur Research Review. ISSUE XVII ISSN-2320-2750
JRR September –November 2016 94
SIZE OR EFFICIENCY – WHAT WILL DRIVE THE FUTURE
OF INDIAN BANKS Saurabh Agarwal Research Scholar, Department of EAFM University of Rajasthan
Prof. Rajiv Upadhayaya
Professor, EAFM deptt. University of Rajasthan
Abstract
India is becoming a major force in the world economy. Real GDP growth has averaged 7 percent over
the past three years, and service and manufacturing exports are booming. As India develops it will
need a strong financial system in order to sustain or exceed its rate of growth. The Indian banking
industry suffers from various inefficiencies and irregularities. The paper explores the present state of
the Indian banking industry by doing an external and internal environment analysis using Porter‘s
diamond model and the SWOT. Priority sector lending, SLR requirements, high intermediation cost,
major government influence, HR issues and technological laggardness are some of the major issues
that are identified using the analysis. By and large the Indian market is an unbanked market. It will be
important for domestic banks to tap the hidden potential in various sectors like rural loans, credit
cards and trying to attract the savings of Indian households for investment in bank deposits which at
present is just 47 % of the total savings. Based on my analysis and findings I have tried to show that
the reforms in the Indian banking sector will continue though in a regulated manner. The Foreign
banks will have to adopt the organic route only as it seems difficult that the regulations will allow
acquisitions by foreign banks. Consolidation and innovation in addition to improved efficiency is the
way forward. The domestic banks will continue to dominate the landscape but they will definitely be
made more competitive with the entry of foreign banks.
It‘s truly said that only the fittest will survive!
_________________________________________________________________________
Size or Efficiency What will Drive the
Future of Indian Banks
India is becoming a major force in the world
economy. Real GDP growth has averaged 7
percent over the past three years, and service
and manufacturing exports are booming. As
India develops it will need a strong financial
system in order to sustain or exceed its rate of
growth. It is important to note that on several
counts the Indian financial system falls short
and there are major inefficiencies in the Indian
financial sector. The system intermediates only
half of the country‘s total savings and
investment and more importantly they lend a
very little portion of deposits in comparison to
other banks. In the wake of increased
acquisitions of Indian firms through leveraged
buy outs Indian banks lose in a big way due to
their inability to finance such deals.
These shortcomings are a major setback to the
Indian economy. The Indian financial system
needs reforms which will have large benefits.
The Indian banks will also need to gear up for
the increased competition posed by opening up
of the sector in 2009. The Indian banks will
have to reduce the role of government,
increase their size through consolidation and
improve the value chain efficiency. Truly said,
it is the time for survival of the fittest.
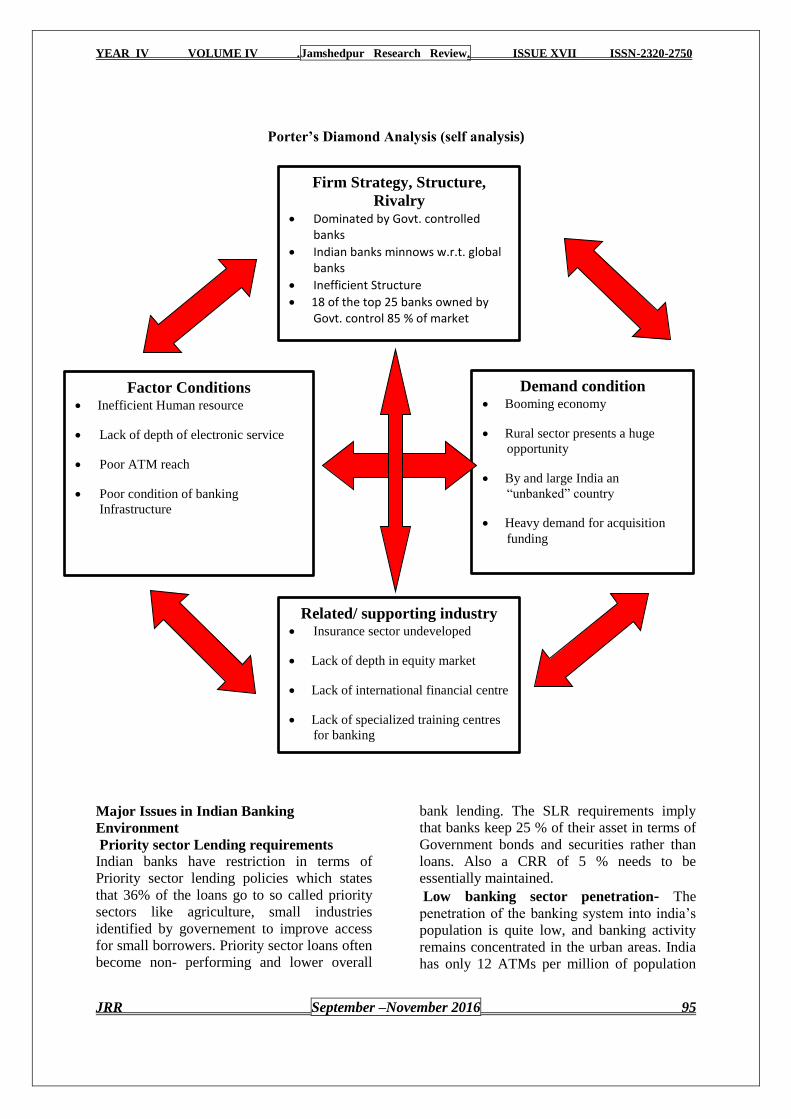
YEAR IV VOLUME IV .Jamshedpur Research Review. ISSUE XVII ISSN-2320-2750
JRR September –November 2016 95
Porter’s Diamond Analysis (self analysis)
Major Issues in Indian Banking
Environment
Priority sector Lending requirements
Indian banks have restriction in terms of
Priority sector lending policies which states
that 36% of the loans go to so called priority
sectors like agriculture, small industries
identified by governement to improve access
for small borrowers. Priority sector loans often
become non- performing and lower overall
bank lending. The SLR requirements imply
that banks keep 25 % of their asset in terms of
Government bonds and securities rather than
loans. Also a CRR of 5 % needs to be
essentially maintained.
Low banking sector penetration- The
penetration of the banking system into india‘s
population is quite low, and banking activity
remains concentrated in the urban areas. India
has only 12 ATMs per million of population
Firm Strategy, Structure,
Rivalry Dominated by Govt. controlled
banks
Indian banks minnows w.r.t. global banks
Inefficient Structure
18 of the top 25 banks owned by Govt. control 85 % of market
Factor Conditions Inefficient Human resource
Lack of depth of electronic service
Poor ATM reach
Poor condition of banking
Infrastructure
Demand condition Booming economy
Rural sector presents a huge
opportunity
By and large India an
―unbanked‖ country
Heavy demand for acquisition
funding
Related/ supporting industry Insurance sector undeveloped
Lack of depth in equity market
Lack of international financial centre
Lack of specialized training centres
for banking
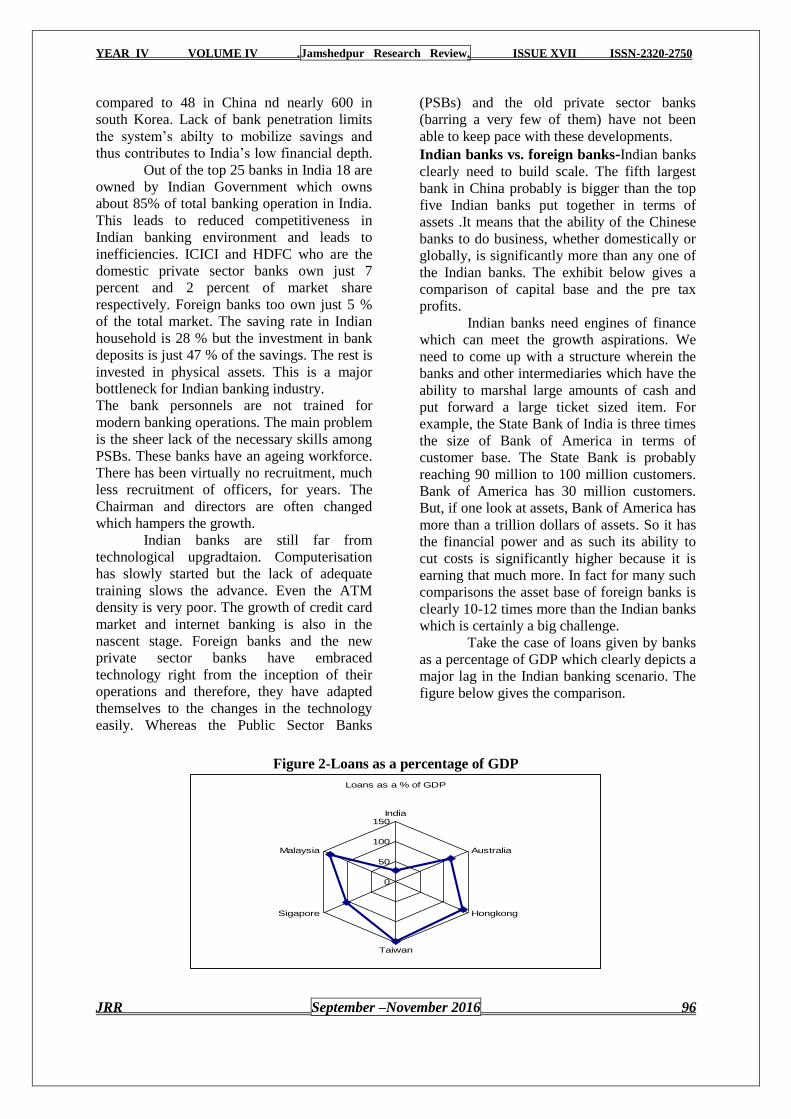
YEAR IV VOLUME IV .Jamshedpur Research Review. ISSUE XVII ISSN-2320-2750
JRR September –November 2016 96
compared to 48 in China nd nearly 600 in
south Korea. Lack of bank penetration limits
the system‘s abilty to mobilize savings and
thus contributes to India‘s low financial depth.
Out of the top 25 banks in India 18 are
owned by Indian Government which owns
about 85% of total banking operation in India.
This leads to reduced competitiveness in
Indian banking environment and leads to
inefficiencies. ICICI and HDFC who are the
domestic private sector banks own just 7
percent and 2 percent of market share
respectively. Foreign banks too own just 5 %
of the total market. The saving rate in Indian
household is 28 % but the investment in bank
deposits is just 47 % of the savings. The rest is
invested in physical assets. This is a major
bottleneck for Indian banking industry.
The bank personnels are not trained for
modern banking operations. The main problem
is the sheer lack of the necessary skills among
PSBs. These banks have an ageing workforce.
There has been virtually no recruitment, much
less recruitment of officers, for years. The
Chairman and directors are often changed
which hampers the growth. Indian banks are still far from
technological upgradtaion. Computerisation
has slowly started but the lack of adequate
training slows the advance. Even the ATM
density is very poor. The growth of credit card
market and internet banking is also in the
nascent stage. Foreign banks and the new
private sector banks have embraced
technology right from the inception of their
operations and therefore, they have adapted
themselves to the changes in the technology
easily. Whereas the Public Sector Banks
(PSBs) and the old private sector banks
(barring a very few of them) have not been
able to keep pace with these developments.
Indian banks vs. foreign banks-Indian banks
clearly need to build scale. The fifth largest
bank in China probably is bigger than the top
five Indian banks put together in terms of
assets .It means that the ability of the Chinese
banks to do business, whether domestically or
globally, is significantly more than any one of
the Indian banks. The exhibit below gives a
comparison of capital base and the pre tax
profits. Indian banks need engines of finance
which can meet the growth aspirations. We
need to come up with a structure wherein the
banks and other intermediaries which have the
ability to marshal large amounts of cash and
put forward a large ticket sized item. For
example, the State Bank of India is three times
the size of Bank of America in terms of
customer base. The State Bank is probably
reaching 90 million to 100 million customers.
Bank of America has 30 million customers.
But, if one look at assets, Bank of America has
more than a trillion dollars of assets. So it has
the financial power and as such its ability to
cut costs is significantly higher because it is
earning that much more. In fact for many such
comparisons the asset base of foreign banks is
clearly 10-12 times more than the Indian banks
which is certainly a big challenge. Take the case of loans given by banks
as a percentage of GDP which clearly depicts a
major lag in the Indian banking scenario. The
figure below gives the comparison.
Figure 2-Loans as a percentage of GDP
Loans as a % of GDP
0
50
100
150India
Australia
Hongkong
Taiwan
Sigapore
Malaysia

YEAR IV VOLUME IV .Jamshedpur Research Review. ISSUE XVII ISSN-2320-2750
JRR September –November 2016 97
The comparison clearly brings out the
condition of under-banking in India. As the
banks are not lacking in the number of
branches, it is important for them to introduce
new products range and reach new people.
One major aspect of Indian banks is the way
they give their loans. Indian banks mostly give
their loans depending on the asset base of a
company while foreign banks give on the basis
of cash flows of the company. This mentality
has to be changed to sustain in the long run.
The product portfolio of Indian banks is quite
low in comparison to foreign banks and a
major reason cited for this is lack of effective
delivery channels. The exhibit below shows
the comparison.
Major issues in Consolidation
a.) Resistance from employee unions:
The mergers in PSBs face a major
roadblock from the employee unions
who feel that such mergers will
hamper the compensation for
employees. In such a scenario the best
the PSBs can do at this moment is
forming loose alliances like that of
Corporation bank.
b.) Non- uniformity on technological
front: There is a major difference on
the technological front in banks like
the computerization, online banking
and the concept of nationalized
banking through internet which is a
challenge.
c.) HRD: The employees of public sector
banks are ageing. Almost 35 to 40 per
cent will be natural attrition of people
in coming years. That would mean
that there are a larger number of
people prepared to take VRS in case it
is offered and the cost also would be
much lower than if the employees
were younger. But the banking system
needs a better staff training and
equipping with advance technology
basics.
d.) Legal Aspects: There are a lot of
issues around our present legislation
on the banking system. The banks are
governed by various Acts. One set of
banks is governed by the Bank
Nationalization Act; the State Bank is
governed by the State Bank of India
Act, private banks are governed by the
Companies Act and Banking
Regulation Act. Sometimes there are
overriding provisions. There is a need
to do some kind of harmonization.
Corporatisation of most of the public
sector banks can be a viable solution.
If the government can do this, by and
large, the issue can be resolved.
e.) Leadership: For consolidation to be
effective, it needs to be led by the
leader. It cannot be led from the
bottom up as a process of the weak
consolidating with the weak. The
leaders have the least incentive
currently in India to lead
consolidation.
f.) Apprehensions: Many argue that
consolidation will lead to poorer
customer service because branches
will be rationalized to enforce
efficiencies. Others argue that because
of banks' inability to reduce staff,
there will be no synergies on cost but
increased complexity in operations,
which will lead to poorer service and
higher cost.
The Reserve bank of India is acting as a
facilitator for the consolidation process. Some
of the measures taken by RBI are:
a.) Increased capital requirements of
banks: The capital requirement is
increased to Rs. 300 crore for all
banks in the private sector which will
force the small banks to merge.
b.) BASEL II: The revised Basel
framework seeks to arrive at
significantly more risk-sensitive
approaches to capital requirements. It
provides a range of options (by way of
ratings) for determining the capital
requirements for credit risk and
operational risk to allow banks to
select approaches that are most
appropriate for their operations and
financial markets.
YEAR IV VOLUME IV .Jamshedpur Research Review. ISSUE XVII ISSN-2320-2750
JRR September –November 2016 98
c.) CAR: Capital Adequacy requirements
will be in compliance to BASEL II
norms.
d.) GAAP: RBI is in a move to
standardize all accounting practices of
banks according to GAAP. This will
bring uniformity in the accounting
methods.
The strategies need to be followed by Indian
banks are listed as under. The most important
will be consolidation as already discussed. We
have tried to rank these strategies in the order
of importance based on our discussion with
some of the bank managers and internet blogs.
Consolidation
Strict Corporate Governance Norms
Regional Expansion
Higher FDI limits
FTA‘s
Some other strategies that will help the Indian
banking system are:
Government should create 5 -6 banks
of the size of SBI
Need to give good competitive
compensation packages at all levels
for better productivity
Implementation of Basel II norms
Conclusion With India becoming a major force in the
world economy, the Indian Financial sector
need to stable and efficient to sustain or
increase the growth rate of the economy.
Banking environment in India is marked with
many irregularities and inefficiencies owing to
increased government role and regulations,
lack of depth and reach in banking operations
and technological laggardness. The reforms in
the Indian banking sector will have a major
effect on the banking operations.
With the opening up of the banking sector the
Indian banks face increased competition. In
the wake of such developments the various
strategies that need to be followed in the order
of preference level are:
1. Consolidation
2. Strict Corporate Governance Norms
3. Regional Expansion
4. Higher FDI limits
5. FTA‘s
In addition the Indian banks will have to
improve their efficiency with respect to
clients, product portfolio, and distribution &
compliance.
References
1. Accelerating India‘s growth through
financial Systems reforms, May 2006-
A report by Mc. Kinsey
2. The World and the Indian banking
Industry, Garima Mishra and Rashi
Goyal, IIM A, MPRA
3. HSBC Interim Report 2007
4. A study of Indian banks- Milind
Sathaye
5. Business Standard, Banking Annual
6. Contemporary and Future Issues in
Indian Banking, speech by V
Leeladhar, deputy governor, RBI
7. Indian banking 2010- Towards a high
performing sector- Mc Kinsey & Co.
2005
8. Mergers & acquisitions in Indian
Banking Sector- Mc Kinsey & Co.
2004
9. FICCI Survey on status of Indian
banking industry
10. Indian Banking: Shaping an
Economic Powerhouse- Shri M.B.N.
Rao Chairman & Managing Director
Canara Bank
11. Doing Business in India the Big
Picture a Banker‘s Perspective- Dr.
Anil K Khandelwal Chairman &
Managing Director Bank of Baroda
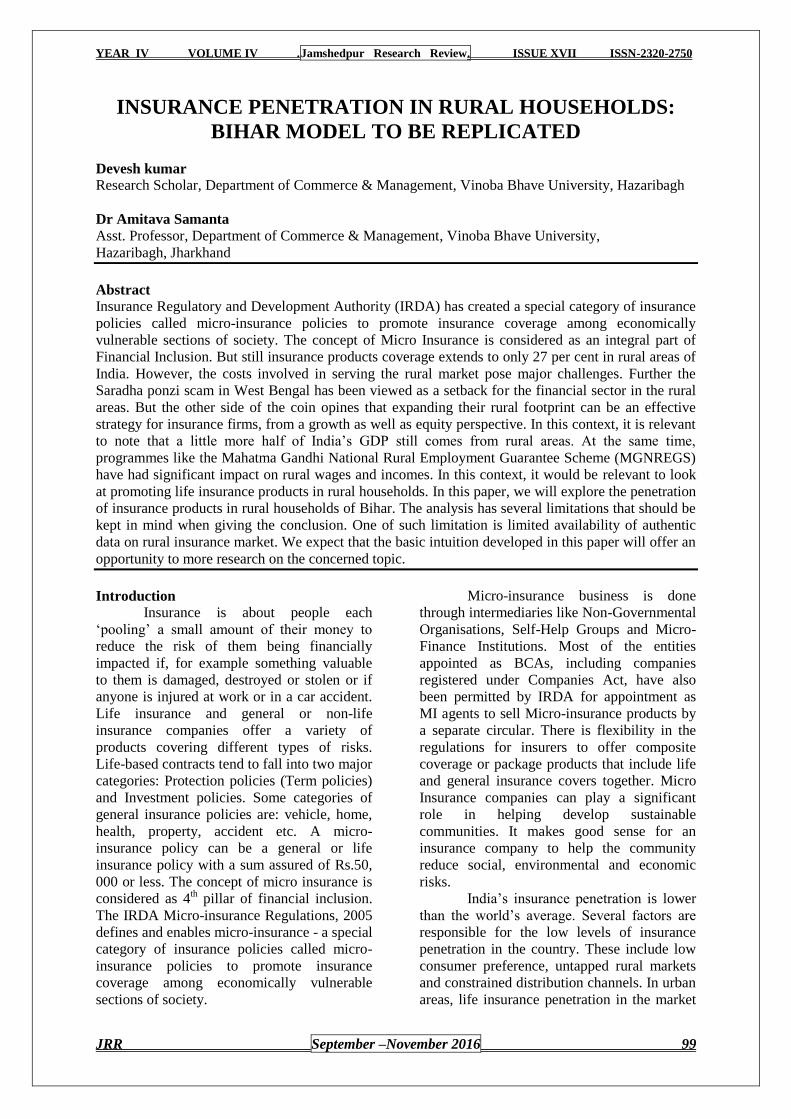
YEAR IV VOLUME IV .Jamshedpur Research Review. ISSUE XVII ISSN-2320-2750
JRR September –November 2016 99
INSURANCE PENETRATION IN RURAL HOUSEHOLDS:
BIHAR MODEL TO BE REPLICATED
Devesh kumar
Research Scholar, Department of Commerce & Management, Vinoba Bhave University, Hazaribagh
Dr Amitava Samanta
Asst. Professor, Department of Commerce & Management, Vinoba Bhave University,
Hazaribagh, Jharkhand
Abstract
Insurance Regulatory and Development Authority (IRDA) has created a special category of insurance
policies called micro-insurance policies to promote insurance coverage among economically
vulnerable sections of society. The concept of Micro Insurance is considered as an integral part of
Financial Inclusion. But still insurance products coverage extends to only 27 per cent in rural areas of
India. However, the costs involved in serving the rural market pose major challenges. Further the
Saradha ponzi scam in West Bengal has been viewed as a setback for the financial sector in the rural
areas. But the other side of the coin opines that expanding their rural footprint can be an effective
strategy for insurance firms, from a growth as well as equity perspective. In this context, it is relevant
to note that a little more half of India‘s GDP still comes from rural areas. At the same time,
programmes like the Mahatma Gandhi National Rural Employment Guarantee Scheme (MGNREGS)
have had significant impact on rural wages and incomes. In this context, it would be relevant to look
at promoting life insurance products in rural households. In this paper, we will explore the penetration
of insurance products in rural households of Bihar. The analysis has several limitations that should be
kept in mind when giving the conclusion. One of such limitation is limited availability of authentic
data on rural insurance market. We expect that the basic intuition developed in this paper will offer an
opportunity to more research on the concerned topic.
Introduction
Insurance is about people each
‗pooling‘ a small amount of their money to
reduce the risk of them being financially
impacted if, for example something valuable
to them is damaged, destroyed or stolen or if
anyone is injured at work or in a car accident.
Life insurance and general or non-life
insurance companies offer a variety of
products covering different types of risks.
Life-based contracts tend to fall into two major
categories: Protection policies (Term policies)
and Investment policies. Some categories of
general insurance policies are: vehicle, home,
health, property, accident etc. A micro-
insurance policy can be a general or life
insurance policy with a sum assured of Rs.50,
000 or less. The concept of micro insurance is
considered as 4th pillar of financial inclusion.
The IRDA Micro-insurance Regulations, 2005
defines and enables micro-insurance - a special
category of insurance policies called micro-
insurance policies to promote insurance
coverage among economically vulnerable
sections of society.
Micro-insurance business is done
through intermediaries like Non-Governmental
Organisations, Self-Help Groups and Micro-
Finance Institutions. Most of the entities
appointed as BCAs, including companies
registered under Companies Act, have also
been permitted by IRDA for appointment as
MI agents to sell Micro-insurance products by
a separate circular. There is flexibility in the
regulations for insurers to offer composite
coverage or package products that include life
and general insurance covers together. Micro
Insurance companies can play a significant
role in helping develop sustainable
communities. It makes good sense for an
insurance company to help the community
reduce social, environmental and economic
risks.
India‘s insurance penetration is lower
than the world‘s average. Several factors are
responsible for the low levels of insurance
penetration in the country. These include low
consumer preference, untapped rural markets
and constrained distribution channels. In urban
areas, life insurance penetration in the market
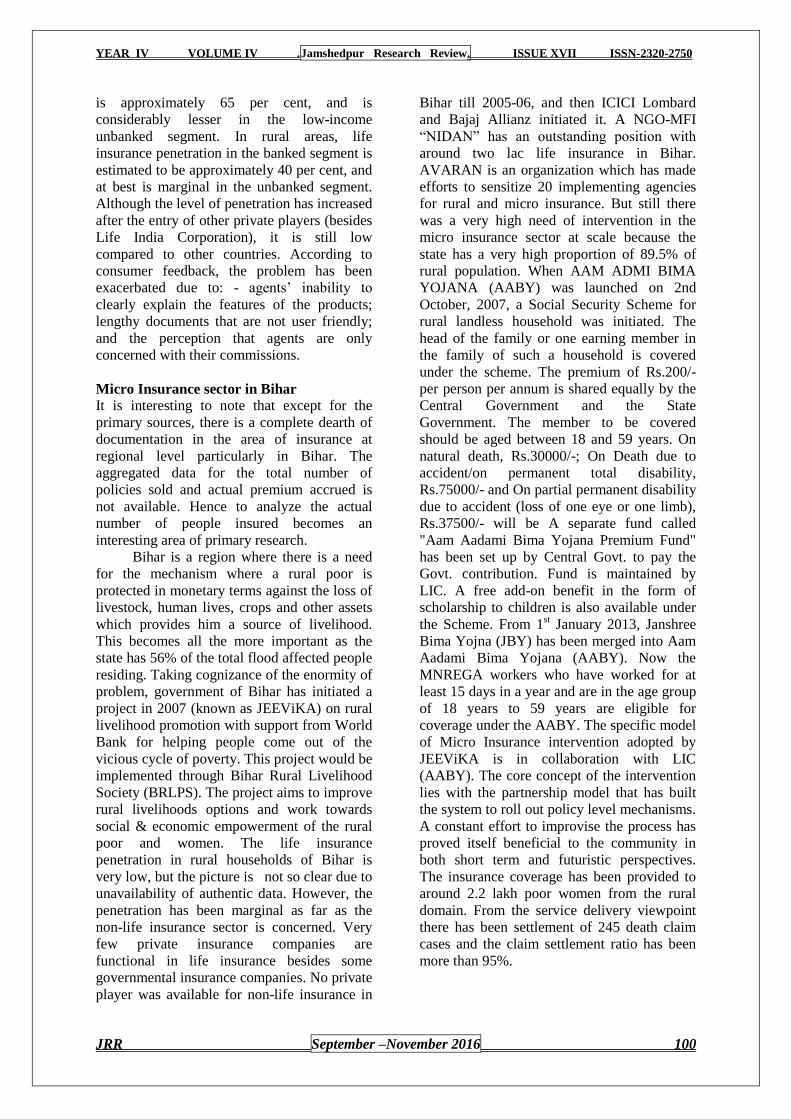
YEAR IV VOLUME IV .Jamshedpur Research Review. ISSUE XVII ISSN-2320-2750
JRR September –November 2016 100
is approximately 65 per cent, and is
considerably lesser in the low-income
unbanked segment. In rural areas, life
insurance penetration in the banked segment is
estimated to be approximately 40 per cent, and
at best is marginal in the unbanked segment.
Although the level of penetration has increased
after the entry of other private players (besides
Life India Corporation), it is still low
compared to other countries. According to
consumer feedback, the problem has been
exacerbated due to: - agents‘ inability to
clearly explain the features of the products;
lengthy documents that are not user friendly;
and the perception that agents are only
concerned with their commissions.
Micro Insurance sector in Bihar
It is interesting to note that except for the
primary sources, there is a complete dearth of
documentation in the area of insurance at
regional level particularly in Bihar. The
aggregated data for the total number of
policies sold and actual premium accrued is
not available. Hence to analyze the actual
number of people insured becomes an
interesting area of primary research.
Bihar is a region where there is a need
for the mechanism where a rural poor is
protected in monetary terms against the loss of
livestock, human lives, crops and other assets
which provides him a source of livelihood.
This becomes all the more important as the
state has 56% of the total flood affected people
residing. Taking cognizance of the enormity of
problem, government of Bihar has initiated a
project in 2007 (known as JEEViKA) on rural
livelihood promotion with support from World
Bank for helping people come out of the
vicious cycle of poverty. This project would be
implemented through Bihar Rural Livelihood
Society (BRLPS). The project aims to improve
rural livelihoods options and work towards
social & economic empowerment of the rural
poor and women. The life insurance
penetration in rural households of Bihar is
very low, but the picture is not so clear due to
unavailability of authentic data. However, the
penetration has been marginal as far as the
non-life insurance sector is concerned. Very
few private insurance companies are
functional in life insurance besides some
governmental insurance companies. No private
player was available for non-life insurance in
Bihar till 2005-06, and then ICICI Lombard
and Bajaj Allianz initiated it. A NGO-MFI
―NIDAN‖ has an outstanding position with
around two lac life insurance in Bihar.
AVARAN is an organization which has made
efforts to sensitize 20 implementing agencies
for rural and micro insurance. But still there
was a very high need of intervention in the
micro insurance sector at scale because the
state has a very high proportion of 89.5% of
rural population. When AAM ADMI BIMA
YOJANA (AABY) was launched on 2nd
October, 2007, a Social Security Scheme for
rural landless household was initiated. The
head of the family or one earning member in
the family of such a household is covered
under the scheme. The premium of Rs.200/-
per person per annum is shared equally by the
Central Government and the State
Government. The member to be covered
should be aged between 18 and 59 years. On
natural death, Rs.30000/-; On Death due to
accident/on permanent total disability,
Rs.75000/- and On partial permanent disability
due to accident (loss of one eye or one limb),
Rs.37500/- will be A separate fund called
"Aam Aadami Bima Yojana Premium Fund"
has been set up by Central Govt. to pay the
Govt. contribution. Fund is maintained by
LIC. A free add-on benefit in the form of
scholarship to children is also available under
the Scheme. From 1st January 2013, Janshree
Bima Yojna (JBY) has been merged into Aam
Aadami Bima Yojana (AABY). Now the
MNREGA workers who have worked for at
least 15 days in a year and are in the age group
of 18 years to 59 years are eligible for
coverage under the AABY. The specific model
of Micro Insurance intervention adopted by
JEEViKA is in collaboration with LIC
(AABY). The core concept of the intervention
lies with the partnership model that has built
the system to roll out policy level mechanisms.
A constant effort to improvise the process has
proved itself beneficial to the community in
both short term and futuristic perspectives.
The insurance coverage has been provided to
around 2.2 lakh poor women from the rural
domain. From the service delivery viewpoint
there has been settlement of 245 death claim
cases and the claim settlement ratio has been
more than 95%.
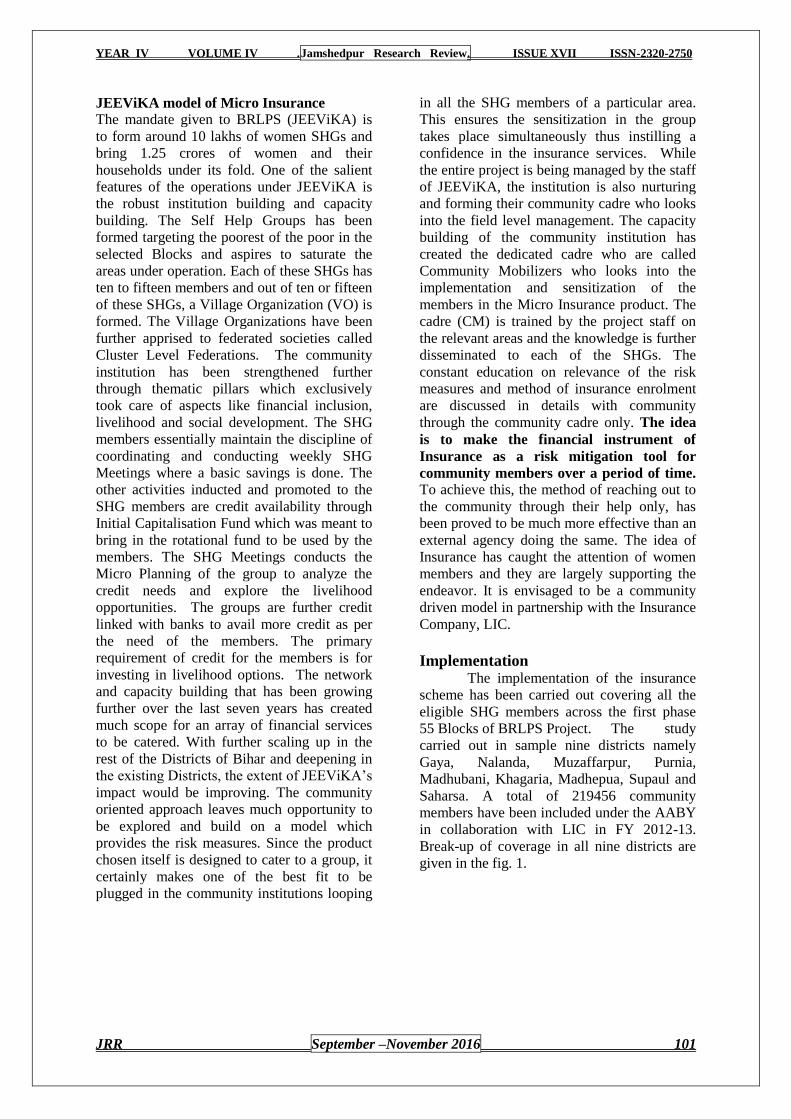
YEAR IV VOLUME IV .Jamshedpur Research Review. ISSUE XVII ISSN-2320-2750
JRR September –November 2016 101
JEEViKA model of Micro Insurance
The mandate given to BRLPS (JEEViKA) is
to form around 10 lakhs of women SHGs and
bring 1.25 crores of women and their
households under its fold. One of the salient
features of the operations under JEEViKA is
the robust institution building and capacity
building. The Self Help Groups has been
formed targeting the poorest of the poor in the
selected Blocks and aspires to saturate the
areas under operation. Each of these SHGs has
ten to fifteen members and out of ten or fifteen
of these SHGs, a Village Organization (VO) is
formed. The Village Organizations have been
further apprised to federated societies called
Cluster Level Federations. The community
institution has been strengthened further
through thematic pillars which exclusively
took care of aspects like financial inclusion,
livelihood and social development. The SHG
members essentially maintain the discipline of
coordinating and conducting weekly SHG
Meetings where a basic savings is done. The
other activities inducted and promoted to the
SHG members are credit availability through
Initial Capitalisation Fund which was meant to
bring in the rotational fund to be used by the
members. The SHG Meetings conducts the
Micro Planning of the group to analyze the
credit needs and explore the livelihood
opportunities. The groups are further credit
linked with banks to avail more credit as per
the need of the members. The primary
requirement of credit for the members is for
investing in livelihood options. The network
and capacity building that has been growing
further over the last seven years has created
much scope for an array of financial services
to be catered. With further scaling up in the
rest of the Districts of Bihar and deepening in
the existing Districts, the extent of JEEViKA‘s
impact would be improving. The community
oriented approach leaves much opportunity to
be explored and build on a model which
provides the risk measures. Since the product
chosen itself is designed to cater to a group, it
certainly makes one of the best fit to be
plugged in the community institutions looping
in all the SHG members of a particular area.
This ensures the sensitization in the group
takes place simultaneously thus instilling a
confidence in the insurance services. While
the entire project is being managed by the staff
of JEEViKA, the institution is also nurturing
and forming their community cadre who looks
into the field level management. The capacity
building of the community institution has
created the dedicated cadre who are called
Community Mobilizers who looks into the
implementation and sensitization of the
members in the Micro Insurance product. The
cadre (CM) is trained by the project staff on
the relevant areas and the knowledge is further
disseminated to each of the SHGs. The
constant education on relevance of the risk
measures and method of insurance enrolment
are discussed in details with community
through the community cadre only. The idea
is to make the financial instrument of
Insurance as a risk mitigation tool for
community members over a period of time.
To achieve this, the method of reaching out to
the community through their help only, has
been proved to be much more effective than an
external agency doing the same. The idea of
Insurance has caught the attention of women
members and they are largely supporting the
endeavor. It is envisaged to be a community
driven model in partnership with the Insurance
Company, LIC.
Implementation
The implementation of the insurance
scheme has been carried out covering all the
eligible SHG members across the first phase
55 Blocks of BRLPS Project. The study
carried out in sample nine districts namely
Gaya, Nalanda, Muzaffarpur, Purnia,
Madhubani, Khagaria, Madhepua, Supaul and
Saharsa. A total of 219456 community
members have been included under the AABY
in collaboration with LIC in FY 2012-13.
Break-up of coverage in all nine districts are
given in the fig. 1.
YEAR IV VOLUME IV .Jamshedpur Research Review. ISSUE XVII ISSN-2320-2750
JRR September –November 2016 102
Figure 1 –AABY Enrollment status in FY 2012-13
Out of nine districts, six districts (Gaya,
Nalanda, Muzaffarpur, Purnia, Madhubani and
Khagaria) are old districts where JEEViKA
has piloted its project. Other three districts
(Madhepua, Supaul and Saharsa) are
comparatively very new. The AABY was
launched in two phases after an interval of six
months. Break-up of coverage in both phases
in all nine districts are given in the fig. 2 and 3
respectively.
Figure 2 –AABY Enrollment status in FY 2012-13 [Phase I]
Gaya Nalanda Muzaffarpur Purnia Madhubani Khagaria Madhepura Supaul Saharsa
Total Micro Insurance 42799 36959 31610 30136 27914 16700 15396 10080 7862
Total Micro Insurance in 9 sample districts in 2012-13
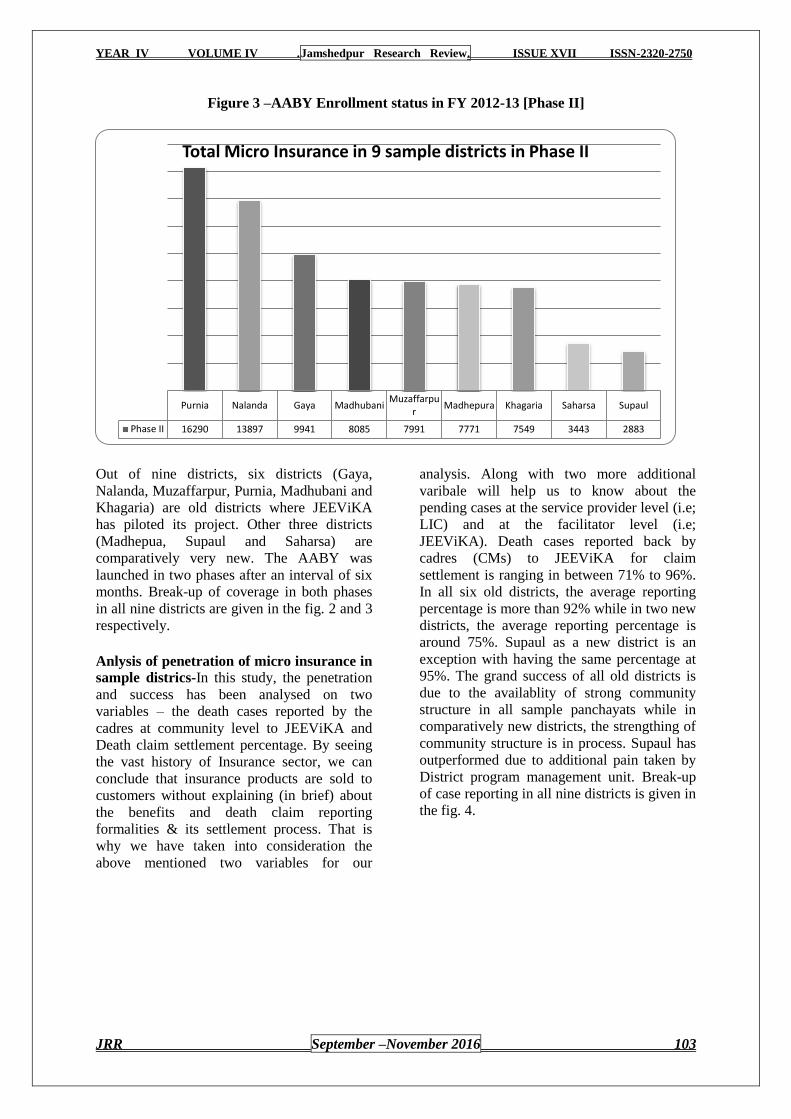
YEAR IV VOLUME IV .Jamshedpur Research Review. ISSUE XVII ISSN-2320-2750
JRR September –November 2016 103
Figure 3 –AABY Enrollment status in FY 2012-13 [Phase II]
Out of nine districts, six districts (Gaya,
Nalanda, Muzaffarpur, Purnia, Madhubani and
Khagaria) are old districts where JEEViKA
has piloted its project. Other three districts
(Madhepua, Supaul and Saharsa) are
comparatively very new. The AABY was
launched in two phases after an interval of six
months. Break-up of coverage in both phases
in all nine districts are given in the fig. 2 and 3
respectively.
Anlysis of penetration of micro insurance in
sample districs-In this study, the penetration
and success has been analysed on two
variables – the death cases reported by the
cadres at community level to JEEViKA and
Death claim settlement percentage. By seeing
the vast history of Insurance sector, we can
conclude that insurance products are sold to
customers without explaining (in brief) about
the benefits and death claim reporting
formalities & its settlement process. That is
why we have taken into consideration the
above mentioned two variables for our
analysis. Along with two more additional
varibale will help us to know about the
pending cases at the service provider level (i.e;
LIC) and at the facilitator level (i.e;
JEEViKA). Death cases reported back by
cadres (CMs) to JEEViKA for claim
settlement is ranging in between 71% to 96%.
In all six old districts, the average reporting
percentage is more than 92% while in two new
districts, the average reporting percentage is
around 75%. Supaul as a new district is an
exception with having the same percentage at
95%. The grand success of all old districts is
due to the availablity of strong community
structure in all sample panchayats while in
comparatively new districts, the strengthing of
community structure is in process. Supaul has
outperformed due to additional pain taken by
District program management unit. Break-up
of case reporting in all nine districts is given in
the fig. 4.
Purnia Nalanda Gaya MadhubaniMuzaffarpu
rMadhepura Khagaria Saharsa Supaul
Phase II 16290 13897 9941 8085 7991 7771 7549 3443 2883
Total Micro Insurance in 9 sample districts in Phase II
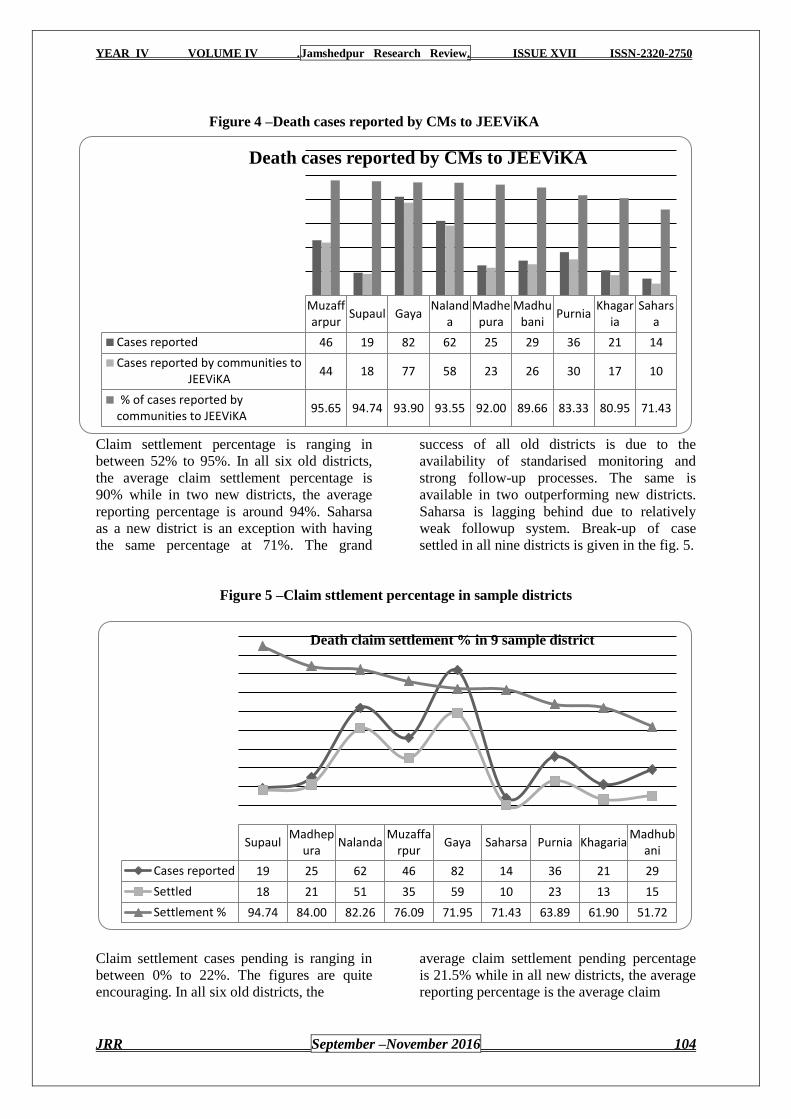
YEAR IV VOLUME IV .Jamshedpur Research Review. ISSUE XVII ISSN-2320-2750
JRR September –November 2016 104
Figure 4 –Death cases reported by CMs to JEEViKA
Claim settlement percentage is ranging in
between 52% to 95%. In all six old districts,
the average claim settlement percentage is
90% while in two new districts, the average
reporting percentage is around 94%. Saharsa
as a new district is an exception with having
the same percentage at 71%. The grand
success of all old districts is due to the
availability of standarised monitoring and
strong follow-up processes. The same is
available in two outperforming new districts.
Saharsa is lagging behind due to relatively
weak followup system. Break-up of case
settled in all nine districts is given in the fig. 5.
Figure 5 –Claim sttlement percentage in sample districts
Claim settlement cases pending is ranging in
between 0% to 22%. The figures are quite
encouraging. In all six old districts, the
average claim settlement pending percentage
is 21.5% while in all new districts, the average
reporting percentage is the average claim
SupaulMadhep
uraNalanda
Muzaffarpur
Gaya Saharsa Purnia KhagariaMadhub
ani
Cases reported 19 25 62 46 82 14 36 21 29
Settled 18 21 51 35 59 10 23 13 15
Settlement % 94.74 84.00 82.26 76.09 71.95 71.43 63.89 61.90 51.72
Death claim settlement % in 9 sample district
Muzaffarpur
Supaul GayaNaland
aMadhe
puraMadhu
baniPurnia
Khagaria
Saharsa
Cases reported 46 19 82 62 25 29 36 21 14
Cases reported by communities toJEEViKA
44 18 77 58 23 26 30 17 10
% of cases reported bycommunities to JEEViKA
95.65 94.74 93.90 93.55 92.00 89.66 83.33 80.95 71.43
Death cases reported by CMs to JEEViKA
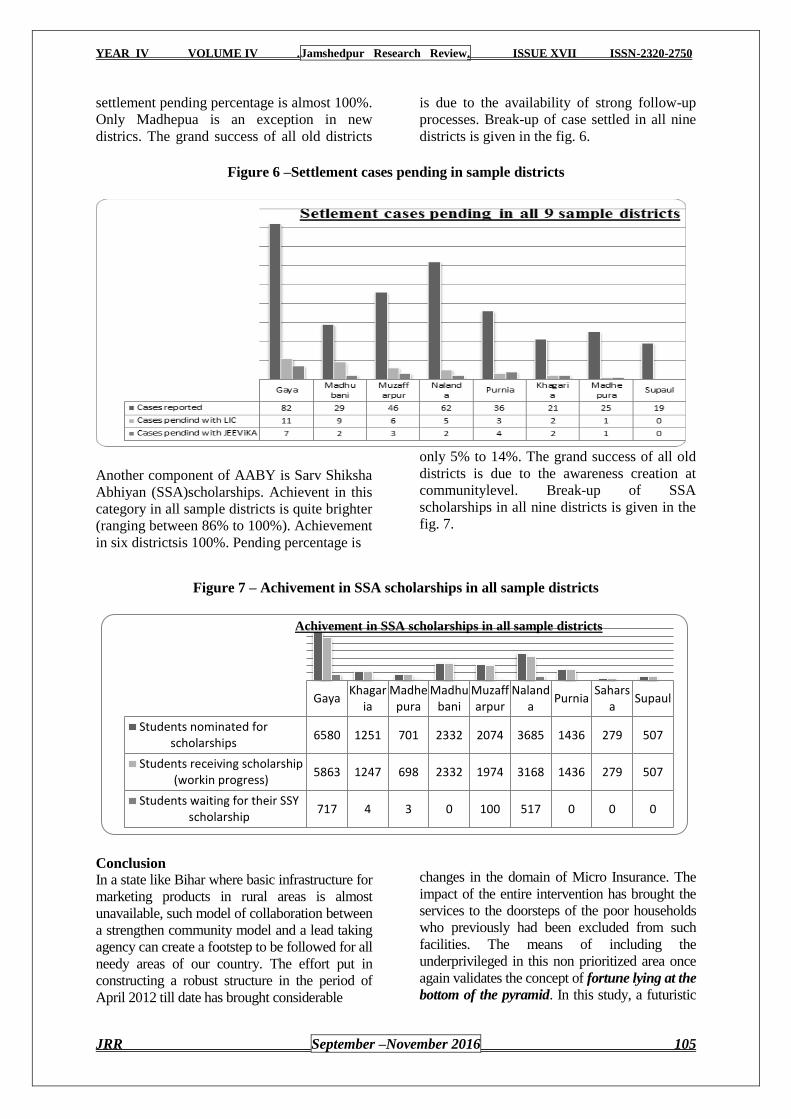
YEAR IV VOLUME IV .Jamshedpur Research Review. ISSUE XVII ISSN-2320-2750
JRR September –November 2016 105
settlement pending percentage is almost 100%.
Only Madhepua is an exception in new
districs. The grand success of all old districts
is due to the availability of strong follow-up
processes. Break-up of case settled in all nine
districts is given in the fig. 6.
Figure 6 –Settlement cases pending in sample districts
Another component of AABY is Sarv Shiksha
Abhiyan (SSA)scholarships. Achievent in this
category in all sample districts is quite brighter
(ranging between 86% to 100%). Achievement
in six districtsis 100%. Pending percentage is
only 5% to 14%. The grand success of all old
districts is due to the awareness creation at
communitylevel. Break-up of SSA
scholarships in all nine districts is given in the
fig. 7.
Figure 7 – Achivement in SSA scholarships in all sample districts
Conclusion
In a state like Bihar where basic infrastructure for
marketing products in rural areas is almost
unavailable, such model of collaboration between
a strengthen community model and a lead taking
agency can create a footstep to be followed for all
needy areas of our country. The effort put in
constructing a robust structure in the period of
April 2012 till date has brought considerable
changes in the domain of Micro Insurance. The
impact of the entire intervention has brought the
services to the doorsteps of the poor households
who previously had been excluded from such
facilities. The means of including the
underprivileged in this non prioritized area once
again validates the concept of fortune lying at the
bottom of the pyramid. In this study, a futuristic
GayaKhagar
iaMadhe
puraMadhu
baniMuzaffarpur
Nalanda
PurniaSahars
aSupaul
Students nominated forscholarships
6580 1251 701 2332 2074 3685 1436 279 507
Students receiving scholarship(workin progress)
5863 1247 698 2332 1974 3168 1436 279 507
Students waiting for their SSYscholarship
717 4 3 0 100 517 0 0 0
Achivement in SSA scholarships in all sample districts
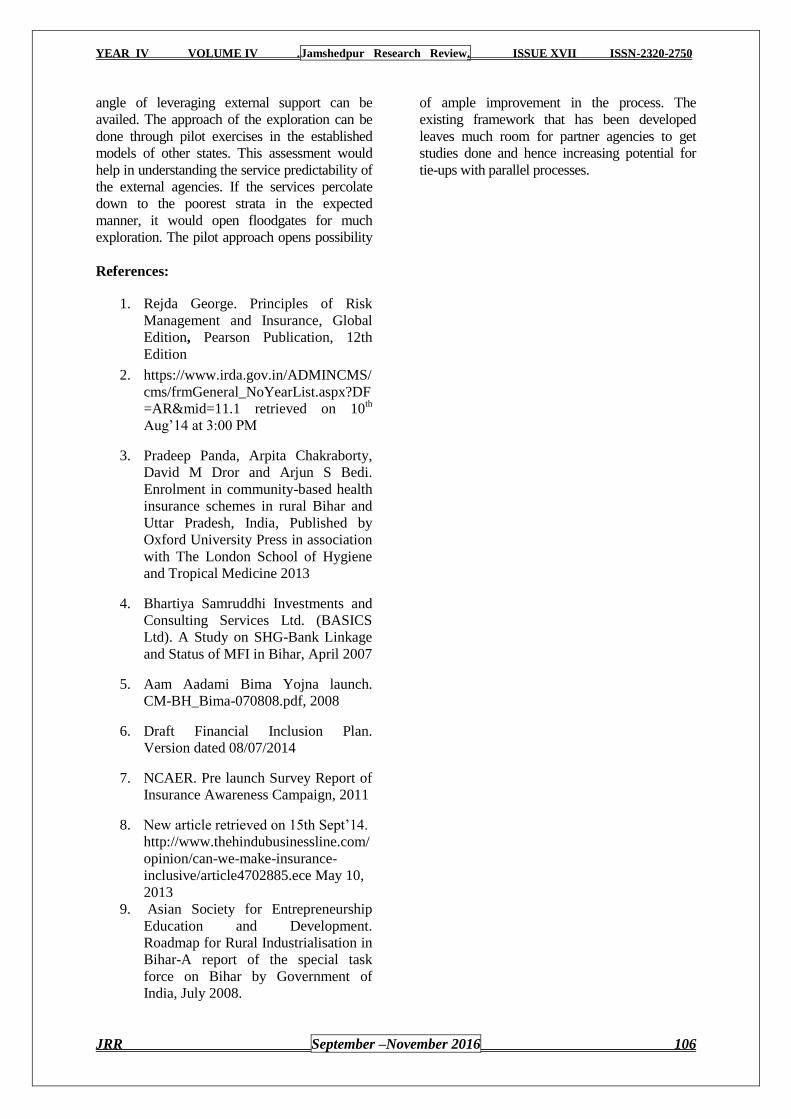
YEAR IV VOLUME IV .Jamshedpur Research Review. ISSUE XVII ISSN-2320-2750
JRR September –November 2016 106
angle of leveraging external support can be
availed. The approach of the exploration can be
done through pilot exercises in the established
models of other states. This assessment would
help in understanding the service predictability of
the external agencies. If the services percolate
down to the poorest strata in the expected
manner, it would open floodgates for much
exploration. The pilot approach opens possibility
of ample improvement in the process. The
existing framework that has been developed
leaves much room for partner agencies to get
studies done and hence increasing potential for
tie-ups with parallel processes.
References:
1. Rejda George. Principles of Risk
Management and Insurance, Global
Edition, Pearson Publication, 12th
Edition
2. https://www.irda.gov.in/ADMINCMS/
cms/frmGeneral_NoYearList.aspx?DF
=AR&mid=11.1 retrieved on 10th
Aug‘14 at 3:00 PM
3. Pradeep Panda, Arpita Chakraborty,
David M Dror and Arjun S Bedi.
Enrolment in community-based health
insurance schemes in rural Bihar and
Uttar Pradesh, India, Published by
Oxford University Press in association
with The London School of Hygiene
and Tropical Medicine 2013
4. Bhartiya Samruddhi Investments and
Consulting Services Ltd. (BASICS
Ltd). A Study on SHG-Bank Linkage
and Status of MFI in Bihar, April 2007
5. Aam Aadami Bima Yojna launch.
CM-BH_Bima-070808.pdf, 2008
6. Draft Financial Inclusion Plan.
Version dated 08/07/2014
7. NCAER. Pre launch Survey Report of
Insurance Awareness Campaign, 2011
8. New article retrieved on 15th Sept‘14.
http://www.thehindubusinessline.com/
opinion/can-we-make-insurance-
inclusive/article4702885.ece May 10,
2013
9. Asian Society for Entrepreneurship
Education and Development.
Roadmap for Rural Industrialisation in
Bihar-A report of the special task
force on Bihar by Government of
India, July 2008.
YEAR IV VOLUME IV .Jamshedpur Research Review. ISSUE XVII ISSN-2320-2750
JRR September –November 2016 107
A STUDY OF FINANCIAL INCLUSION PLAN & ITS
IMPLEMENTATION IN UNBANKED AREA OF INDIA:
AN OVERVIEW Mr. Shyam Jivan Salunkhe
Assistant Professor, Department of Commerce
A R B Garud College, Shendurni, Dist. Jalgaon Maharastra, India
___________________________________________________________________________
Abstract
The term "financial inclusion" has gained importance since the early 2000s, a result of findings about
financial exclusion and its direct correlation to poverty. The Reserve Bank has been encouraging
banks to adopt a structured and planned approach to financial inclusion with commitment at the
highest levels by preparing board-approved FIPs. Out of 3,445 rural bank branches opened during
2014-15, 2,230 branches were opened in unbanked rural centers. Around 155 million Basic Savings
Bank Deposit Accounts (BSBDAs) were added taking the total BSBDAs to 398 million. This includes
147 million accounts opened under PMJDY. With the addition of 2.6 million small farm sector credits
(Kisan Credit Cards-KCCs) and 1.8 million small non-farms sector credits (General Credit Cards-
GCCs), the total number of such accounts went up to nearly 42.5 million and 9.2 million respectively
This paper overlooks on a study of financial inclusion plan and its implementation in unbanked area
of India.
Keywords: Financial Inclusion, financial exclusion, financial literacy, etc.
Introduction
The term "financial inclusion" has gained
importance since the early 2000s, a result of
findings about financial exclusion and its
direct correlation to poverty. So, financial
inclusion is the concept related to financial
services for rural or low income group people
or vulnerable group of people of the society to
improve their standard of living and to brought
them in to flow of banking services through
financial education and with providing basic
banking facilities like saving, withdrawing,
deposits, short term lending or credit facilities,
money transfer, etc. it is cleared that the
financial inclusion plan actively working in
India, with the help of this plan the financial
services include basic saving bank deposit,
small credit, overdraft facility, Kisan credit
card, General Credit Card, ICT A/c‘s, etc.
provided to people from low income group by
Indian banks, under the guidance of Reserve
Bank of India. It is also seems that this activity
under FIP dynamically growing during this
five year period, but in case of last two year it
tremendously increased and positive result of
FIP seen in financial year 2013-2014 and
2014-2015.
Definition
―Basic banking services provide to those
people, who are belongs to low income group
or disadvantage group at affordable cost for
the purpose to financially empowered them
and it is called financial inclusion‖
Dr. C. Rangarajan committee on financial
inclusion defines it as:
"Financial inclusion may be defined as the
process of ensuring access to financial services
and timely and adequate credit where needed
by vulnerable groups such as weaker sections
and low income groups at an affordable cost."
―Financial inclusion is the delivery of financial
services & products to sections of
disadvantaged and low income segments of
society, at an affordable cost in a fair and
transparent manner by regulated mainstream
institutional players‖. From the above
definition it is clear that financial inclusion is
the concept related to basic financial services
or banking services provide to illiterate people,
people from low income group or
disadvantage group of society at very low cost
for elimination of poverty and brought them
into the mainstream of the society.
YEAR IV VOLUME IV .Jamshedpur Research Review. ISSUE XVII ISSN-2320-2750
JRR September –November 2016 108
Objectives of Financial Inclusion Banking services provide to those people, who
are belongs to low income group or
disadvantage group of large segment of
society, at affordable cost for the purpose
elimination of poverty and financially
empowered them,
Financial Inclusion is to extend financial
services to the large hitherto un-served
population of the country to unlock its growth
potential. In addition, it strives towards a more
inclusive growth by making financing
available to the poor in particular.
Importance of the Study:
The term of ―Financial Inclusion‖ is related
basic banking services available for poor
people or people form vulnerable group. India
is the country of rural area, larger section of
population living in rural area and most of
them living in below poverty line, they are not
assured about earned fixed income for day to
day living and to maintain basic standard of
living. So this paper basically overlook on
Financial Inclusion Plan and its
implementation in unbanked area of India to
make financial empowered people of rural
India or the people of vulnerable group.
Objectives of this Study
1. To study the importance of financial
inclusion plan in unbanked area
2. To study the role of Reserve Bank of India
in FIP in unbanked area
3. To Study the implementation of FIP in
unbanked area
Hypothesis of this Paper
1. Financial Inclusion plan really worked in
unbanked area of India to improve
standard of living of people of vulnerable
group
Role of Reserve Bank of India in Financial
Inclusion Plan
On 1st April, 2015, Reserve Bank India
celebrated 80th Anniversary of establishment,
on the this occasion RBI set a theme RBI@80
to enhanced financial inclusion plan in
unbanked area of India. In the financial Year
2012-2013 Government of India and Reserve
Bank of India set target to open a bank
branches in an every village, which covered
with 2000 population. With this target
Government of India and Reserve Bank of
India achieved a target of 490000 unbanked
villages out of 650000 villages (approx..) in
India up to the year of 2014-2015.
Financial inclusion Roadmap for Provision of Banking Facilities
in Unbanked Villages with Population less
than 2,000. The Reserve Bank continued with
its efforts to ensure extension of banking
facilities to all unbanked villages. For this,
about 490,000 unbanked villages with
population less than 2,000 were identified and
allotted to banks for coverage under the
ongoing Phase-II of the roadmap. At end-
March 2015, as reported by State Level
Bankers Committees (SLBCs), 390,387
villages were covered by 14,207 branches,
357,856 business correspondents (BCs) and
18,324 other modes, such as automated teller
machines (ATMs) and mobile vans. In view of
the ongoing implementation of PMJDY, banks
were advised to complete Phase-II coverage
by August 14, 2015 instead of March 31, 2016
as prescribed earlier.
Financial Inclusion Plan (FIP)
The Reserve Bank has been encouraging
banks to adopt a structured and planned
approach to financial inclusion with
commitment at the highest levels by preparing
board-approved FIPs. Out of 3,445 rural bank
branches opened during 2014-15, 2,230
branches were opened in unbanked rural
centers. Around 155 million Basic Savings
Bank Deposit Accounts (BSBDAs) were
added taking the total BSBDAs to 398 million.
This includes 147 million accounts opened
under PMJDY. With the addition of 2.6
million small farm sector credits (Kisan Credit
Cards-KCCs) and 1.8 million small non-farms
sector credits (General Credit Cards-GCCs),
the total number of such accounts went up to
nearly 42.5 million and 9.2 million
respectively.
Pradhan Mantri Jan Dhan Yojana (PMJDY)
The Government of India launched PMJDY on
August 28, 2014, for extending formal
financial services to the excluded population.
The major features of the scheme include: (i)
the facility to open a basic saving bank deposit
(BSBD) account in any bank branch or BC
outlet; (ii) accidental insurance cover (` 0.1
YEAR IV VOLUME IV .Jamshedpur Research Review. ISSUE XVII ISSN-2320-2750
JRR September –November 2016 109
million) and life insurance cover (` 30,000);
and (iii) an overdraft (OD) facility after
satisfactory operation of the account for six
months. Since the inception of the scheme,
165.7 million accounts had been opened by
June 30, 2015. The Government of India has
initiated routing of subsidy payments and also
introduced insurance and pension products for
BSBD account holders including for those
accounts opened under PMJDY. To ensure
increased activity in these accounts, the efforts
that needed to be taken include: (i) rolling out
direct benefit transfer (DBT) for all Central
and State Government payments; (ii) offering
appropriate credit products (farm and non-
farm sector) after due diligence; (iii)
strengthening the BC network; and (iv)
increasing awareness through financial literacy
initiatives. Reflecting the focus of the Reserve
Bank on financial inclusion, the 80th
anniversary celebrations of the Reserve Bank
were held in Mumbai on April 2, 2015, with
financial inclusion as the central theme
Financial Literacy Camps
Apart from direct initiatives, the Reserve
Bank‘s efforts to expand financial literacy is
channeled through banks. In terms of current
instructions, financial literacy centers (FLCs)
and rural branches of banks are required to
conduct financial literacy camps at least once a
month with focus on financially excluded
people. Additionally, banks are encouraged to
conduct such camps in unbanked locations. As
at end March 2015, 1,181 FLCs were
operational in the country, up from 942 as at
end March 2014. During the period April 2014
to March 2015, financial literacy camps were
conducted by 32,509 rural branches of banks
and 1.4 million and 5.7 million participants
opened accounts in the camps organized by the
FLCs and rural branches of banks, respectively
(Table I and II).
Table I : Activities Undertaken by Financial Literacy Centers
Particulars 2013-14 2014-15#
(April-March) (April-March)
1 2 3
No. of operational FLCs 942 1,181
No. of activities conducted* 56,985 84,089
Total no. of participants* 3,826,068 5,238,358
No. of participants opened NA 1,442,546
accounts after attending the camps
No. of participants already having NA 2,890,204
accounts while attending camps
*: Includes both outdoor and indoor activities. However, indoor activities have been
discontinued w.e.f. April 2014. NA: Not available. #: Provisional.
Table II: Activities Undertaken by Rural Branches(*Provisional)
Particulars 2014-15*
1 2
No. of Rural branches 52,934
No. of Rural branches conducted camps 32,509
No. of camps conducted 306,188
Total no. of participants 14,826,647
No. of participants opened accounts after attending the camp 5,657,092
No. of participants already having accounts while attending
camps 6,686,518
YEAR IV VOLUME IV .Jamshedpur Research Review. ISSUE XVII ISSN-2320-2750
JRR September –November 2016 110
Constraints in Financial Inclusion
Though the initiative under financial inclusion
has led to opening of large number of basic
bank accounts of people from the excluded
segment, the effort for ensuring that these
accounts remain operational has to continue.
This is possible if all government payments
are routed through the banking channel. A step
ahead will be to remunerate banks
appropriately for routing these transactions
through the banking channel. In addition, since
the last mile delivery of all banking services is
expected to be done mostly through the large
BC network created across the country, it is
necessary to ensure that appropriate control
system for oversight over BC operations is
provided by banks. The success of the
Information and Communication Technology
based BC model critically depends upon the
availability of proper network connectivity
across the country.
Simplifying Credit Dispensation
SCBs have been advised to dispense with no
due certificate from individual borrowers
(including SHGs and JLGs) for all types of
loans, irrespective of the amount involved.
Banks have been encouraged to use an
alternative framework of due diligence for
credit appraisal, which could consist of one or
more of the following:
a. Credit history check through credit
information companies;
b. Self-declaration or an affidavit from the
borrower;
c. Central Registry of Securitization Asset
Reconstruction and Security Interest
(CERSAI) registration;
d. peer monitoring;
e. information sharing among lenders; and ,
f. information search (writing to other
lenders with an auto deadline).
Going forward, the mechanism for issue of
Priority Sector Lending Certificates (PSLCs)
will be made operational. This will provide
banks with an instrument to aid them in
priority sector target achievement and allow
leveraging of their comparative advantage in
lending to the priority sector. To work out a
medium-term (five year) measureable action
plan for financial inclusion, the Reserve Bank
has constitutedT a Committee on Medium-
term Path on Financial Inclusion (Chairman:
Shri Deepak Mohanty). Studies will be
conducted to assess the efficacy of existing
schemes on lead bank, credit guarantee trust
for micro and small enterprises (CGTMSE),
KCC, SHG - bank linkage and the BC model.
Operationalization of TReDS, which
has been conceptualized as an authorized
electronic platform to facilitate discounting of
invoices/bills of exchange of MSMEs, will be
taken up during the course of the year. In
pursuance of the objective of fostering a
conducive policy environment for the MSME
sector, there will be continuous monitoring of
banks‘ efforts towards nursing and
rehabilitation of MSME units, collation and
analysis of data on credit flow and sickness in
such units. With a view to developing
‗entrepreneurial sensitivity‘ and improving the
skills of dealing functionaries of banks, the
Reserve Bank proposes to roll out a national
capacity building programme. This is expected
to help the functionaries understand the
genuine credit needs of MSME entrepreneurs
and provide timely response.

YEAR IV VOLUME IV .Jamshedpur Research Review. ISSUE XVII ISSN-2320-2750
JRR September –November 2016 111
Table III: Financial Inclusion Plan-Summary Progress of All Banks Including RRBs
Particulars Year ended Year ended Year ended Progress
March 2010 March 2014 March 2015
April 2014 –
Mar 2015
1 2 3 4 5
Banking Outlets in Villages -
Branches 33,378 46,126 49,571 3,445
Banking Outlets in Villages –
Branchless mode 34,316 337,678 504,142 166,464
Banking Outlets in Villages -
Total 67,694 383,804 553,713 169,909
Urban Locations covered
through BCs 447 60,730 96,847 36,117
Basic Savings Bank Deposit
A/c through branches (No. in
million) 60.2 126.0 210.3 84.3
Basic Savings Bank Deposit
A/c through branches (Amt.
in ` billion) 44.3 273.3 365.0 91.7
Basic Savings Bank Deposit
A/c through BCs (No. in
million) 13.3 116.9 187.8 70.9
Basic Savings Bank Deposit
A/c through BCs (Amt. in `
billion) 10.7 39.0 74.6 35.6
BSBDAs Total (No. in
million) 73.5 243.0 398.1 155.1
BSBDAs Total (Amt. in `
billion) 55 312.3 439.5 127.3
OD facility availed in
BSBDAs (No. in million) 0.2 5.9 7.6 1.7
OD facility availed in
BSBDAs (Amt. in ` billion) 0.1 16.0 19.9 3.9
KCCs (No. in million) 24.3 39.9 42.5 2.6
KCCs (Amt. in ` billion) 1,240.1 3,684.5 4,382.3 697.8
GCC (No. in million) 1.4 7.4 9.2 1.8
GCC (Amt. in ` billion) 35.1 1,096.9 1,301.6 204.7
ICT A/Cs BC Transaction
(No. in million)* 26.5 328.6 477.0 477.0
ICT A/Cs BC Transactions
(Amt. in ` billion)* 6.9 524.4 859.8 859.8
*: During the financial year. Source: RBI Report on FI
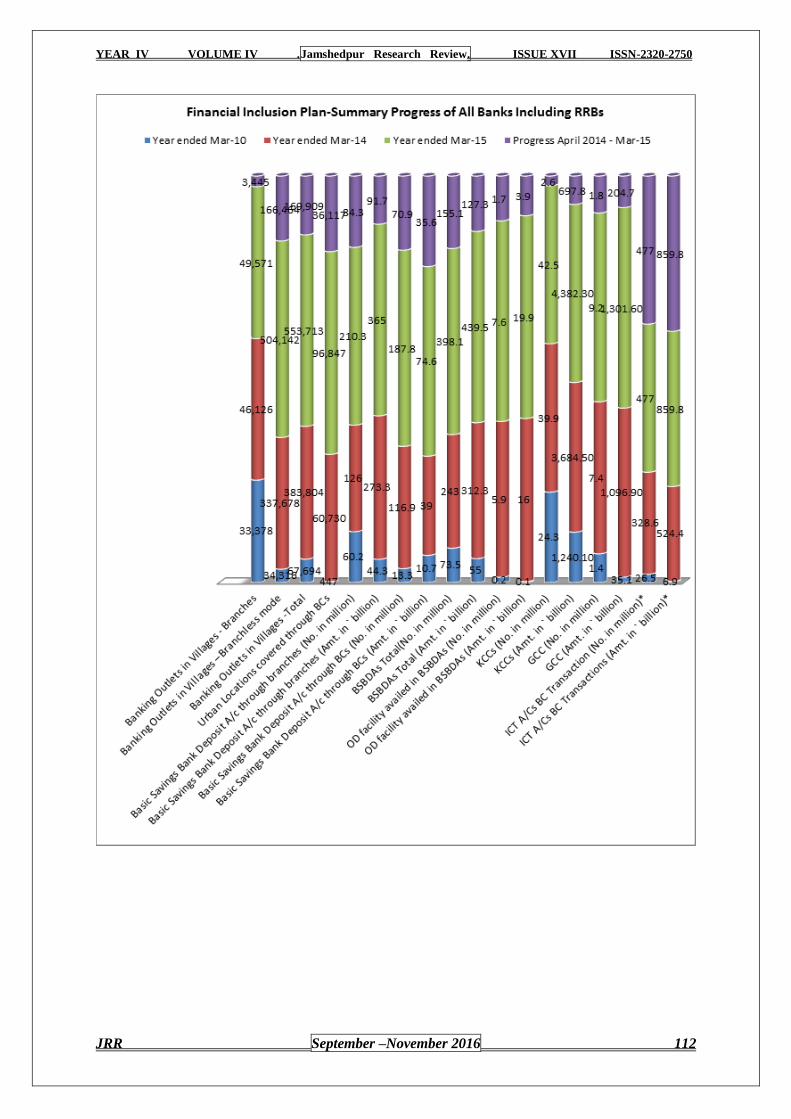
YEAR IV VOLUME IV .Jamshedpur Research Review. ISSUE XVII ISSN-2320-2750
JRR September –November 2016 112
YEAR IV VOLUME IV .Jamshedpur Research Review. ISSUE XVII ISSN-2320-2750
JRR September –November 2016 113
Data Analysis & Discussion
Above table shows the Financial Inclusion
Plan-Summary Progress of All Banks
Including RRBs from March, 2010 to March,
2015. It is observed that during this five years
FIP working very actively and specially in
during last two years FIP reaching outskirt
area of India to provide basic banking services
to people of vulnerable group belongs from
urban and rural area. From the above table it is
found that…
I. The no. of total banking outlets in
villages is increased from 67694 (March,
2010) to 553712 (March, 2015). So, it is
found that no. of outlets in villages
increased by 820% (approximate) during
last five years.
II. The no. of business correspondents
(BCs) covered urban locations from 447
(March, 2010) to 96847 (March, 2015).
It is found that it is increased by 21666%
during this period and during last two
years 2013-14 and 2014-15 it is
increased by 160%.
III. Total no. of Basic Saving Bank Deposit
A/c‘s through bank branched increased
by 349.33% (in million).
IV. Total amount collection through Basic
Saving Bank Deposit A/c‘s through
branches is increased by 824% (Rupees
in Billion).
V. Total no. of Basic Saving Bank Deposit
A/c‘s through BCs increased by 1412%
(in million).
VI. Total amount collection through Basic
Saving Bank Deposit A/c‘s through BCs
is increased by 697% (Rupees in
Billion).
VII. Total no. of Basic Saving Bank Deposit
A/c‘s through bank branches and
business correspondents increased by
541.63% (in million).
VIII. Total amount collection through Basic
Saving Bank Deposit A/c‘s through
bank branches and business
correspondents is increased by 799.09%
(Rupees in Billion).
IX. The Overdraft facility available on 02
million up to March, 2010 and up to
March, 2015 1.7 million BSBDA‘s. So,
it is increased by 11.76%.
X. The amount delivered through overdraft
facility availed Rs. 0.1 (Billion) up to
March, 2010 and up to March, 2015 Rs.
3.9 (Billion). So, amount delivered
through OD‘s increase by 3900% during
this five year period.
XI. 24.3 million Kisan Credit Cards issued
through this BSBDA‘s up to
March,2010 and 42.5 million KCC‘s up
to March, 2015. So, it is cleared that, the
total no. of KCC‘s is increased by
174.89 during this period.
XII. The total amount distributed through
Kisan Credit Cards‘-KCC‘s Rs. 1240.10
billion up to March, 2010 and Rs.
4382.30 billion up to March, 2015. So, it
is found that the amount distributed
through KCC‘s is increased by 353.38%.
XIII. 1.4 million General Credit Cards issued
through this BSBDA‘s up to
March,2010 and 9.2 million GCC‘s up
to March, 2015. So, it is cleared that, the
total no. of GCC‘s is increased by
657.14% during this period.
XIV. The total amount distributed through
General Credit Cards‘-GCC‘s Rs. 35.10
billion up to March, 2010 and Rs.
1301.60 billion up to March, 2015. So, it
is found that the amount distributed
through GCC‘s is increased by
3708.26%.
XV. The ICT A/Cs BC Transaction has 26.5
million up to March, 2010 and 477.0
million up to March, 2015, so it is
cleared that, this transaction increased
by 1800% during this five year period.
XVI. The total amount collected Rs. 6.9
billion up to March, 2010 and Rs.
859.80 billion up to March, 2015. So, it
is found that the total amount collected
increased by 12460.87% during this
period.
From the above analysis and discussion, it is
cleared that the financial inclusion plan
actively working in India, with the help of this
plan the financial services include basic saving
bank deposit, small credit, overdraft facility,
Kisan credit card, General Credit Card, ICT
A/c‘s, etc. provided to people from low
income group by Indian banks, under the
guidance of Reserve Bank of India. It is also
seems that this activity under FIP dynamically
growing during this five year period, but in
case of last two year it tremendously increased
and positive result of FIP seen in financial year
2013-2014 and 2014-2015.
YEAR IV VOLUME IV .Jamshedpur Research Review. ISSUE XVII ISSN-2320-2750
JRR September –November 2016 114
Conclusion
The Reserve Bank has been
encouraging banks to adopt a structured and
planned approach to financial inclusion with
commitment at the highest levels by preparing
board-approved FIPs. Out of 3,445 rural bank
branches opened during 2014-15, 2,230
branches were opened in unbanked rural
centers. Around 155 million Basic Savings
Bank Deposit Accounts (BSBDAs) were
added taking the total BSBDAs to 398 million.
This includes 147 million accounts opened
under PMJDY. With the addition of 2.6
million small farm sector credits (Kisan Credit
Cards-KCCs) and 1.8 million small non-farms
sector credits (General Credit Cards-GCCs),
the total number of such accounts went up to
nearly 42.5 million and 9.2 million
respectively.
The Reserve Bank continued with its
efforts to ensure extension of banking facilities
to all unbanked villages. For this, about
490,000 unbanked villages with population
less than 2,000 were identified and allotted to
banks for coverage under the ongoing Phase-II
of the roadmap. At end-March 2015, as
reported by State Level Bankers Committees
(SLBCs), 390,387 villages were covered by
14,207 branches, 357,856 business
correspondents (BCs) and 18,324 other modes,
such as automated teller machines (ATMs) and
mobile vans. In view of the ongoing
implementation of PMJDY, banks were
advised to complete Phase-II coverage by
August 14, 2015 instead of March 31, 2016 as
prescribed earlier.
References:
1. K. C. Shekhar & Lakshmy Shekhar.
Banking Theory & Practices, Vikas
Publication, New Delhi.
2. Shyam Salunkhe & V. B. Mante,
.Modern Banking & Financial System,
Prashant Publication, Jalgaon
3. I M Paned, Financial Management, 9th
Edition, Vikas Publication, New Delhi
4. Beck, T., A. Demirgüç-Kunt, and M. S.
Martinez Peria.,Banking Services for
Everyone? Barriers to Bank Access and
Use around the World, World Bank
Economic Review 22(3), 2008, 397-430.
5. Chakrabarty, K.C.(2011), ―Financial
Inclusion – A road India needs to travel‖,
Article published in
www.livemint.com on Sep 21, 2011
6. Chakrabarty, K.C.(2011), ―Financial
Inclusion‖, Presentation at St. Xavier‘s
College,
Mumbai on September 7, 2011
7. Rene T. Domingo, Innovative Banking
Customer Service
8. The Current & Future Mobile Trends in
India, Report prepared by Vital Analytics,
Banglore.
9. Tiwari, Rajnish and Buse, Stephan(2007):
The Mobile Commerce Prospects: A
Strategic Analysis of Opportunities in the
Banking Sector, Hamburg University
Press.
10. Tiwari, Rajnish; Buse, Stephan and
Herstatt, Cornelius (2007): Mobile
Services in Banking Sector: The Role of
Innovative Business Solutions in
Generating Competitive Advantage, in:
Proceedings of the International Research
Conference on Quality, Innovation and
Knowledge Management, New Delhi,
YEAR IV VOLUME IV .Jamshedpur Research Review. ISSUE XVII ISSN-2320-2750
JRR September –November 2016 115
KNOWLEDGE PROCESS OUTSOURCING IN INDIA
Dr. Ashutosh Priya Director, Utkarsh Business School, Bareilly
Mrs. Rachna Bamba Research Scholar, Uttarakhand Technical University, Dehradun, Uttarakhand
Abstract
The evolution and maturity of the Indian BPO sector has given birth to yet another wave in the global
outsourcing scene: Knowledge process outsourcing. The success in outsourcing business process
operations to India has encouraged many firms to start outsourcing their high-end knowledge work as
well. Cost savings, operational efficiencies, access to a highly talented workforce and improved
quality are all underlying expectations in off shoring high-end processes to India. The countries,
which have established the greatest number of knowledge process outsourcing firms, are India,
Philippines and China. These countries possess extensive knowledge banks and enough professionals
in different fields for fulfilling the knowledge process needs of businesses in the USA. The work of
knowledge process outsourcing firms requires profound analytical and highly specialized skills. KPO
is a form of outsourcing in which knowledge-related and information-related work is carried out by
workers in a different company or by a subsidiary of the same organization, which may be in the same
country or in an offshore location to save cost. Unlike the outsourcing of manufacturing, this typically
involves high-value work carried out by highly skilled staff. KPO firms, in addition to providing
expertise in the processes themselves, often make many low level business decisions - typically those
that are easily undone if they conflict with higher-level business plans. This paper covers the various
aspects of KPO and a small attempt to unlocking top line growth by outsourcing the ―the core‖.
Introduction:
Service Sector in India today accounts for
more than half of India's GDP. The fact that
the service sector now accounts for more than
half the GDP marks a watershed in the
evolution of the Indian economy and takes it
closer to the fundamentals of a developed
economy. Services or the "tertiary sector" of
the economy covers a wide gamut of activities
like trading, banking & finance, infotainment,
real estate, transportation, security,
management & technical consultancy among
several others. There was marked acceleration
in services sector growth in the eighties and
nineties, especially in the nineties. While the
share of services in India's GDP increased by
21 per cent points in the 50 years between
1950 and 2000, nearly 40 per cent of that
increase was concentrated in the nineties.
While almost all service sectors participated in
this boom, growth was fastest in
communications, banking, hotels and
restaurants, community services, trade and
business services. One of the reasons for the
sudden growth in the services sector in India in
the nineties was the liberalization in the
regulatory framework that gave rise to
innovation and higher exports from the
services sector. The boom in the services
sector has been relatively "jobless". The rise in
services share in GDP has not accompanied by
proportionate increase in the sector's share of
national employment. Some economists have
also cautioned that service sector growth must
be supported by proportionate growth of the
industrial sector; otherwise the service sector
grown will not be sustainable.
In the current economic scenario it looks that
the boom in the services sector is here to stay
as India is fast emerging as global services
hub.
Objectives -The basic objective of this paper
is to cover the various aspects of KPO and
how a need to survive is and helps in emerging
as a winner in the long run. This study is a
small attempt to unlocking top line growth by
outsourcing the ―the core‖.
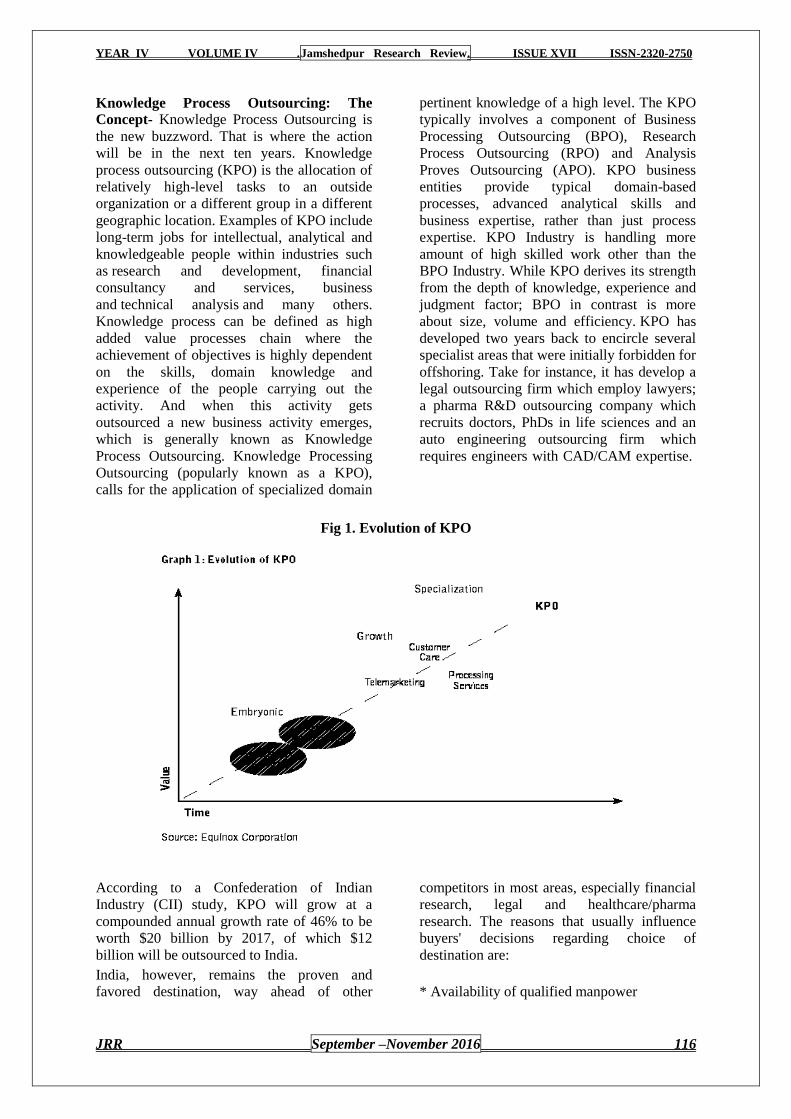
YEAR IV VOLUME IV .Jamshedpur Research Review. ISSUE XVII ISSN-2320-2750
JRR September –November 2016 116
Knowledge Process Outsourcing: The
Concept- Knowledge Process Outsourcing is
the new buzzword. That is where the action
will be in the next ten years. Knowledge
process outsourcing (KPO) is the allocation of
relatively high-level tasks to an outside
organization or a different group in a different
geographic location. Examples of KPO include
long-term jobs for intellectual, analytical and
knowledgeable people within industries such
as research and development, financial
consultancy and services, business
and technical analysis and many others.
Knowledge process can be defined as high
added value processes chain where the
achievement of objectives is highly dependent
on the skills, domain knowledge and
experience of the people carrying out the
activity. And when this activity gets
outsourced a new business activity emerges,
which is generally known as Knowledge
Process Outsourcing. Knowledge Processing
Outsourcing (popularly known as a KPO),
calls for the application of specialized domain
pertinent knowledge of a high level. The KPO
typically involves a component of Business
Processing Outsourcing (BPO), Research
Process Outsourcing (RPO) and Analysis
Proves Outsourcing (APO). KPO business
entities provide typical domain-based
processes, advanced analytical skills and
business expertise, rather than just process
expertise. KPO Industry is handling more
amount of high skilled work other than the
BPO Industry. While KPO derives its strength
from the depth of knowledge, experience and
judgment factor; BPO in contrast is more
about size, volume and efficiency. KPO has
developed two years back to encircle several
specialist areas that were initially forbidden for
offshoring. Take for instance, it has develop a
legal outsourcing firm which employ lawyers;
a pharma R&D outsourcing company which
recruits doctors, PhDs in life sciences and an
auto engineering outsourcing firm which
requires engineers with CAD/CAM expertise.
Fig 1. Evolution of KPO
According to a Confederation of Indian
Industry (CII) study, KPO will grow at a
compounded annual growth rate of 46% to be
worth $20 billion by 2017, of which $12
billion will be outsourced to India.
India, however, remains the proven and
favored destination, way ahead of other
competitors in most areas, especially financial
research, legal and healthcare/pharma
research. The reasons that usually influence
buyers' decisions regarding choice of
destination are:
* Availability of qualified manpower
YEAR IV VOLUME IV .Jamshedpur Research Review. ISSUE XVII ISSN-2320-2750
JRR September –November 2016 117
* Political stability
* Infrastructure
* IPR/Data security issues
* Communication skills
* Lower wages
* Proven delivery capabilities
Industry now needs to take significant
initiatives to cope up with the shortage of
quality supply of professionals and have to
ensure strong training methodologies for their
recruits too. Issues of upgrading data security
and patent infringement are need to be
addressed more proactively, when you are
doing more complex jobs as billing rates also
get higher simultaneously. The onus lies on the
industry to yield weighs even more heavily as
there is positive buildup and expectations from
India in the KPO space. Entrance in KPO is
not a deal, but to survive and emerge as a
winner will set apart the stronger players in the
long run. For every single large KPO player,
there are estimated 10 small players offering
similar services generally at lower billing
rates. High degrees of specialization and
innumerable niches will let even relatively
small firms to persist profitably and create a
large pool of acquisition targets. So, even as
consolidation picks up the pace, the explosion
of new service providers will create further
fragmentation. The practice of off shoring (or
outsourcing, as the trend is more commonly
known) has gained considerable momentum
over the past years, and there is little doubt
that it is here to stay. But even as it benefits
the business interests of companies, many still
believe that outsourcing is detrimental to
western economies, not least because the
creation of jobs in countries where labor is
cheap is perceived to come at the expense of
western workers. Releasing the report
"Knowledge Process Outsourcing (KPO):
Unlocking top-line growth by outsourcing 'the
core,'" during an outsourcing industry event
organized by Nasscom in Mumbai, Edgidio
Zarrella, global partner-in-charge, IT advisory,
KPMG, said that KPO, which is seen as the
third generation of the outsourcing process, is
fast becoming a mainstream outsourcing
option and has "come of age."
India's Intellectual Potential The myth that
Indian companies can only provide "software
coolies" is soon changing to the reality of
Indian companies being capable of almost
anything, even rocket science! India has a
large pool of knowledge workers in various
sectors ranging from Pharmacy, Medicine,
Law, Biotechnology, Education & Training,
Engineering, Analytics, Design & Animation,
Research & Development, Paralegal Content
and even Intelligence services. India is the first
choice amongst the overseas companies that
are looking to offshore their business.
India has largest pool of manpower, which is
capable of efficiently serving the KPO
industry. The country produces more than 3
Million graduates annually. India enjoys the
2nd biggest reservoir of scientists, managers,
and engineers in the world. It's also expected
that India will achieve tremendous growth rate
in the technically advanced segments of KPO
industry. The R&D in pharma/medical along
with data & market research is expected to
make up 50% of the total KPO business in
India.
There are four different types of vendors:
BPO companies venturing into the
KPO services domain
Individual companies providing
specialized services locally and
globally
Highly specialized groups of
individuals offering specialized
services to global markets
Individuals providing their services
inputs
Top KPO companie are
Genpact,
Evalueserve,
Ugam Solutions,
WNS,
24/7 Customer
KPO is a new sector that promises to provide
long-term jobs for intellectual, analytical and
knowledgeable people with a pay scale much
higher than the BPO sector. KPO is about
―Intellectual arbitrage‖. This differentiates
KPO from IT outsourcing (ITO) or Business
Process Outsourcing (BPO), both of which
emphasize cost arbitrage. KPO is characterized
by niche offerings, highly skilled staff and
relatively small scale. It cuts into the
traditional ‗core competencies‘ of many
organizations. The progression of the more
YEAR IV VOLUME IV .Jamshedpur Research Review. ISSUE XVII ISSN-2320-2750
JRR September –November 2016 118
promising KPO industry will be parallel to IT
industry. The four phases which cover the
commonalities in both the industries
The appearance of Western captives.
The mounting of Indian firms.
The growth of Indian firms.
The Indian firms exceed captives.
Nevertheless, the elementary differences
between both the models are still enduring. At
the same time, as the majority of IT firms get
dealing from the bigger projects, KPOs are
catering to the small and medium ventures
(SMEs). Furthermore as SMEs are much more
in figures, the growth potential is also higher
in relation to IT industry. KPO service
providers are expected to amplify their ability
by 55%, whereas the capacity in the captives
may possibly be increase by 45%. Particularly
in the case of SMEs, rather than setting up of
the captives, the share of companies is
commencing to work with the Indian
companies.The positive aspect is that in order
to propose their services in manifold
languages, KPO vendors are now escalating
their functions in Latin America and China.
Above all, along with the outsized firms which
have captives, an additional trend that can
come forward is twofold-sourcing
(outsourcing their work to their captive and
external vendors).As nearly all of the 5,000
global companies is going to have the distinct
policy and are intended for implementing their
off shoring strategies at some point. So, SMEs
will be the KPO industry's key growth driver
consequently. Nonetheless, in favor of
representing about half of the private-sector
employment, there are about five million
SMEs in US, one million in UK and about four
million in continental Europe. In case of
language-sensitive work, due to the inadequate
aptitude in non-English KPO solutions,
European SMEs are going to face the poorer
growth. Yet pretending the extremely small
engagement sizes, the multiplier are so hefty
that KPOs work will be surpassed by SMEs
from 5,000 global companies. KPO players are
now turning to Tier-II cities such as Jaipur,
Chandigarh and Pune and create endless area
for businesses to explore. Also create lakhs of
jobs for engineers, MBAs, doctors, lawyers
and other professionals. Following are some
KPO services that can be outsourced to India:
Research & Development
Business and Technical Analysis
Learning Solutions
Animation & Design
Business & Market Research
Pharmaceuticals and Biotechnology
Medical Services
Writing & Content Development
Legal Services
Intellectual Property (IP) Research
Data Analytics
Network Management
Training & Consultancy
The major benefits of the KPO outsourcing
services are:
Cost reductions.
Standard operational efficiency.
Expert man-power.
Time Saving.
Profit Increments.
Large Manpower without Raising
cost.
The challenges in KPO
The biggest challenge for Indian firms
is the fact that KPO really represents high end
consulting and not just cheap labor
outsourcing. A client in KPO will not look at
dollar figures but will be mainly concerned
with quality of services. That is where Indian
companies may fail. KPO delivers high value
to organizations by providing domain-based
processes and business expertise rather than
just process expertise. These processes
demand advanced analytical and specialized
skill of knowledge workers that have domain
experience to their credit. Therefore
outsourcing of knowledge processes face more
challenges than BPO (Business Process
Outsourcing). Firstly, India's industry
competitiveness is on the decline following the
appreciation of the Indian rupee against the US
dollar. Secondly, there are apparent
shortcomings in the KPO providers' legal and
compliance departments that could place
valuable intellectual property at risk.Thirdly,
KPMG foresees an escalating battle for talent
in the KPO market due to the highly specialist
skills which it offers. And, to overcome high
attrition rates, KPO providers need to quickly
adopt recruitment and retention strategies to
YEAR IV VOLUME IV .Jamshedpur Research Review. ISSUE XVII ISSN-2320-2750
JRR September –November 2016 119
attract and keep staff with the required
qualification and skill sets. Some of the
challenges involved in KPO will be:
Maintaining higher quality standards,
Investment in KPO infrastructure,
Requirement of higher level of control,
Confidentiality and enhanced risk
management.
Meeting demand for highly trained, well-
educated workers
o Top institutes in India produce
low % of graduates
o Some primary education falls
short of standards
Resistance of BPO shops to adopt new
strategies
Attrition due to high demand for skilled
labor
Comparing these challenges with the Indian IT
and ITES service providers, it is not surprising
that India has been ranked the most preferred
KPO outsourcing destination owing to the
country's large talent pool, quality IT training,
friendly government policies and low labor
costs.
India is well equipped to meet this emerging
sector's challenges and all set to be the global
KPO hub.
According to the Ministry of Communication
and Information Technology, apart from
skilled and cost-effective manpower, a man
who knows vernacular of languages can help
the country to emerge as the next biggest KPO
destination globally. A special report of the
Ministry declared that the BPO sector had
been ruling over for the past few years but
Knowledge Process Outsourcing (KPO),
which may be called the highest level of the
BPO, was still at the beginning stage of
development in India.
India would be capable of adding
value to the global KPO businesses and to its
high-end processes through the large pool of
skilled manpower, as in, chartered
accountants, doctors, MBAs, lawyers and
research analysis. The development of KPO
market would guarantee very high-value
services in off-shoring, which would help the
Indian market in ascending to the chain of
global value and knowledge with marginal
revenue as compared to BPO units.
Nevertheless, this report added that India
might lose its cost profit because countries like
Ukraine, Hungary, Belgium, the Czech
Republic and the Philippines has put forward
BPO services at a very lower rates. According
to the IT department, the movement from BPO
to KPO could be comparatively smooth
because the IT-ITES companies are very well
established and moreover because of India's
attractiveness as an investment destination.
Since, there is a brain-drain-of-role-reversal of
the global sourcing model; Indian origin now
provokes people to work in their own country.
In addition to the direct positive impact on
national income and employment generation,
the sector will be expanding various ancillary
industries, will initiate a rise in direct-tax
collections and will urge for an augmentation
in consumer spending.
Scope and Future of KPO
According to a report of National Association
of Software and Services Companies (NASSCOM), the Indian chamber of
commerce that serves as an interface to the
Indian Software industry, Knowledge Process
Outsourcing industry (KPO) is expected to
reach USD 20 billion by 2017, of which USD
12 billion would be outsourced to India.
Another report predicts that India will capture
more than 70 percent of the KPO sector by
2016. Apart from India, countries such as
Russia, China, the Czech Republic, Ireland,
and Israel are also expected to join the KPO
industry.
Conclusion
In India even after independence there was
less progress notable in the area of Intellectual
Property Right protection. India government
awakes only after the TRIPS agreement and in
contrast passed several new acts and
amendments to existing laws to ensure better
protection to the indigenous knowledge and
inventor‘s intellect. A lot of activity was
witnessed thereafter in this area to explore new
possibilities and opportunities for the
industries. The well-organized BPO industries
in India, inspired many foreign based Indian to
start their own business to outsource
knowledge. This knowledge Process

YEAR IV VOLUME IV .Jamshedpur Research Review. ISSUE XVII ISSN-2320-2750
JRR September –November 2016 120
Outsourcing (KPO) has its roots during 1999
and presently there are more than a dozen of
small KPO firms. Cost savings, operational
efficiencies, access to a highly talented
workforce and improved quality are all
underlying expectations in off shoring high-
end processes to India. India has a large pool
of knowledge workers in various sectors of
science and technology. This talent is being
tapped by leading businesses across the globe
resulting in the outsourcing of high-end
processes to low-wage destinations. Hence
KPO involves off shoring of knowledge
intensive business processes that require
specialized domain expertise.
With worldwide outsourcing spending
increasing through 2015 after a lull, Indian
outsourcing industry too is set to grow.
Emerging trends such as the cloud, mobility,
or data analytics are being incorporated into IT
as a service—providing a level playing field
for businesses of all sizes. Indian
government IT spending will total $7.2
billion in 2015, according to Gartner. This will
translate into accelerated broadband
penetration in tier 1 and 2 cities, digitization of
core government processes, and cloud
initiatives etc—providing a conducive
environment for BPOs. Cloud adoption is
being viewed as an imperative strategic
differentiator in terms of performance, cost,
and scalability. Cloud facilitates operational
efficiencies by centralizing information,
accelerates innovation in products, and
improves customer communication and after
sales service. According to Gartner, public
cloud services revenues in India will go up to
$838 million by 2015, a 33% increase over
2014. KPO industry seems set for a steep
growth. NASSCOM predicts that India will
hold 70% of the global KPO industry in 2015.
Business processes such as research and
analytic in market, pharma, legal, and financial
domains, content, and intellectual property are
experiencing a spurt in outsourcing. Skilled
professionals, competitive rates, and high-end
delivery platforms will contribute to an
exponential growth in KPOs. Analytics and
big data will continue to impact business
operations and strategies. A NASSCOM and
CRISIL report pegs Indian industry in Big
Data around $1 billion by 2015. Leveraging
retail and financial data through web and
social networks, industry players will
effectively address customer issues,
personalize services. So we can say that,
Indian industry needs to tone up itself by
moving up in the value chain besides
augmenting human resources and domain
knowledge
Bibliography
1. Bhatt G (2001), ―knowledge
Management in Organizations:
Examining the Interactions between
Technologies, Techniques, and People‖,
Journal of Knowledge Management,
Vol.5, No. 1, pp.68-65
2. Grant R (1996), ―Towards a knowledge-
Based Theory of the firm‖, Strategic
Management Journal, Vol.17, Winter
Special Issue, pp.109-122
3. Hamel G and Prahalad C K (1990), ― The
Core Competence of the Corporation‖,
Harvard Business Review, Vol.68, pp 79-
92
4. Spender J C and Grant R (1996) ,
―Knowledge and the firm: Overview‖,
Strategic Management Journal, Vol.17,
Winter Special Issue, pp.5-9
5. Szulanski G (1996), ―The process of
Knowledge Transfer : A Diachronic
Analysis of Stickiness‖, Organizational
behavior and Human Decision Process,
Vol.82, No.1, pp9-27
6. www.outsource2india.com
7. www.kpoweb.com
8. www.indiadaily.com/editorial/4649.asp
9. www.kpoexperts.com 10. www.intracen.org/servicexport/pdf/Ghaha007
/07Nov07/KPODemand_071107.pdf
YEAR IV VOLUME IV .Jamshedpur Research Review. ISSUE XVII ISSN-2320-2750
JRR September –November 2016 121
AN APPRAISAL OF PARADIGM SHIFT FROM TRANSACTIONAL
MARKETING TO RELATIONSHIP MARKETING: A CASE OF
HOME APPLIANCES MARKET IN WEST BENGAL
Dr. Indrani Majumder Assistant Professor in Economics, Nagar College, Nagar, Post Office- Nagar, District- Murshidabad,
West Bengal
Abstract
The ‗Marketing Continuum‘ was first coined by Gronroos (1994, 1996). This marketing
continuum itself represents a paradigm shift in marketing practices. The left end of this continuum
refers to ‗Transaction Marketing‘ orientation and the right end refers to ‗Relationship Marketing‘
(RM) orientation. Transaction marketing orientation focuses on optimizing the economic gain in an
exchange process between seller and buyer with an emphasis on competition, value to the firm, buyer
passiveness, firms as focus control and short-term independent focus. On the other hand, relationship
marketing focuses more on collaboration, co-operation, value in partnership, buyer as active
participant, firm as part of the process, dependant and network-led long-term focus, people at the
center of the social interaction, database marketing, interaction marketing and network marketing. In
this light the present study will try to give a focus on different aspects of relationship marketing and
will try to investigate the practices in the real marketing field. The study will further try to get the
customers feedback in this particular aspect in some selected region of the state of West Bengal for
home appliance category.
Key Words: Transaction marketing, Relationship Marketing, partnership, interaction marketing.
In ‗transactional marketing‘ the basic objective
of the marketer is to maximize the benefit
received from each transaction with the help of
key ‗marketing mix‘ elements—viz. product,
price, place and promotion. This ‗marketing
mix‘ concept was first introduced by Neil
Borden in 1950s and this was soon labeled as
the 4 Ps. ‗Transactional marketing‘ do not
consider customer satisfaction, or customer
loyalty. On the other hand, the basic objective
of ‗relationship marketing‘ is to turn new
customers into regular purchasing ‗clients‘ and
then convert them from strong supporters of
the company to strong advocates and then an
important referral source for the company. I.e.
the main focus in relationship marketing is on
customer retention and maximizing lifetime
value of desired customer segments. The
relationship marketing approach brings
quality, customer service and marketing
closely together. Relationship Marketing is a
strategy used to learn more about customer‘s
mood and behaviors in order to develop
stronger relationship with them. Origin of the
expression ‗relationship marketing‘ can be
found in the early 1980s. In 1983 Leonard L.
Berry, distinguished professor of Marketing at
Texas A&M University, coined the word
‗Relationship Marketing‘ when he presented a
paper entitled Relationship Marketing at the
American Marketing Association‘s Services
Marketing Conference. The paper was
published in the conference proceedings and
for the first time the phrase Relationship
Marketing appeared in the Marketing
literature. Theodore Levitt, in 1983, without
using the term ‗relationship marketing‘ in
those exact words, stated that the objective of
a business should not be limited to sales in
itself but should also provide the greatest
customer satisfaction, and customer
satisfaction depends on how excellently the
seller could manage the relationship (Levitt,
1983). Two years later, i.e. in 1985, in the
context of a project, related to industrial
marketing, Barbara Jackson uses the same
expression of ‗relationship marketing‘ in her
book ‗Winning and Keeping Industrial
Customers’ as well as in an article published in
Harvard Business Review in 1985. Another
opinion is that Relationship marketing is a
gradual extension of the ―Nordic School‖
approach to services marketing and
management (Gummesson, 1997). In this
present study an attempt has been made to give
a focus on the shift from transactional
YEAR IV VOLUME IV .Jamshedpur Research Review. ISSUE XVII ISSN-2320-2750
JRR September –November 2016 122
marketing to relationship marketing and
furthermore to compare these two ideas of
marketing.
Objective of the Study- The basic objective
of the study is to give a light on the journey of
marketing practices from its transactional
orientation to relationship orientation. It has
tried to give a focus on different aspects of
relationship marketing. The study further tried
to get the customers feedback in this particular
aspect in some selected region of the state of
West Bengal for home appliance category in
India.
Research Methodology- To attain the
objective the study has taken the help of past
literature as well as primary data. To get the
picture of present relationship marketing
practices of different home appliance
manufacturer the help of different company
websites has been taken. The study has tried
to explore the customers‘ insight in the matter
of present marketing practices with its
relationship orientation. For this primary data
has been collected from 200 households of
some selected towns of North 24 pgns district
of the state of West Bengal in India. Due to
time constraints only few items in home
appliance category has been considered: viz.
Air Conditioner (A.C.), Kitchen Chimney,
Vacuum Cleaner, Water Purifier, Inverter and
Water Heater. A questionnaire has been
framed which consists some close ended
questions. The questions has been framed to
know the technical competence of the installer
of the home appliance, suitability of the skill
of sales personnel with their job profile at
show room, satisfaction level with the after
sale service etc.Only those product categories
in home appliances have been taken which are
used by the respondents. And on the basis of
the responses to the questions analysis has
been done to reach to a conclusion about this
movement of marketing practices.
A Journey from Transactional Marketing
to Relationship Marketing- Around the
beginning of 700 B. C. marketing thought was
borne as a distinct discipline from economics
(Carratu, 1987). The discipline gained
momentum through the first three quarters of
20th century and has undergone a change in its
orientation from transactions to relationship
(Kotler, 1990; Webster, 1992). Earlier the
concept of ‗marketing‘ was defined by
American Marketing Association (AMA) as
the process of satisfying individual and
organizational goals through planning and
executing the conception, pricing, promotion,
and distribution of goods, ideas, and services.
2004 onwards AMA portrayed marketing as an
organizational function and a set of processes
for creating, communicating, and delivering
value to customers and for managing customer
relationships in ways that benefit the
organization and all its stakeholders.
Relationship marketing attempts to involve
and integrate customers, suppliers and other
infrastructural partners into a firm's marketing
activities (McKenna 1991; Shani and
Chalasani 1991). The purpose of relationship
marketing is to enhance marketing
productivity through achieving effectiveness
and efficiency such as customer retention,
efficient consumer response (ECR), and the
sharing of resources between marketing
partners (Sheth and Sisodia 1995). In
transactional marketing the marketer believe
that through competition, buyers can be
offered a choice, and this choice of suppliers
motivates marketers to create a higher value
offering for their self-interest.
Studies on the movement of marketing
concept from its transactional orientation to
relational orientation usually divide the time
frame into three phases—pre industrial
marketing era, industrial marketing era and
postindustrial marketing era. ‘Pre-industrial
society’ was basically agriculture based when
the farmers use to sell their produced items
directly in the bazaars. Consumers and
producers use to gather together face-to-face
for trading products which led to strong
relationships between them and enabled the
production of customized products with an
objective of retaining customers, influencing
repeat purchases, nurturing trust and
facilitating future marketing. Direct interaction
between the producers and consumers
necessitated cooperation, reliance, and trust
among marketing actors. Evidence suggests
that these relationships sometimes continued
for generations as producers and consumers
trusted each other (Kingson, Hirshorn and
Cornman 1986). ‘Industrial Era’ was the era
of mass production and mass consumption. In
this phase the marketers began to adopt a more
YEAR IV VOLUME IV .Jamshedpur Research Review. ISSUE XVII ISSN-2320-2750
JRR September –November 2016 123
transactional approach (Cundiff 1988). Mass
production resulted in an increased inventory
of finished products. And this inventory of
unsold finished products gave rise to
aggressive selling and the development of
marketing institutions like wholesalers,
distributors and other marketing intermediaries
that were willing to bear the risks and costs of
inventory ownership and storage on one side
and helped in locating and persuading more
buyers to purchase goods and services on the
other hand through some modern marketing
practices, such as sales, advertising and
promotion, personal and impersonal
demonstration of the selling 'force' to promote
mass consumption. Although the orientation of
the industrial era was largely transactional the
STP (segmentation, targeting, positioning)
concept gradually became important tools for
marketing planning in this era. Brand
marketing grew during this period. Marketers
started to shift their focus from discrete, one
time sales to ongoing, repeat-purchase
possibilities. Administered vertical marketing
systems, such as franchising and exclusive
distribution rights, to extend company‘s
representation beyond their own corporate
limit, was initiated its journey during this
period (McCammon, 1965).
In the ‘post-industrial era’, with the
advent of complex products (basically the
capital equipments) the marketers started to
realize the need to supplement a transaction-
orientation with a customer relationship-
orientation where sale of services are attached
with the purchased item. Gradually this
orientation began to extend to consumer
packaged goods, as well as services (Shapiro
and Posner 1979). The growth of relationship
orientation of marketing in post-industrial era
is the rebirth of direct marketing between
producers and consumers. Five macro-
environmental forces viz. (1) rapid
technological advancements, especially in
information technology; (ii) the adoption of
total quality programs by companies; (iii) the
growth of the service economy; (iv)
organizational development processes leading
to empowerment of individuals and teams; and
(v) increase in competitive intensity leading to
concern for customer retention were behind
this rebirth of direct marketing between
producers and consumers. The ‗just in time‘
inventory system, made possible by the real
time transportation and communication
systems, allowed a producer to eliminate the
need for an intermediate inventory holding
institutions (Sheth, Gardener and Garrett
1988). Another major force influenced the
adoption of relationship marketing was the
total quality movement that recently
revolutionized industry's perspectives
regarding quality and cost.
Present Marketing Practices of the Home
Appliance Manufacturers- In these modern
day world the companies have realized that
adding a new customer into the company‘s
existing customer list is comparatively
expensive than keeping existing customer set.
So, nowadays the companies are putting
sufficient investment for gaining customer
satisfaction and enhancing customer loyalty
with the help of some technology and
methods. Through ‗Relationship Management‘
practices the companies are trying to introduce
the right product to the right customer at the
right time through the right channel to satisfy
the customer‘s growing demands. The failure
to provide distinguished customer oriented
responses basically results in losing loyal
customers which ultimately results in
worsening profitability. Numerous enterprises
are presently investing in customer
management. But not many have a systematic
customer management process and a well-
integrated supporting system.
Basically there are three parts of
Relationship Management strategies: viz.
Operational, Analytical and Collaborative.
Operational Relationship Management
supports the front-end business processes
including customer contact. Analytical CRM
deals with the analysis of data gathered
through operational CRM. Collaborative CRM
involves interactions with customers through
all possible channels of communication: viz.,
personal, letter, fax, phone, web, e-mail etc.
The following section is depicting
some of the practices of some renowned
organizations in home appliance industry:
Eureka Forbes: This Mumbai based company
(incorporated in 1931) is the first direct selling
companies in India. It uses to follow 'tried and
tested' direct selling route for marketing its
products. The company use to deploy
dynamic, friendly, trustworthy and highly
YEAR IV VOLUME IV .Jamshedpur Research Review. ISSUE XVII ISSN-2320-2750
JRR September –November 2016 124
motivated individuals, namely, ‗Eurochamps‘.
To the company, the customers are ―Friend for
Life‖. With the help of Eurochamps the
company maintains close and constant touch
with the customers. The Eurochamps listen to
the need of the customer and educate them to
change their perceptions and practices and
satisfying their health, hygiene and lifestyle.
Company‘s relationship marketing includes
service contracts, spares and accessories sales,
product upgradation and new references. By
2002, the company was the market leader in
the vacuum cleaner segment with 75% market
share and water purifier segment with 85%
market. The company is Asia‘s largest direct
selling organization with a 5,000 strong direct
sales force touching1.25 million Indian homes
and adding 1,500 customers daily. According
to industry estimates, the domestic vacuum
cleaner market is around Rs 250 crore and
Eureka Forbes claims to enjoy a market share
of almost 90 per cent (PTI Report, August 22,
2011). Aquaguard, the water purifier brand of
Eureka Forbes has now become a synonym for
water purifier in India,
Whirlpool: Whirlpool of India Limited (the
result of global expansion strategy of
Whirlpool Corporation: a Fortune 500
company) is now one of the leading
manufacturers and marketers of major home
appliances in our country. Mission of
Whirlpool Corporation is to implant and
maintain the passion of creating loyal
customers for life by providing customized
solutions that fit individual customers‘ unique
needs. The company‘s growth strategy has
been to introduce innovative new products,
strengthen customer loyalty for its brands. The
company believe that Great results can be
achieved through relationships built on trust
only. The company engages the employees
who are closest to the customer by charging
the employees of the company by guiding
principles, continual communication,
employee empowerment, training, and
recognition programs.
The ‗Gold Ring Promise‘ and the
‗Customer Bill of Rights‘ of Whirlpool of
India explain both the company's guiding
principles and employees' responsibilities. The
gold ring of promise around the company logo
itself is reflecting that the common goal of
doing all that is necessary to deliver top
quality products and service is nothing but
continuous improvement of product quality in
every way and encourage others to do the
same. During Whirlpool's acquisition of
Maytag in March 31, 2006 the ‗Customer Bill
of Rights‘ was introduced. It‘s a set of
employee responsibilities listed as customer
expectations. It‘s all about professionalism,
taking ownership, and resolution. As a result
of this the newly integrated contact center
called the Customer eXperience Center (cXc)
has been developed. Whirlpool's customer
service agents, called aka, carry laminated
cards highlighted with the customers' rights
which serve as a constant reminder of the
company's customer service principles. The
Bill of Rights also pops up each morning on
the call consultants' computer screens and a
framed copy resides on their desks. An agent
empowerment tool called an e-card to
encourage agents to deliver on both the Bill
and the Gold Ring Promise has also been
introduced to increase first-call resolution. The
card is awarded to call consultants who show
strong quality scores.
Whirlpool also invests in employee
education to build engagement. The Best
Ticket in Town program creates a partnership
with local universities to give employees the
opportunity to earn a degree in Business
Administration or complete a Customer
Service Certificate Program. The innovation
and the idea exchange program are regular
parts of the culture at Whirlpool. A team of
innovation consultants teaches employees
about innovation, an approach that Whirlpool
attributes to increased earnings and
productivity.
Whirlpool keeps employees inspired
through recognition programs, called, "I'm On
It", for its employees for outstanding
teamwork, sales, or job performance, like
meeting certain goals. Employees use an
automated awards-submission process to
nominate colleagues; employees who are
selected by management to be recognized
receive up to $250 in monetary rewards.
Additionally, the cXc has adopted a Customer
Champion program for exceptional call
handling and performance. This involves the
use of a dedicated phone line for customers to
record compliments regarding agents who
have delivered outstanding service. The
employee with the best compliment receives a
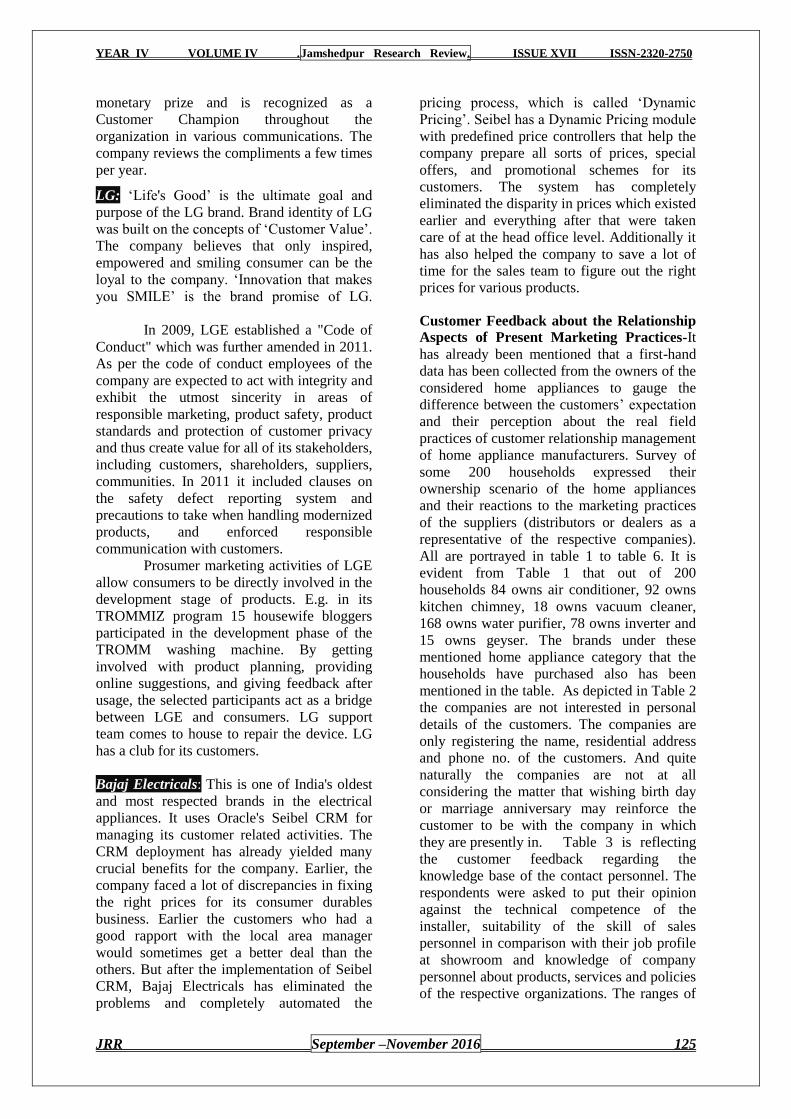
YEAR IV VOLUME IV .Jamshedpur Research Review. ISSUE XVII ISSN-2320-2750
JRR September –November 2016 125
monetary prize and is recognized as a
Customer Champion throughout the
organization in various communications. The
company reviews the compliments a few times
per year.
LG: ‗Life's Good‘ is the ultimate goal and
purpose of the LG brand. Brand identity of LG
was built on the concepts of ‗Customer Value‘.
The company believes that only inspired,
empowered and smiling consumer can be the
loyal to the company. ‗Innovation that makes
you SMILE‘ is the brand promise of LG.
In 2009, LGE established a "Code of
Conduct" which was further amended in 2011.
As per the code of conduct employees of the
company are expected to act with integrity and
exhibit the utmost sincerity in areas of
responsible marketing, product safety, product
standards and protection of customer privacy
and thus create value for all of its stakeholders,
including customers, shareholders, suppliers,
communities. In 2011 it included clauses on
the safety defect reporting system and
precautions to take when handling modernized
products, and enforced responsible
communication with customers.
Prosumer marketing activities of LGE
allow consumers to be directly involved in the
development stage of products. E.g. in its
TROMMIZ program 15 housewife bloggers
participated in the development phase of the
TROMM washing machine. By getting
involved with product planning, providing
online suggestions, and giving feedback after
usage, the selected participants act as a bridge
between LGE and consumers. LG support
team comes to house to repair the device. LG
has a club for its customers.
Bajaj Electricals: This is one of India's oldest
and most respected brands in the electrical
appliances. It uses Oracle's Seibel CRM for
managing its customer related activities. The
CRM deployment has already yielded many
crucial benefits for the company. Earlier, the
company faced a lot of discrepancies in fixing
the right prices for its consumer durables
business. Earlier the customers who had a
good rapport with the local area manager
would sometimes get a better deal than the
others. But after the implementation of Seibel
CRM, Bajaj Electricals has eliminated the
problems and completely automated the
pricing process, which is called ‗Dynamic
Pricing‘. Seibel has a Dynamic Pricing module
with predefined price controllers that help the
company prepare all sorts of prices, special
offers, and promotional schemes for its
customers. The system has completely
eliminated the disparity in prices which existed
earlier and everything after that were taken
care of at the head office level. Additionally it
has also helped the company to save a lot of
time for the sales team to figure out the right
prices for various products.
Customer Feedback about the Relationship
Aspects of Present Marketing Practices-It
has already been mentioned that a first-hand
data has been collected from the owners of the
considered home appliances to gauge the
difference between the customers‘ expectation
and their perception about the real field
practices of customer relationship management
of home appliance manufacturers. Survey of
some 200 households expressed their
ownership scenario of the home appliances
and their reactions to the marketing practices
of the suppliers (distributors or dealers as a
representative of the respective companies).
All are portrayed in table 1 to table 6. It is
evident from Table 1 that out of 200
households 84 owns air conditioner, 92 owns
kitchen chimney, 18 owns vacuum cleaner,
168 owns water purifier, 78 owns inverter and
15 owns geyser. The brands under these
mentioned home appliance category that the
households have purchased also has been
mentioned in the table. As depicted in Table 2
the companies are not interested in personal
details of the customers. The companies are
only registering the name, residential address
and phone no. of the customers. And quite
naturally the companies are not at all
considering the matter that wishing birth day
or marriage anniversary may reinforce the
customer to be with the company in which
they are presently in. Table 3 is reflecting
the customer feedback regarding the
knowledge base of the contact personnel. The
respondents were asked to put their opinion
against the technical competence of the
installer, suitability of the skill of sales
personnel in comparison with their job profile
at showroom and knowledge of company
personnel about products, services and policies
of the respective organizations. The ranges of
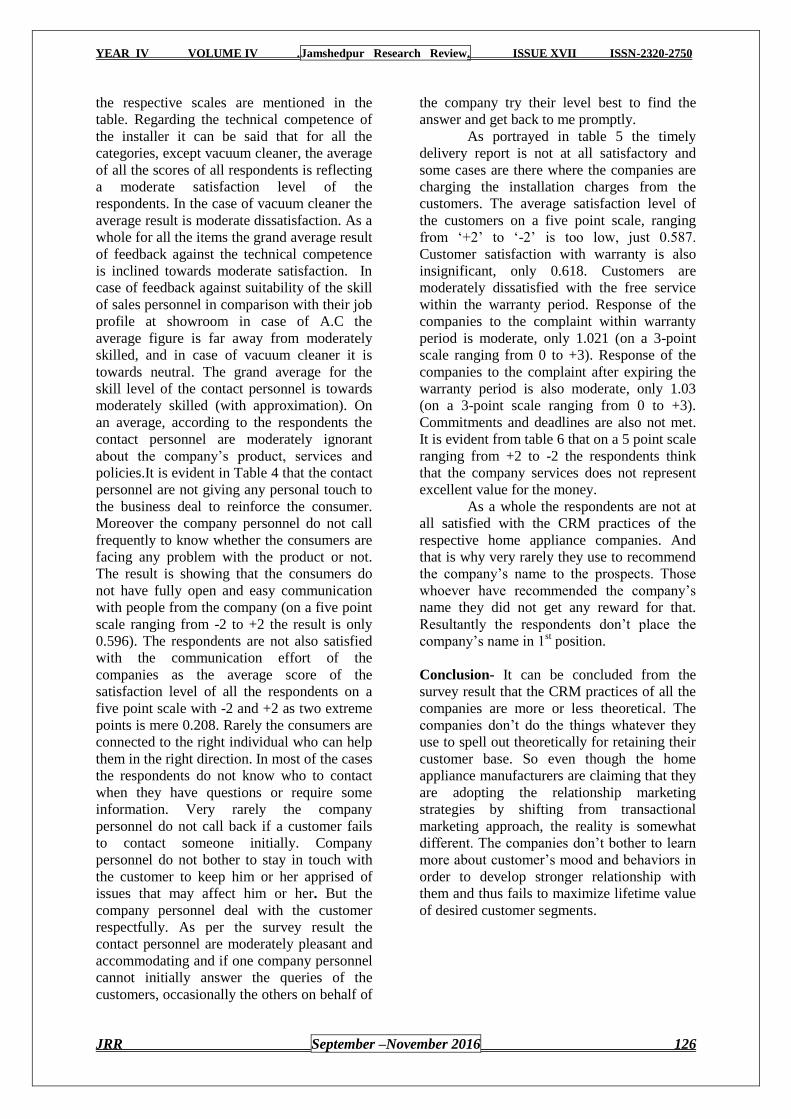
YEAR IV VOLUME IV .Jamshedpur Research Review. ISSUE XVII ISSN-2320-2750
JRR September –November 2016 126
the respective scales are mentioned in the
table. Regarding the technical competence of
the installer it can be said that for all the
categories, except vacuum cleaner, the average
of all the scores of all respondents is reflecting
a moderate satisfaction level of the
respondents. In the case of vacuum cleaner the
average result is moderate dissatisfaction. As a
whole for all the items the grand average result
of feedback against the technical competence
is inclined towards moderate satisfaction. In
case of feedback against suitability of the skill
of sales personnel in comparison with their job
profile at showroom in case of A.C the
average figure is far away from moderately
skilled, and in case of vacuum cleaner it is
towards neutral. The grand average for the
skill level of the contact personnel is towards
moderately skilled (with approximation). On
an average, according to the respondents the
contact personnel are moderately ignorant
about the company‘s product, services and
policies.It is evident in Table 4 that the contact
personnel are not giving any personal touch to
the business deal to reinforce the consumer.
Moreover the company personnel do not call
frequently to know whether the consumers are
facing any problem with the product or not.
The result is showing that the consumers do
not have fully open and easy communication
with people from the company (on a five point
scale ranging from -2 to +2 the result is only
0.596). The respondents are not also satisfied
with the communication effort of the
companies as the average score of the
satisfaction level of all the respondents on a
five point scale with -2 and +2 as two extreme
points is mere 0.208. Rarely the consumers are
connected to the right individual who can help
them in the right direction. In most of the cases
the respondents do not know who to contact
when they have questions or require some
information. Very rarely the company
personnel do not call back if a customer fails
to contact someone initially. Company
personnel do not bother to stay in touch with
the customer to keep him or her apprised of
issues that may affect him or her. But the
company personnel deal with the customer
respectfully. As per the survey result the
contact personnel are moderately pleasant and
accommodating and if one company personnel
cannot initially answer the queries of the
customers, occasionally the others on behalf of
the company try their level best to find the
answer and get back to me promptly. As portrayed in table 5 the timely
delivery report is not at all satisfactory and
some cases are there where the companies are
charging the installation charges from the
customers. The average satisfaction level of
the customers on a five point scale, ranging
from ‗+2‘ to ‗-2‘ is too low, just 0.587.
Customer satisfaction with warranty is also
insignificant, only 0.618. Customers are
moderately dissatisfied with the free service
within the warranty period. Response of the
companies to the complaint within warranty
period is moderate, only 1.021 (on a 3-point
scale ranging from 0 to +3). Response of the
companies to the complaint after expiring the
warranty period is also moderate, only 1.03
(on a 3-point scale ranging from 0 to +3).
Commitments and deadlines are also not met.
It is evident from table 6 that on a 5 point scale
ranging from +2 to -2 the respondents think
that the company services does not represent
excellent value for the money. As a whole the respondents are not at
all satisfied with the CRM practices of the
respective home appliance companies. And
that is why very rarely they use to recommend
the company‘s name to the prospects. Those
whoever have recommended the company‘s
name they did not get any reward for that.
Resultantly the respondents don‘t place the
company‘s name in 1st position.
Conclusion- It can be concluded from the
survey result that the CRM practices of all the
companies are more or less theoretical. The
companies don‘t do the things whatever they
use to spell out theoretically for retaining their
customer base. So even though the home
appliance manufacturers are claiming that they
are adopting the relationship marketing
strategies by shifting from transactional
marketing approach, the reality is somewhat
different. The companies don‘t bother to learn
more about customer‘s mood and behaviors in
order to develop stronger relationship with
them and thus fails to maximize lifetime value
of desired customer segments.
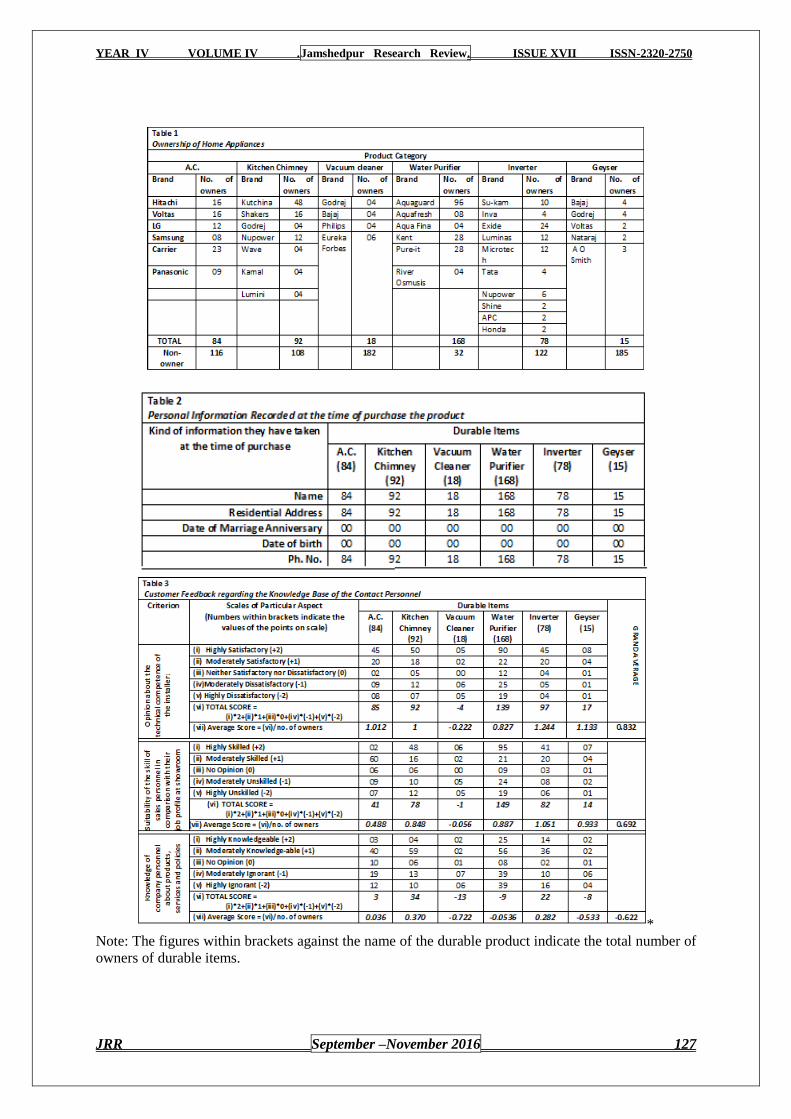
YEAR IV VOLUME IV .Jamshedpur Research Review. ISSUE XVII ISSN-2320-2750
JRR September –November 2016 127
*
Note: The figures within brackets against the name of the durable product indicate the total number of
owners of durable items.
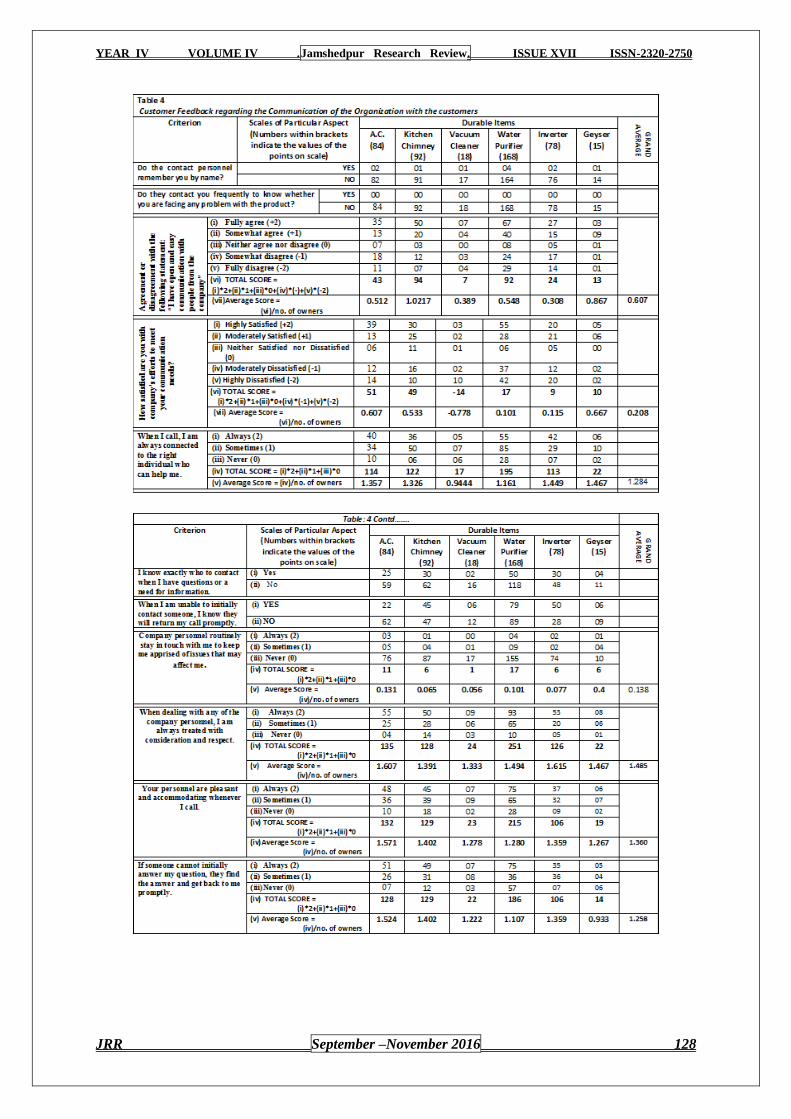
YEAR IV VOLUME IV .Jamshedpur Research Review. ISSUE XVII ISSN-2320-2750
JRR September –November 2016 128

YEAR IV VOLUME IV .Jamshedpur Research Review. ISSUE XVII ISSN-2320-2750
JRR September –November 2016 129
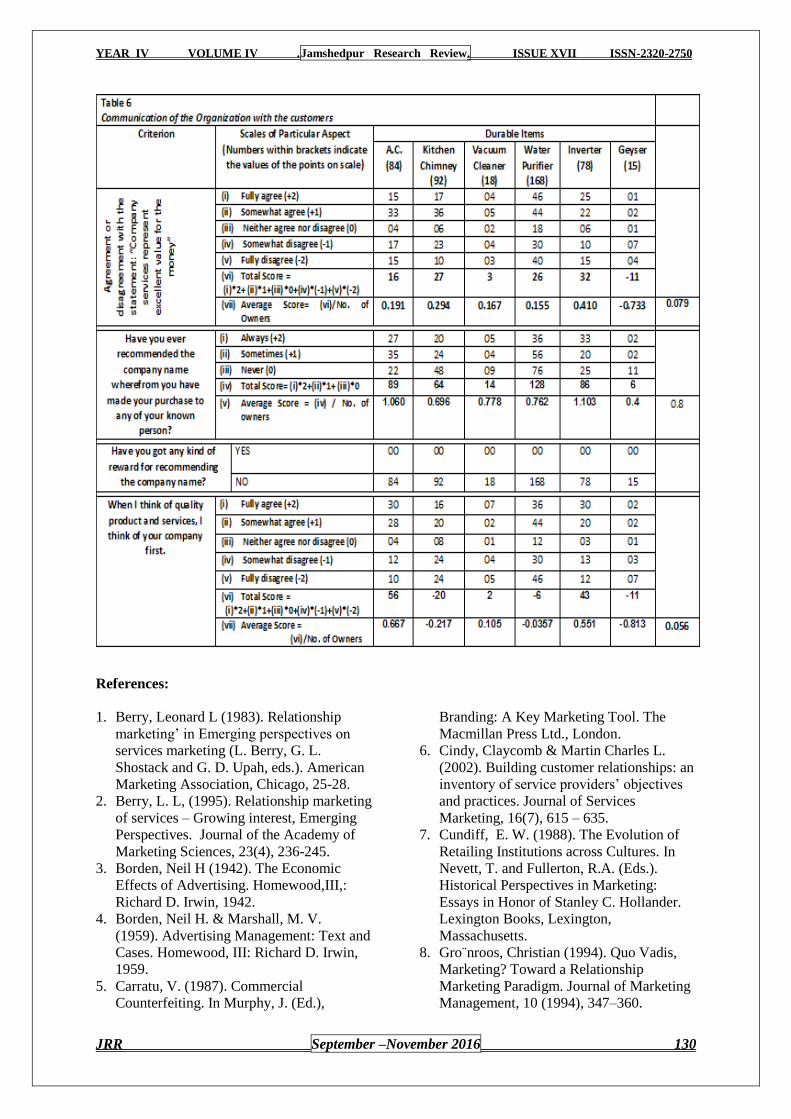
YEAR IV VOLUME IV .Jamshedpur Research Review. ISSUE XVII ISSN-2320-2750
JRR September –November 2016 130
References:
1. Berry, Leonard L (1983). Relationship
marketing‘ in Emerging perspectives on
services marketing (L. Berry, G. L.
Shostack and G. D. Upah, eds.). American
Marketing Association, Chicago, 25-28.
2. Berry, L. L, (1995). Relationship marketing
of services – Growing interest, Emerging
Perspectives. Journal of the Academy of
Marketing Sciences, 23(4), 236-245.
3. Borden, Neil H (1942). The Economic
Effects of Advertising. Homewood,III,:
Richard D. Irwin, 1942.
4. Borden, Neil H. & Marshall, M. V.
(1959). Advertising Management: Text and
Cases. Homewood, III: Richard D. Irwin,
1959.
5. Carratu, V. (1987). Commercial
Counterfeiting. In Murphy, J. (Ed.),
Branding: A Key Marketing Tool. The
Macmillan Press Ltd., London.
6. Cindy, Claycomb & Martin Charles L.
(2002). Building customer relationships: an
inventory of service providers‘ objectives
and practices. Journal of Services
Marketing, 16(7), 615 – 635.
7. Cundiff, E. W. (1988). The Evolution of
Retailing Institutions across Cultures. In
Nevett, T. and Fullerton, R.A. (Eds.).
Historical Perspectives in Marketing:
Essays in Honor of Stanley C. Hollander.
Lexington Books, Lexington,
Massachusetts.
8. Gro¨nroos, Christian (1994). Quo Vadis,
Marketing? Toward a Relationship
Marketing Paradigm. Journal of Marketing
Management, 10 (1994), 347–360.
YEAR IV VOLUME IV .Jamshedpur Research Review. ISSUE XVII ISSN-2320-2750
JRR September –November 2016 131
9. Gro¨nroos, Christian: The Relationship
Marketing Logic. Asia–Australia
Marketing Journal, 4 (1996), 7–18.
10. Grönroos, C. (2000). Relationship
marketing: the Nordic School perspective.
In Sheth, J. N. and Parvatiyar, A (Eds).
Handbook of Relationship Marketing,
Sage, Thousand Oaks, CA, 95-118.
11. Grönroos, C. (2004). The relationship
marketing process: communication,
interaction, dialogue, value. Journal of
Business & Industrial Marketing, 19(2),
99-113.
12. Gummesson, E. (1997). Relationship
marketing as a paradigm shift: some
conclusions from the 30R approach.
Management Decisions 35(4), 267-272.
13. Jackson, B. (1985a). Wining and Keeping
Industrial Customers: the Dynamics of
Customer Relationships, Lexington Books,
Lexington, MA. 54.
14. Jackson, Barbara Bund, (1985a). Build
Customer Relationship that Last. Harvard
Business Review, 63 (November-
December), 120-128.
15. Kingson, E. R., Hirshorn, B. A. &
Cornmarn, J. M. (1986). Ties that Bind:
The Interdependence of Generations. Seven
Locks Press, Cabin John, MD.
16. Levitt, T. (1983). The Globalisation of
Markets. Harvard Business Review.
May/Jun.
17. Levitt, T. (1983). The Marketing
Imagination, The Free Press, New York,
NY
18. Little, R. W. (1970). The Marketing
Channel: Who Should Lead This Extra-
corporate Organization. Journal of
Marketing, 34(January), 31-38.
19. McCammon, B. (1965). The Emergence
and Growth of Contractually Integrated
Channels in the American Economy, in
Bennett, P. D. (Ed.), Economic Growth,
Competition, and World Markets, 496-515,
American Marketing Association, Chicago.
20. Shani, D. & Chalasani, S. (1991).
Exploiting Niches Using Relationship
Marketing. The Journal of Consumer
Marketing, 33-42.
21. Shani, D. & Chalasani, S. (1992).
Exploiting niches using relationship
marketing. Journal of Business Strategy
6(4), 43–52.
YEAR IV VOLUME IV .Jamshedpur Research Review. ISSUE XVII ISSN-2320-2750
JRR September –November 2016 132
VALUE DRIVER MODEL AS MEAN OF MATERIALIZING
SUSTAINABLE DEVELOPMENT: THE CASE OF PHILIPS
ESG STRATEGIES
Dr. Ajai Prakash
Ex- Dean, School of Graduate Studies, Prof. of Strategic Management and International Business
School of Business, KCA University, Nairobi (Kenya), Faculty, Department of Business
Administration, University of Lucknow
Kishore Kumar
Research Scholar (JRF), Deptt. Of Business Administration, University of Lucknow, Lucknow
Abstract The need for efforts to advance the integration of material issues related to Environment, Social and Governance
(ESG) into corporate strategy has been recognised by companies around the world. Looking at the earth‘s finite
natural resources, today organisations need to develop value driven model in order work toward sustainable
solutions to meet human needs. However there are very few companies who have fully integrated sustainability
driven value models into their corporate strategy. Philips is one of the few companies which have reaped
financial benefits of sustainability through integration of sustainability advantaged growth strategy. The present
case profiles how Philips applies ESG strategies in the value driver model to its business operations and how
Philips ESG strategy & performance translated into financial value. Its various sustainability related practices
have also contributed to overall performance. The sustainability value driver model enables to construct its own
metrics to describe the connection between financial objectives like return on capital and the sustainability-
advantaged products(S/G), sustainability-driven productivity initiatives (S/P) and reduced sustainability-related
risk exposure which could materially affect company‘s performance. This case also reflects implications of
sustainability value driver model adopted by Philips to assess and communicate the financial impact of their
sustainable business strategies & operations and deepening investor interest in sustainability as a source of
business value. This case is mainly based on secondary data and has been designed to give learners a clearer
understanding of the issues like, the relevancy of sustainability as new long-term innovation driver and
importance of how firms need to expand their application of sustainability beyond the financial axis to triple-P
(People, Profit, and Planet) approach through Environment, Social, Governance (ESG) strategies.
Objective: This case study focuses largely on sustainability issues, such as developing a framework for
adopting sustainability into business core strategies. Present case is directed towards embedding sustainability as
the value driver into business. At the end of the exercise, learners will have a clearer understanding of the
following issues:
The importance of how firms need to expand their understanding of sustainability beyond the financial axis
to the triple-P (People, Profit, Planet) approach through ESG strategies if they want to retain legitimacy
which in a way is their social license to operate. Topic of relevance includes environmental policy, social
equity through poverty eradication & improving people lives.
The importance of sustainability as new long-term innovation driver. Topic of relevance includes
operational optimization (eco-efficiency), organisational transformation (novel product, services or business
model approach) and system building (societal change through practices).
The importance of reflecting ESG strategies into financial value. Topic of relevance includes impact of
sustainable practices on financial performance, non-financial reporting.
_____________________________________________________________________________________
Introduction This case profiles how Philips
applies ESG strategies in the value driver
model to its business. It is one of the few
companies which
have reaped in the financial impact of
sustainability through integration of
sustainability advantaged growth strategy.
Present case shows how Philips ESG strategy
and performance translated into financial
value. Royal Philips commonly known as
Philips is a Dutch company having business
divisions primarily in the area of consumer
lifestyle, healthcare solutions and lighting. It
was founded in 1891 by Gerard Philips and his
father Fredrick. It is one of the largest
YEAR IV VOLUME IV .Jamshedpur Research Review. ISSUE XVII ISSN-2320-2750
JRR September –November 2016 133
company having total assets of 28.35 billion
Euros and employing more than 105000
people across the across more than 60
countries by the year ending 2014. At 124
years-old, Philips has a strong brand image
and physical presence around the world
through its diversified business with a history
of creating and sustaining business value
through communities, employees, products
and services. For example, Philips launched
EcoVision strategy, in 1998, directed towards
environmental and social dimensions of the
company‘s operations and products, as well as
supply chain sustainability. The strategy
incorporates triple bottom line approach by
taking into account a full analysis of the
company‘s potential influence on
environment, impact on the society,
reputational risks. The company‘s Eco Vision
strategy identified three key innovation areas
which involve:
Improving people‘s lives Improve 3
billion lives by 2025 primarily through
healthcare-related wellbeing and green
products.
Improving energy efficiency of Philips
products by 2015, a 50 per cent
improvement for the average total
product portfolio compared to 2009.
Closing the materials loop by the end of
2015, double global collection of
recycled product and materials, and use
of recycled content in products,
compared to 2009.
Global factors like climate change, global
warming, energy security, increase in aging
population of world, growth in the middle
income class in emerging economies, changing
lifestyle causing health issues like heart
disease, obesity are impinging in one or the
other way Philips core market. Philips
considered sustainability a business
imperative, which can be easily reflected
through its vision mission statement. It has
taken several sustainability initiatives across
its business line. Sustainability is an integral
part of the company's corporate strategy as
Philips believed that sustainability issue could
not be addressed successfully in isolation or as
regulatory compulsion in company's daily
business. In 2009 Philips come up with new
sustainability strategy and decided to make
sustainability an integral part of the company‘s
corporate strategy and value driver for growth.
Philips has established key
performance indicators for sustainability
leadership where it could bring its
competencies to bear – ‗care,‘ ‗energy
efficiency‘ and ‗materials‘. Philips
sustainability strategy for evolving its business
is illustrated by trends in lighting as the
company divests out of older, now-defunct
technologies such as filament bulbs, and shifts
focus to the future of LED. Philips recognises
that lighting accounts for roughly 19 per cent
of the world‘s carbon footprint, with LED
having the potential to create up to 80 per cent
energy savings. This translates into a smaller
footprint and reduced cost of use. Further, the
company is working on defining the social
benefit of energy savings and the risk
management benefits for shareholders.
Our goal is to improve the lives of
three billion people a year by 2025. For a
sustainable world, the transition from a linear
to a circular economy is a necessary boundary
condition. A circular economy requires
innovation in the areas of material; component
and product reuse, as well as related business
models. By using materials more effectively,
economic growth will eventually be decoupled
from the use of natural resources and
ecosystems. In such an economy, the lower
use of raw materials allows us to create more
value."
Circular economy approach:
The transition from a linear economy to a
circular economy plays a crucial role in
creating a sustainable world. A circular
economy aims to decouple economic growth
from the use and reuse of natural resources and
ecosystems by using these resources more
effectively. It is a driver of innovation in the
areas of material, component and product re-
use, as well as new business models such as
system solutions and services. According to
chief sustainability officer, Henk De Bruin,
(Senior-Vice President, Global Head Philips
Sustainability) a circular way of doing things
will unleash new opportunities in future and
this is best way to incorporate sustainability
into business operations. The most obvious
benefits are on the cost side. Philips saved
YEAR IV VOLUME IV .Jamshedpur Research Review. ISSUE XVII ISSN-2320-2750
JRR September –November 2016 134
€471m in the year 2014, just by simplifying
business process and operating model across
all business line. According to him "Business
innovation really is the solution for the planet
in 2050 where nine billion people in this planet
will be looking for a high quality of life".
In a circular economy, more effective use and
reuse of materials helps in generating of more
value, through cost savings and by developing
potential markets or delivering in existing
ones. To unleash new opportunities,
management focus at Philips, is turning to
circular principles like re-manufacturing,
refurbishment and reuse. Various circular
economy projects have been started in almost
every business line in Philips. It has also
developed the circular economy scorecard to
measure and monitor the progress of these
projects. These projects are either linked to
―customer access over ownership‖ (pay for
performance), business innovations model
(from transactions to relationships via service
and solution models) or reverse cycles
(remanufacturing, refurbishment and parts
harvesting). For instance, it is offering pay-for-
use MRI service rather than just simply selling
the equipment up front to hospitals. Similarly
Philips is also experimenting with lighting,
where customers buy illumination and energy
services from company rather than a whole
expensive lighting system.
Eco Vision
In the late 1970s, the Philips board requested
an environmental opportunities analysis of the
company‘s operations, aiming at consuming a
minimum of resources and reducing facility
emissions. By launching the EcoVision
programme in 1998, the company started to
examine its products. As a percentage of the
group total, green product sales rose to 45 per
cent in 2012 up from 39 per cent in 2011. The
company has achieved more than 52 per cent
of total green sale by the year end 2014.
Philips determines products qualify for the
―green product‖ category if they outperform
predecessor or competitor products by 10 per
cent or more in at least one of the company‘s
green focal areas, such as energy efficiency,
hazardous substances, waste and recyclability.
In addition to product sales, the EcoVision
programme has also evolved to encompass
goals involving, among other things,
improving lives through healthcare, supply
chain sustainability, investments in innovation,
and efficiency, including in the company‘s
own operations. Going forward, the company
continues to explore ways to reduce hazardous
substances in its processes, as well as closed
loop recycling/reuse systems. Phillips has
stated it is particularly intrigued by how its
products potentially fit into a circular economy
concept. Philips took a further step in 2012
and undertook a full sustainability audit,
moving from limited to reasonable assurance.
The company deploys a number of
sustainability boards internally that involve the
heads of legal, healthcare management,
strategy and markets along with other
executive team members. Phillips also engages
with key investors and external stakeholders,
such as Greenpeace, on an active basis to
receive useful feedback that helps shape the
company‘s thinking.
Sustainable Development Strategies and
Action Plans:
Today business world is challenged by
complex environmental, social and economic
issues causing threat to survival of the
business and has resulted in increased
stakeholder expectations. Philips has designed
and implemented a comprehensive company-
wide action plan and strategy for prompt
action to adapting to a range of possible future
scenarios. Action plans address key aspects of
issues, assign clear accountability, and drive
goal setting and engagement. Action plan for
sustainable strategy is formulated in following
steps at Philips:
Understanding Issues
Managing projects and operations
Evaluate potential risks and
opportunities
Engage externally
Build capacity
YEAR IV VOLUME IV .Jamshedpur Research Review. ISSUE XVII ISSN-2320-2750
JRR September –November 2016 135
Table 1. Action plan for sustainability related issues
Climate Change issue
Water Management
Preserving Biodiversity
Stakeholder
Issues
Action Plan Action Plan Action Plan Action Plan
Understanding
Footprint
Understanding
Footprint
Understanding Footprint Understanding
Footprint
Managing Operations
and Projects
Managing Operations
and Projects
Managing Operations and
Projects
Managing
Operations and
Projects
Managing Risks and
Opportunities
Managing Risks and
Opportunities
Managing Risks and
Opportunities
Managing Risks
and Opportunities
Engaging Externally Engaging Externally Engaging Externally Engaging
Externally
Source: http://www.annualreport2014.philips.com
Action plans addresses core issues like climate
change, water management, recycling
material. It establish clear accountability, drive
goal setting and engagement throughout
business process. Its business units also create
action plans to identify specific goals and
define targets to address issue of the business,
stakeholders and assets in that region. It
provides detailed time bound actions with
clear cut accountability.
It also focuses on providing insight to
incorporate sustainability issues in business
functions. As issues develop requiring new
strategy, the company review and develops
revised strategies and specific action plans to
address them.
Green Innovation
Green Innovation is the Research &
Development investment related to the
development of new generations of Green
Products and Green Technologies. Philips
Group invested 21 million Euros in Green
Innovations in 2014, spreading over various
projects focused on global challenges related
to water management, air pollution, waste
management, energy security, food and access
to affordable healthcare. Sustainable
Innovations Assessment tool is used in group
innovation programme, in which all innovation
projects of a company are categorized and
rated along the environmental and social
impact of the project in order to identify to
what extent projects drive sustainable
innovation. In 2010 Philips announced a plan
to invest a cumulative 2 billion Euros in Green
Innovation during the coming 5 years. In 2014,
Philips achieved this target a year ahead of
schedule. Lighting continued to be the largest
contributor, mainly as a result of investments
in LED. The impact of Lumileds and
Automotive on Green Innovation is significant
at Euros 105 million in 2014 and Euros 104
million in 2013.
Philips Green Patent portfolio
At the end of 2014, Philips‘ IP portfolio
comprised 8% green patent families, which
means that all these patent families were
labelled with at least one Green Focal
Area.. Energy efficiency is the most frequently
occurring Green Focal Area throughout the
portfolio. Multiplying the portfolio percentage
with annual patent portfolio cost in 2014
determines the amount invested in Green IP,
which constitutes part of Philips investment in
Green Innovation. In 2014, 10% of total patent
filings were flagged as green patent family
Green Product sales
Green innovation has resulted increase in the
green product portfolio. Green Products offer
a significant environmental improvement in
one or more Green Focal Areas such as Energy
efficiency, Packaging, Hazardous substances,
Weight, Recycling and disposal and Lifetime
reliability. Philips has been able to consistent
increase it green product sale. Green Products
sales, excluding the Lumileds and Automotive
business, increased to EUR 11.1 billion in
2014, or 52% of sales (50% in 2013), thereby
reaching a record level and setting new
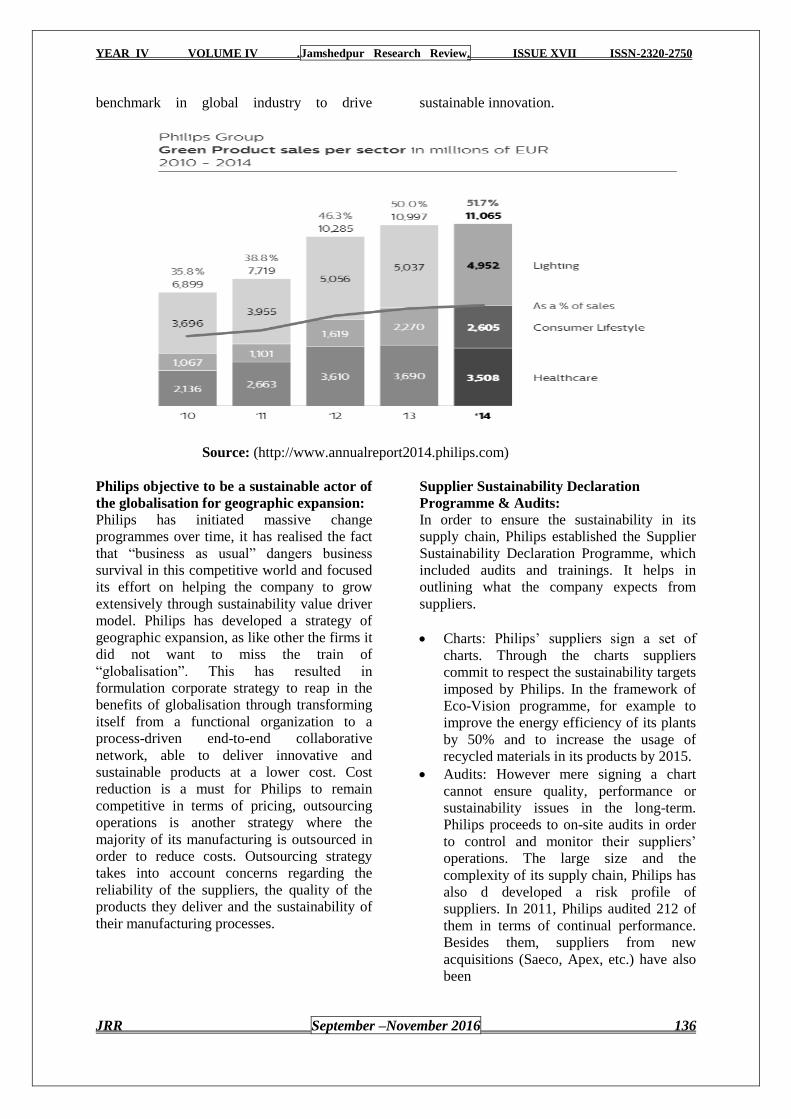
YEAR IV VOLUME IV .Jamshedpur Research Review. ISSUE XVII ISSN-2320-2750
JRR September –November 2016 136
benchmark in global industry to drive sustainable innovation.
Source: (http://www.annualreport2014.philips.com)
Philips objective to be a sustainable actor of
the globalisation for geographic expansion:
Philips has initiated massive change
programmes over time, it has realised the fact
that ―business as usual‖ dangers business
survival in this competitive world and focused
its effort on helping the company to grow
extensively through sustainability value driver
model. Philips has developed a strategy of
geographic expansion, as like other the firms it
did not want to miss the train of
―globalisation‖. This has resulted in
formulation corporate strategy to reap in the
benefits of globalisation through transforming
itself from a functional organization to a
process-driven end-to-end collaborative
network, able to deliver innovative and
sustainable products at a lower cost. Cost
reduction is a must for Philips to remain
competitive in terms of pricing, outsourcing
operations is another strategy where the
majority of its manufacturing is outsourced in
order to reduce costs. Outsourcing strategy
takes into account concerns regarding the
reliability of the suppliers, the quality of the
products they deliver and the sustainability of
their manufacturing processes.
Supplier Sustainability Declaration
Programme & Audits:
In order to ensure the sustainability in its
supply chain, Philips established the Supplier
Sustainability Declaration Programme, which
included audits and trainings. It helps in
outlining what the company expects from
suppliers.
Charts: Philips‘ suppliers sign a set of
charts. Through the charts suppliers
commit to respect the sustainability targets
imposed by Philips. In the framework of
Eco-Vision programme, for example to
improve the energy efficiency of its plants
by 50% and to increase the usage of
recycled materials in its products by 2015.
Audits: However mere signing a chart
cannot ensure quality, performance or
sustainability issues in the long-term.
Philips proceeds to on-site audits in order
to control and monitor their suppliers‘
operations. The large size and the
complexity of its supply chain, Philips has
also d developed a risk profile of
suppliers. In 2011, Philips audited 212 of
them in terms of continual performance.
Besides them, suppliers from new
acquisitions (Saeco, Apex, etc.) have also
been
YEAR IV VOLUME IV .Jamshedpur Research Review. ISSUE XVII ISSN-2320-2750
JRR September –November 2016 137
Results
During the 20th century, Philips has developed a
very strong brand image and a broad physical
presence across the world through its product
offerings. The Philips brand has always been a
reference in the global industry, due to quality of
its products and more importantly for their
innovativeness. The aspect that differentiates
Philips from other companies is the fact that it
was one of the first companies to incorporate the
concept of ―sustainability‖ into its corporate
culture, strategy and business process through
sustainable value driver model. Initially
Sustainability started with caring about the
social, human rights of the employees and
minimising the pollution generated by its
factories. Over time, it also started to diversify
its activities through various sustainable
practices. Philips integrated the entire three
sustainability related factors into the Value
Driver Model: sustainability-advantaged growth,
sustainability driven productivity and risk.
Phillips sustainability-advantaged growth (S/G)
was more than 9x faster than the overall growth
of the company. The company also reported 45
per cent of overall revenue from sustainability-
advantaged products, which are differentiated
from the existing marketplace in 2013. By
evolving its product line, the company has been
able to increase this to more than 50 per cent by
2014 year and is working toward 100 per cent
over the longer term. The company is also
focusing on sustainability-driven productivity
and risk mitigation that seeks to maximise
relevant savings for each of its businesses.
Philips has continuously placed focus on
employee quality and the company has built
schools, hospitals for employee families.
Presently, its business strategy concentrates on
employee engagement and retention, including
engaging with employees on the company‘s
sustainability management. Philips has been
successful in implementation of the company‘s
goals, resulting in not only an improved bottom
line, but also a lower global environmental
footprint which is equally more important. The
company has also found that some of its younger
employees and research and development (R&D)
experts have chosen to work at the company due
to its sustainability track record. The company's
R&D budget in 2013 stretched to €1.8bn,
equivalent to 7.3% of sales revenue which is
largest among the global firm and out of that,
€569m was directed towards green innovation. In
addition, all new and existing projects are all
continuously assessed to determine their social
and environmental contribution. The results of
such projects are clearly reflected through its
product portfolio. In its healthcare business, for
instance, the company has developed a
technology that enables doctors to conduct
internal examinations without the need for
surgery. The interventional x-ray system also
produces 70% less radiation than industry norm.
Conclusion
Philips serves as an example of a generations-old
company that is undertaking company- wide
lengthy transition focused on sustainability-
advantaged products & services to gain
competitive edge. The company has adopted
sustainable strategies that are aimed at
understanding the impact of its operations on 3-P
(People, Planet and Profit) and prioritised
innovation initiatives for the benefit of both
shareholders and all stakeholders. It serves as an
example to other companies as well. They may
take a lead from Philips by applying systems-
thinking approach and sustainability value diver
model that Philips has used over the period of
time regarding, positive employee relations
through training and education, environment
protection by reducing carbon footprints and
improving the lives of millions of people for the
value creation both in short and long term.
Sustainability oriented companies like Philips
that identify and cater to the needs and desires of
future consumers, their employees and of the
society are well-positioned to be suppliers of
choice to the ever increasing number of buyers
interested in dealing and purchasing good from
sustainable companies.
Reference: 1. http://www.annualreport2014.philips.co
m/content/en/group_performance/enviro
nmental_performance/green_product_sa
les.html
2. http://www.annualreport2014.philips.co
m/content/en/group_performance/financ
ial_performance.html
3. http://www.philips.com/about/sustainabi
lity/integratedannualreport/index.page>.
4. http://www.philips.com/about/sustainabi
lity/ecovision/index.page
YEAR IV VOLUME IV .Jamshedpur Research Review. ISSUE XVII ISSN-2320-2750
JRR September –November 2026 138
ROLE OF EDUCATION OF TEACHERS IN 21ST
CENTURY
Dr. Rakesh Prasad
Assistant Professor, Dept of education, K.O College, Gumla, Jharkhand
The efficiency of an educational system
depends largely on the efficiency of its
teachers. School building, books and teaching
methods are no doubt important. But no other
aspect of education is so vital and significant
as the men and women who actually teach in
our schools.
Premises and equipment are needed in
education enterprise but person are vital to
them and a teacher is the supreme factor. It is
no exaggeration to state that a specious
building costly equipment and sound, syllabus
will serve some useful purpose only when
there are teachers who are fully alive to the
nobility of the profession and its
accompanying responsibilities, attitudes,
habit's, manners and above all the character
and personality of the students.
In ancient days a teacher enjoyed a
very high respectful position and honour. He
was kept on . the pedestal as a 'Guru' even the
kings used to set at their but, due to the
nobility of their profession as well as the
sacrifice, service and the dedication towards
their duty. The respect is reflected, if we
analyse some of these definitions, written in
the hours of teachers.
'The teacher's is a maker of man and
history."
"Teachers who educate children, deserve more
honour than parents" (Alexander 356-323 B.C.
The Great conqueror)
The 21st Century is Witnessing an
explosion of knowledge in science and
technology, specially the information
technology. These changes make a heavy
demand on the knowledge and role, the child
is going to play in the near future. The child of
today is the adult of tomorrow. As he grows
older he will be called upon to face and solve
more and more complex problems. In a
progressive world the child should develop
what Dewey Calls" "active and passive
adaptability" changes in society's life demand
corresponding changes in education and role
of teachers in 21st Century. In order to equip
the child to face the challenges of 21st century.
The teacher needs to perform the following
roles:-
A teacher should be a manager of
teaching rather than transmitter of content. A
teacher should possess the capability to select,
use and organise the learning resources with a
view to facilitate learning. He should be a
facilitator of knowledge. He should not
improve knowledge or learning on students,
but rather allow students to acquire knowledge
democratically through multi-sense and multi
directions. These teacher should also possess
effective communication skills to transact
curriculum effectively 21st century teacher
should not only be aware of the latest
innovations, researchers and experiment in the
fields but should be an active researchers and'
experiment in the fields but should be an
active researcher and experiment in the fields
but should be an active researcher and involve
in experimentation. He must change from
teachers - centered to learner centered
methodologies and this would be a challenge
and pre-requisite to 21st century teachers. In
managing the students, the teacher should be
more democratic, he should develop a sense of
trust and sharing of responsibilities. While
ensuring that collective responsibility does not
detract from personal responsibility.
A school can play a very important
role in the moral development of children. The
most important agent in the school is
obviously the teacher. It has been stressed
again and again that nothing can be more
effective and helpful in moulding the child's
moral behaviour than the teacher's own moral
behaviour.
Through the organization of various
curricular and co-curricular activities, teacher
cum foster among children various moral
qualities. In the teaching of different subjects
like languages, social studies etc. Teachers can
stress moral qualities. The teacher should
establish and maintain clear standards of
behaviours and enclosures his pupils to behave
towards himself, towards one another, and
towards the whole community in an orderly

YEAR IV VOLUME IV .Jamshedpur Research Review. ISSUE XVII ISSN-2320-2750
JRR September –November 2026 139
and considerate way. Development of ethical
values such as honesty, integrity, empathy, co-
operation, peace and justice among students
should become part and parcel of his duty.
A teacher should impress upon the minds of
students that barriers of race, colour and
distance do not stand in the way of uniting the
peoples of different countries. He should avoid
indoctrinating the minds of students. He
should be impartial and highly objective in
imparting knowledge, in interpreting or
describing facts. He should not be a
propagandist either directly or indirectly. He
should be radical and constructivist in teaching
especially the teaching of history, because the
effect of history books and misinterpretation of
facts on children's mentalities would be subtle
and pernicious, as history is perceived as the
mirror and guardian of memory, and embodies
cultural referents.
The teacher should instill in students
the values of democracy, secularism,
pluralism, solidarity, gender equity tolerance,
open-mindedness, humanism, justice, peace
and human rights. To develop global
citizenship, a teacher should make the students
understand that the buildings of societies are
based on the affirmation of the dignity of
every human person: promotion of a culture
that pre-supposes an exercise of autonomy and
responsibility; better knowledge and
understanding of multi -cultural and multi-
ethnic societies, the contribution of different
cultures and groups to human existence;
searching for non-violent alternatives and
practice of dialogues to solve problems. To
prepare students for global citizenship, he
should impress upon the students that 'man
remains man first and then he can be called a
Jew, Christian, Hindu or Muslim. He should
accelerate the students cognitive thinking, to
think independently and develop capability to
take decisions and not following blindly. Real
life examples of successful social, political,
and environmental action, to help students to
realize their creativity and in turn lead to
purposeful participation for common good of
mankind.
The teacher must actively and
emotionally associate himself, as an essential
and responsible partner, in the great tasks
which face the nation. If our national goals
were to become the actual motive force and
the ideals that every man, women and child in
our land would live by, the teacher must
intervene in a big way. The formation of
character, a character evolved in response to
the national goals, would constitute his
primary task. He will indeed prepare students
for examinations, and open to them the world
of knowledge. But these will count for little
unless he has helped them become persons of
character. There is the personal aspect of
character-building to develop qualities like
honesty and integrity and there is the social
aspect which defines national character. Such
a character identification must not be based on
cultural and religious traditions 0f anyone
group but must find acceptance by all sections
of the people. He should prepare worthy
citizens capable of discharging the duties
successfully towards democracy. He should
strengthen emotional and national integration
by making students become active,
participative and committed persons.
Traditionally a teacher has been
regarded as an agent of social change and·
modernization. He has been called the 'maker
of history', 'the builder of the nation' and
'social engineer'. Children, especially children
in the plastic period of their life, emulate their
teachers and draw inspiration from them. A
teacher, therefore, can play an important role
in promoting environmental awareness .and
understanding among his students. The
teacher's role in promoting environmental
awareness should not be restricted to cognitive
development, but to affective as well as
behavioral aspects of the students. Educational
excursions could be arranged to arouse a love
for nature.Tree plantation functions can be
organized Cleanlines drives are also very
useful. Principles and practice of educational
technology have direct relevance to the tasks
of a in increasing knowledge and skills of
intended learners. He is required to use the
techniques of drawing attention and
motivating learners in a classroom. The
teachers should effectively undertake the task
of teaching classes in 21st Century by the use
of educational technology. Prot. Ottaway
thinks that ―teachers in the schools can have
the most powerful influence in the immunity if
they choose‖.
As a community manager, teacher
should be capable of appreciating the
aspirations and expectations of the community.
He should act as a change agent for
modernization and development. He must be
capable of developing proper relationship with
YEAR IV VOLUME IV .Jamshedpur Research Review. ISSUE XVII ISSN-2320-2750
JRR September –November 2026 140
the local community, providing guidance and
leadership to it and utilizing its resources for
the development of school for relevant
education. He should work as a social worker
by organizing programmes in non-formal and
adult education; awareness programmes in
health, hygiene, population issues,
environmental challenges etc.
"Good education requires good
teachers" means that it becomes essential that
the most capable and appropriate people be
recruited into the teaching profession,
provided with a high quality pre-service
programme of teacher education and then
offered opportunities to upgrade their
knowledge and skills over the full length of
their professional career. Teacher education
needs to be adequately strengthened and
upgraded to accommodate the changing role of
the teacher, so that teachers can effectively
address contemporary issues regarding
education, in addition to the· important skill
that we should insist on in the education of 21st
Century teachers which is the knowledge and
capacity to handle tools and machines of daily
use in classroom to enhance the personal and
professional capacity and efficiency.
It is therefore, clear that a new design
of education should provide to teach teacher a
significant mastery to know the tools or
machines, he encounters in his environment,
and to put them to the best use for enhancing
the effectiveness of classroom teaching-
learning.The modern time demands multi-
lingual competence including the new
computer languages that are bound to emerge
with the expansion of computer-technology. In
a situation of growing explosion of
knowledge, everyone will be supposed to learn
more efficiently, comprehensively,
uninterruptedly. Therefore, in order to meet
the realities of life, the teacher-education
needs to inculcate the capacity of learning to
learn, and also enhance the capacity of
teachers to devise techniques to assess the
level of achievement of the future generation.
There is also need to restructure the
teacher-education programme from the
existing one year to four years integrated (with
Arts/Science) programmes on lines with
Regional Colleges of Education in the country.
The longer duration teacher-education
programmes would go a long way in giving
fairly good training and strengthening the
overall competencies of teacher-taught,
whereas the one year teacher education
courses gives training of poor quality.
Much is expected of education and
teachers. If this vast understanding of
educational renewal is to succeed, inevitably
there has to be mutual confidence between
teachers at all levels and all sectors, all
education staff and Public and private partners
of education systems. Roles of all those
involved with respect to autonomy,
responsibility and participation .In addition
teachers should earn their status through
commitment and devotion to work, as well as
by developing the professional pride in 21st
century.
Reference:
1. Khagendra Kumar, Common School
system, 2008, Prakashan Sansthan, New
Delhi.
2. As Thakur & Abhinav Thakur,
Development of Education System in
India Problems and prospects, 2013-14
Agarwal Publication, Agra.
3. Dr. Hasseen Taj, Current Challenges in
Education, 2008, Neelkamal Publications
Pvt. Ltd. Agra.
4. Dr. R. A. Mittal & Dr. G. P. Pandey
Addressing Emerging Educational
Concerns 2014, R. Lall, Book Depat,
Merrut
5. Dr. S. P. Gupta & Dr. Alka Gupta,
Bhartiya shiksha ka Itihas,vikash awam
samsyai 2010 ,Sharda pustak
Sadan,Allahabad
YEAR IV VOLUME IV Jamshedpur Research Review ISSUE XVII ISSN-2320-2750
JRR September –November 2016 141
CENTRAL AFRICAN MYTHOLOGY
Durlabh Singh
68 Raynham Avenue, London, N18 2BS, United Kingdom
Mankind has been on this planet for over a
million years but we don‘t know much about
it, their history, and their culture. Books tell us
about human history going back to about 7000
years. What happened to mankind before that?
Fixation of egoism & intellectual
superiority prevails among modern people so
as to discard any idea worth exploring the
whole history of mankind as pre- historic
people just being considered as savages
without any refined sensibilities. They could
not be more wrong.
We are dominated by our so called
logical brain which is a useful tool for living in
our mass society but useless in exploring inner
psyche and latent sensibilities of our spiritual
nature. Real Mind‘s horizons are beyond our
comprehension and our brain just filters only
utilitarian dimensions.
Take the case of Central African
pygmies whose history can be traced to 80.000
years. They had acute sense of natural forces
around us, both visible and invisible and
expressed these into their dance, music and
parables. Like other cultures they personified
natural forces as characters ruling their lives.
Animals being around on the planet
much longer, are wiser & stronger then the
humans & store magical knowledge available
to shamans and alike through special channels
of mind or through trance. What we call
unconsciousness is the great storage house of
all the life forces of human as well as of
animals and birds.
In refined sensibilities of human
minded, imagination turns out to be a
dimension as valid as time and time & space
and the creatures therein takes their places in
the psyche and become real by exerting their
influences on the destiny of hidden observers.
MOKELE--- THE BEAST.
Guarding his place a troop of soldiers
Of red faces, darker hair, with silvery birch
Among berries, nuts, barks and the fruits
Together they will muster enough strength
To throttle men, snakes and the crocodiles
In lands trespassing onto the fields of grass
Sleeps Mokele among seven spirited guards.
His bed a couch of lotus flowers
Four pillars decorating the ivory tusks
An inhabitant of the Sita Tonka
Inodorous rally a master of concealment
He feeds on the yellow fruits
Of longa trees decked with metallic leaves
Or on tangled grown green honey melons.
Along lakesiders of dark deep waters of Dyka
His kingdom ruled over by a spiteful wisdom
Guarding the forests of rain amid onslaught
From ghouls, ghosts or unholy dark spirits
Corrupted dead hunters of the concealed sights
Smouldering, unconsumed lovers of the past lives.

YEAR IV VOLUME IV Jamshedpur Research Review ISSUE XVII ISSN-2320-2750
JRR September –November 2016 142
OBTAKA- THE MAGICIAN.
Moon goddess came to visit the forest last night
Riding on chariots driven by the velvet monkeys
Guarded by hornets and the armies of wasps
Beleaguered in obscurities by Obtaka the magician.
A maker of charms for the thieves and the lovers
Talisman of skies from paled skins of foreheads
Nail maker hooved webs of the antelopes
Shifter of the sharp swords for the reddish ants.
Striding solid at the hour of the midnight
Giving way to doorways to enter the corridors
Illuminated by the translucent light of the moon.
Tender are the dreams under the wider skies
Where buffalos roam in mud staked stripes
Conversing with mirrored spirits of golden ghosts
Witches, wizards, nymphs or other watery sports.
The chameleon on converse with the blizzards
Obeying the command to put spur on the lizards
The crocodiles, hippopotamus, ibis and the lion
Drinking at water holes under direction of wizard
Rocked white, stone turned hatches for the rabbits
Skin rigged, log wooded dug outs for the jackals
The eel of the deep laughing on its trailed dance
And Obtaka the magician roams in rugged stance.
YEAR IV VOLUME IV Jamshedpur Research Review ISSUE XVII ISSN-2320-2750
JRR September –November 2016 143
ASPIRING FOR WORLD UNION ON SPIRITUAL
FOUNDATION Aju Mukhopadhay, 8 Chair, Lodi Street, Pondicherry
___________________________________________________________________________
Abstract:
The paper describes how the conflicting culture, religion, race and countries with their differing ideas
and interests clashed and still violently clash in groups and individually with nuclear threat hanging
over the head of nations. Following the arguments of Sri Aurobindo written in his two renowned
social theories, The Ideal of Human Unity and The Human Cycle, the paper discusses how the whole
mankind is proceeding towards some sort of unity though unity on the basis of Spiritual foundation is
far away. The paper argues following Sri Aurobindo‘s footsteps that world union on the basis of
spirituality has to build nest in the heart of highly evolved individuals first. There is hope that
individuals will carry forward the idea and gradually it will reach the common man whereby the idea
will spread and be fruitful. But the time for it cannot be foretold though the World Union is possible
and will happen, ultimately on spiritual basis.
Seeking to unite under the cover of
spirituality
There is no doubt that mankind is
proceeding towards some kind of unity. If
hindrances are found Nature will seek and find
the right course to move on. If it is based on
spirituality the problem will almost go for men
will see others as themselves, the relation
among them will be based on psychic; soul
realization besides the usual interdependence
of individuals, countries and nations. But it
needs to emphasize that spirituality is a faith
on existence beyond what we see before our
nose and humility that I and my knowledge are
not the end of the world, that there are vast
things which I have yet to grasp and know.
This is based on intuition verified by
experience.
Thirst for beyond and glimpse of it
and awareness of the unknown with faith on
God gave birth to religion. But religions have
become divided, sullied as they are with
individual, racial and communal
interpretations, superstitions and
aggrandizement. Modern man has almost
come out of it at the summit of his intellect
and subtle understanding where he may accept
spiritualism even without uttering any name of
God but the essential truth of it they seem to
accept in whatever way. We should hope that
the present restrictions would gradually give
birth to fresh air of understanding. Yogi Sri
Aurobindo realised that ―Spirituality is in its
essence an awakening to the inner reality of
our being, to a spirit, self, soul which is other
than our mind, life and body, an inner
aspiration to know, to feel, to be that, to enter
into contact with the greater Reality beyond
and pervading the universe which inhabits also
our own being, to be in communion with It and
union with It.‖ (Divine 857)
Aspiring for a world union on the
basis of spiritualism we need to describe the
world scenario as we are passing through, to
emphasize that this must not be the end of all,
that this must be a temporary phase in human
history like many things have passed by.
Keeping the hindrances before our eyes we
need to amend the course of our action.
Clash of Religions
Romans persecuted Jesus and built
Christian religion after him using his life and
work as the symbol of their religion. Proud of
their riches and techno-civilisation European
Nations considered their religion to be superior
to others. They converted many people of the
vanquished countries to Christianity with the
lofty idea of civilising them and bringing them
into their fold. The aggressive Islam coming
later conquered nations and converted the
infidels, according to their conception, to their
religion. The two highly ambitious religions
with ideas to spread and conquer, convert and
expand, clashed. Religion became the source
of power and pride. Religious war continued
for centuries. Religious conversion is a kind of
expansionism. The Pope has expressed

YEAR IV VOLUME IV Jamshedpur Research Review ISSUE XVII ISSN-2320-2750
JRR September –November 2016 144
displeasure at the effort in some province in
India to ban conversion by passing Act.
Proselytism has been a bane to societies
throughout human history. But unfortunately it
continues.
The war continued for years in
Bosnia-Herzegovina and adjacent areas among
Slavs all of whom originally belonged to
Yugoslavia. Sir Arthur Evans wrote after his
visit to the area in his book, Through Bosnia-
Herzegovina on Foot (London: 1876), ―After
the 11th century many Bosnians were no longer
Catholics but followed agnostic, puritanical
form of Christianity. The Catholic rulers and
those of neighbouring kingdoms were
frequently ordered by the Pope to chastise
them . . . for more than three centuries, many
thousands were killed, many more tortured;
once 40000 were arrested and many of them
were dragged in chains all the way to Rome.‖1
In 1450 many such Bosnians appealed to
Turkish Sultan and were converted to Islam.
The fight has continued up to the present era in
different forms.
Afghanistan was a melting spot of
cultures. It was a Buddhist centre up to ninth
century when Islam entered the valley. Buddha
statues, 50 and 34.5 metres in height at
Bamiyan, were two pieces of great heritage of
human art and culture. On 2 March 2001
Taliban, one of the crudest religious
fundamentalists, destroyed such statues by
gun, rocket and tank fires in the face of world
wide protest. Mr. Mulla Mohammad Omar, the
supreme leader of the fanatics, said that it was
in line with the fatwa from local Islamic
clerics, designed to prevent worshipping of
‗false idols‘. They persecuted and killed many
Hazaras, another tribe of the valley, mostly on
religious ground.
Persecution, torture and death at the
hands of religious fanatics continue to grow.
Fight between the Turkish army and Kurdish
workers continued for 16 years. Both
Hizbollah and Fazelet fought to replace
Turkey‘s secular system with an Islamic
agenda.
Malaysia is a secular state with Islam
as the official religion. Three extremists were
sentenced to death and many others punished
as they tried to overthrow the Malaysian
Government and replace it with an Islamic
State in 2000-2001. A Muslim State in Nigeria
pronounced fatwa to kill the author of an
article which was insulting to Prophet
Mohammad. Such fatwa were issued against
authors by the Iranian Head of the
Government, Ayatollah Khomeini and the
clerics in Bangladesh. Fatwa is the usual way
of suppressing and destroying the dissidents by
the Islamic Heads in different Governments.
In recent months world has witnessed series
of massacres in different countries for
publishing caricatures of Prophet Mohammad
by cartoonists in response to an invitation by
the Danish Government as a symbol of the
freedom of expression. Many writers like
Salman Rushdie, Tasleema Nasrin,
philosopher Henri-Levy, Chahla Chafiq are
under threat and fatwas are often used as a tool
to threat. The longest war after the Second
World War was fought between Iraq and Iran.
Then there was the Gulf war.
The recent war for establishing the
Islamic State and its religious hegemony over
the others continues for about five years now.
This fight is more serious than all previous
ones as it is fuelled by all extremists, terrorists
and misguided youths and supported by big
world powers which have been taking sides
covertly or openly. It is raging mainly in Syria
and Iraq but affecting and spreading in
neighbouring areas. The kill and rape of
minorities like Yazdi and others continues in
the name of religion. Innumerable ancient
heritage and cultures are being destroyed by
the modern philistines. According to recent
report by The Guardian, London, more than
four million Syrians who have fled their
country, nearly half have sought shelter in
Turkey, while more than a million are now
living in Lebanon and at least 600,000 in
Jordan. European borders have become the site
of regular fight and frustration. Refugees have
become a gigantic problem. The ever growing
Muslim population is 2.8 billion out of 7
billion world population.
Violent activities in other areas of the
world in recent past were witnessed by the
LTTE in Sri Lanka. Maoists and allied groups
still continue their war based on communist
ideology in India. The Hindu fundamentalists
brought down the historic structure, the Babri
Masjid in Ayodhya, in 2006 and complicated
the issue.
Religionists would do well if they
stop thinking that their religion is the only
great one to be followed by others and begin to
follow Sri Ramakrishna, who said that all
paths lead to the same goal, the divine. Long

YEAR IV VOLUME IV Jamshedpur Research Review ISSUE XVII ISSN-2320-2750
JRR September –November 2016 145
back our Veda pronounced Ekam sad vipra
bahudha vadanti. The Truth is one; the wise
call it by many names. By one it does not
mean to be one for one religion and more for
the other religions. One is one and the same is
applicable to all religions: the idea leads to the
acceptance of our coming to the door of
spiritualism. Let us remember once again what
Swami Vivekananda repeated on 19
September 1893 at the World‘s Parliament of
Religions, Chicago, ―Hear, ye children of
immortal bliss! Even ye that resides in higher
spheres! I have found the Ancient One who is
beyond all darkness, all delusion: knowing
Him alone you shall be saved from death over
again.‖ Vivekananda 18
Clash of Ideas
Communism and Capitalism,
Democracy and Dictatorship are the rival ideas
introducing different systems of Government,
different world order affecting largest numbers
of people. Communism brought the hope to
many that it would spread throughout the
world and men would unite under the
leadership of the proletariat; there remaining
no division like class, creed and caste among
the humans. But it turned out to be a
mechanical dictatorship in the end choking
life. The two largest Communist Governments
were USSR and People‘s Republic of China.
People never lived peacefully under them until
USSR broke up and liberal ideas and capitalist
economy were introduced in China. It has
invited huge foreign investment in the country.
The right to individual property has been
accepted with many other changes done. The
internal state of affairs in communist countries
was exposed by some courageous writers like
Mikhail Sholokhov, Alexander Solzhenitsyn,
Svetlana Aliluyeva, Silviu Craciunas, Jung
Chang, Sheng Keyi and others.
China has realized the world order and
has shifted from its previous stand. There has
never been any communist Government in
India. The Governments formed by left parties
in three provinces functioned democratically
under the Indian Republic. The communist
Chief Minister of West Bengal once admitted
in a chat in The Hindu that the command
system of economy did not function in the big
communist countries of the world as they
functioned in isolation so such regimes failed
to continue as in USSR and elsewhere.
Sri Aurobindo predicted this long ago in his
The Ideal of Human Unity. Rabindranath was
overwhelmed by the material progress of the
Soviets but he too foresaw a crackdown of
such a mechanised system.
Clash of Civilizations
Ultimately it seems to be a clash and
conflict of civilizations. Each civilization
sticks to its root in spite of tremendous
progress in transport and communication,
reducing their apparent distances. Professor
Samuel P Huntington, the author of Clash of
Civilisations? defined civilization as the
highest cultural grouping of people at the
broadest level. While Arnold Toynbee
identified 21 major civilisations of which six
existed, Huntington listed eight.
Relations between countries and nations
have significantly changed. Many isms have
vanished from the scene. The cold war
between US and USSR ended but another cold
war between China and USA raised its head.
Cold war developed between the West and the
Rest of the World. Among them also
differences remain as in Europe and between
Europe and America. Brexit is the latest
emerging issue separating Britain for the rest
of the European Union. But the controversy
continues. Sometimes American ego raises its
head and they act defying the wishes of the
United Nation Organization. The present
President of the US has shown exemplary
quality of keeping away from showing
aggradisement. Each group and country feels
threatened living in an age of nuclear
proliferation in spite of all apparent
restrictions.
The Ego of the Super Power United States is keen to see that no
country other than those already equipped with
nuclear warhead possesses it. Both U.S. and
Russia have stockpiled large number of such
weapons. China is a great submarine hiding its
stocks. Some Europeans and Asians are also
good nuke powers. Countries ambitious to
have such weapons are regularly threatened by
the US and warned by the UNO. But there are
some States like North Korea and Iran who do
not relish to be cowed down and pose threat to
neighbouring countries.
37 noble laureate scientists
representing the Federation of American
Scientists strongly objected to the Indo-US
YEAR IV VOLUME IV Jamshedpur Research Review ISSUE XVII ISSN-2320-2750
JRR September –November 2016 146
civilian nuclear technology deal as it would
jeopardise the NPT idea which was 30 years
old then. They felt that the NPT should be
replaced by a new international frame work.
They further opined that America cannot
continue to treat nuclear weapons as militarily
useful and politically salient while expecting
to stop global nuclear proliferation. Indian
Nuclear Scientists too appealed to the Indian
Parliamentarians to see that Indo-Us
agreement did not infringe on our
independence, that we should be able to hold
on to our nuclear programmes and that nothing
short of Universal Nuclear Disarmament must
be our ultimate aim. They have claimed that
India is one of the most advanced countries in
the technology of fast breeder reactors. Now
India and Pakistan like quite some others are
nuclear powers. It is such a destructive weapon
that no threats can threaten it for it can
command annihilation of the globe if it
spreads. Mankind should stop its proliferation
under any excuse. Let Solar Power be the
guiding principle.
UNO
The founders of the United Nations were
determined ―To save succeeding generations
from the scourge of war, which twice in our
life time has brought untold sorrow to
mankind.‖
Sri Aurobindo wrote in the P.S.
chapter of The Ideal of Human Unity, “The
League of Nations was in fact an oligarchy of
big powers each drawing behind it a retinue of
small states and using the general body. . . for
furtherance of its own policy much more than
for the general interest and the good of the
world at large. . . . In the constitution of the
U.N.O. an attempt was made, in principle at
least, to escape from these errors; but. . . . A
strong surviving element of oligarchy
remained in the preponderant place assigned to
the five great Powers in the Security Council
and was clinched by the device of the veto.‖
(Unity 559)
So he warned, ―The leaders of the
nations . . . must be on guard against unwise
policies or fatal errors; the deficiencies that
exist in the organization or its constitution
have to be quickly remedied or slowly and
continuously eliminated.‖ (Unity 558)
His observations that ―National
egoism, the pride of domination and the desire
of expansion still govern the mind of
humanity, however modified that may now be
in their methods . . . until the spirit is radically
changed, the union of human race by a
federation of free nations must remain a noble
chimera‖ (Unity 328-329)
Confused with the global scenarios
the great scientist and intellectual, Stephen
Hawking recently posed a question in the
Internet, ―In a world that is in chaos
politically, socially and environmentally, how
can the human race sustain for another 100
years?‖ There were 25000 answers through the
yahoo and many invoking the combined power
of God, Love and Peace.
The Unity on Spiritual Foundation In spite of all conflicting news and reports we
find indeed that the world is moving closer for
needs through different associations like UNO
and its different bodies, European Union,
NATO, SAARC, WTO, BRICS, SEATO,
SENTO, Group of Eight and many others. But
these, based on needs, through the mode of
diplomacy are something like outward unity
which Sri Aurobindo called externals of
civilisation like unity in dress, manners and
habits; details of political, social and economic
order. He wished a greater, living unity in the
psychological life of humanity. He said that
oneness is secretly the foundation of all things.
Evolving spirit in Nature is destined to realize
it consciously. Through diversity evolution
proceeds from a simple to a complex entity.
One day the human race must realise this, he
confirmed. But by unity he did not mean
uniformity; logically simple and scientifically
rigid, beautifully neat mechanical sameness
but a living oneness full of healthy variation
and freedom.
Cultural affinity; the same origin of
country and birth are reasons for natural unity.
Living in the same country Ireland and Britain
are always at loggerhead but Pakistan,
Bangladesh and India have the natural affinity
among the people, most of who originally
belong to India. In spite of ban on Indian
cinema in Pakistan, the people zealously
guarded their right to enjoy them even through
illegal means. It is still restricted there.
After reviewing the international
relations and the world order after some 34-35
years of writing the book, The Ideal of Human
Unity, Sri Aurobindo came to a conclusion in a
Postscript chapter written in 1950 that the
theory of some kind of world union as he had

YEAR IV VOLUME IV Jamshedpur Research Review ISSUE XVII ISSN-2320-2750
JRR September –November 2016 147
envisaged was true. ―The ultimate result must
be the formation of a World State and the most
desirable form of it would be a federation of
free nationalities in which all subjection or
forced inequality and subordination of one to
another would have disappeared and, though
some might preserve a greater natural
influence, all would have an equal status . . . .
a federal order would then be most desirable. .
. .‖ (Unity 571)
In his historical analysis of the march of
humanity in his The Human Cycle Sri
Aurobindo held that the unity would be solid
and secured if it is on a spiritual foundation.
About the coming of a spiritual age he said,
“There will be a labour of religion to reject its
past heavy weight of dead matter and revivify
its strength in the fountains of the spirit.‖
(Cycle 234)
―If mankind is to be spiritualised, it must
first in the mass cease to be the material or the
vital man and become the psychic and the true
mental being. It may be questioned
wheather such a mass progress or conversion
is possible; but if it is not, then the
spiritualisation of mankind as a whole is a
chimera‖. (Cycle 238)
Confirming it further he wrote, ―The
spiritual age will be ready to set in when the
common mind of man begins to be alive to
these truths and to be moved or desire to be
moved by the triple or triune spirit.‖ (Cycle
244)
The Conclusion
Though it seems that a world
Government on spiritual foundation is far
away, we may pause a little and deeply ponder
over it. Sri Aurobindo said that the drive
toward spirituality would be pioneered by
individuals and groups of individuals. ―Hope
of humanity lies in the growing number of
men who will realize this truth and seek to
develop it in themselves, so that when the
mind of man is ready to escape from its
mechanical bent, perhaps when it finds that its
mechanical solutions are all temporary and
disappointing, the truth of the Spirit may step
in and lead humanity to the path of its highest
possible happiness and perfection.‖ (Unity
555)
We find such individuals and groups,
spiritual centres already established, not only
in India but across the globe. Even a few of
them may take the world toward fruition of its
goal at the appropriate time, the length of
which is beyond our anticipation.
References
1. The Asian Age; dated 10.7.1995
2. Religious Population Worldwide:
http://www.religiouspopulation.com/
and Muslim Population in the World:
http://www.muslimpopulation.com
Work Cited
1. Sri Aurobindo. The Life Divine.
Pondicherry: SABCL-Sri Aurobindo
Ashram. 1972. Hardbound.
2. Swami Vivekananda. Chicago
Addresses. Calcutta: Advaita
Ashrama. 1992. Booklet.
3. Sri Aurobindo. The Ideal of Human
Unity. Pondicherry: SABCL-Sri
Aurobindo Ashram. 1972. V-15.
Hardbound.
4. Sri Aurobindo. The Human Cycle. .
Pondicherry: SABCL-Sri Aurobindo
Ashram 1972. V-15. Hardbound.
Note: -(Paper Read at Writer’s and Poet’s
Peace Meet / Conference at Ramkrishna
Mission Institute of Culture, Golpark,
Kolkata on 30 December 2015)
YEAR IV VOLUME IV Jamshedpur Research Review ISSUE XVII ISSN-2320-2750
JRR September –November 2016 148
YEAR IV VOLUME IV Jamshedpur Research Review ISSUE XVII ISSN-2320-2750
JRR September –November 2016 149