(Year ended March 31, 2017) 2017 - shinsho.co.jp · (Year ended March 31, 2017) 2017. 1 See...
16
SHINSHO CORPORATION AND CONSOLIDATED SUBSIDIARIES FINANCIAL STATEMENTS (Year ended March 31, 2017) 2017
-
Upload
nguyendieu -
Category
Documents
-
view
213 -
download
0
Transcript of (Year ended March 31, 2017) 2017 - shinsho.co.jp · (Year ended March 31, 2017) 2017. 1 See...

SHINSHOCORPORATION
ANDCONSOLIDATED
SUBSIDIARIESFINANCIAL
STATEMENTS
(Year ended March 31, 2017)
2017

1 See accompanying notes to consolidated financial statements.
SHINSHO CORPORATION AND CONSOLIDATED SUBSIDIARIESCONSOLIDATED BALANCE SHEETS March 31, March 31, 2017 2017 2016 Thousands of (Millions of Yen) (Millions of Yen) U.S. DollarsASSETSCurrent assets:
Cash and cash equivalents ……………………………………… 16,491 17,257 146,999Notes and accounts receivables ………………………………… 153,234 140,712 1,365,850Inventories ……………………………………………………… 28,210 31,217 251,455Advance payments ……………………………………………… 13,028 10,109 116,125Deferred tax assets (Note 6) ……………………………………… 1,000 724 8,920Other current assets ……………………………………………… 3,726 4,665 33,214Allowance for doubtful receivables ……………………………… (90) (94) (806)
Total current assets ………………………………………… 215,602 204,593 1,921,759
Property and equipment:Land ……………………………………………………………… 1,231 1,047 10,975Building and structures ………………………………………… 7,638 5,895 68,088Machinery and equipment ……………………………………… 8,389 6,288 74,780Other ……………………………………………………………… 1,219 1,383 10,869Accumulated depreciation ……………………………………… (10,055) (8,337) (89,625)Construction in progress ………………………………………… 187 3,699 1,668
Total property and equipment ……………………………… 8,611 9,977 76,757
Investments and other assets:Goodwill ………………………………………………………… 344 358 3,070Investment securities …………………………………………… 30,730 27,956 273,918Long-term loans ………………………………………………… 176 409 1,569Deferred tax assets (Note 6) ……………………………………… 92 192 826Other ……………………………………………………………… 2,247 2,265 20,032Allowance for doubtful receivables ……………………………… (294) (158) (2,628)
Total investments and other assets ………………………… 33,296 31,024 296,787
Total Assets ………………………………………………… 257,510 245,594 2,295,304

2 See accompanying notes to consolidated financial statements.
March 31, March 31, 2017 2017 2016 Thousands of (Millions of Yen) (Millions of Yen) U.S. DollarsLIABILITIES AND EQUITYCurrent liabilities:
Notes and accounts payables …………………………………… 125,661 118,183 1,120,074Short-term loans and currentportion of long term debt (Note 3) ……………………………… 31,788 32,878 283,347Income taxes payable …………………………………………… 1,163 492 10,367Deferred tax liabilities (Note 6) ………………………………… 4 2 36Accured bonuses to employees ………………………………… 842 813 7,508Deposits received ………………………………………………… 10,840 7,306 96,624Other current liabilities ………………………………………… 11,584 10,200 103,260
Total current liabilities ……………………………………… 181,884 169,877 1,621,219
Long-term liabilities:Long-term debt, less current portion (Note 3) …………………… 23,184 26,412 206,654Guaranteed deposits received …………………………………… 1,637 1,720 14,591Deferred tax liabilities (Note 6) ………………………………… 1,243 566 11,086Directors' retirement benefit ……………………………………… 86 56 771Net defined benefit liability (Note 8) …………………………… 790 732 7,043Allowance for loss on guarantees ……………………………… 72 44 649Other long-term liabilities ……………………………………… 928 932 8,272
Total long-term liabilities …………………………………… 27,943 30,466 249,070
Contingent liabilities (Note 5)
Equity:Owners' Equity
Common stock …………………………………………………… 5,650 5,650 50,363Capital surplus …………………………………………………… 2,703 2,703 24,098Retained earnings ………………………………………………… 33,850 31,588 301,725Treasury stock …………………………………………………… (19) (17) (171)
Total owners' equity ………………………………………… 42,185 39,924 376,015
Accumulated other comprehensive income (loss)Net unrealized gain (loss) on available-for-sale securities ……… 2,769 1,352 24,688Net unrealized gain (loss) on derivative instruments …………… 0 (62) 2Foreign currency translation adjustments ……………………… 309 878 2,758
Total accumulated other comprehensive income (loss) …… 3,079 2,167 27,449
Noncontrolling interest 2,417 3,158 21,550
Total Equity ………………………………………………… 47,682 45,250 425,015
Total liabilities and equity …………………………………… 257,510 245,594 2,295,304

3 See accompanying notes to consolidated financial statements.
SHINSHO CORPORATION AND CONSOLIDATED SUBSIDIARIESCONSOLIDATED STATEMENTS OF INCOME March 31, March 31, 2017 2017 2016 Thousands of (Millions of Yen) (Millions of Yen) U.S. Dollars
Net sales (Note 11) …………………………………………………… 769,481 791,342 6,858,733Cost of sales ………………………………………………………… 743,370 764,826 6,625,998
Gross profit ……………………………………………………… 26,110 26,516 232,735Selling, general and administrative expenses ………………………… 21,290 20,684 189,774
Operating income ………………………………………………… 4,819 5,831 42,961
Other incomeInterest income …………………………………………………… 91 138 818Dividends income………………………………………………… 624 825 5,564Purchase discount ………………………………………………… 48 56 435Gain on revaluation of derivatives ……………………………… − 637 −Other ……………………………………………………………… 454 389 4,055 1,219 2,047 10,873
Other expenseInterest expense ………………………………………………… 661 653 5,893Loss on sale of notes and account receivables …………………… 268 388 2,397Sales discount …………………………………………………… 187 197 1,671Foreign exchange loss …………………………………………… 181 944 1,620Loss on revaluation of derivatives ……………………………… 358 − 3,193Loss on write-down of investment securities …………………… 10 231 94Loss on impairment of fixed assets ……………………………… 1,068 − 9,527Loss on liquidation of affiliated corporation …………………… 16 − 143Loss on valuation of membership ……………………………… − 2 −Provision for loss on guarantees ………………………………… 26 44 231Other ……………………………………………………………… 78 118 698 2,857 2,579 25,473
Net income before income taxes, noncontrolling interests …………… 3,181 5,299 28,361and equity in earnings of affiliates
Income taxes (Note 4)Current …………………………………………………………… 2,015 1,911 17,964Deferred ………………………………………………………… (82) 192 (739) 1,932 2,103 17,225
Noncontrolling interests ……………………………………………… (775) 56 (6,914)Equity in earnings of affiliates ……………………………………… 945 341 8,424
Net income ……………………………………………………… 2,970 3,480 26,474
(yen) (yen) (dollars)Net income per share 335.43 393.04 2.99

4 See accompanying notes to consolidated financial statements.
SHINSHO CORPORATION AND CONSOLIDATED SUBSIDIARIESCONSOLIDATED STATEMENTS OF SHAREHOLDERS' EQUITY March 31, March 31, 2017 2017 2016 Thousands of (Millions of Yen) (Millions of Yen) U.S. DollarsCommon stock:
Balance at beginning of year …………………………………… 5,650 5,650 50,363Balance at end of period ………………………………………… 5,650 5,650 50,363
Capital surplus:Balance at beginning of year …………………………………… 2,703 2,703 24,098Balance at end of year …………………………………………… 2,703 2,703 24,098
Retained earnings:Balance at beginning of year …………………………………… 31,588 28,907 281,566Effect of changes in accounting policies applied to
foreign subsidiaries ………………………………………… 0 (1) 0Cash dividends …………………………………………………… (708) (797) (6,315)Net income ……………………………………………………… 2,970 3,480 26,474Balance at end of period ………………………………………… 33,850 31,588 301,725
Net unrealized gain (loss) on available-for-sale securities:Balance at beginning of year …………………………………… 1,352 3,261 12,051Net change in unrealized gain (loss) on
available -for-sale securities ………………………………… 1,417 (1,909) 12,637Balance at end of period ………………………………………… 2,769 1,352 24,688
Net unrealized gain (loss) on derivative instruments:Balance at beginning of year …………………………………… (62) (44) (555)Net change in unrealized gain (loss) on
derivative instruments ……………………………………… 62 (18) 558Balance at end of period ………………………………………… 0 (62) 2
Foreign currency transaction adjustment:Balance at beginning of year …………………………………… 878 2,029 7,827Net change in foreign currency translation adjustments ………… (568) (1,150) (5,068)Balance at end of period ………………………………………… 309 878 2,758
Treasury stock:Balance at beginning and end of year …………………………… (17) (17) (159)Net change in treasury stock …………………………………… (1) (0) (12)Change in equity in an associated company accounted
for by equity method-treasury stock ………………………… (0) − (0)Balance at end of period ………………………………………… (19) (17) (171)
Noncontrolling interest:Balance at beginning and end of year …………………………… 3,158 3,202 28,149Net change in noncontrolling interest …………………………… (740) (44) (6,599)Balance at end of period ………………………………………… 2,417 3,158 21,550
Total shareholders' equity 47,682 45,250 425,015
(thousands) (thousands)Number of shares of common stock authorized ……………………… 270,000 270,000Number of shares of common stock issued ………………………… 8,861 88,606
5 See accompanying notes to consolidated financial statements.
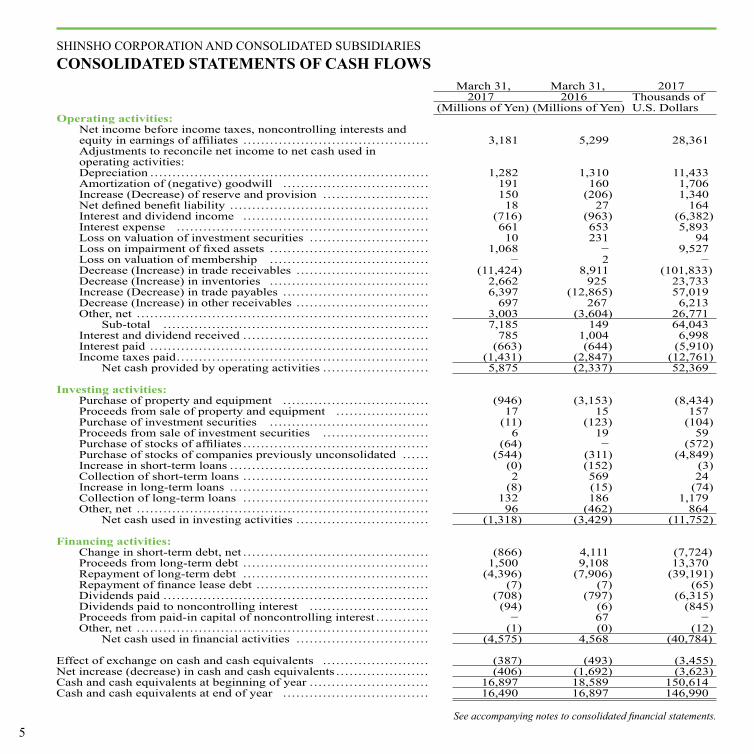
SHINSHO CORPORATION AND CONSOLIDATED SUBSIDIARIESCONSOLIDATED STATEMENTS OF CASH FLOWS March 31, March 31, 2017 2017 2016 Thousands of (Millions of Yen) (Millions of Yen) U.S. DollarsOperating activities:
Net income before income taxes, noncontrolling interests andequity in earnings of affiliates …………………………………… 3,181 5,299 28,361Adjustments to reconcile net income to net cash used in operating activities:Depreciation ……………………………………………………… 1,282 1,310 11,433Amortization of (negative) goodwill …………………………… 191 160 1,706Increase (Decrease) of reserve and provision …………………… 150 (206) 1,340Net defined benefit liability ……………………………………… 18 27 164Interest and dividend income …………………………………… (716) (963) (6,382)Interest expense ………………………………………………… 661 653 5,893Loss on valuation of investment securities ……………………… 10 231 94Loss on impairment of fixed assets ……………………………… 1,068 − 9,527Loss on valuation of membership ……………………………… − 2 −Decrease (Increase) in trade receivables ………………………… (11,424) 8,911 (101,833)Decrease (Increase) in inventories ……………………………… 2,662 925 23,733Increase (Decrease) in trade payables …………………………… 6,397 (12,865) 57,019Decrease (Increase) in other receivables ………………………… 697 267 6,213Other, net ………………………………………………………… 3,003 (3,604) 26,771
Sub-total …………………………………………………… 7,185 149 64,043Interest and dividend received …………………………………… 785 1,004 6,998Interest paid ……………………………………………………… (663) (644) (5,910)Income taxes paid ………………………………………………… (1,431) (2,847) (12,761)
Net cash provided by operating activities …………………… 5,875 (2,337) 52,369
Investing activities:Purchase of property and equipment …………………………… (946) (3,153) (8,434)Proceeds from sale of property and equipment ………………… 17 15 157Purchase of investment securities ……………………………… (11) (123) (104)Proceeds from sale of investment securities …………………… 6 19 59Purchase of stocks of affiliates …………………………………… (64) − (572)Purchase of stocks of companies previously unconsolidated …… (544) (311) (4,849)Increase in short-term loans ……………………………………… (0) (152) (3)Collection of short-term loans …………………………………… 2 569 24Increase in long-term loans ……………………………………… (8) (15) (74)Collection of long-term loans …………………………………… 132 186 1,179Other, net ………………………………………………………… 96 (462) 864
Net cash used in investing activities ………………………… (1,318) (3,429) (11,752)
Financing activities:Change in short-term debt, net …………………………………… (866) 4,111 (7,724)Proceeds from long-term debt …………………………………… 1,500 9,108 13,370Repayment of long-term debt …………………………………… (4,396) (7,906) (39,191)Repayment of finance lease debt ………………………………… (7) (7) (65)Dividends paid …………………………………………………… (708) (797) (6,315)Dividends paid to noncontrolling interest ……………………… (94) (6) (845)Proceeds from paid-in capital of noncontrolling interest ………… − 67 −Other, net ………………………………………………………… (1) (0) (12)
Net cash used in financial activities ………………………… (4,575) 4,568 (40,784)
Effect of exchange on cash and cash equivalents …………………… (387) (493) (3,455)Net increase (decrease) in cash and cash equivalents ………………… (406) (1,692) (3,623)Cash and cash equivalents at beginning of year ……………………… 16,897 18,589 150,614Cash and cash equivalents at end of year …………………………… 16,490 16,897 146,990

6
SHINSHO CORPORATION AND CONSOLIDATED SUBSIDIARIESNOTES TO THE CONSOLIDATED FINANCIAL STATEMENTS
1. Basis of presenting consolidated financial statements
The accompanying consolidated financial statements of Shinsho Corporation (the "Company") and its consolidated subsidiaries have been prepared in accordance with the provisions set forth in the Japanese Financial Instruments and Exchange Act and its related accounting regulations and in conformity with accounting principles generally accepted in Japan ("Japanese GAAP"), which are different in certain respects as to the application and disclosure requirements of International Financial Reporting Standards. Japanese yen figures less than a million yen are rounded down to the nearest million yen and U.S. dollar figures less than a thousand dollars are rounded down to the nearest thousand dollars, except for per share data. In preparing these consolidated financial statements, certain reclassifications and rearrangements have been made to the consolidated financial statements issued domestically in order to present them in a form which is more familiar to readers outside Japan. In addition, certain reclassifications have been made in the 2016 financial statements to conform to the classifications used in 2017. The accompanying consolidated financial statements are stated in Japanese yen, the currency of the country in which the Company is incorporated and principally operates. The translation of Japanese yen amounts into U.S. dollar amounts are included solely for the convenience of readers outside Japan and have been made at the rate of ¥112.19 to $1, the rate of exchange at March 31, 2017. Such translation should not be construed as representations that Japanese yen amounts could be converted into U.S. dollars at that or any other rate.
2. Summary of significant accounting policies
(1) Scope of consolidationThe Company had 38 subsidiaries (majority-owned companies) at March 31, 2017. The accompanying consolidated financial statements include the accounts of the Company and 38 of its subsidiaries for the year ended March 31, 2017, which are listed below:
Shinsho American CorporationShinsho Steel Products CorporationShinsho Non-ferrous CorporationShinko Shoji Singapore Pte. Ltd.
Thai Escorp Ltd.Shinsho (Malaysia) Sdn. Bhd.Asia Chemical Engineering Co., Ltd.Kobelco Trading Shanghai Co., Ltd.Suzhou Shinko-shoji Material Co., Ltd.Matsubo CorporationKobelco Plate Processing India Private LimitedKobelco CH Wire Mexicana, S.A.de C.V.26 other consolidated subsidiaries
(2) Elimination and combinationFor the purposes of preparing the consolidated financial statements of the Company and its consolidated subsidiaries, all significant inter-company transactions, account balances and unrealized profits among the Company and its consolidated subsidiaries have been entirely eliminated to "Noncontrolling Interests". In the elimination, any differences between the cost of investments in subsidiaries and the amount of underlying equity in net assets of the subsidiaries is treated as an asset "Goodwill" or a liability "Negative goodwill". Goodwill recorded promptly on balance sheet amortized within twenty years by cause.(3) Equity method of accounting for investments in affiliatesThe Company had 23 affiliates (companies owned from 20% to 50% actually) at March 31, 2017. The equity method is applied to these 16 investments.(4) Cash and cash equivalentsCash and cash equivalents include all highly liquid investments. Cash equivalents are generally at the maturity of three months or less and readily convertible to cash. Cash equivalents near maturity indicate insignificant risk of changes in value because of changes in interest rates.(5) Investment securitiesSecurities are classified into the categories based on the purpose of holding, which can result in the different measurement and can account for the changes in the fair value. Debt securities that are intended to be held to maturity ("held-to-maturity debt securities") are measured at amortized cost in the balance sheet. Securities other than held-to-maturity debt securities and the equity investment in subsidiaries and affiliates ("other securities") are measured at the fair value. The difference between the fair value and the historical cost is recorded in the category of shareholder's equity. The historical cost is determined by the moving average cost. Securities that have no market price are

7
stated at their historical cost.(6) InventoriesInventories are mainly stated at cost determined by the moving average method. (unless market value of inventories declines significantly and is not expected to recover to cost, in such cases costs are reduced to net realizable values).(7) Property and equipmentProperty and equipment are stated at cost. Depreciation of property and equipment is computed principally by the declining balance method. However, depreciation of buildings booked from April 1, 1998 is computed using the straight-line method.(8) Long-lived assetsThe Company reviews its long-lived assets for the impairment whenever events or changes in circumstance indicate the carrying amount of an asset or asset group may not be recoverable. An impairment loss would be recognized if the carrying amount of an asset or asset group exceeds the sum of the undiscounted future cash flows expected as a result of the continuous use and eventual disposition of the asset or asset group. The impairment loss would be measured when the carrying amount of the asset exceeds its recoverable amount, which is higher of the discounted cash flows from the continuous use and eventual disposition of the asset or the net selling price at disposition.(9) Allowance for retirement and severance benefitsAccrued employees' retirement benefits in subsidiaries are provided mainly at the amount calculated based on the retirement benefit obligation and the fair value of the pension plan assets as of the balance sheet date.(10) Allowance for doubtful receivablesThe allowance for doubtful receivables is provided in amounts which are sufficient to cover possible losses on collection. It consists of individually estimated uncollectible amounts and amounts calculated using the actual rate of historical bad debt.(11) Finance leasesLease assets related to finance lease transactions that do not involve the transfer of ownership are depreciated on a straight-line basis, with the lease period used their useful lived and no residual value.(12) Income taxesThe asset and liability approach is used to recognize deferred tax assets and liabilities for the expected future tax consequences of temporary differences between the carrying amounts of assets
and liabilities for financial reporting purposes and the amounts used for income tax purposes.(13) Translation of foreign currency accountsCurrent and non-current monetary assets and liabilities denominated by foreign currencies are translated into Japanese yen at the exchange rates at the end of fiscal year, and the resulting exchange gains and losses are recognized in the income statement. Balance sheets of consolidated overseas subsidiaries are translated into Japanese yen at the exchange rates at the end of fiscal year except for stockholders' equity accounts, which are translated at the historical rates. Income statements of consolidated overseas subsidiaries are translated at the average exchange rates. The resulting translation adjustments are reflected in the consolidated financial statements as "Foreign currency translation adjustments".(14) Derivative financial instrumentsThe Company and its subsidiaries use derivative financial instruments to manage its exposures to fluctuations in foreign exchange rates and comodity prices. Derivatives include foreign currency forward contracts and comodities futures, which are utilized by the Company to reduce foreign currency exchange rate risks and comodity price risks. The Company and its subsidiaries do not enter into derivatives for trading or speculative purposes. The Company and its subsidiaries have taken various steps, including the establishment of internal management rules, to ensure that transactions are implemented appropriately and that risk is managed. Gains and losses on hedge of existing assets or liabilities are included in carrying amounts of those assets or liabilities and ultimately recognized the income as a part of those carrying amounts. Gains and losses related to qualifying hedges of firm commitments and anticipated transactions are deferred and recognized the income, or adjustments of carrying amounts, when the hedged transaction occurs.(15) Net income per shareThe computation of net income per share is based on the weighted average number of issued shares of common stock outstanding during the relevant period.
3. Short-term debt and long-term debt
Short-term debt at March 31, 2017 and 2016 consisted of the following:

8
(¥ millions) ($ thousands)Short-term loans principally from 2017 2016 2017banks at March 31, 2017 and 2016 represent short-term noteswith the interest on the principal 27,141 28,481 241,927at the average rate of 0.861% and 0.839%, respectively.
Long-term debt at March 31, 2017 and 2016 consisted of the following: (¥ millions) ($ thousands)Long-term loans from banks, 2017 2016 2017insurance companies and other financial institutions due through 2025, at the averaged 27,831 30,809 248,074rate of 0.811%
Less current portion (4,646) (4,396) (41,419) 23,184 26,412 206,654
The aggregate annual maturity of long-term debt at March 31, 2017 were as follows: Year ending March 31 (¥ millions) ($ thousands)2019 7,193 64,1142020 2,749 24,5032021 1,131 10,0812022 and thereafter 12,108 107,924
4. Income taxes
Income taxes applicable to the Company and its domestic subsidiaries comprise of the corporation tax, inhabitants' taxes and the enterprise tax, which in the aggregate resulted in the normal statutory tax rate of approximately 30.8% and 33.0% for 2017 and 2016. The effective tax rates reflected in the statements of operations differ from the statutory tax rates. The difference is due primarily to the timing difference in the recognition of certain income and expenses for tax and financial reporting purposes, and the effect of permanent non-deductible expenses.
5. Contingent liabilities
Contingent liabilities at March 31, 2017 and 2016 were as follows: (¥ millions) ($ thousands) 2017 2016 2017As endorser of notes endorsed 2,169 1,953 19,339As guarantor of loans 2,344 1,888 20,897
6. Deferred income taxes
Significant components of deferred tax assets and liabilities at March 31, 2017 and 2016, were as follows: (¥ millions) ($ thousands)
2017 2016 2017Deferred tax assets:Allowance for doubtful receivables 103 56 918Accrued bonus 274 275 2,442Loss on devaluation of inventories 537 208 4,795Loss on devaluation of fixed assets 643 286 5,735Loss on devaluation of investment securities 1,093 1,041 9,744Retirement bonuses for directors 20 17 181Loss on devaluation of membership 85 86 766Net defined benefit liability 133 193 1,186Loss carried forward 915 687 8,156Other 284 197 2,535Valuation allowance (2,704) (1,819) (24,107)
Gross deferred tax assets 1,386 1,231 12,355
Deferred tax liabilities:Unrealized gain on available-for-sale securities (1,157) (558) (10,317)Undistributed earnings of affiliates (327) (269) (2,921)Other (55) (56) (492)
Gross deferred tax liabilities (1,540) (883) (13,730)Net deferred tax assets, liabilities (154) 348 (1,375)
7. Lease transactions
・Operating leaseUnder non-cancelable operating leases, future minimum lease payments at March 31, 2017 were ¥14 millions ($130 thousands) of which ¥5 millions ($51 thousands) is due within one year.
9
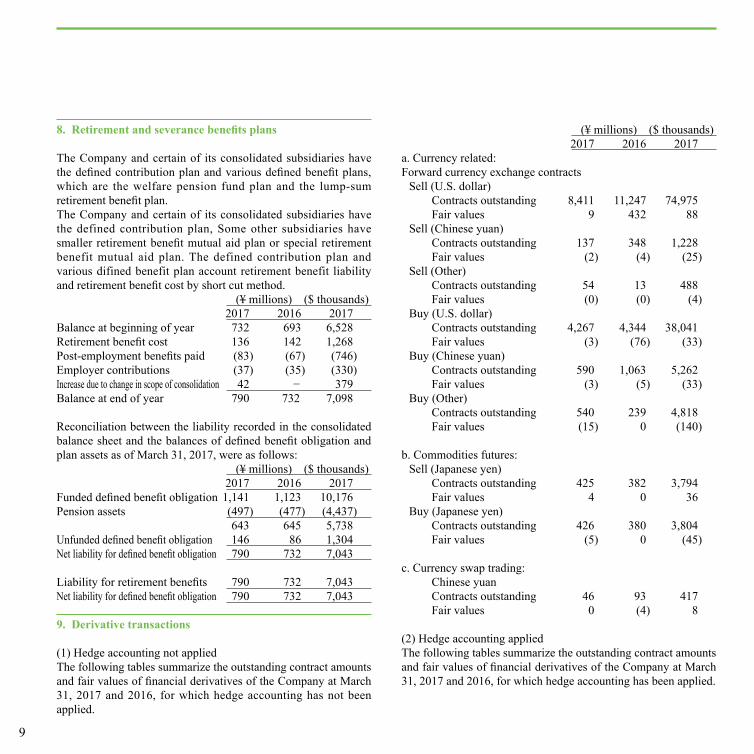
8. Retirement and severance benefits plans
The Company and certain of its consolidated subsidiaries have the defined contribution plan and various defined benefit plans, which are the welfare pension fund plan and the lump-sum retirement benefit plan.The Company and certain of its consolidated subsidiaries have the defined contribution plan, Some other subsidiaries have smaller retirement benefit mutual aid plan or special retirement benefit mutual aid plan. The defined contribution plan and various difined benefit plan account retirement benefit liability and retirement benefit cost by short cut method. (¥ millions) ($ thousands) 2017 2016 2017Balance at beginning of year 732 693 6,528Retirement benefit cost 136 142 1,268Post-employment benefits paid (83) (67) (746)Employer contributions (37) (35) (330)Increase due to change in scope of consolidation 42 − 379Balance at end of year 790 732 7,098
Reconciliation between the liability recorded in the consolidated balance sheet and the balances of defined benefit obligation and plan assets as of March 31, 2017, were as follows: (¥ millions) ($ thousands) 2017 2016 2017Funded defined benefit obligation 1,141 1,123 10,176Pension assets (497) (477) (4,437) 643 645 5,738Unfunded defined benefit obligation 146 86 1,304Net liability for defined benefit obligation 790 732 7,043
Liability for retirement benefits 790 732 7,043Net liability for defined benefit obligation 790 732 7,043
9. Derivative transactions
(1) Hedge accounting not appliedThe following tables summarize the outstanding contract amounts and fair values of financial derivatives of the Company at March 31, 2017 and 2016, for which hedge accounting has not been applied.
(¥ millions) ($ thousands) 2017 2016 2017a. Currency related:Forward currency exchange contracts
Sell (U.S. dollar)Contracts outstanding 8,411 11,247 74,975Fair values 9 432 88
Sell (Chinese yuan) Contracts outstanding 137 348 1,228Fair values (2) (4) (25)
Sell (Other)Contracts outstanding 54 13 488Fair values (0) (0) (4)
Buy (U.S. dollar)Contracts outstanding 4,267 4,344 38,041Fair values (3) (76) (33)
Buy (Chinese yuan)Contracts outstanding 590 1,063 5,262Fair values (3) (5) (33)
Buy (Other)Contracts outstanding 540 239 4,818Fair values (15) 0 (140)
b. Commodities futures:Sell (Japanese yen)
Contracts outstanding 425 382 3,794Fair values 4 0 36
Buy (Japanese yen)Contracts outstanding 426 380 3,804Fair values (5) 0 (45)
c. Currency swap trading:Chinese yuanContracts outstanding 46 93 417Fair values 0 (4) 8
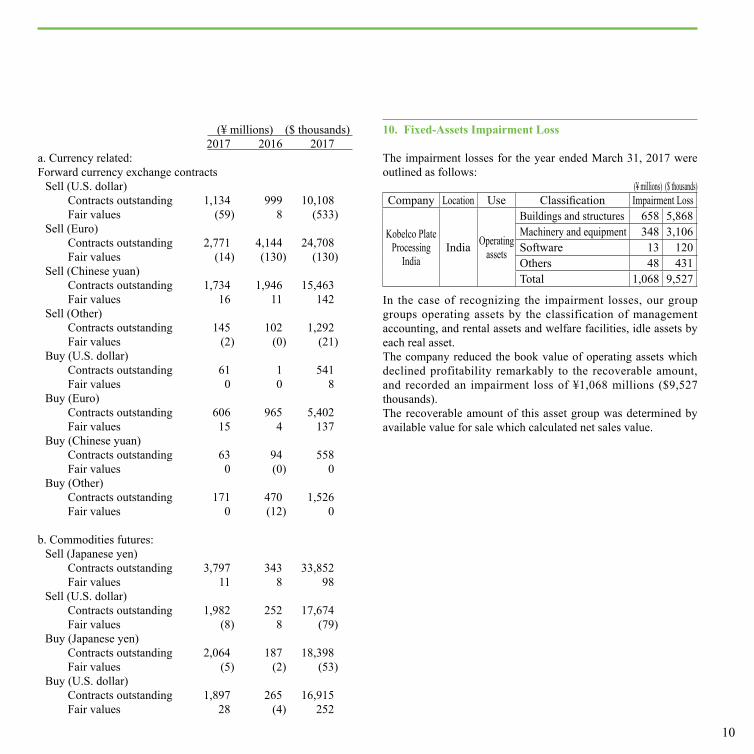
(2) Hedge accounting appliedThe following tables summarize the outstanding contract amounts and fair values of financial derivatives of the Company at March 31, 2017 and 2016, for which hedge accounting has been applied.
10
(¥ millions) ($ thousands) 2017 2016 2017a. Currency related:Forward currency exchange contracts
Sell (U.S. dollar)Contracts outstanding 1,134 999 10,108Fair values (59) 8 (533)
Sell (Euro)Contracts outstanding 2,771 4,144 24,708Fair values (14) (130) (130)
Sell (Chinese yuan)Contracts outstanding 1,734 1,946 15,463Fair values 16 11 142
Sell (Other)Contracts outstanding 145 102 1,292Fair values (2) (0) (21)
Buy (U.S. dollar)Contracts outstanding 61 1 541Fair values 0 0 8
Buy (Euro)Contracts outstanding 606 965 5,402Fair values 15 4 137
Buy (Chinese yuan)Contracts outstanding 63 94 558Fair values 0 (0) 0
Buy (Other)Contracts outstanding 171 470 1,526Fair values 0 (12) 0
b. Commodities futures:Sell (Japanese yen)
Contracts outstanding 3,797 343 33,852Fair values 11 8 98
Sell (U.S. dollar)Contracts outstanding 1,982 252 17,674Fair values (8) 8 (79)
Buy (Japanese yen)Contracts outstanding 2,064 187 18,398Fair values (5) (2) (53)
Buy (U.S. dollar)Contracts outstanding 1,897 265 16,915Fair values 28 (4) 252
10. Fixed-Assets Impairment Loss
The impairment losses for the year ended March 31, 2017 were outlined as follows:
(¥ millions) ($ thousands)Company Location Use Classification Impairment Loss
Kobelco Plate Processing
IndiaIndia Operating
assets
Buildings and structures 658 5,868Machinery and equipment 348 3,106Software 13 120Others 48 431Total 1,068 9,527
In the case of recognizing the impairment losses, our group groups operating assets by the classification of management accounting, and rental assets and welfare facilities, idle assets by each real asset.The company reduced the book value of operating assets which declined profitability remarkably to the recoverable amount, and recorded an impairment loss of ¥1,068 millions ($9,527 thousands). The recoverable amount of this asset group was determined by available value for sale which calculated net sales value.

11
For the year ended March 31, 2016
For the year ended March 31, 2017
For the year ended March 31, 2017
11. Segment information
Notes: The segment is classified with the kind of inventories and the common sales route based on the sales department of the Company.
Iron & Steel Raw Materials Nonferrous MetalsNet sales Outside customers 295,790 240,819 207,942
Inter - segment − − 5Total 295,790 240,819 207,948
Segment profit or loss 3,129 779 1,156Segment assets 111,129 24,317 65,370 Other items Depreciation 621 148 322
Amortization of goodwill − − 29 Interest received 48 22 72Interest expense 244 104 156Equity in earnings of affiliates 274 − 49Loss on impairment of fixed assets − − −Investments in equity method affiliates 4,527 − 650Increase from tangible fixed assets and intangible assets 2,871 115 116
Iron & Steel Raw Materials Nonferrous MetalsNet sales Outside customers 283,364 227,707 200,056
Inter - segment − − 4Total 283,364 227,707 200,061
Segment profit or loss 2,644 1,042 1,425Segment assets 108,794 27,894 69,310Other items Depreciation 700 134 268
Amortization of goodwill − − 57Interest received 35 12 52Interest expense 332 80 125Equity in earnings of affiliates 855 − 73Loss on impairment of fixed assets 1,068 − −Investments in equity method affiliates 5,120 − 649Increase from tangible fixed assets and intangible assets 763 114 96
Iron & Steel Raw Materials Nonferrous MetalsNet sales Outside customers 2,525,753 2,029,656 1,783,195
Inter - segment − − 43Total 2,525,753 2,029,656 1,783,238
Segment profit or loss 23,569 9,288 12,705Segment assets 969,730 248,636 617,799Other items Depreciation 6,247 1,197 2,397
Amortization of goodwill − − 515Interest received 319 110 471Interest expense 2,966 714 1,119Equity in earnings of affiliates 7,628 − 656Loss on impairment of fixed assets 9,527 − −Investments in equity method affiliates 45,643 − 5,790Increase from tangible fixed assets and intangible assets 6,806 1,019 858

12
( Millions of yen )
( Millions of yen )
( Thousands of US$ )
Machinery & Electronics Welding Total Other Corporate / Elimination Consolidated65,001 38,587 848,141 381 (57,180) 791,342
− 5 11 − (11) −65,001 38,593 848,153 381 (57,192) 791,342
689 212 5,967 (38) (9) 5,91831,522 17,078 249,418 346 (4,169) 245,594
154 61 1,308 2 − 1,310130 − 160 − − 16020 12 176 0 (38) 138
115 70 690 1 (38) 653− 11 335 − 5 341− − − − − −− 324 5,501 − − 5,501
84 97 3,286 0 − 3,286
Machinery & Electronics Welding Total Other Corporate / Elimination Consolidated68,170 42,537 821,837 395 (52,751) 769,481
− 4 9 − (9) −68,170 42,542 821,846 395 (52,760) 769,481
112 271 5,496 (31) (216) 5,24835,674 18,866 260,540 304 (3,334) 257,510
121 54 1,280 2 − 1,28298 35 191 − − 19114 9 125 0 (34) 9194 61 694 1 (34) 661− 14 944 − 0 945− − 1,068 − − 1,068− 333 6,104 − − 6,104
70 60 1,105 0 − 1,106
Machinery & Electronics Welding Total Other Corporate / Elimination Consolidated607,637 379,160 7,325,401 3,526 (470,196) 6,858,733
− 40 83 − (83) −607,637 379,200 7,325,484 3,526 (470,280) 6,858,733
1,004 2,421 48,987 (277) (1,928) 46,782317,985 168,165 2,322,315 2,710 (29,722) 2,295,304
1,085 482 11,408 22 − 11,433873 316 1,704 − − 1,706133 87 1,120 2 (305) 818842 544 6,185 12 (305) 5,893
− 131 8,415 − 6 8,424− − 9,527 − − 9,527− 2,977 54,410 − − 54,410
632 540 9,855 3 − 9,859
13
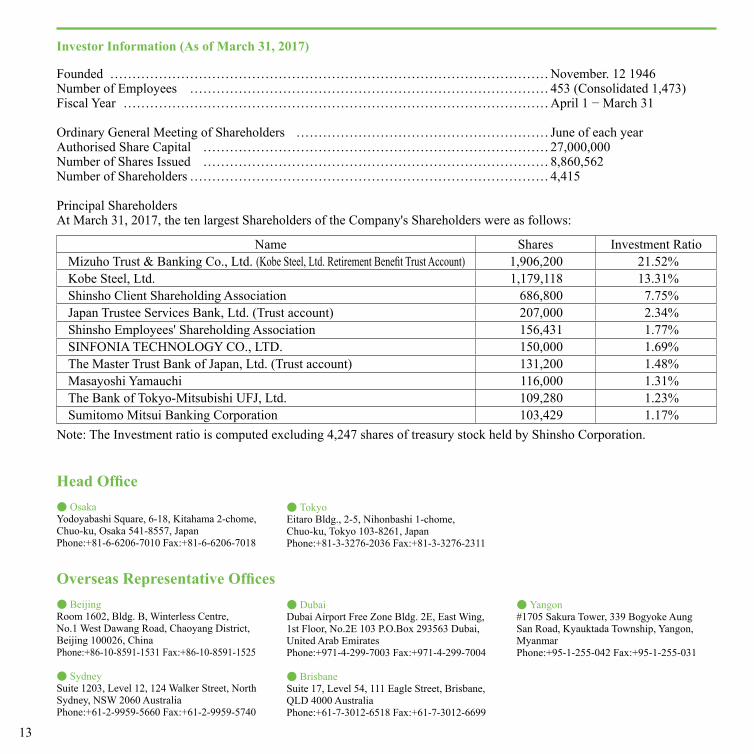
Investor Information (As of March 31, 2017)
Founded ……………………………………………………………………………………… November. 12 1946Number of Employees ……………………………………………………………………… 453 (Consolidated 1,473)Fiscal Year …………………………………………………………………………………… April 1 − March 31
Ordinary General Meeting of Shareholders ………………………………………………… June of each yearAuthorised Share Capital …………………………………………………………………… 27,000,000Number of Shares Issued …………………………………………………………………… 8,860,562Number of Shareholders ……………………………………………………………………… 4,415
Principal ShareholdersAt March 31, 2017, the ten largest Shareholders of the Company's Shareholders were as follows:
Name Shares Investment RatioMizuho Trust & Banking Co., Ltd. (Kobe Steel, Ltd. Retirement Benefit Trust Account) 1,906,200 21.52%Kobe Steel, Ltd. 1,179,118 13.31%Shinsho Client Shareholding Association 686,800 7.75%Japan Trustee Services Bank, Ltd. (Trust account) 207,000 2.34%Shinsho Employees' Shareholding Association 156,431 1.77%SINFONIA TECHNOLOGY CO., LTD. 150,000 1.69%The Master Trust Bank of Japan, Ltd. (Trust account) 131,200 1.48%Masayoshi Yamauchi 116,000 1.31%The Bank of Tokyo-Mitsubishi UFJ, Ltd. 109,280 1.23%Sumitomo Mitsui Banking Corporation 103,429 1.17%
Note: The Investment ratio is computed excluding 4,247 shares of treasury stock held by Shinsho Corporation.
Head Office● OsakaYodoyabashi Square, 6-18, Kitahama 2-chome, Chuo-ku, Osaka 541-8557, JapanPhone:+81-6-6206-7010 Fax:+81-6-6206-7018
● TokyoEitaro Bldg., 2-5, Nihonbashi 1-chome, Chuo-ku, Tokyo 103-8261, JapanPhone:+81-3-3276-2036 Fax:+81-3-3276-2311
Overseas Representative Offices● BeijingRoom 1602, Bldg. B, Winterless Centre,No.1 West Dawang Road, Chaoyang District,Beijing 100026, ChinaPhone:+86-10-8591-1531 Fax:+86-10-8591-1525
● SydneySuite 1203, Level 12, 124 Walker Street, North Sydney, NSW 2060 AustraliaPhone:+61-2-9959-5660 Fax:+61-2-9959-5740
● DubaiDubai Airport Free Zone Bldg. 2E, East Wing,1st Floor, No.2E 103 P.O.Box 293563 Dubai,United Arab EmiratesPhone:+971-4-299-7003 Fax:+971-4-299-7004
● BrisbaneSuite 17, Level 54, 111 Eagle Street, Brisbane, QLD 4000 AustraliaPhone:+61-7-3012-6518 Fax:+61-7-3012-6699
● Yangon#1705 Sakura Tower, 339 Bogyoke Aung San Road, Kyauktada Township, Yangon, MyanmarPhone:+95-1-255-042 Fax:+95-1-255-031

14
Overseas Subsidiaries● SHINSHO AMERICAN CORP.26200 Town Center Drive, Suite 160, Novi, MI 48375, U.S.APhone:+1-248-675-5569 Fax:+1-248-675-5575
● AIKEN WIRE PROCESSING, L.L.C.75 Windham Boulevard, Aiken, SC 29805, U.S.A.Phone:+1-803-641-6091 Fax:+1-803-641-6092
● GRAND BLANC PROCESSING, L.L.C.10151Gainey Drive Holly MI 48442, U.S.A.Phone:+1-810-694-6000 Fax:+1-810-694-5164
● SHINSHO-MEIHOKU WIRE, INC.3475 W. International Court, Columbus, IN 47201, U.S.A.Phone:+1-812-342-2409 Fax:+1-812-342-3257
● SHINSHO MEXICO S.A. DE C.V.Paseo de la Altiplanicie No. 11. Int. 3-A Col. Villas de Irapuato, C.P. 36670, Irapuato, Guanajuato, MexicoPhone:+52-462-104-5019
● KOBELCO CH WIRE MEXICANA, S.A. DE C.V.Circuito Santa Fe No.179 Parque Industrial Santa Fe III, Guanajuato Puerto Interior Silao, Guanajuato C.P.36275 MexicoPhone:+52-472-135-2900
● SC TECH DE MEXICO, S.A. DE C.V.Carretera estatal 431 km 2+200. Lote 63 Modulo 5 Hacienda la machorra (Parque Tecnológico lnnovación). El Marques, Queretaro, 76246, MexicoPhone:+52-442-221-5560 Fax:+52-442-221-5029
● SHINSHO EUROPE GMBHBerliner Allee 55, 40212 Duesseldorf, GermanyPhone:+49-211-4181-960 Fax:+49-211-4181-9629
● KOBELCO TRADING AUSTRALIA PTY. LTD.Suite 1203 Level 12, 124 Walker Street, North Sydney NSW 2060, AustraliaPhone:+61-2-9959-5660 Fax:+61-2-9959-5740
● SHANGHAI SHINSHO TRADING CO., LTD.Suite 802,Gopher Center,No.757,Mengzi Road, Huangpu District, Shanghai 200023, ChinaPhone:+86-21-5396-6464 Fax:+86-21-5396-5975
● KOBELCO TRADING (SHANGHAI) CO., LTD.Suite 802,Gopher Center,No.757,Mengzi Road, Huangpu District, Shanghai 200023, ChinaPhone:+86-21-5396-6464 Fax:+86-21-5396-5975
● KOBELCO PRECISION PARTS (SUZHOU) CO., LTD.No.12 Factory, No. 666 Jianlin Road, Suzhou Hi-Tech District, Jiangsu 215151, ChinaPhone:+86-512-8187-8277 Fax:+86-512-8187-8272
● SHINSHO OSAKA SEIKO (NANTONG) CORPORATIONNo.1 Qing Feng Road Sutong Science and Technology Industrial Park, Nantong, Jiangsu Province, ChinaPhone:+86-513-8919-1055 Fax:+86-513-8919-1056
● NAKAYAMA CORPORATION (SHANGHAI) LIMITEDSuite 804,Gopher Center,No.757,Mengzi Road, Huangpu District, Shanghai 200023, ChinaPhone:+86-21-5187-0002 Fax:+86-21-5081-2428
● THAI ESCORP LTD.1126/2 Vanit Bldg. Ⅱ, Room 2102, 2103, New Petchburi Road., Makkasan, Rajthevee, Bangkok 10400, ThailandPhone:+66-2-254-7645 Fax:+66-2-254-7644
● TES E&M SERVICE CO., LTD.1126/2 Vanit Bldg. Ⅱ, Room 2104, New Petchburi Road., Makkasan, Rajthevee, Bangkok 10400, ThailandPhone:+66-2-254-7645 Fax:+66-2-254-7644
● NAKAYAMA METAL LIMITED1126/2 Vanit Bldg, Ⅱ, Room 2104B, New Petchburi Road, Makkasan, Rajthevee, Bangkok 10400, ThailandPhone:+66-2-255-8537 Fax:+66-2-255-8539
● SHINKO SHOJI SINGAPORE PTE. LTD.8 Shenton Way, #25-03A AXA Tower, Singapore 068811Phone:+65-6220-3329 Fax:+65-6224-4700
● SHINSHO KOREA CO., LTD.9F Bundang Square Bldg. 42, Hwangsaeul-ro 360 bungil, Bundang-gu, Seongnam-si, Gyeonggi-do, Korea 13591Phone:+82-31-707-7915 Fax:+82-31-707-8394
● PT. KOBELCO TRADING INDONESIAWisma Keiai, 7th Floor, Suite 0703 JI. Jend Sudirman Kav.3 Jakarta 10220, IndonesiaPhone:+62-21-572-4325 Fax:+62-21-572-4327
● PT. NAKAYAMAJl.Celebration Boulevard Blok AA 5/26 Grand Wisata, Lambang Jaya, Tambun Selatan, Bekasi 17514, Jawa Barat, IndonesiaPhone:+62-21-8261-5526 Fax:+62-21-8261-5528
● KOBELCO TRADING VIETNAM CO., LTD.Unit 1808, 18th Floor, SUN WAH TOWER 115 Nguyen Hue Boulevard, District 1, Ho Chi Minh City, VietnamPhone:+84-8-3911-0900 Fax:+84-8-3911-0902
● KOBELCO TRADING INDIA PRIVATE LIMITED202-203A, 2nd Floor, Salcon Rasvilas, D-1, District Centre, Saket, New Delhi-110017, IndiaPhone:+91-11-4383-3300 Fax:+91-11-4383-3317
● KOBELCO PLATE PROCESSING INDIA PRIVATE LIMITED2nd Floor, Amble Side, No.8, Khader Nawaz Khan Road, Nungambakkam, Chennai-600 006, IndiaPhone:+91-44-4904-0104 Fax:+91-44-4203-6467
● KTN Co., Ltd.182, Seotan 2-ro, Seotan-myeon, Pyeongtaek-si, Gyeonggi-do, Korea 17704Phone:+82-31-321-4179 Fax:+82-31-321-4189
● SHINSHO (PHILIPPINES) CORP.Unit 2107 Philippine AXA Life Centre, Sen. Gil Puyat Avenue Makati City 1200, PhilippinesPhone:+63-2-848-5171 Fax:+63-2-848-5149
● SHINSHO (MALAYSIA) SDN. BHD.Suite 503, 5th Floor, Kenanga International Building, Jalan Sultan Ismail, 50250 Kuala Lumpur, MalaysiaPhone:+60-3-2161-6588 Fax:+60-3-2161-8228
● TAIWAN SHINSHO CORPORATION7F-2, No.146, Sung Chiang Road., Taipei, 10458 TaiwanPhone:+886-2-2560-1085 Fax:+886-2-2560-1086