Year ended March 31, 2006 Together GARGLE has been the leading brand for more than two decades in...
46
Together Annual Report 2006 Year ended March 31, 2006 with Healthy Life
Transcript of Year ended March 31, 2006 Together GARGLE has been the leading brand for more than two decades in...

Together
Annual Report 2006Year ended March 31, 2006
with
Healthy Life

Competitive
Aiming to be a
Since its establishment in 1916, Meiji Seika Kaisha, Ltd. has contributed
to emphasizing the taste experience and zest in life and through its food
and pharmaceutical operations, has long played a part in helping people
lead happier and more fulfilling lives.
Best known as Japan’s leading manufacturer of chocolate products,
the Food & Health Care Company is recognized as a source of dreams
and good food and helps people lead healthy life. The Pharmaceutical
Company concentrates on providing anti-infectives and central nervous
system drugs for the treatment of diseases, and it has a growing line of
generic drugs. By continuing to expand these two businesses, we are
determined to use our wealth of technology to contribute to healthy life.
As an organization that is closely linked to the preservation of good
health and life, Meiji Seika will continue to fulfill its social
responsibility and provide products that help its customers
lead fulfilling lives while adhering to the highest ethical
standards. At the same time, under the current medium-
term business plan, we will work to raise our corporate
value and become an even more competitive and dynamic
company.
More
Dynamic Companyand
Forward−Looking StatementsThis report contains forward-looking statements regarding the Company’s plans, outlook, strategies and results for the future that are based on management’s estimates, assumptions and projections at the time of publication. Certain risks and uncertainties could cause the Company’s actual results to differ materially from any projections presented in this report. These risks and uncertainties include, but are not limited to, the domestic and international economic circumstances surrounding the Company’s businesses, competitive activity, related laws and regulations, product development programs and changes in exchange rates.

1
Aiming to be a Corporate Philosophy
To help people lead happier and more fulfilling lives
by emphasizing the taste experience and zest in life.
ContentsCorporate Philosophy 1Food & Health Care Company 2 Food 2 Health Care 4Pharmaceutical Company 6Office Building Leasing & Others 8Quality Control / R&D 9Global Operations 10Six-Year Summary 12At a Glance 13To Our Stakeholders 14Corporate Governance and Compliance 20Data File 22
Food & Health Care
Pharmaceuticals
Healthy Life
Dynamic Company Based on this philosophy, we provide products, services and information
in the business domains of food and pharmaceuticals. We are active in
the fields of confections, food, medical care, healthy life, agriculture and
veterinary medicine and the environment.
Management’s Discussion and Analysis 23Consolidated Balance Sheets 28Consolidated Statements of Income 30Consolidated Statements of Shareholders’ Equity 31Consolidated Statements of Cash Flows 32Notes to Consolidated Financial Statements 33Report of Independent Auditors 41Corporate Information 42

Food & Health Care Company
Top Brand That Stands for Good Taste and FunLooking BackSince beginning operations in 1916, Meiji Seika has always worked to supply delicious food products that are one step ahead of market trends.
In 1926, we began selling MILK CHOCOLATE, which soon became our flagship product. The introduction of MARBLE CHOCOLATE in 1961 had an
immediate and significant impact, firmly positioning Meiji Seika as Japan’s premier supplier of
chocolate. With the 1968 launch of KARL, we began the full-scale development of Japan’s snack food market. We then launched CHELSEA in 1971 and KAJU GUMMY in
In July 2005, Meiji Seika combined its Food Company and its Health Care Company into a unified organization called the Food & Health Care Company. The objective of this integration is to use the Group’s resources to create a highly distinctive business model in the field of health care, a drive that includes building deeper ties with the Pharmaceutical Company.
We are increasing the exchange of personnel with the Pharmaceutical Company. Specifically, in R&D, we are building a framework capable of constantly utilizing the know-how of our pharmaceutical business in health-related compounds and clinical development, as well as information extending from medical institutions to health maintenance. Such efforts are aimed at maximizing synergies across the food and pharmaceutical businesses to benefit our health care business.
Further Enhancing
Reliability
MILK CHOCOLATE
2
Value-Added Products that Reflect a Devotion to Good Health
and SafetyFOOD
CHELSEA
MARBLE CHOCOLATE
1988, which created new
categories of the candy market. In 1997, we began
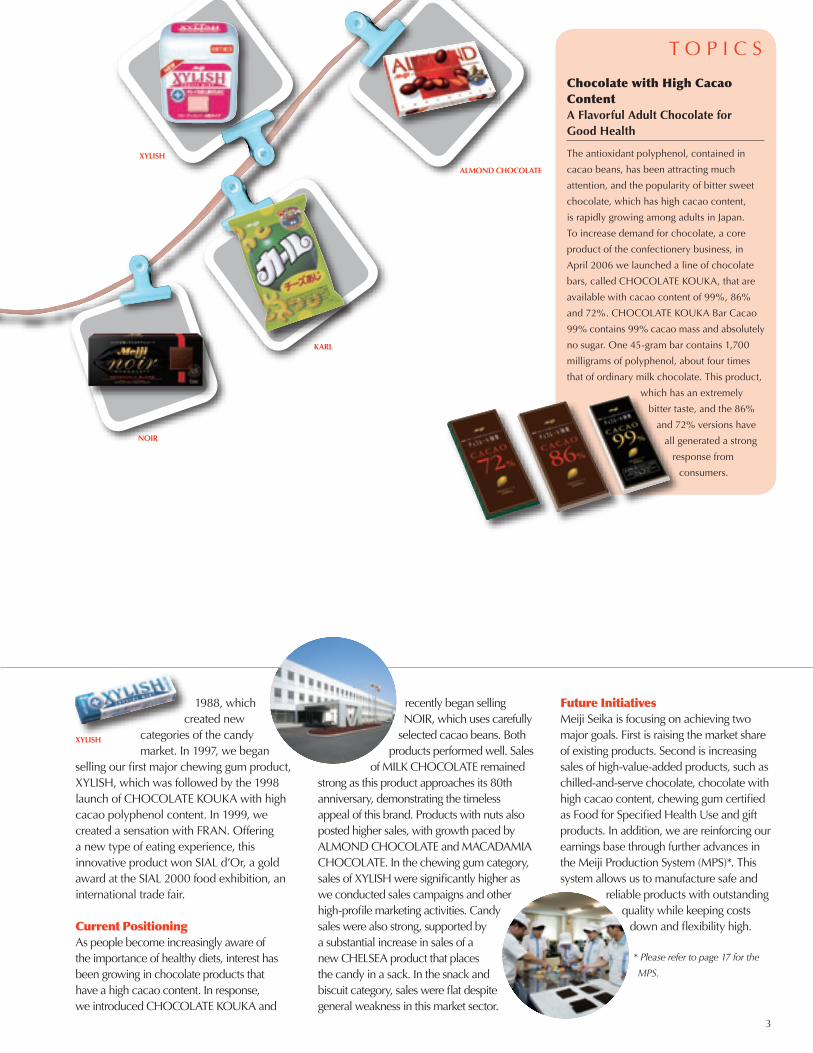
selling our first major chewing gum product, XYLISH, which was followed by the 1998 launch of CHOCOLATE KOUKA with high cacao polyphenol content. In 1999, we created a sensation with FRAN. Offering a new type of eating experience, this innovative product won SIAL d’Or, a gold award at the SIAL 2000 food exhibition, an international trade fair.
Current Positioning As people become increasingly aware of the importance of healthy diets, interest has been growing in chocolate products that have a high cacao content. In response, we introduced CHOCOLATE KOUKA and
recently began selling NOIR, which uses carefully
selected cacao beans. Both products performed well. Sales
of MILK CHOCOLATE remained strong as this product approaches its 80th anniversary, demonstrating the timeless appeal of this brand. Products with nuts also posted higher sales, with growth paced by ALMOND CHOCOLATE and MACADAMIA CHOCOLATE. In the chewing gum category, sales of XYLISH were significantly higher as we conducted sales campaigns and other high-profile marketing activities. Candy sales were also strong, supported by a substantial increase in sales of a new CHELSEA product that places the candy in a sack. In the snack and biscuit category, sales were flat despite general weakness in this market sector.
Future InitiativesMeiji Seika is focusing on achieving two major goals. First is raising the market share of existing products. Second is increasing sales of high-value-added products, such as chilled-and-serve chocolate, chocolate with high cacao content, chewing gum certified as Food for Specified Health Use and gift products. In addition, we are reinforcing our earnings base through further advances in the Meiji Production System (MPS)*. This system allows us to manufacture safe and
reliable products with outstanding quality while keeping costs
down and flexibility high.
* Please refer to page 17 for the
MPS.
3
Chocolate with High Cacao ContentA Flavorful Adult Chocolate for Good Health
The antioxidant polyphenol, contained in
cacao beans, has been attracting much
attention, and the popularity of bitter sweet
chocolate, which has high cacao content,
is rapidly growing among adults in Japan.
To increase demand for chocolate, a core
product of the confectionery business, in
April 2006 we launched a line of chocolate
bars, called CHOCOLATE KOUKA, that are
available with cacao content of 99%, 86%
and 72%. CHOCOLATE KOUKA Bar Cacao
99% contains 99% cacao mass and absolutely
no sugar. One 45-gram bar contains 1,700
milligrams of polyphenol, about four times
that of ordinary milk chocolate. This product,
which has an extremely
bitter taste, and the 86%
and 72% versions have
all generated a strong
response from
consumers.
T O P I C S
NOIR
KARL
ALMOND CHOCOLATE
XYLISH
XYLISH

Food & Health Care Company
Support for a Healthy Life
For decades, Meiji Seika has conducted its food and pharmaceutical businesses by placing safety and reliability above all else. Through these core businesses, we have gained much expertise in delivering proven efficacy and good taste. We are now leveraging this know-how to develop health
care into a new core business. While existing technologies and research work will form the basis for this business, our health care operations will also constantly evolve and advance in response to trends in our markets and
society. Our objective is to strengthen our presence in the health care business by
introducing distinctive products that reflect the themes of good health, functionality and good taste.
Looking BackIn the food category, Meiji Seika has many accomplishments, including the 1926 beginning of cocoa production and sales and the 1954 introduction of Japan’s first canned juice. Today, we supply a wide range of food products including cocoa and other beverages, GINZA CURRY and other retort-pouch products, powdered soups, and many other products.
We also supply food products that perform specific functions for people’s health. SAVAS, which incorporates protein and other nutritional components, has been popular with Olympic and other top athletes for many years. LOLA chewable
GINZA CURRY
4
HEALTH CARE
CASSIS-i
SAVAS
MILK COCOA
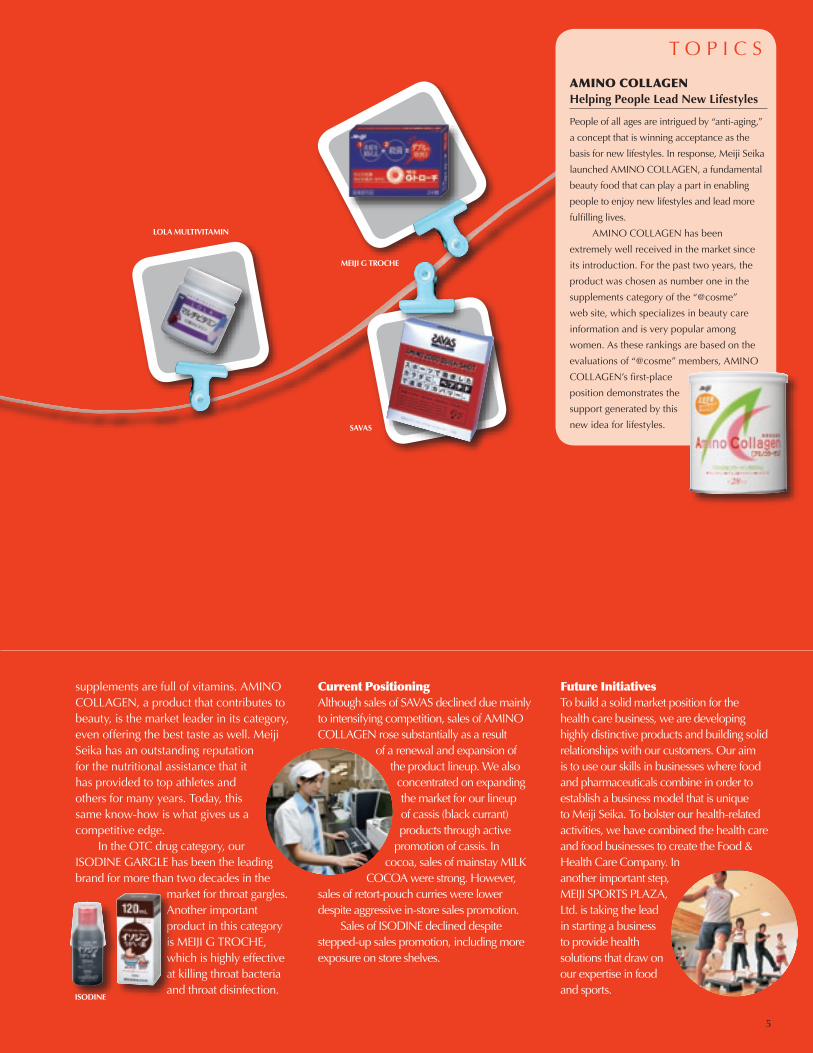
supplements are full of vitamins. AMINO COLLAGEN, a product that contributes to beauty, is the market leader in its category, even offering the best taste as well. Meiji Seika has an outstanding reputation for the nutritional assistance that it has provided to top athletes and others for many years. Today, this same know-how is what gives us a competitive edge.
In the OTC drug category, our ISODINE GARGLE has been the leading brand for more than two decades in the
market for throat gargles. Another important product in this category is MEIJI G TROCHE, which is highly effective at killing throat bacteria and throat disinfection.
Current PositioningAlthough sales of SAVAS declined due mainly to intensifying competition, sales of AMINO COLLAGEN rose substantially as a result
of a renewal and expansion of the product lineup. We also concentrated on expanding the market for our lineup of cassis (black currant) products through active
promotion of cassis. In cocoa, sales of mainstay MILK
COCOA were strong. However, sales of retort-pouch curries were lower despite aggressive in-store sales promotion.
Sales of ISODINE declined despite stepped-up sales promotion, including more exposure on store shelves.
Future InitiativesTo build a solid market position for the health care business, we are developing highly distinctive products and building solid relationships with our customers. Our aim is to use our skills in businesses where food and pharmaceuticals combine in order to establish a business model that is unique to Meiji Seika. To bolster our health-related activities, we have combined the health care and food businesses to create the Food & Health Care Company. In another important step, MEIJI SPORTS PLAZA, Ltd. is taking the lead in starting a business to provide health solutions that draw on our expertise in food and sports.
5
AMINO COLLAGEN Helping People Lead New Lifestyles
People of all ages are intrigued by “anti-aging,”
a concept that is winning acceptance as the
basis for new lifestyles. In response, Meiji Seika
launched AMINO COLLAGEN, a fundamental
beauty food that can play a part in enabling
people to enjoy new lifestyles and lead more
fulfilling lives.
AMINO COLLAGEN has been
extremely well received in the market since
its introduction. For the past two years, the
product was chosen as number one in the
supplements category of the “@cosme”
web site, which specializes in beauty care
information and is very popular among
women. As these rankings are based on the
evaluations of “@cosme” members, AMINO
COLLAGEN’s first-place
position demonstrates the
support generated by this
new idea for lifestyles.
T O P I C S
ISODINE
MEIJI G TROCHE
LOLA MULTIVITAMIN
SAVAS

6
Pharmaceutical Company
6
Looking BackOur pharmaceutical business dates back to 1946 when we began surface fermentation of penicillin. We subsequently began deep tank fermentation of penicillin, resulting in a dramatic advance in production technology. In 1950, we launched Streptomycin, which played an important part in reducing the incidence of tuberculosis in Japan.
In 1958, we developed Kanamycin, the first antibiotic from Japan to be used on a global scale. This was the first step in adding products using our own technologies to our lineup of ethical pharmaceuticals. Since then, we have developed and sold many more outstanding antibiotics, in the process helping improve medical care around the world.
Drawing on our expertise in antibiotics, we extended our scope of activity to include other ethical drugs, OTC drugs, agricultural
A Focus on
DrugsOur Distinctive Approach to Helping People Stay Healthy
and Generic Drugs
The Pharmaceutical Company bases its activities on a steadfast commitment to contribute to good health and health care. Our primary objective is to supply effective, high-quality drugs quickly to individuals who are fighting various diseases. Reflecting this spirit, pharmaceutical activities at the Meiji Seika Group are guided by its mission “To help people lead happier and more fulfilling lives.”
Central nervous system drug DEPROMEL
Anti-infectiveMEIACT
New

7
chemicals and veterinary drugs. One highlight is ISODINE, a topical antiseptic that went on sale in 1961 and is now widely used.
Current PositioningIn the ethical pharmaceuticals field, Meiji Seika supplies many outstanding antibiotics, such as HABEKACIN, Japan’s first treatment for methicillin-resistant Staphylococcus aureus (MRSA) infections, and MEIACT, an orally active cephalosporin. More recently, we have concentrated on anti-infectives and central nervous system drugs to create new drugs outstandingly efficacious and safe by new mechanisms and concepts. In the area of generic drugs, health care professionals give Meiji Seika high
marks for extensive information provided by our team of medical representatives (MRs) and our specialized product lineup.
In agricultural chemicals, we sell distinctive products and
materials. One of the best known is ORYZEMATE, a herbicide that protects rice against blast. In veterinary drugs, we supply anti-infectives, fructo-oligosaccharide (FOS) and other functional materials and enzymes for animal feed, thus helping maintain safe and stable food supplies. In recent years, we have also begun selling drugs and nutrition supplements for companion animals such as dogs, cats and other small animals.
Future InitiativesQuickly and successfully commercializing new drugs under development is a high priority of the Pharmaceutical Company. Another important priority is enlarging the generic drug business, which is positioned to expand as the government continues to take measures to hold down growth in medical care expenses. Activities are focused on raising the number of generic drugs that match specific medical needs and effectively using the entire MR team to promote our generic products. By
rapidly establishing a sound base for our generic drug business, we
intend to achieve our annual sales target of ¥10 billion and to grow as a “specialty and generic pharmaceutical”
company.
Agricultural chemical ORYZEMATE
ME1211 The World’s First Oral Carbapenem Antibiotic
The antibiotic ME1211, which we license from
Wyeth K.K., has completed Phase IIb clinical
trials. We expect the drug to be approved in
the Japanese market by the fiscal year ending
March 31, 2009. It will be the world’s first
carbapenem antibiotic for oral administration.
ME1211 is an oral carbapenem prodrug
with a wide antibacterial spectrum covering
both gram-positive and gram-negative
bacteria. It also exhibits potent activity
against penicillin-resistant Streptococcus
pneumoniae (PRSP), thus making it a
promising candidate for use in the area
of pediatric respiratory tract infections.
Clinical development of this pharmaceutical
was based on PK/PD (Pharmacokinetic/
Pharmacodynamic) analysis, a first in Japan.
Clinical research continues with the aim
of launching ME1211 in the market at the
earliest date.
T O P I C S
● The world’s first oral carbapenem (treatment of respiratory tract infections)
● Preparing for Phase III clinical trials, beginning with pediatric development
● Injectable carbapenem antibiotic (treatment of MRSA and other serious infections)
● Development in North America preceding other areas● Aminoglycoside injectable antibiotic (treatment of serious infections)● Good prospects for outstanding efficacy and greater convenience in
clinical use, developing changes in indication and dosage (one dose per day)
● Japan’s first anti-depressant anti-anxiety with a new mechanism (NaSSA) ● Completed Phase IIb trials, which confirmed efficacy vs. placebo
● Treatment for hepatitis C (indication for prevention of death of liver cells, indication for control of immune system)
● Now in Phase IIa trials using a preparation having improved oral absorption
● Nose anti-inflammatory drug● Considering a licensing partner
ME1211
ME1036
Org3770
ME3738
ME3301
Phase IIb completed
Preclinical
Phase III
Phase IIb completed
Phase IIa ongoing
List of Products under Development
Ant ibac ter ia l Agent
Phase IIa completed
HABEKACIN
Central nervous system drug MEILAX
Anti-infectiveHABEKACIN
Development Code Indication and Notes Stage
Depress ion
Others
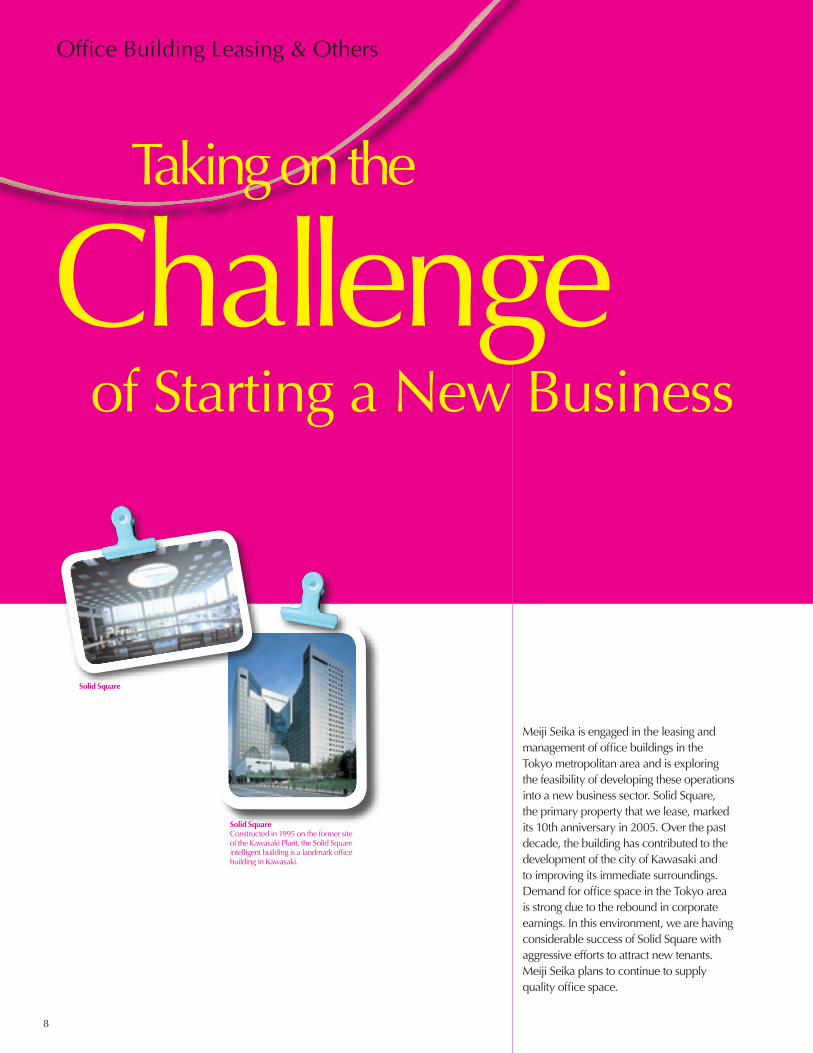
Meiji Seika is engaged in the leasing and management of office buildings in the Tokyo metropolitan area and is exploring the feasibility of developing these operations into a new business sector. Solid Square, the primary property that we lease, marked its 10th anniversary in 2005. Over the past decade, the building has contributed to the development of the city of Kawasaki and to improving its immediate surroundings. Demand for office space in the Tokyo area is strong due to the rebound in corporate earnings. In this environment, we are having considerable success of Solid Square with aggressive efforts to attract new tenants. Meiji Seika plans to continue to supply quality office space.
Solid Square
Solid SquareConstructed in 1995 on the former site of the Kawasaki Plant, the Solid Square intelligent building is a landmark office building in Kawasaki.
Office Building Leasing & Others
8
Taking on the
Challenge of Starting a New Business

9
Quality Control / R&D
The Meiji Seika Quality Control SystemIn addition to prioritizing taste, we also place much importance on safety and reliability when producing our confectionery and food products. Further, we are acutely aware of the critical role that our pharmaceuticals play in keeping people healthy and in saving the precious life of people. This is why we have highly sophisticated control systems for manufacturing and quality assurance.
All Meiji Seika confectionery and food factories have received ISO 9001 certification, an international standard for quality management systems. Our factories perform all tasks—from the selection of raw materials and packaging to shipment and logistics—under stringent quality control standards.
At all of our pharmaceutical plants, manufacturing activities conform to the strict standards of Good Manufacturing Practice and Good Quality Practice. Quality management and quality assurance departments that are independent of manufacturing divisions monitor activities to verify this compliance.
Research & Development at Meiji SeikaWe conduct extensive R&D activities based on the central theme of remaining a source of products that offer good taste and health.
To offer customers exciting flavors and more health-related functions, the Food and Health R&D Laboratory develops products that use new technologies to create new forms of value.
The Pharmaceutical Research Center applies unique core technologies and skills to develop new products for preserving the precious life of people and people’ s “Quality of Life.” The Microbiological Resource & Technology Laboratory uses microbiological resources to help create new drugs and raise productivity at factories. Meanwhile, the Agricultural & Veterinary Research Laboratory is dedicated to the research and development of high-quality agricultural chemicals and veterinary drugs that are ecologically sound and safe.
Constantly conducting these research activities allows us to achieve steady progress in targeted fields while making meaningful contributions to society.
Dedicated to Remaining a Source of Reliable and Exciting Products
The Company’s operations center on food and pharmaceuticals—vital elements of people’s lives and of effective health care. To fulfill our responsibilities, we have production and quality assurance systems that put safety and reliability above all else. Furthermore, we have an aggressive R&D program that allows us to remain a source of good taste, good times, good health and big dreams.
Challenge of Starting a New Business
Creating good taste and fun
Food & Health Care✲ New product development✲ Manufacturing technology
development✲ Product quality research✲ Physical property research✲ Use of survey data✲ Development of equipment✲ Design of packaging✲ Assessment of food functions✲ Sports nutrition research✲ Nutrition physiology research✲ Search for new materials✲ Applied microbiology
Developing of pharmaceuticals that meet specific health care needs
Pharmaceuticals✲ Fermentation production
technology✲ Chemical synthesis technology✲ Microbe library✲ Drug dispensing development
technology✲ Analytic technology✲ Genetic modification technology✲ Compound bank✲ Separation and refinement
technology
Major Research Activities

Global Operations
10
Food & Health Care CompanyIn the United States, Meiji Seika became a shareholder of D.F. Stauffer Biscuit Co., Inc. in 1990 and made this company a wholly owned subsidiary in 2004. Stauffer Biscuit is performing well currently with concentrating on enlarging its sales channels as it narrows its lineup to a selection of key products.
In Asia, Meiji Seika (Singapore) Pte. Ltd. was established in 1974 to conduct business locally and in neighboring countries, and its operations have grown steadily. The company is developing a new business following the 2006 completion of a factory to manufacture milk powder preparations. In 2001, we established P.T. Ceres Meiji Indotama in Indonesia. Operations in China are conducted by Guangzhou Meiji Confectionery Co., Ltd., established in 1993, and Meiji Seika (Shanghai) Co., Ltd., established in 2004, and we are working to expand out presence in this market.
Pharmaceutical CompanyOverseas operations began in 1954 with the export of antibiotics. Today, Meiji Seika-brand drugs, such as MEIACT and FOSMICIN, are sold in more than 60 countries.
Accompanying growth in the scale of our operations in Asia, we set up production bases in Indonesia, P.T. Meiji Indonesian Pharmaceutical Industries in 1974, and in Thailand, Thai Meiji Pharmaceutical Co., Ltd. in 1979, thereby allowing is to develop multinational supply capabilities in various countries. In China, we established Shantou Meiji Pharmaceuticals Co., Ltd., in 1989 for the manufacture and sale of antibiotics, cancer drugs and other products. In a more recent step to grow our operations in China, we formed Meiji Lukang Pharmaceutical Co., Ltd., in 2004. In Europe, our base of operations for the European Union market is Tedec-Meiji Farma S.A., which we established in Spain in 1991.
Worldwide Contributions in Food and Pharmaceutical Markets
Businesses that seek to provide good taste and health and dreams have no boundaries.
Meiji Seika works closely with the people in every country in which it operates to manufacture locally and actively imports and exports its products to meet local needs.
Head Office
Food & Health Care Company
Pharmaceutical Company
Office
Others
Mecor, Inc
Laguna Cookie Co., Inc.A wholly owned subsidiary of D.F. Stauffer Biscuit Co., Inc. that manufactures and markets biscuits

Meiji Seika Kaisha, Ltd.,London Office
Béghin Meiji
Meiji Seika Kaisha, Ltd.,Beijing Office
Meiji Seika Kaisha, Ltd.,Head Office
Meiji Seika(Shanghai) Co., Ltd.
Shantou MeijiPharmaceuticalsCo., Ltd.
D.F. Stauffer Biscuit Co., Inc. A leading manufacturer of cookies, including animal cookies, and crackers
P.T. Ceres Meiji IndotamaProduces and markets chocolate biscuits
P.T. Meiji Indonesian Pharmaceutical IndustriesProduces and markets pharmaceuticals in Southeast Asia
Meiji Seika (Singapore) Pte. Ltd.Produces and markets confectioneries including Yan Yan for various markets worldwide
Tedec-Meiji Farma S.A. (Spain)Manufactures and markets pharmaceuticals in Europe
Thai Meiji Pharmaceutical Co., Ltd. Produces and markets pharmaceuticals and animal health products in Southeast Asia
Meiji Lukang Pharmaceutical Co., Ltd.
Guangzhou Meiji Confectionery Co., Ltd. Produces and markets chocolate biscuits for the domestic Chinese market
11
Comércio e Indústria Uníquimica Ltda.

1212
For the Year:Net sales
Food & Health Care
Pharmaceutical
Office building leasing
Others
Operating income
Net income (loss)
Capital expenditures
Depreciation and amortization
R&D costs
Per Share Data :Net income (loss)
Cash dividends
Shareholders’ equity
At Year-End:Total assets
Shareholders’ equity
Ratios (%):ROE
ROA
Equity ratio
Note: The figures of Food & Health Care from 2001 to 2005 are based on the combined results of the Food Company and Health Care Company.
Millions of Japanese yen
2006 2005 2004 2003 2002 2001
¥382,429
264,410
115,388
2,630
—
16,460
8,678
14,394
14,976
16,578
¥ 22.41
10.00
413.53
¥348,281
157,761
5.7
2.5
45.3
¥353,453
245,838
103,037
3,041
1,535
5,503
2,670
13,260
15,086
17,738
¥ 6.83
7.00
395.31
¥317,798
152,222
1.7
0.8
47.9
¥361,866
244,858
110,692
3,080
3,234
13,042
5,887
17,731
14,798
18,838
¥ 15.20
7.00
404.68
¥336,932
155,990
3.7
1.7
46.3
¥358,898
233,827
117,872
3,035
4,163
17,990
6,880
14,472
15,096
17,667
¥ 17.68
7.00
408.87
¥341,350
158,407
4.5
2.0
46.4
¥364,018
251,860
109,530
2,627
—
8,717
(8,240)
19,827
14,750
16,852
¥ (21.53)
7.00
377.78
¥339,848
144,837
—
—
42.6
¥368,865
257,315
108,504
2,706
338
7,881
348
16,537
13,892
16,688
¥ 0.79
7.00
403.33
¥330,059
154,549
0.2
0.1
46.8
Six-Year SummaryMeiji Seika Kaisha, Ltd. and its Consolidated SubsidiariesYears ended March 31
Yen

13
At a Glance
Market Position
● Japan’s number one chocolate brand
● Strengths in confectionery, candy and chewing gum
● Expanding cocoa, retort-pouch and other food categories
● Comprehensive quality assurance system for safe, reliable products
● ISODINE OTC throat gargle 65% market share
● Ties with top athletes supported by Sports and Nutrition Laboratory
Target of Fiscal 2008
● Supply more appealing products and increase market share
● Establish new business model centered on healthy life
● Net sales: ¥320 billion
Strategies
Confectionery● Reinforce sales channel specific initiatives
centered on brand strategies● Extend business activities to chilled-and-serve,
catalog sales and other new market sectors
Health Care● Strengthen and develop core health food brands● Use catalog sales and specialty sales routes to
enlarge sales channels● Create health business that integrates food and
sports
Overseas ● Strengthen overseas businesses● Establish production and sales networks in China● Establish presence in new markets in Asia
Share of Fiscal 2005
69.1%
Food & Health Care Company
Market Position
● Strong lineup of anti-infectives
● Lineup of central nervous system drugs with high demand growth potential in Japan
● Expanding range of high-quality, reasonably priced generic drugs
● Strong market presence in agricultural chemicals and veterinary drugs
Target of Fiscal 2008
● Establish “specialty and generic pharmaceutical” business
● Net sales: ¥120 billion
Strategies
Ethical pharmaceuticals● Increase sales by enhancing sales capabilities
and bolstering LCM ● Concentrate on high-priority R&D projects,
control total costs and expedite project results
Generic drugs● Expand product lineup● Conduct promotional activities using all MRs
to grow business
Agricultural chemicals and veterinary drugs● Establish a stronger presence in drugs and
nutrition supplements
Overseas ● Enhance appeal of MEIACT and launch product
sales in new markets● Set up production and sales networks for
business expansion in China
Share of Fiscal 2005
30.2%
Pharmaceutical Company
Market Position
● Strong tenant support of Solid Square intelligent building
Target of Fiscal 2008
● Raise property asset value by increasing occupancy rate
Strategies
● Focus on attracting new tenants
Share of Fiscal 2005
0.7%
Office Building Leasing & Others

14
To Our Stakeholders
Naotada SatoPresident
A Significant Improvement in ProfitabilityDuring the fiscal year ended March 31, 2006, the Meiji Seika Group conducted aggressive business
activities focused on the domain of “health.” In July 2005, we launched the Food & Health Care
Company and subsequently took other initiatives to become even more competitive and to achieve
growth in sales and a recovery in profitability. As a result, consolidated net sales rose 5.1% from the
previous fiscal year, to ¥382,429 million.
Several factors contributed to an improvement in earnings, including net sales growth that was
centered on core products and structural reforms that brought down costs. The benefits of these and
other factors lifted operating income 88.8%, to ¥16,460 million. Net income was ¥8,678 million
compared with the previous fiscal year’s net loss of ¥8,240 million.

15
The Final Year of “Challenge 2005”—Building a Base for Pursuing Aggressive Management“Challenge 2005” is the three-year business plan that we commenced in June 2003, when I became
president, and completed in March 2006.
We initiated this plan at a time of crisis. Meiji Seika had seen its earnings drop dramatically for two
consecutive years and “Challenge 2005” was formulated to end this decline. The plan’s first two years,
which ended in March 2005, was a period of transformation. Everyone at the Company worked toward
achieving a V-shaped recovery in our profit structure through rigorous structural reforms and active business
development. Such efforts involved making many difficult decisions. We reorganized our production bases,
and we reduced our workforce by introducing an early retirement support system. Moreover, a radical
change in our pension system resulted in the lump-sum amortization of unrecognized obligation. Following
the implementation of these measures, we turned to aggressive management in the plan’s final year. Although
we did not reach our net sales target, net income exceeded our target for the final year of “Challenge 2005.”
Looking back over this three-year period, I believe there were two particularly significant
accomplishments. First, we completed the plan without any mid-course adjustments. Second, we established
a foundation for becoming a more competitive and dynamic company. As this second point has no final goal,
we will advance one step at a time toward fulfilling the goals of our new medium-term business plan.
0
100
200
300
400
0
1000
2000
3000
4000368.9 364.0
382.4
358.9
’04 ’05 ’060
1000
2000
3000
4000
3,5353,689 3,640
3,824
FY ’03 ’04 ’05 ’06
Net Sales (¥ Billions)
0
5
10
15
20
0
1000
2000
3000
4000
55
7.98.7
16.5
358.9
’04 ’05 ’060
50
100
150
200
55
7987
165
FY ’03 ’04 ’05 ’06
Operating Income (¥ Billions)
0
2
4
6
8
10
0
1000
2000
3000
4000
27
0.3
(8.2)
8.7
358.9
’04 ’05 ’06
0
20
40
60
80
100
27
3
(82)
87
FY ’03 ’04 ’05 ’06
Net Income (Loss) (¥ Billions)
“Challenge 2005” Final-Year Objectives and Achievements Medium-term business plan’s targets Results
Net sales ¥400,000 ¥382,429
Net income ¥7,000 ¥8,678
(¥ Millions)
Three-Year Performance
Performance under “Challenge 2005”
16
To Our Stakeholders
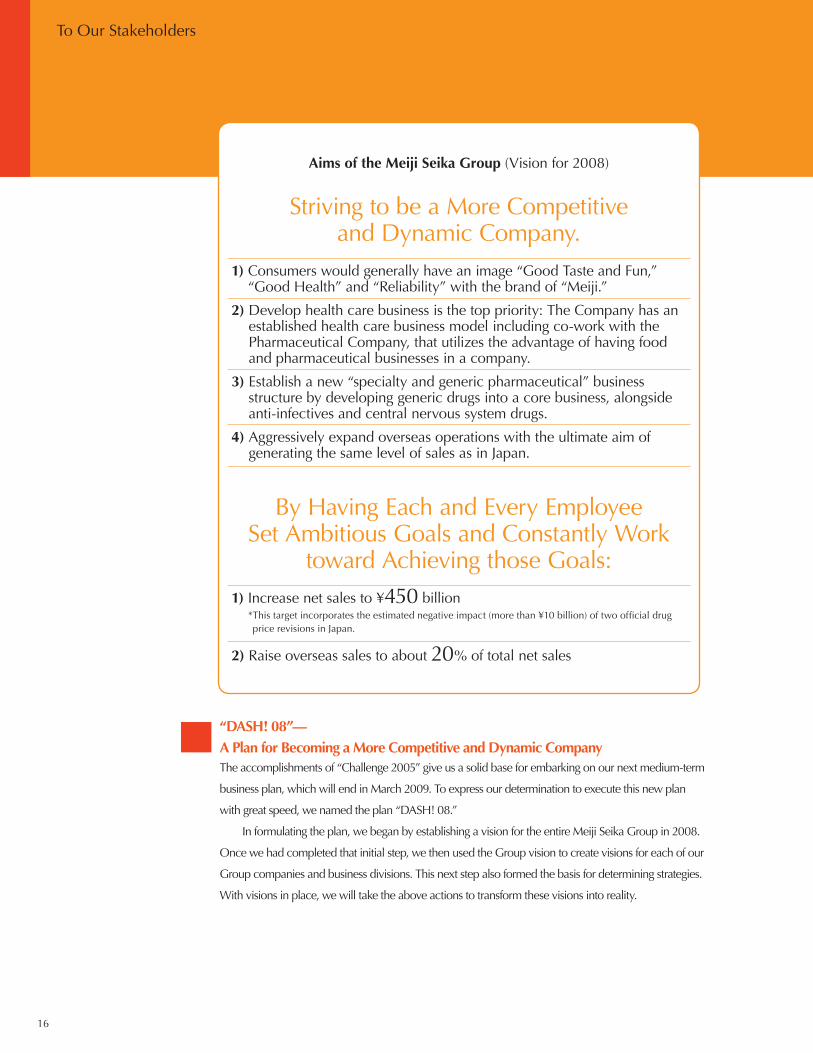
“DASH! 08”—A Plan for Becoming a More Competitive and Dynamic CompanyThe accomplishments of “Challenge 2005” give us a solid base for embarking on our next medium-term
business plan, which will end in March 2009. To express our determination to execute this new plan
with great speed, we named the plan “DASH! 08.”
In formulating the plan, we began by establishing a vision for the entire Meiji Seika Group in 2008.
Once we had completed that initial step, we then used the Group vision to create visions for each of our
Group companies and business divisions. This next step also formed the basis for determining strategies.
With visions in place, we will take the above actions to transform these visions into reality.
Aims of the Meiji Seika Group (Vision for 2008)
Striving to be a More Competitiveand Dynamic Company.
1) Consumers would generally have an image “Good Taste and Fun,” “Good Health” and “Reliability” with the brand of “Meiji.”
2) Develop health care business is the top priority: The Company has an established health care business model including co-work with the Pharmaceutical Company, that utilizes the advantage of having food and pharmaceutical businesses in a company.
3) Establish a new “specialty and generic pharmaceutical” business structure by developing generic drugs into a core business, alongside anti-infectives and central nervous system drugs.
4) Aggressively expand overseas operations with the ultimate aim of generating the same level of sales as in Japan.
By Having Each and Every Employee Set Ambitious Goals and Constantly Work
toward Achieving those Goals:1) Increase net sales to ¥450 billion * This target incorporates the estimated negative impact (more than ¥10 billion) of two official drug
price revisions in Japan.
2) Raise overseas sales to about 20% of total net sales

17
A More Powerful Product Lineup and Higher Market Share in the Confectionery Business
In terms of product categories, we will concentrate on strengthening our chocolate and chewing gum
operations in order to raise our market share. For some time, we have been aiming for a 30% share of
Japan’s chocolate candy market. Market conditions are favorable, and there is growing interest in Japan
in regions of the world that produce cacao beans and in high cacao content. We will take full advantage
of our powerful brand name, which is our greatest strength. We intend to reach our market share target
by adding to our lineup of high-value-added products for adults and distinctive products, such as chilled-
and-serve chocolate products.
To raise our share of the chewing gum market, we are executing two initiatives. The first is to raise
the market share of existing products. The second is to increase the presence of our products in the
high-value-added category, such as chewing gum that is certified as Food for Specified Health Use. To
strengthen manufacturing, the Meiji Production System (MPS)* will be used at all our factories and we
will make a total of about ¥10 billion in capital investment. By adopting this production system, we will
raise product quality and achieve an estimated annual cost saving of about ¥3 billion in the fiscal year
ending March 2009. Meiji Seika will be much more competitive as a result.
* The Meiji Production System (MPS) is a manufacturing and logistics system that gives Meiji Seika a sound base for maintaining a profitable operating framework. Two elements of the system are the use of an internal company system, similar to the Kanban system employed at Toyota, and a cell production system, similar to the one utilized at Canon. Going even farther, Meiji Seika is building a Food & Health Care Company production and logistics system that can fully meet the needs of consumers as well as the entire supply chain.
Establishing a New Business Model Centered on Health
We are implementing strategies that will expand our health care business. Concentrating resources on
core brands is one strategy. Another is working on the enlargement of our sales channels by focusing on
catalog sales and specialty sales routes. To successfully achieve further business growth, it is vital that we
assemble a highly distinctive business model.
Nutrition and exercise are directly linked to good health. For many years, we
have been involved in these two aspects of healthy living and this experience sets
us apart from competitors. Meiji Seika is particularly skilled with regard to nutrition
for athletes. We will draw on this know-how to conduct a health solutions business
based on a new concept—the integration of food and sports. One step in this
direction will be the fall 2006 opening of the new “Meiji Sports Plaza” (Takatsuki,
Osaka), a part of our 90th anniversary activities. We will offer individualized
consultations to identify the nutrition and exercise needs of each customer. This interaction with
customers will enable us to provide them with counseling that covers both food and exercise. Applying
our expertise in supporting athletes to the sports activities of the general public is another business field
that offers much potential.
18
To Our Stakeholders
A Specialty and Generic Pharmaceutical Business
Until now, our pharmaceutical business has focused on anti-infectives and central nervous system drugs.
Going forward, we will remain committed to these fields, and at the same time we will strengthen our
generic drug business with the aim of establishing a new business structure rooted in specialty and
generic pharmaceuticals. There are two reasons to strengthen our generic drug business. First, we have
a competitive advantage because, as a producer of new drugs, we have been involved in generic drugs
for about 10 years. Second, market conditions for generic drugs in Japan are becoming increasingly
favorable as a result of government measures to hold down medical expenses. Moreover, generic
drugs account for only about 15% of Japan’s total pharmaceutical sales in terms of volume and 5% in
monetary terms. In the United States, these figures are about 53% and 12%, respectively. In the near
future, Japan is likely to approach these levels. Thus, by bolstering our generic drug capabilities now, we
will be positioned to capitalize on emerging market opportunities.
Regarding specialty drugs, our goal is to bring to market new drugs as quickly as possible while
raising sales by strengthening our marketing capabilities. Our R&D programs will focus on the most
attractive projects, and we will execute these programs swiftly. Additionally, we will take steps to
improve our product life cycle management to further increase sales.
We are determined to rapidly put this new business structure in place by working to increase the
number of distinctive generic drugs that meet medical needs while actively promoting those products
by using our entire team of medical representatives (MRs). In this way, we will lay the foundations for a
successful specialty and generic pharmaceutical business.
Aggressive Expansion Outside Japan
Japan’s markets for confectionery and pharmaceuticals are unlikely to grow. That means we must
increase our share of overseas markets to sustain our growth. Accordingly, our goal is to continue to
expand operations in China and other Asian countries, in North America, and in other regions. Over the
next three years, we aim to raise overseas sales to about 20% of total net sales. In China, in particular,
we are taking steps to strengthen our manufacturing and sales infrastructures, and in August 2006 a new
confectionery factory began operations on the outskirts of Shanghai.

19
Corporate Social Responsibility (CSR)—Our Commitment to Corporate Citizenship and ResponsibilityFrom the perspective of our social obligations, we believe that our highest priority is fulfilling our
responsibilities to shareholders, customers, business partners, employees, communities and all other
stakeholders. Doing so requires that we maintain growth over the long term while raising operating
efficiency and capital efficiency. We must also be a source of products and services that excel in
terms of safety and quality. In sum, Meiji Seika must develop as a company that coexists with and is
valued by society.
As in the past, we will prioritize six elements of CSR: quality assurance, compliance, risk
management, the environment, social contributions and the disclosure of information. By taking
this approach, we will become more competitive and raise the value of our brands and the entire
Company. Furthermore, we have taken steps to ensure comprehensive CSR management. Our CSR
Committee is tasked with taking the lead in this regard by discussing and determining fundamental
policies and other important matters associated with the Meiji Seika Group’s CSR programs.
A Global Organization Able to Create “Good Taste and Health”We continue to face many challenges, notably reductions in official drug prices in Japan and the
much higher cost of raw materials, such as sugar, nuts and crude oil. To overcome these challenges,
we will raise our corporate value by successfully executing the strategies outlined above. Our goal
is clear; we will become a global organization that is recognized as a source of “Good Taste and
Health.”
Meiji Seika will celebrate its 90th anniversary in October 2006. To express our gratitude to
shareholders for their support over the years, we paid a year-end commemorative dividend of ¥3 per
share in addition to the year-end dividend per share of common stock of ¥3.50. This resulted in an
annual cash dividend of ¥10 per share applicable to the fiscal year ended March 31, 2006.
In line with the basic policy of paying a stable dividend over the medium-to-long term, Meiji
Seika will continue to meet the expectations of its shareholders by taking measures aimed at raising
profitability and corporate value.
August 2006
Naotada Sato
President

20
Corporate Governance and Compliance
Corporate GovernanceMeiji Seika positions corporate governance as one of its highest management priorities. We intend to become more competitive and better able to sustain growth by using sound management systems that can earn the trust of society.
Corporate officers are responsible for conducting business activities. This system allows directors to focus exclusively on making decisions on important management issues and supervising the execution of business activities. We have two external directors, who have wide-ranging knowledge and experience, to provide objective and diverse viewpoints with regard to decision-making and supervisory functions. Advisory committees that include external directors afford even greater management transparency and objectivity. The Nomination Committee submits to the Board of Directors recommendations for candidates for directors and corporate officers positions. The Compensation Committee evaluates the annual performance of directors and corporate officers and submits compensation proposals. The Board of Corporate Auditors has four members, including two external auditors, to provide a powerful supervisory function.
We have also established the CSR Committee, which discusses and determines our fundamental policy and other items concerning corporate social responsibility (CSR). The committee’s goal is to make our CSR spirit an integral element of operations at all Meiji Seika Group companies.
Corporate Governance System
President
General Meeting of Shareholders
Accounting Audit Firm
Board of Corporate Auditors
Corporate Auditors
Board of Directors
Corporate Real Estate Division
Compliance Committee
CSR Committee
Executive Committee
Executive Officer Meetings
Pharmaceutical Company
Auditors’ OfficeInternal Audit
Audit
Audit
Appointment
Appointment
Nomination Committee
Compensation Committee
● Decision-making ● Supervision of
business execution
● Execution of business
Appointment
Audit
Food & Health Care Company

ComplianceMeiji Seika manufactures and sells food and pharmaceutical products that are closely linked to the preservation of good health and life. The provision of products that excel in terms of safety and quality is therefore our most important mission and obligation to society.
As one way to fulfill this mission and obligation, we established the Compliance Committee in October 2002. This was followed in January 2003 with the announcement of the Meiji Seika Business Practices Charter, which defines guidelines for the behavior of all employees when conducting business activities.
In addition, there are many compliance programs in place throughout the Meiji Seika Group. We hold compliance information meetings, distribute compliance handbooks to employees, conduct training sessions and perform other activities.
Compliance Guidelines Compliance Oversight and Execution
A fundamental stance and framework for ensuring compliance
Business Practices Charter Handbook
Explanation of behavioral guidelines based on specific tasks and other daily activities of employees
Guidelines for conducting business activities
Business Practices Charter
Compliance Rules
Board of Directors
Compliance officers at business sites(Head office, branches, factories, R&D centers)
Consulting Attorneys
All Meiji Seika Group employees(Carry a compliance card at all times)
Compliance Hotline
Compliance Committee(Chairperson of Compliance Committee)
BOARD OF DIRECTORS
Members of the Board
Naotada Sato*
Akio Takahashi*
Akinobu Otsubo
Masaki Nagasaki
Masahiko Matsuo
Harunobu Tsukanishi
Masayuki Matsunaga
Hirobumi Mori
Hidetoshi Yajima (outside) (Chairman of Shimadzu
Corporation)
Tadashi Kudo (outside) (Former President & CEO,
Advisor of Mizuho Bank, Ltd.)
* Representative Director
CORPORATE OFFICERS
President
Naotada Sato
Senior Executive Vice President
Akio Takahashi
Executive Vice Presidents
Akinobu Otsubo
Masaki Nagasaki
Senior Vice Presidents
Masahiko Matsuo
Harunobu Tsukanishi
Masayuki Matsunaga
Hirobumi Mori
Osamu Makabe
Hideki Takahashi
Yoshihiko Mizoguchi
Toyomi Sato
Vice Presidents
Eiichi Irie
Riichi Fukui
Fumio Yokomichi
Yukio Nakamura
Masataka Kitamura
Sadaaki Komura
Ryoji Kono
Shinji Nakadori
Ikuo Aramori
Haruo Komatsu
Ryuzo Asada
Hitoshi Uchida
Yoshio Shimoda
BOARD OF CORPORATE AUDITORS
Senior Corporate Auditor
Yoshiaki Iida
Corporate Auditors
Takashi Hasunuma
Mitsuo Kanazawa (outside)
Masahide Kano (outside)
(As of June 28, 2006)
Business Practices Charter
1. We will endeavor to secure sound profits.
2. We will offer pleasure and reassurance to our customers.
3. We will conduct fair and transparent transactions.
4. We will proactively disclose information.
5. We will continue to operate with integrity.
6. We will properly handle confidential information and intellectual property.
7. We will proactively confront environmental issues.
8. We will respect each other’s individuality and manifest our motivation and skills to their utmost potential.
9. We will strive to be a good corporate citizen.
10. We will contribute to the development of each related country and region.
21

22
Data File
0
100
200
300
400
0
1000
2000
3000
4000
40
60
80
100
120
361.9 353.5368.9 364.0
382.4
’02 ’03 ’04 ’05 ’06
Net Sales (¥ Billions)
0
5
10
15
20
0
1000
2000
3000
4000
40
60
80
100
120
0
2
4
6
8
13.0
3.6
4.3
1.6
2.12.4
5.5
7.98.7
16.5
’02 ’03 ’04 ’05 ’06
Operating income (left scale)Operating income to net sales (right scale)
Operating Income and Operating Income to Net Sales (¥ Billions / %)
0
2
4
6
8
10
0
1000
2000
3000
4000
40
60
80
100
120
2.7
0.3
(8.2)
’02 ’03 ’04 ’05 ’06
8.7
5.9
Net Income (Loss) (¥ Billions)
0
100
200
300
400
0
1000
2000
3000
4000
40
60
80
100
120
336.9317.8
330.1339.8
348.3
’02 ’03 ’04 ’05 ’06
Total Assets (¥ Billions)
0
50
100
150
200
0
1000
2000
3000
4000
40
60
80
100
120
0
20
40
60
80
156.0
46.3 47.9 46.842.6
45.3
152.2 154.5 157.8
’02 ’03 ’04 ’05 ’06
144.8
Shareholders’ equity (left scale)Equity ratio (right scale)
Shareholders’ Equity and Equity Ratio
0
1
2
3
4
5
6
0
1000
2000
3000
4000
40
60
80
100
120
1.7
0.8
0.10.2
2.5
’02 ’03 ’04 ’05 ’06
ROE ROA
3.7
5.7
1.7
ROE and ROA (%)
0
5
10
15
20
0
1000
2000
3000
4000
40
60
80
100
12018.8
17.716.7 16.9 16.6
’02 ’03 ’04 ’05 ’06
R&D Costs (¥ Billions)
(¥ Billions / %)
0
1000
2000
3000
4000
40
60
80
100
120
Food & Health Care PharmaceuticalOffice Building Leasing & Others
264.4
2.6
115.4(30.2%)
(0.7%)
(69.1%)
Net Sales by Segment (¥ Billions)
0
1000
2000
3000
4000
40
60
80
100
120
Food & Health Care PharmaceuticalOffice Building Leasing & Others
9.8(59.0%)
(1.2%)
(39.8%)
0.2
6.6
Operating Income bySegment
(¥ Billions)
(Fiscal year ended March 31, 2006) (Fiscal year ended March 31, 2006)
* ROE and ROA are not recorded for the fiscal year ended March 31, 2005 due to net loss.

23
Management’s Discussion and AnalysisMeiji Seika Kaisha, Ltd. and its Consolidated Subsidiaries
Financial StrategyThe Meiji Seika Group’s fundamental policy regarding distribution of profits
is to take a long-term perspective in using internal capital resources to fund
capital investment in Japan and overseas, research and development costs,
and other operating requirements to expand the Group’s businesses and
strengthen the Group’s financial structure while providing reasonable, stable
shareholder returns.
Consolidated SubsidiariesAs of March 31, 2006, the Meiji Seika Group encompassed Meiji Seika
Kaisha, Ltd. (Meiji Seika), 21 consolidated subsidiaries and one affiliate
accounted for on the equity method. The 13 domestic subsidiaries include
10 companies in the food business, 1 company in the pharmaceutical
business, and 2 companies in the health care business. The 8 overseas
subsidiaries include 3 companies in the food business, 4 companies in the
pharmaceutical business and 1 company in other businesses.
OverviewDuring the fiscal year ended March 31, 2006, Japan’s economy staged
a gradual recovery as corporate earnings improved, capital investment
increased and there was an upturn in consumer spending. However, the
outlook remains uncertain because of the much higher cost of crude oil and
other raw materials.
In this environment, the Meiji Seika Group shifted its focus from
structural reforms to business development in order to achieve the goals
of “Challenge 2005,” a medium-term business plan that ended in March
2006. In particular, priority was placed on active business development
with a focus on the health care sector. The Food & Health Care Company
was established in July 2005 and other actions were taken to become more
competitive in order to increase sales and restore profitability.
Due to these actions, consolidated net sales increased 5.1% year-on-
year to ¥382,429 million, operating income was up 88.8% year-on-year
to ¥16,460 million and net income was ¥8,678 million compared with the
previous fiscal year’s net loss of ¥8,240 million.
Review of Operations by SegmentFood & Health Care Company
The Food & Health Care Company was established in July 2005 through
the integration and reorganization of the Food Company and Health Care
Company. This resulted in the change of segment classification from the
fiscal year under review.
The operating environment for the Food & Health Care business was
challenging. Consumption in Japan of confectioneries remained flat. In
the health care sector, despite market expansion continued, the large
number of new entrants in this market produced heated competition. In
this environment, the Meiji Seika Group worked on increasing sales mainly
through two initiatives. First was the development of new products that
anticipate consumer needs and have a competitive edge. Second was the
execution of strategic marketing activities for individual brands.
At domestic consolidated subsidiaries, MEIJI FOOD MATERIA CO.,
LTD. saw sales decline due to a change in the terms and conditions for
transactions with major customers in the core sugar products business.
MEIJI CHEWING GUM CO., LTD. performed well by reinforcing product
development skills that have been developed over many years and the
marketing activities. MEIJI SPORTS PLAZA, Ltd., which operates sports club
facilities, expanded its business because of the May 2005 acquisition of the
fitness clubs of Tokyo Gas Sports Co., Ltd. At overseas subsidiaries, Meiji
Seika (Singapore) Pte. Ltd. increased sales in Singapore and neighboring
countries. In the United States, D.F. Stauffer Biscuit Co., Inc. had a strong
performance due to the aggressive expansion of sales channels and a tight
focus on key products.
In the overseas business, there was a big increase in export sales because
of efforts to raise sales in Asian countries and develop business operations
in the Chinese market. Import sales were also strong. This was mainly a
reflection of higher imports of chocolate due to the growing interest in Japan
in cacao and of sales activities to promote products for Valentine’s Day.
The result was a 5.0% year-on-year increase in net sales to ¥264,410
million and a 56.7% year-on-year increase in operating income to ¥9,843
million. These comparisons with the previous fiscal year are based on the
combined results of the Food Company and Health Care Company.
Pharmaceutical Company
This company continued to encounter a difficult operating environment.
The major challenges were the widespread medical expenses containment
measures in Japan, intense competition involving the development of
new drugs and the growth in research and development costs. In this
environment, the Meiji Seika Group continued to concentrate its resources
on the sale of key products, such as anti-infectives and central nervous
23
24
system drugs. Outside Japan, the main goal was selling products in more
countries by steadily conducting programs to supply scientific information
concerning core products and other products.
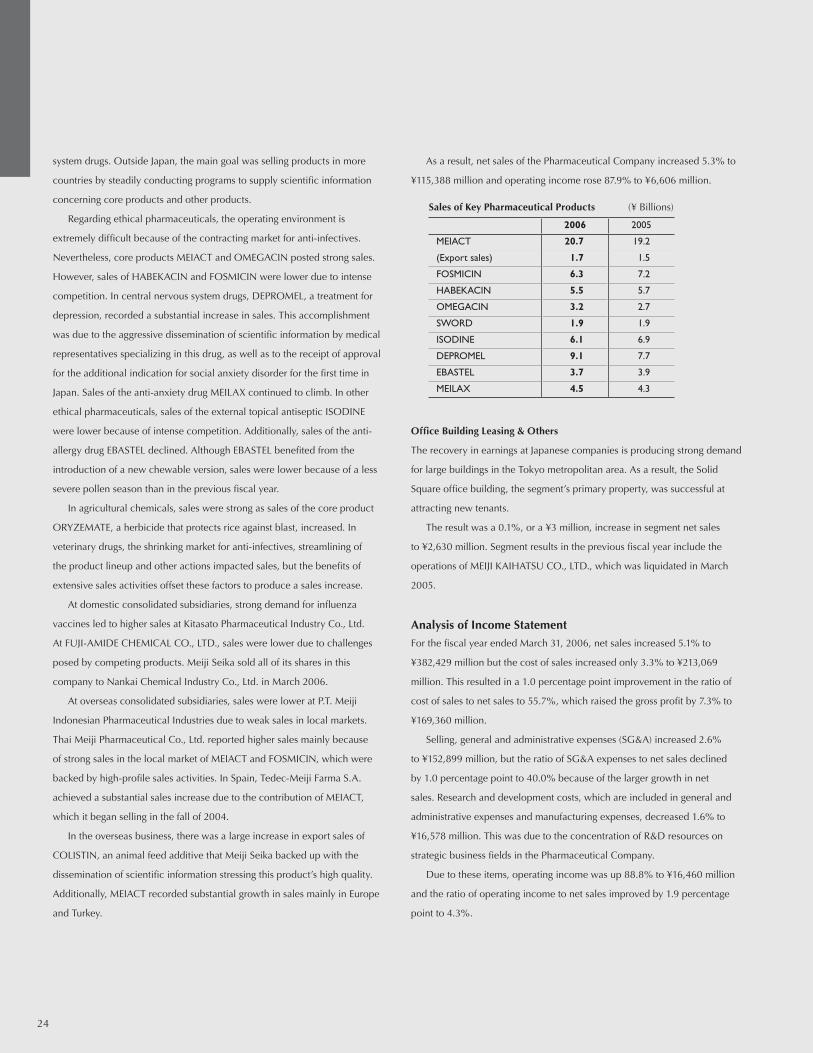
Regarding ethical pharmaceuticals, the operating environment is
extremely difficult because of the contracting market for anti-infectives.
Nevertheless, core products MEIACT and OMEGACIN posted strong sales.
However, sales of HABEKACIN and FOSMICIN were lower due to intense
competition. In central nervous system drugs, DEPROMEL, a treatment for
depression, recorded a substantial increase in sales. This accomplishment
was due to the aggressive dissemination of scientific information by medical
representatives specializing in this drug, as well as to the receipt of approval
for the additional indication for social anxiety disorder for the first time in
Japan. Sales of the anti-anxiety drug MEILAX continued to climb. In other
ethical pharmaceuticals, sales of the external topical antiseptic ISODINE
were lower because of intense competition. Additionally, sales of the anti-
allergy drug EBASTEL declined. Although EBASTEL benefited from the
introduction of a new chewable version, sales were lower because of a less
severe pollen season than in the previous fiscal year.
In agricultural chemicals, sales were strong as sales of the core product
ORYZEMATE, a herbicide that protects rice against blast, increased. In
veterinary drugs, the shrinking market for anti-infectives, streamlining of
the product lineup and other actions impacted sales, but the benefits of
extensive sales activities offset these factors to produce a sales increase.
At domestic consolidated subsidiaries, strong demand for influenza
vaccines led to higher sales at Kitasato Pharmaceutical Industry Co., Ltd.
At FUJI-AMIDE CHEMICAL CO., LTD., sales were lower due to challenges
posed by competing products. Meiji Seika sold all of its shares in this
company to Nankai Chemical Industry Co., Ltd. in March 2006.
At overseas consolidated subsidiaries, sales were lower at P.T. Meiji
Indonesian Pharmaceutical Industries due to weak sales in local markets.
Thai Meiji Pharmaceutical Co., Ltd. reported higher sales mainly because
of strong sales in the local market of MEIACT and FOSMICIN, which were
backed by high-profile sales activities. In Spain, Tedec-Meiji Farma S.A.
achieved a substantial sales increase due to the contribution of MEIACT,
which it began selling in the fall of 2004.
In the overseas business, there was a large increase in export sales of
COLISTIN, an animal feed additive that Meiji Seika backed up with the
dissemination of scientific information stressing this product’s high quality.
Additionally, MEIACT recorded substantial growth in sales mainly in Europe
and Turkey.
As a result, net sales of the Pharmaceutical Company increased 5.3% to
¥115,388 million and operating income rose 87.9% to ¥6,606 million.
Office Building Leasing & Others
The recovery in earnings at Japanese companies is producing strong demand
for large buildings in the Tokyo metropolitan area. As a result, the Solid
Square office building, the segment’s primary property, was successful at
attracting new tenants.
The result was a 0.1%, or a ¥3 million, increase in segment net sales
to ¥2,630 million. Segment results in the previous fiscal year include the
operations of MEIJI KAIHATSU CO., LTD., which was liquidated in March
2005.
Analysis of Income Statement For the fiscal year ended March 31, 2006, net sales increased 5.1% to
¥382,429 million but the cost of sales increased only 3.3% to ¥213,069
million. This resulted in a 1.0 percentage point improvement in the ratio of
cost of sales to net sales to 55.7%, which raised the gross profit by 7.3% to
¥169,360 million.
Selling, general and administrative expenses (SG&A) increased 2.6%
to ¥152,899 million, but the ratio of SG&A expenses to net sales declined
by 1.0 percentage point to 40.0% because of the larger growth in net
sales. Research and development costs, which are included in general and
administrative expenses and manufacturing expenses, decreased 1.6% to
¥16,578 million. This was due to the concentration of R&D resources on
strategic business fields in the Pharmaceutical Company.
Due to these items, operating income was up 88.8% to ¥16,460 million
and the ratio of operating income to net sales improved by 1.9 percentage
point to 4.3%.
2006 2005
MEIACT 20.7 19.2
(Export sales) 1.7 1.5
FOSMICIN 6.3 7.2
HABEKACIN 5.5 5.7
OMEGACIN 3.2 2.7
SWORD 1.9 1.9
ISODINE 6.1 6.9
DEPROMEL 9.1 7.7
EBASTEL 3.7 3.9
MEILAX 4.5 4.3
Sales of Key Pharmaceutical Products (¥ Billions)

25
Net other expenses increased ¥86 million to ¥300 million. Although
interest and dividend income increased 10.7%, interest expenses were up
4.5%. The interest coverage ratio, which is net cash provided by operating
activities divided by interest expenses, improved from 13.5 times to 15.3
times.
Extraordinary items resulted in a net gain of ¥261 million compared with
the net loss of ¥20,833 million in the previous fiscal year. The main reason
is the extraordinary loss recorded in the previous fiscal year for the one-time
amortization of unrecognized retirement benefit obligations and expenses
incurred due to management structure reforms. These factors did not affect
the financial results for the fiscal year under review.
As a result of the above, income before income taxes was ¥16,422
million compared with a loss of ¥12,330 million in the previous fiscal year,
and net income was ¥8,678 million compared with a net loss of ¥8,240
million as consolidated performance made a big improvement from the
previous year’s losses to a solid profit. Net income per share was ¥22.41
compared with a net loss per share of ¥21.53 in the previous fiscal year.
Analysis of Financial PositionAs of March 31, 2006, total assets increased ¥8,433 million to ¥348,281
million. Total current assets decreased ¥6,962 million, and total fixed assets
increased ¥15,396 million.
Total liabilities decreased ¥4,781 million to ¥187,622 million. Growth
in short-term bank loans and other items caused total current liabilities to
increase ¥2,096 million, but total long-term liabilities were down ¥6,877
million mainly because of declines in long-term debt and employees’
retirement benefits.
Shareholders’ equity increased ¥12,924 million to ¥157,761 million as the
strong earnings resulted in higher retained earnings and there was an increase
in the difference in valuation of other securities. Shareholders’ equity per
share increased ¥35.75 to ¥413.53, the return on average total shareholders’
equity (ROE) was 5.7% and the equity ratio improved by 2.7 percentage
points to 45.3%.
Analysis of Cash FlowsNet cash provided by operating activities increased ¥2,782 million from the
previous fiscal year to ¥19,513 million. Although cash was used for a pension
plan contribution associated with the switch to a new retirement benefit
system, this was offset by the large improvement in income before income
taxes.
Net cash used in investing activities increased ¥2,050 million to ¥18,822
million. This was due in part to investments in production bases in China.
Net cash used in financing activities was ¥4,687 million, mainly due to
dividend payments and the purchase of treasury stock. This was a decline of
¥16,664 million compared with net cash provided in the previous fiscal year
when there were proceeds of ¥20,000 million from the bond issuance.
The net result was a ¥3,890 million decrease in cash and cash
equivalents at end of year compared with the previous fiscal year to ¥18,755
million as of March 31, 2006.
Outlook for the Year Ending March 31, 2007As the beginning of the “DASH! 08,” a medium-term business plan, the
fiscal year ending March 31, 2007 is an important period for Meiji Seika.
To accomplish the goals of this plan, the Food & Health Care Company
will focus on raising its share of the chocolate and chewing gum markets
and on the challenge of targeting new customer needs associated health
in particular. In the Pharmaceutical Company, plans call for speeding the
development of new drugs and establishing a framework for a generic drug
business.
For the fiscal year ending March 31, 2007, Meiji Seika is forecasting a 3.3%
increase in net sales to ¥395,000 million, a 27.1% decrease in operating
income to ¥12,000 million and a 42.4% decrease in net income to ¥5,000
million. Net sales are expected to grow because of an expanding health
business and the aggressive development of overseas businesses. However,
the impact of NHI drug price revisions in Japan, higher raw materials prices
and other factors are expected to cause earnings to decline.
By business segment, Food & Health Care Company sales are projected
to increase 5.9% to ¥280,000 million and operating income to decrease
18.7% to ¥8,000 million. Pharmaceutical Company sales are projected to
decrease 2.9% to ¥112,000 million and operating income to decrease 54.6%
to ¥3,000 million. Office Building Leasing & Others sales are projected to
increase 14.0% to ¥3,000 million and operating income to increase 90.8%
to ¥300 million.
26
Risk FactorsFactors that have the potential to exert a significant influence on investors’
decisions include, but are not limited to, the following. Statements in the text
concerning the future are based on the judgment of the Meiji Seika Group’s
management as of March 31, 2006, the end of the fiscal year under review.
(1) Procurement of Raw Ingredients
In the Meiji Seika Group’s confectionery products business, nearly all raw
ingredients and major ingredients (cacao beans, nuts, etc.) are imported.
In principle, the Group maintains a fixed level of domestic stock, and takes
measures to disperse risks in producing regions. However, in the event
that the Group is unable to secure a sufficient volume of ingredients for an
extended period of time due to political conditions in exporting countries,
global demand conditions or other factors, the Group’s production activities
would be hindered, which could impact the Group’s business results and
financial position.
In addition, prices are currently trending higher for nearly all raw
ingredients, and the Group is working to control costs by developing new
procurement routes and promoting streamlining. However, acceleration in
this upward trend in prices in the future could affect production costs.
(2) Changes in Exchange Rates
The Meiji Seika Group uses forward foreign exchange contracts in procuring
raw materials. However, changes in exchange rates could increase
procurement costs, which could affect the Meiji Seika Group’s financial
position.
In addition, items such as product sales, expenses and assets of overseas
subsidiaries and businesses that are denominated in local currencies are
translated into yen upon consolidation. Changes in exchange rates can
therefore affect the Meiji Seika Group’s business results and financial
position.
(3) The Impact of Weather
Chocolate sales account for a large percentage of the Meiji Seika Group’ s
confectionery products business. High temperatures and changes in the
weather can easily affect consumer purchasing patterns and affect sales of
chocolate and other confectioneries. Unpredictable changes in weather
can therefore affect the Meiji Seika Group’s business results and financial
position.
(4) Legal Regulations
The Meiji Seika Group must comply with the Food Sanitation Law and
other laws and regulations, as well as with the Pharmaceutical Affairs Law
and other laws and regulations involving pharmaceuticals, and with the
Agricultural Chemicals Regulation Law and other laws and regulations
involving agricultural chemicals. Furthermore, the Group is subject to the
Product Liability Law, the Anti-monopoly Law and other laws.
In its food and health care business and its pharmaceuticals business,
the Meiji Seika Group assures strict compliance with relevant laws and
regulations, enhances sanitary management, and ensures accurate product
labeling. However, should the Group be required to suspend or to recall
products manufactured prior to changes in relevant laws and regulations,
experience problems unique to the Group, such as defective products,
or suffer the consequences of common social problems or criminal acts
directed against the Group, the Meiji Seika Group’s financial position could
be affected.
Ethical pharmaceuticals prices are subject to changes in the government’s
medical policies, including NHI drug price revisions, and the national health
insurance system. Such changes could affect the Group’s financial position.
(5) Contamination by Foreign Substances
In its food and health care business, the Meiji Seika Group places the highest
priority on using ingredients that are safe and reliable for consumers, and is
working to obtain safe, reliable ingredients through measures such as shifting
procurement to safer countries and strengthening inspection of suppliers. In
the pharmaceutical business, the Meiji Seika Group manufactures products
ranging from bulk pharmaceuticals to drug preparations under management
that follows Good Manufacturing Practice (GMP) guidelines stipulated by the
Ministry of Health, Labour and Welfare. To prevent contamination incidents,
the Group routinely conducts stringent production management and has
incorporated the latest technology in an effort to improve the configuration
and equipment of production facilities. However, there is no guarantee
against the possibility of contamination by foreign substances in any of the
Group’s products. Contamination by foreign substances would have a serious
impact on the reputation of the Meiji Seika Group, which could cause sales
to decline and costs to rise, and thus has the potential to impact the Group’s
business results.

27
(6) Occurrence of Side Effects
In the pharmaceutical business, the Meiji Seika Group conducts product
development, manufacturing and marketing according to various laws and
standards enforced by regulatory authorities. However, unforeseen side
effects have the potential to occur during development and after product
launch. The Meiji Seika Group prepares against the occurrence of such
incidents by carrying insurance coverage for various types of liability,
including product liability. However, because there is no guarantee that
such insurance will be sufficient to cover all damages associated with such
liability, unforeseen side effects have the potential to impact the Group’s
business results and financial position.
(7) Research and Development
In the Meiji Seika Group’s pharmaceutical business, the development of
new products requires a variety of tests over long periods of time, which
necessitates substantial expenses. In addition, the Meiji Seika Group
must in some instances extend, interrupt or cease particular research and
development projects because of safety and efficacy issues. Therefore,
progress in research and development has the potential to impact the Meiji
Seika Group’s business results and financial position. Moreover, the launch
of products that the Meiji Seika Group develops may be delayed if research
and development does not proceed as planned. This may result in the need
to introduce the products of other companies. Such cases have the potential
to increase outlays for intellectual property rights and licensing.
(8) Intellectual Property
The Meiji Seika Group owns intellectual property created through business
activities including research and development. The Group also legally uses
a broad range of intellectual property that is patented by third parties. The
Group uses such intellectual property with the understanding that it is not
infringing upon the rights of third parties. However, litigation and other
issues arising in connection with intellectual property have the potential to
impact the Meiji Seika Group’s business results and financial position.
(9) The Impact of Regional Upheaval or Change in Social Conditions
The Meiji Seika Group conducts production and sales activities overseas,
primarily in Europe, North America and Southeast Asia. The occurrence of
earthquakes or other major natural disasters in areas in which the Group
operates; changes in inflation and other economic conditions; and wars,
revolutions and other events that may cause political turbulence have the
potential to impact the Meiji Seika Group’s business results and financial
position.
(10) The Impact of a Large Earthquake, Fire or Other Disaster
A large earthquake, fire or other natural disaster that causes extensive
damage to Meiji Seika Group’s production facilities and results in an
extended halt in production has the potential to impact the Meiji Seika
Group’s business results and financial position.
(11) Information Systems
The Meiji Seika Group works to thoroughly implement measures to counter
computer viruses and rigorously maintains its information management
system. However, a system shutdown resulting from an unknown virus or
unauthorized system access, or leakage of customer information, all have
the potential to impact the Meiji Seika Group’s business results and financial
position.
The above list is not a complete list of the risks to which the Meiji Seika
Group is vulnerable.

28
Consolidated Balance SheetsMeiji Seika Kaisha, Ltd. and its Consolidated SubsidiariesMarch 31, 2006, 2005 and 2004
Current Assets:Cash and time deposits (Note 9)
Receivables:
Notes and accounts
Unconsolidated subsidiaries and affiliates
Inventories
Prepaid and other current assets
Other current assets in unconsolidated subsidiaries and affiliates
Deferred tax assets (current) (Note 6)
Allowance for doubtful receivables
Total current assets
Fixed Assets:
Investments and Other Non-Current Assets:Investment securities (Notes 3 and 5)
Investments in and advances to unconsolidated subsidiaries and affiliates
Long-term loans
Other investments and advances
Allowance for doubtful accounts
Total investments and other non-current assets
Property, Plant and Equipment (Note 5):
Land
Buildings and structures
Machinery and equipment
Construction in progress
Less accumulated depreciation
Total property, plant and equipment (net)
Intangible Fixed AssetsDeferred Tax Assets (Non-Current) (Note 6)
Total fixed assets
Total assets
See notes to consolidated financial statements.
Millions of Japanese yen
Thousands of U.S. dollars
ASSETS 2006 2005 2004 2006
¥ 18,980
77,296
1,223
43,752
5,427
877
5,765
(28)
153,293
43,525
1,538
2
7,543
(943)
51,667
23,968
148,322
180,251
1,658
(217,436)
136,764
6,271
284
194,988
¥348,281
¥ 23,357
76,050
315
44,897
8,867
1,169
5,694
(95)
160,255
29,570
1,589
4
4,988
(965)
35,187
24,965
146,848
176,534
1,008
(209,450)
139,906
4,257
240
179,592
¥339,848
¥ 11,271
73,790
243
51,231
11,095
1,866
5,172
(60)
154,610
27,295
1,653
203
4,758
(984)
32,926
25,106
140,032
173,186
8,152
(207,656)
138,821
3,457
242
175,448
¥330,059
$ 161,575
658,008
10,413
372,454
46,206
7,465
49,079
(246)
1,304,957
370,524
13,099
21
64,218
(8,031)
439,832
204,042
1,262,641
1,534,447
14,119
(1,850,998)
1,164,251
53,391
2,420
1,659,896
$2,964,853

29
Current Liabilities:Short-term bank loans (Notes 4 and 5)
Commercial paper
Payables:
Notes and accounts
Unconsolidated subsidiaries and affiliates
Accrued expenses
Accrued income taxes
Other current liabilities
Total current liabilities
Long-Term Liabilities:
Long-term debt (Notes 4 and 5)
Employees’ retirement benefits (Note 8)
Deferred tax liabilities (non-current) (Note 6)
Other long-term liabilities
Total long-term liabilities
Total liabilities
Minority Interests
Contingent Liabilities (Note 12)
Shareholders’ Equity:Common stock
Authorized — 796,104,000 shares
Issued 2006 — 385,535,116 shares
Issued 2005 — 385,535,116 shares
Issued 2004 — 385,535,116 shares
Capital surplus
Retained earnings
Difference in valuation of other securities
Foreign currency translation adjustments
Treasury stock
Total shareholders’ equity
Total liabilities, minority interests and shareholders’ equity
Millions of Japanese yen
Thousands of U.S. dollars
LIABILITIES, MINORITY INTERESTS AND SHAREHOLDERS’ EQUITY 2006 2005 2004 2006
¥ 23,511
—
25,219
2,207
16,999
4,170
14,868
86,976
57,485
24,765
13,642
4,752
100,645
187,622
2,897
28,363
—
—
34,948
79,595
17,730
(642)
(2,233)
157,761
¥348,281
¥ 17,223
—
24,555
2,231
16,770
3,514
20,585
84,880
64,118
32,451
6,238
4,714
107,522
192,403
2,607
—
28,363
—
34,946
73,611
10,407
(1,514)
(977)
144,837
¥339,848
¥ 20,110
4,000
25,332
2,668
17,257
4,305
21,377
95,052
42,542
17,959
13,105
4,409
78,015
173,068
2,441
—
—
28,363
34,935
84,575
9,133
(1,355)
(1,103)
154,549
¥330,059
$ 200,148
—
214,687
18,789
144,714
35,502
126,569
740,412
489,362
210,822
116,136
40,457
856,779
1,597,191
24,663
241,454
297,507
677,583
150,936
(5,469)
(19,013)
1,342,998
$2,964,853
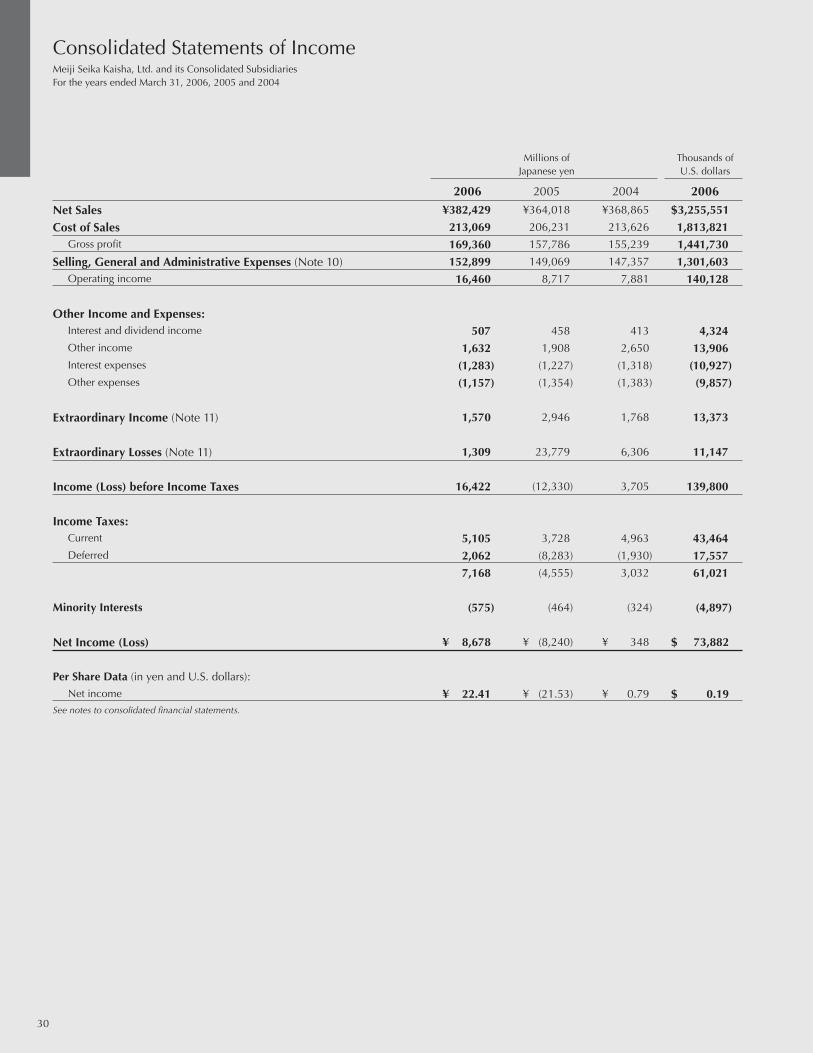
30
Consolidated Statements of IncomeMeiji Seika Kaisha, Ltd. and its Consolidated SubsidiariesFor the years ended March 31, 2006, 2005 and 2004
Net SalesCost of Sales
Gross profit
Selling, General and Administrative Expenses (Note 10)Operating income
Other Income and Expenses:Interest and dividend income
Other income
Interest expenses
Other expenses
Extraordinary Income (Note 11)
Extraordinary Losses (Note 11)
Income (Loss) before Income Taxes
Income Taxes:Current
Deferred
Minority Interests
Net Income (Loss)
Per Share Data (in yen and U.S. dollars):Net income
See notes to consolidated financial statements.
Millions of Japanese yen
Thousands of U.S. dollars
2006 2005 2004 2006 ¥382,429
213,069
169,360
152,899
16,460
507
1,632
(1,283)
(1,157)
1,570
1,309
16,422
5,105
2,062
7,168
(575)
¥ 8,678
¥ 22.41
¥364,018
206,231
157,786
149,069
8,717
458
1,908
(1,227)
(1,354)
2,946
23,779
(12,330)
3,728
(8,283)
(4,555)
(464)
¥ (8,240)
¥ (21.53)
¥368,865
213,626
155,239
147,357
7,881
413
2,650
(1,318)
(1,383)
1,768
6,306
3,705
4,963
(1,930)
3,032
(324)
¥ 348
¥ 0.79
$3,255,551
1,813,821
1,441,730
1,301,603
140,128
4,324
13,906
(10,927)
(9,857)
13,373
11,147
139,800
43,464
17,557
61,021
(4,897)
$ 73,882
$ 0.19

31
Consolidated Statements of Shareholders’ EquityMeiji Seika Kaisha, Ltd. and its Consolidated SubsidiariesFor the years ended March 31, 2006, 2005 and 2004
Balance at March 31, 2003Net income
Decrease in earnings due to increase
in the number of companies accounted
for by the equity method
Cash dividends
Directors’ bonuses
Other
Balance at March 31, 2004Net income
Cash dividends
Directors’ bonuses
Other
Balance at March 31, 2005Net income
Cash dividends
Directors’ bonuses
Other
Balance at March 31, 2006
Number ofshares of
common stock(thousands)
¥34,935
34,935
11
34,946
2
¥34,948
¥86,969
348
(7)
(2,695)
(39)
84,575
(8,240)
(2,681)
(42)
73,611
8,678
(2,683)
(11)
¥79,595
¥ 2,915
6,218
9,133
1,274
10,407
7,323
¥17,730
¥ (206)
(896)
(1,103)
125
(977)
(1,256)
¥ (2,233)
¥28,363
28,363
28,363
¥28,363
385,535
385,535
385,535
385,535
Commonstock
Capitalsurplus
Retainedearnings
Differencein valuation
of othersecurities
Foreigncurrency
translationadjustments
Treasurystock
¥ (754)
(600)
(1,355)
(158)
(1,514)
872
¥ (642)
Millions of Japanese yen
Balance at March 31, 2005Net income
Cash dividends
Directors’ bonuses
Other
Balance at March 31, 2006See notes to consolidated financial statements.
$297,492
14
$297,507
$626,640
73,882
(22,842)
(96)
$677,583
$ 88,601
62,335
$150,936
$ (8,324)
(10,688)
$(19,013)
$241,454
$241,454
Commonstock
Capitalsurplus
Retainedearnings
Differencein valuation
of othersecurities
Foreigncurrency
translationadjustments
Treasurystock
$(12,889)
7,419
$ (5,469)
Thousands of U.S. dollars

32
Consolidated Statements of Cash FlowsMeiji Seika Kaisha, Ltd. and its Consolidated SubsidiariesFor the years ended March 31, 2006, 2005 and 2004
Cash Flows from Operating Activities:Income (loss) before income taxesDepreciation and amortizationAmortization of consolidation adjustmentsLoss on disposal of property, plant and equipment Loss on valuation of investment securitiesIncrease (decrease) in allowance for doubtful accountsIncrease (decrease) in employee retirement allowance Interest and dividends received Interest expenses Equity in loss (income) of equity-method affiliates Gain (loss) on sale of property, plant and equipment Gain (loss) on sale of investment securities Decrease (increase) in trade receivables Decrease (increase) in inventories Increase (decrease) in trade payables Directors’ bonuses paid Other
Subtotal Interest and dividends received Interest paid Income taxes paid
Net cash provided by operating activities
Cash Flows from Investing Activities:Payments for time deposits Proceeds from withdrawal of time deposits Payments for purchases of investment securities Proceeds from sales of investment securities Payments for purchases of property, plant and equipment Proceeds from sales of property, plant and equipment Payments for purchases of shares in affiliates related to
change in the scope of consolidationProceeds from sales of shares in affiliates related to
change in the scope of consolidation Other
Net cash used in investing activities
Cash Flows from Financing Activities:Decrease (increase) in short-term borrowings Increase (decrease) in commercial paper Proceeds from long-term borrowings Repayment of long-term borrowings Proceeds from bond issuance Dividends paidOther
Net cash provided by (used in) financing activities
Translation Adjustment on Cash and Cash Equivalents Net Increase (Decrease) in Cash and Cash Equivalents Cash and Cash Equivalents at Beginning of Year Increase (Decrease) in Cash and Cash Equivalents due to the Change
in the Number of Consolidated SubsidiariesCash and Cash Equivalents at End of Year See notes to consolidated financial statements.
Millions of Japanese yen
Thousands of U.S. dollars
2006 2005 2004 2006
¥16,422 14,976 302 865 15 (93) (7,664) (507) 1,283 (131) (1,144) (11) (2,204) 1,170 1,547 (13)
(133) 24,678 640 (1,278) (4,526) 19,513
(216) 688 (2,363) 646 (15,000) 1,623
(898) 727 (4,029) (18,822) 3,552 — 1,441 (5,552) — (2,683) (1,445) (4,687) 105 (3,890) 22,646
— ¥18,755
¥(12,330) 14,750 144 1,659 293 17 14,496
(458) 1,227
(108)(2,532)
(119)(2,336)
6,300(1,422)
(45) 2,512 22,051 552
(1,243)(4,629)
16,731
(988) 886
(412) 333
(18,911) 3,797 —
—(1,477)
(16,772)
(1,550)(4,000)
7,226(6,884)
20,000(2,681)
(132) 11,977 21 11,957 10,688
—
¥22,646
¥ 3,705 13,892 101 1,204 213
(142)(2,235)
(413) 1,318
(83)(339)
(1,153)(2,025)(3,254)
2,498(41)
(3,365) 9,879 564
(1,337)(2,443)
6,663
(325) 84
(841) 7,681
(11,995) 1,172 —
—(1,199)(5,424)
(350)(1,000)
2,720(3,690)
—(2,695)(1,012)(6,028)
84(4,705)
15,290 103
¥10,688
$139,800 127,494 2,572 7,366 135 (795)
(65,248)(4,324)
10,927(1,119)(9,743)
(94)(18,766)
9,962 13,172
(118)(1,136)
210,085 5,453
(10,885)(38,534)
166,118
(1,838) 5,858
(20,123) 5,507
(127,694) 13,820
(7,652)
6,193(34,305)
(160,233)
30,244 — 12,269
(47,269) —
(22,842)(12,306)(39,904)
897(33,122)
192,785
— $159,662

33
Notes to Consolidated Financial StatementsMeiji Seika Kaisha, Ltd. and its Consolidated Subsidiaries
1. Basis of Presenting Consolidated Financial StatementsThe accompanying consolidated financial statements of Meiji Seika Kaisha,
Ltd. (the “Company”) and subsidiary companies have been prepared
from the consolidated financial statements in Japanese filed with the
Kanto Finance Bureau as required by the Securities and Exchange Law of
Japan, which are in conformity with accounting principles and practices
generally accepted in Japan. These are different in certain respects from
the application and disclosure requirements of International Accounting
Standards. The consolidated financial statements are not intended to present
the financial position, results of operations and cash flows in accordance
with accounting principles and practices generally accepted in countries and
jurisdictions other than Japan. In preparing the accompanying consolidated
financial statements, certain reclassifications have been made to present
them in a form which is familiar to readers outside Japan. The accounts and
the financial statements of the Company and its subsidiaries are maintained
in Japanese yen. For the convenience of the reader, the accompanying
consolidated financial statements are also presented in U.S. dollars by
arithmetically translating all Japanese yen amounts by using the exchange
rate of ¥117.47 to $1 in effect at March 31, 2006.
2. Summary of Significant Accounting Policies(a) Consolidation policy
The accompanying consolidated financial statements include the accounts of
the Company and significant subsidiaries (the “Companies”), over which the
Company has power of control through majority voting rights or existence
of certain conditions evidencing control by the Company. Investments
in affiliates over which the Company has ability to exercise significant
influences over operating and financial policies of the investees, are
accounted for on the equity method. The consolidated financial statements
consist of the Company and its 21 (21 in 2005) significant subsidiaries. All
significant intercompany transactions and accounts have been eliminated.
Accounts of subsidiaries whose business year-ends differ by three months
from March 31 have been included using financial information with
appropriate adjustment. Investments in one affiliate are accounted for on
the equity method. The difference between the cost and underlying net
equity at acquisition of investments in consolidated subsidiaries and affiliates
is allocated to identifiable assets based on fair market value at the date of
acquisition. The unallocated portion of the differences is amortized over 5
years and 15 years on a straight-line basis.
(b) Marketable and investment securities
Marketable and investment securities are valued using the following
methods.
Securities that have market prices:
Market valuation based on market prices at fiscal year-end. Differences
in appraisals are accounted for by incorporation of direct capital, and
sales cost is calculated using the moving-average method.
Securities that have no market prices:
Cost method based on the moving-average method.
(c) Inventories
Inventories, including finished and semifinished products as well as work in
progress, are valued at cost, which is determined mainly by the average cost
method, except supplies and raw materials, which are stated at the lower of
cost or market.
(d) Income taxes
The Companies provide for income taxes applicable to all items included
in the consolidated statements of income regardless of when such taxes are
payable. Income taxes based on temporary differences between tax and
financial reporting purposes are reflected as deferred income taxes in the
consolidated financial statements using the asset and liability method.
(e) Property, plant and equipment
Property, plant and equipment are stated at cost. Depreciation of the assets
of the parent company and domestic subsidiaries is calculated primarily
by the declining balance method. However, depreciation of buildings and
structures used in the leasing business that were acquired on or after April
1, 1995 is calculated by the straight-line method. Furthermore, depreciation
of buildings (excluding attached fixtures) acquired on or after April 1, 1998
is calculated by the straight-line method. Overseas consolidated subsidiaries
mainly used the straight-line method to calculate depreciation.
(f) Intangible assets
Intangible assets are carried at cost less accumulated amortization, which is
calculated principally by the straight-line method.
Commencing with the fiscal year under review, the Company’s U.S.
subsidiaries have adopted the U.S. Financial Accounting Standard Board’ s
Statement No.142, Goodwill and Other Intangible Assets. Accordingly,
impairment studies will be conducted annually or when incidents that
could possibly impair goodwill or other intangible assets occur to determine
whether impairment has occurred.
Following this standard, the U.S. subsidiaries have conducted impairment
studies and determined that the fair value of their goodwill and other
intangible assets lie above carrying value. Therefore, starting with the
fiscal year under review, no amortization charges will be made to the
consolidation adjustment account.
(g) Allowance for doubtful accounts
To provide for losses on doubtful accounts such as accounts receivable, the
Company charges to income an amount based on actual loss experience
for normal accounts, plus an amount for projected unrecoverable amounts
based on assessments of individual designated accounts, such as credits
from companies in danger of bankruptcy.
(h) Reserve for retirement allowances
The Company and its principal consolidated subsidiaries provide for
employees’ accrued retirement benefits by charging to income the amount
recognized as having been incurred based upon the projected amounts of
the liability for accrued retirement benefits and pension assets at the end of
the consolidated fiscal year.
Certain consolidated subsidiaries charge the difference at the time of
accounting standard alteration (¥233 million) is being charged to income on
a pro rata basis over seven years.
Prior service liabilities are amortized on the straight-line method over a
specified number of years (4 years), that is less than the average remaining

34
period of employment for employees from the time the liability arouse.
The difference based on an actuarial calculation is charged to income
beginning in the following consolidated fiscal year, using the pro rata
amounts based on a specified number of years (seven) that is less than the
average remaining period of employment for employees at the time the
difference arose.
(i) Leases
For finance lease transactions, except for leases that transfer ownership of
the property to the lessee, the usual accounting method governing lease
transactions is applicable.
(j) Cash and cash equivalents
Cash and cash equivalents in the consolidated statements of cash flows
are composed of cash on hand, bank deposits available for withdrawal on
demand and highly liquid, short-term investments with a maturity of three
months or less that can be readily converted into cash and which represent a
minor risk of fluctuation in value.
(k) Impairment of fixed assets
Effective from the fiscal year ended March 31, 2006, the Companies adopted
the new accounting standards for impairment of fixed assets (“Statement of
Opinion on the Establishment of Accounting Standards for Impairment of
Fixed Assets” issued by the Business Accounting Council of Japan on August
9, 2002) and the implementation guidance for accounting standards for
impairment of fixed assets (Financial Accounting Standards Implementation
Guidance No.6– “Application Guidance on Accounting Standards for
Impairment of Fixed Assets” issued by the Accounting Standards Board of
Japan on October 31, 2003) .
The adoption of these standards had no effect on the consolidated
statement of income for the fiscal year ended March 31, 2006.
(l) Translation of foreign currency
Short-term and long-term monetary receivables and payables denominated
in foreign currencies are translated into Japanese yen at the exchange rate
at the consolidated balance sheet date. The foreign currency translation
adjustment is accounted for as a gain or loss.
The assets and liabilities of overseas subsidiaries are translated into yen at
the exchange rate as of the balance sheet date. The income and expenses of
overseas subsidiaries are translated into yen using the average exchange rate
during the fiscal year. The translation adjustments are included in minority
interests in consolidated subsidiaries and in the foreign currency translation
adjustment account in the shareholders’ equity portion of the consolidated
balance sheet.
(m) Per share data
Net income per share is computed based on the weighted average number
of shares of common stock.
3. Investment SecuritiesBook value, fair value of securities held by the Company and its consolidated subsidiaries are as follows:
1. Other securities with market prices as of March 31, 2006 and 2005 are as follows:
Securities with market prices exceeding acquisition costsStocksOthersSubtotal
Securities with market prices falling below acquisition costsStockOthersSubtotalTotal
¥41,078 66 ¥41,144
¥ 100 133 ¥ 233 ¥41,378
¥30,097 25 ¥30,122
¥ (23) (2) ¥ (25) ¥30,096
$93,481 349 $93,830
$ 1,050 1,158 $ 2,208 $96,039
$256,211 213 $256,424
$ (199) (19) $ (218) $256,206
¥10,981 41 ¥11,022
¥ 123 136 ¥ 259 ¥11,281
Book value Fair value Difference Book value Fair value Difference
$349,693 562 $350,255
$ 851 1,138 $ 1,990 $352,245
Millions of Japanese yen Thousands of U.S. dollars
Securities with market prices exceeding acquisition costsStocksBonds and debenturesOthersSubtotal
Securities with market prices falling below acquisition costsStockBonds and debenturesOthersSubtotalTotal
¥8,868 500 11 ¥9,379 ¥ 176 100 164 ¥ 441 ¥9,821
¥17,736 0 6 ¥17,743
¥ (36)(14)(22)
¥ (73) ¥17,670
Book value Fair value Difference
¥26,605 500 17 ¥27,123
¥ 140 85 142 ¥ 368 ¥27,491
Millions of Japanese yen
As of March 31, 2006
Sales amounts Total gains on sales
Millions of Japanese yen
Thousands of U.S. dollars
2006 2005 2006 ¥46 22
¥311 182
$399 194
As of March 31, 2005
2. Other securities sold during fiscal 2006 and 2005 are as follows:

35
Other securities(1) Unlisted stocks(2) Preferred securities
Millions of Japanese yen
Thousands of U.S. dollars
2006 2005 2006 ¥1,147 1,000
¥1,078 1,000
$9,766 8,512
3. Book value of major securities not marked to market as of March 31, 2006 and 2005 are as follows:
Other securities(1) Bonds and debentures(2) OtherTotal
¥ — 125 ¥125
¥ — — ¥ —
$ — — $ —
$ — — $ —
¥ — — ¥ —
Within one year From 1–5 years Over 5 years
$ — 1,066 $1,066
Millions of Japanese yen Thousands of U.S. dollars
As of March 31, 2006
4. Expected redemption values of other securities with future maturity as of March 31, 2006 and 2005 are as follows:
Within one year From 1–5 years Over 5 years
Other securities(1) Bonds and debentures(2) OtherTotal
¥500 — ¥500
¥85 — ¥85
¥— 98 ¥98
Millions of Japanese yen
As of March 31, 2005 Within one year From 1–5 years Over 5 years
4. Short-Term Loans Payable and Long-Term DebtThe average annual rates of interest on the outstanding balance of short-term loans payable as of March 31, 2006 and 2005 were 1.3% and 1.1%, respectively.
Long-term debt as of March 31, 2006 and 2005 is summarized as follows:
0.7% unsecured bonds due 20070.83% unsecured bonds due 2009Loans from domestic banks, insurance companies, government agencies and others, due 2006 to 2022
Less portion due within one yearTotal long-term debt
Millions of Japanese yen
Thousands of U.S. dollars
2006 2005 2006 ¥20,000 20,000
25,351 65,351
(7,866) ¥57,485
¥20,000 20,000
29,441 69,441
(5,323) ¥64,118
$170,256 170,256
215,813 556,325 (66,963) $489,362
2008200920102011Thereafter
Total
Millions of Japanese yen Thousands of U.S. dollarsYear ending March 31
¥26,425 1,189 27,368 772 1,729 ¥57,485
$224,955 10,122 232,983 6,576 14,725 $489,362
At March 31, 2006 the aggregate annual maturities of long-term debt are as follows:
5. Collateral and Secured LiabilityA summary of assets pledged as collateral for liability at March 31, 2006 and 2005 is as follows:
LandBuildingsInvestment securities
Total
Millions of Japanese yen
Thousands of U.S. dollars
2006 2005 2006 ¥ 693 26,333 1,926 ¥28,953
¥ 693 27,754 1,014 ¥29,462
$ 5,907 224,170 16,395 $246,473
Long-term loans (Including current portions of long-term loans payable within one year)
Millions of Japanese yen
Thousands of U.S. dollars
2006 2005 2006 ¥5,676
¥6,393 $48,324
A summary of secured liability at March 31, 2006 and 2005 is as follows:

36
6. Deferred Tax Assets and LiabilitiesThe significant components of the Company’s deferred tax assets and liabilities as of March 31, 2006 and 2005 are as follows:
Deferred tax assetsAmount in excess of limit for employee retirement allowancesSelling expenses not deductible for tax purposes during the periodValuation loss on investment and marketable securitiesAmount in excess of limit for accrued bonuses to employeesExcess depreciation of fixed assetsExcess deferred asset depreciation for tax purposesAccrued enterprise taxesOtherSubtotalTemporary difference for future reductions that are unscheduledTotal deferred tax assets
Deferred tax liabilitiesAdvanced depreciation reserve for fixed assetsDifference in valuation of other securitiesOtherTotal deferred tax liabilities
Net deferred tax liabilities
Millions of Japanese yen
Thousands of U.S. dollars
2006 2005 2006 ¥11,710 607 1,070 1,755 1,352 38 438 5,022 21,995 (1,392) ¥ 20,603
¥(15,554)(12,339)
(301)¥(28,196)
¥ (7,592)
¥ 14,471 627 1,112 1,983 1,347 32 354 4,700 24,629
(1,402) ¥ 23,227
¥(16,060)(7,244)
(225)¥(23,530)
¥ (302)
$ 99,690 5,171 9,112 14,942 11,510 327 3,730 42,757 187,243 (11,851) $ 175,392
$(132,415) (105,045)
(2,568) $(240,029)
$ (64,637)
Deferred tax assets (current)Deferred tax assets (non-current)Deferred tax liabilities (non-current)
Millions of Japanese yen
Thousands of U.S. dollars
2006 2005 2006 ¥ 5,765 284
(13,642)
¥ 5,694 240
(6,238)
$ 49,079 2,420
(116,136)
The net deferred tax assets at March 31, 2006 and 2005, included in the consolidated balance sheets are as follows:
An analysis of the significant differences between the statutory tax rate and the Company’s effective tax rate for the year ended March 31, 2006 is as follows:
Statutory tax rate
Entertainment and other permanently non-deductible expensesDividend and other permanently non-taxable incomePer capita inhabitant’s taxUnrecognized tax effect due to elimination of investment and capitalDifference in tax rate of overseas consolidated subsidiariesTax credit for experimentation and research expensesOtherEffective tax rates
2006 41.0% 5.3 (3.0) 0.8 4.0 (1.9) (4.2) 1.6 43.6%
No information for differences between the statutory income tax rate and the effective income tax rate is required for the year ended March 31, 2005, as the loss before income taxes and minority interests was reported for this year.
7. Leasesa) Finance leasesAmounts corresponding to lease property acquisition cost, accumulated depreciation, net leased property of machinery, equipment and other assets during the fiscal years 2006 and 2005 are as follows:
Acquisition costAccumulated depreciationNet book value
Millions of Japanese yen
Thousands of U.S. dollars
2006 2005 2006 ¥7,303 3,780 ¥3,523
¥7,668 3,938 ¥3,730
$62,174 32,181 $29,992

37
The amounts corresponding to lease property acquisition cost are calculated by the interest payment inclusion method because the outstanding balance of future lease payments at the end of the fiscal year is a small percentage of the fiscal year-end balance of property, plant and equipment.
The equity method is used for the calculation of asset depreciation.Outstanding balances of future lease payments as of March 31, 2006 and
2005 are as follows:
Due within one yearDue after one year
Total
Millions of Japanese yen
Thousands of U.S. dollars
2006 2005 2006 ¥1,278 2,244 ¥3,523
¥1,374 2,355 ¥3,730
$10,883 19,108 $29,992
The amounts corresponding to the outstanding balance of future lease payments at the end of the fiscal year are calculated by the interest payment inclusion method because the outstanding balance of future lease payments at the end of the fiscal year is a small percentage of the fiscal year-end
balance of property, plant and equipment.Paid lease fees and equivalent depreciation expense amount are as
follows:
Paid lease feesEquivalent depreciation expense amountNote:Equivalent depreciation expense amount is calculated using the straight-line method, with the lease period as the useful life and zero (0) as the residual value.
Millions of Japanese yen
Thousands of U.S. dollars
2006 2005 2006 ¥1,514 1,514
¥1,677 1,677
$12,896 12,896
b) Operating leasesOutstanding balances of future lease payments as of March 31, 2006 and 2005 are as follows:
Due within one yearDue after one year
Total
Millions of Japanese yen
Thousands of U.S. dollars
2006 2005 2006 ¥ 169 1,781 ¥1,950
¥ 148 1,721 ¥1,869
$ 1,440 15,164 $16,604
8. Retirement BenefitsThe liability for employees’ retirement benefits at March 31, 2006 and 2005 is as follows:
Projected benefit obligationFair value of plan assetsUnrecognized actuarial lossUnrecognized transitional obligationUnrecognized prior service liabilityNet liability for retirement benefits
Millions of Japanese yen
Thousands of U.S. dollars
2006 2005 2006 ¥(43,196) 31,463 (10,116) 21 (2,937) ¥(24,765)
¥ (43,500) 12,757 2,152 55 (3,916) ¥ (32,451)
$(367,720) 267,843 (86,118) 181 (25,008) $(210,821)
As of April 2005, the Company shifted to a new lump-sum retirement benefit plan in connection with significant revisions to its human resource and retirement benefit systems that involved a shift to a defined benefit plan that uses market rates (cash-balance plan). The Company incurred prior service cost (a reduction of the liability) in the year ended March 31, 2006 as a result of this change.
The components of net periodic benefit costs for the years ended March 31, 2006 and 2005 are as follows:
Service costInterest costExpected return on plan assetsRecognized actuarial lossAmortization of transitional obligationAmortization of prior service liabilityNet periodic benefit costs
Millions of Japanese yen
Thousands of U.S. dollars
2006 2005 2006 ¥2,144 1,062 (186) 307 27 (979) ¥2,376
¥ 2,231 1,658
(659) 10,525 7,530 — ¥21,287
$18,257 9,042
(1,584) 2,617 237 (8,336) $20,233
Discount rateExpected rate of return on plan assetsRecognition period of actuarial gain/lossAmortization period of transitional obligationAmortization period of prior service cost
Assumptions used for the years ended March 31, 2006 and 2005 are set forth as follows: 2006 2005 2.5% 3.5% 7 years 7 years —
2.5% 3.0% 7 years 7 years 4 years

38
9. Supplemental Cash Flow InformationThe following table represents a reconciliation of cash and cash equivalents as of March 31, 2006 and 2005:
Cash and time depositsTime deposits with maturities of more than three monthsCash and cash equivalents
Millions of Japanese yen
Thousands of U.S. dollars
2006 2005 2006 ¥18,980
(224) ¥18,755
¥23,357(710)
¥22,646
$161,575 (1,912) $159,662
10. Selling, General and Administrative ExpensesSelling, general and administrative expenses during fiscal 2006 and 2005 are as follows:
Sales promotion expensesSalaries and wages
Millions of Japanese yen
Thousands of U.S. dollars
2006 2005 2006 ¥51,014 21,685
¥47,068 19,743
$434,279 184,606
11. Extraordinary Income (Losses)Extraordinary income (losses) during fiscal 2006 and 2005 are as follows:
Extraordinary incomeGain on liquidation of affiliated companiesGain on sale of property, plant and equipmentGain on sale of marketable securities
Extraordinary lossesLoss on disposal of property, plant and equipmentLoss on sales of stock of affiliated companiesAmortization of unrecognized retirement benefit obligationExpenses incurred due to revision of workforce and organization
Millions of Japanese yen
Thousands of U.S. dollars
2006 2005 2006 ¥ 315 1,161 —
904 20 — —
¥ — 2,558 182
950 — 13,295 7,337
$2,689 9,890 —
7,698 171 — —
12. Contingent Liabilities1) Guaranteed Financial ObligationsThe Company is contingently liable as guarantor of loans from financial institutions to the following non-consolidated subsidiary and employees:
MEIKA KOUSAN CO., LTD.Employees
Total
Millions of Japanese yen
Thousands of U.S. dollars
2006 2005 2006 ¥ 800 1,188 ¥1,988
¥ 900 1,339 ¥2,239
$ 6,810 10,120 $16,930
2) Notes receivables discounted
Notes receivables discounted
Millions of Japanese yen
Thousands of U.S. dollars
2006 2005 2006 ¥76 ¥30 $649
13. Research and Development CostsResearch and development costs which were included in general and administrative expenses and manufacturing expenses during the fiscal years 2006 and 2005 are as follows:
Research and development costs
Millions of Japanese yen
Thousands of U.S. dollars
2006 2005 2006 ¥16,578 ¥16,852 $141,129
The Company formerly accounted for a portion of research and
development expenses as a manufacturing expense. As a result of significant
reorganization of the Pharmaceutical Research and Development Division,
the Company has revised its treatment of research expenses as per the
standard “Accounting for Research and Development Costs,” and includes
all research expenses in general and administrative expenses. An amount
equivalent to the research and development expenses discussed above
totaling ¥5,227 million was reclassified from indirect manufacturing costs
included in inventories at the beginning of the fiscal year and recorded as
part of extraordinary losses for the fiscal year ended March 31, 2005.
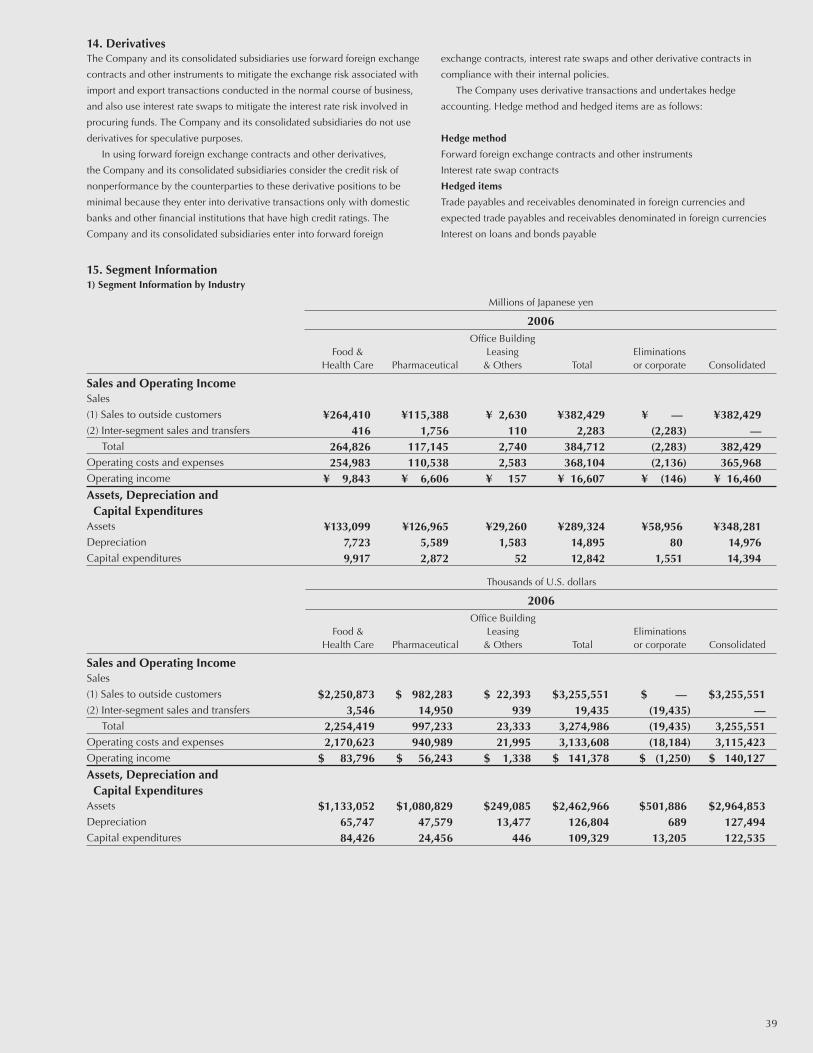
39
14. DerivativesThe Company and its consolidated subsidiaries use forward foreign exchange
contracts and other instruments to mitigate the exchange risk associated with
import and export transactions conducted in the normal course of business,
and also use interest rate swaps to mitigate the interest rate risk involved in
procuring funds. The Company and its consolidated subsidiaries do not use
derivatives for speculative purposes.
In using forward foreign exchange contracts and other derivatives,
the Company and its consolidated subsidiaries consider the credit risk of
nonperformance by the counterparties to these derivative positions to be
minimal because they enter into derivative transactions only with domestic
banks and other financial institutions that have high credit ratings. The
Company and its consolidated subsidiaries enter into forward foreign
exchange contracts, interest rate swaps and other derivative contracts in
compliance with their internal policies.
The Company uses derivative transactions and undertakes hedge
accounting. Hedge method and hedged items are as follows:
Hedge method
Forward foreign exchange contracts and other instruments
Interest rate swap contracts
Hedged items
Trade payables and receivables denominated in foreign currencies and
expected trade payables and receivables denominated in foreign currencies
Interest on loans and bonds payable
15. Segment Information1) Segment Information by Industry
Sales and Operating IncomeSales
(1) Sales to outside customers
(2) Inter-segment sales and transfers
Total
Operating costs and expenses
Operating income
Assets, Depreciation and Capital ExpendituresAssets
Depreciation
Capital expenditures
¥115,388 1,756 117,145 110,538 ¥ 6,606
¥126,965 5,589 2,872
¥ 2,630 110 2,740 2,583 ¥ 157
¥29,260 1,583 52
¥382,429 2,283 384,712 368,104 ¥ 16,607
¥289,324 14,895 12,842
¥382,429 — 382,429 365,968 ¥ 16,460
¥348,281 14,976 14,394
¥264,410 416 264,826 254,983 ¥ 9,843
¥133,099 7,723 9,917
Food &Health Care Pharmaceutical
Office Building Leasing
& Others
¥ —(2,283)(2,283)(2,136)
¥ (146)
¥58,956 80 1,551
Millions of Japanese yen
2006
TotalEliminationsor corporate Consolidated
Sales and Operating IncomeSales
(1) Sales to outside customers
(2) Inter-segment sales and transfers
Total
Operating costs and expenses
Operating income
Assets, Depreciation and Capital ExpendituresAssets
Depreciation
Capital expenditures
$ 982,283 14,950 997,233 940,989 $ 56,243
$1,080,829 47,579 24,456
$ 22,393 939 23,333 21,995 $ 1,338
$249,085 13,477 446
$3,255,551 19,435 3,274,986 3,133,608 $ 141,378
$2,462,966 126,804 109,329
$3,255,551 — 3,255,551 3,115,423 $ 140,127
$2,964,853 127,494 122,535
$2,250,873 3,546 2,254,419 2,170,623 $ 83,796
$1,133,052 65,747 84,426
Food &Health Care Pharmaceutical
Office Building Leasing
& Others
$ — (19,435)
(19,435)(18,184)
$ (1,250)
$501,886 689 13,205
Thousands of U.S. dollars
2006
TotalEliminationsor corporate Consolidated

40
The Company formerly classified operations into four business segments:
Food, Pharmaceutical, Health Care, and Office Building Leasing & Others.
On July 1, in-house companies Food and Health Care merged to form a Food
& Health Care company. Effective from the current consolidated fiscal year,
the Company’s operations are classified into three business segments: Food &
Health Care, Pharmaceutical and Office Building Leasing & Others.
Segment information for the year ended March 31, 2005 restated in
accordance with the segment classification is as follows:
Sales and Operating IncomeSales
(1) Sales to outside customers
(2) Inter-segment sales and transfers
Total
Operating costs and expenses
Operating income
Assets, Depreciation and Capital ExpendituresAssets
Depreciation
Capital expenditures
¥109,530 7,511 117,042 113,525 ¥ 3,516
¥131,131 5,854 6,305
¥19,104 711 19,816 19,933
¥ (117)
¥10,591 18 80
¥ 2,627 114 2,741 2,644 ¥ 96
¥29,950 1,588 36
¥364,018 — 364,018 355,300 ¥ 8,717
¥339,848 14,750 19,827
¥232,755 4,026 236,781 230,381 ¥ 6,399
¥116,356 7,238 7,378
Food Pharmaceutical
Office Building Leasing
& Others
¥364,01812,363
376,381366,485
¥ 9,896
¥288,02914,69913,800
Millions of Japanese yen
2005
TotalEliminationsor corporate Consolidated
Sales and Operating IncomeSales
(1) Sales to outside customers
(2) Inter-segment sales and transfers
Total
Operating costs and expenses
Operating income
Assets, Depreciation and Capital ExpendituresAssets
Depreciation
Capital expenditures
¥109,530 3,883 113,414 109,897 ¥ 3,516
¥131,131 5,854 6,305
¥ 2,627 114 2,741 2,644 ¥ 96
¥29,950 1,588 36
¥364,018 4,383 368,402 358,505 ¥ 9,896
¥287,943 14,699 13,800
¥364,018 — 364,018 355,300 ¥ 8,717
¥339,848 14,750 19,827
¥251,860 386 252,246 245,964 ¥ 6,282
¥126,861 7,256 7,458
Food &Health Care Pharmaceutical
Office Building Leasing
& Others
¥ —(4,383)(4,383)(3,204)
¥ (1,178)
¥51,904 51 6,026
Millions of Japanese yen
2005
TotalEliminationsor corporate Consolidated
2) Segment Information by Region
The Company has omitted segment information by region because domestic sales and assets exceeded 90% of all segments for the years ended March 31,
2006 and 2005.
3) Overseas Sales
The Company has omitted information on overseas sales because such sales accounted for less than 10% of the total fiscal 2006 and 2005 consolidated net
sales.
¥ —(12,363)(12,363)(11,184)
¥ (1,178)
¥51,818 51 6,026
Health Care
Change in classification of business segment

41
Report of Independent Auditors
We have audited the accompanying consolidated balance sheets of Meiji Seika Kaisha, Ltd. and its subsidiaries as of
March 31, 2006, 2005 and 2004, and the related consolidated statements of income, shareholders’ equity and cash flows
for the years then ended, all expressed in Japanese yen. These financial statements are the responsibility of the Company’s
management. Our responsibility is to express an opinion on these financial statements based on our audits.
We conducted our audits in accordance with generally accepted auditing standards in Japan. Those standards require that
we plan and perform the audit to obtain reasonable assurance about whether the financial statements are free of material
misstatement. An audit includes examining, on a test basis, evidence supporting the amounts and disclosures in the financial
statements. An audit also includes assessing the accounting principles used and significant estimates made by management,
as well as evaluating the overall financial statement presentation. We believe that our audits provide a reasonable basis for
our opinion.
In our opinion, the consolidated financial statements referred to above present fairly, in all material respects, the
consolidated financial position of Meiji Seika Kaisha, Ltd. and its subsidiaries as of March 31, 2006, 2005 and 2004, and the
consolidated results of their operations and their cash flows for the years then ended in conformity with generally accepted
accounting principles in Japan.
As described in Note 15, the Company has changed its method of business segment classification in the year ended
March 31, 2006.
The amounts expressed in U.S. dollars, which are provided for solely for the convenience of the readers, have been
translated on the basis set in Note 1.
To the Board of Directors and Shareholders
Meiji Seika Kaisha, Ltd.
Tokyo, Japan
June 28, 2006
The Fuji Accounting Office
Certified Public Accountants

42
Corporate Information (As of March 31, 2006)
Corporate Data
Consolidated Subsidiaries Name Paid-in capital Equity ownership
Main business (Principal subsidiaries) (Millions of yen) (%)
MEIJI FOOD MATERIA CO., LTD. 300 94.87 Sales of sugar, glucose and functional materials
DONAN SHOKUHIN CO., LTD. 40 100.00 Manufacturing and sale of confectionery and other foods
ZAO SHOKUHIN KAISHA, LTD. 10 100.00 Manufacturing and sale of confectionery and other foods
RONDE CORPORATION 50 100.00 Manufacturing and sale of confectionery and other foods
MEIJI SANGYO CO., LTD. 50 85.00*1 Manufacturing and sale of confectionery and other foods
MEIJI CHEWING GUM CO., LTD. 75 51.00 Manufacturing and sale of confectionery and other foods
AZTECA Co., Ltd. 100 100.00 Manufacturing and sale of high-end confectionery
OKAYAMAKEN SHOKUHIN CO., LTD. 50 94.00*1 Manufacturing and sale of confectionery and other foods
SHIKOKU MEIJI CO., LTD. 91 98.94 Manufacturing and sale of confectionery and other foods
TAIYO SHOKUHIN CO., LTD. 80 100.00 Manufacturing and sale of foods
Kitasato Pharmaceutical Industry Co., Ltd. 30 60.00 Sale of vaccines
MEIJI SPORTS PLAZA, Ltd. 90 100.00 Management of sports and recreational facilities
MEIJI AQA SPORTS, Ltd. 100 —*1 Management of sports and recreational facilities
Meiji Seika (Singapore) Pte. Ltd. (Singapore) S$15 million 100.00 Manufacturing and sale of confectionery and confectionery materials
D.F. Stauffer Biscuit Co., Inc. (U.S.A.) US$38,005 thousand 100.00 Manufacturing and sale of confectionery and other foods
Laguna Cookie Co., Inc. (U.S.A.) US$20,729 thousand —*1 Manufacturing and sale of confectionery and other foods
P.T. Meiji Indonesian Pharmaceutical Industries (Indonesia)
Rp9,628 million 83.86 Manufacturing and sale of medical and veterinary products
Thai Meiji Pharmaceutical Co., Ltd. (Thailand) Bt297 million 93.53*2 Manufacturing and sale of medical and veterinary products
Tedec-Meiji Farma S.A. (Spain) Euro 2,028 thousand 20.00*3 Manufacturing and sale of medical products
Mabo Farma S.A. (Spain) Euro 300 thousand —*1 Sale of medical products
Meiji Seika Europe B.V. (Netherlands) Euro 25 thousand 100.00 Finance and investment operations
Notes: *1. Fully owned including indirect shareholdings *2. 94.61% owned including indirect shareholdings *3. 80% owned including indirect shareholdings
Principal Shareholders Name Number of shares Percentage of (Thousands) shares held (%)
Mizuho Bank, Ltd. 18,927 4.91
The Master Trust Bank of Japan, Ltd. (Trust account) 16,965 4.40
The Dai-ichi Mutual Life Insurance Company 16,163 4.19
Nippon Life Insurance Company 14,707 3.81
Fukoku Mutual Life Insurance Company 10,001 2.59
Japan Trustee Services Bank, Ltd. (Trust account) 9,438 2.45
Meiji Dairies Corporation 7,249 1.88
The Bank of Tokyo-Mitsubishi UFJ, Ltd. 6,804 1.77
Tokio Marine & Nichido Fire Insurance Co., Ltd. 6,512 1.69
Asahi Mutual Life Insurance Company 6,386 1.66
Total 113,154 29.35%
Number of Employees: 3,759
Stock Listing: Tokyo
Authorized Common Stock: 796,104,000
Shares Issued and Outstanding: 385,535,116
Number of Shareholders: 71,161

43
[AMERICAS]
D.F. Stauffer Biscuit Co., Inc.Belmont and Sixth Avenue, York, PA 17403, U.S.A.Telephone: 1-717-843-9016Facsimile: 1-717-854-2387
Laguna Cookie Company, Inc.4041 West Garry Ave., Santa Ana, CA 92704, U.S.A.Telephone: 1-714-546-6855Facsimile: 1-714-556-2491
Mecor, Inc.600 Corporate Circle, Suite H, Golden, CO 80401, U.S.A.Telephone: 1-303-216-2489Facsimile: 1-303-216-2477
Comércio e Indústria Uníquimica Ltda.Av. Casa Grande, 574 Bairro Casa Grande, Diadema, CEP 09961-350, São Paulo, BrasilTelephone: 55-11-4066-6277Facsimile: 55-11-4066-6359
[EUROPE]
Meiji Seika Kaisha, Ltd., London OfficeSalisbury House, Finsbury Circus, London EC2M 5QQ, EnglandTelephone: 44-20-7638-2283Facsimile: 44-20-7638-0460
Béghin MeijiRue du Petit Versailles BP 08 F 59239 Thumeries, FranceTelephone: 33-3-20-90-40-41Facsimile: 33-3-20-90-40-49
Meiji Seika Europe B.V.Atrium, Strawinskylaan 3105, 1077 ZX Amsterdam, NetherlandsTelephone: 31-20-646-59-56Facsimile: 31-20-642-76-75
Tedec-Meiji Farma S.A.Carretera M-300, Km 30,500, 28802 Alcala de Henares, Madrid, SpainTelephone: 34-91-887-09-80Facsimile: 34-91-883-70-23
Mabo Farma S.A.Carretera M-300, Km 30,500, 28802 Alcala de Henares, Madrid, SpainTelephone: 34-91-887-09-80Facsimile: 34-91-883-70-23
[ASIA]
Meiji Seika Kaisha, Ltd., Singapore OfficeMeiji Seika Kaisha (Singapore) Pte. Ltd.36 Quality Road, Jurong Town, 618806, SingaporeTelephone: 65-6265-2411Facsimile: 65-6265-2834
P.T. Meiji Indonesian Pharmaceutical Industries(Office)JI. Tanah Abang II, No. 4 Jakarta 10160, P.O. Box 3611 Jakarta 10036, IndonesiaTelephone: 62-21-384-5584Facsimile: 62-21-345-7650(Factory)JI. Mojoparon 1, Bangi 167153, Pasuruan, Jawa Timur, IndonesiaTelephone: 62-343-741102Facsimile: 62-343-741103
P.T. Ceres Meiji IndotamaJI. Maligi III, Lot J-2B, KIIC Karawang 41361, IndonesiaTelephone: 62-21-891-09777Facsimile: 62-21-891-09779
Thai Meiji Pharmaceutical Co., Ltd.(Office)8th Floor, Regent House, 183 Rajdamri Road, Lumpinee, Pathumwan, Bangkok 10330,ThailandTelephone: 66-2-251-1570Facsimile: 66-2-651-9063(Factory)64 Moo 4, Ladkrabang Industrial Estate, Chalongkrung Road, Lamplatiew,Ladkrabang, Bangkok 10520, ThailandTelephone: 66-2-326-0750–0754Facsimile: 66-2-326-0958
Guangzhou Meiji Confectionery Co., Ltd.1st Floor A-7 Building, Bei Wei Industrial One Zone, Guangzhou Economic & Technological Development Zone, Guangzhou, ChinaTelephone: 86-20-8221-4446Facsimile: 86-20-8221-4445
Shantou Meiji Pharmaceuticals Co., Ltd.West 3/F, Block 9, Da Bei Shan Er Lu, Longhu Industrial District, Shantou S.E.Z., Guangdong, ChinaTelephone: 86-754-8805172Facsimile: 86-754-8805220
Meiji Lukang Pharmaceutical Co., Ltd.8 East Ringroad, Jining High-Tech Development Zone, Shandong, ChinaTelephone: 86-537-2386006Facsimile: 86-537-2486003
Meiji Seika (Shanghai) Co., Ltd.Room No. 2501, Shanghai International Trade Center, 2201, Yan An West Road, Shanghai, ChinaTelephone: 86-21-6219-3360Facsimile: 86-21-6219-9136
Meiji Seika Kaisha, Ltd., Beijing OfficeRoom 303, Tower B, Winterless Center Property Management Office, No. 1 West Dawanglu Road, Chaoyang District, Beijing 100026, ChinaTelephone: 86-10-6538-8196Facsimile: 86-10-6538-8199
Overseas Offices and Affiliates
Stock Price Range and Trading Volume
0
200
400
600
800
1,000
’01/4 ’02/4 ’03/4 ’04/4 ’05/4 ’06/4
Common Stock Price Range (¥)Low
HighOpening
ClosingLow
High
Opening
Closing Black: Opening Price > Closing PriceWhite: Closing Price > Opening Price
0
10,000
20,000
30,000
40,000
0
200
400
600
800
1000
0
200
400
600
800
1000
0
200
400
600
800
1000
0
200
400
600
800
1000
’01/4 ’02/4 ’03/4 ’04/4 ’05/4 ’06/4
0
200
400
600
800
1000
Trading Volume (Thousands of shares)
4-16, Kyobashi 2-chome, Chuo-ku,Tokyo 104-8002, JapanTelephone: 81-3-3272-6511Facsimile: 81-3-3271-3528
Printed in Japan on 100% recycled paper.