Year-End Report 2019 - Investor AB€¦ · partly driven by higher sales and marketing expenses....
34
Year-End Report 2019 Johan Forssell, CEO Helena Saxon, CFO 1
Transcript of Year-End Report 2019 - Investor AB€¦ · partly driven by higher sales and marketing expenses....

Year-End Report 2019Johan Forssell, CEOHelena Saxon, CFO
1

2
2019 Global Economy

3
XXTotal avkastning 2019
XXTSR Marknaden
40%Total Shareholder Return, 2019
Investor AB
35%Total Shareholder Return, 2019
SIXRX

4
XXTotal avkastning 2019
XXTSR Marknaden
13%2019 sales growth, of which 4%
organic in constant currency, in major subsidiaries
18%2019 EBITA growth in major subsidiaries

5
Key activities in 2019
Electroluxproposal to list Professional
Strategicacquisitions In Laborie and
Piab
ABB SEK 4.3bn invested
PeopleSeveral new CEOs and
board members
EQT AB listed on NASDAQ Stockholm
Cash flow Strong
contribution from all
business areas

6
XXTotal avkastning 2019
XXTSR Marknaden
0
2
4
6
8
10
12
14
16
2010 2011 2012 2013 2014 2015 2016 2017 2018 2019p
DPS
+ 8% Pay a steadily rising dividend

7
Q4 2019 Highlights
6%Adjusted NAV
growth(SIXRX +10%)
6%Adjusted EBITA growth in major
subsidiaries
Strategicacquisitions In Laborie and
Piab
ABB SEK 1.0bn invested
7%TSR
(SIXRX +10%)

Patricia Industries
8

9
Patricia Industries – development in Q4 2019
-3% - Earnings growth and good cash flow impacted positively
- However, multiple contraction and currency impacted negatively
value change (excl. cash)

Patricia Industries – value change (excluding cash), 2019
10
23% Value change 2019
>2/3 driven by earnings growth & cash flow
<1/3driven by multiples

Patricia Industries – operational development Q4 2019
2 percent organic sales growth, %
11
VecturaGrand Group
SarnovaMölnlyckeLaborie BraunAbility
Permobil
-2%
8%
Piab
4%
8%
5%
3%
1%
-9%
23%of tot. adjusted assets
115SEK bn
3% Reported EBITA
growth
6%Adjusted EBITA
growth

12
A provider of advanced products for treatment and prevention of wounds and single-use surgical solutions
Q4 2019
• Organic sales growth +1 percent in constant currency• Wound Care +1 percent• Surgical +2 percent driven by Surgical Trays
and Antiseptics
• All regions relatively flat, Emerging Markets grew faster than the group, but slower than previously in 2019
• EBITA margin essentially flat
• Strong cash flow, EUR 243m distributed to Patricia Industries IFRS 16 implemented as of the first quarter 2019
0
5
10
15
20
25
30
35
0
50
100
150
200
250
300
350
400
450
Q416
Q117
Q217
Q317
Q417
Q118
Q218
Q318
Q418
Q119
Q219
Q319
Q419
%EUR m.
Sales EBITDA, % EBITA, %
13
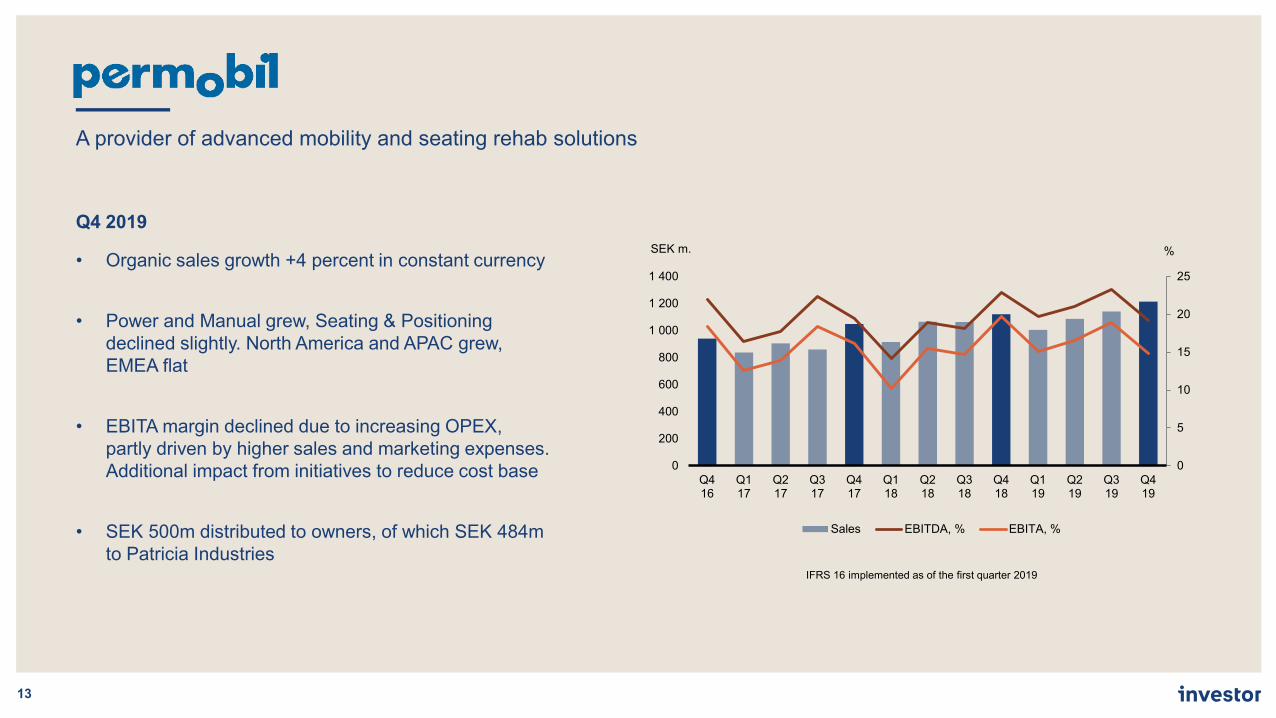
A provider of advanced mobility and seating rehab solutions
Q4 2019
• Organic sales growth +4 percent in constant currency
• Power and Manual grew, Seating & Positioning declined slightly. North America and APAC grew, EMEA flat
• EBITA margin declined due to increasing OPEX, partly driven by higher sales and marketing expenses. Additional impact from initiatives to reduce cost base
• SEK 500m distributed to owners, of which SEK 484m to Patricia Industries
IFRS 16 implemented as of the first quarter 2019
0
5
10
15
20
25
0
200
400
600
800
1 000
1 200
1 400
Q416
Q117
Q217
Q317
Q417
Q118
Q218
Q318
Q418
Q119
Q219
Q319
Q419
%SEK m.
Sales EBITDA, % EBITA, %
14
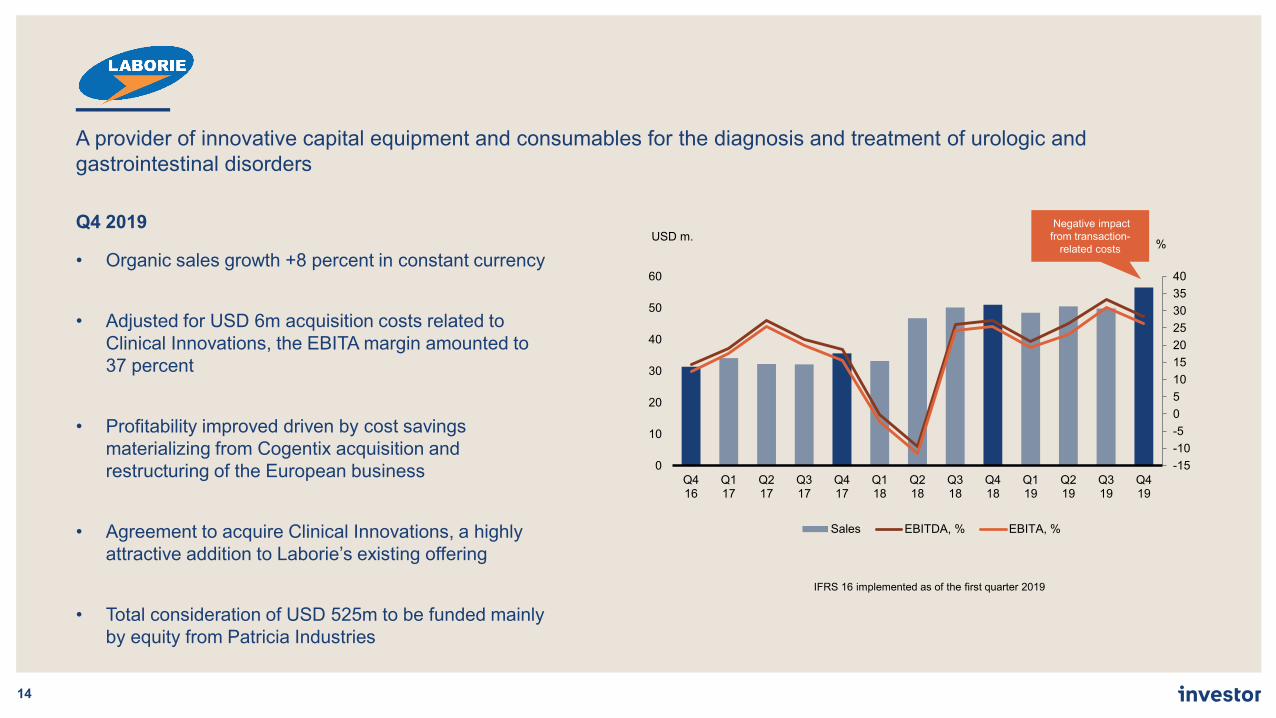
A provider of innovative capital equipment and consumables for the diagnosis and treatment of urologic and gastrointestinal disorders
Q4 2019
• Organic sales growth +8 percent in constant currency
• Adjusted for USD 6m acquisition costs related to Clinical Innovations, the EBITA margin amounted to 37 percent
• Profitability improved driven by cost savings materializing from Cogentix acquisition and restructuring of the European business
• Agreement to acquire Clinical Innovations, a highly attractive addition to Laborie’s existing offering
• Total consideration of USD 525m to be funded mainly by equity from Patricia Industries
IFRS 16 implemented as of the first quarter 2019
-15-10-50510152025303540
0
10
20
30
40
50
60
Q416
Q117
Q217
Q317
Q417
Q118
Q218
Q318
Q418
Q119
Q219
Q319
Q419
%USD m.
Sales EBITDA, % EBITA, %
Negative impact from transaction-
related costs

Laborie - Clinical Innovations
15
• Provider of single-use products for hospital labor & delivery and neonatal intensive care units
• Market-leading positions in segments with favorable long-term growth dynamics
• High-risk births expected to increase• Under-penetration in Emerging Markets
• 2019 sales estimated at USD 70m
• Good organic growth, strong profitability and cash conversion

16
A manufacturer of wheelchair accessible vehicles and wheelchair lifts
Q4 2019
• Organic sales growth +5 percent in constant currency
• Strong growth in Commercial WAVs, good growth in Consumer WAVs, Lifts down slightly
• EBITA margin improved, driven by operating efficiency improvements and supply chain optimization initiatives
• Strong cash flow driven by good management of working capital
IFRS 16 implemented as of the first quarter 2019
0
2
4
6
8
10
12
0
50
100
150
200
250
Q416
Q117
Q217
Q317
Q417
Q118
Q218
Q318
Q418
Q119
Q219
Q319
Q419
%USD m.
Sales EBITDA, % EBITA, %

17
A provider of gripping and moving solutions for automated manufacturing and logistics processes
Q4 2019
• Organic sales growth -9 percent in constant currency
• Americas grew slightly, Europe and APAC declined. Moderate growth in Vacuum Automation, all other divisions declined. Largest decline in Robotic Gripping
• Adjusted for SEK 9m in transaction costs related to the acquisition of TAWI Group, the adjusted EBITA margin amounted to 24 percent. Profitability declined mainly due to lower sales
• Acquisition of TAWI Group adds more than 25 percent to group sales and makes Piab a world leader within Ergonomic Handling
IFRS 16 implemented as of the first quarter 2019
0
5
10
15
20
25
30
35
40
0
50
100
150
200
250
300
350
400
Q117
Q217
Q317
Q417
Q118
Q218
Q318
Q418
Q119
Q219
Q319
Q419
%SEK m.
Sales EBITDA, % EBITA, %
Negative impact from transaction-
related costs

Piab – TAWI Group
18
• TAWI - a leading manufacturer of smart lifting solutions with global reach
• SEK 350m sales in 2019 with good profitability
• Strong sales growth and profitability
• E-commerce logistics one of several key growth drivers
19
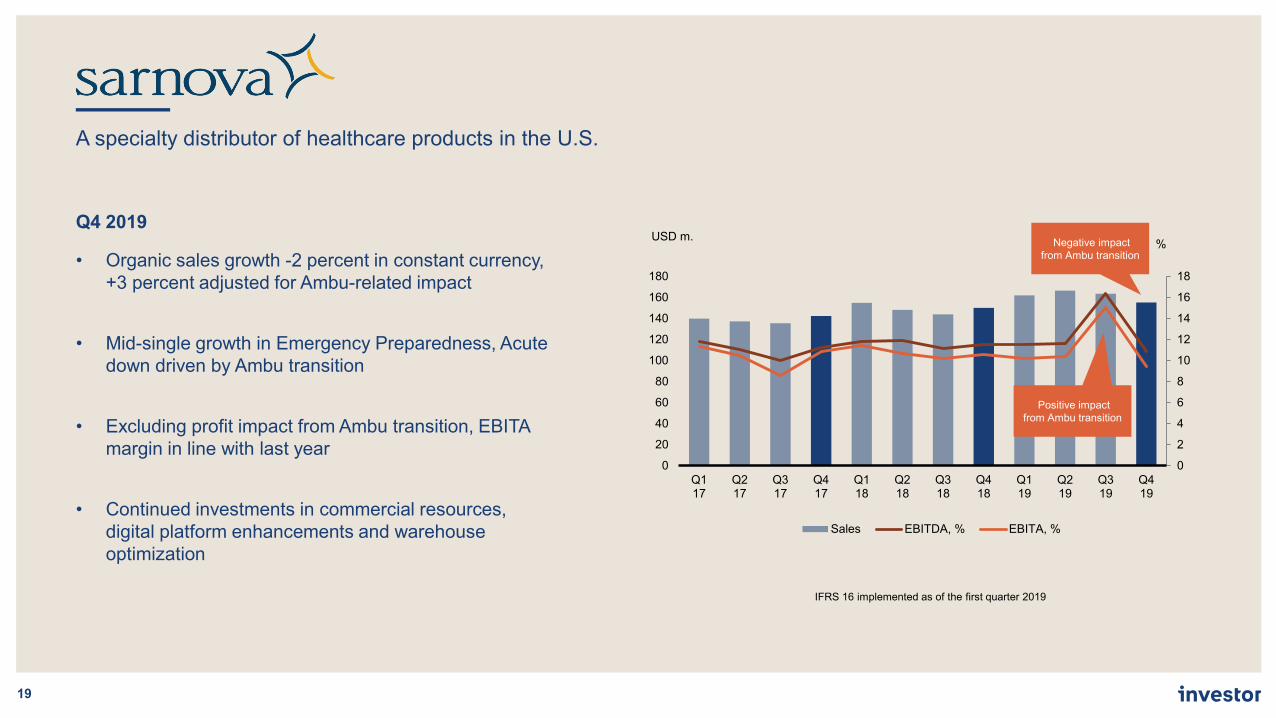
A specialty distributor of healthcare products in the U.S.
Q4 2019
• Organic sales growth -2 percent in constant currency, +3 percent adjusted for Ambu-related impact
• Mid-single growth in Emergency Preparedness, Acute down driven by Ambu transition
• Excluding profit impact from Ambu transition, EBITA margin in line with last year
• Continued investments in commercial resources, digital platform enhancements and warehouse optimization
IFRS 16 implemented as of the first quarter 2019
0
2
4
6
8
10
12
14
16
18
0
20
40
60
80
100
120
140
160
180
Q117
Q217
Q317
Q417
Q118
Q218
Q318
Q418
Q119
Q219
Q319
Q419
%USD m.
Sales EBITDA, % EBITA, %
Negative impact from Ambu transition
Positive impact from Ambu transition

20
A provider of mobile voice and broadband services in Sweden and Denmark
Q4 2019
• Subscription base +53,000
• Service revenue +5 percent excluding previously communicated Swedish VAT ruling
• Excl. IFRS 16, Swedish VAT ruling and a non-recurring expense related to a group strategy project last year, EBITDA +8 percent
IFRS 16 implemented as of the first quarter 2019
-30
-20
-10
0
10
20
30
40
50
0
500
1 000
1 500
2 000
2 500
3 000
3 500
Q416
Q117
Q217
Q317
Q417
Q118
Q218
Q318
Q418
Q119
Q219
Q319
Q419
%SEK m.
Sales EBITDA reported, %
Negative impact from VAT rulings
Negative impact from VAT rulings

Investments in EQT
21

Investments in EQT
22
7%of tot. adjusted assets
37SEK bn
11%Total value change constant currency (9% reported) 2.7
SEK bnNet cash flow Q4
24%Total Return EQT AB
1%Value change, constant currency, investments in
EQT funds
0
5
10
15
20
25
30
35
40
1 year 5 years 10 years 20 years
Percent
Investor B SIXRX
23
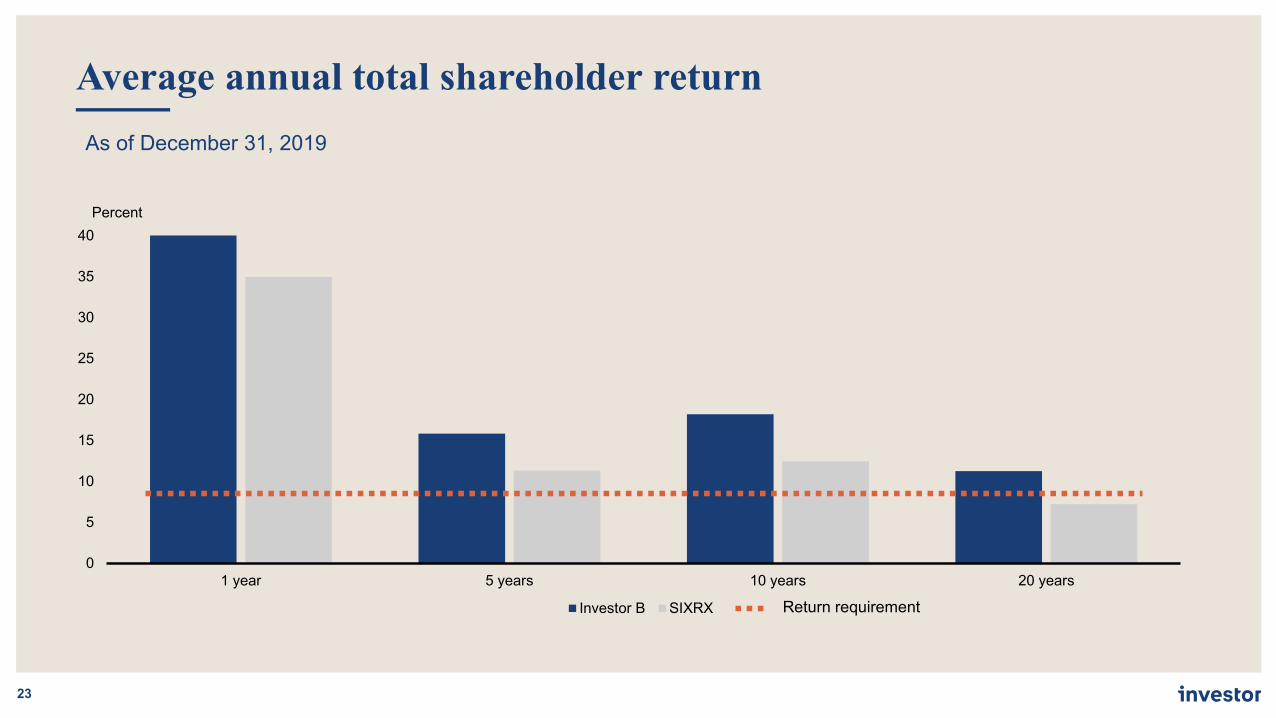
Average annual total shareholder returnAs of December 31, 2019
Return requirement

Year-End Report 2019Helena Saxon, CFO
24
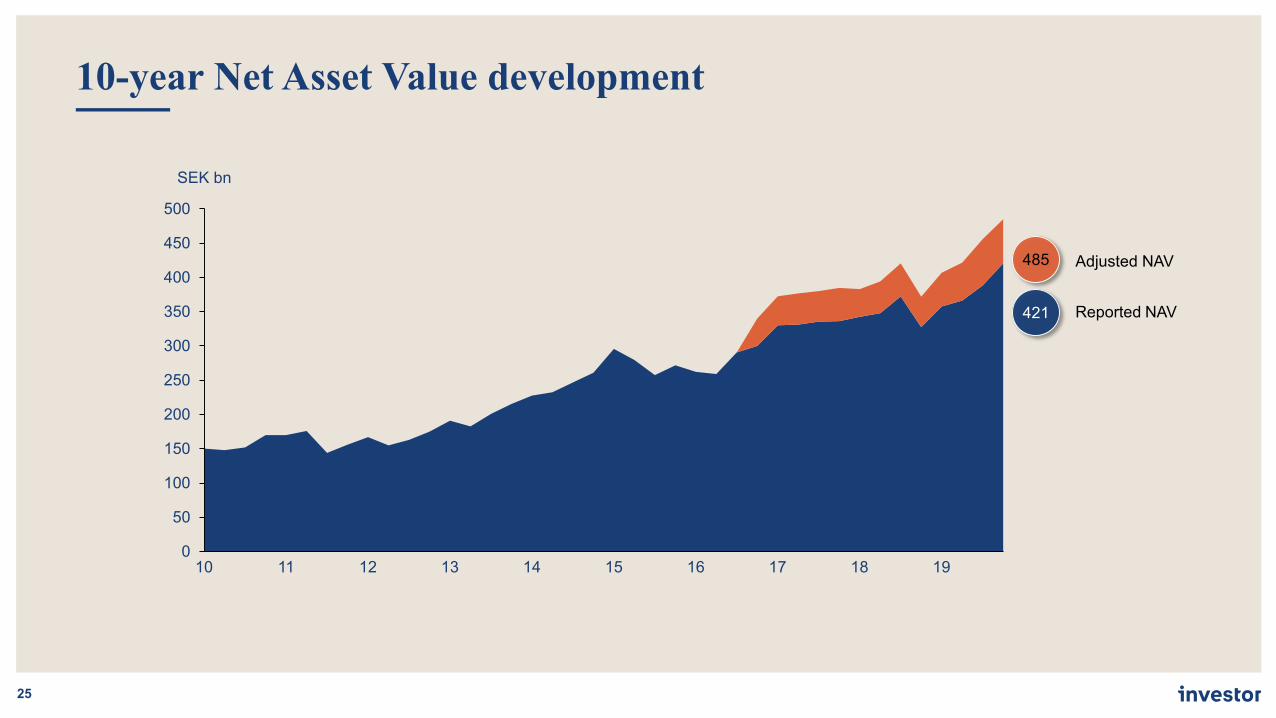
10-year Net Asset Value development
25
0
50
100
150
200
250
300
350
400
450
500
13
SEK bn
1410 11 12 15 16 17 18 19
421
485
Reported NAV
Adjusted NAV

Listed Companies
26
Q4 2019 Summary
• Total contribution to NAV SEK 30bn• Listed Companies TSR 9%, SIXRX 10%
Atlas Copco 22%
ABB 17%
AstraZeneca 14%
SEB 12%
Epiroc 7%
Ericsson 6%
Nasdaq 6%
Sobi 5%
Saab 4%Electrolux 3%
Wärtsilä 3% Husqvarna 2%
-10
-5
0
5
10
15
20
25
10
0
-2
2
8
4
6
12
16
14
6.9
1.9
%
Elec
trolu
x
QTD, SEK bn
Atla
s C
opco
16.6
-6.2
Nas
daq
Astra
Zene
ca
Epiro
c
Saab
Eric
sson
Sobi
Hus
qvar
na
Wär
tsilä
SEB
24.3
2.9
9.111.5
6.2
1.90.0
-3.0
ABB
Contribution to NAV TSR
69%of tot. adjusted assets
345SEK bn

Patricia Industries – value change (excluding cash), Q4 2019
27
MultiplesPerformance and cash flow
-6
-3
FX + other Net increase/decrease
5
-4
SEK bn
Q4 growth
-3%

Patricia Industries – change in Estimated Market Values
28
Q4 2019 Summary Estimated market value change
-3%value
decreaseexcl. cash
1 667 1 368 629 80
(682) (277) (208)
(2 000)
6 494
MölnlyckeThree Scandinavia
Financial Investments
Sarnova Aleris exit proceeds
(2 142)
Grand Group
Total NAV Dec 2019
LaborieTotal NAV Sept 2019
136 381
PemobilVectura
(7 328)(1 534)
140 313
BraunAbilityPiab Patricia Cash
Distributions/proceeds

Major Drivers of Estimated Market Values Q4 2019
29
SEK -7.3bn Lower multiples, currency impacted negatively, partly offset by cash flow. SEK 2.6bn distribution
CompanyEst. market value
change Q4 2019 vs. Q3 2019
Major drivers
SEK +1.7bn Higher profit, multiples impacted positively
SEK -0.3bn Strong earnings growth impacted positively, lower multiples and currency impacted negatively
SEK +0.7bn First time at estimated market values. Sarnovaimpacted positively, Piab impacted negatively
SEK -1.5bn Lower multiples, profit impacted negatively, partly offset by cash flow. SEK 0.5bn distribution

Financial Investments
30
Q4 2019 Summary
• The realization of the portfolio continues
• SEK 1.6bn cash proceeds received from exits of NS Focus, HireVue and Acquia
Five largest financial investments, December 31, 2019
~4.3SEK bnValue
December 31, 2019
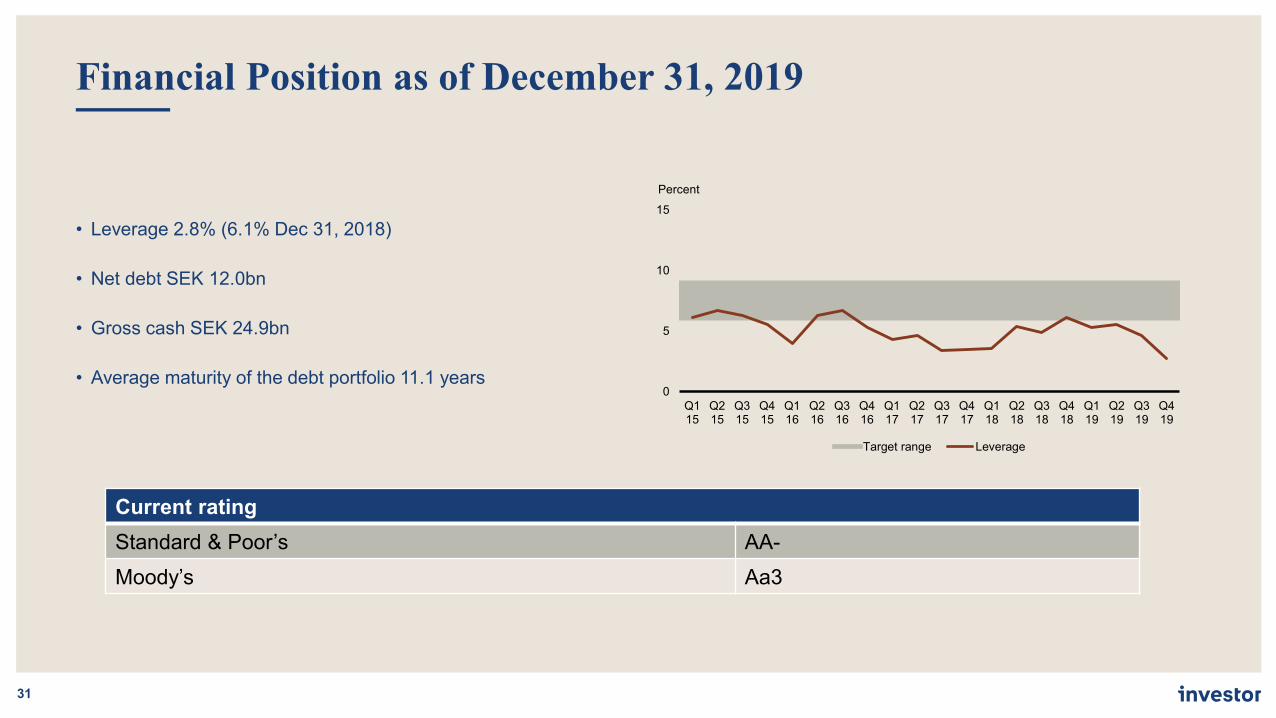
Financial Position as of December 31, 2019
31
• Leverage 2.8% (6.1% Dec 31, 2018)
• Net debt SEK 12.0bn
• Gross cash SEK 24.9bn
• Average maturity of the debt portfolio 11.1 years
Current ratingStandard & Poor’s AA-Moody’s Aa3
0
5
10
15
Q115
Q215
Q315
Q415
Q116
Q216
Q316
Q416
Q117
Q217
Q317
Q417
Q118
Q218
Q318
Q418
Q119
Q219
Q319
Q419
Percent
Target range Leverage

Strong cash flow generation gives great financial flexibility
LISTED COMPANIES
LISTED COMPANIES
DIVIDEND PAID
~77SEK bn
32
Cash flow 2015-2019 Sources Uses
Net debt approximately SEK 8bn lower, leverage down from 7.3 percent to 2.8 percent
Net otherInvestments in EQT
~85SEK bn
*Including divestment of Aleris

We create value for people and society
by buildingstrong and sustainable
businesses

Financial Calendar & Contact Details
34
Event Date
Interim Management Statement January – March 2020 April 22, 2020
Interim Report January – June 2020 July 17, 2020
Interim Management Statement January-September 2020 October 19, 2020
Contact Details
Viveka Hirdman-Ryrberg +46 70 550 3500
Head of Corporate Communication and Sustainability [email protected]
Magnus Dalhammar +46 73 524 2130
Head of Investor Relations [email protected]