Yara Third Quarter 2021 Presentation
32
Yara International ASA 2021 Third quarter results 20 October 2021
Transcript of Yara Third Quarter 2021 Presentation

Yara International ASA2021 Third quarter results20 October 2021

This presentation contains forward-looking information and statements relating tothe business, financial performance and results of Yara and/or industry andmarkets in which it operates. Forward-looking statements are statements that arenot historical facts and may be identified by words such as "aims", "anticipates","believes", "estimates", "expects", "foresees", "intends", "plans", "predicts","projects", "targets", and similar expressions. Such forward-looking statementsare based on current expectations, estimates and projections, reflect currentviews with respect to future events, and are subject to risks, uncertainties andassumptions. Forward-looking statements are not guarantees of futureperformance, and risks, uncertainties and other important factors could cause theactual business, financial performance, results or the industry and markets inwhich Yara operates to differ materially from the statements expressed or impliedin this presentation by such forward-looking statements. No representation ismade that any of these forward-looking statements or forecasts will come to passor that any forecasted results will be achieved, and you are cautioned not to placeany undue reliance on any forward-looking statements.
Cautionary note
2

Our ambition is zero injuries
1) Total Recordable Injuries per 1 million working hours
TRI1 (12-month rolling)
People
3
3Q211Q160
1
2
3
4
5
1.1

• Improved returns reflecting higher prices
• 8.3% ROIC1, up from 7.9% a year earlier
• ~40% ammonia curtailment in Europe3.7 %
6.1 %
7.9 %
3Q2018
3Q2019
3Q2020
3Q2021
ROIC1 12M rolling
1) For definition and reconciliation of ROIC, see APM section in 3Q report, page 312) Effect of Salitre impairment on 3Q21 ROIC: calculated by increasing NOPAT by 266 MUSD (impairment of 355 MUSD with a 25% tax rate). This implies a ROIC excluding Salitre impairment of 10.6%
(NOPAT: 1,206 MUSD divided by invested capital of 11,353 MUSD).4
Improved returns demonstrate business model resilience
8.3%Salitre impairment2 (2.3 pp)
ROIC 12M rolling

Natural gas spike in Europe has triggered significant curtailmentsand driven up global nitrogen prices
5
Yara Europe ammonia curtailments currently amount to around ~40% of capacity
High Yara flexibility; unprofitable production curtailed and replaced with sourcing, from other Yara plants and from global trade
Limited impact on finished fertilizer production to date; Yara is closely monitoring the situation going forward
Yara is committed to supplying customers provided sufficient margins are available
Curtailed production capacity
2.93.6
1.9 3.6
Europe Other regions
4.8
Curtailed In operation
Ammonia production capacity p.a. in million tons

1) Change in net operating capital as presented in the cash flow statement, page 14 of 3Q report, and consists of trade receivables, inventories, and trade and other payables
2) Net cash used in investing activities as presented in the cash flow statement, page 14 of 3Q report. 3) 3Q20 figures includes proceeds (USD 1 billion) from the sale of Yara’s shares in QafcoAlternative performance measures are defined, explained and reconciled to the Financial statements in the APM section of the 3Q report on pages 29-34
EBITDA ex. special items(MUSD)
EPS ex. currency and special items(USD per share)
Cash from operations(MUSD)
Investments (net)2,3
(MUSD)
ROIC(12-month rolling)
Change in net operating capital1(MUSD)
Financial performance
Prosperity 3Q20 3Q21
558765
3Q20 3Q21
0.881.33
3Q20 3Q21
7.9 8.3
3Q20 3Q21
222
-731
3Q20 3Q21
854
-2273Q20 3Q21
659
-91
6

EBITDA increase driven by higher prices
EBITDA ex. special items (MUSD)1
ROIC2
3Q20 3Q21OtherMargin CurrencyVolume/Mix
558
-12
240
-4 -16
765
0
300
600
900
10.4 % 4.1 %
1) EBITDA ex. special items. For definition and reconciliation see APM section of 3Q report, page 292) Quarterly ROIC, annualized. For definition and reconciliation see APM section of 3Q report, page 30
7
Fixed costs: -14Other: -2
Of which energy cost: -410

Improved results in all regions, with strong contribution from overseas production assets
Europe Americas Africa and Asia
Industrial Solutions
Global Plants
1) EBITDA ex. special items. For definition and reconciliation see APM section of 3Q report, page 292) For definition and reconciliation of ROIC, see APM section in 3Q report, page 303) ROIC for Americas excluding Salitre impairment: 11.4% - calculated by increasing NOPAT by 266 MUSD (impairment of 355 MUSD with a 25% tax rate). This implies a ROIC excluding Salitre
impairment of 11.4 % (NOPAT: 442 MUSD divided by invested capital of 3,889 MUSD).
Clean Ammonia
EBITDA ex. special items1 (MUSD)
8
108148
3Q20 3Q21
181
285
3Q20 3Q21
36
103
3Q20 3Q21
96
64
3Q20 3Q21
118145
3Q20 3Q21
2938
3Q20 3Q21
Europe Americas Africa and Asia
Industrial Solutions
Global Plants Clean Ammonia
ROIC2 (%)
6 %10 %
3Q20 3Q21
6 %5 %
3Q20 3Q21
1 %
5 %
3Q20 3Q21
16 % 16 %
3Q20 3Q21
14 % 14 %
3Q20 3Q21
20 %24 %
3Q20 3Q21
3
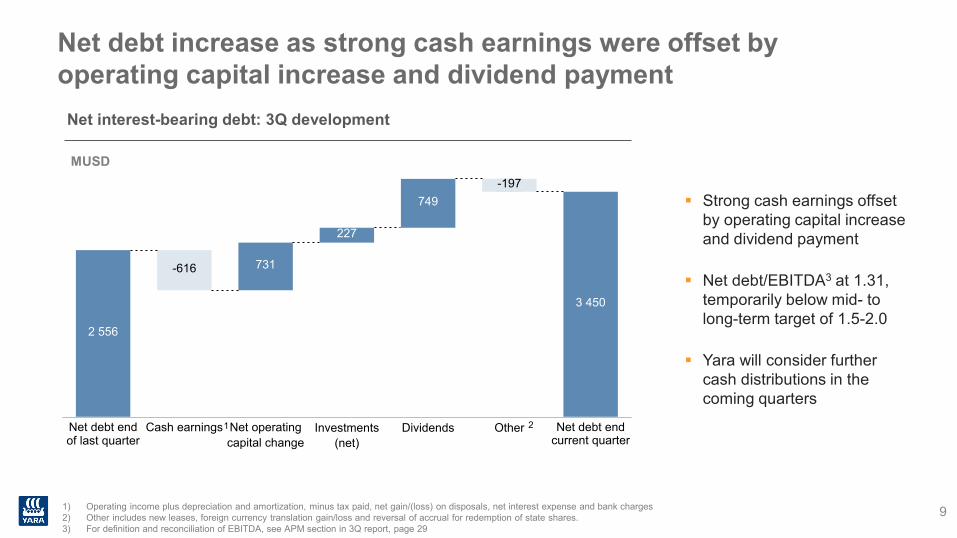
Net debt increase as strong cash earnings were offset by operating capital increase and dividend payment
1) Operating income plus depreciation and amortization, minus tax paid, net gain/(loss) on disposals, net interest expense and bank charges2) Other includes new leases, foreign currency translation gain/loss and reversal of accrual for redemption of state shares.3) For definition and reconciliation of EBITDA, see APM section in 3Q report, page 29
MUSD
Net interest-bearing debt: 3Q development
OtherDividendsInvestments(net)
Net debt endof last quarter
Cash earnings Net operatingcapital change
Net debt endcurrent quarter
2 556
-616 731
227
749-197
3 450
9
Strong cash earnings offset by operating capital increase and dividend payment
Net debt/EBITDA3 at 1.31, temporarily below mid- to long-term target of 1.5-2.0
Yara will consider further cash distributions in the coming quarters
1 2

Yara Improvement Program (YIP) performance
Fixed costs1 Operating capital2
MUSD Days • Positive finished product performance, ammonia production and energy consumption impacted by reliability issues
• Europe curtailments will impact energy efficiency and CO2 emission intensity
• Temporary fixed costs increase in line with 4Q20 communication, offset by lower capex
• Continued operating capital improvement, driven by inventory and receivable days
1) For reconciliation of Fixed costs to Operating costs and expenses, see APM section of 3Q report, page 322) Operating capital excluding prepayments from customers. For reconciliation of Operating capital days, see APM section of 3Q report, page 333) Portfolio change impact (ammonia: Trinidad plant closure 250kt, finished products: Salitre 900kt)
Comments:
Ammonia energy consumptionAmmonia production
GJ/tonMillion tonnes
Finished product production
Million tonnes
7.9 7.8 7.7 7.88.9
2018 2019 2020 L12M 2023target
20.9 21.1 21.3 21.7 23.9
2018 2019 2020 L12M 2023target
0
10
20
3034.1 33.7 33.2 33.2 32.7
2018 2019 2020 L12M 2023target
2 314 2 291 2 322 2 423 2 314
2018 2019 2020 L12M 2023target
104115 113
90 92
2018 2019 2020 L12M 2023target
10
Portfolio adjustment3 Portfolio adjustment3

European nitrogen production is essential to global food security
11
Finished nitrogen products, nutrient tonnes1
Sources: 1) IFA 2020, 2) Broadbalk long term trial Rothamsted UK, 3) Erisman, J. W., Sutton, M. A., Galloway, J., Klimont, Z., & Winiwarter, W. (2008). How a century of ammonia synthesis changed the world. Nature Geoscience, and Our World in Data: https://ourworldindata.org/grapher/world-population-with-and-without-fertilizer
Grain yield from Nitrogen fertilizer2
Tonne per hectare
Long term without N
1 year without N
With N Fertilizer
9.6
5.5
1.8
-43%
Annual nitrogen application is critical for crops
15%
Europe represents a significant share of global nitrogen production
Nitrogen fertilizer provides food for ~1/2 of the world’s population
7.4
World population
with nitrogen fertilizers
3.8
World population
without nitrogen fertilizers
-3.5
Billion people3 (2015)

Resilient business model and collaborative strategy
Broadening our core towards food solutions
Enabling the Hydrogen economy
Ramping up business within Green Ammonia
Diverse and inclusive culture
Active portfolio management
Clear capital allocation
Ourcompetitive
edge
PeopleKnowledge
Driving Sustainable Performance
Connection to FarmGlobal footprint
12

Global food security cannot be solved by any individual company or country; broad collaboration is essential
13
Yara is well positioned to support the much needed food system transformation
We have already demonstrated what is possible through collaboration
Global footprint
Resilient business model and collaborative strategy
Products and solutions to improve yields and reduce emissions
Action Africa

Appendix

Driving sustainable performance with an integrated scorecard
People Planet Prosperity
15
PlanetPeople
Yara KPI
Energy efficiency
GHG emissions, intensity
GHG emissions, scope1+2
Active hectares
Carbon marketplace
2020
33.2
3.0
17.7
8
L12M
33.2
3.0
17.5
8
2025Target
32.7
2.7
-30
150
TBD
Measure
Gj/t NH3
t CO2e/t N
% CO2e
MHa
Yara KPI
Strive towards zeroaccidents
Engagement Index
Diversity and inclusionindex
Female senior managers
2020
1.3
79%
74%
24%
L12M
1.1
27%
2025Target
<1.0
Topquartile
Topquartile
40%
Measure
TRI
Index
Index
%
3
6
6,7
6,7
6
1) Measured annually2) Energy efficiency target is for 20233) GHG absolute emissions scope 1+2 target is for 2030 with a 2019 baseline4) Cropland with digital farming user activity within defined frequency parameters5) Reported upon updates6) YIP target for 20237) Alternative performance measures are defined, explained and reconciled to the Financial statements in the APM
section of the 3Q 21 Report on pages 29-348) CAPEX max 1.2 for 2022 onwards (including maintenance)
2
5
7
8
7
4
1
1
Yara KPI
Ammonia Production
Finished FertilliserProduction
Premium generated
Revenues from newbusiness models
Revenues from onlinesales
Working capital
Capital return (ROIC)
Fixed costs
Capex
Net debt / EBITDA
MSCI rating
Sustainalytics rating
2020
7.7
21.3
1 036
6
0
113
8%
2 322
0.8
1.36
BBB
Med
L12M
7.8
21.7
711
8
2
90
8.3 %
2 423
0.9
1.31
A
Med
2025Target
8.9
23.9
N/A
1 500
1 200
92
>10%
2 314
1.2
1.5-2.0
A
Med
Measure
Mt
Mt
MUSD
MUSD
MUSD
Days
%
MUSD
BUSD
Ratio
Score
Score

External revenues (MUSD) ROIC (12-month rolling)EBITDA ex SI (MUSD)
Europe: higher prices more than offset lower volumes
3Q20 3Q21
108148
+37%
3Q20 3Q21
6.2%
9.9%
651
891
3Q20 3Q21
159
492
229
662
+37% Premiumproducts
Commodities
• Higher prices • Deliveries decreased with 9% in an
overall slow market where customers were hesitant to take positions early in the season
• Higher prices more than offset higher feedstock costs and lower volumes
• Improved earnings and lower working capital
16Alternative performance measures are defined, explained and reconciled to the Financial statements in the APM section of the 3Q report on pages 29-34For operating segment information, refer to Note 3 Operating segment information in the 3Q report on pages 17-22

External revenues (MUSD) ROIC (12-month rolling)EBITDA ex SI (MUSD)
Americas: stable deliveries and higher margins
3Q20 3Q21
181
285
+57%
3Q20 3Q21
6.5%4.5%
1 303
1 972
3Q20 3Q21
800
503
1192
780
+51% Premiumproducts
Commodities
• Higher prices • 3Q deliveries in line with a year
earlier, but increased share of premium products
• Increased nitrogen prices more than offset energy costs and inventory write-down
• Strong margin improvement, particularly in the ammonia plants
• Salitre impairment impacting negatively
• Positive development in working capital
17Alternative performance measures are defined, explained and reconciled to the Financial statements in the APM section of the 3Q report on pages 29-34For operating segment information, refer to Note 3 Operating segment information in the 3Q report on pages 17-22

External revenues (MUSD) ROIC (12-month rolling)EBITDA ex SI (MUSD)
• Revenues up due to higher prices and volume growth
• Improved ammonia production margins
• Improved earnings• Positive development in working
capital
Africa & Asia: improved production and higher prices
469
680
3Q20 3Q21
210
259
342
338
+45%
3Q20 3Q21
36
103
189 %
3Q20 3Q21
1.2%
4.9%
Premiumproducts
Commodities
18Alternative performance measures are defined, explained and reconciled to the Financial statements in the APM section of the 3Q report on pages 29-34For operating segment information, refer to Note 3 Operating segment information in the 3Q report on pages 17-22

Production (thousand tonnes) ROIC (12-month rolling)EBITDA ex SI (MUSD)
• Improved finished fertilizer production
• Turnaround and market optimization impacting ammonia production volumes
• Higher nitrogen prices and phosphate margins more than offset increased energy costs
• Deliveries to other operating segments increased 16% due to improved reliability for production of finished goods
• Improved earnings
Global Plants: higher prices offsetting increase in gas cost
3Q20 3Q21
567
1 727
535
1 859
+4%
3Q20 3Q21
118145
+23%
3Q20 3Q21
13.6% 13.9%
Finishedproducts
Ammonia
19Alternative performance measures are defined, explained and reconciled to the Financial statements in the APM section of the 3Q report on pages 29-34For operating segment information, refer to Note 3 Operating segment information in the 3Q report on pages 17-22

External revenues (MUSD) ROIC (12-month rolling)EBITDA ex SI (MUSD)
Industrial Solutions: higher European gas costs impacting results
3Q20 3Q21
436643
+47%
3Q20 3Q21
9664
-33%
3Q20 3Q21
15.9% 15.6%
20
• Increased deliveries as demand for industrial nitrogen remains strong
• Higher gas costs for the European sites
• Stable earnings combined with slightly higher invested capital
Alternative performance measures are defined, explained and reconciled to the Financial statements in the APM section of the 3Q report on pages 29-34For operating segment information, refer to Note 3 Operating segment information in the 3Q report on pages 17-22

Total revenues1 (MUSD) ROIC (12-month rolling)EBITDA ex SI (MUSD)
Clean Ammonia: positive impact from higher ammonia prices
3Q20 3Q21
228
612
+169%
3Q20 3Q21
2938
+32%
3Q20 3Q21
19.8%23.8%
21
• Revenue increase driven by increased volume and ammonia prices
• Increased commission income from higher ammonia prices
• 12-month rolling ROIC improvement mainly reflects improving results
1) Total revenues; includes internal revenue from other Yara segmentsAlternative performance measures are defined, explained and reconciled to the Financial statements in the APM section of the 3Q report on pages 29-34For operating segment information, refer to Note 3 Operating segment information in the 3Q report on pages 17-22

Unchanged total capex, phasing from 2021 to 2022
1) 2021 onwards represents committed maximum frame
1.6
2.2
1.1
0.8
2017 2018 2019 2020 2021 2022
max. 1.2 per year from 2022 excluding phasing
22
Investments1 (BUSD)
0.2 BUSD phasing
1.4
1.11.2

Free cash flow
Free cash flow before financing activities1
MUSD, rolling 12 months
1,298
-3,243
-2,630-2,954
3Q212Q211Q18 2Q18
1,669
-3,083
3Q18 4Q18
-2,237
1Q19
-1,394
2Q19 2Q20
-1,101
3Q19
863
3Q204Q19
845
1Q20
1,0081,491
4Q20 1Q21
1,973
1,142
Divestment proceeds InvestmentsOperations Free cash flow adjusted for divestment proceeds
1) Net cash provided by operating activities minus net cash used in investment activities.

Key product price developments
1) Source: BOABC, CFMW, Fertilizer publications, Argus. 1-month lag applied, as proxy for realized prices (delivery assumed 1 month after order)2) Yara’s realized European nitrate price, CAN 27 CIF Germany equivalent ex. Sulphur3) Yara’s realized global compound NPK price (average grade)
1.9 1.8
12.7
3.7
Europe US
+569%
+104%
193
416
312
564
CAN 27 Compound NPK
+62%
+36%
Urea price development1 (USD/t) Yara realized CAN2 and NPK price3 (USD/t)Spot gas prices1 (USD/Mmbtu)
3Q20 3Q21
250 234
456411
Urea granular FOB Egypt
Urea inland China proxy
+82%+76%
24

0
450
3Q19 3Q20
Nitrate and NPK premiums
Source: Fertilizer Market publications
0
330
3Q19 3Q20 3Q21
Urea Egypt CFR proxy
Ammonia CFR
CAN CIF
17
1 Nitrate premium in CIF Germany terms, above Urea Granular FOB Egypt, in 27% N (USD/t):All prices in CAN27 equivalents, with 1 month time lag
Weighted average global premium above blend cost
2 Export NPK plants, average grade 19-10-13, net of transport and handling cost.
DAP, CIF inland Germany
MOP, CIF inland Germany
Urea, CIF inland Germany
Nitrate premium, CIF inland Germany
Yara realized NPK price69
133
NPK premium over blend2Nitrogen upgrading margins1
USD/tUSD/t CAN27 equivalents (monthly publication prices)
Yara EU gas cost *12
4
25
3Q21

Regional fertilizer deliveries
1) Premium defined as Differentiated N, NPK, CN, fertigation products and YaraVita
0.7
2.1
0.60.5
2.3
3.0 2.9
0.3
1.0
0.30.6
1.0
-9%
-3%
+1%
-9% +11%+28%
Million tonnes
3Q20 3Q21
Europe North America
Brazil Latin America
Asia Africa
Premium*
Commodity
26

Energy cost
Source: Yara, World Bank, Argus/ICIS Heren*Dotted lines denote forward prices as of 7 October 2021, market prices (HH and TTF) are not lagged..**Yara Global restated from 2Q 2018 to include Cubatão gas cost, Babrala excluded, and updated Yara gas cost methodology from 1Q20
Quarterly averages for 2018-2021 with forward prices* for 4Q21 and 1Q22
27
1.74Q18 1Q19
6.88.2
3Q18
1.92.5
6.68.4
25.9
4Q21
7.56.1
4.1
6.0
32.3
2.9
4.8
9.4
18.3
4.3
11.7
2Q19 2Q21
2.3
3Q19
3.3
3Q21
2.3
4Q19
3.41.9
6.3
11.7
3.14.3
4.0
1Q20
32.8
1.7
2Q20 4Q20
2.4
3Q20
4.6
1Q21
16.6
22.6
31.7
1Q22
4.32.9
4.08.2
3.82.9
7.8
5.5
2.73.9 4.5
3.53.1 2.53.14.34.3
9.55.8 5.7
TTF day aheadYara Global**US gas price (Henry Hub) Yara Europe

Yara stocksFinished fertilizerMill. tonnes
8
0Urea
Q3-18 Q3-20
Other
Q3-21Q3-17 Q3-19
Nitrates
CompoundNPK
28

European producers’ nitrate stocks
Source: Fertilizers Europe, Yara estimates 29
Index June 2007 = 1
0.0
0.2
0.4
0.6
0.8
1.0
1.2
1.4
1.6
Jul Aug Sep Oct Nov Dec Jan Feb Mar Apr May Jun
21/22 14/15 15/16 16/17 17/18 18/19 19/20 20/21

CRU expect lower growth in production than gross capacity additions in the next years
30Source: CRU August 2021
20192014 20252015
4.2
2016 202020182017 2021 2022 2023 2024
1.2 1.3
4.55.5
6.7
3.2
1.0
4.75.5
3.4
1.7
AlgeriaIndiaRussiaIran
USANigeria
ProductionOthers
Production forecast
2.6% consumption growth
Global urea capacity additions ex. China (mill. tonnes)

Attractive Yara prospects
• Crop nutrition leader; #1 premium product and market presence
• Transitioning towards sustainable solutions for the global food system
• Operational improvement and innovation focus
• Resource and environment challenges require strong agriproductivity improvement
• Attractive Yara growth opportunities within sustainable food solutions and green ammonia
• Improved market fundamentals
• Strict capital discipline
• Clear capital allocation policy
• Target to reach 10% ROIC through the cycle
Attractive opportunities Focused strategy Strong shareholder returns
31

Alternative performance measures
Alternative performance measures are defined, explained and reconciled to the Financial statements in the APM section of the Quarterly report on pages 29-34
32