Yanping Li, Zhenhua Li, Sopan Kurkute, Lucia Scaff
15
Continental Scale Convection - permitting WRF regional climate simulation over western Canada Yanping Li, Zhenhua Li, Sopan Kurkute, Lucia Scaff
Transcript of Yanping Li, Zhenhua Li, Sopan Kurkute, Lucia Scaff

Continental Scale Convection-permitting WRF regional climate simulation over western Canada
Yanping Li, Zhenhua Li, Sopan Kurkute, Lucia Scaff

22
Available RCM output for CCRN regionCRCM5 CanRCM4 NACCAP CCRN-WRF
Spatial Resolution
50 km NAM-22 (25 km)
NAM-44 (50 km)
50 km 4 km
Vertical levels 29 4 26 51
Temporal resolution
daily NAM-22(daily)
NAM-44(daily, hourly for Pr)
3-hourly hourly
Downscale from CanESM2 CCCma-CanESM2 11 members CMIP5 models 20 ensemble
Scenario RCP4.5, RCP8.5 RCP4.5, RCP8.5 SRES A2 RCP8.5
Output available
2006-2100 1950-2005 (historic)
2006-2010 (future)
1971-2000 (historic)
2041-2070 (near future)
2000-2013 (historic)
2086-2099 (PGW equivalent)
CRCM5 NACCAP CCRN-WRF

33
WRF Model Setup and Design WRF Model (Version 3.4.1)
A single domain: 2560 x 2800 km2
4 km grid spacing; 37 levels
Microphysics Scheme: New Thompson et al.
PBL scheme: YSU
RRTMG Long-wave and Short-wave scheme
No Cumulus parameterization used, assumed explicit
Forcing Data The 6-hourly, 0.7030 x 0.7030
resolution ERA-Interim reanalysis data provide the initial and lateral boundary condition
Continental Scale Regional Climate Simulation using 4-KM WRF
MRB
SRB
MRB: Mackenzie River BasinSRB: Saskatchewan River Basin
NCAR CONUS domain

4
Historical simulation (CTRL)
Future simulation (PGW)WRF Dynamical downscaling and
PGW method
DYNAMICAL
DOWNSCALING
HINDCAST
DYNAMICAL DOWNSCALING FUTURE PGW
Weather Research Forecast V3.6
HIGH-RESOLUTION (4-km) REGIONAL CLIMATE
MODEL
PSEUDO GLOBAL WARMINGERA-I + ΔCIMP5
Global monthly multi-model average increments:ΔCIMP5 = projection ensemble − historical ensemble
(2070 to 2099) (1976 to 2005)
RCP8.5 “the business as usual” scenario projectsa 3.7oC warming by the end of the 21 century.
GLOBAL
FUTURE
SCENARIOS ACCESS1-3CanESM2CCSM4CESM1-CAM5CMCC-CMCNRM-CM5CSIRO-Mk3-6-0
CMIP5 models under
RCP8.5GFDL-CM3
GFDL-ESM2M
GISS-E2-H
HadGEM2-CC
HadGEM2-ES
Inmcm4
IPSL-CM5A-
MR
MIROC5
MIROC-ESM
MPI-ESM-LR
MPI-ESM-
MR
MRI-CGCM3
6-hours historical boundary conditions from:ERA-Interim reanalysis (ERA-I)
•Sea surface temperature and ice •Air temperature •Horizontal wind
OBSERVATION
PERIOD 2001-2015
• Specific humidity• Air pressure • Geopotential height

55
WRF dynamical downscaling for 2000-2013
CMIP5-historic WRF-historic CMIP5-historic WRF-historic
Winter
Spring
Summer
Fall
Precipitation (mm/day)

66
WRF dynamical downscaling of CMIP5WRF-PGW WRF-PGW
Winter
Spring
Summer
Fall
WRF-historic WRF-historic
Precipitation (mm/day)

7
Annual precipitation/TemperatureCMIP5 vs WRF
( mm
/mo
nth
)( m
m/m
on
th)

8
CCRN-WRF Performance Evaluation (Annual cycle)
SRB
MRB
T T
T
T
P
P
P
P
8

9
CA4KM-WRF Performance Evaluation -PDF for hourly precipitation intensityFr
eq
ue
ncy
MRB SRB
mm/hr

10
Present and future probability of meteorological and hydrological hazards (over CCRN domain)
Objective: to provide a consistent examination of present and future atmospheric-related hazards across the CCRN domain
Datasets: ECCC StationObs, ANUSPLIN, CaPA, NCEP, NARCCAP, CMIP5 scenarios, CRCM5, CanRCM4, WRF 4-km…
Collaborators: Univ of Manitoba: Ron Stewart, John Hanesiak Univ of Quebec at Montreal: Julie TheriaultECCC: Kit Szeto, Barrie Bonsal, Xuebin Zhang, Bob Kochtubajda, Julian Brimelow Pacific Climate Impacts Consortium, University of Victoria : Francis Zwiers
Extremes to be analyzed: Meteorology floods Drought Sub-daily precipitation extremes Large hail Convective vs Stratiform rainstorms Winter phenomena Heavy snowfall Blizzards (snow storms) Freezing rain (0oC) Windstorms Tornadoes Lightning (thunderstorms) Wildfires
11
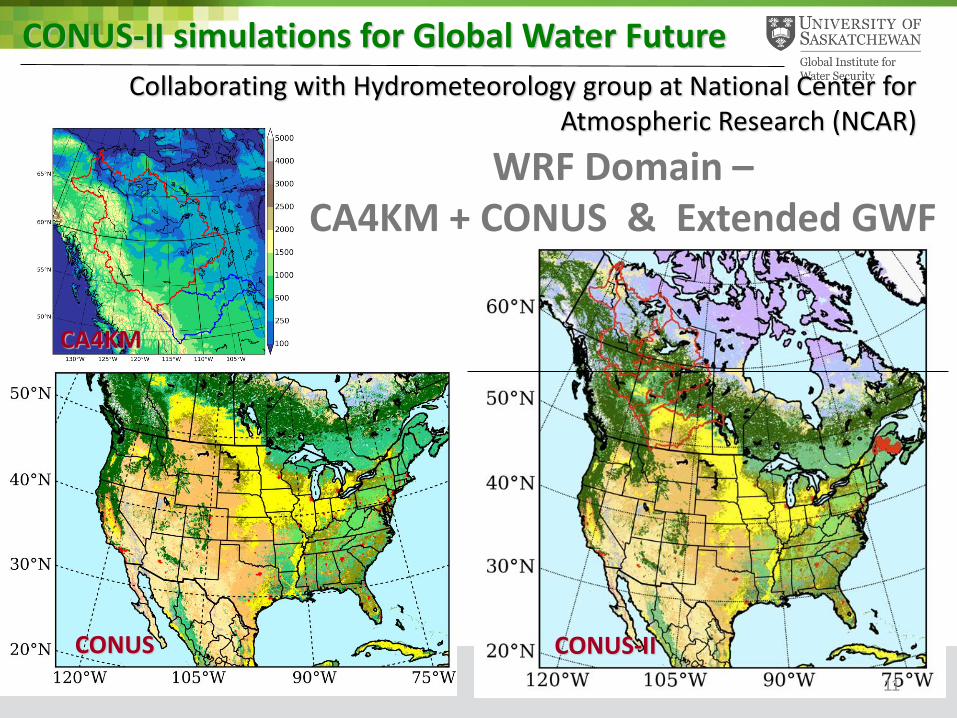
WRF Domain –CA4KM + CONUS & Extended GWF
CONUS-II simulations for Global Water Future
Collaborating with Hydrometeorology group at National Center for Atmospheric Research (NCAR)
CONUS-IICONUS
CA4KM

12Working together with John Hanesiak’s Group at U of Manitoba, using 1-d cloud model to process WRF 3d output to generate hail and severe weather related parameters
Future projection of Hailand severe weather parameter

13
We adapted the code compare2meter[Thompson et al. 2017] to extract WRF 2d precipitation data according to METAR station location (over 1400+ inCanada), a small patch of near-surface (as in METAR comparison) or full vertical columns (as in PIREP comparison), then derive icing accretion or cloud ceiling and visibility for direct comparisons to the observation.
The purpose is to use WRF simulated precipitation to derive differentprecipitation species, such as rain, snow, hail, freezing rain, fog, etc. Andcompare the results against surface METAR station observation.
Reference: Thompson, G., M. K. Politovich, and R. M. Rasmussen, 2017: A numerical weather model’s ability to predict characteristics of aircraft icing environments. Weather and Forecasting, 32, 207-221, doi:10.1175/WAF-D-16-0125.1.
WRF output to derive different precipitation species

PRECIPITATION (PR) – SV
- The annual series show that the bias is corrected (WRF-CTL-Cor matches
CaPA) and inter-annual variability is preserved for WRF-CTL and WRF-
PGW
- Average Annual 2004-2015
- CaPA: 486 mm
- WRF-CTL (Before, After Correction): 550, 467 mm
- WRF-PGW (Before, After Correction: 702, 546 mm
- The monthly distributions show that bias was corrected giving close
seasonal distribution to CaPA over the correction period except for
summer months
- The climate change signal is not preserved (PGW – CTL) after correction
- Seems we are extrapolating too much in summer beyond the fitting range
(note that WRF summer rainfall is higher then CaPA to because it captures
convection better)
Bias Correction for WRF output

PRECIPITATION (PR) – MV
- The annual series show that the bias is corrected (WRF-CTL-Cor matches
CaPA) and inter-annual variability is preserved for WRF-CTL and WRF-
PGW
- Average Annual 2004-2015
- CaPA: 486 mm
- WRF-CTL (Before, After Correction): 550, 467 mm
- WRF-PGW (Before, After Correction: 702, 571 mm
- The monthly distributions show that bias was corrected giving close
seasonal distribution to CaPA over the correction period except for
summer months
- The climate change signal is not preserved (PGW – CTL) after correction
but better than the SV case except for summer months … may be patterns
are shifting in space
Bias Correction for WRF output