
Yadong Li Final Report 2016 - MarTREC
15
MARITIME TRANSPORTATION RESEARCH AND EDUCATION CENTER TIER 1 UNIVERSITY TRANSPORTATION CENTER U.S. DEPARTMENT OF TRANSPORTATION Exploration of novel multifunctional open graded friction courses for in-situ highway runoff treatment July 1, 2014-June 30, 2016 Yadong Li (PI) Lin Li (Co-PI) Divya Sinha (GRA) Dept. of Civil & Environmental Engineering Jackson State University Jackson, Mississippi Final Report Date FINAL RESEARCH REPORT Prepared for: Maritime Transportation Research and Education Center University of Arkansas 4190 Bell Engineering Center Fayetteville, AR 72701 479-575-6021
Transcript of Yadong Li Final Report 2016 - MarTREC

MARITIME TRANSPORTATION RESEARCH AND EDUCATION CENTER
TIER 1 UNIVERSITY TRANSPORTATION CENTER
U.S. DEPARTMENT OF TRANSPORTATION
Exploration of novel multifunctional open graded friction courses
for in-situ highway runoff treatment
July 1, 2014-June 30, 2016
Yadong Li (PI)
Lin Li (Co-PI)
Divya Sinha (GRA)
Dept. of Civil & Environmental Engineering
Jackson State University
Jackson, Mississippi
Final Report Date
FINAL RESEARCH REPORT
Prepared for:
Maritime Transportation Research and Education Center
University of Arkansas
4190 Bell Engineering Center
Fayetteville, AR 72701
479-575-6021

ACKNOWLEDGEMENT
This material is based upon work supported by the U.S. Department of Transportation under
Grant Award Number DTRT13-G-UTC50. The work was conducted through the Maritime
Transportation Research and Education Center at the University of Arkansas.
DISCLAIMER
The contents of this report reflect the views of the authors, who are responsible for the facts and
the accuracy of the information presented herein. This document is disseminated under the
sponsorship of the U.S. Department of Transportation’s University Transportation Centers
Program, in the interest of information exchange. The U.S. Government assumes no liability for
the contents or use thereof.

1
1. Project Description
Pollutants on roadways and parking lots can come from various sources, including the
deposition of exhaust, fluid leakage from vehicles, abrasion from the friction between tires and
roads, abrasion from brake pads, deicing activities, atmospheric deposition, corrosion of crash
barriers, and pavement itself. Storm water runoffs from roadways contain both organic and
inorganic contaminants of which large portions are eventually conveyed to the nearby water
bodies such as rivers and lakes. Copper (Cu) and Zinc (Zn) have been identified to be the major
inorganic contaminants in roadway runoffs (USDOT, 2012). Contaminants from vehicles and
activities associated with roadway construction and maintenance tend to be washed from roads
and roadsides when it rains or snow melts; large amount of this runoff pollution is carried
directly to water bodies. The concentration ranges of Zn and Cu in runoffs are 20-2000 µg/L and
5-200 µg/L respectively according to various studies (Davis et al, 2001; McNamee, 1998).
According to Herrera Environmental Consultants (2007), Zn and Cu in runoffs are 13-134 µg/L
and 3-18 µg/L respectively. Barrett et al. (1998) studied stormwater samples collected from
surface runoff from a highway in Texas and found that concentrations of Zn and Cu were
222 µg/L and 37 µg/L respectively.
U.S. Environmental Protection Agency (EPA) storm water regulations set limits on the
levels of pollution in streams and lakes (Pervious Pavement, 2011). Therefore, the U.S.
Department of Transportation (DOT) is subjected to increasing pressures by water quality
regulatory agencies for the control and treatment of highway storm water runoffs. To meet these
regulations, two basic approaches have been considered: (1) to reduce the overall run-off from
an area, and (2) to reduce the level of pollutants contained in the runoffs.
Pagotto et al. (2000) investigated the runoffs generated from both porous and non-porous
road surface in France and found that the runoff water quality from pervious open graded friction
course (OGFC) was better than the non-porous ones such as hot-mix asphalt (HMA). OGFC is
an alternative to HMA and is produced by eliminating the fine aggregate from the asphalt mix.
Normally, a layer of porous asphalt, approximately 50 mm thick, is placed as an overlay on top
of an existing conventional concrete or asphalt roadway surface. Main benefits of OGFC include
the improved rain water drainage that reduces hydroplaning, the reduction of splash and spray
behind vehicles, the improvement of wet pavement friction and surface reflectivity, and the
reduction of traffic noise.
Pervious Concrete Pavement (PCP), as one of OGFCs, has become attractive in roadway
and parking lot constructions because of its economic, structural, and environmental advantages.
It can facilitate the recharge of groundwater and reduce storm water runoff. PCP is made of large
aggregates with little to no fine aggregates and the mixture contains little or no sand, creating a
substantial void content. The voids ratio in PCP overlay layer is generally 18% to 22% (Barrett
et al, 2008).

2
The goal of this study is to examine the removal of the major heavy metals Cu and Zn in
roadway runoffs through PCP and Modified PCP (MPCP). The latter is a PCP that contains
strategically selected additives. The objectives of this study include
1) To identify functional additives based on their commercial availability, cost, and
potential adsorption capacity of heavy metals,
2) To fabricate PCP and MPCP samples with identified additives and test their physical
and mechanical properties important for highway pavement, and
3) To examine the removal of heavy metals with the PCP and MPCP samples from
highway runoffs through batch and dynamic adsorption tests.
2. Methodological Approach
2.1. Materials
To produce PCP and MPCP samples, following materials were used:
(1) Portland cement. The Portland cement was obtained from a local store. The particle was
very fine, and smooth and dark grey in color.
(2) Crushed lime stones. The aggregates used in the PCP and MPCP were crushed lime
stones obtained from a large quarry in Jackson, Mississippi as shown in Figure 2-1. They
are of high quality and polish resistant aggregate with a capacity to provide and maintain
good frictional characteristics.
Figure 2-1. Crushed lime stones used in PCP and MPCP sample fabrication
3
(3) Water. Water is one of the most important elements in cement products. The water used
for mixing and curing should be clean and free from injurious quantities of alkalis, acid,
oils, salt, sugar, organic materials, vegetable growth and other substances that may be
deleterious to bricks, stone, concrete or steel. Potable water is generally considered
satisfactory for mixing. The pH value of water should be not less than 6.
(4) Functional additives. Adsorption different additives including various bentonites, zeolite,
activated carbon, diatomite, and lime were used as functional additives to produce
modified PCP or MPCP which were intended to have high adsorption capacities for
heavy metals in runoffs. These additives were used in the form of mostly powder and had
a different texture. Only 5% of these additives were used in making MPCP samples.
2.2. Test of adsorption capacities of functional additives
Different types of functional additives were tested for their absorbing capacities on Zn
and Cu. The adsorption test was conducted using a known mass (in g or mg) of each additive
with a specific volume of solutions containing heavy metal ions of desired concentrations at
constant temperature (20oC). The solid to water ratio was 1:10. The mixtures of additives
solution were shaken for 24 h to ensure that the adsorption reaches equilibrium. The
concentrations before and after adsorption were measured. The amount of the metal adsorbed
was derived. This test was conducted for each additive with different metal concentrations to
obtain isotherm parameters. The additives with high Zn and Cu absorbing capacities would be
considered as additives in making MPCP samples.
Linear, Langmuir, Frendulich, and Dubinin-Kaganer-Radushkevich methods were used
to model the experimental data and to determine which model best describes the nature of the
adsorption isotherm for each additive.
2.3. PCP sample preparation
The PCP samples were prepared using crushed limestone aggregates, Portland cement,
and water as described in Section 2.1. The graduation of the aggregates used in the preparation of
the PCP samples is given in Table 2-1.
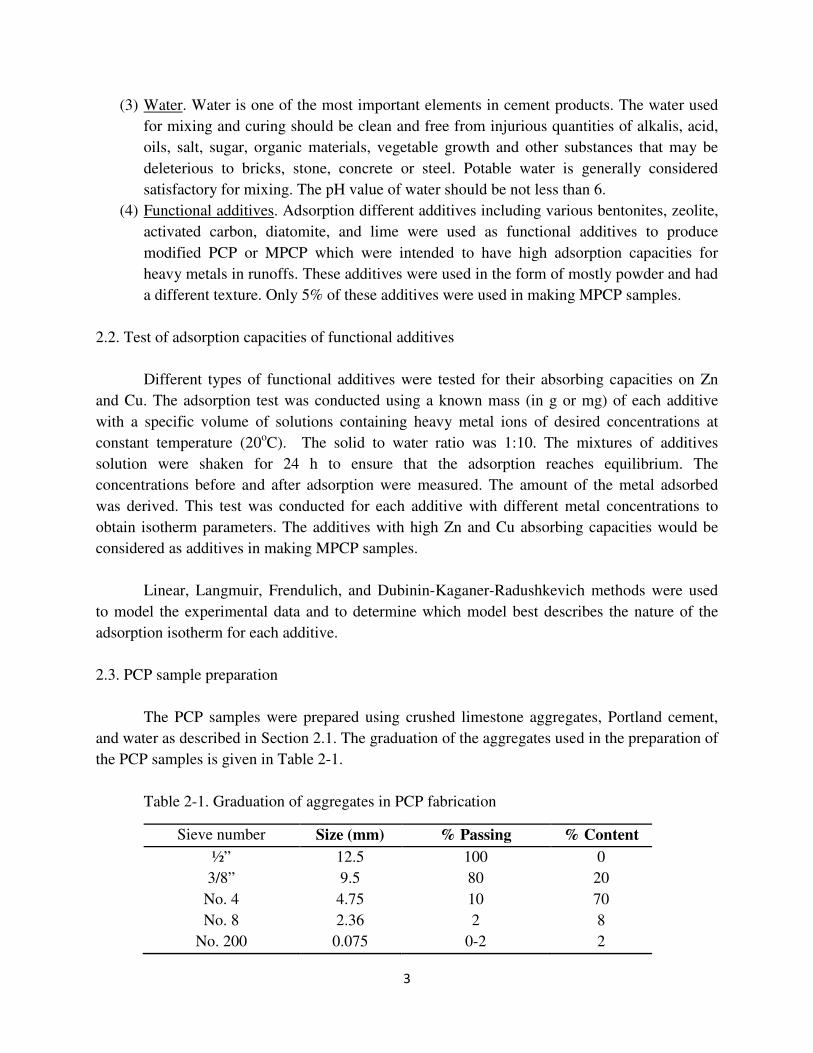
Table 2-1. Graduation of aggregates in PCP fabrication
Sieve number Size (mm) % Passing % Content
½” 12.5 100 0
3/8” 9.5 80 20
No. 4 4.75 10 70
No. 8 2.36 2 8
No. 200 0.075 0-2 2
4
Two different sizes of samples were prepared for this study. For compressive strength
test, sample size was 4 inch in diameter and 8 inch in thickness. For all other test, sample size
was 6 inch in diameter and 2 inch in thickness.
The aggregates were dried in oven at 165oC for 2 h and weighed according to the selected
gradation (Table 2-1). Cement and water were added to the aggregate in a desired ratio to make
the paste of desired consistency. In this study, an aggregate-to-cement ratio of 3:1 and a water-
to-cement of 1:3 was used. After mixing it was poured in molds, shaken and compacted. Then
the samples were left for setting for 24 h. After setting, the samples were taken out of the molds
and sealed in plastic bags for the curing. Water was sprinkled in the bags to keep the humidity
above 95%. The curing time used in the study was 14 d. After curing, the samples were ready for
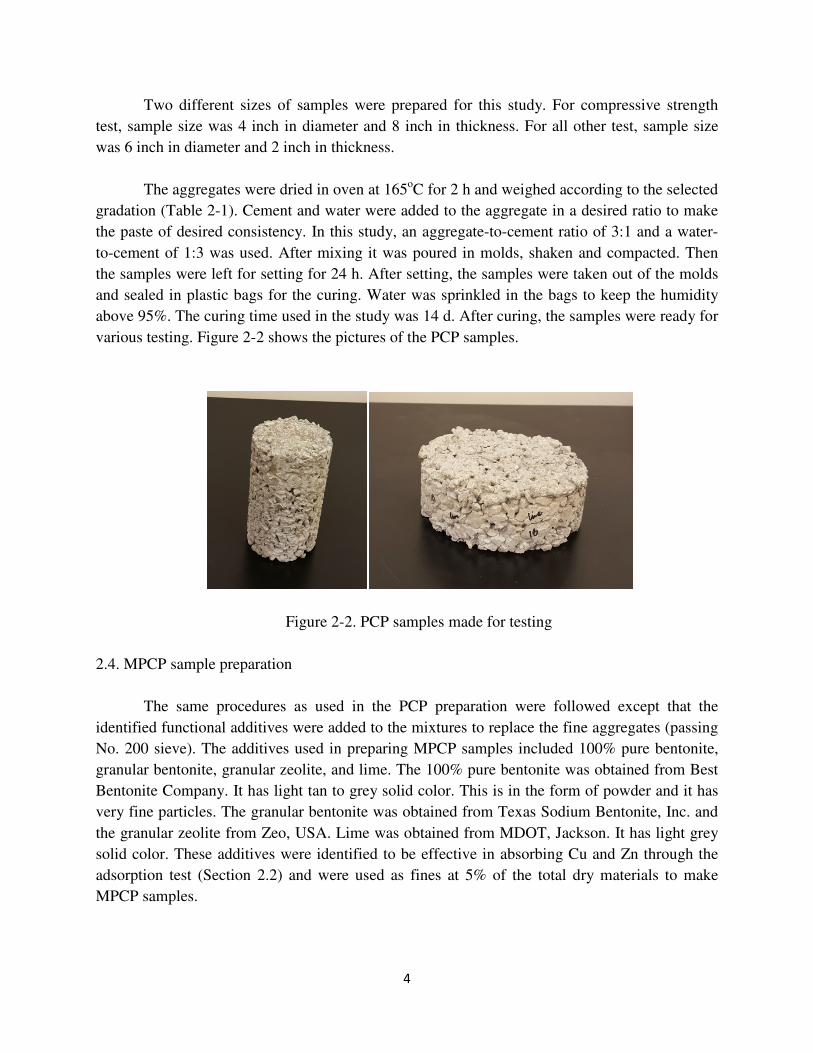
various testing. Figure 2-2 shows the pictures of the PCP samples.
Figure 2-2. PCP samples made for testing
2.4. MPCP sample preparation
The same procedures as used in the PCP preparation were followed except that the
identified functional additives were added to the mixtures to replace the fine aggregates (passing
No. 200 sieve). The additives used in preparing MPCP samples included 100% pure bentonite,
granular bentonite, granular zeolite, and lime. The 100% pure bentonite was obtained from Best
Bentonite Company. It has light tan to grey solid color. This is in the form of powder and it has
very fine particles. The granular bentonite was obtained from Texas Sodium Bentonite, Inc. and
the granular zeolite from Zeo, USA. Lime was obtained from MDOT, Jackson. It has light grey
solid color. These additives were identified to be effective in absorbing Cu and Zn through the
adsorption test (Section 2.2) and were used as fines at 5% of the total dry materials to make
MPCP samples.

5
2.5. Testing of Physical and Mechanical Properties of PCP and MPCP Samples
The permeability, air void, and compressive strength of the PCP and MPCP samples were
tested as described below.
(1) Permeability
Permeability test was conducted according to ASTM Falling Head Laboratory
Permeability Test Method (ASTM, 2001). A Permeameter manufactured by Global
Gilson was used in this study. Each specimen was put in the rubber container. Petroleum
jelly was applied onto the plastic wrapped specimen for lubrication before the specimen
was inserted into the stand pipe. Once the apparatus was secured, the Permeameter was
filled with water to a height above the top of the specimen. The valve was opened and the
time required for the water to drop from the initial head and the final head above the
specimen was recorded and used to calculate the permeability using Darcy’s Law.
(2) Air Voids
Air voids test was conducted according to ASTM C1754/C1754M standard (ASTM,
2012). The dimensions of a specimen were measured to determine its volume. The
PCP/MPCP samples of 6 inch in diameter and 2 inch thick were oven dried at 93 oC for
24 to 48 h to get the actual dry weight. The weights of the samples were measured before
and after they were soaked in the water. Specific gravity weight balance was used to
measure the weight of sample in water. The air void content was calculated using the
difference between the total volume and the displaced volume when submerged.
(3) Unconfined compressive strength
The unconfined compressive strengths (UCS) of the PCP and MPCP samples were tested
according to ASTM Standard C 39-96 (ASTM, 1998) to assess the mechanical properties
of the samples. The specimens were 4 inch in diameter and 8 inch in length. The sample
was loaded axially in the automatic compression test machine at a constant axial strain
rate and the applied load resulting deformations was used to calculate the UCS.
2.6. Batch Adsorption Test
The PCP or MPCP samples were soaked in the water containing 0.3 to 0.5 mg/L Zn and
Cu for 24 h in room temperature. The solid-to-water ratio was 1:5. The solution was stirred
periodically. The initial and final pH values were also measured. After the adsorption, the water
was analyzed for Cu and Zn concentrations to determine the adsorption rates by the samples. The
batch adsorption test setup is shown in Figure 2-3.

6
Figure 2-3. Batch adsorption test
2.7. Dynamic Adsorption Test
This test was performed using the same Permeameter as for the permeability test. Water
containing Zn and Cu was passed through the PCP sample at constant flow rate of about 0.105
L/h. The effluent was collected at different times. The accumulative weight of the effluent was
recorded and effluent samples taken at different times were analyzed for Cu and Zn
concentrations and as well as pH. Calcium (Ca) and aluminum (Al) in the effluents were also
analyzed. Concentration-versus-time curves were obtained which can be used to evaluate the in-
situ removal of heavy metals by PCP or MPCP pavements. The dynamic adsorption test setup is
shown in Figure 2-4.
Figure 2-4. Experimental setup
for dynamic adsorption test

7
3. Results/Findings
3.1. Adsorption test results of different additives
From the adsorption test as described in Section 2.2, the equilibrium concentrations of Cu
and Zn in water were plotted against their concentrations in the solid phase. For the twelve
additives tested. Most adsorption results fit Freundlich isotherm model with a few fit linear
model. The Freundlich isotherm model is defined as
� = ����/�
Where X is the amount of adsorbate (Cu or Zn in this case) adsorbed onto per unit mass of solid;
C is the equilibrium solution concentration of the adsorbate; Kf is the Freundlich adsorption
constant; and n is a constant. The Freundlich Kf is equivalent to the distribution coefficient Kd in
the linear model (X=KdC) and the bigger its value is, the higher is the adsorption capacity of the
material. Table 3-1 gives the results from curve-fitting of the equilibrium concentrations for all
the twelve additives tested.
Table 3-1 Adsorption test results of functional additives on heavy metals Cu and Zn
Additive Tested Heavy
metal
Correlation
coefficient R²
Isotherm
model Kf or Kd
Granular Bentonite (Texas Sodium
Bentonite)
Cu 0.97 Freundlich 1086
Zn 0.95 Freundlich 735
Pearl Soil (Pearl, Mississippi) Cu 0.98 Freundlich 156
Zn 0.94 Liner 66
100% Pure Bentonite (Texas Best
Bentonite, Inc.)
Cu 0.66 Liner 591
Zn 0.57 Liner 737
Zeolite powder ultrafine (Kelpless) Cu 0.91 Freundlich 796
Zn 0.97 Freundlich 379
Pure Zeolite clay (Greece) Cu 0.97 Freundlich 334
Zn 0.99 Freundlich 314
Sodium Zeolite (Charles B. Crystal
Co. inc)
Cu 0.81 Liner 413
Zn 0.97 Freundlich 298
Sodium Bentonite (Charles B.
Chrystal Co. Inc)
Cu 0.67 Liner 997
Zn 0.75 Liner 1161
Bentonite Seal 0922W (Soil Moisture
Equipment Corp.)
Cu 0.87 Freundlich 513
Zn 0.99 Freundlich 482
Granular Zeolite (Zeo, USA) Cu 0.85 Freundlich 431

8
Zn 0.95 Freundlich 415
Activated Carbon (envirosupply.net) Cu 0.85 Linear 1982
Zn 0.93 Freundlich 638
Diatomite (Burney) Cu 0.87 Freundlich 680
Zn -- -- --
Lime (MDOT) Cu 0.08 Freundlich 1320
Zn 0.59 Freundlich 1364
The results indicate that 100% pure bentonite, granular zeolite, granular bentonite, and
lime had high adsorption capabilities for both Cu and Zn. They were used as additives to make
MPCP samples.
3.2. Permeability results for PCP and MPCP samples
The permeabilities for PCP samples and MPCP samples containing 5% of the four
selected additives have been tested and results are shown in Table 3-2.
Table 3-1 Permeability results for PCP samples and MPCP samples
Sample Average Permeability
(m/d)
PCP 23.0
MPCP with 5% 100% Pure Bentonite 36.5
MPCP with 5% Granular Bentonite 32.8
MPCP with 5% Granular Zeolite 29.0
MPCP with 5% Lime 30.9
The results indicate that the MPCP samples with bentonite have higher permeabilities.
This is due to the swelling property of the bentonite that caused the sample to have more cracks
which were observed on the samples. Nevertheless, these permeabilities are within normal range
for most PCPs.
3.3. Air voids results for PCP and MPCP samples
The results of air voids for the PCP and MPCP samples are given in Table 3-3.
9
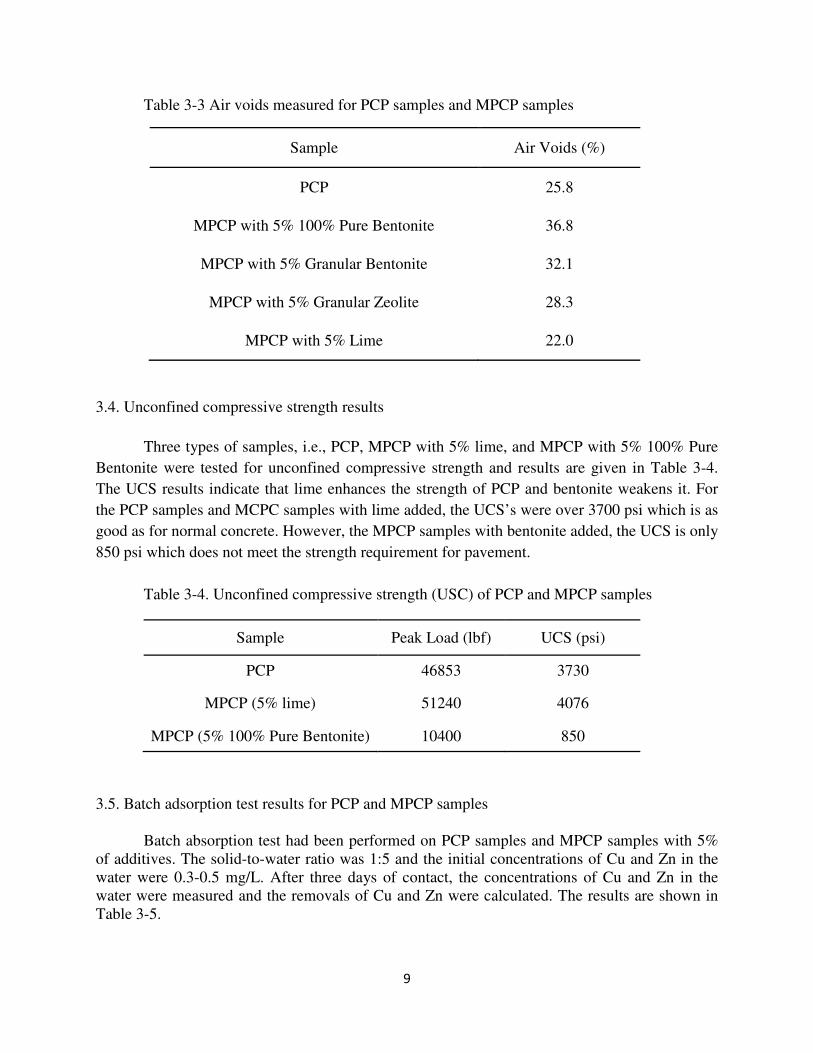
Table 3-3 Air voids measured for PCP samples and MPCP samples
Sample Air Voids (%)
PCP 25.8
MPCP with 5% 100% Pure Bentonite 36.8
MPCP with 5% Granular Bentonite 32.1
MPCP with 5% Granular Zeolite 28.3
MPCP with 5% Lime 22.0
3.4. Unconfined compressive strength results
Three types of samples, i.e., PCP, MPCP with 5% lime, and MPCP with 5% 100% Pure
Bentonite were tested for unconfined compressive strength and results are given in Table 3-4.
The UCS results indicate that lime enhances the strength of PCP and bentonite weakens it. For
the PCP samples and MCPC samples with lime added, the UCS’s were over 3700 psi which is as
good as for normal concrete. However, the MPCP samples with bentonite added, the UCS is only
850 psi which does not meet the strength requirement for pavement.
Table 3-4. Unconfined compressive strength (USC) of PCP and MPCP samples
Sample Peak Load (lbf) UCS (psi)
PCP 46853 3730
MPCP (5% lime) 51240 4076
MPCP (5% 100% Pure Bentonite) 10400 850
3.5. Batch adsorption test results for PCP and MPCP samples
Batch absorption test had been performed on PCP samples and MPCP samples with 5%
of additives. The solid-to-water ratio was 1:5 and the initial concentrations of Cu and Zn in the
water were 0.3-0.5 mg/L. After three days of contact, the concentrations of Cu and Zn in the
water were measured and the removals of Cu and Zn were calculated. The results are shown in
Table 3-5.

10
Table 3-5 Batch adsorption test results for PCP and MPCP samples
Sample Adsorption rate (%)
Cu Zn
PCP 59.3 93.5
MPCP (5% 100% Pure Bentonite) 46.1 86.1
MPCP (5% Granular Bentonite) 21.8 33.6
MPCP (5% Granular Zeolite) 48.0 34.4
MPCP (5% Lime) 31.7 46.8
The results indicate that the addition of the additives do not increase the ability of the
PCP samples in absorbing Cu and Zn from water. This further indicates that the cement in the
PCP and MPCP samples is the main agent absorbing the heavy metals. Adding the additives does
not improve the adsorption capacity. In regard to the removal of Cu and Zn from runoffs, there is
no benefit to add these additives and PCP itself already has high absorbing capacity.
3.6. Dynamic adsorption test results
Since the batch adsorption results revealed that the additives do not increase the abilities
of the PCP samples in absorbing Cu and Zn, the dynamic adsorption test was performed only on
PCP samples. Due to the constraints of test device and time, the dynamic test was performed on
only one PCP sample for 60 d. The concentrations of Cu and Zn in the influent were 4.73 and
2.13 mg/L respectively. The effluents were analyzed for Cu and Zn as well as calcium (Ca),
aluminum (Al), and iron (Fe). The concentrations of Fe in the effluents were found near zero.
The concentrations of Cu, Zn, Ca, and Al with time are plotted as shown in Figure 3-1.
It can be seen in Figure 3-1 that the concentrations of Cu and Zn gradually decreased
with time to as low as 5% of the original concentrations while the concentration of Ca
maintained high (20-100 mg/L). This indicates that the main mechanism of Cu and Zn removal
was ion exchange with Ca, not adsorption. Since there was huge amount of Ca in the sample
(mainly in the Portland cement), the removal could continue for a long time. Even for 60 d, the
removals of Cu and Zn still maintained high. This can lead to a conclusion that the PCP has
long-lasting removal capacities for Cu and Zn in runoffs.
Figure 3-2 is a picture of the PCP sample taken out of the Permeameter after the dynamic
adsorption test. The blue color on the top indicates the deposit of Cu salt and the Cu was retained
from the influent of the test. This again suggests an ion exchange mechanism for the removal of
Cu in the water.

11
Figure 3-1. Changes of concentrations of metals in effluent of the dynamic adsorption test
Figure 3-2. PCP sample after dynamic adsorption test
0.01
0.2
4
80
0 10 20 30 40 50 60 70
Co
nce
ntr
ati
on
(m
g/L
)
Time (d)
Al Ca Cu Zn

12
4. Impacts/Benefits of Implementation (actual, not anticipated)
The results of this study bring an important conclusion that not only can the pervious
concrete pavement bring the traffic-related benefits, but also environmental benefits because its
long-term removal capacities for Cu and Zn, which are the major heavy metal contaminants in
roadway runoffs. The use of PCP in roadways and parking lots brings positive impacts for the
sake of environmental protection.
5. Recommendations and Conclusions
This study found that the possible functional additives such as bentonite, zeolite, and clay
cannot increase the physical and mechanical properties of PCP, neither the removal of Cu and
Zn. Lime is effective in enhancing the physical and mechanical strengths of PCP, but cannot
improve the removals of Cu an Zn from runoffs. On the other hand, PCP alone has a long-term
removing capability for Cu and Zn. The capacity comes from the ion exchange with huge
amount of calcium contained in the raw material (cement) in PCP. Therefore, the use of PCP on
roadway and parking lots can not only mitigate the storm water runoff, but also provide long-
term environmental benefits by removing heavy metals from the runoffs.
It is recommended that a long-term, pilot scale test be further performed to more closely
simulate the real-life situation of PCP and quantify the reduction of pollutants in the runoffs.

13
References
ASTM (1998). Standard test method for compressive strength of cylindrical concrete specimens.
Annual Book of ASTM Standards, Vol. 04.02
ASTM (2001). ASTM PS 129-01. Standard Provisional Test Method for Measurement of
Permeability of Bituminous Paving Mixtures Using a Flexible Wall Permeameter.
ASTM (2012). Standard Test Method for Density and Void Content of Hardened Pervious
Concrete. ASTM C1754/C1754M-12
Barrett, M.E., Irish, L.B., Malina, J.F., Charbeneau, R.J., (1998). Characterization of
Highway Runoff in Austin, Texas Area. Journal of Environmental Engineering,124:131-137
Barrett, M. E. (2008), Effects of Permeable Friction Course on Highway Runoff. Journal of
Irrigation and Drainage Engineering
Davis et al. (2001). Loading estimates of lead, copper, cadmium, and zinc in urban runoff from
specific sources. Chemosphere. 44:997–1009
East-West Gateway Coordinating Council (2000), Highway Runoff and Water Quality Impacts
Herrera Environmental Consultants (2007), Untreated Highway Runoff in Western Washington,
White Paper
McNamee, Porter, and Seeley, Inc. (1998), Highway Stormwater Runoff Study
Pagotto et al. (2000). Comparison of the hydraulic behavior and the quality of highway runoff
water according to the type of pavement. Water resources. 34(18):4446-4454
Pervious Pavement (2011). http://www.perviouspavement.org/benefits/environmental.html
USDOT (2012). Pavements, US Department of Transportation.
http://www.fhwa.dot.gov/pavement/concrete/pubs/hif13006/index.cfm)


![YADONG LUO - University of Miami School of Business ...11] Shenkar, Oded and Yadong Luo. 2003. International Business, John Wiley & Sons, 1st Edition. [10] Luo, Yadong (2002). Multinational](https://static.fdocuments.us/doc/165x107/5aa1240f7f8b9a8e178ef5ee/yadong-luo-university-of-miami-school-of-business-11-shenkar-oded-and-yadong.jpg)


