Xxxxxxxx - Paladin Energypaladinenergy.com.au/sites/default/files/presentation_file/15.11... ·...
16
xxxxxxxxxxxx Xxxxxxxx Annual General Meeting 19 November 2015 Alexander Molyneux – Interim Chief Executive Officer
Transcript of Xxxxxxxx - Paladin Energypaladinenergy.com.au/sites/default/files/presentation_file/15.11... ·...

xxxxxxxxxxxxXxxxxxxx
Annual General Meeting19 November 2015
Alexander Molyneux – Interim Chief Executive Officer

xxxxxxxxxxxxXxxxxxxx
Paladin Energy Ltd
Disclaimer and Notes for JORC and NI 43-101
Mineral Resources and Ore Reserves
1
This presentation includes certain statements that may be deemed “forward-looking statements”. All statements in this presentation, other thanstatements of historical facts, that address future production, reserve or resource potential, exploration drilling, exploitation activities andevents or developments that Paladin Energy Ltd (the “Company”) expects to occur, are forward-looking statements.
Although the Company believes the expectations expressed in such forward-looking statements are based on reasonable assumptions, suchstatements are not guarantees of future performance and actual results or developments may differ materially from those in the forward-lookingstatements. Factors that could cause actual results to differ materially from those in forward looking statements include market prices,exploitation and exploration successes, and continued availability of capital and financing and general economic, market or businessconditions.
Investors are cautioned that any such statements are not guarantees of future performance and actual results or developments may differmaterially from those projected in the forward-looking statements. Readers should not place undue reliance on forward-looking information.The Company does not assume any obligation to update or revise its forward-looking statements, whether as a result of new information, futureevents or otherwise.
In the following presentation, for those deposits that are reported as conforming to the Joint Ore Reserves Committee (JORC) 2004 or 2012code, the terms Inferred Mineral Resources, Indicated Mineral Resources, Measured Mineral Resources, Ore Reserves, Proved Ore Reserves,Probable Ore Reserves and Competent Person are equivalent to the terms Inferred Mineral Resources, Indicated Mineral Resources, MeasuredMineral Resources, Mineral Reserves, Proven Mineral Reserves, Probable Mineral Reserves and Qualified Person, respectively, used inCanadian National Instrument 43-101 (NI 43-101).
The technical information in this presentation that relates to Exploration Results, Mineral Resources and Ore Reserves is based on informationcompiled by David Princep B.Sc. and Stephanie Raiseborough B.E., both of whom are Fellows of the Australasian Institute of Mining andMetallurgy. Mr. Princep and Ms. Raiseborough each have sufficient experience that is relevant to the style of mineralisation and type of depositunder consideration and to the activity that they are undertaking to qualify as Competent Persons as defined in the 2012 Edition of the“Australasian Code for Reporting of Exploration Results, Mineral Resources and Ore Reserves”, and as Qualified Persons as defined in NI 43-101. Mr. Princep and Ms. Raiseborough are full-time employees of the Company and consent to the inclusion of the relevant information in thisannouncement in the form and context in which it appears.
Previous tonnages, grades, assays and other technical data relating to the Oobagooma deposit are taken from historical records prior to theimplementation of the current NI 43-101. While the data is believed to have been acquired, processed and disclosed by persons believed to betechnically competent, they were estimated prior to the implementation of NI 43-101 and are therefore regarded as historical estimates for thepurposes of NI 43-101 and as an exploration target for the purposes of JORC disclosure. A Qualified Person as defined in NI 43-101 has notdone sufficient work to classify the historical estimate as current Mineral Resources. The Company is not treating the historical estimates ascurrent Mineral Resources as defined in NI 43-101 and for this reason the historical estimates should not be relied upon. At present, theCompany considers that these resources have no equivalent classification under NI 43-101 and should therefore be considered as unclassified.The historical information is presented on the basis that it may be of interest to investors.
Some of the information in this presentation, in relation to the mineral resources and ore reserves for all deposits except Manyingee andMichelin, was prepared and first disclosed under the JORC Code 2004. It has not been updated since to comply with JORC Code 2012 on thebasis that the information that the estimates are derived from has not materially changed since it was last reported.

xxxxxxxxxxxxXxxxxxxx
Paladin Energy Ltd
Paladin….
2
A GLOBAL URANIUM LEADER
OWNS LANGER HEINRICH, A STRATEGIC TIER ONE MINE
HAS OPTIMISATION AS A CORE COMPETENCY
PROVIDES BEST SENIOR LEVERAGE TO URANIUM UPSIDE

xxxxxxxxxxxxXxxxxxxx
Paladin Energy Ltd
Global Uranium Leader
3
ARMZ/Uranium One
Cameco
Rio Tinto
KazAtomProm
Areva
Navoi
Paladin
BHP Billiton
27.4
24.5
23.5
23.5
21.4
11.8
8.8
8.0
6.2
Paladin is the world’s leading independent pure
play uranium miner
Government owned
Divisions of diversified companies
Integrated with non-mining
Annual Capacity
Mlb

xxxxxxxxxxxxXxxxxxxx
Paladin Energy Ltd
Langer Heinrich A Strategic Tier One Mine
4
First Quartile C1 Cash Cost1
32.7MlbsCumulative production
Top 10 Uranium Mine by Production
2
4th largest open-pit
+20 Year Mine Life3
1 Source – UxC Uranium Production Cost Study – August 20152 Source – TradeTech Uranium Market Study – 2015: Issue 3 (based on 2015 production)3 At current processing rates
xxxxxxxxxxxxXxxxxxxx
Paladin Energy Ltd
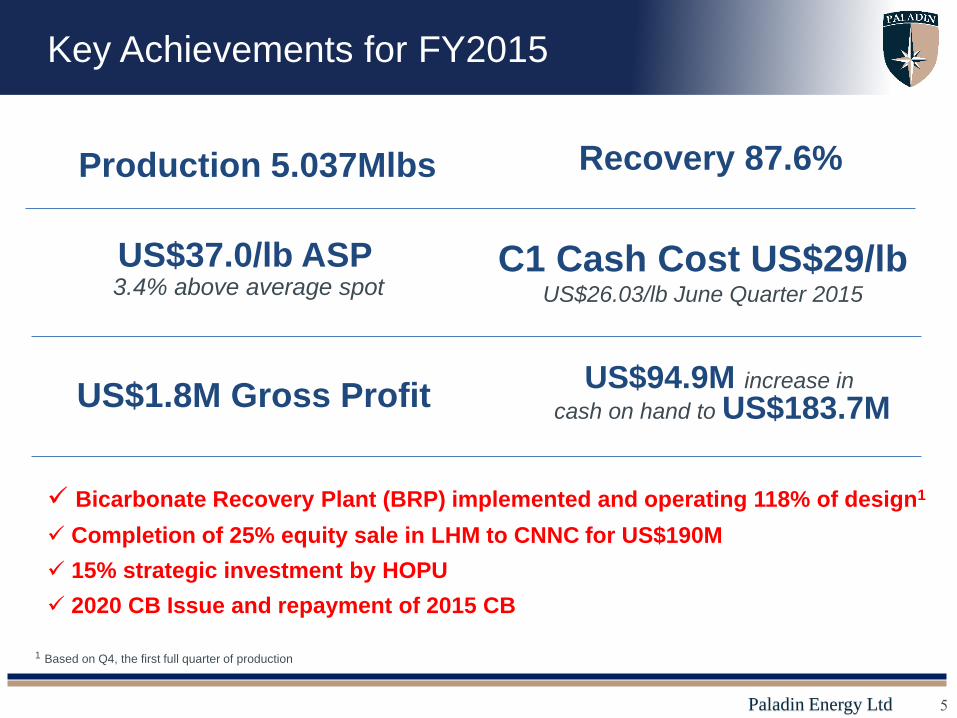
Key Achievements for FY2015
5
C1 Cash Cost US$29/lbUS$26.03/lb June Quarter 2015
Recovery 87.6%
US$37.0/lb ASP3.4% above average spot
US$1.8M Gross Profit
Production 5.037Mlbs
US$94.9M increase in
cash on hand to US$183.7M
Bicarbonate Recovery Plant (BRP) implemented and operating 118% of design1
Completion of 25% equity sale in LHM to CNNC for US$190M
15% strategic investment by HOPU
2020 CB Issue and repayment of 2015 CB
1 Based on Q4, the first full quarter of production

xxxxxxxxxxxxXxxxxxxx
Paladin Energy Ltd
FY2015 Profit & Loss
6
Sales revenue US$198.6M 5.367Mlb sold at average
realised price of US$37.0/lb
Impairments of US$193.1M
(after tax)US$180.8M write down of
Queensland exploration assets
Admin, marketing and
non-production
costs of US$19.3M
Exploration
expenditure
US$5.7M
Gross Profit US$1.8M
Turnaround from FY2014 Gross Loss of US$65.1M
Finance costs US$57.0M
Down 30%
Down 5%
Down 38%
Down 12%

xxxxxxxxxxxxXxxxxxxx
Paladin Energy Ltd
Optimisation a Core Competency
7
Paladin maintains a world class
technical services team focused on
cash flow optimisation
BRP Enhancement 4 now operational
Capital Cost of additional
<US$100k of our original capital
cost of US$6.8M
Recovery of sodium bicarbonate
now exceeds 200% of design
Total operating cost saving now
>US$6/lb (>US$30Mpa)
Additional secondary benefits
33% Reduction

xxxxxxxxxxxxXxxxxxxx
Paladin Energy Ltd
Optimisation a Core CompetencyFY2016 Cash Flow Optimisation Initiatives
8
Mining and processing
optimisation:― Full-year impact of BRP plus increase in expected
performance to over 200% of design
― Alliance style mining contract
Other Controllable costs:― Reduction of head office staff and admin costs
― Exploration on care and maintenance (i.e., minimal
spend to meet licence commitments)
All in total expenditure including annualised impact and optimisation initiatives1
Assumed USD/NAD of 12.60 Vs 11.48 for FY2015
9.6% reduced grade to 694ppm offset by volume increase
1Includes: Operating cash flows; investing cash flows; and debt servicing (including principal and interest payments on the LHM syndicated facility agreement)
US$/lb

xxxxxxxxxxxxXxxxxxxx
Paladin Energy Ltd
Best Leverage to Uranium UpsideUranium is not affected by recent commodity rout
9
30
40
50
60
70
80
90
100
110
120
130
Jan-14 Mar-14 May-14 Jul-14 Sep-14 Nov-14 Jan-15 Mar-15 May-15 Jul-15 Sep-15 Nov-15
Oil Bloomberg Commodity Index Uranium
Reb
as
ed
to
10
0%

xxxxxxxxxxxxXxxxxxxx
Paladin Energy Ltd
Best Leverage to Uranium UpsideUranium has a positive outlook and Paladin has leverage
10
Current situation is positive
― Japan 2 reactors restarted and
25 have applied to follow
― 2017 will see record nuclear
power generation
― 65 reactors under construction
– 59% in Asia
― Mined supply reduced 10% in
2014
― Higher prices are needed
Paladin is leveraged
― Publicly-listed uranium pure
play exposure
― FY2016 85% spot-related
exposure
― FY2017 & FY2018 almost
100% spot relatedSource: TradeTech for historical spot. Analysts’ forecast is based on average of 16
analyst forecasts as shown in latest available reports (analysts include: BAML; BMO;
Cantor; CIBC; CIMB; Cormark; CS; Dundee; JPM; Raymond James; RBC; RFC
Ambrian; Salman; Scotiabank; TD; and UBS).
39
48
55
68
Analysts’ forecast
US$/lb

xxxxxxxxxxxxXxxxxxxx
Paladin Energy Ltd
Strategy
11
1. Maximise LHM operating cash flows through optimisation
initiatives that preserve the integrity of the long-term life
of mine plan
2. Maintain KM and exploration on a “minimal expenditure,
care and maintenance basis”
3. Minimise corporate and administrative costs
4. Progress strategic initiatives with respect to partnerships,
strategic investment, funding and corporate transactions

xxxxxxxxxxxxXxxxxxxx
Paladin Energy Ltd
FY2016 Guidance
12
5.0 - 5.4Mlbs Production
LHM C1 US$25-27/lb7-14% lower than FY2015
Cash flow neutral
for FY2016Subsequent quarters to
be cash flow positive
December Quarter Sales 1.5 - 1.7Mlb
LHM C1 US$25-27/lb
Cash build to US$110-120M
US$4/lb ASP Premium to spot
US$19M corporate costs,
KM care and maintenance
and explorationUS$14M lower than FY2015

xxxxxxxxxxxxXxxxxxxx
Paladin Energy Ltd 13

xxxxxxxxxxxxXxxxxxxx
Paladin Energy Ltd 14
Proxy Votes 2015 Annual General Meeting
For Against Abstain Open usable*
% of Issued Capital
Excluded Votes**
Resolution 1Re-election of Donald Shumka 574,674,092 54,369,240 2,619,718 5,229,908 37.05%
Resolution 2Re-election of Peter Donkin 574,604,801 54,284,408 2,773,818 5,229,931 37.05%
Resolution 3Re-election of Wendong Zhang 587,859,183 41,063,729 2,740,115 5,229,931 37.05%
Resolution 4Renewal of Company’s ProportionalTakeover Provisions
626,800,513 2,237,252 2,613,166 5,237,528 37.05%
(proxy results for remaining resolutions continued over)
* Open usable reflects valid proxies for which no voting indication has been noted – if held by the Chairmanthese will be voted in favour of all resolutions other than for Resolution 8 where the Chair intends to vote against.
** Relates to key management personnel excluded from voting pursuant to ASX Listing Rules
1,149 proxies were received representing 37.05% of the issued capital

xxxxxxxxxxxxXxxxxxxx
Paladin Energy Ltd
(continued from previous slide)
For Against Abstain Open usable*
% of Issued Capital
Excluded Votes**
Resolution 5Approval of Employee Performance Share Rights Plan
566,846,780 39,391,171 1,349,922 5,159,131 35.65% 23,999,055
Resolution 6Approval of Contractors Performance Share Rights Plan
595,932,038 10,043,157 1,706,878 5,167,131 35.65% 23,999,055
Resolution 7Remuneration Report 540,023,703 84,940,837 2,610,000 5,172,793 35.65% 23,999,055
Resolution 8 – if requiredHolding a Spill Meeting 56,647,158 547,308,874 3,683,928 5,209,243 35.65% 23,999,055
Proxy Votes 2015 Annual General Meeting
15
* Open usable reflects valid proxies for which no voting indication has been noted – if held by the Chairmanthese will be voted in favour of all resolutions other than for Resolution 8 where the Chair intends to vote against.
** Relates to key management personnel excluded from voting pursuant to ASX Listing Rules