XXXXX RESOURCES · Process Mineralogical Consulting Ltd. XXXX Resources November 2, 2012 Project #...
48
NOTE: This report refers to the samples as received. The practice of this Company in issuing reports of this nature is to require the recipient not to publish the report or any part thereof without the written consent of Process Mineralogical Consulting. A Mineralogical Description of a Head Sample from the XXXX Project Prepared for XXXXX RESOURCES Project # JUN2012-04 Date: November 2, 2012
Transcript of XXXXX RESOURCES · Process Mineralogical Consulting Ltd. XXXX Resources November 2, 2012 Project #...

NOTE: This report refers to the samples as received.
The practice of this Company in issuing reports of this nature is to require the recipient not to publish the report or any part thereof without the written consent of Process Mineralogical Consulting.
A Mineralogical Description of a Head Sample from the XXXX Project
Prepared for
XXXXX RESOURCES
Project # JUN2012-04
Date: November 2, 2012

Process Mineralogical Consulting Ltd. XXXX Resources November 2, 2012 Project # JUN2012-04
!"
SUMMARY REPORT
One sample identified as “XX Head” was submitted to Process Mineralogical Consulting Ltd for
mineralogical examination. The purpose of the examination was to determine the deportment
and distribution of gold within the sample detailing grain size and association.
METHODOLOGY
The sample was received, weighed and a representative portion riffled for gold assay using fire
assay techniques. The sample was then screened on a 38!m screen to produce two fractions and
a representative portion was riffled from each fraction for gold assay. The individual fractions
were then pre-concentrated using a combination of heavy liquids and Superpan tabling. The
heavy liquid separation was carried out on the individual size fractions using Lithium Meta-
tungstate at a density split point of 2.90g/cc in a centrifuge to concentrate an optimal amount of
the heavy minerals present in each sample. A representative portion of the 2.9g/cc float product
was riffled and submitted for gold assay. The 2.90g/cc Sink fractions were submitted for further
concentration using the Haultain Superpanner to prepare a high gold concentrate (Tip), a
sulphide concentrate (Midd) and a heavy silicate concentrate (Tail) as illustrated in Diagram 1.
The resulting Superpan products were submitted for polished section preparation where replicate
polished sections were prepared from the Midd (2) and Tail (3) products and a single polished
section prepared from the Tip product. Riffled portions of the Midd, Tail and Slimes products
were also submitted for Au assays. The replicate polished sections were systematically scanned
using bright phase recognition software equipped on a Tescan Vega 3 Scanning Electron
Microscope equipped with an Energy Dispersive Spectrometer (SEM-EDS) to determine the
elemental composition of the higher atomic weight elements (Au). The grains were measured
based upon the pixel areas and the semi-quantitative elemental composition analyzed. The
associations with other minerals were noted and the data assembled to present the grain size
distribution, weight distribution and gold mineral association. Backscatter Electron Images
(BEI) were taken of selected grains to demonstrate mineral texture and associations. Mineral
abundance determinations were made of the individual size fractions of each sample using the
Tescan Integrated Mineral Analyzer (TIMA). Additionally, Secondary Ion Mass Spectrometry
(SIMS) work was carried out on the XX Float Concentrate sample (submitted under Project
#SEP2-12-01) to determine the Au content in the pyrite family (pyrite, arsenopyrite and arsenian

Process Mineralogical Consulting Ltd. XXXX Resources November 2, 2012 Project # JUN2012-04
#"
pyrite). These values were utilized in this dataset to account for the sub-micron Au in these
minerals in the XX head sample.
Diagram 1: Schematic of gravity concentration procedures
RESULTS
The results of the mineralogical investigation are presented in the graphs and tables included in
this section, and demonstrate the following:
• The sample is primarily composed of non-opaque gangue minerals, which include quartz
(28%) and plagioclase (39%) with moderate amounts of other silicate minerals (biotite,
orthoclase and clay minerals). Pyrite was observed in minor amounts (4%), trace
amounts of arsenian-pyrite (0.5%) and arsenopyrite (0.5%).
• The primary gold bearing mineral present in the sample is native gold, with minor
amounts of electrum. The semi-quantitative EDX analysis of the gold grains indicates
the gold content ranges from 48 to 100% with an average gold content of 98%.
• Distribution of gold between the separation products indicates that ~80% of the gold was
recovered into the heavy liquid sink products with 70% in the combined Tip and Midd
for the XX Head sample.
• Gold-bearing minerals occur with a normal distribution between 0.5!m and 18!m with
an average of 3 !m often occurring as inclusions in pyrite and arsenopyrite.
Float
Sink
SP Midd SP Tail SP Tip SP Slimes

Process Mineralogical Consulting Ltd. XXXX Resources November 2, 2012 Project # JUN2012-04
$"
• Textural determinations made by Backscatter Electron Imaging (Appendix 1) indicate
that gold-bearing minerals occur primarily as attachments to pyrite and non-opaque
gangue, with a moderate amount locked in pyrite and 7 % as free gold-bearing grains.
• Overall, the visible gold distribution in Table 2 indicates ~7% is present as free grains,
~35% is associated with sulphide minerals, and ~13% is associated with non-opaque
gangue minerals.
• Significant amounts of the gold in this sample remains as solid solution in arsenopyrite
(31%), arsenian pyrite (~10%) and pyrite (4%) as shown in the SIMS report (Appendix
4)
• The distribution of ~35% as fine visible inclusions in sulphides averaging ~3!m in size
added with the free gold grains observed, indicates flotation followed by CN Leach may
recover ~40 % of the gold. The large quantities of gold as sub-microscopic (solid
solution) gold in arsenopyrite and pyrite would suggest that ~45% of the gold would be
recovered by pressure oxidation (POX). The remaining ~15% of the gold remains as
locked/attached grains to non-opaque gangue.
The accompanying tables, graphs and appendices of backscatter electron images and raw data
provide further detail to the distribution of gold-bearing minerals present in each sample.
Table 1: Mineral abundance of XX Head sample determined by TIMA analysis
Fraction `+38 `-38 HeadFraction % 58.8 41.2 -Arsenopyrite 0.43 0.62 0.51Arsenian Pyrite 0.48 0.48 0.48Pyrite 4.63 3.6 4.2Other Sulphides 0.07 0.25 0.14Pyroxene 2.16 2.5 2.3Quartz 32.8 21.3 28.1Orthoclase 2.45 6.6 4.1Plagioclase 35.9 45.4 39.8Talc 0.37 0.03 0.23Amphibole 1.49 0.47 1.1Biotite 5.07 5.3 5.2Clay 4.01 0.73 2.7Other Silicates 3.57 5.7 4.4Oxide 2.10 5.5 3.5Phosphate/Carbonate 3.78 1.6 2.9Other 0.63 0.0 0.38
Mineral Abundance- GG HeadXX

Process Mineralogical Consulting Ltd. XXXX Resources November 2, 2012 Project # JUN2012-04
%"
Table 2: Association Distribution of Gold including “Invisible” Gold in Pyrite Group
Table 3: Solid Solution vs. Visible Gold Determination
Head +38 -38
1 14 6.6 6.5 6.02 82 8.8 12.7 1.7
3 33 17.8 20.2 12.1
4 18 0.9 1.4 0.15 16 4.2 5.4 1.8
6 15 1.1 0.2 2.37 7 12.1 18.7 0.4
8 2 0.01 0.0 0.03
9 2 3.0 0.0 7.1
10 - 31.3 23.0 49.3
11 - 9.7 8.4 12.6
12 - 3.6 3.4 4.013 - 1.0 - 2.6
187 100 100 100
Solid Solution in Arsenopyrite
Solid Solution in Arsenian Pyrite
Solid Solution in Pyrite
FreeLocked in Pyrite
Exposed / Attached to Pyrite
Locked in ArsenopyriteExposed / Attached to Arsenopyrite
Locked in Non-opaque GangueExposed / Attached to Non-opaque Gangue
Associated with Oxides
Associated with Tetrahedrite or Sphalerite
TOTAL
FrequencyGold Distibution %Association Summary
Type of Association
In Sp Slimes
!"#$%&'( )*+"#,, -./0 -1/0 2+#34#5567 89:;;<= >0?0 @A?B 18"5+(';C"&%+ !!"#$ D?/0 D?>> D?@>8"5+(&#(6EC"&%+ #%"!& D?A/ D?A/ D?A/EC"&%+ '"#( D?DF D?D@ D?D>
G(*&5&H,+6896:$#,$= !"#$ !"$% !"&'I&5$"+%+6J',3 A?DK D?/K D?0AL'%#,6896:855#C= A?FF A?AA A?@@
()*+,-*./01234+)+56.10786/

Process Mineralogical Consulting Ltd. XXXX Resources November 2, 2012 Project # JUN2012-04
&"
Table 4: Distribution of Gold Between Upgrade Products in XX Head
Figure 1: Gold-bearing Mineral Association Weighted by Au Distribution in XX Head
!"#
!$#
%"#
"#
&#
"#
""#
'#(#
"#
!!"#$%&"' ()"(**+,-%.-+/"0)11%23"43"()"5-*.2-4).-+/"6"
)*++ ,-./+0123145*26+789-:+01;1<66=.>+016-145*26+ ,-./+01231<*:+3-95*26+789-:+01;1<66=.>+016-1<*:+3-95*26+ ,-./+01231?-3@-9=AB+1C=3DB+789-:+01;1<66=.>+016-1?-3@-9=AB+1C=3DB+ <::-.2=6+01E26>1F820+:<::-.2=6+01E26>1G+6*=>+0*26+1-*1H9>=I+*26+ J31H91HI2K+:
XX

Process Mineralogical Consulting Ltd. XXXX Resources November 2, 2012 Project # JUN2012-04
'"
Figure 2: Visible Gold-bearing Mineral Association Frequency in XX Head
Figure 3: Visible Gold Grain Weighted Size Distribution in XX Head
!"
#$"
%!"
%&"'" ("
#"
%"
%"
!!"#$%&"' !()&"*++(,-%.-(/"0122%34"54"63$71$/,4
)*++ ,-./+0123145*26+789-:+01;1<66=.>+016-145*26+ ,-./+01231<*:+3-95*26+789-:+01;1<66=.>+016-1<*:+3-95*26+ ,-./+01231?-3@-9=AB+1C=3DB+789-:+01;1<66=.>+016-1?-3@-9=AB+1C=3DB+ <::-.2=6+01E26>1F820+:<::-.2=6+01E26>1G+6*=>+0*26+1-*1H9>=I+*26+
!" !" #"$"
%%"
$&"
'"
!"
%!"
&!"
$!"
(!"
#!!"
)"!*+"
,!*+-"#."
,#-"%."
,%-"&."
,&-"(."
,(-"#$."
/"#$"
!"#$"%
&'(")*+&'
,--.#"%&'/01)2.3"%&'4).5"&"#'65)$#7%89'
::';".<'':73<':#.)%'4)8&#)=1>7%''=?'(")*+&'
XX
XX

Process Mineralogical Consulting Ltd. XXXX Resources November 2, 2012 Project # JUN2012-04
("
Figure 4: Visible Gold Grain Size Distribution Frequency in XX Head FINDINGS The occurrences of visible gold in the sample are primarily fine (<16!m) with significant
amounts associated with sulphide minerals. The heavy liquid separation concentrated ~80% of
the gold, suggesting gravity concentration may be an alternative for pre-concentration, although
the fine nature of grains may limit this application. The mass distribution of gold in the
separation products indicates that ~19% remains in the heavy liquid float products which is
support through our observations with 15% of the visible gold occurring as locked or attached
grains to non-opaque gangue minerals. The remaining 4% of the gold will be present as solid
solution / sub-microscopic gold in the arsenopyrite / pyrite grains attached or locked to non-
opaque gangue minerals. The textural occurrences of gold observed are primarily as fracture
fillings in sulphide minerals and as finely disseminated grains interstitial to non-opaque gangue
minerals. An increase in the grinding of the material may provide opportunity for leaching due to
permeability along grain boundaries; although the very fine nature may limits this effect.
!"
#$"
%&"
'$"
!&"
#%"
(")"
#)"
()"
!)"
%)"
*)"
')"
$)"
&)"
+"),*"
-),*."#/"
-#."(/"
-(."%/"
-%."&/"
-&."#'/"
0"#'"
!"#$%&'(#)%*+"
*(,-#
!..&%*(/#0+"'1&2*(/#3'&4*/*%#54',%6(78#
$$#9*&:##$62:#;%&'(##)%*+"*(,-#3'7/%'<"=6(#
XX
Process Mineralogical Consulting Ltd. XXXX Resources November 2, 2012 Project # JUN2012-04
)"
Significant amounts of gold are present in solid solution in the pyritic minerals; the arsenopyrite
has an observed maximum of 427 ppm gold with an average gold content of 88.25 ppm. The
pyrite in the SIMS report has been divided for mineralogical purposes into arsenian pyrite and
pyrite, where arsenian pyrite contains arsenic that is greater than 5000 ppm and pyrite contains
less than 5000 ppm. The arsenian pyrite has a maximum gold content of 127 ppm with an
average content of 26.9 ppm; the pyrite has an observed maximum content of 2.1 ppm with an
average of 1.2 ppm gold. The combination of SIMS and TIMA indicates that the gold found in
solid solution comprises 44% of the total gold in the sample. This combined with the visible
gold associated with sulphide minerals indicates that ~79% is in someway associated with
sulphide minerals. This and the fine nature of the gold and suggest flotation followed by
pressure oxidation or smelting as the most effective method to obtain the highest recovery.
November 1, 2012
Geoffrey R. Lane, B.Sc. (Hons), P.Geo. Chief Mineralogist Process Mineralogical Consulting Ltd.
Technical Assistance: Alan Verstraeten, Mineralogical Technician Jason Redpath, Junior Mineralogist

Process Mineralogical Consulting Ltd. XXXX Resources November 2, 2012 Project # JUN2012-04
*+"
Appendix 1
Backscatter Electron Images of Gold Occurrences

Process Mineralogical Consulting Ltd. XXXX Resources November 2, 2012 Project # JUN2012-04
**"
Figure 1: Three Native Gold Grains Exposed on Arsenopyrite
Figure 2: Pyrite binary with Native Gold

Process Mineralogical Consulting Ltd. XXXX Resources November 2, 2012 Project # JUN2012-04
*!"
Figure 3: Native Gold Exposed on Pyrite
Figure 4: Native Gold attached to Pyrite grain

Process Mineralogical Consulting Ltd. XXXX Resources November 2, 2012 Project # JUN2012-04
*#"
Figure 5: Native Gold rim on Pyrite grain with Native Gold attachment
Figure 6: Native Gold attached to Rutile with NOG inclusions

Process Mineralogical Consulting Ltd. XXXX Resources November 2, 2012 Project # JUN2012-04
*$"
Figure 7: Native Gold binary with Arsenopyrite with small Galena inclusion
Figure 8: Native Gold in grain boundary of Pyrite and Tetrahedrite

Process Mineralogical Consulting Ltd. XXXX Resources November 2, 2012 Project # JUN2012-04
*%"
Figure 9: Interstitial Native Gold in Arsenopyrite fracture.
Figure 10: Native Gold binary with Pyrite

Process Mineralogical Consulting Ltd. XXXX Resources November 2, 2012 Project # JUN2012-04
*&"
Figure 11: Native Gold attached to Pyrite
Figure 12: Native Gold locked in Pyrite

Process Mineralogical Consulting Ltd. XXXX Resources November 2, 2012 Project # JUN2012-04
*'"
Figure 13: Native Gold Locked in Pyrite as attachment to Tetrahedrite
Figure 14: Native Gold Exposed on Pyrite

Process Mineralogical Consulting Ltd. XXXX Resources November 2, 2012 Project # JUN2012-04
*("
Figure 15: Native Gold locked in Pyrite/Non Opaque Gangue grain boundaries
Figure 16: Native Gold exposed on Arsenopyrite
Process Mineralogical Consulting Ltd. XXXX Resources November 2, 2012 Project # JUN2012-04
*)"
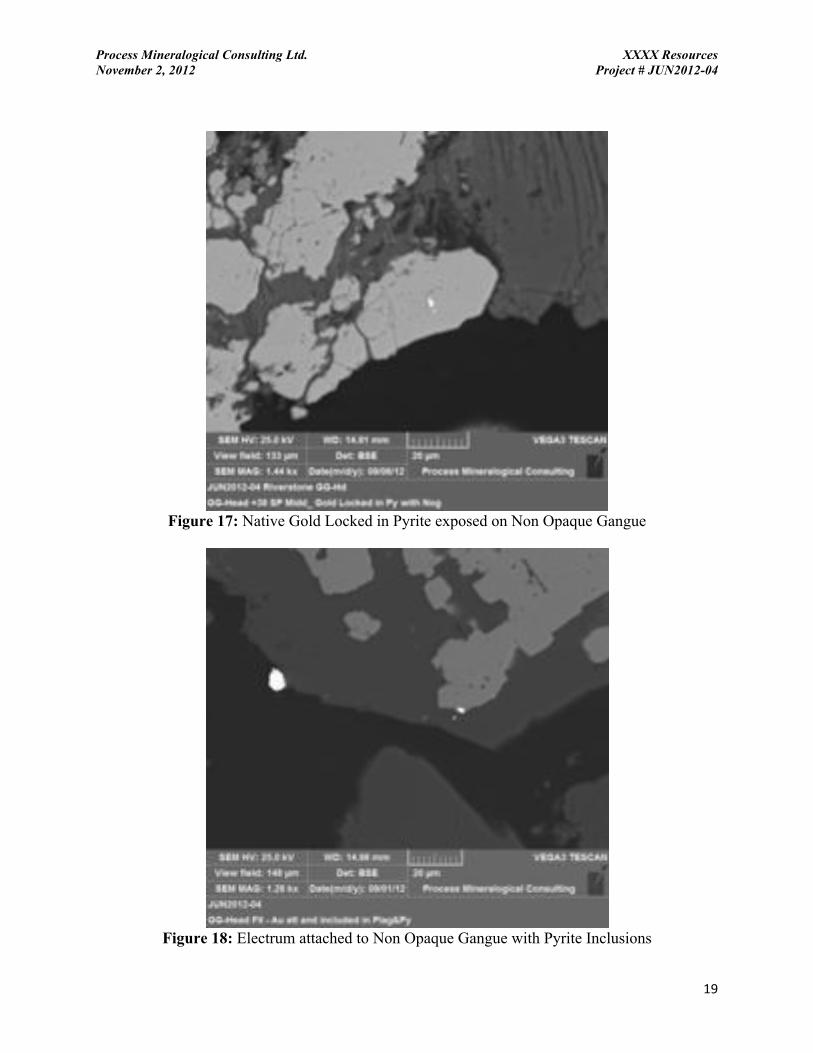
Figure 17: Native Gold Locked in Pyrite exposed on Non Opaque Gangue
Figure 18: Electrum attached to Non Opaque Gangue with Pyrite Inclusions

Process Mineralogical Consulting Ltd. XXXX Resources November 2, 2012 Project # JUN2012-04
!+"
Figure 19: Native Gold locked in fractured Non Opaque Gangue
Figure 20: Native Gold exposed as friable rim on Arsenopyrite

Process Mineralogical Consulting Ltd. XXXX Resources November 2, 2012 Project # JUN2012-04
!*"
Figure 21: Native Gold locked in Non Opaque Gangue
Figure 22: Native Gold locked in Non Opaque Gangue with Pyrite inclusions

Process Mineralogical Consulting Ltd. XXXX Resources November 2, 2012 Project # JUN2012-04
!!"
Figure 23: Native Gold locked in Non Opaque Gangue – Pyrite grain boundary
Figure 24: Native Gold locked in Non Opaque Gangue fracture with Pyrite inclusions

Process Mineralogical Consulting Ltd. XXXX Resources November 2, 2012 Project # JUN2012-04
!#"
Figure 25: Electrum locked in Sphalerite
Figure 26: Electrum locked in Pyrite

Process Mineralogical Consulting Ltd. XXXX Resources November 2, 2012 Project # JUN2012-04
!$"
Figure 27: Native Gold Locked in Pyrite with Non Opaque Gangue attached
Figure 28: Native Gold locked in Arsenian Pyrite fracture

Process Mineralogical Consulting Ltd. XXXX Resources November 2, 2012 Project # JUN2012-04
!%"
Figure 29: Native Gold locked in Pyrite
Figure 30: Native Gold Locked in Brecciated Pyrite

Process Mineralogical Consulting Ltd. XXXX Resources November 2, 2012 Project # JUN2012-04
!&"
Figure 31: Native Gold Exposed on Arsenopyrite
Figure 32: Native Gold locked in Pyrite- Non Opaque Gangue grain Boundary

Process Mineralogical Consulting Ltd. XXXX Resources November 2, 2012 Project # JUN2012-04
!'"
Figure 33: Native Gold locked in Pyrite in Non Opaque Gangue
Figure 34: Native Gold locked in Arsenopyrite in Non Opaque Gangue
Process Mineralogical Consulting Ltd. XXXX Resources November 2, 2012 Project # JUN2012-04
!("
Appendix 2
Raw Data for All Visible Gold Occurrences

Process Mineralogical Consulting Ltd. XXXX Resources November 2, 2012 Project # JUN2012-04
!)"
Table 1.1: Raw Data for All Occurrences in XX Head

Process Mineralogical Consulting Ltd. XXXX Resources November 2, 2012 Project # JUN2012-04
#+"
Table 1.2: Raw Data for All Occurrences in XX Head <continued>

Process Mineralogical Consulting Ltd. XXXX Resources November 2, 2012 Project # JUN2012-04
#*"
Table 1.3: Raw Data for All Occurrences in XX Head <continued>

Process Mineralogical Consulting Ltd. XXXX Resources November 2, 2012 Project # JUN2012-04
#!"
Appendix 3
Visible Gold Distribution Data by Product
XX Head

Process Mineralogical Consulting Ltd. XXXX Resources November 2, 2012 Project # JUN2012-04
##"
Association Summary +38 Float+38 Float Frequency %Weight
1 0 02 39 943 1 34 2 15 1 06 11 37 1 08 0 09 0 0
55 100
Exposed / Attached to Non-opaque Gangue
Locked in Pyrite
Locked in Arsenopyrite
Locked in Non-opaque Gangue
Associated with Oxides
TotalAssociated with Tetrahedrite or Sphalerite
Type of Association
Exposed / Attached to Pyrite
Exposed / Attached to Arsenopyrite
Free
Association Summary +38 Tail+38 Tail Frequency %Weight
1 6 962 0 03 0 04 0 05 0 06 0 07 1 48 0 09 0 0
7 100Total
Associated with Oxides
Locked in Non-opaque GangueExposed / Attached to Non-opaque Gangue
Associated with Tetrahedrite or Sphalerite
FreeLocked in Pyrite
Locked in ArsenopyriteExposed / Attached to Arsenopyrite
Type of Association
Exposed / Attached to Pyrite
Association Summary +38 Midd+38 Midd Frequency %Weight
1 0 02 18 103 5 394 5 35 3 116 0 07 2 378 0 09 0 0
33 100Total
Locked in PyriteExposed / Attached to PyriteLocked in Arsenopyrite
Locked in Non-opaque GangueExposed / Attached to Non-opaque GangueAssociated with OxidesAssociated with Tetrahedrite or Sphalerite
Type of Association
Exposed / Attached to Arsenopyrite
Free
Association Summary +38 Tip+38 Tip Frequency %Weight
1 0 02 16 593 4 404 1 15 1 16 0 07 0 08 0 09 0 0
22 100Total
Type of Association
Exposed / Attached to Arsenopyrite
FreeLocked in PyriteExposed / Attached to PyriteLocked in Arsenopyrite
Locked in Non-opaque GangueExposed / Attached to Non-opaque Gangue
Associated with Tetrahedrite or SphaleriteAssociated with Oxides

Process Mineralogical Consulting Ltd. XXXX Resources November 2, 2012 Project # JUN2012-04
#$"
Association Summary -38 FloatFrequency %Weight
1 0 02 1 83 1 404 0 05 0 06 0 07 1 38 0 09 1 49
4 100
Locked in Non-opaque Gangue
Total
Exposed / Attached to Non-opaque GangueAssociated with OxidesAssociated with Tetrahedrite or Sphalerite
Type of Association
Exposed / Attached to Pyrite
FreeLocked in Pyrite
Locked in ArsenopyriteExposed / Attached to Arsenopyrite
Association Summary -38 TailFrequency %Weight
1 1 82 1 43 1 74 0 05 2 56 4 757 0 08 0 09 0 0
9 100Total
Associated with OxidesExposed / Attached to Non-opaque Gangue
Associated with Tetrahedrite or Sphalerite
FreeLocked in Pyrite
Locked in ArsenopyriteExposed / Attached to Pyrite
Exposed / Attached to ArsenopyriteLocked in Non-opaque Gangue
Type of Association
Association Summary -38 MiddFrequency %Weight
1 3 282 7 63 18 354 9 15 9 296 0 07 2 08 2 19 1 0
51 100Total
Locked in PyriteExposed / Attached to PyriteLocked in Arsenopyrite
Locked in Non-opaque GangueExposed / Attached to Arsenopyrite
Exposed / Attached to Non-opaque GangueAssociated with OxidesAssociated with Tetrahedrite or Sphalerite
Type of AssociationFree
Association Summary - 38 TipFrequency %Weight
1 4 512 0 03 3 494 1 05 0 06 0 07 0 08 0 09 0 0
8 100Total
Exposed / Attached to Arsenopyrite
Type of AssociationFreeLocked in PyriteExposed / Attached to PyriteLocked in Arsenopyrite
Locked in Non-opaque GangueExposed / Attached to Non-opaque GangueAssociated with OxidesAssociated with Tetrahedrite or Sphalerite

Process Mineralogical Consulting Ltd. XXXX Resources November 2, 2012 Project # JUN2012-04
#%"
Association Summary +38 Fraction
Frequency %Au Distribution1 6 102 73 193 10 314 8 25 5 86 11 07 4 298 0 09 0 0
117 100Total
Exposed / Attached to Non-opaque GangueAssociated with OxidesAssociated with Tetrahedrite or Sphalerite
Exposed / Attached to ArsenopyriteLocked in Non-opaque Gangue
Locked in ArsenopyriteExposed / Attached to Pyrite
FreeLocked in Pyrite
Type of Association
Association Summary -38 Fraction
Frequency %Au Distribution1 8 192 9 53 23 384 10 05 11 66 4 77 3 18 2 09 2 22
72 98Total
Exposed / Attached to Non-opaque GangueAssociated with OxidesAssociated with Tetrahedrite or Sphalerite
Exposed / Attached to ArsenopyriteLocked in Non-opaque Gangue
Exposed / Attached to Pyrite
FreeLocked in Pyrite
Locked in Arsenopyrite
Type of Association

Process Mineralogical Consulting Ltd. XXXX Resources November 2, 2012 Project # JUN2012-04
#&"
Appendix 4
SIMS Report

Process Mineralogical Consulting Ltd. XXXX Resources November 2, 2012 Project # JUN2012-04
#'"
SSW Reference: 45612.pro Final report
BY ELECTRONIC MAIL October 29, 2012 Mr. Geoffrey Lane Chief Mineralogist Process Mineralogical Consulting Ltd. 10630 240th Street Maple Ridge, B.C. V2W3B2 Dear Geoff, Attached is the final report on the analysis of your sample that was received in our laboratory on October 1, 2012. The following sample was received: powder sample from one con composite You requested that we analyze the sample in an attempt to determine the gold content and distribution in selected minerals. Normal turnaround was requested for this work. METHODOLOGY The Dynamic SIMS technique is a benchmark technique for analysis of sub-microscopic (invisible) gold in minerals.The sub-microscopic gold detected and quantified by the Dynamic SIMS instrument is refractory gold, i.e. it is locked within the crystalline structure of the mineral phase (most often in sulphide minerals) and it can not be directly released by the cyanide leach process. This type of gold may be present as finely disseminated colloidal size gold particles (<0.5!m) or as a solid solution within the sulphide mineral matrix. During the D-SIMS analysis an ion beam removes consecutive layers of material from the surface of the polished mineral grains and generates depth profiles of the distribution of the chosen elements of interest. Examples of D-SIMS depth profiles (Figures 4-7) show the distribution of the basic matrix elements (S, Fe and As) as well as the trace elements, Au and As (for pyrite). The spikes in the gold signal intensity in the depth profiles represent colloidal gold (Figures 4a and 5a) and the yellow colored areas represent the approximate size of this colloidal type, sub-microscopic gold. The typical size is in the range of 100-200nm. D-SIMS depth profiles for solid solution sub-microscopic gold show a steady (flat) Au signal similar to the matrix elements but with different levels of intensity depending on the concentration of sub-microscopic gold present in the mineral phase (Figures 5b, 6,7).

Process Mineralogical Consulting Ltd. XXXX Resources November 2, 2012 Project # JUN2012-04
#("
The marked mineral particles of interest were analyzed using the Cameca IMS 3F SIMS instrument and concentration depth profiles for Au, As, S and Fe were produced. The quantification of the gold and arsenic was established using internal mineral specific standards. The experimental conditions are described in Appendix A. SUMMARY The objectives of this study were to quantify the sub-microscopic gold content in the following minerals: pyrite and arsenopyrite. The description of the sample analyzed by D-SIMS is provided in Table 1. In total, 93 analyses are provided. Examples of the mineral phases analyzed are presented in Figure 1. A comparison between the determined Au content among the various analyzed mineral phases and morphological varieties in the sample is presented in Figure 2. In addition to the quantification of sub-microscopic gold in these minerals, the arsenic content in pyrite was measured. The correlations between sub-microscopic gold and arsenic content in different morphological types of pyrite was established, Figure 3. Major findings:
A. Identified gold carriers: 1. Arsenopyrite: major gold carrier i) The following different morphological types of arsenopyrite in the sample were identified: coarse, porous and microcrystalline arsenopyrite, Figure 1. ii) The estimated average gold concentrations in the various morphological types of arsenopyrite in the sample are as follows, Table 2: " Coarse: 90.94 ppm " Porous: 87.92 ppm " Microcrystalline: 84.25 ppm
iii) Statistically, 100% of the SIMS concentration depth profiles in arsenopyrite showed presence of solid solution sub-microscopic gold, Figures 6 and 7.
2. Pyrite: major gold carrier i) The following different morphological types of pyrite in the sample were identified: coarse, porous and microcrystalline pyrite, Figure 1.

Process Mineralogical Consulting Ltd. XXXX Resources November 2, 2012 Project # JUN2012-04
#)"
ii) The estimated average gold concentrations in the various morphological types of pyrite in the sample are as follows, Table 3: " Coarse: 2.33 ppm " Porous: 24.79 ppm " Microcrystalline: 41.17 ppm
iii) Statistically, 62% of the SIMS concentration depth profiles in pyrite showed presence of colloidal size sub-microscopic gold (Figure 4a), the rest being solid solution sub-microscopic gold, Figure 5b.
iv) There is a positive correlation between the measured sub-microscopic gold concentration in pyrite and the arsenic content, Figure 3.
If you have any questions, or require further assistance, please contact us. Sincerely,
Brian R. Hart Stamen Dimov Brian R. Hart Stamen Dimov
Research Scientists, for Surface Science Western Att./Data

Process Mineralogical Consulting Ltd. XXXX Resources November 2, 2012 Project # JUN2012-04
$+"
LIST OF CONTENTS I. Quantification of sub-microscopic gold
Table 1 Description of the sample for the D-SIMS study Table 2 Concentration of sub-microscopic gold in arsenopyrite Table 3 Concentration of sub-microscopic gold and arsenic in pyrite Table 4: Determined by optical microscopy abundance of morphological types in
pyrite and arsenopyrite Figure 1 Examples of mineral phases analyzed by D-SIMS
Figure 2 Comparison by mineral/morphological type of the measured mean values of gold concentrations
Figure 3 Correlation between measured concentrations of sub-microscopic gold and arsenic in different morphological types of pyrite
" ,-./01"$" 2342"51678"609:-;1<"-="6>0-71".0?-=<" Figure 5 SIMS depth profile in pyrite grains " ,-./01"&" 2342"51678"609:-;1<"-="?0<1=96>0-71".0?-=<" Figure 7 SIMS depth profile in arsenopyrite grains
Appendix A D-SIMS experimental conditions

Process Mineralogical Consulting Ltd. XXXX Resources November 2, 2012 Project # JUN2012-04
$*"
I. Quantification of sub-microscopic gold
The measured gold concentrations are given in Tables 2-3. Concentrations measured in each grain and their average values per mineral type with the corresponding 95% confidence intervals are included in the tables. Table 1. Description of the sample
Sample ID
Mineral type
# of analyses
SEP2012-01 CONS COMP +38!m MSI403 PS mount M1: SP Tip
Pyrite Arsenopyrite
45 48
Total
93

Process Mineralogical Consulting Ltd. XXXX Resources November 2, 2012 Project # JUN2012-04
$!"
Table 2: Measured concentrations of sub-microscopic gold in arsenopyrite
PS mount M1 Arsenopyrite
Coarse Porous Microcrystalline Grain I.D.
Au ppm
Grain I.D.
Au ppm
Grain I.D.
Au ppm
m1apc02 48.02 m1app01 468.98 m1apm58 39.64 m1apc07 67.37 m1app01a 134.87 m1apm60 6.74 m1apc08 78.01 m1app03 61.92 m1apm61 35.80 m1apc09 125.93 m1app04 7.40 m1apm62 39.73 m1apc10 18.30 m1app05 60.17 m1apm63 194.65 m1apc12 36.63 m1app06 162.81 m1apm64 188.95 m1apc16 17.77 m1app11 8.41 m1apc20 426.57 m1app15 180.94 m1apc22 54.88 m1app17 120.54 m1apc25 184.54 m1app18 92.48 m1apc27 4.25 m1app19 6.89 m1apc28 14.88 m1app21 27.59 m1apc29 62.23 m1app24 13.73 m1apc30 34.50 m1app26 126.78 m1apc33 394.97 m1app32 13.70 m1apc42 26.11 m1app43 16.40 m1apc44 4.60 m1app45 22.37 m1apc51 9.16 m1app47 8.93 m1apc52 36.34 m1app48 156.41 m1apc53 23.56 m1app49 67.14 m1apc59 20.84 m1apc69a 311.24
Average 90.94 87.92 84.25 ±# 53.38 48.18 68.78
±#: 95 % confidence interval #= 2 $/%n; $ is the standard deviation; n is the number of analyses

Process Mineralogical Consulting Ltd. XXXX Resources November 2, 2012 Project # JUN2012-04
$#"
Table 3: Measured concentrations of sub-microscopic gold and arsenic in pyrite
PS mount M1 Pyrite
Coarse Porous Microcrystalline Grain I.D.
Au ppm
As ppm
Grain I.D.
Au ppm
As ppm Grain I.D.
Au ppm
As ppm
m1pyc100 3.48 15513 m1pyp48a 53.38 18370 m1pym119 17.37 17636 m1pyc102 2.32 8199 m1pyp65 58.55 20903 m1pym120 10.52 116071 m1pyc103 1.58 4966 m1pyp66 0.29 2397 m1pym121 3.77 12724 m1pyc104 0.72 4254 m1pyp67 0.31 312 m1pym124 46.77 21248 m1pyc118 10.33 11902 m1pyp68 2.24 12151 m1pym125 127.44 22896 m1pyc122 1.11 2441 m1pyp69 3.06 9083 m1pyc123 1.16 8346 m1pyp70 2.07 4055 m1pyc76 3.10 7640 m1pyp71 0.52 3658 m1pyc83 2.77 14485 m1pyp72 47.57 16286 m1pyc85 1.79 993 m1pyp73 98.04 25199 m1pyc87 1.24 3098 m1pyp74 18.33 14737 m1pyc89 1.01 1312 m1pyp75 1.20 5260 m1pyc91 1.01 520 m1pyp80 6.15 10086 m1pyc92 1.38 3298 m1pyp81 52.51 17883 m1pyc93 3.05 2071 m1pyp82 20.14 10969 m1pyc94 2.01 901 m1pyp84 23.01 16115 m1pyc95 0.33 3624 m1pyp86 27.40 17532 m1pyc97 5.52 10688 m1pyp88 0.81 4528 m1pyc98 1.48 5328 m1pyp90 1.80 353 m1pyc99 1.13 2280 m1pyp96 78.49 26086
Average 2.33 5593 24.79 11798 41.17 38115
±# 1.00 2052 13.32 3571 45.56 39134 ±#: 95 % confidence interval #= 2 $/%n; $ is the standard deviation; n is the number of analyses Table 4: Determined by optical microscopy abundance of morphological types in pyrite and arsenopyrite

Process Mineralogical Consulting Ltd. XXXX Resources November 2, 2012 Project # JUN2012-04
$$"
Abundance,% """
Arsenopyrite Coarse Porous Microcrystalline
28 58 14 Pyrite
Coarse Porous Microcrystalline 21 66 13
Pyrite coarse Pyrite porous Pyrite microcrystalline
Arsenopyrite coarse Arsenopyrite porous Arsenopyrite microcrystalline
Figure 1. Examples of minerals/morphological types analyzed by D-SIMS

Process Mineralogical Consulting Ltd. XXXX Resources November 2, 2012 Project # JUN2012-04
$%"
0.1
1
10
100
1000
Pyrite coarse Pyrite porous Pyritemicrocrystalline
Arsenopyritecoarse
Arsenopyriteporous
Arsenopyritemicrocrystalline
Au,
ppm
Figure 2. Comparison by mineral phase/morphological type of the measured mean values of sub-microscopic gold concentration.
100
1000
10000
100000
0.10 1.00 10.00 100.00 1000.00
Au, ppm
As,
ppm
coarse porous microcrystalline
Figure 3. Scatter plot of gold and arsenic concentration in different morphological types of pyrite. Note: Au and As concentrations are plotted logarithmically.

Process Mineralogical Consulting Ltd. XXXX Resources November 2, 2012 Project # JUN2012-04
$&"
Direction of analysis by D-SIMS Direction of analysis by D-SIMS
Grain surface Grain surface
A B
Figure 4. Concentration depth profiles of sub-microscopic gold in pyrite. A) colloidal size sub-microscopic gold in a porous pyrite grain: Au= 1.20ppm B) solid solution type sub-microscopic gold in a porous pyrite grain: Au= 98.04 ppm Note: The spikes in the gold signal intensity in the depth profiles represent colloidal gold and the yellow colored areas represent the approximate size of the colloidal type sub-microscopic gold on the depth scale
Direction of analysis by D-SIMS Direction of analysis by D-SIMS
Grain surface Grain surface
A B
Figure 5. Concentration depth profiles of sub-microscopic gold in pyrite. A) colloidal size sub-microscopic gold in a coarse pyrite grain: Au= 0.72ppm B) solid solution/colloidal type sub-microscopic gold in a microcrystalline pyrite grain: Au= 46.77 ppm

Process Mineralogical Consulting Ltd. XXXX Resources November 2, 2012 Project # JUN2012-04
$'"
Direction of analysis by D-SIMS Direction of analysis by D-SIMS
Grain surface Grain surface
A B
Figure 6. Concentration depth profiles of sub-microscopic gold in arsenopyrite. A) solid solution type sub-microscopic gold in a coarse arsenopyrite grain: Au= 426.57ppm B) solid solution type sub-microscopic gold in a microcrystalline arsenopyrite grain: Au= 194.65 ppm
Direction of analysis by D-SIMS Direction of analysis by D-SIMS
Grain surface Grain surface
A B
Figure 7. Concentration depth profiles of sub-microscopic gold in arsenopyrite. A) solid solution type sub-microscopic gold in a porous arsenopyrite grain: Au= 468.98ppm B) solid solution type sub-microscopic gold in a porous arsenopyrite grain: Au= 120.54 ppm

Process Mineralogical Consulting Ltd. XXXX Resources November 2, 2012 Project # JUN2012-04
$("
APPENDIX A
ANALYTICAL TECHNIQUE AND CONDITIONS
Technique: Secondary Ions Mass Spectrometry (SIMS) Instrument: Cameca IMS-3f Operating conditions for quantitative analysis: " Primary ions: Cs+ " Secondary ions: Au-, S-, Fe-, As-
" Primary ion energy: 10kV " Primary current: 15nA " Primary beam spot size: 15!m " -180V offset to suppress molecular interferences in depth profile mode


![Composite-Katalog Neuhaeuser Jun2012 ENG[1]](https://static.fdocuments.us/doc/165x107/563db847550346aa9a923532/composite-katalog-neuhaeuser-jun2012-eng1.jpg)