XXXII. ROBUST TRUCKLOAD RELAY NETWORK DESIGN UNDER … · XXXII. ROBUST TRUCKLOAD RELAY NETWORK...
22
1 XXXII. ROBUST TRUCKLOAD RELAY NETWORK DESIGN UNDER DEMAND UNCERTAINTY Hector A. Vergara Oregon State University Zahra Mokhtari Oregon State University Abstract This research addresses the issue of incorporating demand uncertainty in the strategic design of relay networks for truckload transportation. An existing composite variable mathematical model for the design of hybrid relay networks is extended by developing its robust counterpart. The proposed approach considers uncertainty in the number of truckloads to be dispatched between a pair of nodes in the network which is characterized by a symmetric interval around the expected demand value. A two-step heuristic approach is used to solve the robust model. Several numerical experiments are carried out to study the differences between the solutions obtained with the robust approach and those generated by the existing deterministic model. In particular, we were interested in understating how different levels of uncertainty affect total cost of the system and the configuration of the resulting networks. At the end, numerical results are discussed and directions for future research are presented. 1 Introduction Full truckload (TL) transportation is one of the key modes of transportation of goods in the United States accounting for 71% of the total value and 69% of the total weight transported [1]. In the traditional Point-to-Point (PtP) dispatching method used by TL carriers, a single driver delivers a load from origin to destination. This dispatching method results from carriers attempting to minimize empty repositioning movements between different load deliveries to benefit from high vehicle utilization. As a result of this objective and since it is difficult to find appropriate back-haul trips to get drivers back to their home domiciles, drivers are usually assigned to a series of new load pick- ups originating in the vicinity of previous drop-offs. The resulting tours keep drivers on the road for an average of two to three weeks at a time which significantly affects the perception of low quality of life for drivers and motivates them to quit [2]. The resulting
Transcript of XXXII. ROBUST TRUCKLOAD RELAY NETWORK DESIGN UNDER … · XXXII. ROBUST TRUCKLOAD RELAY NETWORK...

1
XXXII. ROBUST TRUCKLOAD RELAY NETWORK DESIGN UNDER DEMAND UNCERTAINTY
Hector A. Vergara
Oregon State University
Zahra Mokhtari
Oregon State University
Abstract
This research addresses the issue of incorporating demand uncertainty
in the strategic design of relay networks for truckload transportation. An
existing composite variable mathematical model for the design of hybrid
relay networks is extended by developing its robust counterpart. The
proposed approach considers uncertainty in the number of truckloads to be
dispatched between a pair of nodes in the network which is characterized
by a symmetric interval around the expected demand value. A two-step
heuristic approach is used to solve the robust model. Several numerical
experiments are carried out to study the differences between the solutions
obtained with the robust approach and those generated by the existing
deterministic model. In particular, we were interested in understating how
different levels of uncertainty affect total cost of the system and the
configuration of the resulting networks. At the end, numerical results are
discussed and directions for future research are presented.
1 Introduction
Full truckload (TL) transportation is one of the key modes of transportation of goods in
the United States accounting for 71% of the total value and 69% of the total weight
transported [1]. In the traditional Point-to-Point (PtP) dispatching method used by TL
carriers, a single driver delivers a load from origin to destination. This dispatching
method results from carriers attempting to minimize empty repositioning movements
between different load deliveries to benefit from high vehicle utilization. As a result of
this objective and since it is difficult to find appropriate back-haul trips to get drivers
back to their home domiciles, drivers are usually assigned to a series of new load pick-
ups originating in the vicinity of previous drop-offs. The resulting tours keep drivers on
the road for an average of two to three weeks at a time which significantly affects the
perception of low quality of life for drivers and motivates them to quit [2]. The resulting

2
high driver turnover and the lack of qualified drivers are major issues that historically
affect the TL industry as described in [3].
As an alternative to PtP dispatching for TL transportation, relay networks have been
studied given their potential to produce more regular routes for the drivers and to
facilitate reducing the length of their tour lengths, so that drivers are able to return back
to their home domiciles more frequently [4], [5], [6], [7]. In this alternative configuration,
each load is carried by several drivers that exchange trailers at relay points (RPs) or hubs.
Two types of drivers are in charge of carrying loads between non-RP nodes and RPs
(local drivers) and between RPs (lane drivers), respectively. Limitations on the distances
that local and lane drivers are allowed to travel result in more regular routes for them as
compared to traditional PtP movements. Figure 1 shows a graphical representation of a
RN that is used to transport a load from node i to node j using three RPs.
Figure 1: Example of a Relay Network for TL Transportation.
Several studies have explored the integrated Truckload Relay Network Design
(TLRND) problem considering both strategic and tactical decisions while satisfying
operational constraints. Mainly, these studies have focused on developing mathematical
models and solution approaches for this problem and its extensions such as the work
completed by Üster and Maheshwari [4], Üster and Kewcharoenwong [5], Vergara and
Root [6], Vergara and Root [7] and Melton and Ingalls [8].
However, most of the previous studies are restricted to deterministic models of the
TLRND problem and use the best estimates of the design parameters. In reality, costs,
demand, travel times and other parameters of the model might be highly uncertain. We
developed a mathematical formulation that is solved to obtain a relay network design that
remains feasible for all possible demand realizations and represents a robust solution that
is close to the best (i.e., deterministic) solution for almost any demand value. As such,
we are able to overcome some of the limitations of existing deterministic modeling and
solution approaches to evaluate real world problems.
In this paper, we present a robust counterpart to the integer programming model
proposed by Vergara and Root [7] for the design of hybrid relay networks in order to
handle truckload demand fluctuations between a given set of origin-destination (O-D)
node pairs in the network. In reality, a large fraction of the demand for TL carriers is
only observed a few days in advance. This robust counterpart was developed using the
robust optimization approach presented by Bertsimas and Sim [9] which was applied
assuming that load demand between O-D pairs fluctuates in bounded and symmetric
i
jNode
Relay Point
Lane Transportation
Local Transportation

3
intervals. To the best of our knowledge, this is the first time that a robust optimization
approach is applied to the TLRND problem or its extensions. Numerical experiments of
the robust optimization model and solution approach used in this research were
completed and the results were compared to solutions obtained for the deterministic case
to determine the effect of demand uncertainty in solution cost and the design of the
network. In addition, we explored how different levels of protection against uncertainty
affect the characteristics of the robust solutions and the computational speed of our
modeling and solution approach.
The remainder of this paper is organized as follows. Section 2 includes a review of
related literature and a formal definition of the Robust Truckload Relay Network Design
Problem with Mixed Fleet Dispatching (R-TLRN-MD) problem. Section 3 presents the
robust optimization framework that was applied in this research and describes the
solution approach used to solve R-TLRND-MD. The computational experiments and
performance evaluation of the robust model as it is compared to the deterministic case are
presented in Section 4. Finally, concluding remarks and future research directions are
discussed in Sections 5 and 6, respectively.
2 Problem Description 2.1 Literature Review
2.1.1 Relay Networks for TL Transportation The fact that more regular tours and lower driver turnover rates exist in the Less-than-
Truckload (LTL) industry, in which hub-and-spoke (H&S) networks are used, motivated
researchers and carriers to investigate the potential benefits of implementing such
networks for TL transportation. The evolution of the research on several H&S-type
configurations for TL transportation has resulted in several proposed alternative
dispatching methods which have been described in the existing literature. A significant
number of these research studies have used simulation-based approaches to investigate
the benefits of such structures for TL transportation while a more recent group of studies
deals with the development of mathematical modeling and solution approaches for the
strategic design of relay networks for TL transportation.
This literature review focuses on research studies that are related to the design and
evaluation of mixed fleet configurations where some of the loads are transported through
the RN while the rest of the loads are still transported PtP. Such configurations are of
interest to carriers and researches given their potential for actual implementation in
practice. Taylor and Whicker [10] proposed an integer programming model and heuristic
solution approach for the design of distributed manufacturing networks that combine PtP
and RN movements in an effort to regularize TL driving routes. Their model creates
partial networks in which nodes with high density of transactions are used as part of a
relay network while the loads associated with other nodes are moved PtP. In another

4
study, Liu et al. [11] compared the performance of mixed truck delivery systems against
pure PtP and pure H&S networks. They developed a heuristic model and evaluated the
savings on total travel distance as their only performance measure. According to their
experimental results, the mixed delivery system outperformed the pure PtP and pure H&S
networks and lead to 10% savings in total travel distance.
The incorporation of relays points in TL transportation has also been studied by Hunt
[12] and Ali et al. [13] who developed algorithmic approaches to locate RPs to serve loads
in a TL transportation network. Tsu and Agarwal [14] developed linear programming
models for the design of networks with and without relay points in order to find
regularized private fleet tours that minimize the cost of distribution. They found a
significant reduction in the number of drivers that are needed and shorter tours as a result
of utilizing relays in the network.
The first mathematical formulation for the TLRND problem was developed by Üster
and Maheshwari in [4]. They developed a mixed integer programming model that
integrates the multi-commodity flow network and hub location models to determine the
location of RPs and the selection of routes for the loads through the RN. Their
formulation includes constraints that restrict the distances for local and lane movements
as well as limitations on out-of-route miles and equipment imbalance at the nodes in the
network. However due to tractability issues, the constraints on out-of-route miles and
equipment imbalance were later relaxed to obtain solutions for larger instances using a
heuristic approach based on tabu search. This original formulation was slightly modified
in [5] by Üster and Kewcharoenwong and solved to optimality for instances of up to 80
nodes. A Bender’s decomposition-based approach was used to obtain high quality
solutions satisfying the operational constraints that were relaxed in [4]. The authors
emphasized the potential benefit of integrating a partial RN design along with PtP
dispatching to minimize the total installation and transportation cost of the RN.
In [6], Vergara and Root developed an alternative formulation for TLRND using
composite variables that represent feasible truckload routes. In this approach, restrictions
on local and lane distance movements, out-of-route miles and number of RPs allowed to
be visited are considered when generating feasible routes to be used in an integer
program that minimizes the total cost of transportation and installation of RPs. The
authors used an exact solution method based on branch-and-cut to solve networks with 50
nodes. For larger instances, a heuristic approach with a reduced number of composite
variables is used to obtain high quality solutions for problems with up to 150 nodes. A
test case with real data from a major TL carrier is also solved using the heuristic approach
in reasonable computation time.
Later, Vergara and Root [7] extended their composite variable model to strategically
design mixed fleet configurations of TLRND integrating PtP and RN shipments. The
selection of the dispatching mode was incorporated as an additional decision variable in
their formulation and additional operational constraints associated with this alternative
configuration were also included. A branch-and-cut approach was also used to solve the
model for 50 node networks and a heuristic approach was used to efficiently solve larger
instances up to 150 nodes within reasonable computational time. The experimental

5
results obtained in this research proved the benefits of a mixed fleet dispatching system in
TL trucking over pure PtP and RN-only configurations.
More recently, Melton and Ingalls [8] developed a mixed integer quadratic program to
model a highway transportation network with the goal of locating relay points within a
TL dispatching system. Their objective function included annual transportation cost,
annual fixed amortized cost of building relay points, annual driver turnover cost, and
truck and trailer depreciation cost. The experimental results in [8] also showed a better
performance of the relay network as compared to the PtP method in providing suitable
driver work hours and driver home time.
Without attempting to be comprehensive, Table 1 shows a summary of existing
research on the strategic design of relay networks for TL transportation.
Table 1: Summary of Relay Network Design for TL Transportation Research.
Study Contribution
Taylor and Whicker [10] Optimization model and heuristic approach for
distributed manufacturing networks
Liu et al. [11] Heuristic model to compare mixed truck delivery
against pure PtP and pure H&S
Hunt [12] Algorithmic approach to locate RPs and create
shortest path routes
Ali et al. [13] Heuristic models for H&S network design to minimize
the number of RPs
Tsu and Agarwal [14] Linear programming models for network design with
and without relay points in private fleets
Üster and Maheshwari [4] Integer programming model for multi-zone
dispatching
Üster and Kewcharoenwong [5] Bender’s Decomposition-based algorithm to obtain
optimal solutions for Üster and Maheshwari [4]
Vergara and Root [6] Composite variable model for TLRND and heuristic
solution approach
Vergara and Root [7] Composite variable model for TLRND with mixed
fleet dispatching incorporating PtP and relay network
Melton and Ingalls [8] Mixed integer quadratic programming model for
TLRND
2.1.2 Robust Optimization in Network Design and Transportation Planning In [15], Rosenhead et al. analyzed the long-term decision making nature of strategic
planning problems and emphasized that finding an optimal solution for such problems is
not always an appropriate approach for decision making. They suggested that, in
practice, finding flexible solutions that are near-optimal for a wide variety of conditions
of uncertain inputs is sometimes more desirable for managers, so that they have feasible
alternative plans available when making strategic decisions. Based on this, several
approaches have been developed to incorporate uncertainty in mathematical models used
for decision making. For example, Bertsimas and Sim [9] introduced a robust

6
optimization approach for discrete optimization and network flow problems in which the
level of conservatism against uncertainty that is incorporated in the model is controllable
in terms of the number of coefficients that are allowed to change value due to uncertainty.
In their approach, only a subset of the coefficients might be assumed to take on their
worst possible values as opposed to enforcing this condition for all coefficients which is
very common in other robust optimization approaches in the literature (such as the
method presented by Soyster in [16]). Bertsimas and Sim [9] provided a comprehensive
description of how to address data uncertainty for coefficients in the objective function
and constraints of the optimization model, and presented efficient procedures to deal with
such mathematical models.
Reviewing the literature, it is clear that robust optimization approaches have been
used in several network design and transportation planning problems in the past.
Gutierrez et al. in [17] obtained robust designs for the general uncapacitated network
design problem involving considerable uncertainty in the input data. Their approach
considered using an algorithm to generate network designs that lie within p% of the
optimal solution for any realization of the uncertain input parameters.
Ukkusuri and Mathew [18] introduced a formulation for a strategic robust network
design problem (RNDP) that is characterized by a weighted objective function of the
expected value and the standard deviation of the total system travel time under demand
uncertainty. The authors developed a genetic algorithm-based methodology to solve the
RNDP and obtained near-optimal solutions. Mudchanatongsuk et al. [19] studied the
problem of robust capacitated network design with single origin and destination per
commodity. In this research, transportation cost and demand are allowed to fluctuate in
independent closed convex uncertainty sets. The authors developed an approximation of
the adjusted RNDP formulation and showed that the approximate adjusted robust
counterpart of the arc-flow network problem is equivalent to the robust counterpart of the
path-flow network formulation which has a tractable linear relaxation that is solved using
a column generation procedure.
In another study related to transportation planning, List et al. [20] studied the fleet
sizing problem under uncertainty on the demand and the conditions of productivity under
which they operate. The proposed model accounted for a quantification of the intuitive
tradeoff between expected cost of owning more vehicles and the risk of being out of
efficient vehicles. More recently, Erera et al. [21] proposed a robust optimization
approach for the empty repositioning problem in LTL transportation when resource net
supply at each time-space node is uncertain. Their formulation considered the
minimization of flow cost under network flow balance constraints and decisions about
empty flows on each arc. They applied the uncertainty budget approach of Bertsimas and
Sim [9] and surveyed three types of robust repositioning problems.
While the TLRND problem is classified as a strategic decision problem, the majority
of the research in this area has failed to explicitly incorporate the existing uncertain
nature of the design parameters in the mathematical formulation of this problem. The
application of robust optimization approaches to other network design and transportation
planning problems with uncertain input data demonstrates the capability of this approach
7
to capture parameter uncertainty within the TLRND problem as well. Thus, the main
contribution of this study is to develop a robust optimization approach for the solution of
the TLRND problem when a mixed fleet configuration that includes PtP and RN
dispatching is used.
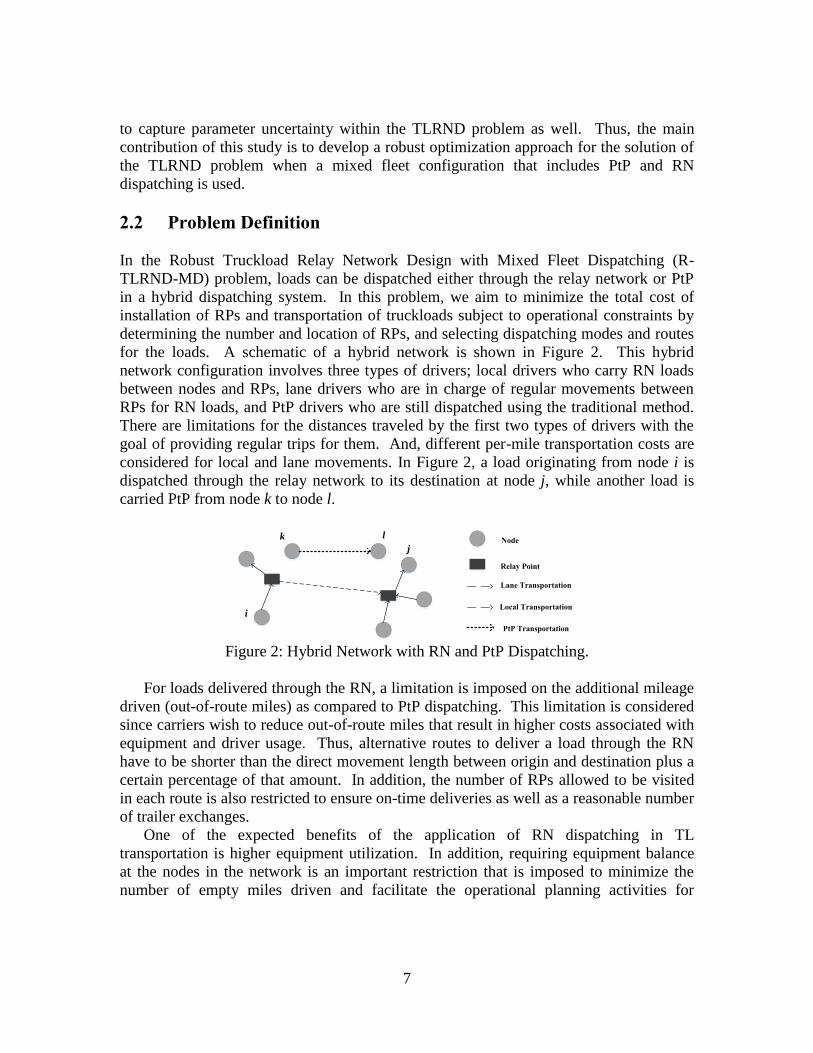
2.2 Problem Definition In the Robust Truckload Relay Network Design with Mixed Fleet Dispatching (R-
TLRND-MD) problem, loads can be dispatched either through the relay network or PtP
in a hybrid dispatching system. In this problem, we aim to minimize the total cost of
installation of RPs and transportation of truckloads subject to operational constraints by
determining the number and location of RPs, and selecting dispatching modes and routes
for the loads. A schematic of a hybrid network is shown in Figure 2. This hybrid
network configuration involves three types of drivers; local drivers who carry RN loads
between nodes and RPs, lane drivers who are in charge of regular movements between
RPs for RN loads, and PtP drivers who are still dispatched using the traditional method.
There are limitations for the distances traveled by the first two types of drivers with the
goal of providing regular trips for them. And, different per-mile transportation costs are
considered for local and lane movements. In Figure 2, a load originating from node i is
dispatched through the relay network to its destination at node j, while another load is
carried PtP from node k to node l.
Figure 2: Hybrid Network with RN and PtP Dispatching.
For loads delivered through the RN, a limitation is imposed on the additional mileage
driven (out-of-route miles) as compared to PtP dispatching. This limitation is considered
since carriers wish to reduce out-of-route miles that result in higher costs associated with
equipment and driver usage. Thus, alternative routes to deliver a load through the RN
have to be shorter than the direct movement length between origin and destination plus a
certain percentage of that amount. In addition, the number of RPs allowed to be visited
in each route is also restricted to ensure on-time deliveries as well as a reasonable number
of trailer exchanges.
One of the expected benefits of the application of RN dispatching in TL
transportation is higher equipment utilization. In addition, requiring equipment balance
at the nodes in the network is an important restriction that is imposed to minimize the
number of empty miles driven and facilitate the operational planning activities for
i
jNode
Relay Point
Lane Transportation
Local Transportation
k l
PtP Transportation

8
carriers. For PtP loads, a repositioning cost is included on top of the regular
transportation cost as a surrogate for this constraint.
Additional operational constraints consider a minimum volume required to justify
opening a RP based on the level of traffic at a given node and a maximum proportion of
loads that are allowed to be dispatched PtP. The latter requirement is established to
ensure that the benefits of operating the RN in terms of improved driving tours are
observed for most of the drivers in the company.
Finally, the biggest challenge associated with R-TLRN-MD deals with the
requirement that shipments between O-D node pairs need to be satisfied even though
uncertainty on the number of loads exists.
3 Modeling and Solution Approach 3.1 Model Formulation
In this section, we present a mathematical formulation for R-TLRND-MD that is the
robust counterpart to the integer programming model developed by Vergara and Root [7]
for the deterministic case of this problem (TLRND-MD). The uncertain parameter
considered was the amount of demand for truckloads between a specific O-D node pair,
. The robust counterpart model was obtained using the Bertsimas and Sim [9] approach
for robust discrete optimization problems. Using this approach, we captured the
fluctuation in the amount of demand for a given O-D pair by using an uncertainty set
(i.e., a symmetric interval around such as ). In addition, the
Bertsimas and Sim [9] approach seemed reasonable as intuitively all the demands
between O-D pairs are not likely to change simultaneously. Based on this notion, a limit
on the number of O-D pairs with uncertain demand was set to a given number Γ. This
means that we assumed that among all the coefficients in the nominal (deterministic)
model that are subject to uncertainty, only Γ of them have , while the rest (i.e., the
O-D pairs with certain demand) have . More details about the application of the
robust optimization approach to the nominal model are presented in Section 3.2.
In our formulation, a composite variable is a feasible routing for truckloads that are
dispatched between an O-D pair that satisfies constraints on local and lane distance,
maximum percentage of out-of-route miles and maximum number of RPs allowed to be
visited. A description of how these composite variables are generated is presented in
Section 3.3.
The following notation is used in the formulation of the R-TLRND-MD model which
is based on the composite variable model for TLRND-MD presented in [7].
Sets
= set of composites r,
= set of O-D pairs t with truckload demand,
= set of nodes k,

9
set of O-D pairs t with uncertain truckload demand, S T,
= set of composites r for O-D pair t, ,
= set of composites r that visit node k, .
Parameters
= cost of composite r, ,
= fixed cost of relay point k, ,
= cost of dispatching a truckload for O-D pair t using PtP dispatching, ,
= demand for O-D pair t (in number of truckloads), ,
= maximum acceptable percentage equipment imbalance,
= maximum proportion of truckloads to be dispatched direct PtP,
= minimum volume (in number of truckloads) required to open a RP,
Γ = maximum number of O-D pairs with uncertain demand, |S| ≤ Γ,
= -1 if node k is the origin relay point of composite r,
1 if node k is the destination relay point of composite r, ,
0 otherwise,
= 1 if composite r visits relay point k, ,
0 otherwise.
Variables
= number of composites r used, ,
= 1 if a relay point is opened at node k, ,
0 otherwise,
= number of truckloads sent direct PtP for O-D pair t, ,
dual multipliers associated with constraints in TLRND-MD (see reference [7])
that include the uncertain parameter, .
Using the above notation, R-TLRND-MD can be formulated as follows:
min ∑
∑
∑
(1)
subject to
∑
∑
(2)
∑
∑
(3)
∑
∑
∑
(4)

10
∑
∑
∑
(5)
∑
(6)
∑
∑
∑
(7)
(8)
(9)
(10)
integer (11)
{ } (12)
integer (13)
(14)
The objective function (1) minimizes the total cost of opening RPs and transporting
truckloads. Constraint (2) enforces demand satisfaction for all O-D pairs that have
truckload demand, either by using the RN or using PtP movements. This constraint
incorporates uncertain demand parameters and has been obtained using the procedure that
is described in Section 3.2. Constraint (3) enforces the selection of routes that only visit
open RPs. Constraints (4) and (5) enforce equipment balance at the nodes of the RN.
Constraint (6) enforces the requirement that a minimum volume is required to open a RP.
Constraint (7) sets the limitation on the number of PtP load deliveries that are allowed.
Constraints (8) to (10) result from the application of the robust optimization approach of
Bertsimas and Sim [9] to the TLRND-MD model in [7] to deal with demand uncertainty.
The development procedure for these constraints is presented in Section 3.2. Constraints
(11) to (14) enforce variable-type constraints on the decision variables.
3.2 Application of Robust Optimization Approach
In this section we illustrate how the Bertsimas and Sim [9] procedure for robust
optimization was applied to obtain the formulation presented in Section 3.1. Considering
demand uncertainty as a symmetric interval around the expected value of demand
required the modification of constraints (2), (3) and (7) in the nominal
model presented in [7], and also the addition of more constraints and variables to the
robust mathematical model. The first step of the robust optimization approach requires
modifying the original constraints in the nominal model as follows:
∑
max{ { } ⌊ ⌋ }
{ ( ⌊ ⌋) } (2a)

11
∑
max{ { } ⌊ ⌋ }
{ ( ⌊ ⌋)( }
(3a)
∑
max{ { } ⌊ ⌋ }
{ ∑
( ⌊ ⌋) } ∑
(7a)
Then, according to the Bertsimas and Sim [9] robust optimization procedure, the
inner maximization problems can be written as linear optimization problems as follows:
max subject to ∑
(2b)
max [ ] subject to ∑
(3b)
max [ ∑
] subject to
(7b)
After defining the dual formulations for the maximization problems presented above,
we obtained the following minimization problems:
min [ ∑
] subject to
(2c)
min [ ∑
] subject to (3c)
min [ ∑
] ∑
(7c)
Finally, the objective functions of (2c), (3c) and (7c) were incorporated to constraints
(2), (3) and (7) of the nominal model while the associated constraints of (2c), (3c) and
(7c) were added to obtain the final mathematical formulation of R-TLRND-MD that is
presented in Section 3.1.
3.3 Solution Approach
A two-step heuristic solution approach was used to solve several instances of R-TLRND-
MD based on previous research by Vergara and Root [7]. In the first step, composite
variables representing feasible routes for truckloads and empty movements between O-D

12
pairs using the relay network were generated. In the second step, the generated
composite variables were used to solve the integer programming formulation presented in
Section 3.1.
For the generation of composite variables for loaded movements, an algorithm was
developed to enumerate all feasible routes that satisfied the following constraints:
maximum percentage of out-of-route miles allowed (β), maximum local and lane
distances allowed (γ1 and γ2) and maximum number of RPs allowed to be visited. A set
of templates was developed for the enumeration algorithm considering 1, 2 and 3 RPs
visited in a route. Figure 3 shows an example of how a feasible route is determined using
a pre-specified template, where SPij is the shortest path (PtP) distance between nodes i
and j. The main advantage of a composite variable formulation approach is to avoid
incorporating these difficult operational constraints in the mathematical formulation;
however this results in a very large number of composite variables that need to be
generated. For this reason, based on preliminary experimentation with the model, a set of
four templates (i.e., those with 3 RPs) that did not produce composites selected in the
optimal solution were eliminated. Figure 4, shows the final set of templates used to
generate composite variables in this research.
i j
dik≤ϒ1
dkl≤ϒ2
dlj≤ϒ1k l
dij ≤ SPij (1+β)
Figure 3: Example of Composite Variable Generation Using a Template with Two RPs.
Figure 4: Templates Used for Composite Generation.
2 nodes
3 nodes
4 nodes

13
Since reducing the number of templates resulted in a significant reduction in the
number of variables, the implementation of the mathematical model presented in Section
3.1 using the generated subset of composites was equivalent to solving a reduced version
of the complete problem. The resulting reduced model was solved using the optimization
software CPLEX which implements a standard branch-and-cut solution approach to be
able to obtain high quality solutions in reasonable computation times. This approach was
proven to generate solutions within an optimality gap of 1% in [7].
4 Computational Experiments In this section, we present the results of several computational experiments that were
completed to assess the performance of the proposed R-TLRN-MD model and to show
how robust solutions are compared to deterministic solutions obtained with the nominal
model without demand uncertainty.
4.1 Generation of Instances and Selection of Parameter Values
We generated 10 instances of complete networks with 25 and 50 nodes, respectively.
Using a normalized scale, nodes were uniformly distributed in a squared area of 1x1.
Similarly, O-D node pairs with truckload demand were randomly selected to achieve
densities of 10% and 20% with respect to the total number of existing O-D pairs in the
network. As such, 60 and 120 O-D pairs were selected for 25 node networks while 245
and 490 O-D pairs were selected for 50 node networks. In addition, the expected
truckload demand between each O-D pair was randomly generated considering a uniform
distribution between 10 and 20 truckloads.
Three different uncertainty levels were considered in our experiments. We evaluated
cases where 25%, 50% and 100% of all O-D pairs had uncertain truckload demand. For
example, in the case with 60 O-D pairs with truckload demand, the 25% uncertainty level
corresponds to a scenario with 15 O-D pairs with an uncertain amount of demand. A
scenario with zero uncertainty level is equivalent to the deterministic scenario and it is
assumed as the base model for comparisons. Additionally, for the uncertain demand
scenarios, demand was assumed to fluctuate uniformly in symmetric intervals of length
±10%, ±25% and ±100% from the expected value of demand for uncertain O-D pairs.
These interval lengths were used to evaluate different levels of severity of demand
uncertainty. For example, if the expected value of demand for an O-D pair is 20, a ±10% fluctuation results in an interval between 18 and 22.
Other parameters were held constant across all instances solved and include the
limitations on local and lane distances for RN movements, percentage of out-of-route
miles and number of RPs allowed to be visited in a RN route, equipment imbalance
allowed, minimum volume required to open RPs and maximum proportion of PtP loads
as well as fixed RP installation and variable transportation costs. Table 2 shows the
values used for these parameters.

14
Table 2: Fixed Parameter Values Used in Computational Experimentation. Parameter Value
Local distance limitation (distance units) 0.3
Lane distance limitation (distance units) 0.5
Maximum percentage of out-of-route miles allowed 0.25
Number of RPs allowed to be visited 3
Equipment imbalance allowed 0
Minimum volume required to open RPs (as a percentage of total volume) 0.01
Maximum proportion of PtP loads allowed 1
Fixed installation cost of RPs (cost units) 10
Per-mile local transportation cost (cost units) 1
Per-mile lane transportation cost (cost units) 1.3
Per-mile PtP transportation cost (cost units) 1.5
4.2 Results The composite generation algorithm and the R-TLRND-MD model were implemented in
Python 2.7, while solutions for the computational experiments were obtained for both
deterministic and uncertain instances using CPLEX 12.2 on a 2.53 GHz Intel® Core™2
Duo with 4 GB of memory.
The performance measures used to assess the effect of uncertainty in the design of the
network and the performance of the robust model and solution approach were solution
value, number of RPs open, setup time, solution time and total time. Additionally,
instances were characterized considering number of composites, number of additional
variables in uncertain scenarios, number of constraints and number of truckloads. All of
the values presented for these measures in the following tables are averages of ten
instances with some exceptions where noted due to infeasibilities in some of the
uncertain demand scenarios.
Table 3 shows the results obtained for the deterministic case when 25 node networks
with 10% and 20% O-D pair density were considered. The deterministic case represented
a baseline scenario for comparison with respect to the robust solutions obtained for the
uncertain demand scenarios. As shown in Table 3, all measures for 20% O-D pair
density were higher than the ones associated with 10% O-D pair density. Solution value
and number of RPs were affected by the larger O-D pair density given the significant
increase in the number of truckloads that needed to be transported. It is also important to
note that although there was a significant increase in the number of composite variables
and constraints in the case with 20% O-D pair density, solution time remained the same
on average. However, the larger problem instances affected the setup time required to
generate composites and construct the model for CPLEX to solve.

15
Table 3: Results for 25 Node Networks with Deterministic Demand (Baseline Scenario). Number
of O-D
Pairs
Number of
Composites
Number of
Constraints
Number of
Truckloads
Solution
Value
(units)
Number
of RPs
Open
Setup
Time
(sec.)
Solution
Time
(sec.)
Total
Time
(sec.)
60
(10%) 229.50 342.70 889 1005.60 11.90 0.62 0.14 0.76
120
(20%) 470.40 597.30 1749 1813.03 14.90 1.06 0.14 1.20
4.2.1 Demand Uncertainty Effect
Tables 4 and 5 show the results considering demand uncertainty for 25 node networks
with 10% and 20% O-D pair density, respectively. Uncertainty level (i.e., number of O-
D pairs with uncertain demand) and the amount of fluctuation with respect to the
expected value (i.e., demand change) were varied to analyze the impact of these factors
on the performance measures. The percentage or actual differences of these measures
with respect to the baseline scenario are shown in parentheses. It is important to note that
the number of composites under each combination of factors in the uncertain scenarios
did not differ from the deterministic case since the feasibility of routes was not affected
by changes in the quantity of the demand between O-D pairs. For this reason, the number
of composites is not included in Tables 4 and 5. Only the additional variables that were
created from the application of the robust optimization approach explained in Section 3.2
are included instead. Additionally, total solution time was not included in the following
tables as it can be easily obtained by adding together setup and solution time.
Table 4: Results for 25 Node Networks and 10% O-D Pair Density with Uncertain
Demand. Demand
Change
(%)
Uncertain
O-D
Pairs
Add’l
Vars
Number of
Constraints
Number of
Truckloads
Solution
Value
(units)
Number
of RPs
Open
Setup
Time
(sec.)
Solution
Time
(sec.)
Infeasible
Instances
±10
15 48 660.7
(+92.8 %)
918
(+3.3 %)
1127.63
(+12.1 %)
20.5
(+8.6)
0.73
(+17.7 %)
0.16
(+14.3 %) 0
30 93 1083.70
(+216.2%)
946
(+6.4%)
1193.23
(+18.7%)
23.30
(+11.4)
0.87
(+40.3%)
0.10
(-28.6%) 0
60 183 1914.70
(+458.7%)
1004
(+12.9%)
1285.23
(+27.8%)
24.20
(12.3)
1.24
(+100%)
0.16
(+14.3%) 0
±25
15 48 660.70
(+92.8%)
952
(+7.09%)
1187.60
(+18.1%)
20.5
(+8.6)
0.73
(+17.7%)
0.14
(-) 0
30 93 1083.70
(+216.2%)
1014
(+14.1%)
1303.97
(+29.7%)
23.30
(+11.4)
0.83
(+33.9%)
0.12
(-14.3%) 0
60 183 1914.70
(+458.7%)
1137
(+27.9%)
1494.86
(+48.6%)
24.2
(+12.3)
1.21
(+95.2%)
0.15
(+7.1%) 0
±100
15 48 709
(+106.9%)
1116
(+25.5%)
1469.25
(+46.1%)
20.33
(+8.4)
0.78
(+25.8%)
0.11
(-21.4%) 7
30 93 - - - - - - 10
60 183 - - - - - - 10

16
Table 5: Results for 25 Node Networks and 20% O-D Pair Density with Uncertain
Demand.
Demand
Change
(%)
Uncertain
O-D
Pairs
Add’l
Vars
Number of
Constraints
Number of
Truckloads
Solution
Value
(units)
Number
of RPs
Open
Setup
Time
(sec.)
Solution
Time
(sec.)
Infeasible
Instances
±10
30 93 1344.3
(+125.1%)
1808
(+3.4%)
1974.76
(+8.9%)
23.2
(+8.3)
1.30
(+22.6%)
0.18
(+28.6%) 0
60 183 2169.30
(+263.2%)
1865
(+6.6%)
2077.00
(+14.6%)
24.30
(+9.4)
1.70
(+60.4%)
0.19
(+35.7%) 0
120 363 3780.88
(+533%)
1978
(+13.1%)
2303.01
(+27%)
24.62
(+9.7)
2.74
(+158.5%)
0.25
(+78.6%) 2
±25
30 93 1344.30
(+125.1%)
1873
(+7.1%)
2076.93
(+14.6%)
23.20
(+8.3)
1.30
(+22.6%)
0.18
(+28.6%) 0
60 183 2169.30
(+263.2%)
1996
(+14.1%)
2284.93
(+26%)
24.30
(+9.4)
1.69
(+59.4%)
0.17
(+21.4%) 0
120 363 3780.87
(+533%)
2228
(+27.4%)
2702.19
(+49%)
24.62
(+9.7)
2.70
(+154.7%)
0.21
(+50%) 2
±100
30 93 1345.6
(+125.3%)
2201
(+25.8%)
2947.46
(+62.6%)
23
(+8.1)
1.30
(+22.6%)
0.15
(+7.1%) 5
60 183 - - - - - - 10
120 363 - - - - - - 10
As Tables 4 and 5 show, solution value and number of open RPs increased as
compared to the deterministic case in all instances with uncertain demand. Even though
a larger number of RPs were opened as more O-D pairs with uncertain demand were
present, the effect seems to be more significant for the case with lower O-D pair density
(10% or 60 O-D pairs with truckload demand). Interestingly, no difference was observed
for different levels of fluctuation of the demand across instances with the same number of
uncertain O-D pairs. The higher volume of loads in the network for scenarios under
uncertainty can explain the higher number of RPs in these scenarios. Our observations of
the robust network designs showed that nodes that did not meet the minimum volume of
loads required to justify using them as RPs in the deterministic scenario were actually
able to meet that requirement after incorporating uncertainty and allowing a higher load
volume.
As more truckloads were dispatched in uncertain demand instances as compared to
the deterministic case, and more RPs were opened, the solution value for uncertain
instances also increased. Solution values were larger as more uncertain O-D pairs were
present and more fluctuation with respect to the expected demand was considered. The
changes in solution value seem to be the result of more RPs and larger transportation
costs that result from more truckloads being dispatched, especially as larger fluctuations
were considered. However, similar to the number of open RPs, the uncertainty effect on
solution value seems to be more significant for the cases with lower O-D pair density
(10% or 60 O-D pairs with truckload demand). It is important to note that the proportion
of loads that were dispatched PtP remained the same when comparing deterministic and

17
robust solutions. This means that uncertainty doesn’t seem to have a significant effect on
the selection of the dispatching mode that is used to satisfy the demand. Moreover,
another interesting observation from our experiments relates to the distribution of the
shipments between O-D pairs that use the RN. In the deterministic case, almost all O-D
pairs were served using only one feasible route (i.e., composite variable); however in the
cases under uncertainty, shipments were split among several feasible routes from origin
to destination for most O-D pairs served through the RN.
In terms of model performance, solution time increased as the number of O-D pairs
with uncertain demand increased, but no significant difference was observed from one
fluctuation level to another. In general, this can be attributed to a significant increase that
was observed in the number of constraints needed in our proposed model when a higher
level of uncertainty was considered. Although the number of composites was not
affected by incorporating uncertainty, the increase in the number of constraints and
additional variables imposed by the robust optimization approach explain the longer
solution times in scenarios with larger uncertainty, especially in the case with higher O-D
pair density (20% or 120 O-D pairs with truckload demand). Still, the largest average
solution time was under 3 seconds.
Another observation from our computational experiments relates to the
infeasibilities that occurred for instances with more uncertain demand O-D pairs and
larger fluctuations from the expected demand value. The latter factor had a more
significant effect in the case with higher O-D pair density (20% or 120 O-D pairs with
truckload demand). Figure 5 shows how the boundaries of a nominal (i.e., deterministic)
problem fluctuate due to demand uncertainty and form a new feasible region (shown in
grey) that is robust against any realization of the uncertain demand when the robust
optimization approach used in this research is applied. In this case, the objective value
for the robust model is worse than the nominal one as observed in Figure 5. In terms of
our research problem, if we assume a large number of O-D pairs with uncertain demand
(i.e., higher uncertainty level) and a large fluctuation with respect to the expected value, it
might be reasonable to suggest that no feasible region might exist that satisfies all the
constraints in the robust formulation.
Figure 5: Nominal and Robust Boundaries in a Problem with Right-Hand Side
Coefficient Uncertainty.

18
4.2.2 Network Size Effect
In our computational experimentation, we increased the number of nodes in the network
to assess the effect of network size on the robust solutions obtained with our proposed
model and solution approach and compare them to the deterministic case. Table 6 shows
the results for the baseline scenario with no uncertainty. Similar to the 25 node network
results presented in Table 3, reasonable solution times were observed for both 10% and
20% O-D pair density instances.
Table 6: Results for 50 Node Networks with Deterministic Demand.
Number
of O-D
Pairs
Number of
Composites
Number of
Constraints
Number of
Truckloads
Solution
Value
(units)
RPs
Open
Setup
Time
(sec.)
Solution
Time
(sec.)
Total
Time
(sec.)
245
(10%) 2732 1990.40 3594 3036.02 23.7 6.08 0.95 7.03
490
(20%) 6063 4034.30 7133 5467.69 29 12.09 2.18 14.27
Tables 7 and 8 show the results for scenarios with demand uncertainty for 50 node
networks with 10% and 20% O-D pair density, respectively. The percentage or actual
difference from the deterministic case is shown in parentheses.
Table 7: Results for 50 Node Networks and 10% O-D Pair Density with Uncertain
Demand.
Demand
Change
(%)
Uncertain
O-D
Pairs
Add’l
Vars
Number of
Constraints
Number of
Truckloads
Solution
Value
(units)
Number
of RPs
Open
Setup
Time
(sec.)
Solution
Time
(sec.)
Infeasible
Instances
±10
61 186 5087.50
(+155.6%)
3709
(+3.2%)
3327.13
(+9.6%)
48.75
(+25)
7.29
(+19.9%)
0.99
(+4.2%) 2
122 369 8324.80
(+318.2%)
3826
(+6.4%)
3514.06
(+15.7%)
50
(+26.3)
8.70
(+43.1%)
1.19
(+25.3%) 5
245 738 14720.80
(+639.6%)
4059
(+12.9%)
3762.24
(+23.9%)
50
(+26.3)
12.76
(+109.9%)
1.07
(+12.6%) 5
±25
61 186 5087.5
(+155.6%)
3842
(+6.9%)
3480.87
(+14.6%)
48.75
(+25)
7.17
(+17.9%)
0.78
(-17.9%) 2
122 369 8324.80
(+318.2%)
4088
(+13.7%)
3825.07
(+26%)
50
(+26.3)
8.57
(+41%)
0.95
(-) 5
245 738 14692.25
(+638.1%)
4585
(+27.6%)
4420.89
(+45.6%)
50
(+26.3)
12.68
(+108.5%)
1.08
(+13.7%) 6
±100
61 186 5142
(+158.3%)
4486
(+24.8%)
5475.83
(+80.4%)
48.33
(+24.6)
7.37
(+21.2%)
0.79
(-16.8%) 4
122 369 - - - - - - 10
245 738 - - - - - - 10

19
Table 8: Results for 50 Node Networks and 20% O-D Pair Density with Uncertain
Demand.
Demand
Change
(%)
Uncertain
O-D
Pairs
Add’l
Vars
Number of
Constraints
Number of
Truckloads
Solution
Value
(units)
Number
of RPs
Open
Setup
Time
(sec.)
Solution
Time
(sec.)
Infeasible
Instances
±10
122 369 10322
(+155.9%)
7368
(+3.3%)
5854.39
(+7.1%)
49.55
(+20.5)
14.82
(+22.6%)
2.21
(+1.4) 1
245 738 16758.56
(+315.4%)
7604
(+6.6%)
6101.04
(+11.6%)
49.89
(+20.9)
19.38
(+60.3%)
2.36
(+8.3%) 1
490 1473 29523.29
(+631.8%)
8070
(+13.1%)
6504.06
(+18.9%)
50
(+21)
33.35
(+175.8%)
2.78
(+27.5%) 3
±25
122 369 10352.75
(+156.6%)
7627
(+6.9%)
6052.53
(+10.7%)
49.5
(+20.5)
14.89
(+23.1%)
2.48
(13.8%) 2
245 738 16794.37
(+316.3%)
8108
(+13.7%)
6550.62
(+19.8%)
49.875
(+20.9)
19.34
(+60%)
2.08
(-4.6%) 2
490 1473 29523.28
(+631.8%)
9100
(+27.6%)
7544.21
(+38%)
50
(+21)
33.56
(+177.6%)
2.61
(+19.7%) 3
±100
122 369 10341.14
(+156.3)
8931.71
(+25.2)
10442.44
(+91%)
49.57
(+20.6)
14.67
(+21.3%)
1.58
(-27.5%) 3
245 738 - - - - - - 10
490 1473 - - - - - - 10
In general, as shown in Tables 7 and 8, the results obtained for 50 node networks
follow the same trends discussed for the experiments with 25 node networks (Tables 4
and 5). However, it is important to note that for the problems with 50 node networks,
almost all nodes in the network were selected to be open as RPs as soon as uncertainty is
incorporated in the model. This seems to be a result of having more truckloads being
dispatched and having more nodes satisfy the minimum volume required to open RPs.
Also, demand uncertainty seems to affect smaller network instances more than larger
instances in terms of solution value. This might be an indication that as the size of the
network increases, higher levels of demand uncertainty seem to have a reduced marginal
effect on the costs of the system. In addition, although setup times were affected by more
truckloads and additional variables due to the uncertainty associated with more O-D
pairs, solutions were still obtained in less than one minute in average for each instance.
Finally, the main difference between these results and the ones for 25 node networks is
that for the larger network size instances, the fraction of instances that are infeasible
increased.
4.2.3 Fixed RP Installation Cost Effect
Although our computational experiments originally considered a fixed installation cost
for RPs (e.g., 10 cost units per RP), the observed result of a large number of open RPs in
the network for scenarios involving uncertainty led us to investigate the impact of higher
fixed installation costs on the number of RPs. Three scenarios considering 20, 50 and 100

20
cost units for the fixed RP installation cost were solved under all the previous
combinations of factors. The results obtained did not show a significant difference with
respect to the original results with a fixed RP installation cost of 10 cost units, especially
for highly uncertain scenarios. Based on these observations we concluded that the large
amount of loads to be dispatched in uncertain instances somewhat explains opening as
many RPs as possible regardless of their installation cost. This hypothesis merits
additional research as we pursue alternative solution approaches to solve larger instances
of R-TLRND-MD.
5 Conclusions
This paper presents a robust optimization formulation and solution approach for the
Robust Truckload Relay Network Design with Mixed Fleet Dispatching (R-TLRND-
MD) problem. To the best of our knowledge, this is the first paper in which a robust
optimization approach is used to find a solution to the strategic relay network design
problem in TL transportation when demand uncertainty is explicitly considered. The
mathematical model presented in this research applies the Bertsimas and Sim [9] robust
optimization approach to the mathematical formulation presented by Vergara and Root in
[7]. Computational experiments were completed to assess the performance of the model
and solution approach and to develop insights with respect to uncertainty effects on the
cost of the system and the design of the resulting hybrid dispatching networks for TL
transportation that are obtained with this approach.
Since the robust model considers the worst case value of demand for a subset of
uncertain O-D pairs with truckload demand, a significant number of additional loads is
added to the network which results in more traffic at the nodes. As the proportion of
truckloads that are dispatched PtP remains at the same level regardless of the uncertainty
level, more truckloads in the system result in opening more RPs for truckloads that are
dispatched through the RN since more volume flowing through the nodes justifies the
installation of the RPs. Looking at individual instances, it was observed that no RPs
selected in the deterministic case were modified in the robust case, only new ones were
added to the RN. Moreover, demand uncertainty led to splitting RN shipments among
several feasible routes from origin to destination.
Although the number of RPs increases as uncertainty is incorporated, the effect is
more significant as the level of uncertainty increases in terms of more O-D pairs with
uncertain demands and more fluctuation with respect to the expected demand (i.e., cases
with higher conservatism). More RPs and more loads to be dispatched result in higher
solution values as installation and transportation cost increase. However, the effect of
different levels of uncertainty seems to have a more significant effect on instances with
fewer nodes.
The tractability of the robust model indicates the ability of the proposed approach to
obtain solutions that remain feasible against all demand values in a pre-specified interval
of fluctuation in reasonable computation times. However, considering the worst case

21
value of demand affects the feasibility of instances with higher levels of uncertainty. As
discussed in Section 4, the robust approach modifies the solution space of the
optimization problem to ensure hedging against any demand realization. This behavior
of the robust approach makes it more difficult to find a feasible region for the problem.
6 Future Work
Several limitations of the current research can be explored as future work in addition to
other extensions of the TLRND-MD problem that still incorporate the uncertain nature of
the TL industry. First, as relatively small networks are studied in this paper, the
development of efficient heuristic approaches that enable us to solve more realistic
network sizes would be an interesting area of future research. Another research direction
would be to consider other parameters within the TLRND-MD problem to be uncertain
such as installation and transportation costs. Also, exploring other approaches of robust
optimization for both modeling approach and general uncertainty set definition (e.g.,
ellipsoidal uncertainty sets) is another interesting area of study.
Considering that probability distributions can be obtained to represent demand
uncertainty, stochastic optimization is another procedure that can be used to address input
data uncertainty. Implementing stochastic optimization techniques in the TLRND-MD
problem under uncertainty is also another direction of future work.
Finally, it would be interesting to explore the applicability of the approach used in
this research in other contexts where relay networks are designed under an uncertain
environment such as in telecommunications and sensor networks.
References [1] Bureau of Transportation Statistics. “Transportation 2007 commodity flow survey,”
(2010).
[2] Powell, W.B., Marar, A., Gelfand, J., and Bowers, S., “Implementing Real-Time
Optimization Models A Case Application From The Motor Carrier Industry.”
Operations Research 50, 4, 571–581, (2002).
[3] American Trucking Associations. “Trucking activity report,” (2012).
[4] Üster, H. and Maheshwari, N., “Strategic network design for multi-zone truckload
shipments,” IIE Transactions 39, 2, 177–189, (2007).
[5] Üster, H. and Kewcharoenwong, P., “Strategic design and analysis of a relay
network in truckload transportation,” Transportation Science 45, 4, 505–523,
(2011).
[6] Vergara, H.A. and S. Root., “Composite Variable Model for Truckload Relay
Network Design,” University of Arkansas, Fayettville, AR, (2012).
[7] Vergara, H.A. and Root, S., “Mixed fleet dispatching in truckload relay network
design optimization,” Transportation Research Part E: Logistics and
Transportation Review 54, 32–49, (2013).

22
[8] Melton, K.D. and Ingalls, R., “Utilizing Relay Points to Improve the Truckload
Driving Job,” International Journal of Supply Chain Management 1, 3 (2013).
[9] Bertsimas, D. and Sim, M., “Robust discrete optimization and network flows,”
Mathematical Programming 98, 1-3, 49–71, (2003).
[10] Taylor, G.D. and Whicker, G.L., “Optimization and heuristic methods supporting
distributed manufacturing,” Production Planning & Control 13, 6, 517–528, (2002).
[11] Liu, J., Li, C.-L., and Chan, C.-Y., “Mixed truck delivery systems with both hub-
and-spoke and direct shipment,” Transportation Research Part E: Logistics and
Transportation Review 39, 4, 325–339, (2003).
[12] Hunt, G.W. Transportation relay network design. Atlanta, GA: Ph.D. Thesis,
Georgia Institute of Technology (1998).
[13] Ali, T.H., Radhakrishnan, S., Pulat, S., and Gaddipati, N.C., “Relay network design
in freight transportation systems,” Transportation Research Part E: Logistics and
Transportation Review 38, 6, 405–422, (2002).
[14] Tsu, J. and Agarwal, M., “Use of transportation relays to improve private fleet
management,” (2009).
[15] Rosenhead, J., Elton, M., and Gupta, S.K., “Robustness and Optimality as Criteria
for Strategic Decisions,” Operational Research Quarterly (1970-1977) 23, 4, 413,
(1972).
[16] Soyster, A. L. "Convex programming with set-inclusive constraints and applications
to inexact linear programming," Operation Research 21, 5, 1154–1157, (1973).
[17] Gutiérrez, G.J., Kouvelis, P., and Kurawarwala, A.A., “A robustness approach to
uncapacitated network design problems,” European Journal of Operational
Research 94, 2, 362–376, (1996).
[18] Ukkusuri, S.V., Mathew, T.V., and Waller, S.T., “Robust Transportation Network
Design Under Demand Uncertainty,” Computer-Aided Civil and Infrastructure
Engineering 22, 1, 6–18, (2007).
[19] Mudchanatongsuk, S., Ordóñez, F., and Liu, J., “Robust solutions for network
design under transportation cost and demand uncertainty,” Journal of the
Operational Research Society 59, 5, 652–662, (2007).
[20] List, G.F., Wood, B., Nozick, L.K., et al., “Robust optimization for fleet planning
under uncertainty,” Transportation Research Part E: Logistics and Transportation
Review 39, 3, 209–227, (2003).
[21] Erera, A.L., Morales, J.C., and Savelsbergh, M., “Robust Optimization for Empty
Repositioning Problems,” Operations Research 57, 2, 468–483, (2009).