
%XGJHW DW D *ODQFH - USD 230
13
USD 230 - Spring Hill Budget at a Glance 2021-2022 1
Transcript of %XGJHW DW D *ODQFH - USD 230

USD 230 - Spring Hill
Budget at a Glance
2021-2022
1

3
4
5
6
7
8
9
10
11
12
13
Table of Contents
Average Salary…………………………………………………………………………………..
District Reports…………………………………………………………………………………
Total Expenditures by Function (All Funds)………….…………………………….
Summary of Total Expenditures by Function (All Funds)…………………….
Total Expenditures Amount per Pupil by Function (All Funds)…………….
Summary of General and Supplemental General Fund Expenditures…
Instruction Expenses…………………………………………………………………………
Sources of Revenue and Proposed Budget for 2021-2022 ……..….…....…
Enrollment and Low Income Students……………………………………………….
Mill Rates by Fund……………………………………………………………...…………..…
Assessed Valuation and Bonded Indebtedness…………………….……………
Page 2
2021-2022 USD #230
Page 3
2021-2022 USD #230
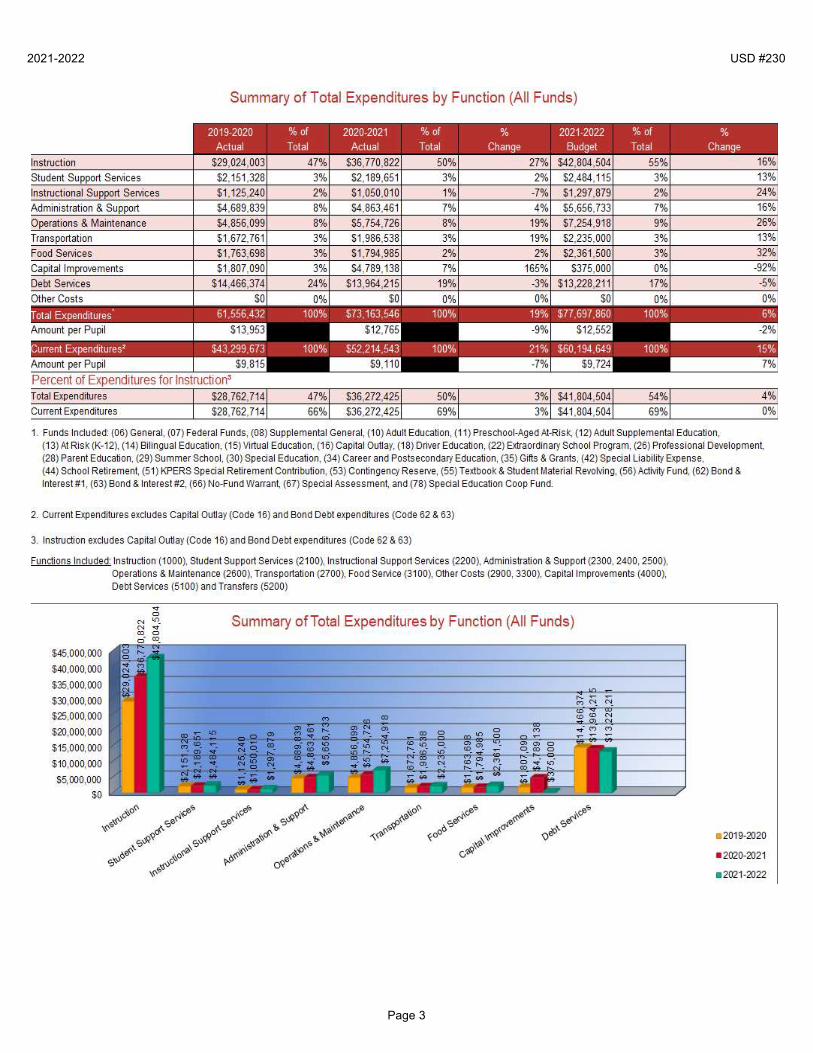
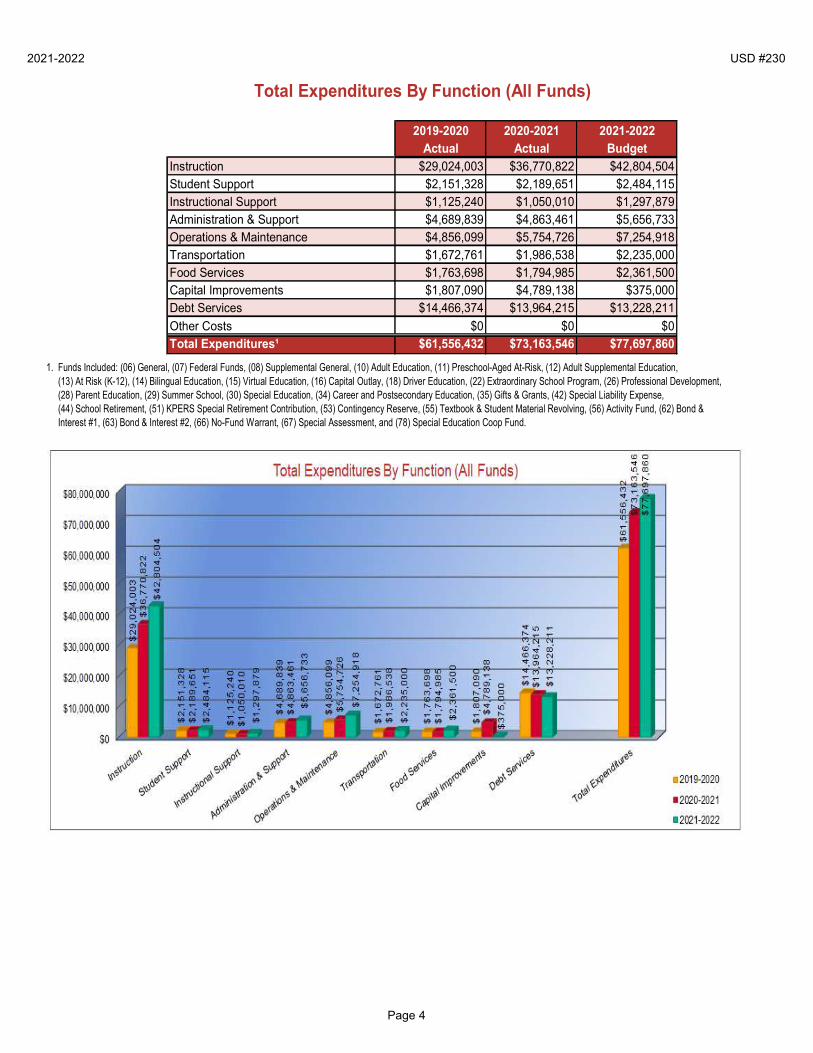
Total Expenditures By Function (All Funds)
2019-2020 2020-2021 2021-2022Actual Actual Budget
Instruction $29,024,003 $36,770,822 $42,804,504Student Support $2,151,328 $2,189,651 $2,484,115Instructional Support $1,125,240 $1,050,010 $1,297,879Administration & Support $4,689,839 $4,863,461 $5,656,733Operations & Maintenance $4,856,099 $5,754,726 $7,254,918Transportation $1,672,761 $1,986,538 $2,235,000Food Services $1,763,698 $1,794,985 $2,361,500Capital Improvements $1,807,090 $4,789,138 $375,000Debt Services $14,466,374 $13,964,215 $13,228,211
Other Costs $0 $0 $0Total Expenditures¹ $61,556,432 $73,163,546 $77,697,860
1. Funds Included: (06) General, (07) Federal Funds, (08) Supplemental General, (10) Adult Education, (11) Preschool-Aged At-Risk, (12) Adult Supplemental Education, (13) At Risk (K-12), (14) Bilingual Education, (15) Virtual Education, (16) Capital Outlay, (18) Driver Education, (22) Extraordinary School Program, (26) Professional Development, (28) Parent Education, (29) Summer School, (30) Special Education, (34) Career and Postsecondary Education, (35) Gifts & Grants, (42) Special Liability Expense, (44) School Retirement, (51) KPERS Special Retirement Contribution, (53) Contingency Reserve, (55) Textbook & Student Material Revolving, (56) Activity Fund, (62) Bond & Interest #1, (63) Bond & Interest #2, (66) No-Fund Warrant, (67) Special Assessment, and (78) Special Education Coop Fund.
Page 4

2021-2022 USD #230
2019-2020 2020-2021 2021-2022Actual Actual Budget
Instruction $6,579 $6,416 $6,915Student Support $488 $382 $401Instructional Support $255 $183 $210Administration & Support $1,063 $849 $914Operations & Maintenance $1,101 $1,004 $1,172Transportation $379 $347 $361Food Services $400 $313 $381Capital Improvements $410 $836 $61Debt Services $3,279 $2,436 $2,137
Other Costs $0 $0 $0Total Expenditures¹ $13,953 $12,765 $12,552
Enrollment (FTE)² 4,411.7 5,731.4 6,190.2
by Function (All Funds)Total Expenditures Amount Per Pupil
1. Funds Included: (06) General, (07) Federal Funds, (08) Supplemental General, (10) Adult Education, (11) Preschool-Aged At-Risk, (12) Adult Supplemental Education, (13) At Risk (K-12), (14) Bilingual Education, (15) Virtual Education, (16) Capital Outlay, (18) Driver Education, (22) Extraordinary School Program, (26) Professional Development, (28) Parent Education, (29) Summer School, (30) Special Education, (34) Career and Postsecondary Education, (35) Gifts & Grants, (42) Special Liability Expense, (44) School Retirement, (51) KPERS Special Retirement Contribution, (53) Contingency Reserve, (55) Textbook & Student Material Revolving, (56) Activity Fund, (62) Bond & Interest #1, (63) Bond & Interest #2, (66) No-Fund Warrant, (67) Special Assessment, and (78) Special Education Coop Fund.
2. FTE enrollment includes 9/20 and 2/20 counts, Preschool-Aged At-Risk (4 year old) and Virtual. Beginning in 2017-2018, full-day Kindergarten is funded as 1.0 FTE.
Page 5

2021-2022 USD #230
Summary of General and Supplemental General FundExpenditures by Function*
% % %2019-2020 of 2020-2021 of % 2021-2022 of
Actual Total Actual Total Change Budget TotalInstruction $12,714,886 57% $13,685,398 56% 8% $15,626,679 57%Student Support $1,152,564 5% $1,195,883 5% 4% $1,273,300 5%Instructional Support $850,000 4% $762,261 3% -10% $863,000 3%Administration & Support $3,536,543 16% $3,586,469 15% 1% $4,083,550 15%Operations & Maintenance $2,722,319 12% $3,494,710 14% 28% $3,824,750 14%Transportation $1,325,158 6% $1,779,462 7% 34% $1,860,000 7%Capital Improvements $0 0% $0 0% 0% $0 0%Other Costs $0 $0 $0 $0 0% $0 0%
Total Expenditures $22,301,470 100% $24,504,183 100% 10% $27,531,279 100%Amount per Pupil $5,055 $4,275 -15% $4,448
9%5%0%0%
12%
Change14%6%
13%14%
%
4%
*The Summary of General and Supplemental General Fund Expenditures by Function comes from pages 6-13 and is the sum of the "General Fund" and "Supplemental General Fund" line items.
Page 6

2021-2022 USD #230
Instruction Expenditures (1000)
2019-2020 % %Actual Change Change
General $9,677,698 -4% 20%Federal Funds $163,201 131% 324%
Supplemental General $3,037,188 44% 2%Preschool-Aged At-Risk $30,368 2% 44%At Risk (K-12) $805,398 21% 41%Bilingual Education $105,211 20% 39%
Virtual Education $6,199,440 94% 6%Capital Outlay $261,289 91% 101%Driver Education $84,274 -66% 183%
Declining Enrollment $0 0% 0%Extraordinary School Program $0 0% 0%Food Service $0 0% 0%Professional Development $0 0% 0%
Parent Education Program $0 0% 0%Summer School $0 0% 0%Special Education $4,892,215 10% 4%Cost of Living $0 0% 0%
Career and Postsecondary Ed. $507,796 3% 17%Gifts & Grants¹ $141,598 -56% 279%Special Liability $0 0% 0%
School Retirement $0 0% 0%Extraordinary Growth Facilities $0 0% 0%Special Reserve $0 0%KPERS Spec. Ret. Contribution $2,519,823 0% 49%
Contingency Reserve $0 0%Text Book & Student Material $196,775 -15%Activity Fund $401,729 -5%Bond and Interest #1 $0 0% 0%
Bond and Interest #2 $0 0% 0%No-Fund Warrant $0 0% 0%Special Assessment $0 0% 0%Temporary Note $0 0% 0%
SUBTOTAL $29,024,003 27% 16%Enrollment (FTE)³ 4,411.7 30% 8%Amount per Pupil² $6,579 -2% 8%
Adult Education $0 0% 0%Adult Supplemental Education $0 0% 0%Special Education Coop $0 0% 0%
TOTAL $29,024,003 27% 16%
$376,476$9,297,903
Actual
$0
$82,025
$0
$1,000,000$12,719,750
$1,375,500$44,500
$4,469,910
$1,595,000$11,156,769
Budget
2021-2022
$12,004,590
$28,948$498,397
$978,143$30,954
$4,387,495
$3,750,000
$0$0
$0$235,000$610,050
$0$5,590,000
$0$0
$0$0$0
$0
$0$0$0
$126,533 $176,000
$0
$0$0
$0$62,001
$521,241
2020-2021
$0$0$0$0
$0
$42,804,504
$0$5,389,222
$0
$36,770,822
$0$0$0
$6,4165,731.4
$36,770,822
$379,823$168,227
$0
$2,520,869$0
$0$0$0$0
$0
$6,9156,190.2
$42,804,504
$0$0
1. Gifts & Grants includes private grants and grants from non-federal sources.2. Amount per pupil excludes the following funds: Adult Education, Adult Supplemental Education, and Special Education Coop.3. FTE enrollment includes 9/20 and 2/20 counts, Preschool-Aged At-Risk (4 year old) and Virtual; excludes KAMS. Beginning in 2017-2018, full-day Kindergarten is funded as 1.0 FTE.
Page 7

2021-2022 USD #230
Sources of Revenue and Proposed Budget for 2021-2022
2021-2022 Estimated Sources of Revenue - 2021-2022 EstimatedAmount July 1, 2021 Local July 1, 2022
Budgeted Cash Balance Interest Transfers Other Cash BalanceGeneral $39,245,119 $0 $39,245,119 $0 $0 $0Supplemental General $8,753,410 $514,713 $5,097,986 $0 $3,140,711Adult Education $0 $0 $0 $0 $0 $0 $0 $0Preschool-Aged At-Risk (4 yr Old) $62,025 $13,654 $0 $0 $50,000 $0 $1,629Adult Supplemental Education $0 $0 $0 $0 $0 $0At Risk (K-12) $0 $80,643 $0 $0 $1,365,000 $0 $66,593Bilingual Education $176,000 $8,998 $0 $0 $170,000 $0 $2,998Virtual Education $12,719,750 $0 $0 $12,719,750 $0 $0Capital Outlay $4,275,000 $421,350 $1,585,825 $0 $0 $0 $2,812,707 $544,882Driver Training $85,025 $52,836 $19,200 $0 $0 $0 $40,000 $27,011Declining Enrollment $0 $0 $0 $0Extraordinary School Program $0 $0 $0 $0 $0 $0 $0Food Service $2,309,100 $574,021 $15,400 $1,637,675 $20,000 $2,500 $241,980 $182,476Professional Development $155,487 $16,981 $0 $0 $0 $150,000 $0 $11,494Parent Education Program $44,815 $9,815 $0 $0 $0 $35,000 $0 $0Summer School $0 $0 $0 $0 $0 $0 $0Special Education $7,427,500 $828,907 $0 $1,122,066 $50,000 $5,400,000 $50,000 $23,473Career and Postsecondary Education $610,050 $69,903 $0 $0 $0 $575,000 $25,000 $59,853Special Liability Expense Fund $135,000 $53,131 $0 $0 $143,299 $61,430Special Reserve Fund $738,454Gifts and Grants $245,000 $146,735 $0 $0 $175,000 $76,735Textbook & Student Materials Revolving $287,429School Retirement $0 $0 $0 $0 $0Extraordinary Growth Facilities $3,750,000 $1,629 $3,750,000 $3,748,371KPERS Special Retirement Contribution $5,344,568 $0 $5,344,568Contingency Reserve $500,419Activity Funds $185,360Bond and Interest #1 $13,228,211 $4,851,665 $5,444,470 $0 $0 $7,725,955 $4,793,879Bond and Interest #2 $0 $0 $0 $0 $0 $0 $0No Fund Warrant $0 $0 $0 $0Special Assessment $375,000 $294,004 $364,026 $283,030Temporary Note $0 $0 $0 $0 $0Coop Special Education $0 $0 $0 $0 $0 $0 $0Federal Funds $1,595,000 -$393,125 $3,045,860 $1,057,735Cost of Living $0 $0 $0 $0SUBTOTAL $100,536,060 $9,257,522 $56,752,568 $5,805,601 $70,000 $24,217,250 $18,467,049 $7,193,218Less Transfers $24,217,250
TOTAL Budget Expenditures $76,318,810
2019-2020 2020-2021 2021-202240,703,575 49,942,524 56,752,568
1,668,798 3,011,715 5,805,60120,674,104 21,466,454 18,537,049
63,046,477 74,420,693 81,095,21814,291 12,985 13,101
Fund
Note: Effective July 1, 2014 (2014-2015 school year) KSA 72-5142 states proceeds from the Ad Valorem taxes levied for the General Fund shall be remitted to the State Treasurer. Such remittance shall be redistributed as State Foundation (General State) Aid.
State Federal
State RevenuesFederal Revenues
Local Revenues¹
Total RevenuesRevenues Per Pupil
1. Excludes "Transfers" to avoid duplication of revenue.
Sources of Revenue
Page 8
2021-2022 USD #230
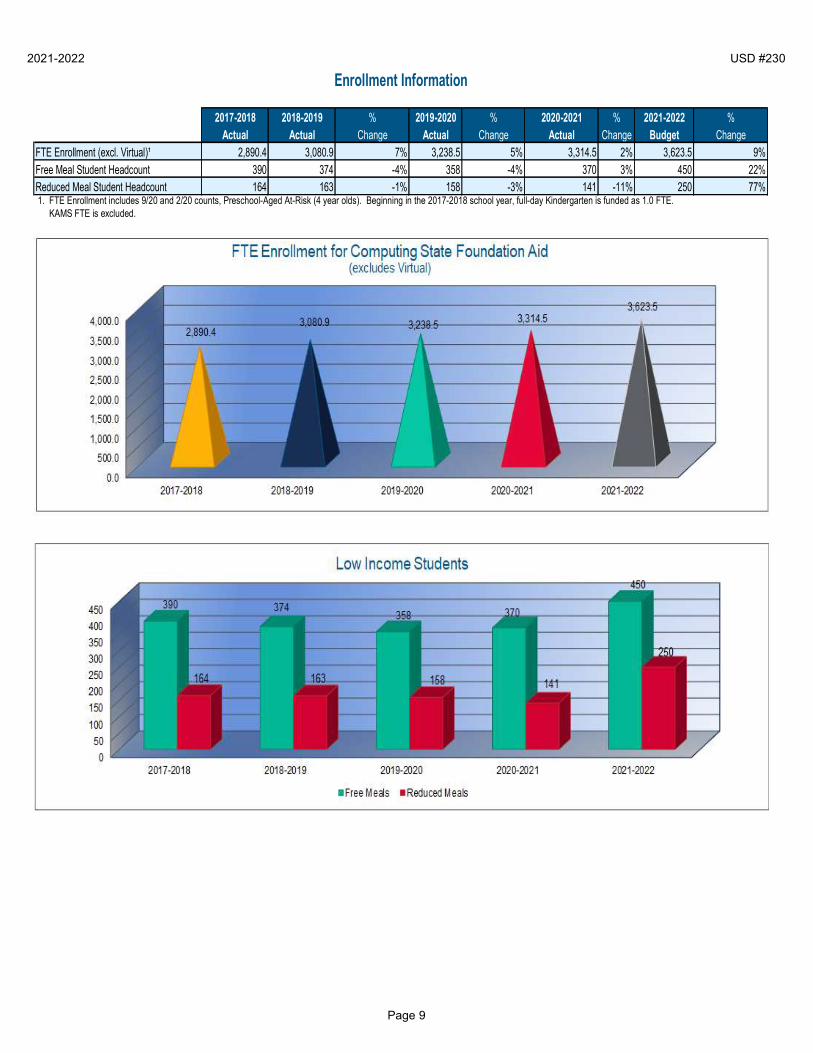
2017-2018 2018-2019 % 2019-2020 % 2020-2021 % 2021-2022 %Actual Actual Change Actual Change Actual Change Budget Change
FTE Enrollment (excl. Virtual)¹ 2,890.4 3,080.9 7% 3,238.5 5% 3,314.5 2% 3,623.5 9%Free Meal Student Headcount 390 374 -4% 358 -4% 370 3% 450 22%Reduced Meal Student Headcount 164 163 -1% 158 -3% 141 -11% 250 77%
Enrollment Information
1. FTE Enrollment includes 9/20 and 2/20 counts, Preschool-Aged At-Risk (4 year olds). Beginning in the 2017-2018 school year, full-day Kindergarten is funded as 1.0 FTE. KAMS FTE is excluded.
Page 9

2021-2022 USD #230
Mill Rates by Fund
2019-2020Actual
General 20.000Supplemental General 9.027Adult Education 0.000Capital Outlay 8.000Declining Enrollment 0.000Cost of Living 0.000Special Liability 0.000School Retirement 0.000Extraordinary Growth Facilities 7.634Bond and Interest #1 23.319Bond and Interest #2 0.000No Fund Warrant 0.000Special Assessment 0.000Temporary Note 0.000
TOTAL USD 67.980Historical Museum 0.000Public Library Board 0.000Public Library Board & Emp Benefits 0.000Recreation Commission 2.902Rec Comm Employee Bnfts 0.150
TOTAL OTHER 3.052
67.719
0.0001.245
3.053
0.4512.6020.0000.0000.000
67.875
0.0000.0000.0000.000
18.7229.8150.0000.0000.000
0.0000.000
18.785
2021-20222020-2021
20.000Budget
20.000Actual
10.0920.0000.4900.0000.0008.0000.0009.107
3.050
0.4502.6000.0000.0000.000
0.0008.0000.000
11.338
Page 10

2021-2022 USD #230
Other Information
2019-2020
ActualAssessed Valuation $277,390,718Total USD Debt $223,315,000 $220,600,000
$335,979,885Budget
2021-2022
$225,185,000$303,457,767
Actual
2020-2021
Page 11

2021-2022 USD #230
FTE Total Salary Average Salary FTE Total Salary Average Salary FTE Total Salary Average SalaryAdministrators (Certified/Non-Certified) 22.9 $2,724,268 $118,964 20.9 $2,646,993 $126,650 22.9 $2,988,575 $130,505Teachers (Full Time) 239.3 $13,798,306 $57,661 253.5 $14,973,508 $59,067 274.5 $16,637,074 $60,609Other Certified (Licensed) Personnel 40.8 $2,493,738 $61,121 41.9 $2,741,445 $65,428 45.3 $3,041,246 $67,136Classified Personnel 170.5 $6,537,393 $38,342 180.6 $6,606,699 $36,582 203.8 $7,753,628 $38,045Substitutes/Temporary Help ~~~~~~ $503,303 ~~~~~~~~~~ ~~~~~~ $415,907 ~~~~~~~~~~ ~~~~~~ $600,000 ~~~~~~~~~~
Salaries
2020-21 Actual 2021-22 Contracted2019-20 Actual
Teachers (Full Time Only):
Other Certified (Licensed) Personnel:
Classified Personnel:
Substitutes/Temporary: **Substitute Teachers, Coaching Assistants and other short term temporary help.Total Salary:
473.5 26,057,008 496.9 27,384,552 546.5 31,020,523
**FTE of 1.0 for Non-Certified Administrators, Classified Personnel and Substitutes/Temporary should be based upon 2,080 hours.***Employee reduction plans include benefits received by employees under a Section 125 Salary Reduction Agreement. Does not include social security, workers' compensation, and unemployment ****Board paid fringe benefits (employer paid) include group life, group health, disability income, accidental death and dismemberment, and hospital surgical, and/or medical expense insurance. Does
*Practical Arts/Vocational Teachers; Special Education Teachers; Prekindergarten Teachers; Kindergarten Teachers; Reading Specialists/Teachers; All Other Teachers.
Part-Time Teachers; Library Media Specialists; School Counselors; Clinical or School Psychologists; Speech Pathologists; Audiologists; Nurses (RN); Social Workers.**Attendance Services Staff; Library Media Aides; Security Officers; Regular Education Teacher Aides; Secretarial/Clerical; Special Education Paraprofessionals; Nurses (LPN); Food Service Workers; Custodians; Bus Drivers.
Report total salary including employee reduction plans***, supplemental, extra pay for summer school, and board paid fringe benefits (employer *FTE for Certified Administrators, Teachers and Other Certified (Licensed) Personnel is defined by the local school board. Generally FTE for teachers with a 9-10 month contract should be reported
Page 12

2021-2022 USD #230
DataCentral.KSDE.org
DataCentral.KSDE.org/Report_Gen.aspx
• Attendance & Enrollment • Building
• Inclement Weather & In-Service Date • Personnel (Certified & Non-Certified)
• Graduate & Dropout • Suspension & Expulsion
• Crime • Transportation
Warehouse Comparitive Performance & Fiscal System (CPFS)• Assessed Valuation Budget Reports by Fund, Function and Object Code.
• Cash Balance
• Headcount Enrollment Budgets
• Mill Levies Budget, At a Glance, Profile, Form 150, and Summary.
• Personnel (Certified & Non-Certified)
• Salary CPA Reports
• Bond
• State Foundation Aid & LOB
• Expenditure School District Funding Report
• Kindergarten Formats
• Meal Pricing
• Expenditure
• Pupil to Teacher Ratio
• Transportation
KSReportCard.KSDE.org/default.aspx
• Attendance Rate • Similar Schools
• IDEA Performance Plan • Grade Range
• Performance Level • Title I status
• School Violence • Website & Contact info
• Assessments (NAEP) • Post-Secondary Progress
- Reading • Dropout and Graduation Rate & Post-Secondary Progress
- Mathematics • Teacher Quality
• Enrollment • Demographic
• ACT Scores
Kansas State Building Report Card
Public School District Reports on KSDE's Data Central
Kansas K-12 Reports
School Finance Reports
Page 13


![6WDWH RI $UL]RQD %XGJHW 5HTXHVW](https://static.fdocuments.us/doc/165x107/62040c13aef71220db78f5c7/6wdwh-ri-ulrqd-xgjhw-5htxhvw.jpg)


