XACTLY CORP - MSCIcorpdocs.msci.com/Annual/ar_2015_317983.pdf · Table of Contents Index to...
182
XACTLY CORP FORM 424B4 (Prospectus filed pursuant to Rule 424(b)(4)) Filed 06/26/15 Address 300 PARK AVENUE, SUITE 1700 SAN JOSE, CA 95110 Telephone (408) 977-3132 CIK 0001322554 Symbol XTLY SIC Code 7372 - Prepackaged Software Fiscal Year 01/31 http://www.edgar-online.com © Copyright 2015, EDGAR Online, Inc. All Rights Reserved. Distribution and use of this document restricted under EDGAR Online, Inc. Terms of Use.
Transcript of XACTLY CORP - MSCIcorpdocs.msci.com/Annual/ar_2015_317983.pdf · Table of Contents Index to...
XACTLY CORP
FORM 424B4(Prospectus filed pursuant to Rule 424(b)(4))
Filed 06/26/15
Address 300 PARK AVENUE, SUITE 1700
SAN JOSE, CA 95110Telephone (408) 977-3132
CIK 0001322554Symbol XTLY
SIC Code 7372 - Prepackaged SoftwareFiscal Year 01/31
http://www.edgar-online.com© Copyright 2015, EDGAR Online, Inc. All Rights Reserved.
Distribution and use of this document restricted under EDGAR Online, Inc. Terms of Use.

Table of Contents
Index to Financial Statements
Filed Pursuant to Rule 424(b)(4) Registration No. 333- 204288
Prospectus
7,037,500 shares
Common stock
This is an initial public offering of shares of common stock of Xactly Corporation. Prior to this offering, there has been no public market for our common stock. We are offering 6,853,500 shares of our common stock. The selling stockholders identified in this prospectus, which includes an executive officer, are offering an additional 184,000 shares of our common stock. We will not receive any of the proceeds from the sale of shares being sold by the selling stockholders.
Our common stock has been approved for listing on the New York Stock Exchange under the symbol “XTLY.”
We are an “emerging growth company” as that term is defined under the federal securities laws and, as such, have elected to comply with certain reduced U.S. public company reporting requirements for this prospectus and future filings.
Investing in our common stock involves a high degre e of risk. See “ Risk factors ” beginning on page 12.
The underwriters have an option for a period of 30 days to purchase up to 1,055,625 additional shares of our common stock from us at the initial public offering price, less underwriting discounts and commissions, solely to cover over-allotments, if any.
Neither the Securities and Exchange Commission nor any other regulatory body has approved or disapprov ed of these securities or passed upon the accuracy or ade quacy of this prospectus. Any representation to the contrary is a criminal offense.
The underwriters expect to deliver the shares of common stock to purchasers on July 1, 2015.
June 25, 2015
Per share Total Initial public offering price $ 8.00 $ 56,300,000 Underwriting discounts and commissions(1) $ 0.56 $ 3,941,000 Proceeds to Xactly, before expenses $ 7.44 $ 50,990,040 Proceeds to the selling stockholders, before expenses $ 7.44 $ 1,368,960
See “Underwriting” for a description of the compensation payable to the underwriters.
J.P. Morgan Deutsche Bank Securities
UBS Investment Bank
Needham & Company Oppenheimer & Co.
(1)

Table of Contents
Index to Financial Statements
DESIGNED TO IMPROVE SALES RESULTS AND EMPLOYEE PERFORMANCE THROUGH INCENTIVES SUBSCRIBER GROWTH 203,000 34% 194,000 34% CAGR GROWTH 151,000 140,000 108,000 As of Jan 31, 2013 Jan 31, 2014 Jan 31, 2015 Apr 30, 2014 Apr 30, 2015 FISCAL YEAR FISCAL Q1 A subscriber is a unique user account purchased by a customer for use by an employee or other customer-authorized user. Note: Subscribers rounded to nearest thousand.

Table of Contents
Index to Financial Statements
AUTOMATE MOTIVATE OPTIMIZE By using Xactly, DocuSign has been able to tailor its compensation plans to optimize outcomes, reduce operational risk and improve internal controls. Carestream is using Xactly to align sales behaviors with strategic goals, offering sales teams visibility into how they are being compensated, and why. Frost Bank uses Xactly to pay its front-line branch sales personnel, commercial lending officers, treasury management officers and private bankers.
Table of Contents
Index to Financial Statements
Table of contents
Through and including July 20, 2015 (the 25th day a fter the date of this prospectus), all dealers effe cting transactions in these securities, whether or not participating in t his offering, may be required to deliver a prospect us. This is in addition to a dealer’s obligation to deliver a prospectus wh en acting as an underwriter and with respect to an unsold allotment or subscription.
Neither we nor the underwriters have authorized anyone to provide any information or to make any representations other than those contained in this prospectus or in any free writing prospectuses we have prepared. We take no responsibility for, and can provide no assurance as to the reliability of, any other information that others may give you. This prospectus is an offer to sell only the shares offered hereby, but only under circumstances and in jurisdictions where it is lawful to do so. The information contained in this prospectus is current only as of its date.
For investors outside the United States (U.S.): Neither we nor any of the underwriters have done anything that would permit this offering or possession or distribution of this prospectus in any jurisdiction where action for that purpose is required, other than in the U.S. Persons outside the U.S. who come into possession of this prospectus must inform themselves about, and observe any restrictions relating to, this offering and the distribution of this prospectus outside of the U.S.
i
Page
Prospectus summary 1
Risk factors 12
Special note regarding forward-looking statements 37
Industry and market data 39
Use of proceeds 40
Dividend policy 40
Capitalization 41
Dilution 43
Selected consolidated financial data 45
Management’s discussion and analysis of financial condition and results of operations 47
Letter from our Chief Executive Officer 75
Business 76
Management 92
Executive compensation 100
Certain relationships, related party and other transactions 113
Principal and selling stockholders 115
Description of capital stock 119
Shares eligible for future sale 124
Material U.S. federal income tax and estate tax consequences to non-U.S. holders 127
Underwriting 131
Legal matters 138
Experts 138
Where you can find more information 138
Index to consolidated financial statements F-1
Table of Contents
Index to Financial Statements
1
Prospectus summary
This summary highlights selected information appearing elsewhere in this prospectus and is qualified in its entirety by the more detailed information and financial statements included elsewhere in this prospectus. This summary may not contain all the information you should consider before investing in our common stock. You should carefully read this prospectus in its entirety before investing in our common stock, including the sections titled “Risk factors” and “Management’s discussion and analysis of financial condition and results of operations” and our consolidated financial statements and related notes included elsewhere in this prospectus. Unless the context otherwise requires, we use the terms “Xactly,” the “Company,” “we,” “us” and “our” in this prospectus to refer to Xactly Corporation and, where appropriate, our consolidated subsidiaries.
Overview
Xactly is a leading provider of enterprise-class, cloud-based, incentive compensation solutions for employee and sales performance management. We address a critical business need: to incentivize employees and align their behaviors with company goals. Our solutions allow organizations to make better strategic decisions, optimize behaviors, increase sales and employee performance, improve margins, increase operational efficiencies, mitigate risk, design better incentive compensation plans and reduce error rates in incentive compensation calculations. We were the first 100% cloud-based, multi-tenant provider focusing solely on the incentive compensation and employee and sales performance management market and we achieved our leadership position through domain expertise and innovative technology. We deliver our solutions through a Software-as-a-Service (SaaS) business model.
We believe that our solutions are strategic for our customers. We go beyond automation by providing our customers with commercially actionable insights so that they can optimize their employees’ behaviors. We believe that we are the first and only company to make commercially available insights derived from an empirical set of aggregated and anonymized data which helps customers make fact-based decisions to motivate employees and drive business performance. Our solutions help executives design, manage and analyze incentive programs and provide visibility into employee and incentive program performance. At the same time, employees use our solutions to monitor, estimate and track their own and their team’s performance in real-time, and modify their behaviors to maximize their payout consistent with company goals.
The design and management of incentive compensation is often highly complex. Traditional systems such as spreadsheets, manual processes and homegrown solutions are inadequate to deal with the complexity associated with variable forms of pay, such as commissions, bonuses and non-cash rewards. According to an August 2014 research study by Aon Hewitt, 91% of organizations currently offer a variable pay program for their broad based employee populations and expect to spend 13% of payroll on variable pay. Further, according to Aon Hewitt, variable pay budgets and spending have nearly doubled in the last 20 years.
We have a diverse and rapidly growing customer base ranging from FORTUNE 50 enterprises to small, emerging companies in a variety of industries such as business & financial services, communications, high-tech manufacturing, life sciences, media & internet and SaaS & traditional software, which provides us with large, unique, industry-specific data sets. Customers use our solutions to manage and incent a broad range of employees, from bank tellers to post office employees to sales people.
We strive to be a thought leader in incentives and employee performance, identifying and interpreting emerging trends, shaping and guiding industry dialogue, and creating and sharing best practices. Our thought leadership is based on our big-data insights as well as our significant industry experience. We deliver our thought leadership
Table of Contents
Index to Financial Statements
2
and innovation through the expertise of our employees as well as the authoring and dissemination of information about incentives that complement and leverage our technology solutions. We believe our thought leadership differentiates us and allows us to increase the value of our solutions to our customers.
We have achieved significant growth. As of January 31, 2015, we had approximately 194,000 subscribers, compared to approximately 140,000 subscribers as of January 31, 2014, representing an increase of approximately 39%. We estimate that during the 2014 calendar year approximately 24% of the payees whose compensation was administered through our solution were in non-sales roles. While approximately 54% of our customers were enterprise and mid-market companies as of January 31, 2015, we derived approximately 91% of our revenue from enterprise and mid-market customers for the fiscal year ended January 31, 2015. As of January 31, 2015, we had approximately 725 customers.
We offer our solutions on a subscription basis, typically through non-cancellable contracts with one to three year terms, which provides us with visibility into a substantial portion of our future revenue. We had total revenue of $36.3 million, $47.2 million and $61.1 million for the fiscal years ended January 31, 2013, 2014 and 2015, respectively, resulting in year-over-year increases of 30% and 29%. Our subscription revenue for the fiscal years ended January 31, 2013, 2014 and 2015 was $27.5 million, $35.9 million and $47.3 million, respectively, resulting in year-over-year increases of 30% and 32%. In addition, for the three months ended April 30, 2014 and 2015, our total revenue was $15.3 million and $17.8 million, respectively, resulting in a period-over-period increase of 17%. Our subscription revenue for the three months ended April 30, 2014 and 2015 was $11.1 million and $13.5 million, respectively, resulting in a period-over-period increase of 22%. We have made and expect to continue to make significant investments to support our growth and our transition to becoming a public company, and accordingly have incurred net losses of $9.4 million, $14.5 million and $18.5 million for the fiscal years ended January 31, 2013, 2014 and 2015, respectively. For the three months ended April 30, 2014 and 2015, our net losses were $3.9 million and $5.0 million, respectively.
Industry background
Market overview and history. To determine variable pay and communicate results, companies have traditionally used spreadsheets or other manual processes that are often error-prone and are not designed for use by mobile users. Spreadsheets, manual processes and homegrown systems tend to provide untimely results with limited visibility, are difficult to understand, and are difficult to integrate with customer relationship management (CRM), configure price quote (CPQ), human capital management (HCM), supply chain management (SCM) and enterprise resource planning (ERP) applications. The incentive compensation programs employed by today’s companies have increased in complexity as management teams seek to implement more innovative variable compensation structures and use incentive compensation plans more broadly across their organizations. The importance and complexity of incentive compensation programs drive a need for sophisticated employee and sales performance management solutions.
Emergence of cloud-based solutions. Over the past decade, cloud-based solutions have emerged, enabling enterprises to improve a range of business and technology operations. In comparison to legacy systems, cloud-based solutions can provide a number of benefits to enterprises, including improved application performance, broader user adoption, simpler integration, greater flexibility and lower costs of ownership. According to IDC, the worldwide SaaS and cloud software market reached $39.3 billion in revenue in 2013, a 22.6% year-over-year growth rate, and will grow to $102.9 billion by 2018, at a compound annual growth rate of 21.3%, compared to an expected compound annual growth rate of 6.3% for the broader software market for the same time period.
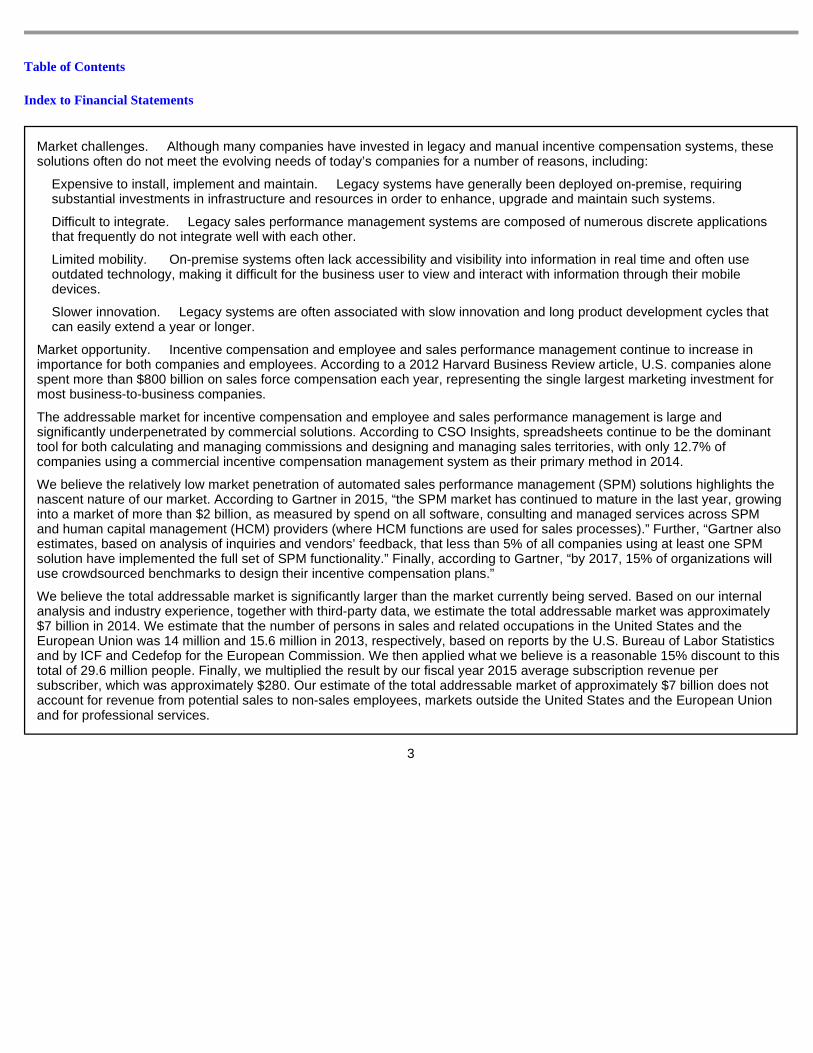
Table of Contents
Index to Financial Statements
3
Market challenges. Although many companies have invested in legacy and manual incentive compensation systems, these solutions often do not meet the evolving needs of today’s companies for a number of reasons, including:
Expensive to install, implement and maintain. Legacy systems have generally been deployed on-premise, requiring substantial investments in infrastructure and resources in order to enhance, upgrade and maintain such systems.
Difficult to integrate. Legacy sales performance management systems are composed of numerous discrete applications that frequently do not integrate well with each other.
Limited mobility. On-premise systems often lack accessibility and visibility into information in real time and often use outdated technology, making it difficult for the business user to view and interact with information through their mobile devices.
Slower innovation. Legacy systems are often associated with slow innovation and long product development cycles that can easily extend a year or longer.
Market opportunity. Incentive compensation and employee and sales performance management continue to increase in importance for both companies and employees. According to a 2012 Harvard Business Review article, U.S. companies alone spent more than $800 billion on sales force compensation each year, representing the single largest marketing investment for most business-to-business companies.
The addressable market for incentive compensation and employee and sales performance management is large and significantly underpenetrated by commercial solutions. According to CSO Insights, spreadsheets continue to be the dominant tool for both calculating and managing commissions and designing and managing sales territories, with only 12.7% of companies using a commercial incentive compensation management system as their primary method in 2014.
We believe the relatively low market penetration of automated sales performance management (SPM) solutions highlights the nascent nature of our market. According to Gartner in 2015, “the SPM market has continued to mature in the last year, growing into a market of more than $2 billion, as measured by spend on all software, consulting and managed services across SPM and human capital management (HCM) providers (where HCM functions are used for sales processes).” Further, “Gartner also estimates, based on analysis of inquiries and vendors’ feedback, that less than 5% of all companies using at least one SPM solution have implemented the full set of SPM functionality.” Finally, according to Gartner, “by 2017, 15% of organizations will use crowdsourced benchmarks to design their incentive compensation plans.”
We believe the total addressable market is significantly larger than the market currently being served. Based on our internal analysis and industry experience, together with third-party data, we estimate the total addressable market was approximately $7 billion in 2014. We estimate that the number of persons in sales and related occupations in the United States and the European Union was 14 million and 15.6 million in 2013, respectively, based on reports by the U.S. Bureau of Labor Statistics and by ICF and Cedefop for the European Commission. We then applied what we believe is a reasonable 15% discount to this total of 29.6 million people. Finally, we multiplied the result by our fiscal year 2015 average subscription revenue per subscriber, which was approximately $280. Our estimate of the total addressable market of approximately $7 billion does not account for revenue from potential sales to non-sales employees, markets outside the United States and the European Union and for professional services.
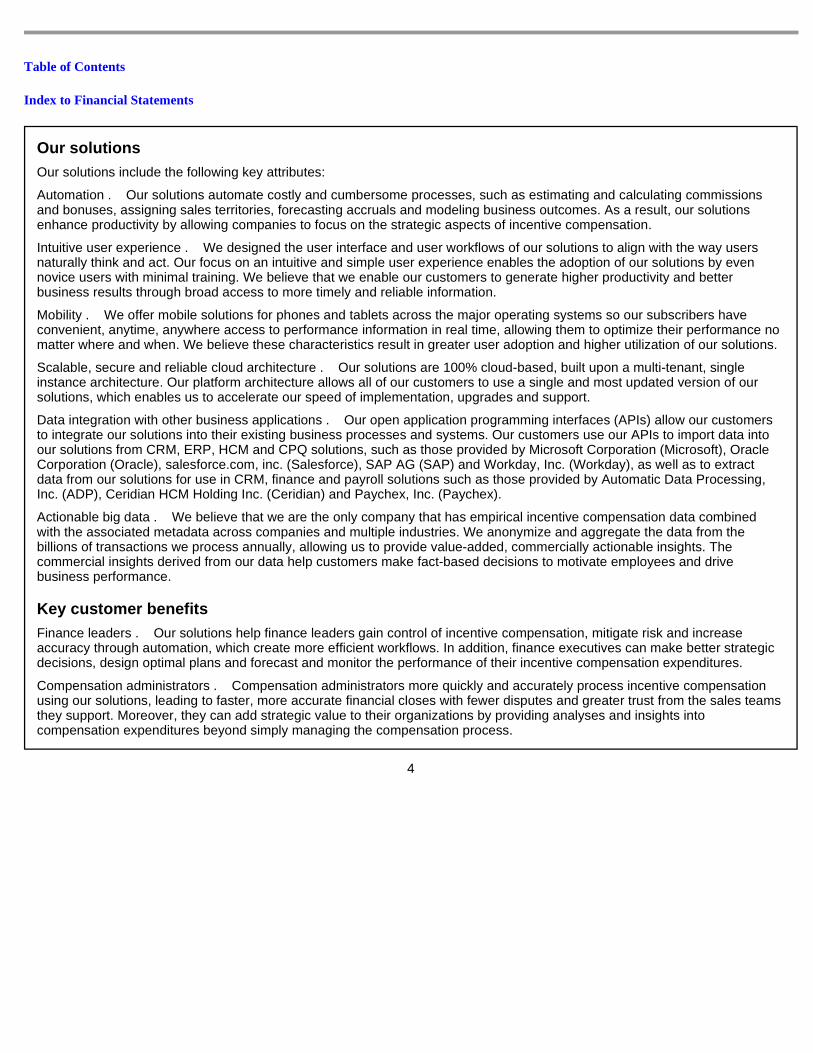
Table of Contents
Index to Financial Statements
4
Our solutions
Our solutions include the following key attributes:
Automation . Our solutions automate costly and cumbersome processes, such as estimating and calculating commissions and bonuses, assigning sales territories, forecasting accruals and modeling business outcomes. As a result, our solutions enhance productivity by allowing companies to focus on the strategic aspects of incentive compensation.
Intuitive user experience . We designed the user interface and user workflows of our solutions to align with the way users naturally think and act. Our focus on an intuitive and simple user experience enables the adoption of our solutions by even novice users with minimal training. We believe that we enable our customers to generate higher productivity and better business results through broad access to more timely and reliable information.
Mobility . We offer mobile solutions for phones and tablets across the major operating systems so our subscribers have convenient, anytime, anywhere access to performance information in real time, allowing them to optimize their performance no matter where and when. We believe these characteristics result in greater user adoption and higher utilization of our solutions.
Scalable, secure and reliable cloud architecture . Our solutions are 100% cloud-based, built upon a multi-tenant, single instance architecture. Our platform architecture allows all of our customers to use a single and most updated version of our solutions, which enables us to accelerate our speed of implementation, upgrades and support.
Data integration with other business applications . Our open application programming interfaces (APIs) allow our customers to integrate our solutions into their existing business processes and systems. Our customers use our APIs to import data into our solutions from CRM, ERP, HCM and CPQ solutions, such as those provided by Microsoft Corporation (Microsoft), Oracle Corporation (Oracle), salesforce.com, inc. (Salesforce), SAP AG (SAP) and Workday, Inc. (Workday), as well as to extract data from our solutions for use in CRM, finance and payroll solutions such as those provided by Automatic Data Processing, Inc. (ADP), Ceridian HCM Holding Inc. (Ceridian) and Paychex, Inc. (Paychex).
Actionable big data . We believe that we are the only company that has empirical incentive compensation data combined with the associated metadata across companies and multiple industries. We anonymize and aggregate the data from the billions of transactions we process annually, allowing us to provide value-added, commercially actionable insights. The commercial insights derived from our data help customers make fact-based decisions to motivate employees and drive business performance.
Key customer benefits
Finance leaders . Our solutions help finance leaders gain control of incentive compensation, mitigate risk and increase accuracy through automation, which create more efficient workflows. In addition, finance executives can make better strategic decisions, design optimal plans and forecast and monitor the performance of their incentive compensation expenditures.
Compensation administrators . Compensation administrators more quickly and accurately process incentive compensation using our solutions, leading to faster, more accurate financial closes with fewer disputes and greater trust from the sales teams they support. Moreover, they can add strategic value to their organizations by providing analyses and insights into compensation expenditures beyond simply managing the compensation process.
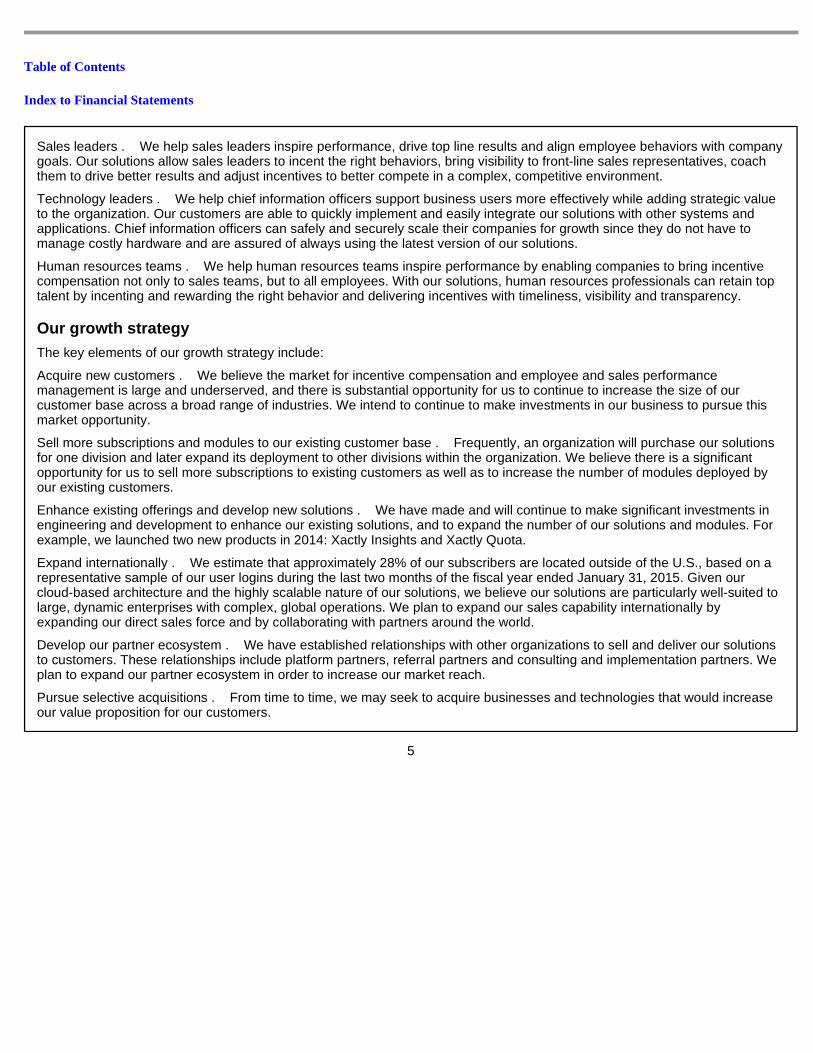
Table of Contents
Index to Financial Statements
5
Sales leaders . We help sales leaders inspire performance, drive top line results and align employee behaviors with company goals. Our solutions allow sales leaders to incent the right behaviors, bring visibility to front-line sales representatives, coach them to drive better results and adjust incentives to better compete in a complex, competitive environment.
Technology leaders . We help chief information officers support business users more effectively while adding strategic value to the organization. Our customers are able to quickly implement and easily integrate our solutions with other systems and applications. Chief information officers can safely and securely scale their companies for growth since they do not have to manage costly hardware and are assured of always using the latest version of our solutions.
Human resources teams . We help human resources teams inspire performance by enabling companies to bring incentive compensation not only to sales teams, but to all employees. With our solutions, human resources professionals can retain top talent by incenting and rewarding the right behavior and delivering incentives with timeliness, visibility and transparency.
Our growth strategy
The key elements of our growth strategy include:
Acquire new customers . We believe the market for incentive compensation and employee and sales performance management is large and underserved, and there is substantial opportunity for us to continue to increase the size of our customer base across a broad range of industries. We intend to continue to make investments in our business to pursue this market opportunity.
Sell more subscriptions and modules to our existing customer base . Frequently, an organization will purchase our solutions for one division and later expand its deployment to other divisions within the organization. We believe there is a significant opportunity for us to sell more subscriptions to existing customers as well as to increase the number of modules deployed by our existing customers.
Enhance existing offerings and develop new solutions . We have made and will continue to make significant investments in engineering and development to enhance our existing solutions, and to expand the number of our solutions and modules. For example, we launched two new products in 2014: Xactly Insights and Xactly Quota.
Expand internationally . We estimate that approximately 28% of our subscribers are located outside of the U.S., based on a representative sample of our user logins during the last two months of the fiscal year ended January 31, 2015. Given our cloud-based architecture and the highly scalable nature of our solutions, we believe our solutions are particularly well-suited to large, dynamic enterprises with complex, global operations. We plan to expand our sales capability internationally by expanding our direct sales force and by collaborating with partners around the world.
Develop our partner ecosystem . We have established relationships with other organizations to sell and deliver our solutions to customers. These relationships include platform partners, referral partners and consulting and implementation partners. We plan to expand our partner ecosystem in order to increase our market reach.
Pursue selective acquisitions . From time to time, we may seek to acquire businesses and technologies that would increase our value proposition for our customers.
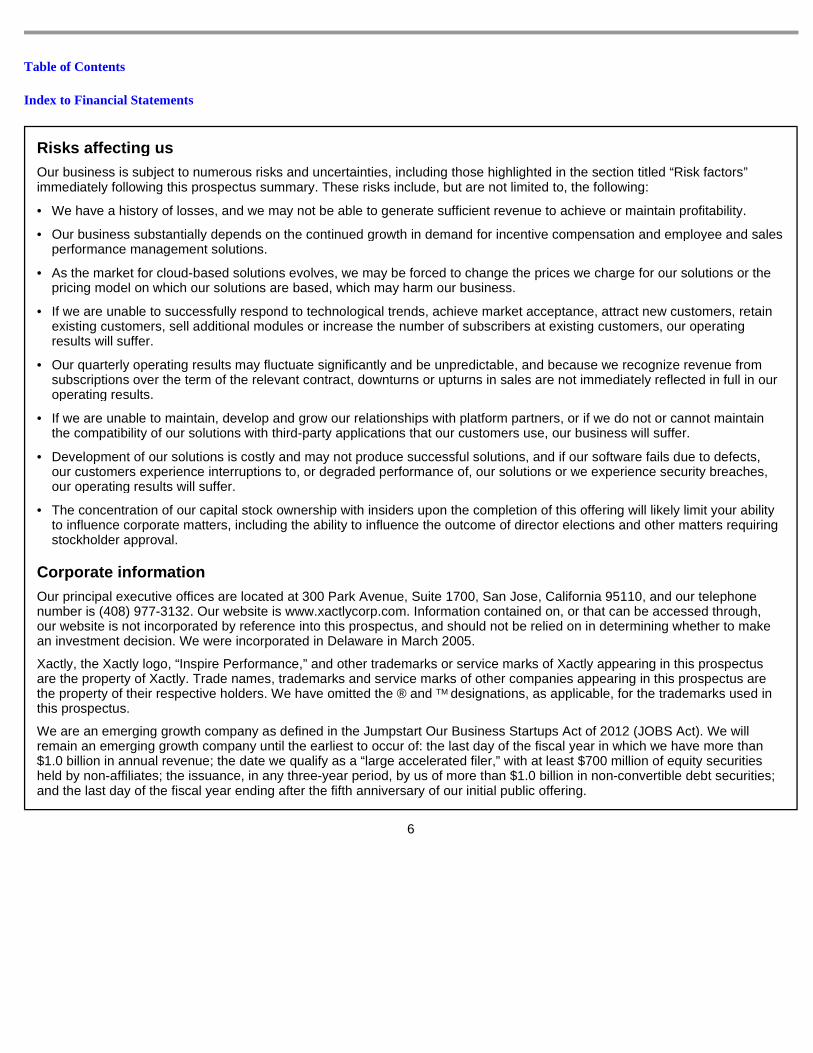
Table of Contents
Index to Financial Statements
6
Risks affecting us
Our business is subject to numerous risks and uncertainties, including those highlighted in the section titled “Risk factors” immediately following this prospectus summary. These risks include, but are not limited to, the following:
Corporate information
Our principal executive offices are located at 300 Park Avenue, Suite 1700, San Jose, California 95110, and our telephone number is (408) 977-3132. Our website is www.xactlycorp.com. Information contained on, or that can be accessed through, our website is not incorporated by reference into this prospectus, and should not be relied on in determining whether to make an investment decision. We were incorporated in Delaware in March 2005.
Xactly, the Xactly logo, “Inspire Performance,” and other trademarks or service marks of Xactly appearing in this prospectus are the property of Xactly. Trade names, trademarks and service marks of other companies appearing in this prospectus are the property of their respective holders. We have omitted the ® and designations, as applicable, for the trademarks used in this prospectus.
We are an emerging growth company as defined in the Jumpstart Our Business Startups Act of 2012 (JOBS Act). We will remain an emerging growth company until the earliest to occur of: the last day of the fiscal year in which we have more than $1.0 billion in annual revenue; the date we qualify as a “large accelerated filer,” with at least $700 million of equity securities held by non-affiliates; the issuance, in any three-year period, by us of more than $1.0 billion in non-convertible debt securities; and the last day of the fiscal year ending after the fifth anniversary of our initial public offering.
• We have a history of losses, and we may not be able to generate sufficient revenue to achieve or maintain profitability.
• Our business substantially depends on the continued growth in demand for incentive compensation and employee and sales performance management solutions.
• As the market for cloud-based solutions evolves, we may be forced to change the prices we charge for our solutions or the pricing model on which our solutions are based, which may harm our business.
• If we are unable to successfully respond to technological trends, achieve market acceptance, attract new customers, retain existing customers, sell additional modules or increase the number of subscribers at existing customers, our operating results will suffer.
• Our quarterly operating results may fluctuate significantly and be unpredictable, and because we recognize revenue from subscriptions over the term of the relevant contract, downturns or upturns in sales are not immediately reflected in full in our operating results.
• If we are unable to maintain, develop and grow our relationships with platform partners, or if we do not or cannot maintain the compatibility of our solutions with third-party applications that our customers use, our business will suffer.
• Development of our solutions is costly and may not produce successful solutions, and if our software fails due to defects, our customers experience interruptions to, or degraded performance of, our solutions or we experience security breaches, our operating results will suffer.
• The concentration of our capital stock ownership with insiders upon the completion of this offering will likely limit your ability to influence corporate matters, including the ability to influence the outcome of director elections and other matters requiring stockholder approval.
TM
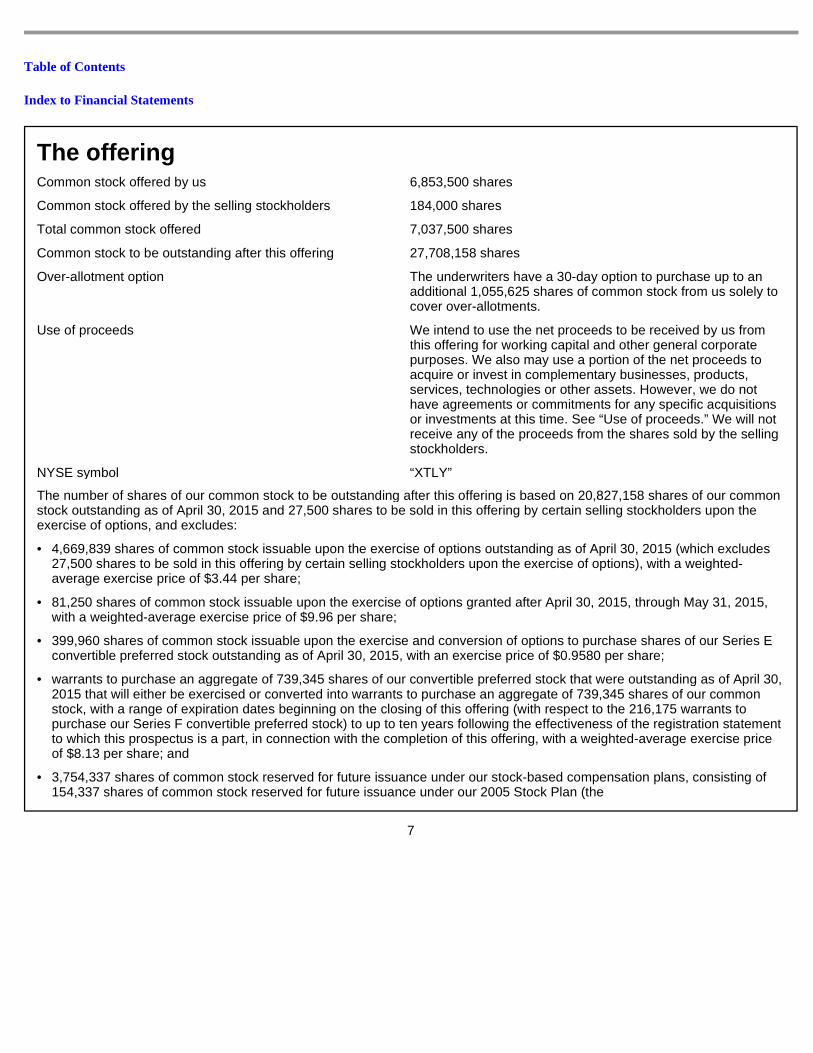
Table of Contents
Index to Financial Statements
7
The offering
The number of shares of our common stock to be outstanding after this offering is based on 20,827,158 shares of our common stock outstanding as of April 30, 2015 and 27,500 shares to be sold in this offering by certain selling stockholders upon the exercise of options, and excludes:
Common stock offered by us 6,853,500 shares
Common stock offered by the selling stockholders 184,000 shares
Total common stock offered 7,037,500 shares
Common stock to be outstanding after this offering 27,708,158 shares
Over-allotment option The underwriters have a 30-day option to purchase up to an additional 1,055,625 shares of common stock from us solely to cover over-allotments.
Use of proceeds We intend to use the net proceeds to be received by us from this offering for working capital and other general corporate purposes. We also may use a portion of the net proceeds to acquire or invest in complementary businesses, products, services, technologies or other assets. However, we do not have agreements or commitments for any specific acquisitions or investments at this time. See “Use of proceeds.” We will not receive any of the proceeds from the shares sold by the selling stockholders.
NYSE symbol “XTLY”
• 4,669,839 shares of common stock issuable upon the exercise of options outstanding as of April 30, 2015 (which excludes 27,500 shares to be sold in this offering by certain selling stockholders upon the exercise of options), with a weighted-average exercise price of $3.44 per share;
• 81,250 shares of common stock issuable upon the exercise of options granted after April 30, 2015, through May 31, 2015, with a weighted-average exercise price of $9.96 per share;
• 399,960 shares of common stock issuable upon the exercise and conversion of options to purchase shares of our Series E convertible preferred stock outstanding as of April 30, 2015, with an exercise price of $0.9580 per share;
• warrants to purchase an aggregate of 739,345 shares of our convertible preferred stock that were outstanding as of April 30, 2015 that will either be exercised or converted into warrants to purchase an aggregate of 739,345 shares of our common stock, with a range of expiration dates beginning on the closing of this offering (with respect to the 216,175 warrants to purchase our Series F convertible preferred stock) to up to ten years following the effectiveness of the registration statement to which this prospectus is a part, in connection with the completion of this offering, with a weighted-average exercise price of $8.13 per share; and
• 3,754,337 shares of common stock reserved for future issuance under our stock-based compensation plans, consisting of 154,337 shares of common stock reserved for future issuance under our 2005 Stock Plan (the
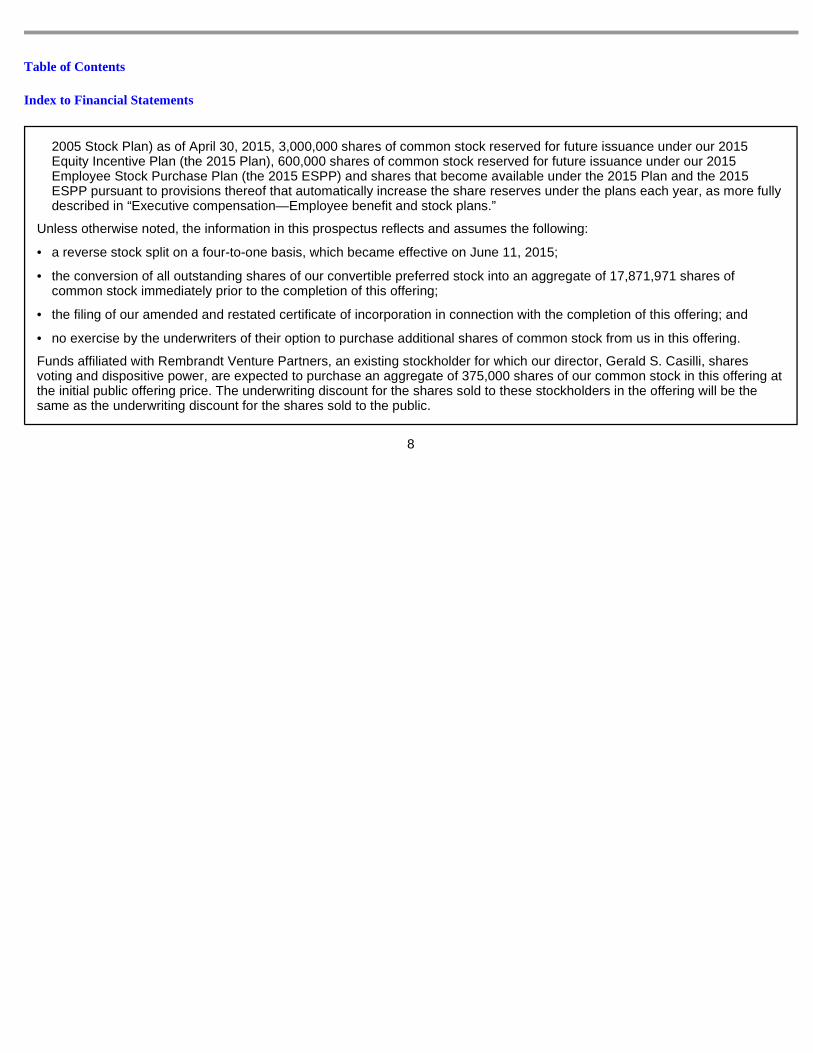
Table of Contents
Index to Financial Statements
8
Unless otherwise noted, the information in this prospectus reflects and assumes the following:
Funds affiliated with Rembrandt Venture Partners, an existing stockholder for which our director, Gerald S. Casilli, shares voting and dispositive power, are expected to purchase an aggregate of 375,000 shares of our common stock in this offering at the initial public offering price. The underwriting discount for the shares sold to these stockholders in the offering will be the same as the underwriting discount for the shares sold to the public.
2005 Stock Plan) as of April 30, 2015, 3,000,000 shares of common stock reserved for future issuance under our 2015 Equity Incentive Plan (the 2015 Plan), 600,000 shares of common stock reserved for future issuance under our 2015 Employee Stock Purchase Plan (the 2015 ESPP) and shares that become available under the 2015 Plan and the 2015 ESPP pursuant to provisions thereof that automatically increase the share reserves under the plans each year, as more fully described in “Executive compensation—Employee benefit and stock plans.”
• a reverse stock split on a four-to-one basis, which became effective on June 11, 2015;
• the conversion of all outstanding shares of our convertible preferred stock into an aggregate of 17,871,971 shares of common stock immediately prior to the completion of this offering;
• the filing of our amended and restated certificate of incorporation in connection with the completion of this offering; and
• no exercise by the underwriters of their option to purchase additional shares of common stock from us in this offering.
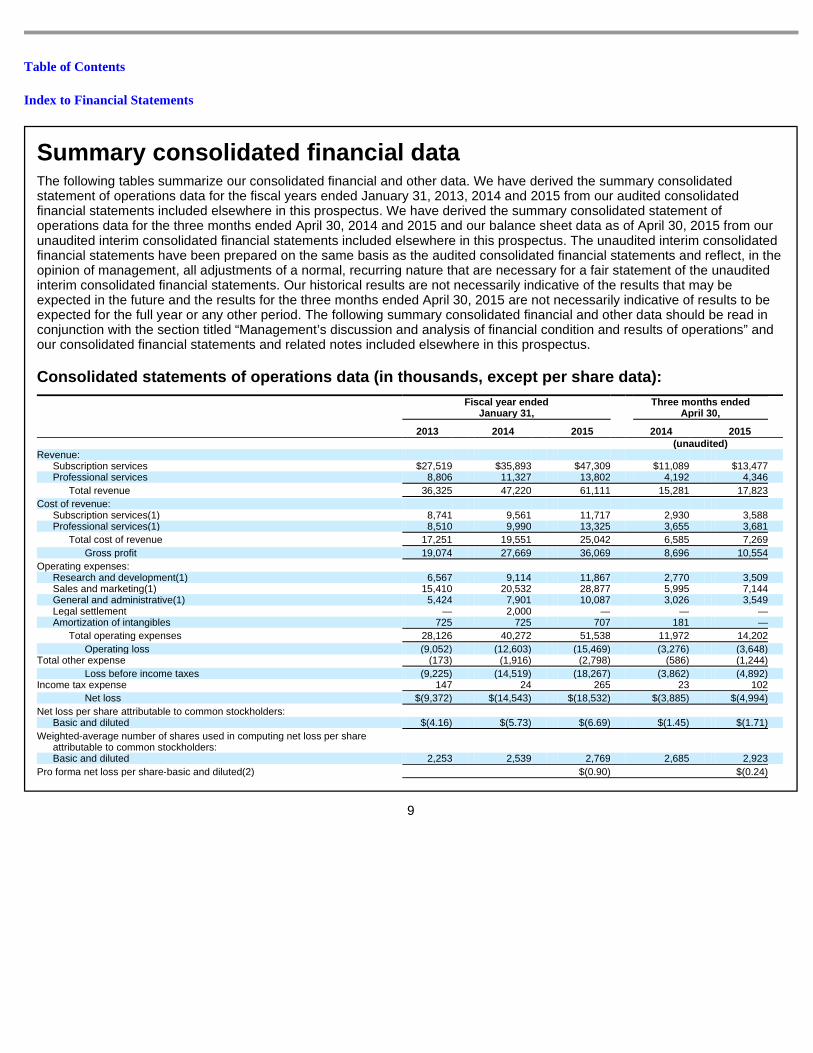
Table of Contents
Index to Financial Statements
9
Summary consolidated financial data
The following tables summarize our consolidated financial and other data. We have derived the summary consolidated statement of operations data for the fiscal years ended January 31, 2013, 2014 and 2015 from our audited consolidated financial statements included elsewhere in this prospectus. We have derived the summary consolidated statement of operations data for the three months ended April 30, 2014 and 2015 and our balance sheet data as of April 30, 2015 from our unaudited interim consolidated financial statements included elsewhere in this prospectus. The unaudited interim consolidated financial statements have been prepared on the same basis as the audited consolidated financial statements and reflect, in the opinion of management, all adjustments of a normal, recurring nature that are necessary for a fair statement of the unaudited interim consolidated financial statements. Our historical results are not necessarily indicative of the results that may be expected in the future and the results for the three months ended April 30, 2015 are not necessarily indicative of results to be expected for the full year or any other period. The following summary consolidated financial and other data should be read in conjunction with the section titled “Management’s discussion and analysis of financial condition and results of operations” and our consolidated financial statements and related notes included elsewhere in this prospectus.
Consolidated statements of operations data (in thou sands, except per share data):
Fiscal year ended
January 31, Three months ended
April 30,
2013 2014 2015 2014 2015 (unaudited) Revenue:
Subscription services $27,519 $35,893 $47,309 $11,089 $13,477 Professional services 8,806 11,327 13,802 4,192 4,346
Total revenue 36,325 47,220 61,111 15,281 17,823
Cost of revenue: Subscription services(1) 8,741 9,561 11,717 2,930 3,588 Professional services(1) 8,510 9,990 13,325 3,655 3,681
Total cost of revenue 17,251 19,551 25,042 6,585 7,269
Gross profit 19,074 27,669 36,069 8,696 10,554
Operating expenses: Research and development(1) 6,567 9,114 11,867 2,770 3,509 Sales and marketing(1) 15,410 20,532 28,877 5,995 7,144 General and administrative(1) 5,424 7,901 10,087 3,026 3,549 Legal settlement — 2,000 — — — Amortization of intangibles 725 725 707 181 —
Total operating expenses 28,126 40,272 51,538 11,972 14,202
Operating loss (9,052) (12,603) (15,469) (3,276) (3,648) Total other expense (173) (1,916) (2,798) (586) (1,244)
Loss before income taxes (9,225) (14,519) (18,267) (3,862) (4,892) Income tax expense 147 24 265 23 102
Net loss $(9,372) $(14,543) $(18,532) $(3,885) $(4,994)
Net loss per share attributable to common stockholders: Basic and diluted $(4.16) $(5.73) $(6.69) $(1.45) $(1.71)
Weighted-average number of shares used in computing net loss per share attributable to common stockholders: Basic and diluted 2,253 2,539 2,769 2,685 2,923
Pro forma net loss per share-basic and diluted(2) $(0.90) $(0.24)
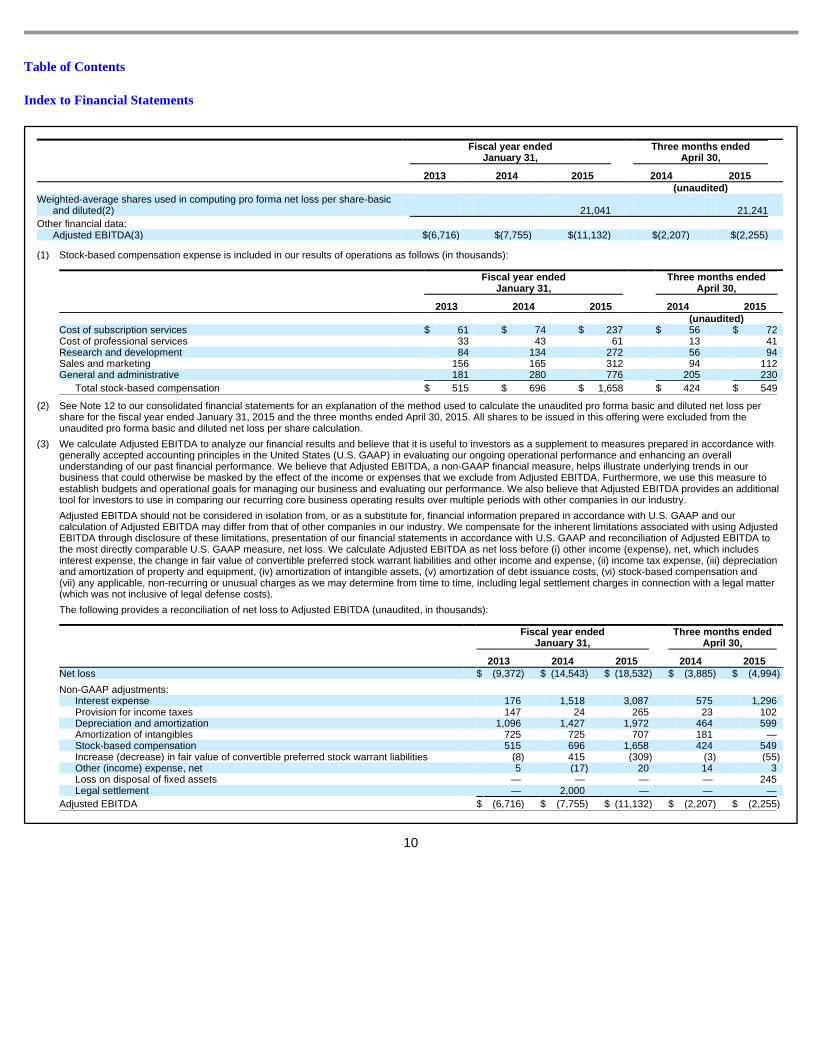
Table of Contents
Index to Financial Statements
10
Fiscal year ended
January 31, Three months ended
April 30,
2013 2014 2015 2014 2015 (unaudited) Weighted-average shares used in computing pro forma net loss per share-basic
and diluted(2) 21,041 21,241
Other financial data: Adjusted EBITDA(3) $(6,716) $(7,755) $(11,132) $(2,207) $(2,255)
(1) Stock-based compensation expense is included in our results of operations as follows (in thousands):
Fiscal year ended
January 31, Three months ended
April 30,
2013 2014 2015 2014 2015 (unaudited) Cost of subscription services $ 61 $ 74 $ 237 $ 56 $ 72 Cost of professional services 33 43 61 13 41 Research and development 84 134 272 56 94 Sales and marketing 156 165 312 94 112 General and administrative 181 280 776 205 230
Total stock-based compensation $ 515 $ 696 $ 1,658 $ 424 $ 549
(2) See Note 12 to our consolidated financial statements for an explanation of the method used to calculate the unaudited pro forma basic and diluted net loss per share for the fiscal year ended January 31, 2015 and the three months ended April 30, 2015. All shares to be issued in this offering were excluded from the unaudited pro forma basic and diluted net loss per share calculation.
(3) We calculate Adjusted EBITDA to analyze our financial results and believe that it is useful to investors as a supplement to measures prepared in accordance with generally accepted accounting principles in the United States (U.S. GAAP) in evaluating our ongoing operational performance and enhancing an overall understanding of our past financial performance. We believe that Adjusted EBITDA, a non-GAAP financial measure, helps illustrate underlying trends in our business that could otherwise be masked by the effect of the income or expenses that we exclude from Adjusted EBITDA. Furthermore, we use this measure to establish budgets and operational goals for managing our business and evaluating our performance. We also believe that Adjusted EBITDA provides an additional tool for investors to use in comparing our recurring core business operating results over multiple periods with other companies in our industry.
Adjusted EBITDA should not be considered in isolation from, or as a substitute for, financial information prepared in accordance with U.S. GAAP and our calculation of Adjusted EBITDA may differ from that of other companies in our industry. We compensate for the inherent limitations associated with using Adjusted EBITDA through disclosure of these limitations, presentation of our financial statements in accordance with U.S. GAAP and reconciliation of Adjusted EBITDA to the most directly comparable U.S. GAAP measure, net loss. We calculate Adjusted EBITDA as net loss before (i) other income (expense), net, which includes interest expense, the change in fair value of convertible preferred stock warrant liabilities and other income and expense, (ii) income tax expense, (iii) depreciation and amortization of property and equipment, (iv) amortization of intangible assets, (v) amortization of debt issuance costs, (vi) stock-based compensation and (vii) any applicable, non-recurring or unusual charges as we may determine from time to time, including legal settlement charges in connection with a legal matter (which was not inclusive of legal defense costs).
The following provides a reconciliation of net loss to Adjusted EBITDA (unaudited, in thousands):
Fiscal year ended
January 31, Three months ended
April 30,
2013 2014 2015 2014 2015 Net loss $ (9,372 ) $ (14,543 ) $ (18,532 ) $ (3,885 ) $ (4,994 )
Non-GAAP adjustments: Interest expense 176 1,518 3,087 575 1,296 Provision for income taxes 147 24 265 23 102 Depreciation and amortization 1,096 1,427 1,972 464 599 Amortization of intangibles 725 725 707 181 — Stock-based compensation 515 696 1,658 424 549 Increase (decrease) in fair value of convertible preferred stock warrant liabilities (8 ) 415 (309 ) (3 ) (55 ) Other (income) expense, net 5 (17 ) 20 14 3 Loss on disposal of fixed assets — — — — 245 Legal settlement — 2,000 — — —
Adjusted EBITDA $ (6,716 ) $ (7,755 ) $ (11,132 ) $ (2,207 ) $ (2,255 )
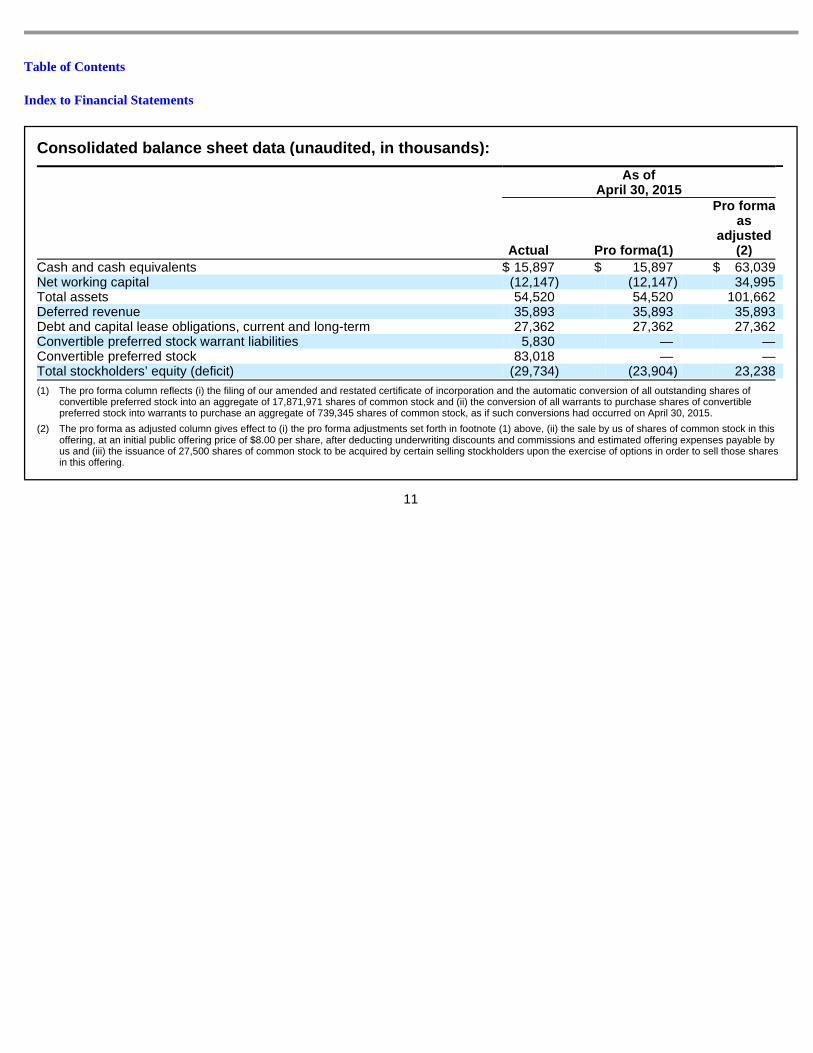
Table of Contents
Index to Financial Statements
11
Consolidated balance sheet data (unaudited, in thou sands):
As of April 30, 2015
Actual Pro forma(1)
Pro forma as
adjusted(2)
Cash and cash equivalents $ 15,897 $ 15,897 $ 63,039 Net working capital (12,147 ) (12,147 ) 34,995 Total assets 54,520 54,520 101,662 Deferred revenue 35,893 35,893 35,893 Debt and capital lease obligations, current and long-term 27,362 27,362 27,362 Convertible preferred stock warrant liabilities 5,830 — — Convertible preferred stock 83,018 — — Total stockholders’ equity (deficit) (29,734 ) (23,904 ) 23,238
(1) The pro forma column reflects (i) the filing of our amended and restated certificate of incorporation and the automatic conversion of all outstanding shares of convertible preferred stock into an aggregate of 17,871,971 shares of common stock and (ii) the conversion of all warrants to purchase shares of convertible preferred stock into warrants to purchase an aggregate of 739,345 shares of common stock, as if such conversions had occurred on April 30, 2015.
(2) The pro forma as adjusted column gives effect to (i) the pro forma adjustments set forth in footnote (1) above, (ii) the sale by us of shares of common stock in this offering, at an initial public offering price of $8.00 per share, after deducting underwriting discounts and commissions and estimated offering expenses payable by us and (iii) the issuance of 27,500 shares of common stock to be acquired by certain selling stockholders upon the exercise of options in order to sell those shares in this offering.
Table of Contents
Index to Financial Statements
Risk factors
Investing in our common stock involves a high degree of risk. You should consider carefully the risks and uncertainties described below, together with all of the other information in this prospectus, including our consolidated financial statements and related notes, before deciding whether to purchase shares of our common stock. If any of the following risks is realized, our business, financial condition, operating results and prospects could be materially and adversely affected. In that event, the price of our common stock could decline and you could lose part or all of your investment.
Risks related to our business
We have a history of losses, and we may not be able to generate sufficient revenue to achieve or maint ain profitability.
We generated net losses of $9.4 million, $14.5 million and $18.5 million for the fiscal years ended January 31, 2013, 2014 and 2015, respectively, and $3.9 million and $5.0 million for the three months ended April 30, 2014 and 2015, respectively. As of April 30, 2015 we had an accumulated deficit of $120.8 million. We will need to generate and sustain increased revenue levels in future periods in order to become and remain profitable. We intend to continue to expend significant funds to expand our marketing and sales operations, develop and enhance our incentive compensation and employee and sales performance management solutions, meet the increased compliance requirements associated with our transition to, and operation as, a public company, scale our professional services capabilities and expand into new markets. Our efforts to grow our business may be more costly than we expect, and we may not be able to increase our revenue enough to offset our higher operating expenses. We may incur significant losses in the future for a number of reasons, including the other risks described in this prospectus, and unforeseen expenses, difficulties, complications and delays and other unknown events. We may not be able to maintain or increase our revenue levels, and we expect to incur losses for the foreseeable future and may not be able to achieve or sustain profitability.
Our business substantially depends on the continued growth in demand for incentive compensation and em ployee and sales performance management solutions.
The market for incentive compensation and employee and sales performance management services and products, is relatively new and evolving. We believe one of our key challenges is to be able to demonstrate the benefit of our solutions and services to prospective customers such that they place purchases of our solutions and services at a higher priority relative to other projects to which they allocate a portion of their budget, including the maintenance or renewal of their existing solutions. Organizations with existing homegrown, manual, spreadsheet or on-premise solutions may be reluctant or unwilling to migrate to a cloud-based solution like ours for a variety of reasons, including the perceived implementation costs and ongoing subscription costs. Our financial performance depends in large part on continued growth in the number of organizations adopting incentive compensation management, employee and sales performance management and other related solutions, and particularly cloud-based solutions, to manage the performance of their sales and non-sales organizations. The market for incentive compensation and employee and sales performance management solutions may not develop as we expect, or at all.
Growth forecasts are subject to significant uncertainty and are based on assumptions and estimates which may not prove to be accurate. Forecasts relating to, among other things, the expected growth in the SaaS and cloud software market or the market for incentive compensation and employee and sales performance management solutions may prove to be inaccurate. Demand for incentive compensation and employee and sales performance management solutions depends substantially on the adoption of variable compensation practices by organizations, and such practices may not be adopted in accordance with our expectations or at all. Even if these markets experience the forecasted growth, we may not grow our business at similar rates, or at all. In any of these cases, our business and operating results will be adversely affected.
12
Table of Contents
Index to Financial Statements
Cloud-based incentive compensation solutions such a s ours represent a relatively recent approach to ad dressing incentive compensation challenges, and we may be fo rced to change the prices we charge for our solutio ns or the pricing model upon which they are based as the market for t hese types of solutions evolves, which may harm our business.
The market for cloud-based solutions to address incentive compensation challenges is still developing. Competitive dynamics may cause pricing levels and pricing models to change, as the market matures and as existing and new market participants introduce new types of solutions and different approaches to enable organizations to address their incentive compensation management needs. As a result, we may be forced to reduce the prices we charge for our solutions or the pricing model on which they are based, and may be unable to renew existing customer agreements or enter into new customer agreements at the same prices and upon the same terms that we have historically, which could have a material adverse effect on our revenue, gross margin and operating results.
We compete in a highly competitive market, and comp etitive pressures from existing and new companies m ay adversely impact our business, revenue, growth rates and mark et share.
The market for incentive compensation solutions for employee and sales performance management is highly competitive and significantly fragmented. With the introduction of new technologies and the potential entry of new competitors into the market, we expect competition to increase and intensify in the future, which could harm our ability to increase sales, maintain or increase renewals and maintain our prices. We compete primarily with companies offering incentive compensation and employee and sales performance management applications via hybrid cloud-based and on-premise solutions. We also compete with spreadsheets, homegrown systems, and toolsets and products developed by software providers that allow customers to build new applications that run on the customers’ current infrastructure or as hosted services. Our competitors include Callidus Software Inc. (Callidus), Cognos (a division of International Business Machines Corporation) (Cognos) and Oracle.
Competition could significantly impede our ability to sell our incentive compensation and employee and sales performance management solutions on terms favorable to us. Our current and potential competitors may develop and market new technologies that render our existing or future solutions less competitive, unmarketable or obsolete. In addition, if these competitors develop products with similar or superior functionality to our solutions, including big data analysis and benchmarking capabilities, streamlined user experiences or real-time mobile accessibility we may need to decrease the prices for our solutions in order to remain competitive. If we are unable to maintain our current pricing due to competitive pressures, our margins will be reduced and our operating results will be negatively affected.
Some of our current competitors have, and future competitors may have, greater financial, technical, marketing and other resources, greater resources to devote to the development, promotion, sale and support of their products and services, more extensive customer bases and broader customer relationships and longer operating histories and greater name recognition. As a result, these competitors may be better able to respond quickly to new technologies and to undertake more extensive marketing campaigns. In a few cases, some competitors may also be able to offer competing solutions at little or no additional cost by bundling them with their existing suite of solutions. In addition, if one or more of our competitors were to merge or partner with another of our competitors, the change in the competitive landscape could adversely affect our ability to compete effectively. If we are unable to compete with such companies, the demand for our incentive compensation and employee and sales performance management solutions could decline substantially.
13
Table of Contents
Index to Financial Statements
We operate in a rapidly evolving market and if we a re unable to introduce new solutions or make enhanc ements to our existing solutions that successfully respond to eme rging technological trends and achieve market accep tance, our growth rates would likely decline and our business, operating results and competitive position could s uffer.
Incentive compensation solutions and cloud-based software markets are generally characterized by:
To keep pace with technological developments, satisfy increasingly sophisticated customer requirements, achieve market acceptance and effectively respond to competition, we must quickly identify emerging trends and requirements, accurately define and design enhancements and improvements for existing solutions and services, and introduce new solutions and services. Accelerated introductions and short product life cycles for solutions and services require high levels of expenditures for research and development that could adversely affect our operating results. In addition, as we expand our business and target new industry verticals, we may be required to develop additional features for our solutions, expand our expertise in certain areas and add sales and support personnel possessing familiarity with relevant industry verticals.
Our growth strategy depends, in part, on our ability to develop and launch new solutions on a timely basis. For example, in 2014, we launched two new products, Xactly Insights and Xactly Quota. If existing and potential customers do not perceive the benefits of these new offerings, a market may not develop or may develop more slowly than we expect, either of which would adversely affect our revenue growth prospects. We also face the risk that customers may not understand or be willing to bear the cost of incorporating these newer solutions into their organizations. In addition, we have limited experience in pricing any new solutions, such as Xactly Insights and Xactly Quota, which could result in underpricing that adversely affects our expected financial performance, or overpricing that inhibits our customers’ acceptance of such new solutions. Even if the initial development and commercial introduction of any new solutions are successful, we cannot assure you that they will achieve widespread market acceptance or that any market acceptance will be sustainable over the longer term.
Moreover, new solutions that we develop may not be introduced in a timely manner. If we are unable to successfully develop or enhance existing solutions, or if we fail to position and price our solutions to meet market demand, our business and operating results will be adversely affected.
If we are unable to attract new customers, our reve nue growth will be adversely affected.
To increase our revenue, we must add new customers, increase the number of subscribers at existing customers and sell additional modules to current customers. As our industry matures or as competitors introduce lower cost and/or differentiated products or services that are perceived to compete with ours, our ability to sell based on pricing, technology and functionality could be impaired. As a result, we may be unable to attract new customers at rates or on terms that would be favorable or comparable to prior periods, which could have an adverse effect on our revenue and growth.
Our sales cycles to our enterprise customers can be long and unpredictable, and our sales efforts requ ire considerable time and expense. As a result, our sales are diffic ult to predict and may vary substantially from peri od to period, which may cause our operating results to fluctuate signif icantly.
Our sales efforts involve educating prospective customers and our existing customers about the use, technical capabilities and benefits of our solutions. In general, the enterprise customers we target may undertake a significant evaluation process before purchasing our solutions. As we continue to pursue enterprise customers,
14
• rapid technological advances; • changing customer needs; and • frequent new product introductions and enhancements.
Table of Contents
Index to Financial Statements
we may face greater costs, longer sales cycles and less predictability in completing such sales. We may spend substantial time, effort and money on our sales efforts without any assurance that our efforts will produce any sales. Events affecting our customers’ businesses may occur during the sales cycle that could affect the size or timing of a purchase, contributing to more unpredictability in our business and operating results.
Our business depends substantially on customers ren ewing their agreements and purchasing additional mo dules from us or adding additional subscribers. Any decline in ou r customer renewals or purchases of additional modu les or subscriptions would harm our future operating resul ts.
In order for us to improve our operating results, it is important that our customers renew their agreements with us when their contract terms expire and also purchase additional solutions and modules and add additional subscribers. Our customers have no obligation to renew their subscriptions after the initial subscription period, and we cannot assure you that customers will renew subscriptions with the same or higher number of modules, if at all. In the past, some of our customers have elected not to renew their agreements with us or have renewed their agreements with a lower number of subscribers or with fewer modules. Our customers’ renewal rates may decline or fluctuate as a result of a number of factors, including their satisfaction or dissatisfaction with our solutions, pricing, the prices of competing products or services, mergers and acquisitions affecting our customer base, reduced hiring by our customers, reductions in our customers’ spending levels or the loss of an executive sponsor at a customer. If our customers do not renew their subscriptions, renew on less favorable terms, fail to purchase additional solutions or modules, or fail to add additional subscriptions, our revenue may decline, and our operating results may be harmed.
Shifts over time in the mix of sizes or types of or ganizations that purchase our solutions or changes in the components of our solutions purchased by our customers could nega tively affect our operating results.
Our strategy is to sell our incentive compensation and employee and sales performance management solutions to organizations of broadly different sizes, from FORTUNE 50 enterprises to small, emerging companies. Our gross margins can vary depending on numerous factors related to the implementation and use of our incentive compensation and sales performance management solutions, including the sophistication and intensity of our customers’ use of our solutions and the level of professional services and support required by a customer. Sales to enterprise customers may entail longer sales cycles and more significant selling efforts, and the prices we charge each customer per subscriber are driven, in part, by subscriber attributes and the number of subscribers for which that customer has contracted, with generally lower prices per subscriber for larger contracts consistent with industry practice. Customer attributes that impact pricing include, in no particular order, frequency of payment by the customer to its employees, complexity of the compensation plans, value of the employee’s compensation, value of the product or service that the employee is selling and the number of payees.
Selling to small, emerging companies may involve smaller contract sizes, higher relative selling costs, greater risk of non-renewal and greater credit risk and uncertainty. If the mix of organizations that purchase our solutions changes, or the mix of solution components purchased by our customers changes, our gross margins could decrease and our operating results could be adversely affected.
Because our long-term growth strategy involves furt her expansion of our sales to customers outside the U.S., our business will be increasingly susceptible to risks associated with international operations.
A component of our growth strategy involves the further expansion of our operations and customer base internationally. For the fiscal year ended January 31, 2015 and for the three months ended April 30, 2015, revenue generated outside of the U.S. was approximately 8% and 7%, respectively, of our total revenue. In addition, a number of our customers are U.S. companies with employees abroad, and we estimate that approximately 28% of our subscribers are located outside of the U.S., based on a representative sample of our user logins during the last two months of the fiscal year ended January 31, 2015. We currently have
15
Table of Contents
Index to Financial Statements
international offices outside of the U.S. in the United Kingdom for sales and marketing and support and India for research and development, support and professional services. In the future, we may expand to other international locations. Our current international operations and future initiatives will involve a variety of risks, including:
Our limited experience in operating our business internationally increases the risk that any potential future expansion efforts that we may undertake will not be successful. If we invest substantial time and resources to expand our international operations and are unable to do so successfully and in a timely manner, our business and operating results will suffer.
Because we recognize revenue from subscriptions ove r the term of the relevant contract, downturns or u pturns in sales are not immediately reflected in full in our operat ing results.
As a subscription-based business, we recognize revenue over the terms of each of our contracts, which are typically from one to three years. As a result, much of the revenue we report each quarter results from contracts entered into during previous quarters. Consequently, a shortfall in demand for our solutions and professional services or a decline in new or renewed contracts in any one quarter may not significantly reduce our revenue for that quarter but could negatively affect our revenue in future quarters. Accordingly, the effect of significant downturns in new sales or renewals of our solutions will not be reflected in full in our operating results until future periods. Our revenue recognition model also makes it difficult for us to rapidly increase our revenue through additional sales in any quarter, as revenue from new customers must be recognized over the applicable term of the contracts.
16
• changes in a specific country’s or region’s political or economic conditions;
• unexpected changes in regulatory requirements, taxes or trade laws;
• more stringent regulations relating to data security and the unauthorized use of, or access to, commercial and personal information, particularly in the European Union (E.U.), including, in certain jurisdictions such as Germany, the requirement to locate our data in data centers in such jurisdiction;
• differing labor regulations, especially in the E.U., where labor laws are generally more advantageous to employees as compared to the U.S., including deemed hourly wage and overtime regulations in these locations;
• challenges inherent in efficiently managing an increased number of employees over large geographic distances, including the need to implement appropriate systems, policies, benefits and compliance programs;
• difficulties in managing a business in new markets with diverse cultures, languages, customs, legal systems, alternative dispute systems and regulatory systems;
• increased travel, real estate, infrastructure and legal compliance costs associated with international operations;
• currency exchange rate fluctuations and the resulting effect on our revenue and expenses, and the cost and risk of entering into hedging transactions if we chose to do so in the future;
• limitations on our ability to reinvest earnings from operations in one country to fund the capital needs of our operations in other countries;
• laws and business practices favoring local competitors or general preferences for local vendors;
• limited or insufficient intellectual property protection;
• political instability or terrorist activities;
• exposure to liabilities under anti-corruption and anti-money laundering laws, including the U.S. Foreign Corrupt Practices Act of 1977 and similar laws and regulations in other jurisdictions; and
• adverse tax burdens and foreign exchange controls that could make it difficult to repatriate earnings and cash.
Table of Contents
Index to Financial Statements
Our quarterly operating results may fluctuate signi ficantly and be unpredictable, which makes our futu re operating results difficult to predict and could cause the trading pr ice of our common stock to decline.
Our quarterly operating results have fluctuated in the past and are expected to fluctuate in the future due to a variety of factors, many of which are outside of our control. As a result, our past results may not be indicative of our future performance, and comparing our operating results on a period-to-period basis may not be meaningful. In addition to the other risks described in this prospectus, factors that may affect our quarterly operating results include the following:
If we are unable to maintain, develop and grow our relationships with platform partners, or if we do n ot or cannot maintain the compatibility of our solutions with third-party applications that our customers use, our business will suffer.
We integrate our solutions with third-party applications and platforms. Our platform partners include Oracle, Salesforce and SAP. Our APIs allow our customers to integrate our solutions into their existing business
17
• changes in spending on incentive compensation or sales performance management solutions by our current or prospective customers;
• pricing of our solutions;
• acquisition of new customers and new subscribers at current customers and the sale of additional modules to current customers;
• customer renewal rates and the number of subscribers and additional modules for which agreements are renewed;
• customer delays in purchasing decisions in anticipation of new products or product enhancements by us or our competitors;
• budgeting cycles of our customers;
• changes in the competitive dynamics of our market, including consolidation among competitors or customers;
• the amount and timing of operating expenses, particularly research and development and marketing and sales expenses (including marketing events and commissions and bonuses associated with performance), and employee benefit expenses;
• the amount and timing of any third-party disputes, litigation or intellectual property threats or litigation;
• the amount and timing of non-cash expenses, including stock-based compensation, goodwill impairments, unusual items and other non-cash charges;
• the amount and timing of costs associated with recruiting and training new employees;
• the amount and timing of cash collections from our customers and the relative mix of quarterly, semi-annual and annual billings;
• the introduction and adoption of our solutions and services in markets outside of the U.S.;
• unforeseen costs and expenses related to the expansion of our business, operations and infrastructure;
• the costs and timing of costs associated with our data center facilities;
• changes in the levels of our capital expenditures;
• foreign currency exchange rate fluctuations; and
• general economic and political conditions in our markets.
Table of Contents
Index to Financial Statements
processes and systems. Our customers use our APIs to import data into our solutions from CRM, ERP, HCM and CPQ solutions, such as those provided by Microsoft Corporation, Workday, Inc. and our platform partners, as well as to extract data from our solutions for use in CRM, finance and payroll solutions. The functionality and popularity of our incentive compensation and employee and sales performance management solutions depends, in part, on our ability to integrate our solutions with these third-party applications and platforms. Any deterioration in our relationship with any third-party applications provider or platform partner would harm our business and adversely affect our operating results.
Our business may be harmed if any platform partner:
In addition, we have benefited from these platform partners’ brand recognition, reputations, referrals and customer bases. Any losses or shifts in the referrals from or the market position of these platform partners in general, in relation to one another or to new competitors or new technologies could lead to losses in our relationships or customers, or our need to identify or transition to alternative channels for marketing our solutions.
Third-party providers of applications may change their APIs or the features of their applications and platforms, restrict our access to their applications and platforms or alter the terms governing use of their applications and APIs and access to those applications and platforms in an adverse manner. Such changes could functionally limit or terminate our ability to use these third-party applications and platforms in conjunction with our solutions, which could negatively impact our offerings and harm our business. If we fail to integrate our solutions with new third-party applications and platforms that our customers use, we may not be able to offer the functionality that our customers need, which would negatively impact our ability to reach our prospective customers and generate revenue and adversely impact our business.
Our development of solutions is costly, and our cur rent development efforts may not produce successful solutions and may achieve delayed, or lower than expected, benefi ts, which could harm our operating results.
In order to remain competitive, we must continue to develop new solutions and modules and enhancements to our existing solutions. Maintaining adequate research and development personnel and resources to meet the demands of the market is essential. If we are unable to develop high-quality solutions for any reason, such as high employee turnover, lack of management ability or a lack of other research and development resources, we may miss market opportunities. Further, our competitors may expend a considerably greater amount of funds on their research and development programs, and those that do not may be acquired by larger companies that could allocate greater resources to our competitors’ research and development programs. Our failure to maintain adequate research and development resources or to compete effectively with the research and development programs of our competitors could materially adversely affect our business.
In addition, because our service is designed to operate on a variety of network hardware and software platforms using a standard browser or our mobile applications, we will need to continuously modify and
18
• discontinues or limits our access to its APIs;
• terminates or does not allow us to renew or replace our contractual relationship;
• modifies its terms of service or other policies, including fees charged to, or other restrictions on, us or other application developers, or changes how customer information or other data may be accessed by us, our customers, or other application developers;
• establishes more favorable relationships with one or more of our competitors, or acquires one or more of our competitors and offers competing services; or
• otherwise develops its own competitive offerings.
Table of Contents
Index to Financial Statements
enhance our service to keep pace with changes in internet-related hardware, software, communication, browser, database and mobile technologies. We may not be successful in either developing these modifications and enhancements or in timely bringing them to market. Furthermore, uncertainties about the timing and nature of new network platforms or technologies, or modifications to existing platforms or technologies, could increase our research and development expenses. Any failure of our service to operate effectively with future network platforms and technologies could reduce the demand for our service, result in customer dissatisfaction and harm our business.
Interruptions to or degraded performance of our sol utions or cloud-based data centers managed by us or third parties could result in customer dissatisfaction, damage to our reputation, loss of customers, limited growth and reduction in revenue.
We currently serve our customers from data centers located in Virginia and California, with most of these data center operations managed by third parties, and some managed by us beginning in April 2015. The continuous availability of our service depends on the operations of those facilities, on a variety of network service providers, on third-party vendors and on our own data center operations staff. In addition, we depend on our operations staff and our third-party facility providers’ ability to protect these facilities against damage or interruption from natural disasters, power or telecommunications failures, criminal acts, cyber-attacks and similar events. If there are any lapses of service or damage to a facility, we could experience lengthy interruptions in our service as well as delays and additional expenses in arranging new facilities and services. Even with current and planned disaster recovery arrangements, which, to date, have not been tested in an actual crisis, our business could be harmed.
We designed our system infrastructure and own, lease or contract through managed service providers the hardware used for our services. Design and mechanical errors, spikes in usage volume and failure to follow operations protocols and procedures could cause interruptions in our service or our systems to fail. Any interruptions or delays in our service, whether as a result of third-party error, our own error, natural disasters, criminal acts, security breaches or other causes, whether accidental or willful, could harm our relationships with customers, harm our reputation and cause our revenue to decrease and/or our expenses to increase. Also, in the event of damage or interruption, our insurance policies may not adequately compensate us for any losses that we may incur. These factors in turn could further reduce our revenue, subject us to liability and cause us to issue credits or cause customers not to renew their subscriptions, any of which could materially adversely affect our business.
We have historically had limited experience managing data center operations ourselves, and we may lack the required expertise to manage these new operations effectively. We may have difficulty recruiting or retaining qualified personnel who can provide such data center management services. Also, the third-party managers of our other data center operations are under no obligation to renew their agreements with us on commercially reasonable terms, or at all. If we are unable to renew these agreements on commercially reasonable terms, we may be required to move to new data centers, and we may incur significant costs and possible service interruptions in connection with such a move.
If our software fails due to defects or similar pro blems, and if we fail to correct any defect or othe r software problems, we could lose customers, become subject to service per formance or warranty claims or incur significant co sts.
Our solutions and the systems infrastructure underlying our platform are inherently complex and may contain material defects or errors. We have from time to time found defects in our solutions and may discover additional defects in the future. We may not be able to detect and correct defects or errors before customers begin to use our solutions. Consequently, we or our customers may discover defects or errors after our
19
Table of Contents
Index to Financial Statements
solutions have been implemented. These defects or errors could also cause inaccuracies in the data we collect, process or produce for our customers, or even the loss, damage or inadvertent release of such confidential or personal data. Any problem in connection with our regularly-scheduled system maintenance may lead to unplanned system downtime. Even if we are able to implement the bug fixes and upgrades in a timely manner, any defects or inaccuracies in the data we collect, process or produce for our customers, or the loss, damage, unauthorized access to or inadvertent release of such confidential or personal data could expose us to substantial liability and cause our reputation to be harmed, could lead to customers electing not to purchase or renew their agreements with us and subject us to service performance credits, warranty claims or increased insurance costs. The costs associated with any material defects, errors or other performance problems in or affecting in our solutions or the systems underlying our platform may be substantial and could materially adversely affect our operating results.
Our efforts to market and sell solutions to small, emerging companies may not be successful which may lead to greater expenses and lower revenue.
Our success depends, in part, on our ability to attract and retain customers that are small, emerging companies, such as those we target with our Xactly Incent Express product. These customers are challenging to reach, acquire and retain in a cost-effective manner. Selling to and retaining these smaller companies can be more difficult than selling to and retaining large enterprise customers because smaller companies generally have high business failure rates, are price-sensitive, are difficult to reach with targeted sales campaigns, have lower renewal rates and generate less revenue. In addition, smaller companies frequently have limited budgets and may choose to spend funds on items other than our solutions. If these organizations experience economic hardship, they may be unwilling or unable to expend resources on technology software and services. If we are unable to market and sell our solutions to these smaller companies with competitive pricing and in a cost-effective manner, our ability to grow our revenue will be harmed.
Our implementation cycles can be long and encounter unforeseen complications with customer integration s of our solutions. Any delay with our implementations could lead to increased costs and dissatisfied customers .
We may face unexpected challenges with some customers or more complicated implementations of our solutions with such customers. It may be difficult or expensive to implement our solutions if a customer has unexpected data, hardware or software technology challenges, or complex or unanticipated business requirements. Any difficulties or delays in the initial implementation could cause customers to delay or forego future purchases of our solutions, in which case our business, operating results and financial condition would be adversely affected.
Our use of distributed product development, support and professional services may prove difficult to m anage to allow us to produce new solutions and services and provide p rofessional services in order to drive growth.
Certain of our engineering services for product development, customer technical support and professional consulting services are performed in remote offices including our subsidiary located in India. Our use of distributed personnel to perform new product and services development, and provide support and professional consulting efforts has required, and will continue to require, detailed technical and logistical coordination. We must ensure that our distributed personnel are aware of and understand development specifications and customer support, implementation and configuration requirements and that they can meet applicable timelines or, if they are not met, that any delays are not significant. We may not be able to maintain acceptable standards of quality in support, product development and professional services. If we are unable to retain or attract personnel in our distributed locations our attempts to drive growth through new solutions and margin improvements in technical support and professional services may be negatively impacted, which would adversely affect our results of operations.
20
Table of Contents
Index to Financial Statements
Weakened U.S. and global economic conditions may ha rm our industry, business and operating results, in cluding as a result of decreasing demand for our solutions by ou r customers.
Our overall performance depends in part on U.S. and worldwide economic conditions, especially as the macroeconomic environment impacts our customers. Key economies have experienced downturns in the past in which economic activity was impacted by falling demand for a variety of goods and services, restricted credit, poor liquidity, reduced corporate profitability, volatility in credit, equity and foreign exchange markets, bankruptcies and overall uncertainty with respect to the economy. These conditions may affect the rate of information technology spending generally and could adversely affect our customers’ ability or willingness to purchase our solutions and professional services, delay prospective customers’ purchasing decisions, reduce the value or duration of their subscription contracts, or affect renewal rates, all of which could adversely affect our operating results. In particular, if any such economic slowdown disproportionately impacts any particular industry verticals of our customers, we may face diminished demand for our solutions or a contraction of subscribers and modules, which would significantly harm our revenue and results of operations.
We may not be able to scale our business quickly en ough to meet our customers’ growing needs and if we are not able to grow efficiently, our operating results could be ha rmed.
As usage of our incentive compensation and employee and sales performance management solutions grows, we will need to devote additional resources to improving our platform architecture, integrating with third-party systems and maintaining infrastructure performance. In addition, we will need to appropriately scale our internal business systems and our customer support and professional services organization to serve our enterprise customers and our growing customer base. We will also need to scale our network of partners, including hiring and contracting with additional third-party service providers, as well as scale our data center capabilities. Any failure of or delay in these efforts could cause impaired system performance and reduced customer satisfaction. These issues could reduce the attractiveness of our solutions to customers, resulting in decreased sales to new customers, lower renewal rates by existing customers, the issuance of service credits or requested refunds, which could impede our revenue growth and harm our reputation. Even if we are able to upgrade our systems and expand our staff, any such expansion will be expensive and could be complex, requiring management time and attention. We could also face inefficiencies or operational failures as a result of our efforts to scale our infrastructure. Moreover, there are inherent risks associated with upgrading, improving and expanding our information technology systems. We cannot be sure that the expansion and improvements to our infrastructure and systems will be fully or effectively implemented on a timely basis, if at all. These efforts may reduce revenue and our margins and adversely affect our operating results.
Failure to effectively develop and expand our marke ting and sales capabilities could harm our ability to increase our customer base and achieve broader market acceptance of our solutions.
Our ability to increase our customer base and achieve broader market acceptance of our incentive compensation and employee and sales performance management solutions will depend to a significant extent on our ability to expand our marketing and sales operations. We plan to continue expanding our sales force and third-party partners, both domestically and internationally. These efforts will require us to invest significant financial and other resources. In addition, the cost to acquire customers is high due to these marketing and sales efforts. Our business will be seriously harmed if our efforts do not generate a correspondingly significant increase in revenue. We may not achieve anticipated revenue growth from expanding our sales force if we are unable to hire, develop and retain talented sales personnel, if our new sales personnel are unable to achieve desired productivity levels in a reasonable period of time or if our sales and marketing programs are not otherwise effective.
21
Table of Contents
Index to Financial Statements
We engage partners to promote, sell, integrate and support our solutions, and we intend to seek expans ion of our international partner network. Any failure to effec tively develop and manage this distribution channel could adversely affect our ability to generate revenue from the sal e of our solutions.
We rely on third-party service providers to provide certain services to us and/or our customers, as well as indirect sales partners to pursue additional channel and agency distribution partnerships. Our future growth in revenue and ability to achieve and sustain profitability depends, in part, on our ability to identify, establish and retain successful third-party service provider relationships, including internationally, which will take significant time and resources and involve significant risk. If any of these third-party service providers stop supporting our solution or if our network of providers does not expand, we will likely have to expand our internal team to meet the needs of our customers, which could increase our operating costs and result in lower margins. To the extent that we are unable to recruit alternative partners, or to expand our internal team, our revenue and operating results would be harmed.
If we fail to maintain our thought leadership posit ion in incentives and employee performance, our bus iness may suffer.
We believe that maintaining our thought leadership position in incentives and employee performance is an important element in attracting new customers. We devote significant resources to developing and maintaining our thought leadership position, with a focus on identifying and interpreting emerging trends in incentive compensation, shaping and guiding industry dialogue, and creating and sharing proposed best practices. Our activities related to developing and maintaining our thought leadership may not yield increased revenue, and even if they do, any increased revenue may not offset the expenses we incur in such effort. We rely upon the continued services of our management and employees with domain expertise in incentives and employee performance, and the loss of any key management or employees in this area could harm our competitive position and reputation. If we fail to successfully grow and maintain our thought leadership position, or incur substantial expenses in our attempts to do so, we may not attract enough new customers or retain our existing customers, and our business could suffer.
We rely on our management team and other key employ ees, and the loss of one or more key employees coul d harm our business.
Our success and future growth depend upon the continued services of our management team, including Christopher Cabrera, our founder and Chief Executive Officer, and other key employees in the areas of research and development, marketing, sales, services and general and administrative functions. From time to time, there may be changes in our management team resulting from the hiring or departure of executives, which could disrupt our business. We also are dependent on the continued service of our existing software engineers and our key sales personnel. We may terminate any employee’s employment at any time, with or without cause, and any employee may resign at any time, with or without cause. In addition, our executive officers and certain other management-level employees benefit from change of control severance agreements in which an involuntary termination by us without cause or a voluntary termination by the employee for good reason within one year after a change of control transaction, will result in acceleration of equity vesting and cash severance payments for the individual, which would increase the cost to us of any such departure. We do not maintain key man life insurance on any of our employees. The loss of one or more of our key employees could harm our business.
The failure to attract and retain additional qualif ied personnel could prevent us from executing our b usiness strategy.
To execute our business strategy, we must attract and retain highly qualified personnel. In particular, we compete with many other companies for software developers with high levels of experience in designing, developing and managing cloud-based software, as well as for skilled sales and operations professionals, and we may not be successful in attracting and retaining the professionals we need. Also, sales compensation
22
Table of Contents
Index to Financial Statements
management experts and enterprise sales professionals are very important to our success and are difficult to replace. We have from time to time in the past experienced, and we expect to continue to experience in the future, difficulty in hiring and retaining highly-skilled employees with appropriate qualifications. In particular, we have experienced a very competitive hiring environment in the San Francisco Bay Area, where we are headquartered. Many of the companies with which we compete for experienced personnel have greater resources than we do. In addition, in making employment decisions, particularly in the software industry, job candidates often consider the value of the stock options or other equity incentives they are to receive in connection with their employment. Following this offering, it may be more difficult to attract new employees, some of whom may prefer to work for a private company with the possibility of a future initial public offering. If the price of our stock declines, or experiences significant volatility, our ability to attract or retain key employees will be adversely affected. If we fail to attract new personnel or fail to retain and motivate our current personnel, our growth prospects could be severely harmed.
If we fail to enhance our brand, our ability to exp and our customer base will be impaired and our fina ncial condition may suffer.
We believe that our development of the Xactly brand is important to achieving awareness of our existing and future incentive compensation and employee and sales performance management solutions, and, as a result, is important to attracting new customers, maintaining existing customers and continuing our relationship with key platform partners. We also believe that the importance of brand recognition will increase as competition in our market increases. Successful promotion of our brand will depend largely on the effectiveness of our marketing efforts and on our ability to provide reliable and useful incentive compensation and employee and sales performance management solutions at competitive prices. In the past, our efforts to build our brand have involved significant expenses. Brand promotion activities may not yield increased revenue, and even if they do, any increased revenue may not offset the expenses we incur in building our brand.
If we fail to forecast our revenue accurately, or i f we fail to match our expenditures with correspond ing revenue, our operating results could be adversely affected.
Because our recent growth has resulted in the expansion of our business, we do not have a long history upon which to base forecasts of future operating revenue. In addition, for our enterprise customers, the lengthy sales cycle for the evaluation and implementation of our solutions, which typically extends for several months, may also cause us to experience a delay between increasing operating expenses for such sales efforts, and, upon successful sales, the generation of corresponding revenue. Accordingly, we may be unable to prepare accurate internal financial forecasts or replace anticipated revenue that we do not receive as a result of delays arising from these factors. As a result, our operating results in future reporting periods may be significantly below the expectations of equity research analysts or investors, which could harm the price of our common stock.
If we fail to offer high-quality professional servi ces and customer support, our business and reputati on would suffer.
High-quality professional services and customer support are important for the successful marketing and sale of our solutions, the renewal of existing customers, the addition of subscribers at existing customers and the sale of additional solutions to existing customers. Providing these professional services requires that our customer support personnel and implementation partners have specific incentive compensation and employee and sales performance management knowledge and expertise, making it more difficult for us to hire qualified personnel and to scale up our support operations due to the extensive training required. The importance of high-quality performance services and customer support will increase as we expand our business and pursue new customers. Also, as we rely more on our implementation partners to deliver our solutions to our customers and provide necessary support, our ability to manage and ensure the successful implementation of our solutions will be further limited. If we or our implementation partners fail to help our customers effectively implement
23
Table of Contents
Index to Financial Statements
our solutions, resolve post-deployment issues and provide ongoing support, our ability to sell additional functionality and professional services to existing customers may suffer and our reputation with existing or potential customers may be harmed.
If we are unable to protect our intellectual proper ty rights, our competitive position, ability to pro tect our proprietary technology and our brand could be harmed or we coul d be required to incur significant expense to enfor ce our rights.
Our success is dependent, in part, upon our proprietary technology and content, including software, databases, confidential information and know-how, the protection of which is crucial to the success of our business. We rely on a combination of patents, copyrights, trademarks, service marks, domain names, trade secret laws and contractual restrictions to establish and protect our proprietary rights in our solutions and services. However, the steps we take to protect our intellectual property may be inadequate. We will not be able to protect our intellectual property if we are unable to enforce our rights or if we do not detect unauthorized use of our intellectual property. Any of our patents, trademarks or other intellectual property rights may be challenged, infringed, misappropriated, or circumvented by others or invalidated through administrative process or litigation. The steps we take to protect our intellectual property may not prevent the misappropriation or misuse of our intellectual property, or deter independent development of similar intellectual property by others. Confidentiality and non-disclosure agreements may not effectively prevent unauthorized use or disclosure of our confidential information, intellectual property or technology and may not provide an adequate remedy in the event of unauthorized use or disclosure of our confidential information, intellectual property or technology. Some aspects of our business and services also rely on technologies, software and content developed by or licensed from third parties, and we may not be able to maintain our relationships with such third parties or enter into similar relationships in the future on reasonable terms or at all.
While we have three U.S. patent applications pending, those applications and any patent applications that we may file in the future may not result in issued patents, and we may be unable to obtain protection for the covered technology. In addition, any patents issued in the future or other intellectual property may not provide us with competitive advantages, or may be successfully challenged or invalidated by third parties through administrative process or litigation. Effective trademark, trade secret, patent, copyright and domain name protection is expensive to develop and maintain, both in terms of initial and ongoing registration requirements and the costs of defending our rights. Furthermore, legal standards relating to the validity, enforceability and scope of protection of intellectual property rights are uncertain. Additional uncertainty may result from changes to intellectual property legislation enacted in the U.S. and elsewhere, and from interpretations of intellectual property laws by applicable courts and agencies. Despite our precautions, it may be possible for unauthorized third parties to copy our solutions or to use information that we regard as proprietary to create products and services that compete with ours. Some license provisions protecting against unauthorized use, copying, transfer and disclosure of our solutions may be unenforceable under the laws of certain jurisdictions. In addition, the laws of some countries do not protect proprietary and intellectual property rights to the same extent as the laws of the U.S., and mechanisms for enforcement of intellectual property rights may be inadequate. To the extent we expand our international activities, our exposure to unauthorized copying and use of our solutions and proprietary information may increase. We may be required to spend significant resources to monitor and protect our intellectual property rights. We may in the future initiate claims or litigation against third parties for infringement of our proprietary rights or to establish the validity of our proprietary rights, including as counterclaims to any intellectual property litigation. Litigation is inherently uncertain, and any litigation, whether as a plaintiff or defendant and whether or not it is resolved in our favor, could result in significant expense to us and the invalidation or narrowing of the scope of our intellectual property and could divert the efforts of our technical and management personnel.
24
Table of Contents
Index to Financial Statements
We have been and may in the future be sued by third parties for various claims including alleged infri ngement of proprietary rights.
We have been and may in the future be involved in various legal matters arising from our business activities. Such future actions may include claims, suits, government investigations and other proceedings alleging that we, our customers, our licensees, or parties indemnified by us have infringed, misappropriated, or otherwise violated the intellectual property rights or other rights of third parties, or have violated commercial, corporate and securities, labor and employment, wage and hour, and other laws and regulations. For example, we may be subject to claims that we are infringing the patent, trademark or copyright rights of third parties, or that our employees have misappropriated or divulged their former employers’ trade secrets or confidential information.
The cloud-based and business-to-business software and internet industries are characterized by the existence of a large number of patents, trademarks and copyrights and by frequent litigation based on allegations of infringement or other violations of intellectual property rights. For example, we settled intellectual property and related litigation with one of our competitors in 2013. We have received, and in the future may receive, communications from third parties, including practicing entities and non-practicing entities, claiming that we have infringed, misappropriated or otherwise violated their proprietary rights or intellectual property.
We and our customers or partners may in the future be sued by third parties for alleged infringement of their claimed proprietary rights. Our technologies may be subject to injunction if they are found to infringe the rights of a third party or we may be required to pay damages, or both. Many of our agreements with customers and partners require us to indemnify them for third-party intellectual property infringement claims, which would increase the cost to us of an adverse ruling on such a claim.
The outcome of any claims or litigation, regardless of the merits, is inherently uncertain. Any claims and lawsuits, and the disposition of such claims and lawsuits, whether through settlement or licensing discussions, or litigation, could be time-consuming and expensive to resolve, divert management attention from executing our business plan, result in efforts to enjoin our activities, lead to attempts on the part of other parties to pursue similar claims, adversely affect our relationships with our current or future customers and partners, cause delays or stoppages in providing our services, necessitate incurring significant legal fees and, in the case of intellectual property claims, require us to change our technology, change our business practices and/or pay monetary damages or enter into short- or long-term royalty or licensing agreements. Some claimants may have substantially greater resources, including larger patent portfolios, than we do and may be able to sustain the costs of complex intellectual property litigation to a greater degree and for longer periods of time than we could. In addition, patent holding companies that focus on extracting royalties and settlements by enforcing patent rights may target us. Liability for monetary damages against us may be tripled and may include attorneys’ fees, or, in some circumstances, damages against our customers and partners, and we may be prohibited from developing, commercializing or continuing to provide some or all of our services unless we obtain licenses from, and pay royalties to, the holders of the patents or other intellectual property rights, which may not be available on commercially favorable terms, or at all.
Any adverse determination related to intellectual property claims or other litigation could prevent us from offering our services to others, could be material to our financial condition or cash flows, or both, or could otherwise adversely affect our operating results. In addition, depending on the nature and timing of any such dispute, an unfavorable resolution of a legal matter could materially affect our future results of operation or cash flows or both.
In addition, our exposure to risks associated with various claims, including the use of intellectual property, may be increased as a result of acquisitions of other companies, or as we expand the complexity, scope and public profile of our business. For example, we may have a lower level of visibility into the development process with
25
Table of Contents
Index to Financial Statements
respect to intellectual property or the care taken to safeguard against infringement risks with respect to the acquired company or technology. In addition, third parties may make infringement and similar or related claims after we have acquired technology that had not been asserted prior to our acquisition.
We use open source software in our solutions, which could subject us to litigation or other actions.
We use open source software in our platform and we intend to continue to use open source software in the future. From time to time, there have been claims challenging the ownership of open source software against companies that incorporate open source software into their products or alleging that these companies have violated the terms of an open source license. As a result, we could be subject to lawsuits by parties claiming ownership of what we believe to be open source software or alleging that we have violated the terms of an open source license. Litigation could be costly for us to defend, have a negative effect on our operating results and financial condition or require us to devote additional research and development resources to change our solutions. In addition, if we were to combine our proprietary software solutions with open source software in certain manners, we could, under certain open source licenses, be required to publicly release the source code of our proprietary software solutions. If we inappropriately use open source software, we may be required to re-engineer our solutions, discontinue the sale of our solutions, release the source code of our proprietary software to the public at no cost or take other remedial actions. Although we have taken steps to control our use of open source software, many open source licenses have not been interpreted by courts, and we cannot be certain that our processes for controlling our use of open source software in our products have been or will be effective. There is a risk that open source licenses could be construed in a way that could impose unanticipated conditions or restrictions on our ability to commercialize our solutions, which could adversely affect our business, operating results and financial condition.
If our security measures or those of our customers are compromised or unauthorized access to customer data is otherwise obtained, our solutions may be perceived as not being secure, customers may curtail or cease their use of our solutions, our reputation may be harmed and we may incur significant liabilities.
Our operations involve the storage and transmission of customer data, including, in some cases, personally identifiable information, and any unauthorized access to, loss of or unauthorized disclosure of this information, as a result of a security incident, employee, customer or partner error, malfeasance, stolen or fraudulently obtained log-in credentials or otherwise could result in litigation, substantial liability, regulatory investigations or fines, indemnity obligations and other possible liabilities, as well as negative publicity, any of which could damage our reputation, impair our sales and harm our business. Cyber-attacks and other malicious internet-based activity continue to increase generally, and cloud-based platform providers have been targeted. In addition, if the security measures of any of our customers or platform partners are compromised, even without any actual compromise of our own systems, we may face substantial liability or negative publicity or reputational harm if our customers, platform partners or anyone else incorrectly attributes the blame for such security breaches to us or our systems. We may be unable to anticipate or prevent techniques used to obtain unauthorized access to or to sabotage our systems because they change frequently and generally are not detected until after an incident has occurred. As we increase our customer base and our brand becomes more widely known and recognized, we may become more of a target for third parties seeking to compromise our security systems or gain unauthorized access to our customers’ data.
Many governments have enacted laws requiring companies to notify individuals of data security incidents involving certain types of personal data. In addition, some of our customers contractually require notification of any data security compromise. Security compromises experienced by our competitors, by our platform partners, by our customers or by us may lead to public disclosures, which may lead to widespread negative publicity. Any security compromise in our industry, whether actual or perceived, could harm our reputation, erode customer confidence in the effectiveness of our security measures, negatively impact our ability to
26
Table of Contents
Index to Financial Statements
attract new customers, cause existing customers to elect not to renew their subscriptions or subject us to third-party lawsuits, regulatory fines or other action or liability, which could materially and adversely affect our business and operating results.
The limitations of liability provisions in our cont racts and our insurance coverage may not be enforce able or adequate.
There can be no assurance that any limitations of liability provisions in our contracts would be enforceable or adequate or would otherwise protect us from any liabilities or damages with respect to any particular claim, including any intellectual property claims, claims relating to a data security breach, or other claims for which we must indemnify our customers or partners. We also cannot be sure that our existing general liability insurance coverage and coverage for errors or omissions will continue to be available on acceptable terms or will be available in sufficient amounts to cover one or more large claims, or that the insurer will not deny coverage as to any future claim. The successful assertion of one or more large claims against us that exceed available insurance coverage or the occurrence of changes in our insurance policies, including premium increases or the imposition of large deductible or co-insurance requirements, could have a material adverse effect on our business, financial condition and operating results.
Data usage limitations, privacy and data protection concerns, evolving regulation of the internet, cro ss-border data transfers and other domestic or foreign regulations may limit the use and adoption of our solutions an d adversely affect our business.
Our customers can use our solutions to store contact and other personal or identifying information regarding some of their employees. As internet commerce continues to evolve, increasing regulation by federal, state or foreign governments and agencies becomes more likely. For example, increased regulation is occurring in the areas of data privacy and data protection, both in the U.S. and internationally, and privacy- and data security-related regulatory obligations are evolving. New and modified laws and regulations applying to the solicitation, collection, processing, use and security of personal information could affect our or our customers’ ability to use data, potentially reducing demand for our solutions, imposing greater compliance burdens on us or our customers and restricting our ability to store, process and share data with our customers.
We use our customers’ data in an aggregated and anonymized format for our solutions. Privacy and data protection-related concerns may cause our customers’ employees or contacts to resist providing the personal data necessary to allow our customers to use our solutions effectively. Even the perception of privacy concerns, whether or not valid, may inhibit market adoption of our solutions in certain industries and in certain countries.
We may be subject to future foreign regulation requiring data collected or used within such foreign jurisdiction to reside there. Foreign data privacy laws and regulations, such as the E.U.’s Data Protection Directive, and the country-specific laws and regulations that implement the directive, also govern the processing of personally identifiable data, and may be stricter than U.S. laws. The E.U. currently is considering adoption of a General Data Protection Regulation, to supersede the Data Protection Directive, which may cause E.U. data privacy laws to be more stringent and to provide for greater penalties for noncompliance. The E.U. has indicated that it will recommend suspension of the U.S. / E.U. Safe Harbor Framework, under which we are permitted to transfer personal data regarding E.U. data subjects to the U.S., as part of the General Data Protection Regulation. If restrictions are adopted by the E.U. that prohibit the transfer of our data regarding E.U. data subjects to the U.S., we may have to create duplicative, and potentially expensive, information technology infrastructure and business operations in Europe, which may hinder our expansion plans in Europe or render such plans commercially infeasible. The costs of compliance with, and other burdens imposed by, such laws and regulations that are applicable to us or to the businesses of our customers may be substantial and may limit the use and adoption of our solutions and reduce overall demand, may require us to change our business practices
27
Table of Contents
Index to Financial Statements
in a manner that could compromise our ability to effectively pursue our growth strategy, or may lead to significant fines, penalties or liabilities for any noncompliance with such privacy laws or regulations.
In addition to government activity, privacy advocacy groups and the technology and other industries are considering various new or additional self-regulatory standards that may place additional burdens on our customers or on us. If the gathering of personal information were to be curtailed in this manner, our solutions would be less effective and we would be required to work with our customers to modify such information on our solutions, which may reduce demand for our solutions and harm our business.
We may expand through acquisitions of, or investmen ts in, other companies, which may divert our manage ment’s attention and result in additional dilution to our stockholders, and we may be unable to integrate acq uired businesses and technologies successfully or achieve the expected b enefits of such acquisitions.
We may in the future seek to acquire or invest in businesses, products or technologies that we believe could complement or expand our solutions, enhance our technical capabilities or otherwise offer growth opportunities. The pursuit of potential acquisitions may divert the attention of management and cause us to incur various expenses in identifying, investigating and pursuing suitable acquisitions, whether or not the acquisitions are completed. In addition, we have limited experience in acquiring other businesses, having acquired one company in 2009. If we acquire additional businesses, we may not be able to successfully integrate the acquired personnel, operations and technologies, maintain relationships with customers or partners or effectively manage the combined business following the acquisition. We may not be able to find and identify desirable acquisition targets or be successful in entering into an agreement with any particular target. We also may fail to identify all of the problems, liabilities, or other shortcomings or challenges of an acquired business, product, or technology, including issues related to intellectual property, solution quality or architecture, regulatory compliance practices, revenue recognition or other accounting practices or employee or client issues. Acquisitions could also result in dilutive issuances of equity securities or the incurrence of debt, which could impact our cash flows and subject us to restrictive covenants that could inhibit our business, any of which could adversely affect our operating results. In addition, if an acquired business fails to meet our expectations or if we are unable to successfully integrate it, our business and operating results may suffer.
We may not be able to utilize a significant portion of our net operating loss or research tax credit c arryforwards, which could adversely affect our future liquidity positio n.
As of January 31, 2015, we had approximately $198.7 million and $67.5 million of federal and state net operating loss carryforwards, which if not utilized will begin to expire in 2019 for federal purposes and began to expire in 2015 for state purposes. These net operating loss carryforwards could expire unused and be unavailable to offset future income tax liabilities, which could require additional cash expenditures for income taxes in the future. In addition, under Section 382 of the Internal Revenue Code of 1986 (the Code), our ability to utilize net operating loss carryforwards or other tax attributes in any taxable year may be limited if we experience an “ownership change.” Under Section 382 of the Code, an “ownership change” generally occurs if one or more stockholders or groups of stockholders who own at least 5% of our stock increase their ownership by more than 50% over their lowest ownership percentage within a rolling three-year period. Similar rules may apply under state tax laws. It is possible that prior ownership changes, an ownership change in connection with this offering, or any future ownership change could have a material effect on the use of our net operating loss carryforwards or other tax attributes.
28
Table of Contents
Index to Financial Statements
We are leveraged financially, which could adversely affect our ability to adjust our business to respo nd to competitive pressures and to obtain sufficient funds to satisfy our future research and development needs, to prot ect and enforce our intellectual property, and to meet other needs.
As of April 30, 2015, we had total outstanding indebtedness of approximately $27.4 million drawn under various credit facilities. The degree to which we are leveraged could have negative consequences, including the following:
A failure to comply with the covenants and other provisions of our credit agreements could result in events of default under such agreements, which could permit acceleration of all of our outstanding indebtedness. Any required repayment of the principal amount of our existing indebtedness as a result of a fundamental change or acceleration of our existing indebtedness would reduce our cash on hand such that we would not have those funds available for use in our business.
Financing agreements to which we are party or may b ecome party may contain operating and financial cov enants that restrict our business and financing activities.
Our existing credit facilities with certain lenders contain certain operating and financial restrictions and covenants, including a prohibition on the incurrence of certain indebtedness and liens, a prohibition on certain investments, a prohibition on paying dividends on our common stock, restrictions against certain merger and consolidation transactions, certain restrictions against the disposition of assets and the requirement to maintain a minimum level of liquidity. These restrictions and covenants, as well as those contained in any future financing agreements that we may enter into, restrict our ability to finance our operations, engage in, expand or otherwise pursue our business activities and strategies. Our ability to comply with these covenants may be affected by events beyond our control, and breaches of these covenants could result in a default under the credit agreement and any future financing agreements that we may enter into. If not waived, defaults could cause our outstanding indebtedness under our credit agreement and any future financing agreements that we may enter into to become immediately due and payable.
Taxing authorities may successfully assert that we should have collected or in the future should colle ct sales and use, value-added or similar taxes, and we could be subje ct to liability with respect to past or future sale s, which could adversely affect our results of operations.
We do not collect sales and use, value-added and similar taxes in all jurisdictions in which we have sales of our solutions or related services where we do not believe that such taxes are applicable. Sales and use, value-added and similar tax laws and rates vary greatly by jurisdiction. Certain jurisdictions in which we do not collect such taxes may assert that such taxes are applicable, which could result in tax assessments, penalties and interest, and we may be required to collect such taxes in the future. Such tax assessments, penalties and interest or future requirements may adversely affect the results of our operations.
29
• we may be more vulnerable to economic downturns, less able to withstand competitive pressures and less flexible in responding to changing business and economic conditions;
• our ability to obtain additional financing in the future for working capital, capital expenditures, acquisitions, litigation, general corporate or other purposes may be limited; and
• a substantial portion of our cash flows from operations in the future may be required for the payment of the principal amount of our existing indebtedness when it becomes due at maturity, which is currently scheduled for August 2016, with respect to indebtedness under our Amended and Restated Loan and Security Agreement with Silicon Valley Bank (SVB) and October 2017 with respect to both our Amended and Restated Loan and Security Agreement with Wellington Financial LP (Wellington) and our Mezzanine Loan and Security Agreement with SVB.

Table of Contents
Index to Financial Statements
Violations of the U.S. Foreign Corrupt Practices Ac t and similar foreign anti-bribery laws could adver sely impact our business, financial condition and results of operat ions.
The U.S. Foreign Corrupt Practices Act (FCPA) and similar anti-bribery laws in other jurisdictions prohibit companies and their intermediaries and agents from making improper payments to foreign officials, including employees of government owned businesses, as well as private organizations, for the purpose of obtaining or retaining business. During the last few years, the United States Department of Justice and the SEC have brought an increasing number of FCPA enforcement cases, many resulting in very large fines and deferred criminal prosecutions.
We have prepared anti-corruption policies, to be in effect upon the completion of this offering, to mandate compliance with the FCPA and other similar anti-bribery laws and expect to design and implement a plan that seeks to ensure compliance with those policies. However, there can be no assurance that our employees and third-party intermediaries will comply with the FCPA and similar anti-bribery laws and the policies that we implement to seek to ensure compliance with them. Violations of the FCPA or other foreign anti-bribery laws, or allegations of such violations, could disrupt our business and cause us to suffer civil and criminal financial penalties and other sanctions, which may have a material adverse impact on our business, financial condition and results of operations.
Our business is subject to the risks of earthquakes , fire, floods and other natural catastrophic event s, and to interruption by manmade problems such as network security breach es, computer viruses or terrorism.
We rely heavily on our data centers, network infrastructure and information technology systems for our business operations. A disruption or failure of these systems in the event of a terrorist attack, online or hacker attack, earthquake, fire, flood, power loss, telecommunications failure, or other similar catastrophic event could cause system interruptions, delays in accessing our service, reputational harm and loss of critical data or could prevent us from providing our solutions to our customers. Our service is delivered from data centers operated by a third party in Virginia and California. In addition, we are headquartered and most of our employees reside in the San Francisco Bay Area, an area susceptible to earthquakes, and a major earthquake or other catastrophic event could affect our employees, who may not be able to access our systems or otherwise continue to provide our solutions to our customers. A catastrophic event that results in the destruction or disruption of our data centers, or our network infrastructure or information technology systems, or access to our systems, could affect our ability to conduct normal business operations and adversely affect our operating results.
Risks relating to owning our common stock and this offering
There has been no prior market for our common stock and an active market may not develop or be sustain ed, and you may not be able to resell your shares at or above t he initial public offering price, if at all.
There has been no public market for our common stock prior to this offering. The initial public offering price for our common stock has been determined through negotiations between the underwriters and us and may vary from the market price of our common stock following this offering. If you purchase shares of our common stock in this offering, you may not be able to resell those shares at or above the initial public offering price. An active or liquid market in our common stock may not develop upon closing of this offering or, if it does develop, it may not be sustainable, which could adversely affect your ability to sell your shares and could depress the market price of our common stock.
30
Table of Contents
Index to Financial Statements
Our stock price may be volatile and may decline reg ardless of our operating performance resulting in s ubstantial losses for investors purchasing shares in this offering.
The trading prices of the securities of technology companies, including providers of cloud-based software, have been highly volatile. The market price of our common stock may fluctuate significantly in response to numerous factors, many of which are beyond our control, including:
In addition, the stock markets have experienced extreme price and volume fluctuations that have affected and continue to affect the market prices of equity securities of many technology companies. Stock prices of many technology companies have fluctuated in a manner unrelated or disproportionate to the operating performance of those companies.
In the past, stockholders have instituted securities class action litigation following periods of market volatility. If we were to become involved in securities litigation, it could subject us to substantial costs, divert resources and the attention of management from our business and adversely affect our business.
Substantial future sales of shares of our common st ock by existing stockholders could depress the mark et price of our common stock.
The market price for our common stock could decline as a result of the sale of substantial amounts of our common stock, particularly sales by our directors, executive officers and significant stockholders, a large number of shares of our common stock becoming available for sale or the perception in the market that holders of a large number of shares intend to sell their shares. Based on shares outstanding as of April 30, 2015, after giving effect to the issuance of 27,500 shares of our common stock to be acquired by certain selling stockholders through option exercises in order to sell those shares in this offering, upon completion of this
31
• actual or anticipated fluctuations in our revenue and other operating results, including as a result of the addition or loss of customers;
• announcements by us or our competitors of significant technical innovations, acquisitions, partnerships, joint ventures or capital commitments;
• the financial projections we may provide to the public, any changes in these projections or our failure to meet these projections;
• failure of securities analysts to initiate or maintain coverage of us, changes in ratings and financial estimates by any securities analysts who follow our company, or our failure to meet these estimates or the expectations of investors;
• changes in operating performance and stock market valuations of cloud-based software or other technology companies, or those in our industry in particular;
• price and volume fluctuations in the trading of our common stock and in the overall stock market, including as a result of trends in the economy as a whole;
• announcements by us with regard to the effectiveness of our internal controls and our ability to accurately report financial results;
• new laws or regulations or new interpretations of existing laws or regulations applicable to our business or our industry;
• lawsuits threatened or filed against us;
• changes in key personnel; and
• other events or factors, including those resulting from war, incidents of terrorism or responses to these events.
Table of Contents
Index to Financial Statements
offering, we will have outstanding approximately 27.7 million shares of common stock, approximately 20.4 million of which are subject to the 180-day contractual lock-up more fully described in “Underwriting.” The representatives of the underwriters may permit our officers, directors, employees and stockholders to sell shares prior to the expiration of the lock-up agreements.
After this offering, holders of approximately 18.0 million shares of our common stock as of April 30, 2015, will have rights, subject to some conditions, to require us to file registration statements covering their shares or to include their shares in registration statements that we may file for ourselves or our stockholders. Substantially all of these shares are subject to the 180-day contractual lock-up referred to above.
In addition, the shares of common stock subject to outstanding options under our equity incentive plans and the shares reserved for future issuance under our equity incentive plans will become eligible for sale in the public market in the future, subject to certain legal and contractual limitations. See “Shares eligible for future sale” for a more detailed description of sales that may occur in the future.
If a substantial number of shares are sold, or if it is perceived that they will be sold, in the public market, before or after the expiration of the 180-day contractual lock-up period, the trading price of our common stock could decline substantially.
If you purchase shares of our common stock in this offering, you will experience substantial and immed iate dilution.
If you purchase shares of our common stock in this offering, you will experience substantial and immediate dilution of $7.39 in the pro forma net tangible book value per share as of April 30, 2015 after giving effect to this offering, based on the initial public offering price of $8.00 per share, because the price that you pay will be substantially greater than the pro forma net tangible book value per share of the common stock that you acquire. This dilution is due in large part to the fact that our earlier investors paid substantially less than the initial public offering price when they purchased their shares of our capital stock. You will experience additional dilution upon exercise of any warrant, upon exercise of options to purchase common stock under our equity incentive plans, if we issue restricted stock to our employees under our equity incentive plans or if we otherwise issue additional shares of our common stock at a price per share below the initial public offering price per share. For a further description of the dilution that you will experience immediately after this offering, see “Dilution.”
If securities or industry analysts do not publish r esearch or publish incorrect or unfavorable researc h about our business, our stock price and trading volume could decline.
The trading market for our common stock depends in part on the research and reports that securities or industry analysts publish about us or our business, our market and our competitors. If no or few securities or industry analysts cover our company, the trading price for our stock would be negatively impacted. If one or more of the analysts who covers us downgrades our stock or publishes incorrect or unfavorable research about our business, our stock price would likely decline. If one or more of these analysts ceases coverage of our company or fails to publish reports on us regularly, demand for our stock could decrease, which could cause our stock price or trading volume to decline.
The concentration of our capital stock ownership wi th insiders upon the completion of this offering wi ll likely limit your ability to influence corporate matters, including t he ability to influence the outcome of director ele ctions and other matters requiring stockholder approval.
We anticipate that our executive officers, directors, current 5% or greater stockholders and affiliated entities will together beneficially own approximately 57.4% of our common stock outstanding after this offering based on shares outstanding as of April 30, 2015. As a result, these stockholders, acting together, will have significant influence over all matters that require approval by our stockholders, including the election of directors and
32
Table of Contents
Index to Financial Statements
approval of significant corporate transactions. Corporate action might be taken even if other stockholders, including those who purchase shares in this offering, oppose them. This concentration of ownership might also have the effect of delaying or preventing a change of control of our company that other stockholders may view as beneficial.
Our management will have broad discretion in the us e of the net proceeds that we receive in this offer ing.
Our management will have broad discretion as to how to use the net proceeds from this offering, and you will be relying on the judgment of our management regarding the application of these proceeds. Our management might not apply the net proceeds in ways that increase the value of your investment. We intend to use the net proceeds for working capital and other general corporate purposes. We may use a portion of the net proceeds to expand our current business through acquisitions of other businesses, products and technologies. Until we use the net proceeds from this offering, we plan to invest them, and these investments may not yield a favorable rate of return. If we do not invest or apply the net proceeds in ways that enhance stockholder value, we may fail to achieve expected financial results, which could cause our stock price to decline.
Our ability to raise capital in the future may be l imited, and our failure to raise capital when neede d could prevent us from growing.
Our business and operations may consume resources faster than we anticipate. In the future, we may need to raise additional funds to invest in future growth opportunities. Additional financing may not be available on favorable terms, if at all. If adequate funds are not available on acceptable terms, we may be unable to invest in future growth opportunities, which could seriously harm our business and operating results. If we incur debt, the debt holders would have rights senior to common stockholders to make claims on our assets, and the terms of any debt could restrict our operations, including our ability to pay dividends on our common stock. Furthermore, if we issue additional equity securities, stockholders will experience dilution, and the new equity securities could have rights senior to those of our common stock. Because our decision to issue securities in any future offering will depend on market conditions and other factors beyond our control, we cannot predict or estimate the amount, timing or nature of our future offerings. As a result, our stockholders bear the risk of our future securities offerings reducing the market price of our common stock and diluting their interest.
The requirements of being a public company will sub ject us to increased costs and may strain our resou rces and divert management’s attention.
As a public company, we will be subject to the reporting requirements of the Securities Exchange Act of 1934, as amended (the Exchange Act), the Sarbanes-Oxley Act of 2002 (the Sarbanes-Oxley Act), the Dodd-Frank Wall Street Reform and Consumer Protection Act, and the rules and regulations of the New York Stock Exchange. The requirements of these rules and regulations will increase our legal, accounting and financial compliance costs, will make some activities more difficult, time-consuming and costly and may also place undue strain on our personnel, systems and resources.
The Exchange Act requires, among other things, that we file annual, quarterly and current reports with respect to our business and operating results. The Sarbanes-Oxley Act requires, among other things, that we maintain effective disclosure controls and procedures and internal control over financial reporting. We are continuing the costly process of implementing and testing our systems to report our results as a public company, to continue to manage our growth and to implement internal controls. We will be required to implement and maintain various other control and business systems related to our equity, finance, treasury, information technology, other recordkeeping systems and other operations. As a result of this implementation and maintenance, management’s attention may be diverted from other business concerns, which could adversely affect our business. Furthermore, we rely on third-party software and system providers for ensuring our reporting obligations and effective internal controls, and to the extent these third parties fail to provide adequate service
33
Table of Contents
Index to Financial Statements
including as a result of any inability to scale to handle our growth and the imposition of these increased reporting and internal controls and procedures, we could incur material costs for upgrading or switching systems and our business could be materially affected.
In addition, changing laws, regulations and standards relating to corporate governance and public disclosure are creating uncertainty for public companies, increasing legal and financial compliance costs and making some activities more time-consuming. These laws, regulations and standards are subject to varying interpretations, in many cases due to their lack of specificity and, as a result, their application in practice may evolve over time as new guidance is provided by regulatory and governing bodies. This could result in continuing uncertainty regarding compliance matters and higher costs necessitated by ongoing revisions to disclosure and governance practices. We intend to invest resources to comply with evolving laws, regulations and standards, and this investment may result in increased general and administrative expenses and a diversion of management’s time and attention from revenue-generating activities to compliance activities. If our efforts to comply with new laws, regulations and standards differ from the activities intended by regulatory or governing bodies due to ambiguities related to their application and practice, regulatory authorities may initiate legal proceedings against us and our business may be adversely affected.
In addition, we expect these laws, rules and regulations to make it more difficult and more expensive for us to obtain director and officer liability insurance, and we may be required to incur substantial costs to maintain appropriate levels of coverage. These factors could also make it more difficult for us to attract and retain qualified members of our board of directors, particularly to serve on our audit committee, and qualified executive officers.
As a result of disclosure of information in this prospectus and in filings required of a public company, our business and financial condition will become more visible, which we believe may result in threatened or actual litigation, including by competitors and other third parties. If such claims are successful, our business and operating results could be adversely affected, and even if the claims do not result in litigation or are resolved in our favor, these claims, and the time and resources necessary to resolve them, could divert the time and resources of our management and adversely affect our business and operating results.
As a result of becoming a public company, we will b e obligated to further develop and maintain proper and effective internal control over financial reporting. We may n ot complete our analysis of our internal control ov er financial reporting in a timely manner, or these internal controls may not be determined to be effective, which may advers ely affect investor confidence in our company and, as a result, the val ue of our common stock.
We will be required, pursuant to Section 404 of the Sarbanes-Oxley Act, to furnish a report by management on, among other things, the effectiveness of our internal control over financial reporting commencing with our annual report covering the fiscal year ending January 31, 2017. This assessment will need to include disclosure of any material weaknesses identified by our management in our internal control over financial reporting. Prior to this offering, we have never been required to test our internal controls within a specified period, and, as a result, we may experience difficulty in meeting these reporting requirements in a timely manner. In addition, our independent registered public accounting firm will not be required to formally attest to the effectiveness of our internal control over financial reporting pursuant to Section 404 of the Sarbanes-Oxley Act until the later of the year following our first annual report required to be filed with the SEC, or the date we are no longer an “emerging growth company” as defined in the JOBS Act. If we are unable to comply with the requirements of Section 404 of the Sarbanes-Oxley Act in a timely manner, the market price of our stock could decline and we could be subject to sanctions or investigations by the stock exchange on which our common stock is listed, the SEC or other regulatory authorities, which would require additional financial and management resources.
Any failure to develop or maintain effective controls, or any difficulties encountered in their implementation or improvement, could harm our operating results or cause us to fail to meet our reporting obligations. Any failure to implement and maintain effective internal controls also could adversely affect the results of periodic
34
Table of Contents
Index to Financial Statements
management evaluations regarding the effectiveness of our internal control over financial reporting. Ineffective disclosure controls and procedures or internal control over financial reporting could also cause investors to lose confidence in our reported financial and other information, which would likely have a negative effect on the trading price of our common stock.
Implementing any appropriate changes to our internal controls may require specific compliance training of our directors, officers and employees, entail substantial costs in order to modify our existing accounting systems, and take a significant period of time to complete. Such changes may not, however, be effective in maintaining the adequacy of our internal controls, and any failure to maintain that adequacy, or consequent inability to produce accurate financial statements on a timely basis, could increase our operating costs and could materially impair our ability to operate our business. In the event that we are not able to demonstrate compliance with Section 404 of the Sarbanes-Oxley Act in a timely manner, that our internal controls are perceived as inadequate or that we are unable to produce timely or accurate financial statements, investors may lose confidence in our operating results and our stock price could decline.
We are an “emerging growth company” and we cannot b e certain if the reduced disclosure requirements ap plicable to emerging growth companies will make our common stoc k less attractive to investors.
We are an “emerging growth company,” as defined in the JOBS Act, and we may take advantage of certain exemptions from various reporting requirements that are applicable to other public companies that are not “emerging growth companies” including, but not limited to, not being required to comply with the auditor attestation requirements of Section 404 of the Sarbanes-Oxley Act, reduced financial disclosure obligations, reduced disclosure obligations regarding executive compensation in our periodic reports and proxy statements, and exemptions from the requirements of holding a nonbinding advisory vote on executive compensation and any golden parachute payments not previously approved. We may take advantage of these provisions for up to five years or such earlier time that we are no longer an “emerging growth company.” We would cease to be an “emerging growth company” upon the earliest to occur of: the last day of the fiscal year in which we have more than $1.0 billion in annual revenue; the date we qualify as a “large accelerated filer,” with at least $700 million of equity securities held by non-affiliates; the issuance, in any three-year period, by us of more than $1.0 billion in non-convertible debt securities; and the last day of the fiscal year ending after the fifth anniversary of our initial public offering. We may choose to take advantage of some but not all of these reduced reporting burdens. If we take advantage of any of these reduced reporting burdens in future filings, the information that we provide our security holders may be different than you might get from other public companies in which you hold equity interests. We cannot predict if investors will find our common stock less attractive because we may rely on these exemptions. If some investors find our common stock less attractive as a result, there may be a less active trading market for our common stock and our stock price may be more volatile.
In addition, Section 107 of the JOBS Act provides that an “emerging growth company” can take advantage of the extended transition period provided in Section 7(a)(2)(B) of the Securities Act of 1933, as amended (the Securities Act) for complying with new or revised accounting standards. In other words, an “emerging growth company” can delay the adoption of certain accounting standards until those standards would otherwise apply to private companies. However, we have chosen to “opt out” of such extended transition period, and as a result, we will comply with new or revised accounting standards on the relevant dates on which adoption of such standards is required for non-emerging growth companies. Section 107 of the JOBS Act provides that our decision to opt out of the extended transition period for complying with new or revised accounting standards is irrevocable.
We do not intend to pay dividends following the com pletion of this offering.
We have never declared or paid any cash dividends on our common stock and do not currently intend to do so for the foreseeable future. In addition, our Amended and Restated Loan and Security Agreement with SVB, our Amended and Restated Loan and Security Agreement with Wellington and our Mezzanine Loan and Security Agreement with
35
Table of Contents
Index to Financial Statements
SVB prohibit us from paying cash dividends, and future financing or credit agreements may contain similar restrictions. We currently intend to invest our future earnings, if any, to fund our growth. Therefore, you are not likely to receive any dividends on your common stock for the foreseeable future and the success of an investment in shares of our common stock will depend upon any future appreciation in its value. Consequently, investors may need to sell all or part of their holdings of our common stock after price appreciation, which may never occur, as the only way to realize any future gains on their investment. There is no guarantee that shares of our common stock will appreciate in value or even maintain the price at which our stockholders have purchased their shares. Investors seeking cash dividends should not purchase our common stock.
Provisions in our amended and restated certificate of incorporation and amended and restated bylaws an d under Delaware law might discourage, delay or prevent a c hange of control of our company or changes in our m anagement and, therefore, depress the trading price of our common stock.
Our amended and restated certificate of incorporation, amended and restated bylaws and Delaware law contain provisions that may have the effect of delaying or preventing a change in control of us or changes in our management. Our amended and restated certificate of incorporation and amended and restated bylaws, which will become effective upon the closing of this offering, include provisions that:
These provisions, alone or together, could delay or prevent hostile takeovers and changes in control or changes in our management.
In addition, because we are incorporated in Delaware, we are governed by the provisions of Section 203 of the Delaware General Corporation Law, which limits the ability of stockholders owning in excess of 15% of our outstanding voting stock to merge or combine with us in certain circumstances.
Any provision of our amended and restated certificate of incorporation or amended and restated bylaws or Delaware law that has the effect of delaying or deterring a change in control could limit the opportunity for our stockholders to receive a premium for their shares of our common stock, and could also affect the price that some investors are willing to pay for our common stock.
36
• authorize “blank check” preferred stock, which could be issued by the board without stockholder approval and may contain voting, liquidation, dividend and other rights superior to our common stock;
• create a classified board of directors whose members serve staggered three-year terms;
• specify that special meetings of our stockholders can be called only by our board of directors, the chairperson of the board, the chief executive officer or the president;
• prohibit stockholder action by written consent;
• establish an advance notice procedure for stockholder approvals to be brought before an annual meeting of our stockholders, including proposed nominations of persons for election to our board of directors;
• provide that our directors may be removed only for cause;
• provide that vacancies on our board of directors may be filled only by a majority of directors then in office, even though less than a quorum;
• specify that no stockholder is permitted to cumulate votes at any election of directors;
• authorize our board of directors to modify, alter or repeal our amended and restated bylaws; and
• require supermajority votes of the holders of our common stock to amend specified provisions of our charter documents.
Table of Contents
Index to Financial Statements
Special note regarding forward-looking statements
This prospectus contains forward-looking statements that involve substantial risks and uncertainties. Forward-looking statements generally relate to future events or our future financial or operating performance. In some cases you can identify forward-looking statements because they contain words such as “anticipate,” “believe,” “can,” “could,” “estimate,” “expect,” “intend,” “likely,” “may,” “might,” “plan,” “potential,” “predict,” “project,” “seek,” “should,” “target,” “will,” “would” or similar expressions and the negatives of those terms. Forward-looking statements contained in this prospectus include, but are not limited to, statements about:
37
• our future financial performance, including our expectations regarding our revenue, cost of revenue, gross profit or gross margin, operating expenses, ability to generate cash flow and ability to achieve and maintain future profitability;
• our ability to anticipate market needs and timely develop new and enhanced solutions and services to meet those needs, and our ability to successfully monetize them;
• the evolution of technology affecting our solutions, services and markets;
• the impact of competition in our industry and innovation by our competitors;
• the anticipated trends, growth rates and challenges in our business and in the markets in which we operate;
• maintaining and expanding our customer base and our relationships with other companies;
• our liquidity and working capital requirements;
• our anticipated growth and growth strategies and our ability to effectively manage that growth and effect these strategies;
• our ability to sell our solutions and expand internationally;
• our failure to anticipate and adapt to future changes in our industry;
• our reliance on our third-party service providers;
• the impact of any failure of our solutions;
• our ability to hire and retain necessary qualified employees to expand our operations;
• our ability to adequately protect our intellectual property;
• the anticipated effect on our business of litigation to which we are or may become a party;
• our ability to stay abreast of new or modified laws and regulations that currently apply or become applicable to our business both in the U.S. and internationally;
• the increased expenses and administrative workload associated with being a public company;
• our ability to maintain an effective system of internal controls necessary to accurately report our financial results and prevent fraud;
• our use of the net proceeds from this offering;
• the estimates and estimate methodologies used in preparing our consolidated financial statements and determining option exercise prices;
Table of Contents
Index to Financial Statements
We caution you that the foregoing list may not contain all of the forward-looking statements made in this prospectus.
You should not rely upon forward-looking statements as predictions of future events. We have based the forward-looking statements contained in this prospectus primarily on our current expectations and projections about future events and trends that we believe may affect our business, financial condition, operating results and growth prospects. The outcome of the events described in these forward-looking statements is subject to risks, uncertainties and other factors described in the section titled “Risk factors” and elsewhere in this prospectus. Moreover, we operate in a very competitive and rapidly changing environment. New risks and uncertainties emerge from time to time, and it is not possible for us to predict all risks and uncertainties that could have an impact on the forward-looking statements contained in this prospectus. Further, our forward-looking statements do not reflect the potential impact of any future acquisitions, mergers, dispositions, joint ventures or investments we may make. We cannot assure you that the results, events and circumstances reflected in the forward-looking statements will be achieved or occur, and actual results, events or circumstances could differ materially from those described in the forward-looking statements.
The forward-looking statements made in this prospectus relate only to events as of the date on which the statements are made. We undertake no obligation to update any forward-looking statements made in this prospectus to reflect events or circumstances after the date of this prospectus or to reflect new information or the occurrence of unanticipated events, except as required by law. We may not actually achieve the plans, intentions or expectations disclosed in our forward-looking statements and you should not place undue reliance on our forward-looking statements.
38
• the future trading prices of our common stock and the impact of securities analysts’ reports on these prices; and
• other factors discussed in this prospectus in the sections titled “Risk factors,” “Management’s discussion and analysis of financial condition and results of operations,” and “Business.”
Table of Contents
Index to Financial Statements
Industry and market data
This prospectus contains estimates and other statistical data, including those relating to our industry and the market in which we operate, that we have obtained or derived from industry publications and reports. These industry publications and reports generally indicate that they have obtained their information from sources believed to be reliable, but do not guarantee the accuracy and completeness of their information. Based on our industry experience, we believe that the publications and reports are reliable and that the conclusions contained in the publications and reports are reasonable. The industry in which we operate is subject to a high degree of uncertainty and risk due to a variety of factors, including those described in the section titled “Risk factors.” These and other factors could cause actual results to differ materially from those expressed in the industry publications and reports.
The sources of industry and market data contained in this prospectus are listed below:
The Gartner Report described herein (Gartner Report) represents data, research opinion or viewpoints published as part of a syndicated subscription service, by Gartner, Inc. (Gartner). Each Gartner Report speaks as of its original publication date (and not as of the date of this prospectus) and the opinions expressed in the Gartner Report are subject to change without notice.
39
(1) Aon Hewitt’s 2014 U.S. Salary Increase Survey, published August 2014.
(2) CSO Insights’ 2014 Sales Compensation & Performance Management Study, published April 2014.
(3) Gartner’s “Magic Quadrant for Sales Performance Management,” published January 6, 2015.
(4) “Motivating Salespeople: What Really Works” by Thomas Steenburgh and Michael Ahearne, Harvard Business Review, July 1, 2012.
(5) International Data Corporation’s Worldwide SaaS and Cloud Software 2014-2018 Forecast and 2013 Vendor Shares, published July 2014.
(6) United States Department of Labor – Bureau of Labor Statistics, “Occupational Employment and Wages – May 2013,” published April 1, 2014.
(7) EU Skills Panorama (2014) Sales workers Analytical Highlight, prepared by ICF and Cedefop for the European Commission, published December 2014.
Table of Contents
Index to Financial Statements
Use of proceeds
We estimate that the net proceeds to us from the sale of shares of our common stock in this offering and the exercise by certain selling stockholders of options to acquire 27,500 shares of our common stock will be $47.1 million, based on the initial public offering price of $8.00 per share, after deducting underwriting discounts and commissions and estimated offering expenses payable by us. If the underwriters exercise their over-allotment option to purchase additional shares from us in full, we estimate that our net proceeds would be $55.0 million, after deducting underwriting discounts and commissions and estimated offering expenses payable by us. We will not receive any of the proceeds from the shares sold by the selling stockholders.
The principal purposes of this offering are to increase our financial flexibility, improve brand awareness, create a public market for our common stock and facilitate our future access to the public capital markets. We expect to use the net proceeds that we will receive from this offering for working capital and other general corporate purposes. We may also use a portion of the net proceeds that we receive to acquire or invest in complementary businesses, products, services, technologies or other assets. However, we do not have agreements or commitments for any specific acquisitions or investments at this time.
We cannot specify with certainty the particular uses of the net proceeds that we will receive from this offering. Accordingly, we will have broad discretion in using these proceeds. Furthermore, the amount and timing of our actual expenditures will depend on numerous factors, including the cash used in or generated by our operations, the status of our development, the level of our sales and marketing activities, the pace of our international expansion plans and our investments and acquisitions. Pending the use of proceeds from this offering as described above, we plan to invest the net proceeds that we receive in this offering in short-term and intermediate-term interest-bearing obligations, investment-grade investments, certificates of deposit or direct or guaranteed obligations of the U.S. government. We cannot predict whether the invested proceeds will yield a favorable return.
Dividend policy
We have never declared or paid cash dividends on our common stock. We currently intend to retain all available funds and any future earnings for use in the operation of our business and do not anticipate paying any dividends on our common stock in the foreseeable future. Any future determination to declare dividends will be made at the discretion of our board of directors and will depend on our financial condition, operating results, capital requirements, general business conditions and other factors that our board of directors may deem relevant. In addition, unless waived, the terms of our Amended and Restated Loan and Security Agreement with SVB, our Amended and Restated Loan and Security Agreement with Wellington and our Mezzanine Loan and Security Agreement with SVB prohibit us from paying cash dividends.
40
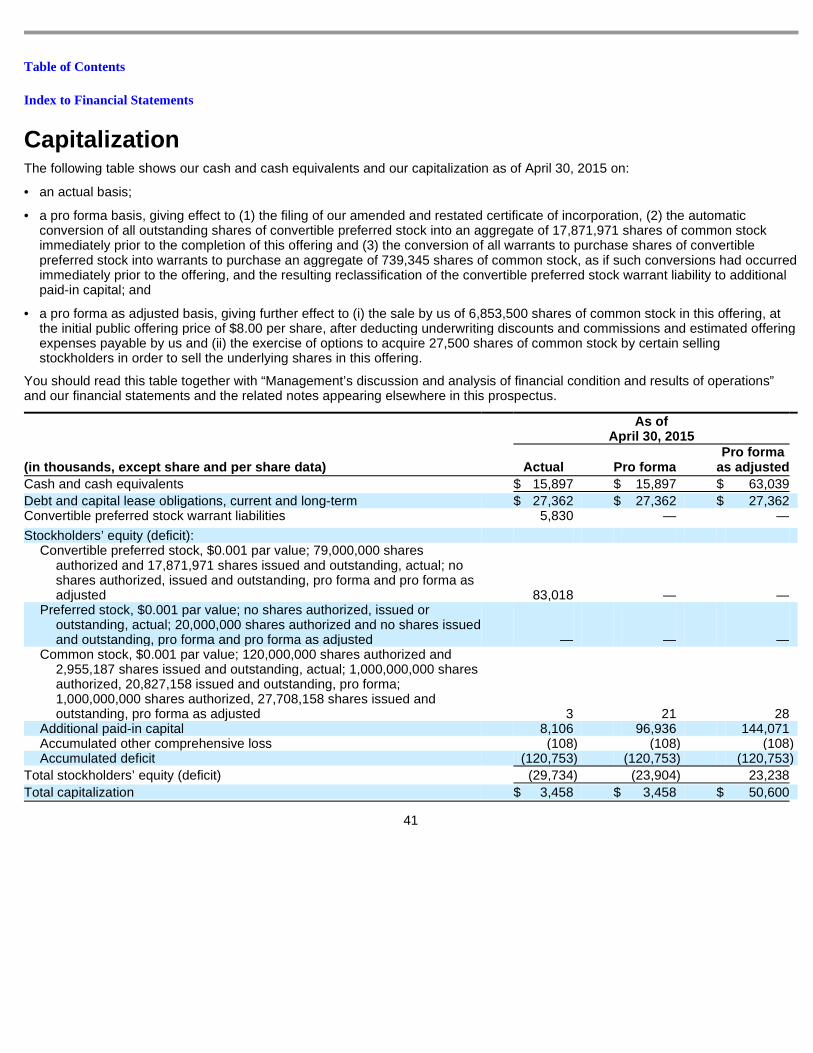
Table of Contents
Index to Financial Statements
Capitalization
The following table shows our cash and cash equivalents and our capitalization as of April 30, 2015 on:
You should read this table together with “Management’s discussion and analysis of financial condition and results of operations” and our financial statements and the related notes appearing elsewhere in this prospectus.
41
• an actual basis;
• a pro forma basis, giving effect to (1) the filing of our amended and restated certificate of incorporation, (2) the automatic conversion of all outstanding shares of convertible preferred stock into an aggregate of 17,871,971 shares of common stock immediately prior to the completion of this offering and (3) the conversion of all warrants to purchase shares of convertible preferred stock into warrants to purchase an aggregate of 739,345 shares of common stock, as if such conversions had occurred immediately prior to the offering, and the resulting reclassification of the convertible preferred stock warrant liability to additional paid-in capital; and
• a pro forma as adjusted basis, giving further effect to (i) the sale by us of 6,853,500 shares of common stock in this offering, at the initial public offering price of $8.00 per share, after deducting underwriting discounts and commissions and estimated offering expenses payable by us and (ii) the exercise of options to acquire 27,500 shares of common stock by certain selling stockholders in order to sell the underlying shares in this offering.
As of April 30, 2015
(in thousands, except share and per share data) Actual Pro forma
Pro forma as adjusted
Cash and cash equivalents $ 15,897 $ 15,897 $ 63,039
Debt and capital lease obligations, current and long-term $ 27,362 $ 27,362 $ 27,362 Convertible preferred stock warrant liabilities 5,830 — —
Stockholders’ equity (deficit):
Convertible preferred stock, $0.001 par value; 79,000,000 shares authorized and 17,871,971 shares issued and outstanding, actual; no shares authorized, issued and outstanding, pro forma and pro forma as adjusted 83,018 — —
Preferred stock, $0.001 par value; no shares authorized, issued or outstanding, actual; 20,000,000 shares authorized and no shares issued and outstanding, pro forma and pro forma as adjusted — — —
Common stock, $0.001 par value; 120,000,000 shares authorized and 2,955,187 shares issued and outstanding, actual; 1,000,000,000 shares authorized, 20,827,158 issued and outstanding, pro forma; 1,000,000,000 shares authorized, 27,708,158 shares issued and outstanding, pro forma as adjusted 3 21 28
Additional paid-in capital 8,106 96,936 144,071 Accumulated other comprehensive loss (108 ) (108 ) (108 ) Accumulated deficit (120,753 ) (120,753 ) (120,753 )
Total stockholders’ equity (deficit) (29,734 ) (23,904 ) 23,238
Total capitalization $ 3,458 $ 3,458 $ 50,600
Table of Contents
Index to Financial Statements
The total number of shares of our common stock to be outstanding after this offering used in this prospectus is based on 20,827,158 shares of our common stock (including convertible preferred stock on an as converted basis) outstanding as of April 30, 2015 and 27,500 shares to be sold in this offering by certain selling stockholders upon the excercise of options, and excludes:
42
• 4,669,839 shares of common stock issuable upon the exercise of options outstanding as of April 30, 2015 (which excludes 27,500 shares to be sold in this offering by certain selling stockholders upon the excercise of options), with a weighted-average exercise price of $3.44 per share;
• 81,250 shares of common stock issuable upon the exercise of options granted after April 30, 2015, through May 31, 2015, with a weighted-average exercise price of $9.96 per share;
• 399,960 shares of common stock issuable upon the exercise and conversion of options to purchase shares of our Series E convertible preferred stock outstanding as of April 30, 2015, with an exercise price of $0.9580 per share;
• warrants to purchase an aggregate of 739,345 shares of our convertible preferred stock that were outstanding as of April 30, 2015 that will either be exercised or converted into warrants to purchase an aggregate of 739,345 shares of our common stock, with a range of expiration dates beginning on the closing of this offering (with respect to the 216,175 warrants to purchase our Series F convertible preferred stock) to up to ten years following the effectiveness of the registration statement to which this prospectus is a part, in connection with the completion of this offering, with a weighted-average exercise price of $8.13 per share; and
• 3,754,337 shares of common stock reserved for future issuance under our stock-based compensation plans, consisting of 154,337 shares of common stock reserved for future issuance under the 2005 Stock Plan as of April 30, 2015, 3,000,000 shares of common stock reserved for future issuance under the 2015 Plan, 600,000 shares of common stock reserved for future issuance under the 2015 ESPP and shares that become available under the 2015 Plan and the 2015 ESPP pursuant to provisions thereof that automatically increase the share reserves under the plans each year, as more fully described in “Executive compensation—Employee benefit and stock plans.”
Table of Contents
Index to Financial Statements
Dilution
If you invest in our common stock in this offering, your ownership interest will be diluted to the extent of the difference between the initial public offering price per share of our common stock and the pro forma as adjusted net tangible book value per share of our common stock immediately after this offering. Net tangible book value dilution per share to new investors represents the difference between the amount per share paid by purchasers of shares of common stock in this offering and the pro forma net tangible book value per share of common stock immediately after completion of this offering.
Net tangible book value per share is determined by dividing our total tangible assets less our total liabilities by the number of shares of common stock outstanding. Our pro forma net tangible book value as of April 30, 2015 was $(30.3 million), or $(1.45) per share, based on the total number of shares of our common stock outstanding as of April 30, 2015, after giving effect to the pro forma adjustments referenced under “Capitalization,” which will occur upon the completion of this offering.
After giving effect to (i) the pro forma adjustments referenced under “Capitalization,” (ii) the receipt of the net proceeds from the sale of 6,853,500 shares of common stock by us at the initial public offering price of $8.00 per share, after deducting underwriting discounts and commissions and estimated offering expenses payable by us and (iii) the issuance of 27,500 shares of common stock to be acquired by certain selling stockholders upon the exercise of options in order to sell those shares in this offering, our pro forma as adjusted net tangible book value as of April 30, 2015 would have been approximately $16.9 million, or $0.61 per share. This represents an immediate increase in pro forma net tangible book value of $2.06 per share to our existing stockholders and an immediate dilution of $7.39 per share to investors purchasing shares of common stock in this offering at the initial public offering price. The following table illustrates this dilution on a per share basis:
If the underwriters exercise their over-allotment option to purchase additional shares from us in full, the pro forma as adjusted net tangible book value per share of our common stock immediately after this offering would be $0.86 per share, and the dilution in pro forma net tangible book value per share to new investors in this offering would be $7.14 per share.
The following table summarizes, on the pro forma as adjusted basis described above as of April 30, 2015, the total number of shares of common stock purchased from us, the total consideration paid to us and the average price per share paid to us by existing stockholders and by new investors purchasing shares in this offering at the initial public offering price of $8.00 per share, before deducting underwriting discounts and commissions and estimated offering expenses payable by us:
43
Initial public offering price per share $ 8.00 Pro forma net tangible book value per share as of April 30, 2015 $ (1.45 ) Increase in pro forma net tangible book value per share attributable to new investors in this offering 2.06
Pro forma as adjusted net tangible book value per share immediately after this offering 0.61
Dilution in pro forma net tangible book value per share to new investors in this offering $ 7.39
Shares purchased Total consideration Average
price per
share Number Percent Amount Percent
Existing stockholders 20,854,658 75.3% $ 86,218,612 61.1% $ 4.13 New investors 6,853,500 24.7% $ 54,828,000 38.9% $ 8.00
Total 27,708,158 100% $ 141,046,612 100%
Table of Contents
Index to Financial Statements
If the underwriters exercise their over-allotment option to purchase additional shares from us in full, our existing stockholders would own 72.5% and our new investors would own 27.5% of the total number of shares of our common stock outstanding upon the completion of this offering.
The foregoing discussion and tables exclude:
44
• 4,669,839 shares of common stock issuable upon the exercise of options outstanding as of April 30, 2015 (which excludes 27,500 shares to be sold in this offering by certain selling stockholders upon the exercise of options), with a weighted-average exercise price of $3.44 per share;
• 81,250 shares of common stock issuable upon the exercise of options granted after April 30, 2015, through May 31, 2015, with a weighted-average exercise price of $9.96 per share;
• 399,960 shares of common stock issuable upon the exercise and conversion of options to purchase shares of our Series E convertible preferred stock outstanding as of April 30, 2015, with an exercise price of $0.9580 per share;
• warrants to purchase an aggregate of 739,345 shares of our convertible preferred stock that were outstanding as of April 30, 2015 that will either be exercised or converted into warrants to purchase an aggregate of 739,345 shares of our common stock, with a range of expiration dates beginning on the closing of this offering (with respect to the 216,175 warrants to purchase our Series F convertible preferred stock) to up to ten years following the effectiveness of the registration statement to which this prospectus is a part, in connection with the completion of this offering, with a weighted-average exercise price of $8.13 per share; and
• 3,754,337 shares of common stock reserved for future issuance under our stock-based compensation plans, consisting of 154,337 shares of common stock reserved for future issuance under the 2005 Stock Plan as of April 30, 2015, 3,000,000 shares of common stock reserved for future issuance under the 2015 Plan, 600,000 shares of common stock reserved for future issuance under the 2015 ESPP and shares that become available under the 2015 Plan and the 2015 ESPP pursuant to provisions thereof that automatically increase the share reserves under the plans each year, as more fully described in “Executive compensation—Employee benefit and stock plans.”
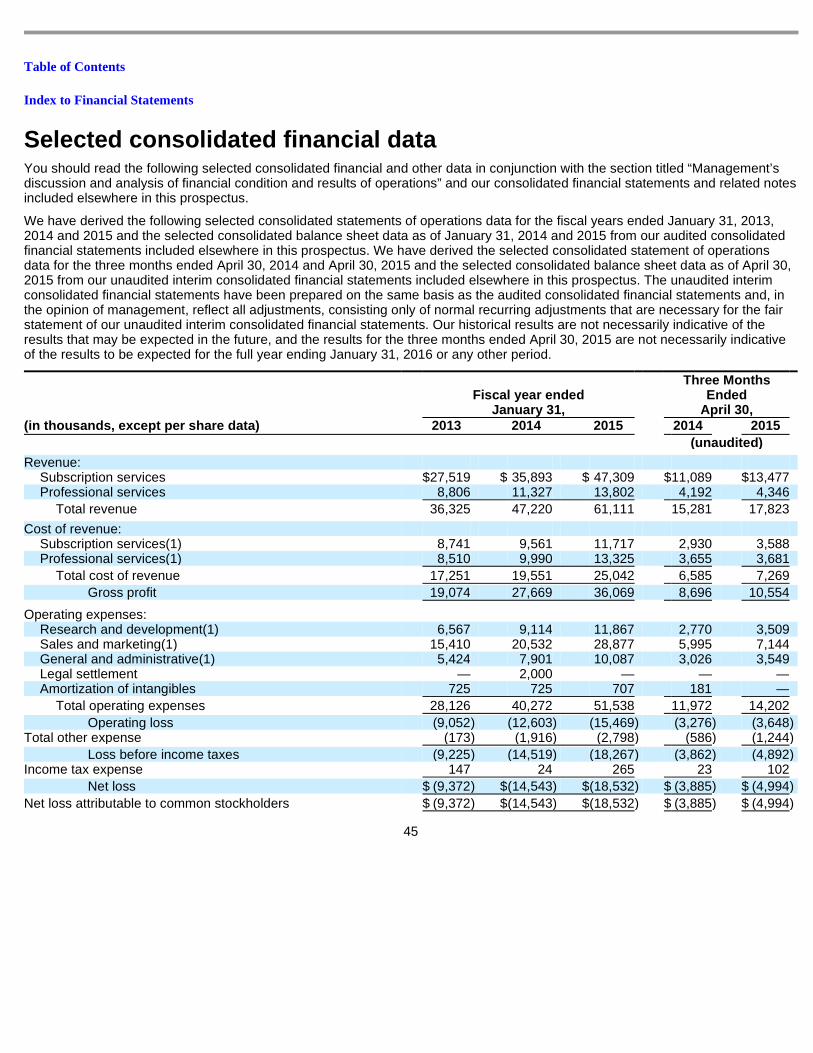
Table of Contents
Index to Financial Statements
Selected consolidated financial data
You should read the following selected consolidated financial and other data in conjunction with the section titled “Management’s discussion and analysis of financial condition and results of operations” and our consolidated financial statements and related notes included elsewhere in this prospectus.
We have derived the following selected consolidated statements of operations data for the fiscal years ended January 31, 2013, 2014 and 2015 and the selected consolidated balance sheet data as of January 31, 2014 and 2015 from our audited consolidated financial statements included elsewhere in this prospectus. We have derived the selected consolidated statement of operations data for the three months ended April 30, 2014 and April 30, 2015 and the selected consolidated balance sheet data as of April 30, 2015 from our unaudited interim consolidated financial statements included elsewhere in this prospectus. The unaudited interim consolidated financial statements have been prepared on the same basis as the audited consolidated financial statements and, in the opinion of management, reflect all adjustments, consisting only of normal recurring adjustments that are necessary for the fair statement of our unaudited interim consolidated financial statements. Our historical results are not necessarily indicative of the results that may be expected in the future, and the results for the three months ended April 30, 2015 are not necessarily indicative of the results to be expected for the full year ending January 31, 2016 or any other period.
45
Fiscal year ended January 31,
Three Months Ended
April 30,
(in thousands, except per share data) 2013 2014 2015 2014 2015
(unaudited)
Revenue:
Subscription services $ 27,519 $ 35,893 $ 47,309 $ 11,089 $ 13,477 Professional services 8,806 11,327 13,802 4,192 4,346
Total revenue 36,325 47,220 61,111 15,281 17,823
Cost of revenue:
Subscription services(1) 8,741 9,561 11,717 2,930 3,588 Professional services(1) 8,510 9,990 13,325 3,655 3,681
Total cost of revenue 17,251 19,551 25,042 6,585 7,269
Gross profit 19,074 27,669 36,069 8,696 10,554
Operating expenses:
Research and development(1) 6,567 9,114 11,867 2,770 3,509 Sales and marketing(1) 15,410 20,532 28,877 5,995 7,144 General and administrative(1) 5,424 7,901 10,087 3,026 3,549 Legal settlement — 2,000 — — — Amortization of intangibles 725 725 707 181 —
Total operating expenses 28,126 40,272 51,538 11,972 14,202
Operating loss (9,052 ) (12,603 ) (15,469 ) (3,276 ) (3,648 ) Total other expense (173 ) (1,916 ) (2,798 ) (586 ) (1,244 )
Loss before income taxes (9,225 ) (14,519 ) (18,267 ) (3,862 ) (4,892 ) Income tax expense 147 24 265 23 102
Net loss $ (9,372 ) $ (14,543 ) $ (18,532 ) $ (3,885 ) $ (4,994 )
Net loss attributable to common stockholders $ (9,372 ) $ (14,543 ) $ (18,532 ) $ (3,885 ) $ (4,994 )
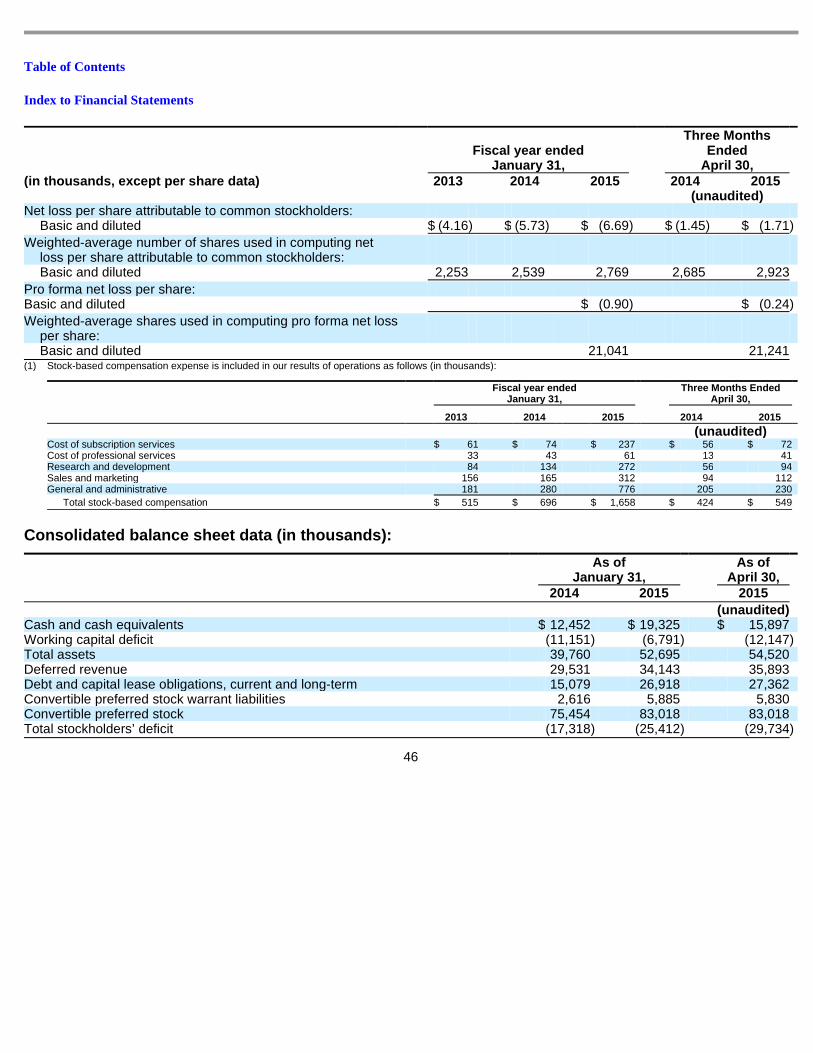
Table of Contents
Index to Financial Statements
Consolidated balance sheet data (in thousands):
46
Fiscal year ended January 31,
Three Months Ended
April 30,
(in thousands, except per share data) 2013 2014 2015 2014 2015
(unaudited)
Net loss per share attributable to common stockholders:
Basic and diluted $ (4.16 ) $ (5.73 ) $ (6.69 ) $ (1.45 ) $ (1.71 )
Weighted-average number of shares used in computing net loss per share attributable to common stockholders:
Basic and diluted 2,253 2,539 2,769 2,685 2,923
Pro forma net loss per share:
Basic and diluted $ (0.90 ) $ (0.24 )
Weighted-average shares used in computing pro forma net loss per share:
Basic and diluted 21,041 21,241
(1) Stock-based compensation expense is included in our results of operations as follows (in thousands):
Fiscal year ended
January 31, Three Months Ended
April 30,
2013 2014 2015 2014 2015
(unaudited) Cost of subscription services $ 61 $ 74 $ 237 $ 56 $ 72 Cost of professional services 33 43 61 13 41 Research and development 84 134 272 56 94 Sales and marketing 156 165 312 94 112 General and administrative 181 280 776 205 230
Total stock-based compensation $ 515 $ 696 $ 1,658 $ 424 $ 549
As of January 31,
As of April 30,
2014 2015 2015
(unaudited)
Cash and cash equivalents $ 12,452 $ 19,325 $ 15,897 Working capital deficit (11,151 ) (6,791 ) (12,147 ) Total assets 39,760 52,695 54,520 Deferred revenue 29,531 34,143 35,893 Debt and capital lease obligations, current and long-term 15,079 26,918 27,362 Convertible preferred stock warrant liabilities 2,616 5,885 5,830 Convertible preferred stock 75,454 83,018 83,018 Total stockholders’ deficit (17,318 ) (25,412 ) (29,734 )
Table of Contents
Index to Financial Statements
Management’s discussion and analysis of financial c ondition and results of operations
The following discussion and analysis of our financial condition and results of operations should be read in conjunction with our consolidated financial statements and related notes included elsewhere in this prospectus. In addition to historical consolidated financial information, the following discussion contains forward-looking statements that reflect our plans, estimates, and beliefs. Our actual results could differ materially from those discussed in the forward-looking statements. Factors that could cause or contribute to these differences include those discussed below and elsewhere in this prospectus, particularly in “Risk factors” and “Special note regarding forward-looking statements.” Our fiscal year end is January 31 and our fiscal quarters end on April 30, July 31, October 31, and January 31.
Overview
We are a leading provider of enterprise-class, cloud-based incentive compensation solutions for employee and sales performance management. We address a critical business need: to incentivize employees and align their behaviors with company goals. Our solutions allow organizations to make better strategic decisions, optimize behaviors, increase sales and employee performance, improve margins, increase operational efficiencies, mitigate risk, design better incentive compensation plans and reduce error rates in incentive compensation calculations. We were the first 100% cloud-based, multi-tenant provider focusing solely on the incentive compensation and employee and sales performance management market and we achieved our leadership position through domain expertise and innovative technology. We deliver our solutions through a SaaS business model.
We were founded in March 2005 and initially we focused on providing incentive compensation solutions for sales personnel. As we have grown, we have expanded our solutions to serve all types of employees across a variety of industries and companies, ranging from FORTUNE 50 enterprises to small, emerging companies. Our initial commercially available solution was Xactly Incent Enterprise, our flagship solution, which helps large enterprise and mid-market companies manage the critical elements of incentive compensation. In 2010, we introduced Xactly Incent Express, our incentive compensation solution that provides streamlined functionality targeted to companies with fewer than 350 employees. In 2013, we introduced Xactly Objectives, a solution for both sales and non-sales personnel, allowing managers and employees to collaboratively track and achieve individual and shared goals. In August 2014, we introduced Xactly Insights, a solution which helps our customers make fact-based decisions to motivate employees and drive business performance using our empirical set of aggregated and anonymized data. In addition, over the years, we have also introduced modules that augment Xactly Incent Enterprise, such as analytics, modeling, automated workflows and approvals and credit assignment.
Our customer base has been predominantly located in the U.S., and we plan to grow our customer base internationally. However, a number of our customers are U.S. companies with employees abroad. We estimate that approximately 28% of our subscribers are located outside of the U.S., based on a representative sample of our user logins during the last two months of the fiscal year ended January 31, 2015. For the fiscal year ended January 31, 2015, approximately 92% of our revenue was from U.S. customers. We market our solutions and services through our direct sales force and sales support staff, and we also rely on partners to refer opportunities to our sales force.
Because we offer our solutions on a subscription basis, we have visibility into a substantial portion of our future revenue. Subscriptions are typically sold through non-cancellable contracts with one to three year terms. Subscription fees are primarily based on the number of subscribers per customer per month. We generally invoice customers annually in advance. The prices we charge a customer per subscriber are driven, in part, by
47
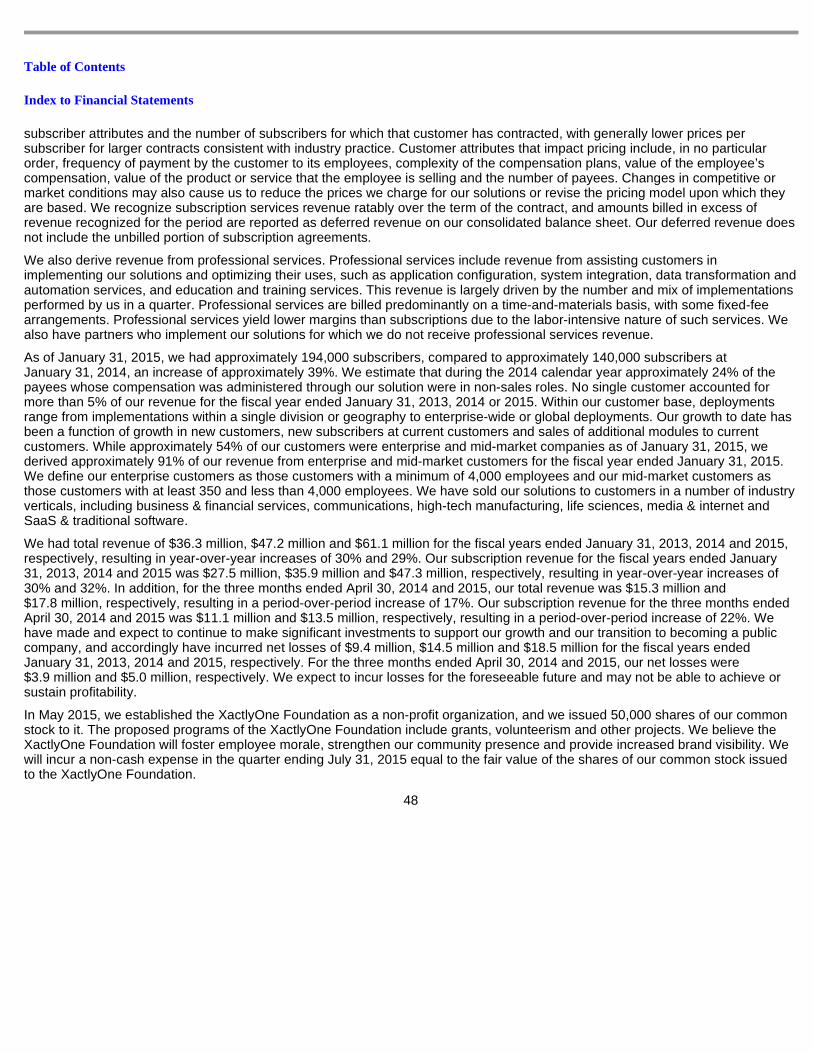
Table of Contents
Index to Financial Statements
subscriber attributes and the number of subscribers for which that customer has contracted, with generally lower prices per subscriber for larger contracts consistent with industry practice. Customer attributes that impact pricing include, in no particular order, frequency of payment by the customer to its employees, complexity of the compensation plans, value of the employee’s compensation, value of the product or service that the employee is selling and the number of payees. Changes in competitive or market conditions may also cause us to reduce the prices we charge for our solutions or revise the pricing model upon which they are based. We recognize subscription services revenue ratably over the term of the contract, and amounts billed in excess of revenue recognized for the period are reported as deferred revenue on our consolidated balance sheet. Our deferred revenue does not include the unbilled portion of subscription agreements.
We also derive revenue from professional services. Professional services include revenue from assisting customers in implementing our solutions and optimizing their uses, such as application configuration, system integration, data transformation and automation services, and education and training services. This revenue is largely driven by the number and mix of implementations performed by us in a quarter. Professional services are billed predominantly on a time-and-materials basis, with some fixed-fee arrangements. Professional services yield lower margins than subscriptions due to the labor-intensive nature of such services. We also have partners who implement our solutions for which we do not receive professional services revenue.
As of January 31, 2015, we had approximately 194,000 subscribers, compared to approximately 140,000 subscribers at January 31, 2014, an increase of approximately 39%. We estimate that during the 2014 calendar year approximately 24% of the payees whose compensation was administered through our solution were in non-sales roles. No single customer accounted for more than 5% of our revenue for the fiscal year ended January 31, 2013, 2014 or 2015. Within our customer base, deployments range from implementations within a single division or geography to enterprise-wide or global deployments. Our growth to date has been a function of growth in new customers, new subscribers at current customers and sales of additional modules to current customers. While approximately 54% of our customers were enterprise and mid-market companies as of January 31, 2015, we derived approximately 91% of our revenue from enterprise and mid-market customers for the fiscal year ended January 31, 2015. We define our enterprise customers as those customers with a minimum of 4,000 employees and our mid-market customers as those customers with at least 350 and less than 4,000 employees. We have sold our solutions to customers in a number of industry verticals, including business & financial services, communications, high-tech manufacturing, life sciences, media & internet and SaaS & traditional software.
We had total revenue of $36.3 million, $47.2 million and $61.1 million for the fiscal years ended January 31, 2013, 2014 and 2015, respectively, resulting in year-over-year increases of 30% and 29%. Our subscription revenue for the fiscal years ended January 31, 2013, 2014 and 2015 was $27.5 million, $35.9 million and $47.3 million, respectively, resulting in year-over-year increases of 30% and 32%. In addition, for the three months ended April 30, 2014 and 2015, our total revenue was $15.3 million and $17.8 million, respectively, resulting in a period-over-period increase of 17%. Our subscription revenue for the three months ended April 30, 2014 and 2015 was $11.1 million and $13.5 million, respectively, resulting in a period-over-period increase of 22%. We have made and expect to continue to make significant investments to support our growth and our transition to becoming a public company, and accordingly have incurred net losses of $9.4 million, $14.5 million and $18.5 million for the fiscal years ended January 31, 2013, 2014 and 2015, respectively. For the three months ended April 30, 2014 and 2015, our net losses were $3.9 million and $5.0 million, respectively. We expect to incur losses for the foreseeable future and may not be able to achieve or sustain profitability.
In May 2015, we established the XactlyOne Foundation as a non-profit organization, and we issued 50,000 shares of our common stock to it. The proposed programs of the XactlyOne Foundation include grants, volunteerism and other projects. We believe the XactlyOne Foundation will foster employee morale, strengthen our community presence and provide increased brand visibility. We will incur a non-cash expense in the quarter ending July 31, 2015 equal to the fair value of the shares of our common stock issued to the XactlyOne Foundation.
48
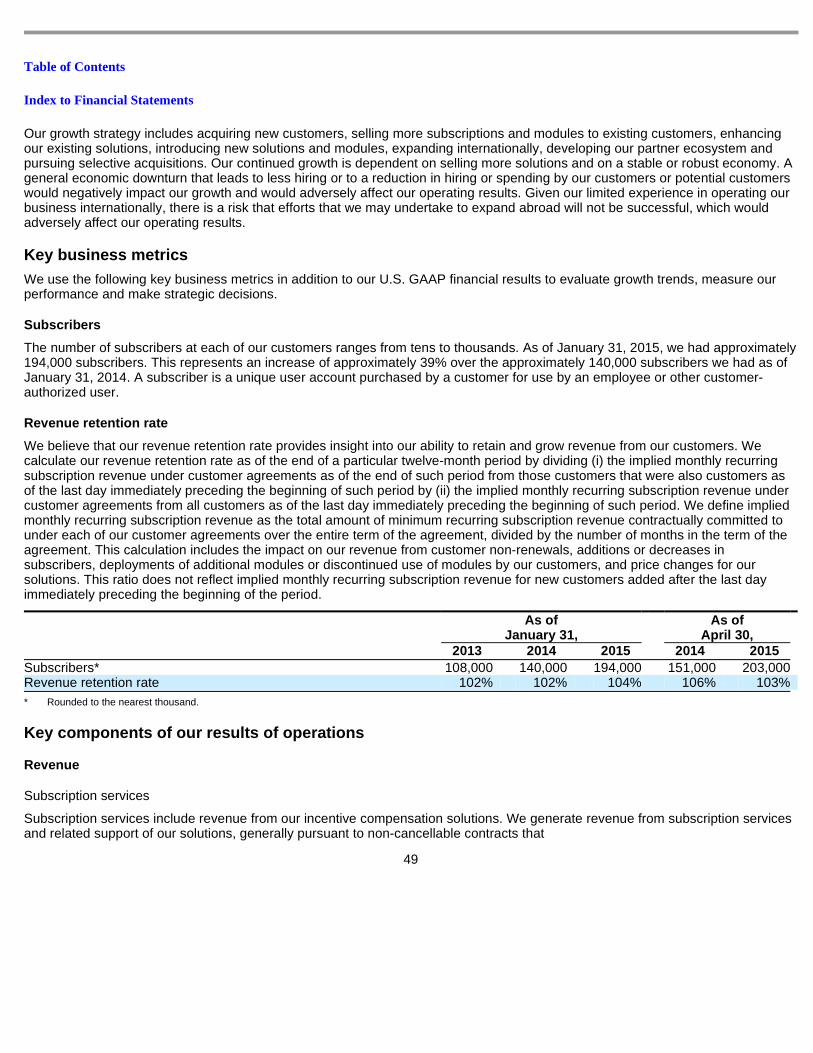
Table of Contents
Index to Financial Statements
Our growth strategy includes acquiring new customers, selling more subscriptions and modules to existing customers, enhancing our existing solutions, introducing new solutions and modules, expanding internationally, developing our partner ecosystem and pursuing selective acquisitions. Our continued growth is dependent on selling more solutions and on a stable or robust economy. A general economic downturn that leads to less hiring or to a reduction in hiring or spending by our customers or potential customers would negatively impact our growth and would adversely affect our operating results. Given our limited experience in operating our business internationally, there is a risk that efforts that we may undertake to expand abroad will not be successful, which would adversely affect our operating results.
Key business metrics
We use the following key business metrics in addition to our U.S. GAAP financial results to evaluate growth trends, measure our performance and make strategic decisions.
Subscribers
The number of subscribers at each of our customers ranges from tens to thousands. As of January 31, 2015, we had approximately 194,000 subscribers. This represents an increase of approximately 39% over the approximately 140,000 subscribers we had as of January 31, 2014. A subscriber is a unique user account purchased by a customer for use by an employee or other customer-authorized user.
Revenue retention rate
We believe that our revenue retention rate provides insight into our ability to retain and grow revenue from our customers. We calculate our revenue retention rate as of the end of a particular twelve-month period by dividing (i) the implied monthly recurring subscription revenue under customer agreements as of the end of such period from those customers that were also customers as of the last day immediately preceding the beginning of such period by (ii) the implied monthly recurring subscription revenue under customer agreements from all customers as of the last day immediately preceding the beginning of such period. We define implied monthly recurring subscription revenue as the total amount of minimum recurring subscription revenue contractually committed to under each of our customer agreements over the entire term of the agreement, divided by the number of months in the term of the agreement. This calculation includes the impact on our revenue from customer non-renewals, additions or decreases in subscribers, deployments of additional modules or discontinued use of modules by our customers, and price changes for our solutions. This ratio does not reflect implied monthly recurring subscription revenue for new customers added after the last day immediately preceding the beginning of the period.
Key components of our results of operations
Revenue
Subscription services
Subscription services include revenue from our incentive compensation solutions. We generate revenue from subscription services and related support of our solutions, generally pursuant to non-cancellable contracts that
49
As of January 31,
As of April 30,
2013 2014 2015 2014 2015
Subscribers* 108,000 140,000 194,000 151,000 203,000 Revenue retention rate 102% 102% 104% 106% 103%
* Rounded to the nearest thousand.
Table of Contents
Index to Financial Statements
range in duration from one to three years. We typically invoice customers in advance in annual installments for our subscription services. We recognize subscription services revenue ratably over the term of the subscription. Amounts billed in excess of revenue recognized for the period are reported as deferred revenue on our consolidated balance sheet.
Professional services
Professional services include revenue from assisting customers in implementing and optimizing use of our incentive compensation solutions. These services include application configuration, system integration, data transformation and automation services, education and training services and strategic services.
Our professional services are billed predominantly on a time-and-materials basis, with some services billed on a fixed-fee basis. We generally invoice customers monthly as the work is performed for time-and-materials arrangements or on a milestone basis for fixed-fee arrangements. We recognize professional services revenue as the services are performed using the proportional-performance method, with performance based on hours of work performed or upon project completion for certain fixed-fee contracts.
Cost of revenue
Subscription services
Our cost of subscription services consists primarily of data center capacity costs, personnel costs for our data center and customer support departments, software and maintenance costs, third-party royalties and other outside services associated with delivery of our subscription services. In addition, our cost of subscription services includes allocated depreciation and amortization, facilities, insurance and rent expenses.
Professional services
Cost of professional services consists primarily of personnel costs for our professional services delivery team as well as other outside services associated with supplementing our internal staff. In addition, our cost of professional services includes allocated depreciation, facilities, insurance and rent expenses.
Operating expenses
We classify our operating expenses as research and development, sales and marketing, general and administrative expenses and amortization of intangibles.
Research and development expenses consist primarily of personnel costs and outside services. In addition, research and development expenses include allocated depreciation, facilities, insurance and rent expenses. We believe that continued investment in our solutions is important for our growth. We expect our research and development expenses to continue to increase in dollar amount for the foreseeable future, and these expenses may also increase as a percentage of our total revenue, at least in the near term.
Sales and marketing expenses consist primarily of personnel costs, sales commissions, customer-focused events and travel-related expenses. In addition, sales and marketing expenses include allocated depreciation, facilities, insurance and rent expenses. We expect our sales and marketing expenses to continue to increase in dollar amount for the foreseeable future as we expand our sales and marketing efforts domestically and internationally, and these expenses also may increase as a percentage of our total revenue, at least in the near term.
General and administrative expenses consist primarily of personnel costs for finance, accounting, legal, human resources and management information systems personnel. In addition, general and administrative expenses
50
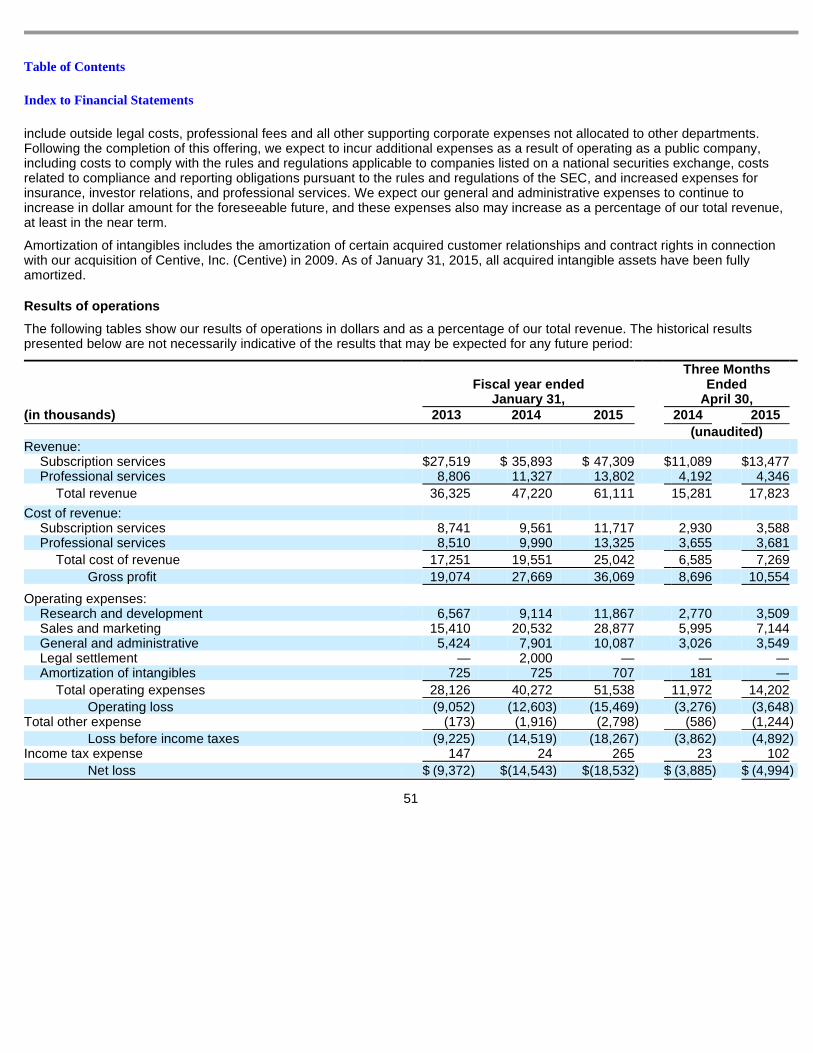
Table of Contents
Index to Financial Statements
include outside legal costs, professional fees and all other supporting corporate expenses not allocated to other departments. Following the completion of this offering, we expect to incur additional expenses as a result of operating as a public company, including costs to comply with the rules and regulations applicable to companies listed on a national securities exchange, costs related to compliance and reporting obligations pursuant to the rules and regulations of the SEC, and increased expenses for insurance, investor relations, and professional services. We expect our general and administrative expenses to continue to increase in dollar amount for the foreseeable future, and these expenses also may increase as a percentage of our total revenue, at least in the near term.
Amortization of intangibles includes the amortization of certain acquired customer relationships and contract rights in connection with our acquisition of Centive, Inc. (Centive) in 2009. As of January 31, 2015, all acquired intangible assets have been fully amortized.
Results of operations
The following tables show our results of operations in dollars and as a percentage of our total revenue. The historical results presented below are not necessarily indicative of the results that may be expected for any future period:
51
Fiscal year ended January 31,
Three Months Ended
April 30,
(in thousands) 2013 2014 2015 2014 2015
(unaudited)
Revenue:
Subscription services $ 27,519 $ 35,893 $ 47,309 $ 11,089 $ 13,477 Professional services 8,806 11,327 13,802 4,192 4,346
Total revenue 36,325 47,220 61,111 15,281 17,823
Cost of revenue:
Subscription services 8,741 9,561 11,717 2,930 3,588 Professional services 8,510 9,990 13,325 3,655 3,681
Total cost of revenue 17,251 19,551 25,042 6,585 7,269
Gross profit 19,074 27,669 36,069 8,696 10,554
Operating expenses:
Research and development 6,567 9,114 11,867 2,770 3,509 Sales and marketing 15,410 20,532 28,877 5,995 7,144 General and administrative 5,424 7,901 10,087 3,026 3,549 Legal settlement — 2,000 — — — Amortization of intangibles 725 725 707 181 —
Total operating expenses 28,126 40,272 51,538 11,972 14,202
Operating loss (9,052 ) (12,603 ) (15,469 ) (3,276 ) (3,648 ) Total other expense (173 ) (1,916 ) (2,798 ) (586 ) (1,244 )
Loss before income taxes (9,225 ) (14,519 ) (18,267 ) (3,862 ) (4,892 ) Income tax expense 147 24 265 23 102
Net loss $ (9,372 ) $ (14,543 ) $ (18,532 ) $ (3,885 ) $ (4,994 )
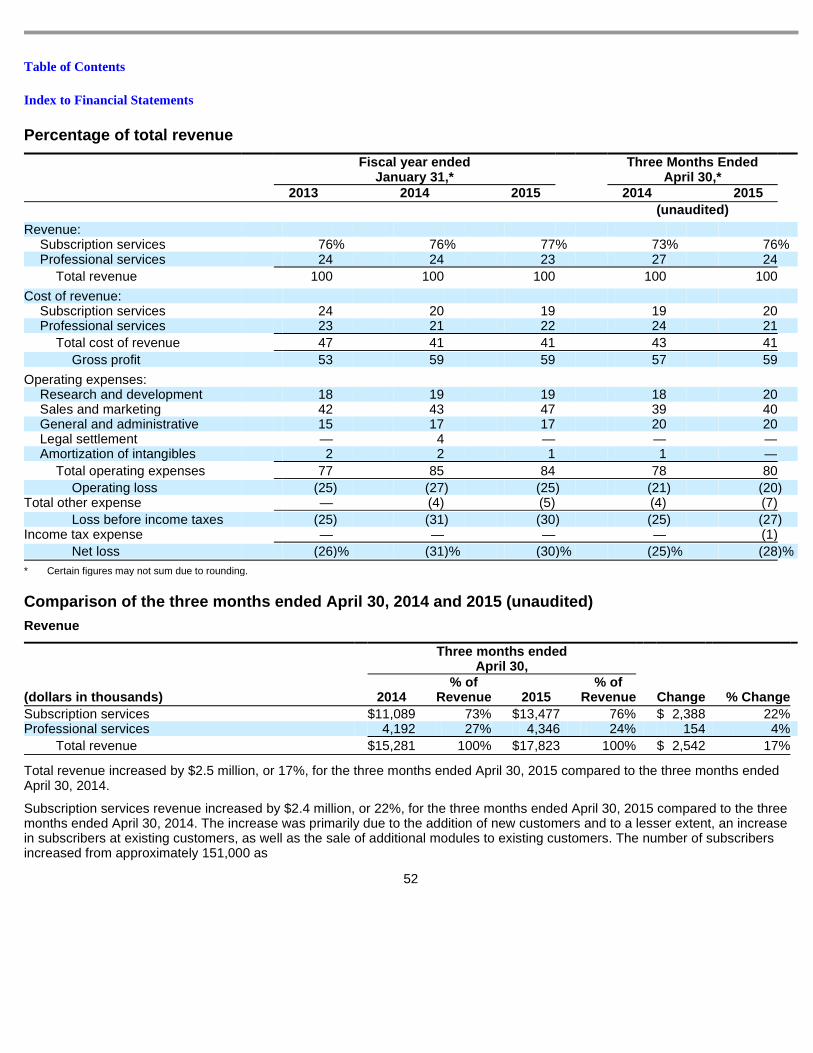
Table of Contents
Index to Financial Statements
Percentage of total revenue
Comparison of the three months ended April 30, 2014 and 2015 (unaudited)
Revenue
Total revenue increased by $2.5 million, or 17%, for the three months ended April 30, 2015 compared to the three months ended April 30, 2014.
Subscription services revenue increased by $2.4 million, or 22%, for the three months ended April 30, 2015 compared to the three months ended April 30, 2014. The increase was primarily due to the addition of new customers and to a lesser extent, an increase in subscribers at existing customers, as well as the sale of additional modules to existing customers. The number of subscribers increased from approximately 151,000 as
52
Fiscal year ended January 31,*
Three Months Ended April 30,*
2013 2014 2015 2014 2015
(unaudited)
Revenue:
Subscription services 76 % 76 % 77 % 73 % 76 % Professional services 24 24 23 27 24
Total revenue 100 100 100 100 100
Cost of revenue:
Subscription services 24 20 19 19 20 Professional services 23 21 22 24 21
Total cost of revenue 47 41 41 43 41
Gross profit 53 59 59 57 59
Operating expenses:
Research and development 18 19 19 18 20 Sales and marketing 42 43 47 39 40 General and administrative 15 17 17 20 20 Legal settlement — 4 — — — Amortization of intangibles 2 2 1 1 —
Total operating expenses 77 85 84 78 80
Operating loss (25 ) (27 ) (25 ) (21 ) (20 ) Total other expense — (4) (5) (4) (7)
Loss before income taxes (25 ) (31 ) (30 ) (25 ) (27 ) Income tax expense — — — — (1)
Net loss (26 )% (31 )% (30 )% (25 )% (28 )%
* Certain figures may not sum due to rounding.
Three months ended April 30,
(dollars in thousands) 2014
% of Revenue 2015
% of Revenue Change % Change
Subscription services $ 11,089 73% $ 13,477 76% $ 2,388 22% Professional services 4,192 27% 4,346 24% 154 4%
Total revenue $ 15,281 100% $ 17,823 100% $ 2,542 17%
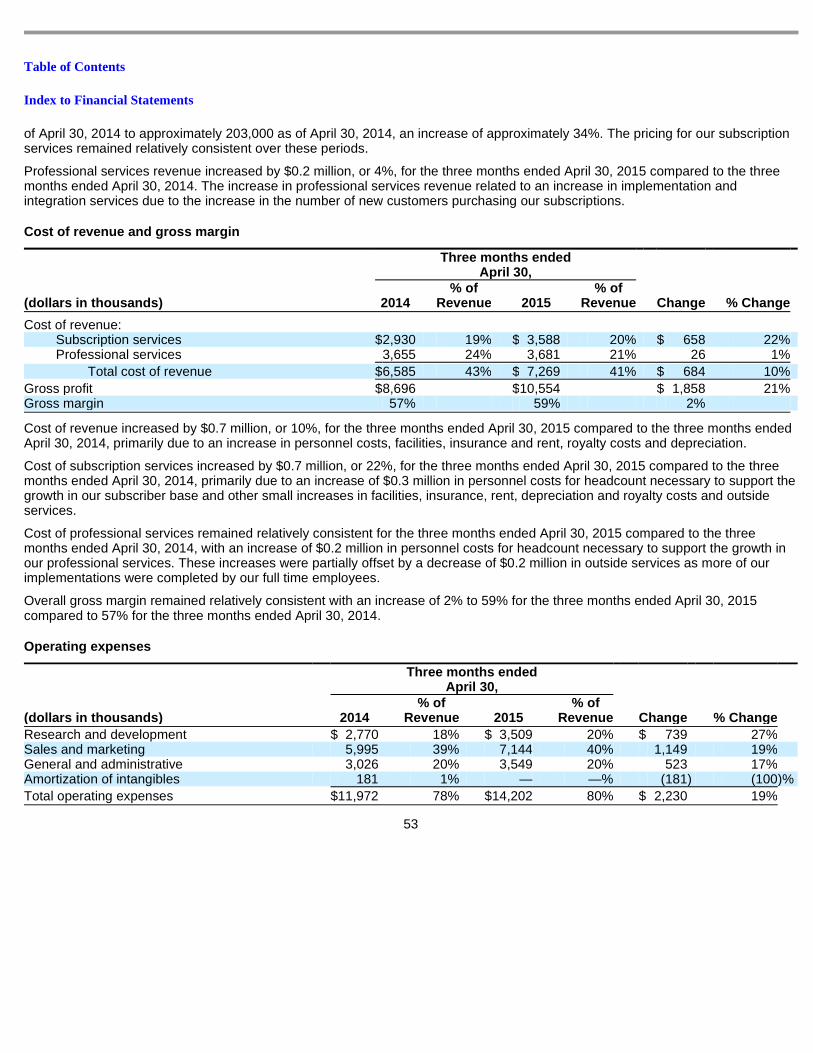
Table of Contents
Index to Financial Statements
of April 30, 2014 to approximately 203,000 as of April 30, 2014, an increase of approximately 34%. The pricing for our subscription services remained relatively consistent over these periods.
Professional services revenue increased by $0.2 million, or 4%, for the three months ended April 30, 2015 compared to the three months ended April 30, 2014. The increase in professional services revenue related to an increase in implementation and integration services due to the increase in the number of new customers purchasing our subscriptions.
Cost of revenue and gross margin
Cost of revenue increased by $0.7 million, or 10%, for the three months ended April 30, 2015 compared to the three months ended April 30, 2014, primarily due to an increase in personnel costs, facilities, insurance and rent, royalty costs and depreciation.
Cost of subscription services increased by $0.7 million, or 22%, for the three months ended April 30, 2015 compared to the three months ended April 30, 2014, primarily due to an increase of $0.3 million in personnel costs for headcount necessary to support the growth in our subscriber base and other small increases in facilities, insurance, rent, depreciation and royalty costs and outside services.
Cost of professional services remained relatively consistent for the three months ended April 30, 2015 compared to the three months ended April 30, 2014, with an increase of $0.2 million in personnel costs for headcount necessary to support the growth in our professional services. These increases were partially offset by a decrease of $0.2 million in outside services as more of our implementations were completed by our full time employees.
Overall gross margin remained relatively consistent with an increase of 2% to 59% for the three months ended April 30, 2015 compared to 57% for the three months ended April 30, 2014.
Operating expenses
53
Three months ended April 30,
(dollars in thousands) 2014
% of Revenue 2015
% of Revenue Change % Change
Cost of revenue:
Subscription services $ 2,930 19% $ 3,588 20% $ 658 22% Professional services 3,655 24% 3,681 21% 26 1%
Total cost of revenue $ 6,585 43% $ 7,269 41% $ 684 10%
Gross profit $ 8,696 $ 10,554 $ 1,858 21% Gross margin 57% 59% 2%
Three months ended April 30,
(dollars in thousands) 2014
% of Revenue 2015
% of Revenue Change % Change
Research and development $ 2,770 18% $ 3,509 20% $ 739 27% Sales and marketing 5,995 39% 7,144 40% 1,149 19% General and administrative 3,026 20% 3,549 20% 523 17% Amortization of intangibles 181 1% — —% (181 ) (100 )%
Total operating expenses $ 11,972 78% $ 14,202 80% $ 2,230 19%
Table of Contents
Index to Financial Statements
Research and development expenses increased by $0.7 million, or 27%, for the three months ended April 30, 2015 compared to the three months ended April 30, 2014, primarily due to an increase in personnel costs of $0.5 million related to increases in headcount to support our development and product management teams and smaller increases in facilities and expensed equipment due to our headcount growth.
Sales and marketing expenses increased by $1.1 million, or 19%, for the three months ended April 30, 2015 compared to the three months ended April 30, 2014, primarily due to an increase in personnel costs of $0.9 million related to an increase in headcount. There was an increase in variable costs of $0.2 million due to increases in targeted marketing and promotions costs related to lead generation, brand awareness, and customer marketing as well as commission expenses. In addition, the growth in our sales and marketing departments led to increases in facilities, other employee related travel, software, equipment and depreciation costs of $0.3 million. These increases were offset by a decrease of $0.2 million in other employee costs related to the timing of certain sales group meetings.
General and administrative expenses increased by $0.5 million, or 17%, for the three months ended April 30, 2015 compared to the three months ended April 30, 2014, primarily due to an increase of $0.9 million in non-recurring costs related to the early exit from our former headquarters and $0.2 million in personnel costs related to an increase in headcount and travel to support the continued growth of the company. These increases were partially offset by a decrease in professional fees of $0.6 million.
Amortization of intangibles decreased by $0.2 million, or 100%, for the three months ended April 30, 2015 compared to the three months ended April 30, 2014. As of January 31, 2015, the entire intangible asset balance has been fully amortized.
Total other income (expense)
Interest expense increased by $0.7 million for the three months ended April 30, 2015 compared to the three months ended April 30, 2014, primarily due to interest accrued on a larger outstanding principal balance under our credit facilities as well as the non-cash amortization of the debt discount related to the warrants issued in November 2014 being amortized over the term of the related debt facility.
54
Three months ended April 30,
(dollars in thousands) 2014
% of Revenue 2015
% of Revenue Change % Change
Interest expense $ (575 ) (4 )% $ (1,296 ) (7 )% $ (721 ) 125 % (Increase) decrease in fair value of
preferred stock warrant liabilities 3 —% 55 —% 52 NM Other income (expense), net (14 ) —% (3 ) —% 11 (79 )%
Total other income (expense) $ (586 ) (4 )% $ (1,244 ) (7 )% $ (658 ) 112 %
Table of Contents
Index to Financial Statements
Comparison of the fiscal years ended January 31, 20 14 and 2015
Revenue
Total revenue increased by $13.9 million, or 29%, for the fiscal year ended January 31, 2015 compared to the fiscal year ended January 31, 2014.
Subscription services revenue increased by $11.4 million, or 32%, for the fiscal year ended January 31, 2015 compared to the fiscal year ended January 31, 2014. The increase was primarily due to the addition of new customers and to a lesser extent, an increase in subscribers at existing customers, as well as the sale of additional products and modules to existing customers. The number of subscribers increased from approximately 140,000 as of January 31, 2014 to approximately 194,000 as of January 31, 2015, an increase of approximately 39%. The pricing for our subscription services remained relatively consistent over these periods.
Professional services revenue increased by $2.5 million, or 22%, for the fiscal year ended January 31, 2015 compared to the fiscal year ended January 31, 2014. The increase in professional services revenue related to an increase in implementation and integration services related to the increase in the number of new customers purchasing our subscriptions.
Cost of revenue and gross margin
Cost of revenue increased by $5.5 million, or 28%, for the fiscal year ended January 31, 2015 compared to the fiscal year ended January 31, 2014, primarily due to an increase in personnel costs, royalty costs, outside services and depreciation.
Cost of subscription services increased by $2.2 million, or 23%, for the fiscal year ended January 31, 2015 compared to the fiscal year ended January 31, 2014, primarily due to an increase of $1.0 million in personnel costs for headcount necessary to support the growth in our subscriber base, a $0.7 million increase in royalty costs and a $0.4 million increase in depreciation.
55
Fiscal year ended January 31,
(dollars in thousands) 2014
% of Revenue 2015
% of Revenue Change % Change
Subscription services $ 35,893 76% $ 47,309 77% $ 11,416 32% Professional services 11,327 24% 13,802 23% 2,475 22%
Total revenue $ 47,220 100% $ 61,111 100% $ 13,891 29%
Fiscal year ended January 31,
(dollars in thousands) 2014
% of Revenue 2015
% of Revenue Change % Change
Cost of revenue:
Subscription services $ 9,561 20% $ 11,717 19% $ 2,156 23% Professional services 9,990 21% 13,325 22% 3,335 33%
Total cost of revenue $ 19,551 41% $ 25,042 41% $ 5,491 28%
Gross profit $ 27,669 $ 36,069 $ 8,400 30% Gross margin 59% 59% —%
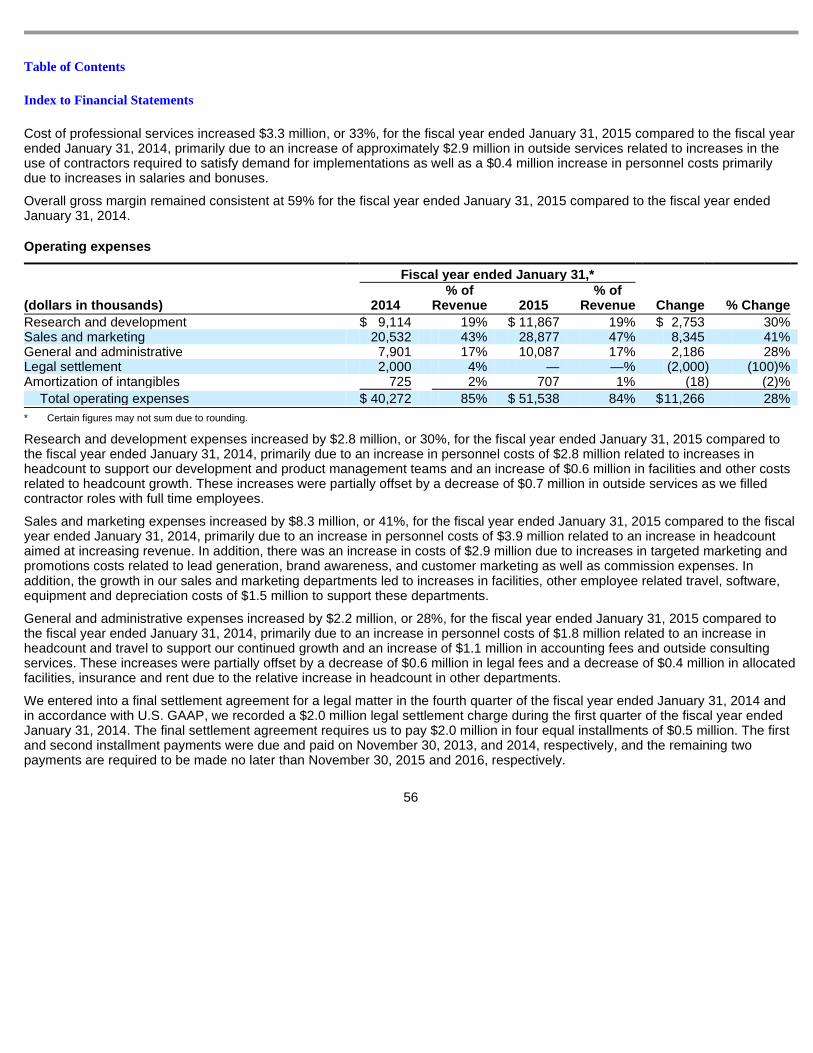
Table of Contents
Index to Financial Statements
Cost of professional services increased $3.3 million, or 33%, for the fiscal year ended January 31, 2015 compared to the fiscal year ended January 31, 2014, primarily due to an increase of approximately $2.9 million in outside services related to increases in the use of contractors required to satisfy demand for implementations as well as a $0.4 million increase in personnel costs primarily due to increases in salaries and bonuses.
Overall gross margin remained consistent at 59% for the fiscal year ended January 31, 2015 compared to the fiscal year ended January 31, 2014.
Operating expenses
Research and development expenses increased by $2.8 million, or 30%, for the fiscal year ended January 31, 2015 compared to the fiscal year ended January 31, 2014, primarily due to an increase in personnel costs of $2.8 million related to increases in headcount to support our development and product management teams and an increase of $0.6 million in facilities and other costs related to headcount growth. These increases were partially offset by a decrease of $0.7 million in outside services as we filled contractor roles with full time employees.
Sales and marketing expenses increased by $8.3 million, or 41%, for the fiscal year ended January 31, 2015 compared to the fiscal year ended January 31, 2014, primarily due to an increase in personnel costs of $3.9 million related to an increase in headcount aimed at increasing revenue. In addition, there was an increase in costs of $2.9 million due to increases in targeted marketing and promotions costs related to lead generation, brand awareness, and customer marketing as well as commission expenses. In addition, the growth in our sales and marketing departments led to increases in facilities, other employee related travel, software, equipment and depreciation costs of $1.5 million to support these departments.
General and administrative expenses increased by $2.2 million, or 28%, for the fiscal year ended January 31, 2015 compared to the fiscal year ended January 31, 2014, primarily due to an increase in personnel costs of $1.8 million related to an increase in headcount and travel to support our continued growth and an increase of $1.1 million in accounting fees and outside consulting services. These increases were partially offset by a decrease of $0.6 million in legal fees and a decrease of $0.4 million in allocated facilities, insurance and rent due to the relative increase in headcount in other departments.
We entered into a final settlement agreement for a legal matter in the fourth quarter of the fiscal year ended January 31, 2014 and in accordance with U.S. GAAP, we recorded a $2.0 million legal settlement charge during the first quarter of the fiscal year ended January 31, 2014. The final settlement agreement requires us to pay $2.0 million in four equal installments of $0.5 million. The first and second installment payments were due and paid on November 30, 2013, and 2014, respectively, and the remaining two payments are required to be made no later than November 30, 2015 and 2016, respectively.
56
Fiscal year ended January 31,*
(dollars in thousands) 2014
% of Revenue 2015
% of Revenue Change % Change
Research and development $ 9,114 19% $ 11,867 19% $ 2,753 30% Sales and marketing 20,532 43% 28,877 47% 8,345 41% General and administrative 7,901 17% 10,087 17% 2,186 28% Legal settlement 2,000 4% — —% (2,000 ) (100)% Amortization of intangibles 725 2% 707 1% (18 ) (2)%
Total operating expenses $ 40,272 85% $ 51,538 84% $ 11,266 28%
* Certain figures may not sum due to rounding.
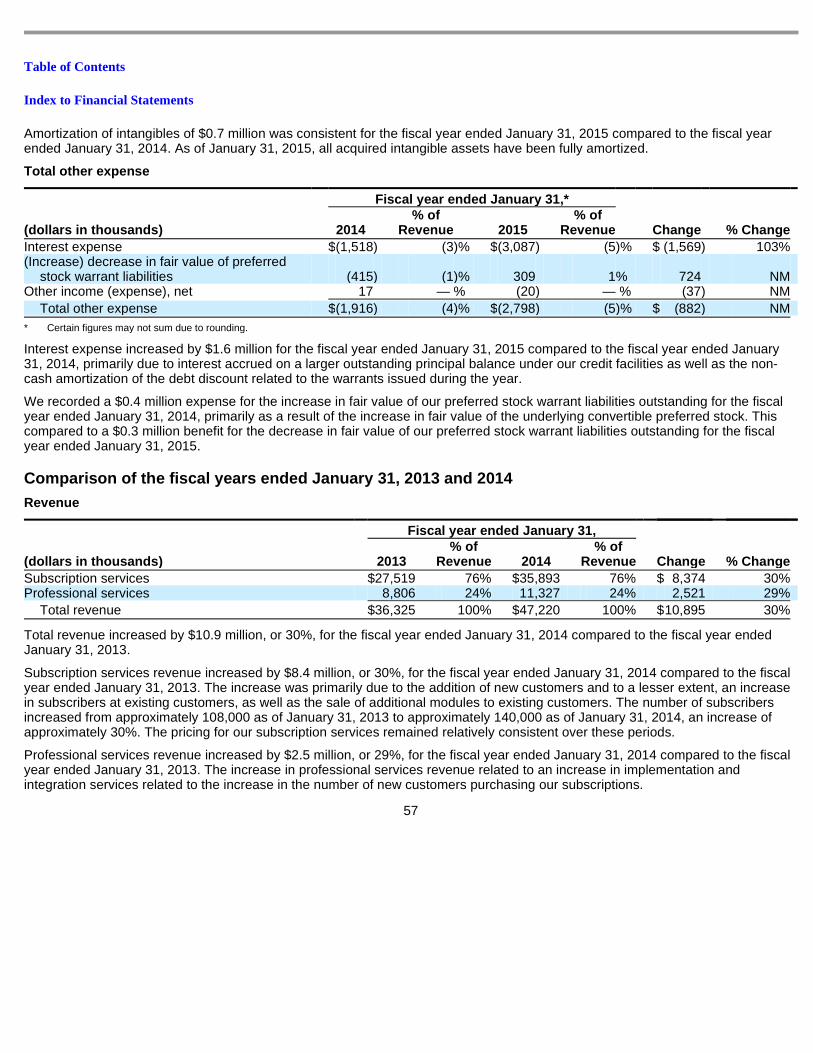
Table of Contents
Index to Financial Statements
Amortization of intangibles of $0.7 million was consistent for the fiscal year ended January 31, 2015 compared to the fiscal year ended January 31, 2014. As of January 31, 2015, all acquired intangible assets have been fully amortized.
Total other expense
Interest expense increased by $1.6 million for the fiscal year ended January 31, 2015 compared to the fiscal year ended January 31, 2014, primarily due to interest accrued on a larger outstanding principal balance under our credit facilities as well as the non-cash amortization of the debt discount related to the warrants issued during the year.
We recorded a $0.4 million expense for the increase in fair value of our preferred stock warrant liabilities outstanding for the fiscal year ended January 31, 2014, primarily as a result of the increase in fair value of the underlying convertible preferred stock. This compared to a $0.3 million benefit for the decrease in fair value of our preferred stock warrant liabilities outstanding for the fiscal year ended January 31, 2015.
Comparison of the fiscal years ended January 31, 20 13 and 2014
Revenue
Total revenue increased by $10.9 million, or 30%, for the fiscal year ended January 31, 2014 compared to the fiscal year ended January 31, 2013.
Subscription services revenue increased by $8.4 million, or 30%, for the fiscal year ended January 31, 2014 compared to the fiscal year ended January 31, 2013. The increase was primarily due to the addition of new customers and to a lesser extent, an increase in subscribers at existing customers, as well as the sale of additional modules to existing customers. The number of subscribers increased from approximately 108,000 as of January 31, 2013 to approximately 140,000 as of January 31, 2014, an increase of approximately 30%. The pricing for our subscription services remained relatively consistent over these periods.
Professional services revenue increased by $2.5 million, or 29%, for the fiscal year ended January 31, 2014 compared to the fiscal year ended January 31, 2013. The increase in professional services revenue related to an increase in implementation and integration services related to the increase in the number of new customers purchasing our subscriptions.
57
Fiscal year ended January 31,*
(dollars in thousands) 2014
% of Revenue 2015
% of Revenue Change % Change
Interest expense $ (1,518 ) (3 )% $ (3,087 ) (5 )% $ (1,569 ) 103% (Increase) decrease in fair value of preferred
stock warrant liabilities (415 ) (1 )% 309 1 % 724 NM Other income (expense), net 17 — % (20 ) — % (37 ) NM
Total other expense $ (1,916 ) (4 )% $ (2,798 ) (5 )% $ (882 ) NM
* Certain figures may not sum due to rounding.
Fiscal year ended January 31,
Change
% Change (dollars in thousands) 2013
% of Revenue 2014
% of Revenue
Subscription services $ 27,519 76% $ 35,893 76% $ 8,374 30% Professional services 8,806 24% 11,327 24% 2,521 29%
Total revenue $ 36,325 100% $ 47,220 100% $ 10,895 30%
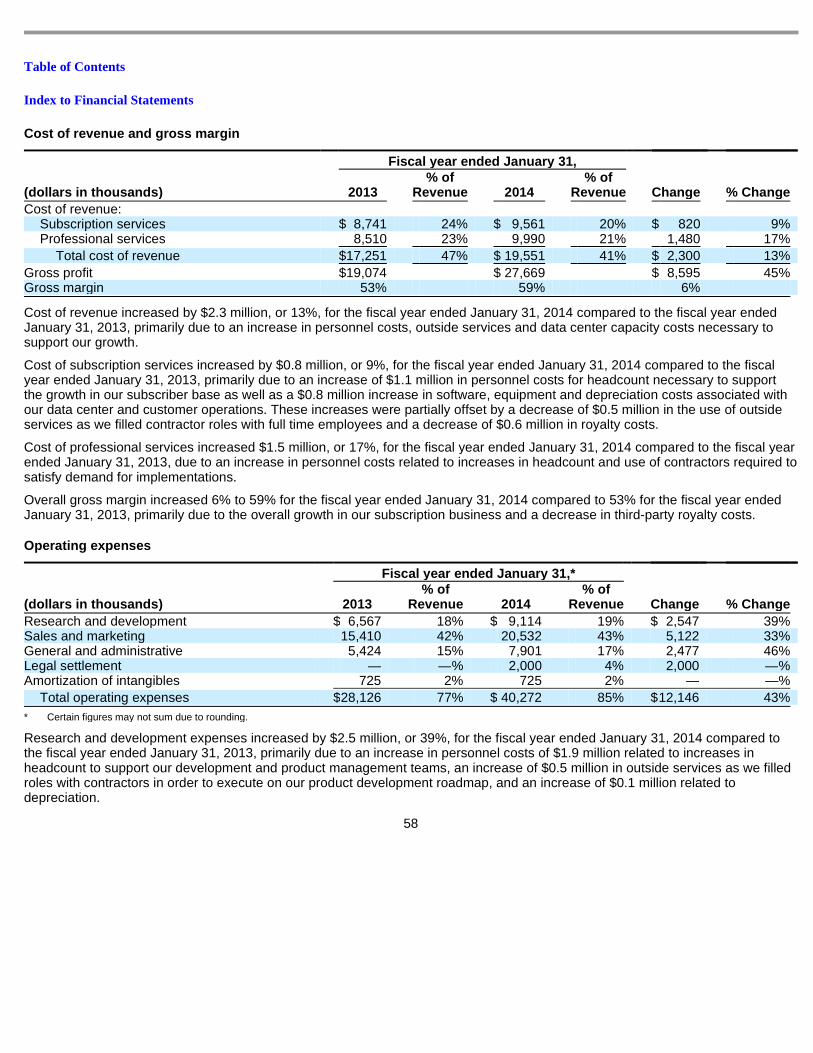
Table of Contents
Index to Financial Statements
Cost of revenue and gross margin
Cost of revenue increased by $2.3 million, or 13%, for the fiscal year ended January 31, 2014 compared to the fiscal year ended January 31, 2013, primarily due to an increase in personnel costs, outside services and data center capacity costs necessary to support our growth.
Cost of subscription services increased by $0.8 million, or 9%, for the fiscal year ended January 31, 2014 compared to the fiscal year ended January 31, 2013, primarily due to an increase of $1.1 million in personnel costs for headcount necessary to support the growth in our subscriber base as well as a $0.8 million increase in software, equipment and depreciation costs associated with our data center and customer operations. These increases were partially offset by a decrease of $0.5 million in the use of outside services as we filled contractor roles with full time employees and a decrease of $0.6 million in royalty costs.
Cost of professional services increased $1.5 million, or 17%, for the fiscal year ended January 31, 2014 compared to the fiscal year ended January 31, 2013, due to an increase in personnel costs related to increases in headcount and use of contractors required to satisfy demand for implementations.
Overall gross margin increased 6% to 59% for the fiscal year ended January 31, 2014 compared to 53% for the fiscal year ended January 31, 2013, primarily due to the overall growth in our subscription business and a decrease in third-party royalty costs.
Operating expenses
Research and development expenses increased by $2.5 million, or 39%, for the fiscal year ended January 31, 2014 compared to the fiscal year ended January 31, 2013, primarily due to an increase in personnel costs of $1.9 million related to increases in headcount to support our development and product management teams, an increase of $0.5 million in outside services as we filled roles with contractors in order to execute on our product development roadmap, and an increase of $0.1 million related to depreciation.
58
Fiscal year ended January 31,
Change
% Change (dollars in thousands) 2013
% of Revenue 2014
% of Revenue
Cost of revenue:
Subscription services $ 8,741 24% $ 9,561 20% $ 820 9% Professional services 8,510 23% 9,990 21% 1,480 17%
Total cost of revenue $ 17,251 47% $ 19,551 41% $ 2,300 13%
Gross profit $ 19,074 $ 27,669 $ 8,595 45% Gross margin 53% 59% 6%
Fiscal year ended January 31,*
Change
% Change (dollars in thousands) 2013
% of Revenue 2014
% of Revenue
Research and development $ 6,567 18% $ 9,114 19% $ 2,547 39% Sales and marketing 15,410 42% 20,532 43% 5,122 33% General and administrative 5,424 15% 7,901 17% 2,477 46% Legal settlement — —% 2,000 4% 2,000 —% Amortization of intangibles 725 2% 725 2% — —%
Total operating expenses $ 28,126 77% $ 40,272 85% $ 12,146 43%
* Certain figures may not sum due to rounding.
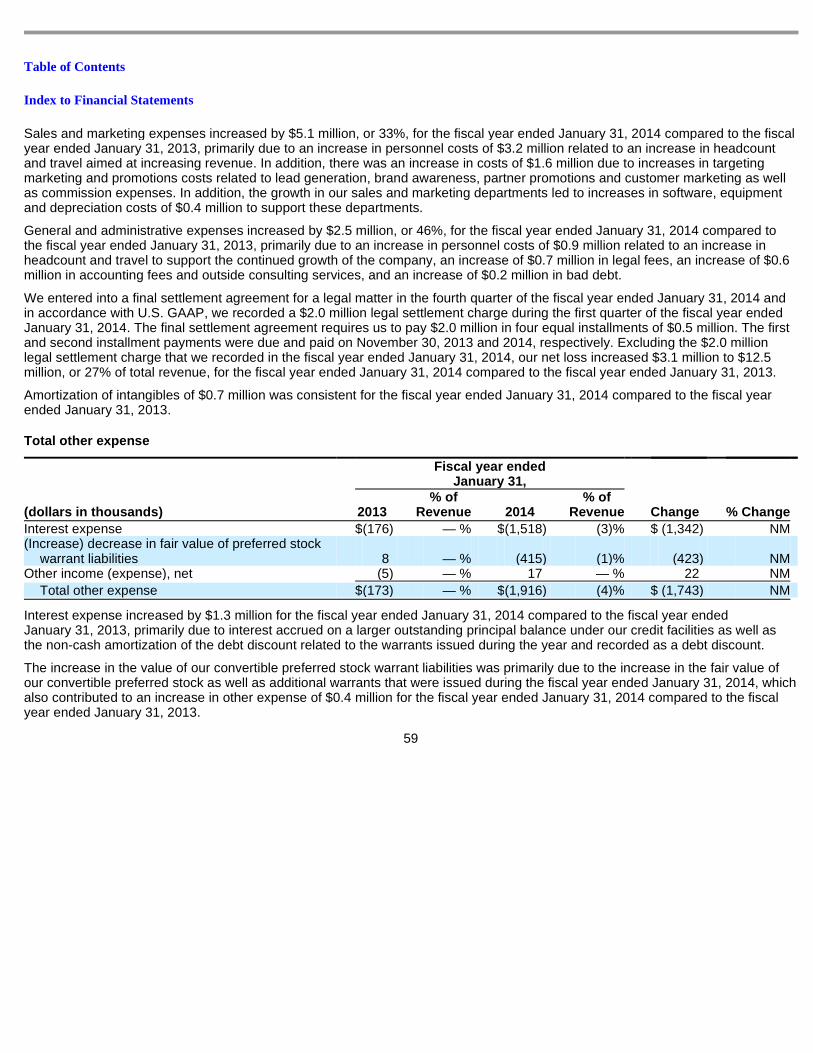
Table of Contents
Index to Financial Statements
Sales and marketing expenses increased by $5.1 million, or 33%, for the fiscal year ended January 31, 2014 compared to the fiscal year ended January 31, 2013, primarily due to an increase in personnel costs of $3.2 million related to an increase in headcount and travel aimed at increasing revenue. In addition, there was an increase in costs of $1.6 million due to increases in targeting marketing and promotions costs related to lead generation, brand awareness, partner promotions and customer marketing as well as commission expenses. In addition, the growth in our sales and marketing departments led to increases in software, equipment and depreciation costs of $0.4 million to support these departments.
General and administrative expenses increased by $2.5 million, or 46%, for the fiscal year ended January 31, 2014 compared to the fiscal year ended January 31, 2013, primarily due to an increase in personnel costs of $0.9 million related to an increase in headcount and travel to support the continued growth of the company, an increase of $0.7 million in legal fees, an increase of $0.6 million in accounting fees and outside consulting services, and an increase of $0.2 million in bad debt.
We entered into a final settlement agreement for a legal matter in the fourth quarter of the fiscal year ended January 31, 2014 and in accordance with U.S. GAAP, we recorded a $2.0 million legal settlement charge during the first quarter of the fiscal year ended January 31, 2014. The final settlement agreement requires us to pay $2.0 million in four equal installments of $0.5 million. The first and second installment payments were due and paid on November 30, 2013 and 2014, respectively. Excluding the $2.0 million legal settlement charge that we recorded in the fiscal year ended January 31, 2014, our net loss increased $3.1 million to $12.5 million, or 27% of total revenue, for the fiscal year ended January 31, 2014 compared to the fiscal year ended January 31, 2013.
Amortization of intangibles of $0.7 million was consistent for the fiscal year ended January 31, 2014 compared to the fiscal year ended January 31, 2013.
Total other expense
Interest expense increased by $1.3 million for the fiscal year ended January 31, 2014 compared to the fiscal year ended January 31, 2013, primarily due to interest accrued on a larger outstanding principal balance under our credit facilities as well as the non-cash amortization of the debt discount related to the warrants issued during the year and recorded as a debt discount.
The increase in the value of our convertible preferred stock warrant liabilities was primarily due to the increase in the fair value of our convertible preferred stock as well as additional warrants that were issued during the fiscal year ended January 31, 2014, which also contributed to an increase in other expense of $0.4 million for the fiscal year ended January 31, 2014 compared to the fiscal year ended January 31, 2013.
59
Fiscal year ended January 31,
Change
% Change (dollars in thousands) 2013
% of Revenue 2014
% of Revenue
Interest expense $ (176 ) — % $ (1,518 ) (3)% $ (1,342 ) NM (Increase) decrease in fair value of preferred stock
warrant liabilities 8 — % (415 ) (1)% (423 ) NM Other income (expense), net (5 ) — % 17 — % 22 NM
Total other expense $ (173 ) — % $ (1,916 ) (4)% $ (1,743 ) NM
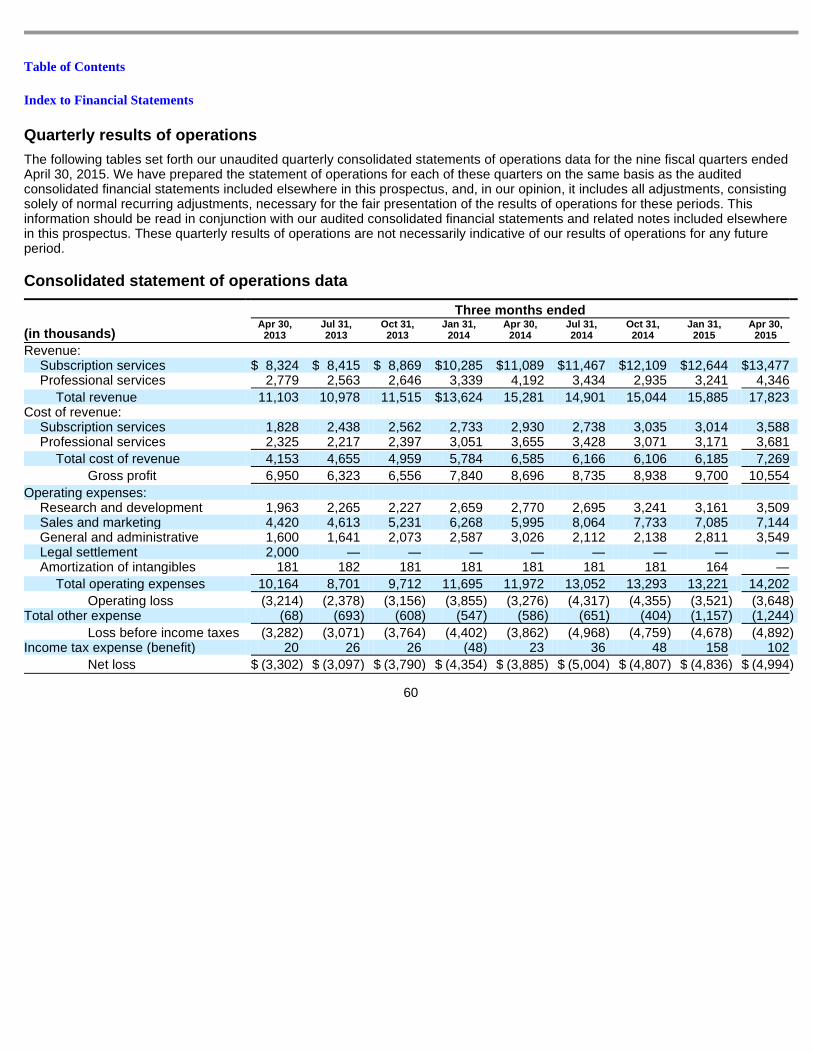
Table of Contents
Index to Financial Statements
Quarterly results of operations
The following tables set forth our unaudited quarterly consolidated statements of operations data for the nine fiscal quarters ended April 30, 2015. We have prepared the statement of operations for each of these quarters on the same basis as the audited consolidated financial statements included elsewhere in this prospectus, and, in our opinion, it includes all adjustments, consisting solely of normal recurring adjustments, necessary for the fair presentation of the results of operations for these periods. This information should be read in conjunction with our audited consolidated financial statements and related notes included elsewhere in this prospectus. These quarterly results of operations are not necessarily indicative of our results of operations for any future period.
Consolidated statement of operations data
60
Three months ended
(in thousands) Apr 30,
2013 Jul 31, 2013
Oct 31, 2013
Jan 31, 2014
Apr 30, 2014
Jul 31, 2014
Oct 31, 2014
Jan 31, 2015
Apr 30, 2015
Revenue:
Subscription services $ 8,324 $ 8,415 $ 8,869 $ 10,285 $ 11,089 $ 11,467 $ 12,109 $ 12,644 $ 13,477 Professional services 2,779 2,563 2,646 3,339 4,192 3,434 2,935 3,241 4,346
Total revenue 11,103 10,978 11,515 $ 13,624 15,281 14,901 15,044 15,885 17,823 Cost of revenue:
Subscription services 1,828 2,438 2,562 2,733 2,930 2,738 3,035 3,014 3,588 Professional services 2,325 2,217 2,397 3,051 3,655 3,428 3,071 3,171 3,681
Total cost of revenue 4,153 4,655 4,959 5,784 6,585 6,166 6,106 6,185 7,269
Gross profit 6,950 6,323 6,556 7,840 8,696 8,735 8,938 9,700 10,554
Operating expenses:
Research and development 1,963 2,265 2,227 2,659 2,770 2,695 3,241 3,161 3,509 Sales and marketing 4,420 4,613 5,231 6,268 5,995 8,064 7,733 7,085 7,144 General and administrative 1,600 1,641 2,073 2,587 3,026 2,112 2,138 2,811 3,549 Legal settlement 2,000 — — — — — — — — Amortization of intangibles 181 182 181 181 181 181 181 164 —
Total operating expenses 10,164 8,701 9,712 11,695 11,972 13,052 13,293 13,221 14,202
Operating loss (3,214 ) (2,378 ) (3,156 ) (3,855 ) (3,276 ) (4,317 ) (4,355 ) (3,521 ) (3,648 ) Total other expense (68 ) (693 ) (608 ) (547 ) (586 ) (651 ) (404 ) (1,157 ) (1,244 )
Loss before income taxes (3,282 ) (3,071 ) (3,764 ) (4,402 ) (3,862 ) (4,968 ) (4,759 ) (4,678 ) (4,892 ) Income tax expense (benefit) 20 26 26 (48 ) 23 36 48 158 102
Net loss $ (3,302 ) $ (3,097 ) $ (3,790 ) $ (4,354 ) $ (3,885 ) $ (5,004 ) $ (4,807 ) $ (4,836 ) $ (4,994 )
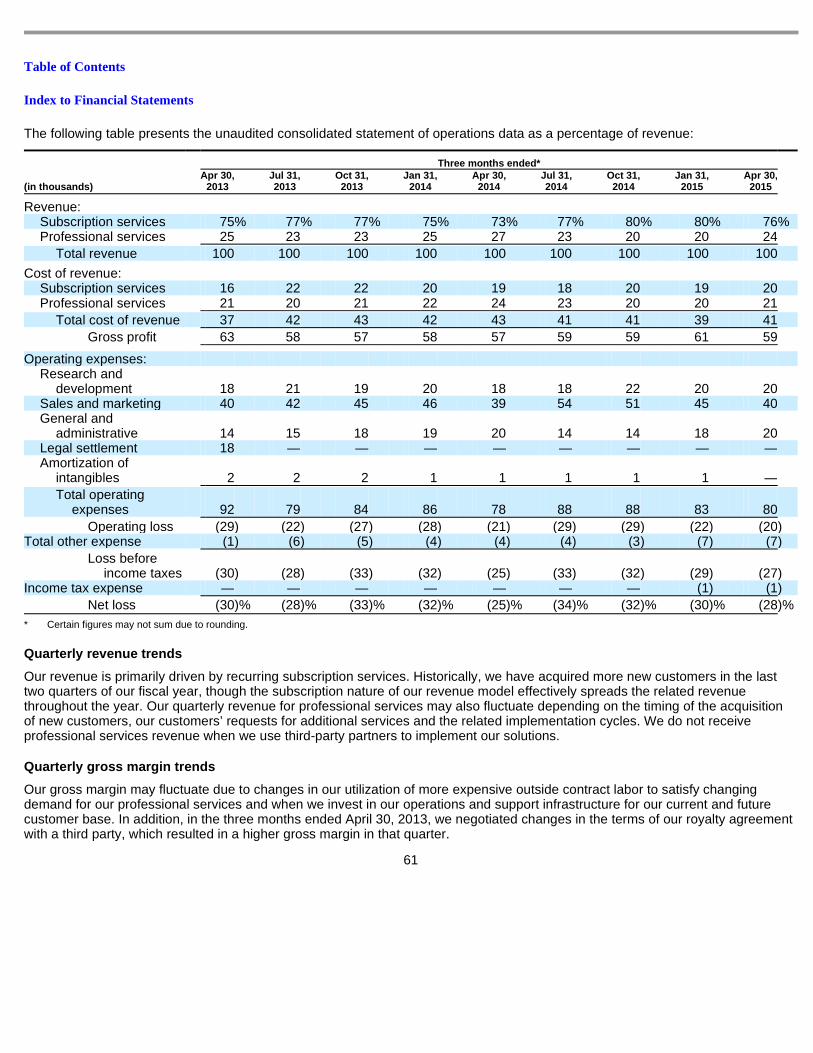
Table of Contents
Index to Financial Statements
The following table presents the unaudited consolidated statement of operations data as a percentage of revenue:
Quarterly revenue trends
Our revenue is primarily driven by recurring subscription services. Historically, we have acquired more new customers in the last two quarters of our fiscal year, though the subscription nature of our revenue model effectively spreads the related revenue throughout the year. Our quarterly revenue for professional services may also fluctuate depending on the timing of the acquisition of new customers, our customers’ requests for additional services and the related implementation cycles. We do not receive professional services revenue when we use third-party partners to implement our solutions.
Quarterly gross margin trends
Our gross margin may fluctuate due to changes in our utilization of more expensive outside contract labor to satisfy changing demand for our professional services and when we invest in our operations and support infrastructure for our current and future customer base. In addition, in the three months ended April 30, 2013, we negotiated changes in the terms of our royalty agreement with a third party, which resulted in a higher gross margin in that quarter.
61
Three months ended*
(in thousands) Apr 30,
2013 Jul 31, 2013
Oct 31, 2013
Jan 31, 2014
Apr 30, 2014
Jul 31, 2014
Oct 31, 2014
Jan 31, 2015
Apr 30, 2015
Revenue:
Subscription services 75 % 77 % 77 % 75 % 73 % 77 % 80 % 80 % 76 % Professional services 25 23 23 25 27 23 20 20 24
Total revenue 100 100 100 100 100 100 100 100 100
Cost of revenue:
Subscription services 16 22 22 20 19 18 20 19 20 Professional services 21 20 21 22 24 23 20 20 21
Total cost of revenue 37 42 43 42 43 41 41 39 41
Gross profit 63 58 57 58 57 59 59 61 59
Operating expenses:
Research and development 18 21 19 20 18 18 22 20 20
Sales and marketing 40 42 45 46 39 54 51 45 40 General and
administrative 14 15 18 19 20 14 14 18 20 Legal settlement 18 — — — — — — — — Amortization of
intangibles 2 2 2 1 1 1 1 1 —
Total operating expenses 92 79 84 86 78 88 88 83 80
Operating loss (29 ) (22 ) (27 ) (28 ) (21 ) (29 ) (29 ) (22 ) (20 ) Total other expense (1 ) (6 ) (5 ) (4 ) (4 ) (4 ) (3 ) (7 ) (7 )
Loss before income taxes (30 ) (28 ) (33 ) (32 ) (25 ) (33 ) (32 ) (29 ) (27 )
Income tax expense — — — — — — — (1 ) (1 )
Net loss (30 )% (28 )% (33 )% (32 )% (25 )% (34 )% (32 )% (30 )% (28 )%
* Certain figures may not sum due to rounding.
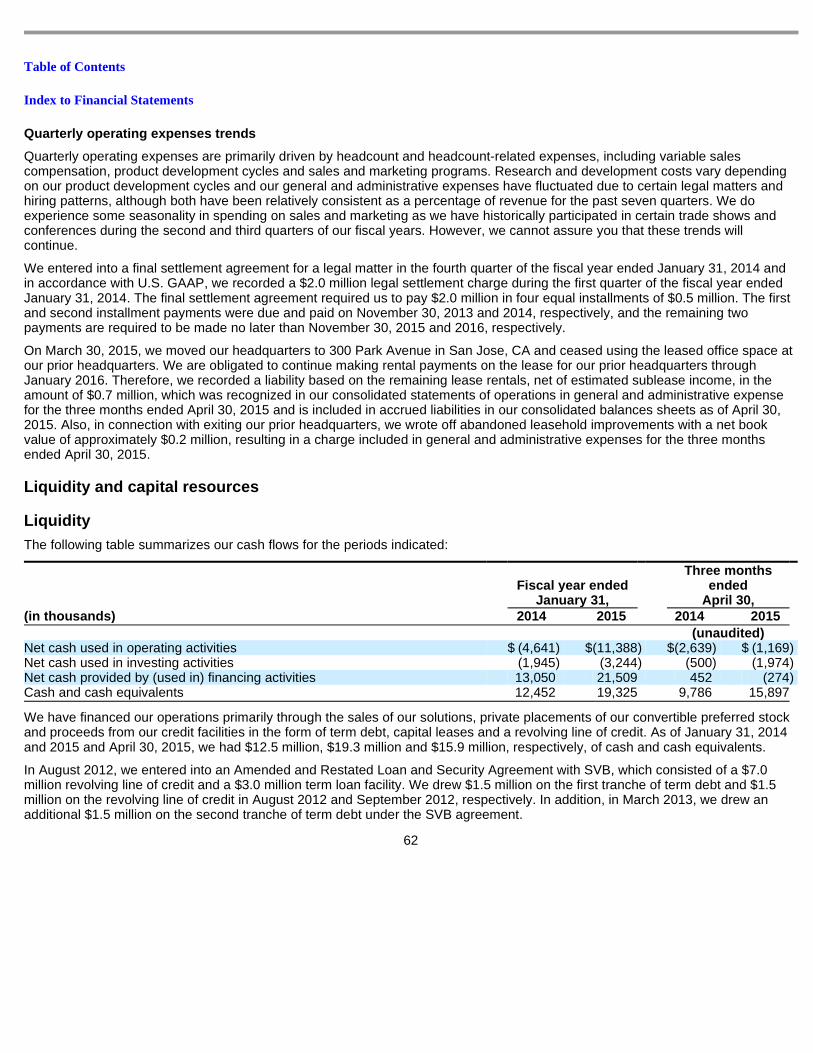
Table of Contents
Index to Financial Statements
Quarterly operating expenses trends
Quarterly operating expenses are primarily driven by headcount and headcount-related expenses, including variable sales compensation, product development cycles and sales and marketing programs. Research and development costs vary depending on our product development cycles and our general and administrative expenses have fluctuated due to certain legal matters and hiring patterns, although both have been relatively consistent as a percentage of revenue for the past seven quarters. We do experience some seasonality in spending on sales and marketing as we have historically participated in certain trade shows and conferences during the second and third quarters of our fiscal years. However, we cannot assure you that these trends will continue.
We entered into a final settlement agreement for a legal matter in the fourth quarter of the fiscal year ended January 31, 2014 and in accordance with U.S. GAAP, we recorded a $2.0 million legal settlement charge during the first quarter of the fiscal year ended January 31, 2014. The final settlement agreement required us to pay $2.0 million in four equal installments of $0.5 million. The first and second installment payments were due and paid on November 30, 2013 and 2014, respectively, and the remaining two payments are required to be made no later than November 30, 2015 and 2016, respectively.
On March 30, 2015, we moved our headquarters to 300 Park Avenue in San Jose, CA and ceased using the leased office space at our prior headquarters. We are obligated to continue making rental payments on the lease for our prior headquarters through January 2016. Therefore, we recorded a liability based on the remaining lease rentals, net of estimated sublease income, in the amount of $0.7 million, which was recognized in our consolidated statements of operations in general and administrative expense for the three months ended April 30, 2015 and is included in accrued liabilities in our consolidated balances sheets as of April 30, 2015. Also, in connection with exiting our prior headquarters, we wrote off abandoned leasehold improvements with a net book value of approximately $0.2 million, resulting in a charge included in general and administrative expenses for the three months ended April 30, 2015.
Liquidity and capital resources
Liquidity
The following table summarizes our cash flows for the periods indicated:
We have financed our operations primarily through the sales of our solutions, private placements of our convertible preferred stock and proceeds from our credit facilities in the form of term debt, capital leases and a revolving line of credit. As of January 31, 2014 and 2015 and April 30, 2015, we had $12.5 million, $19.3 million and $15.9 million, respectively, of cash and cash equivalents.
In August 2012, we entered into an Amended and Restated Loan and Security Agreement with SVB, which consisted of a $7.0 million revolving line of credit and a $3.0 million term loan facility. We drew $1.5 million on the first tranche of term debt and $1.5 million on the revolving line of credit in August 2012 and September 2012, respectively. In addition, in March 2013, we drew an additional $1.5 million on the second tranche of term debt under the SVB agreement.
62
Fiscal year ended January 31,
Three months ended
April 30,
(in thousands) 2014 2015 2014 2015
(unaudited)
Net cash used in operating activities $ (4,641 ) $ (11,388 ) $ (2,639 ) $ (1,169 ) Net cash used in investing activities (1,945 ) (3,244 ) (500 ) (1,974 ) Net cash provided by (used in) financing activities 13,050 21,509 452 (274 ) Cash and cash equivalents 12,452 19,325 9,786 15,897
Table of Contents
Index to Financial Statements
In May 2013, we entered into a Loan and Security Agreement with Wellington. The total credit facility consisted of a $10.0 million term loan facility and a $2.0 million operating line. The term loan facility and the operating line each mature on May 31, 2016, which maturity date may be extended to May 31, 2017 and again to May 31, 2018 upon the satisfaction of certain conditions and at our option. We drew $10.0 million on the term loan facility and $2.0 million on the operating line in May 2013. In connection with the Wellington credit facility, we repaid and cancelled the $3.0 million SVB term loan facility and reduced the SVB revolving line of credit from $7.0 million to $5.0 million.
In January 2014, we added an additional $3.0 million term loan facility under the Wellington credit facility. Such additional term loan facility matures on May 31, 2016, which maturity date may be extended to May 31, 2017 and again to May 31, 2018 upon the satisfaction of certain conditions and at our option. We drew $3.0 million on such term loan facility in January 2014. In January 2014, we also increased the revolving line of credit under the SVB credit facility from $5.0 million to $8.0 million and extended the maturity date of such facility to August 20, 2015. We drew down an additional $0.5 million, $2.0 million and $2.5 million on this line of credit in February 2014, July 2014 and October 2014, respectively.
In October 2014, we entered into an Amended and Restated Loan and Security Agreement with Wellington, which amended and restated the original May 2013 Loan and Security Agreement. The October 2014 Wellington credit facility consists of a $15.4 million term loan facility, which is a consolidation of the balance outstanding on the term loan and operating line entered into in May 2013, and the new term loan facility matures on October 24, 2017.
In October 2014, we extended the maturity date of the SVB credit facility to August 20, 2016 and provided for increases in the revolving line of credit under such facility from $8.0 million to up to $13.0 million upon the achievement of certain milestones. In November 2014, we achieved the first such milestone and the revolving credit line under the facility was increased to $11.0 million. As of January 31, 2015, we had $4.5 million available under the SVB credit facility.
In October 2014, we entered into a Mezzanine Loan and Security Agreement with SVB, consisting of a $10.0 million mezzanine term loan facility. The mezzanine term loan facility matures on October 24, 2017. We drew $10.0 million on such mezzanine term loan facility in October 2014. In November 2014, Westriver Mezzanine Loans, LLC (Westriver) became a co-lender in the mezzanine term loan facility.
A significant majority of our customers pay in advance for annual subscriptions. Therefore, a substantial source of our cash provided by operating activities is our deferred revenue, which is included on our consolidated balance sheet as a liability. Deferred revenue consists of the unearned portion of billed fees for our subscriptions, which is recognized as revenue in accordance with our revenue recognition policy. As of January 31, 2014 and 2015 and April 30, 2014 and 2015, we had deferred revenue of $29.5 million, $34.1 million, $29.5 million and $35.9 million, respectively. Of these amounts, $27.7 million, $31.8 million, $27.9 million and $33.0 million, respectively, were recorded as current liabilities and were expected to be recorded as revenue in the following fiscal year, provided all other revenue recognition criteria have been met.
Net cash used in operating activities
As of January 31, 2013, 2014 and 2015 and April 30, 2015, we had working capital deficits of $10.0 million, $11.2 million, $6.8 million and $12.1 million, respectively. The average quarterly days sales outstanding for the fiscal years ended January 31, 2013, 2014 and 2015 were 79 days, 85 days and 84 days, respectively, and 83 days for the three months ended April 30, 2015.
Cash used in operating activities is significantly influenced by the amount of cash we invest in personnel, customer acquisition and infrastructure to support the anticipated growth of our business, the increase in the number of
63
Table of Contents
Index to Financial Statements
customers using our solutions, and the amount and timing of customer payments. For the periods presented, we have continued to experience increases in sales and marketing expenses combined with increases in investments in personnel and infrastructure, all of which have significantly exceeded the revenue generated from the growth in our subscriber base, driving net losses, which have resulted from negative working capital for the periods presented. As we continue to invest in personnel and infrastructure to support the anticipated growth of our business, we expect working capital deficits and uses of cash in operations, to continue.
We used $2.6 million in cash for operating activities for the three months ended April 30, 2014 compared to $1.2 million in the three months ended April 30, 2015. The $1.4 million decrease in cash used for operations was primarily driven by an increase in deferred revenue of $1.8 million offset partially by the increase in average days sales outstanding. Average days sales outstanding increased from 80 days for the three months ended April 30, 2014 to 83 days for the three months ended April 30, 2015.
We used $4.6 million in cash for operating activities for the fiscal year ended January 31, 2014 compared to $11.4 million in cash used for operating activities for the fiscal year ended January 31, 2015. The $6.8 million increase in cash used for operations was primarily related to a $4.0 million increase in our net loss due to increased personnel and outside services costs in our research and development and sales and marketing departments aimed at executing on our product development roadmap and driving subscription revenue and increased general and administrative costs associated with supporting the growth of the business. Average days sales outstanding decreased from 84 days for the fiscal year ended January 31, 2015 to 83 days for the three months ended April 30, 2015.
We used $3.0 million in cash for operating activities for the fiscal year ended January 31, 2013 compared to $4.6 million in cash used for operating activities for the fiscal year ended January 31, 2014. The $1.6 million increase in cash used for operations primarily related to a $5.1 million increase in our net loss due to increased personnel and outside services costs in our research and development and sales and marketing departments aimed at executing on our product development roadmap and driving subscription revenue, increased general and administrative costs associated with supporting the growth of the business and a $0.5 million payment related to the legal settlement. The increases in these areas of spending were partially offset by an increase of 6% in our overall gross margins primarily due to improved utilization and increased pricing in professional services. Average days sales outstanding increased from 79 days for the fiscal year ended January 31, 2013 to 85 days for the fiscal year ended January 31, 2014.
Net cash used in investing activities
Our primary investing activities have consisted of capital expenditures to purchase equipment necessary to support our data center facilities and our network and other operations. As our business grows, we expect our capital expenditures to continue to increase.
We used $0.5 million in cash for investing activities for the three months ended April 30, 2014 compared to $2.0 million used for the three months ended April 30, 2015. The $1.5 million increase in cash used in investing activities was primarily due to an increase in purchases of property and equipment as we made significant investments in hardware and software to support growth in our customer base. In particular, we made significant investments in enhancing our system architecture during the three months ended April 30, 2015.
We used $1.9 million in cash for investing activities for the fiscal year ended January 31, 2014 compared to $3.2 million in cash used for investing activities for the fiscal year ended January 31, 2015. The $1.3 million increase in cash used in investing activities was primarily due to an increase in purchases of property and equipment as we made significant investments in software and equipment to support growth in our customer base as well as sustained growth of headcount levels in all functions of the business. In particular, we made significant investments in enhancing our system architecture during the fiscal year ended January 31, 2015.
64
Table of Contents
Index to Financial Statements
We used $0.5 million in cash for investing activities for the fiscal year ended January 31, 2013 compared to $1.9 million in cash used for investing activities for the fiscal year ended January 31, 2014. The $1.4 million increase in cash used in investing activities was primarily due to an increase in purchases of property and equipment as we made significant investments in software and equipment to support growth in our customer base as well as sustained growth of headcount levels in all functions of the business. In particular, we made significant investments in enhancing our system architecture during the fiscal year ended January 31, 2014.
Net cash provided by (used in) financing activities
Our primary financing activities during the fiscal years ended January 31, 2014 and 2015 have consisted of proceeds from and payments on our term debt and line of credit with SVB and Wellington, and capital lease obligations entered into to finance investments in personnel and infrastructure as well as the issuance of Series F Convertible Preferred Stock.
We generated $0.5 million in cash from financing activities for the three months ended April 30, 2014 compared to $0.3 million in cash used for financing activities for the three months ended April 30, 2015. The $0.8 million decrease in cash from financing activities was primarily due to our borrowings during the three months ended April 30, 2014 under the SVB mezzanine credit facility as well as payments during the three months ended April 30, 2015 for costs associated with our initial public offering.
We generated $13.1 million in cash from financing activities for the fiscal year ended January 31, 2014 compared to $21.5 million in cash from financing activities for the fiscal year ended January 31, 2015. The $8.4 million increase in cash from financing activities was primarily due to borrowings under the SVB mezzanine credit facility, as well as the issuance of Series F Convertible Preferred Stock, offset by repayments under the SVB credit facility in the fiscal year ended January 31, 2014 and payments of deferred initial public offering costs.
We generated $2.9 million in cash from financing activities for the fiscal year ended January 31, 2013 compared to $13.1 million in cash from financing activities for the fiscal year ended January 31, 2014. The $10.2 million increase in cash from financing activities was primarily due to borrowings under the Wellington credit facility and line of credit, offset by repayments under the SVB credit facility.
Capital resources
As of April 30, 2015, we had cash and cash equivalents of $15.9 million, which were predominantly denominated in U.S. dollars and consisted of bank deposits and money market funds. As of April 30, 2015, $0.2 million of cash was held by our foreign subsidiaries. We incurred net losses of $9.4 million, $14.5 million and $18.5 million during the fiscal years ended January 31, 2013, 2014 and 2015, respectively, and $3.9 million and $5.0 million during the three months ended April 30, 2014 and 2015, respectively. In addition, our accumulated deficit as of April 30, 2015 was $120.8 million.
We require access to capital to fund our operations, including general working capital for operating expenses, purchases of property and equipment for our operations, and other needs. We believe that our existing liquidity sources will satisfy our cash requirements and operations (including continued growth in revenue and employees) for at least the next 12 months. We expect that our operating losses and negative cash flows from operations will continue through at least the foreseeable future. To the extent that existing cash and cash from operations are not sufficient to fund our future operations, we may need to raise additional funds through public or private equity or additional debt financing. Although we currently are not a party to any agreement and do not have any understanding with any third parties with respect to potential investments in, or acquisitions of, businesses or technologies, we may enter into these types of arrangements in the future, which could also require us to seek additional equity or debt financing. We cannot assure you that such additional
65
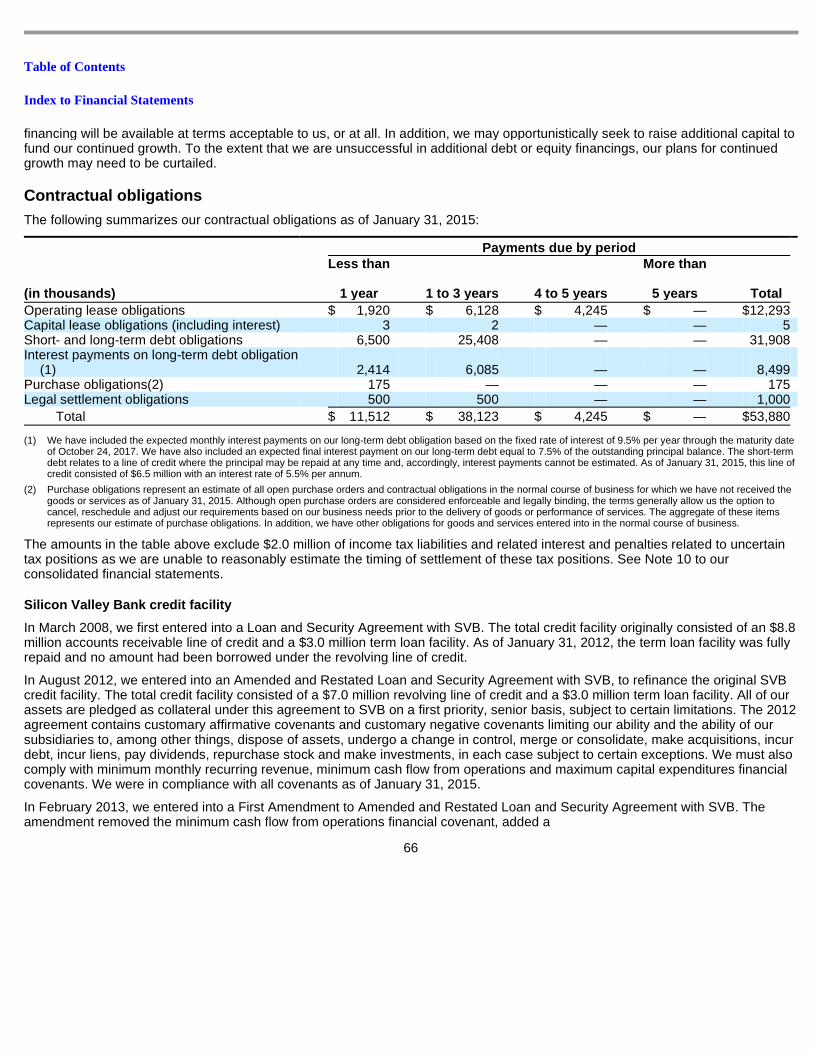
Table of Contents
Index to Financial Statements
financing will be available at terms acceptable to us, or at all. In addition, we may opportunistically seek to raise additional capital to fund our continued growth. To the extent that we are unsuccessful in additional debt or equity financings, our plans for continued growth may need to be curtailed.
Contractual obligations
The following summarizes our contractual obligations as of January 31, 2015:
The amounts in the table above exclude $2.0 million of income tax liabilities and related interest and penalties related to uncertain tax positions as we are unable to reasonably estimate the timing of settlement of these tax positions. See Note 10 to our consolidated financial statements.
Silicon Valley Bank credit facility
In March 2008, we first entered into a Loan and Security Agreement with SVB. The total credit facility originally consisted of an $8.8 million accounts receivable line of credit and a $3.0 million term loan facility. As of January 31, 2012, the term loan facility was fully repaid and no amount had been borrowed under the revolving line of credit.
In August 2012, we entered into an Amended and Restated Loan and Security Agreement with SVB, to refinance the original SVB credit facility. The total credit facility consisted of a $7.0 million revolving line of credit and a $3.0 million term loan facility. All of our assets are pledged as collateral under this agreement to SVB on a first priority, senior basis, subject to certain limitations. The 2012 agreement contains customary affirmative covenants and customary negative covenants limiting our ability and the ability of our subsidiaries to, among other things, dispose of assets, undergo a change in control, merge or consolidate, make acquisitions, incur debt, incur liens, pay dividends, repurchase stock and make investments, in each case subject to certain exceptions. We must also comply with minimum monthly recurring revenue, minimum cash flow from operations and maximum capital expenditures financial covenants. We were in compliance with all covenants as of January 31, 2015.
In February 2013, we entered into a First Amendment to Amended and Restated Loan and Security Agreement with SVB. The amendment removed the minimum cash flow from operations financial covenant, added a
66
Payments due by period
(in thousands)
Less than
1 year 1 to 3 years 4 to 5 years
More than
5 years Total
Operating lease obligations $ 1,920 $ 6,128 $ 4,245 $ — $ 12,293 Capital lease obligations (including interest) 3 2 — — 5 Short- and long-term debt obligations 6,500 25,408 — — 31,908 Interest payments on long-term debt obligation
(1) 2,414 6,085 — — 8,499 Purchase obligations(2) 175 — — — 175 Legal settlement obligations 500 500 — — 1,000
Total $ 11,512 $ 38,123 $ 4,245 $ — $ 53,880
(1) We have included the expected monthly interest payments on our long-term debt obligation based on the fixed rate of interest of 9.5% per year through the maturity date of October 24, 2017. We have also included an expected final interest payment on our long-term debt equal to 7.5% of the outstanding principal balance. The short-term debt relates to a line of credit where the principal may be repaid at any time and, accordingly, interest payments cannot be estimated. As of January 31, 2015, this line of credit consisted of $6.5 million with an interest rate of 5.5% per annum.
(2) Purchase obligations represent an estimate of all open purchase orders and contractual obligations in the normal course of business for which we have not received the goods or services as of January 31, 2015. Although open purchase orders are considered enforceable and legally binding, the terms generally allow us the option to cancel, reschedule and adjust our requirements based on our business needs prior to the delivery of goods or performance of services. The aggregate of these items represents our estimate of purchase obligations. In addition, we have other obligations for goods and services entered into in the normal course of business.
Table of Contents
Index to Financial Statements
maximum cumulative EBITDA loss financial covenant and set the threshold amounts in the financial covenants for the fiscal year ended January 31, 2015. Additionally, in March 2013, SVB advanced us the additional $1.5 million term loan. The advance carried a variable annual interest rate of 1.75% above the prime rate and required us to make monthly interest only payments for six months. Thereafter, we became obligated to make 30 equal monthly installments of principal and accrued interest, payable at the beginning of each month through the maturity date on such advance of March 1, 2016. In May 2013, in connection with the Wellington credit facility, we entered into a Second Amendment to Amended and Restated Loan and Security Agreement with SVB. The amendment reduced the revolving line of credit to $5.0 million. Upon entering the Wellington credit facility, the outstanding balance of the SVB term loan facility of $2.9 million was repaid. In August 2013, we entered into a Third Amendment to Amended and Restated Loan and Security Agreement with SVB. The amendment removed the maximum cumulative EBITDA loss financial covenant and revised the maximum capital expenditures financial covenant. In January 2014, we entered into a Fourth Amendment to Amended and Restated Loan and Security Agreement with SVB. The amendment, among other things, added a maximum cumulative EBITDA loss financial covenant, revised the maximum capital expenditures covenant, increased the revolving line of credit to $8.0 million and amended the revolving line of credit maturity date to August 20, 2015. In March 2014, we entered into a Fifth Amendment to Amended and Restated Loan and Security Agreement with SVB. The amendment, among other things, revised the maximum cumulative EBITDA loss financial covenant and the monthly minimum recurring revenue covenant. In October 2014, we entered into a Sixth Amendment to the Amended and Restated Loan and Security Agreement. The amendment, among other things, provided for increases in the revolving line of credit to up to $13.0 million upon the achievement of certain milestones and amended the revolving line of credit maturity date to August 20, 2016. In November 2014, we achieved the first such milestone and the revolving credit line under the facility was increased to $11.0 million. As of January 31, 2015, we had $4.5 million available under the SVB credit facility.
Wellington Financial LP credit facility
In May 2013, we first entered into a Loan and Security Agreement with Wellington. The total credit facility consisted of a $10.0 million 36-month, interest only term loan facility and a $2.0 million line of credit. The term loan carries a fixed interest rate of 9.5% per annum. Additional interest will accrue on the unpaid principal amount of the term loan at a per annum rate of 2.5% which will also be due at the maturity date. The line of credit carries a variable interest rate of prime plus 2.5% per annum or 6.0% per annum, whichever is greater. Interest is payable monthly on the outstanding principal amount of the line of credit. Under the line of credit, we may borrow, prepay and re-borrow loans from time to time before the maturity date. All of our assets are pledged as collateral under this agreement to Wellington on a senior basis (currently subordinated to the security interest of SVB by up to $13.0 million in aggregate principal amount), subject to certain limited exceptions. In May 2013, we borrowed $10.0 million under the term loan facility and $2.0 million under the line of credit. The Wellington agreement contains customary affirmative covenants and customary negative covenants limiting our ability and the ability of our subsidiaries to, among other things, dispose of assets, undergo a change in control, merge or consolidate, make acquisitions, incur debt, incur liens, make capital expenditures, pay dividends, repurchase stock and make investments, in each case subject to certain exceptions. We must also comply with a minimum EBITDA financial covenant. We were in compliance with all covenants as of January 31, 2015.
In June 2013, we entered into a First Amendment to Loan and Security Agreement to the Wellington credit facility to amend certain administrative post-closing conditions. In August 2013, we entered into a Second Amendment to Loan and Security Agreement to amend the maximum capital expenditures covenant. In January 2014, we entered into a Third Amendment to Loan and Security Agreement to add an additional $3.0 million term loan facility. As amended, the term loan facility and line of credit mature on May 31, 2016, which maturity date can be extended to May 31, 2017 and again to May 31, 2018 upon the satisfaction of certain conditions and at our option. We borrowed $3.0 million under such term loan facility in January 2014.
67
Table of Contents
Index to Financial Statements
In October 2014, we entered into an Amended and Restated Loan and Security Agreement with Wellington, which amended and restated the original May 2013 Loan and Security Agreement. The October 2014 Wellington credit facility consolidated the outstanding borrowings under each of the term loan and line of credit into a single $15.4 million term loan facility, which matures on October 24, 2017. The October 2014 Wellington credit facility otherwise contains generally the same terms, conditions and covenants as the original May 2013 Loan and Security Agreement with Wellington, as amended, including a fixed term loan interest rate of 9.5% per annum. As of January 31, 2015, $15.4 million had been drawn under the term loan facility. In addition, in November 2014, we issued warrants to purchase 147,936 shares of our Series D-1 convertible preferred stock to Wellington at an exercise price of $7.60 per share, or, at the option of Wellington, shares of our preferred stock issued at our next round of equity financing. For more information regarding the terms of the warrants to purchase shares of our Series D-1 convertible preferred stock, see Note 6 and Note 8 to our consolidated financial statements.
Silicon Valley Bank mezzanine facility
In October 2014, we entered into a Mezzanine Loan and Security Agreement with SVB, consisting of a $10.0 million mezzanine term loan facility. The mezzanine term loan facility carries a fixed interest rate of 9.5% per annum and matures on October 24, 2017. Substantially all of our assets are pledged as collateral under this agreement to SVB on a subordinated basis (currently subordinated to the security interest of SVB by up to $13.0 million in aggregate principal amount), subject to certain limited exceptions. In October 2014, we borrowed $10.0 million under the mezzanine term loan facility. The mezzanine agreement contains customary affirmative covenants and customary negative covenants limiting our ability and the ability of our subsidiaries to, among other things, dispose of assets, undergo a change in control, merge or consolidate, make acquisitions, incur debt, incur liens, make capital expenditures, pay dividends, repurchase stock and make investments, in each case subject to certain exceptions. We must also comply with a maximum cumulative EBITDA loss financial covenant as set forth in this agreement. We were in compliance with all covenants as of January 31, 2015. In connection with the Mezzanine Loan and Security Agreement with SVB, in November 2014, we issued warrants to purchase 78,125 shares of our Series D-1 convertible preferred stock to each of SVB and Westriver at an exercise price of $7.60 per share, or, at the option of SVB or Westriver, shares of our preferred stock issued at our next round of equity financing. For more information regarding the terms of the warrants to purchase shares of our Series D-1 convertible preferred stock, see Note 6 and Note 8 to our consolidated financial statements.
Indemnification obligations
In the normal course of business, we provide indemnification of varying scope to customers against claims of intellectual property infringement made by third parties arising from the use of our services, and from time to time we may be subject to claims by our customers under these indemnification provisions. Historically, costs related to these indemnification provisions have not been significant, but we are unable to estimate the maximum potential impact of these indemnification provisions on our future results of operations.
To the extent permitted under Delaware law, we have agreements whereby we indemnify our directors and officers for certain events or occurrences while the director or officer is or was serving at our request in such capacity. The indemnification period covers all pertinent events and occurrences during the director’s or officer’s lifetime. The maximum potential amount of future payments we could be required to make under these indemnification agreements is unlimited; however, we have director and officer insurance coverage that limits our exposure and enables us to recover a portion of any future amounts paid. We believe the estimated fair value of these indemnification agreements in excess of applicable insurance coverage is minimal.
68
Table of Contents
Index to Financial Statements
Contingencies
Other taxes
We conduct operations in many tax jurisdictions throughout the U.S. In many of these jurisdictions, non-income based taxes, such as property taxes, sales and use taxes, and value-added taxes are assessed on our operations in that particular location. While we strive to ensure compliance with these various non-income based tax filing requirements, there have been instances where potential non-compliance exposures have been identified. In accordance with U.S. GAAP, we make a provision for these exposures when it is both probable that a liability has been incurred and the amount of the exposure can be reasonably estimated. We believe that, as of January 31, 2014 and 2015, we have adequately provided for such contingencies. However, it is possible that our results of operations, cash flows, and financial position could be harmed if one or more noncompliance tax exposures are asserted by any of the jurisdictions where we conduct our operations.
Employee agreements
We have various employment agreements with executives and key employees pursuant to which if we terminate such employee’s employment without cause, or if such employee does so for good reason, within one year following a change of control of our company, such employee is entitled to receive certain benefits including cash payments and accelerated vesting of stock options. To date, no triggering events which would cause these provisions to become effective have occurred.
Off-balance sheet arrangements
During the three months ended April 30, 2014 and 2015 and the fiscal years ended January 31, 2013, 2014 and 2015, we did not have any relationships with unconsolidated organizations or financial partnerships, such as structured finance or special purpose entities, that would have been established for the purpose of facilitating off-balance sheet arrangements.
Quantitative and qualitative disclosures about mark et risk
We are exposed to market risk in the ordinary course of our business. Market risk represents the risk of loss that may impact our financial position due to adverse changes in financial market prices and rates. Our market risk exposure is primarily a result of fluctuations in foreign currency exchange rates and interest rates. We do not hold or issue financial instruments for trading purposes.
Foreign currency risk
The functional currency of our foreign subsidiaries is generally the local currency. Most of our sales are denominated in U.S. dollars, and therefore our revenue is not currently subject to significant foreign currency risk. Our operating expenses are denominated in the currencies of the countries in which our operations are located, which are primarily in the U.S., the United Kingdom and India. Our consolidated results of operations and cash flows are, therefore, subject to fluctuations due to changes in foreign currency exchange rates and may be adversely affected in the future due to changes in foreign exchange rates. To date, we have not entered into any hedging arrangements with respect to foreign currency risk or other derivative financial instruments. During the fiscal years ended January 31, 2013, 2014 and 2015 and the three months ended April 30, 2015, the effect of a hypothetical 10% change in foreign currency exchange rates applicable to our business would not have had a material impact on our consolidated financial statements.
69
Table of Contents
Index to Financial Statements
Interest rate sensitivity
We had cash and cash equivalents of $12.5 million, $19.3 million and $15.9 million as of January 31, 2014 and 2015 and April 30, 2015, respectively. Our cash and cash equivalents are held in cash and short-term money market funds. Due to the short-term nature of these instruments, we believe that we do not have any material exposure to changes in the fair value of our investment portfolio as a result of changes in interest rates. Declines in interest rates, however, would reduce future interest income. During the fiscal years ended January 31, 2013, 2014 and 2015 and the three months ended April 30, 2015, the effect of a hypothetical 10% increase or decrease in overall interest rates would not have had a material impact on our interest income. In addition, as of January 31, 2014 and 2015 and April 30, 2015, we had approximately $16.5 million, $6.5 million and $6.5 million, respectively, in short- and long-term debt with variable interest rate components. A hypothetical increase or decrease in overall interest rates is not expected to have a material impact on our interest expense.
Recent accounting pronouncements
In April 2014, the Financial Accounting Standards Board (FASB) issued an accounting standards update (ASU) on reporting discontinued operations and disclosures of disposals of components of an entity. The standard changes the requirements for reporting discontinued operations. The amendment is effective on a prospective basis for financial statements issued for fiscal years, and interim periods within those fiscal years, beginning on or after December 15, 2014. Early adoption is permitted for disposals that have not been reported in financial statements previously issued. We will apply the provisions of this standard to any future transactions after the effective date which qualify for reporting discontinued operations. We do not expect this standard to have a material impact on our consolidated financial position or results of operations.
In May 2014, the FASB issued an ASU on revenue from contracts with customers, which supersedes the current revenue recognition requirements. This ASU is based on the principle that revenue is recognized to depict the transfer of goods or services to customers in an amount that reflects the consideration to which the entity expects to be entitled in exchange for those goods or services. The standard also requires additional disclosure about the nature, amount, timing and uncertainty of revenue and cash flows arising from customer contracts, including significant judgments and changes in judgments and assets recognized from costs incurred to obtain or fulfill a contract. The standard’s effective date will be the first quarter of fiscal year 2018 using one of two adoption methods. However, in April 2015, the FASB issued an exposure draft that would provide us with the option to adopt the new standard in either the first quarter of the fiscal year ending January 31, 2018 or the fiscal year ending January 31, 2019. We have not determined the potential effects of this standard on our consolidated financial statements or the planned method or timing of adoption.
In August 2014, the FASB issued new guidance related to the disclosures around going concern. The new standard provides guidance around management’s responsibility to evaluate whether there is substantial doubt about an entity’s ability to continue as a going concern and to provide related footnote disclosures. The new standard is effective for fiscal years, and interim periods within those fiscal years, beginning after December 15, 2016. Early adoption is permitted. We will apply the guidance and disclosure provisions of the new standard and assess the impact upon effectiveness.
In April 2015, the FASB issued an ASU on the presentation of debt issuance costs. This ASU amends existing guidance to require the presentation of debt issuance costs in the balance sheet as a deduction from the carrying amount of the related debt liability instead of a deferred charge. It is effective for annual reporting periods beginning after December 15, 2015, but early adoption is permitted. We do not expect this standard to have a material impact on our consolidated financial position or results of operations.
70
Table of Contents
Index to Financial Statements
Critical accounting policies
We prepare our consolidated financial statements in accordance with U.S. GAAP. In many cases, the accounting treatment of a particular transaction is specifically dictated by U.S. GAAP and does not require management’s judgment in its application. In other cases, management’s judgment is required in selecting among available alternative accounting standards that provide for different accounting treatment for similar transactions. The preparation of consolidated financial statements also requires us to make estimates and assumptions that affect the amounts we report as assets, liabilities, revenue, costs, and expenses, and affect the related disclosures. We base our estimates on historical experience and other assumptions that we believe are reasonable under the circumstances. In many instances, we could reasonably use different accounting estimates, and in some instances changes in the accounting estimates are reasonably likely to occur from period to period. Accordingly, our actual results could differ significantly from the estimates made by our management. To the extent that there are differences between our estimates and actual results, our future financial statement presentation, financial condition, results of operations, and cash flows will be affected. We believe that the accounting policies discussed below are critical to understanding our historical and future performance, as these policies relate to the more significant areas involving management’s judgments and estimates.
Revenue recognition
We derive our revenue from two sources: (1) subscription services revenue, which is generated from the sale of subscriptions to our cloud-based offerings of incentive compensation solutions and (2) professional services revenue, which is generated from assisting customers in implementing our solutions and optimizing use.
Subscriptions are typically sold through contracts with one to three year terms. Subscription services fees are based primarily on the number of subscribers per customer per month. Customers are not permitted to take possession of our software.
Professional services include application configuration, system integration, data transformation and automation services, education and training services and strategic services. Professional services are billed predominantly on a time-and-materials basis, with some fixed-fee arrangements. Professional services are performed by us directly or by third-party professional service providers engaged by us. Customers may also choose to perform these services themselves or engage their own third-party service providers.
We recognize revenue when the following criteria are met:
Subscription services are recognized ratably over the term of the arrangement as delivered. Professional services are recognized as the services are performed using the proportional-performance method. Performance is based on hours of work performed, or upon project completion for certain fixed-fee contracts.
We enter into arrangements with multiple deliverables that include subscription and professional services. When subscription services arrangements involve multiple elements that qualify as separate units of accounting, we allocate revenue to each deliverable in a multiple-deliverable arrangement based upon its relative selling price. We determine the selling price for each deliverable using vendor-specific objective evidence (VSOE) of selling price or third-party evidence (TPE) of selling price, if it exists. If neither VSOE nor TPE of selling price exists for a deliverable, we use our best estimated selling price (BESP) for that deliverable. Revenue allocated to each deliverable, limited to the amount not contingent on future performance, is then recognized when the basic revenue recognition criteria are met for the respective deliverable.
71
• there is persuasive evidence of an arrangement; • the service is being provided to the customer or the solution has been delivered; • the amount of fees to be paid by the customer is fixed or determinable; and • the collection of the fees is reasonably assured.
Table of Contents
Index to Financial Statements
We determine VSOE of fair value based on historical standalone sales to customers. In determining VSOE, we require that a substantial majority of the selling prices for our subscription or professional services fall within a reasonably narrow pricing range of the applicable median selling price. We have not yet been able to establish VSOE for our subscription and professional services because we have not historically priced our service offerings within a sufficiently narrow range. When VSOE cannot be established, we apply judgment with respect to whether we can establish a selling price based on TPE. TPE is determined based on third-party prices for similar deliverables when sold separately. Generally, our pricing strategy differs from that of our peers and our services and solutions contain a significant level of differentiation such that the comparable pricing of other offerings with similar functionality cannot be obtained. Furthermore, we are unable to reliably determine what similar competitor services’ selling prices are on a stand-alone basis. As a result, we use BESP as the selling price for our services. We estimate BESP for our solutions and services by considering multiple factors, including, but not limited to, prices we charge for similar offerings, market conditions, competitive landscape, and pricing practices.
Income taxes
Significant judgment may be required in determining our provision for income taxes and evaluating our tax positions. We record income taxes using the asset and liability method, which requires the recognition of deferred tax assets and liabilities for the expected future tax consequences of events that have been recognized in our financial statements or tax returns. In estimating future tax consequences, we generally consider all expected future events other than enactments or changes in the tax law or rates. Valuation allowances are provided when necessary to reduce deferred tax assets to the amount expected to be realized.
We provide reserves as necessary for uncertain tax positions taken on our tax filings. First, we determine if the weight of available evidence indicates that a tax position is more likely than not to be sustained upon audit. Second, based on the largest amount of benefit, which is more likely than not to be realized on ultimate settlement, we recognize any such differences as a liability. Because of our full valuation allowance against the net deferred tax assets, any change in our uncertain tax positions would not impact our effective tax rate.
In evaluating our ability to recover our deferred tax assets, in full or in part, we consider the available positive and negative evidence, including our past results of operations, our forecast of future market growth, forecasted earnings, future taxable income and prudent and feasible tax planning strategies. The assumptions utilized in determining future taxable income require significant judgment, in consultation with outside tax advisors, and are consistent with the plans and estimates we use to manage the underlying businesses. Due to the net losses we have incurred and the uncertainty of realizing our deferred tax assets, for all the periods presented, we have a full valuation allowance against our net deferred tax assets.
As of January 31, 2015, we had federal and state net operating loss carryforwards of $198.7 million and $67.5 million, respectively, and federal and state research and development tax credit carryforwards in the amount of $2.4 million and $1.2 million, respectively. In the future, we intend to utilize any carryforwards available to us to reduce our tax payments. These carryforwards may be subject to annual limitations that may result in their expiration before some portion of them has been fully utilized. If not utilized, these carryforwards will begin to expire in 2019 for federal purposes and began to expire in 2015 for state purposes.
Stock-based compensation
We measure and recognize compensation expense for all stock options granted to our employees and directors, based on the estimated fair value of the award on the grant date. We use the Black-Scholes valuation model to estimate the fair value of stock option awards. The fair value is recognized as expense, net of estimated forfeitures, over the requisite service period, which is generally the vesting period of the respective award on a straight-line basis. We believe that the fair value of stock options granted to non-employees is more reliably
72
Table of Contents
Index to Financial Statements
measured than the fair value of the services received. As such, the fair value of the unvested portion of the options granted to non-employees is re-measured each period. The resulting increase in value, if any, is recognized as expense during the period the related services are rendered. The determination of the grant date fair value of options using an option-pricing model is affected by our estimated common stock fair value, as well as assumptions regarding a number of other complex and subjective variables.
Historically, for all periods prior to this initial public offering, the fair values of the shares of common stock underlying our stock-based awards were estimated on each grant date by our board of directors. In order to determine the fair value of our common stock underlying option grants, our board of directors considered, among other things, contemporaneous valuations of our common stock prepared by an unrelated third-party valuation firm in accordance with the guidance provided by the American Institute of Certified Public Accountants 2004 Practice Aid, Valuation of Privately-Held-Company Equity Securities Issued as Compensation . Given the absence of a public trading market of our common stock, our board of directors exercised reasonable judgment and considered a number of objective and subjective factors to determine the best estimate of the fair value of our common stock, including:
In valuing our common stock, our board of directors determined the equity value of our Company using both the income and the market approach valuation methods. The income approach estimates value based on the expectation of future cash flows that a company will generate. These future cash flows are discounted to their present values using a discount rate derived from an analysis of the cost of capital of comparable publicly traded companies in our industry as of each valuation date and is adjusted to reflect the risks inherent in our cash flows. The market approach estimates value based on a comparison of the subject company to comparable public companies in a similar line of business. From the comparable companies, a representative market value multiple is determined and then applied to the subject company’s financial results to estimate the value of the subject company.
Since July 2013, we have used the Probability Weighted Expected Return Method, or PWERM, to allocate our equity value among various outcomes. Using the PWERM, the value of our common stock is estimated based upon a probability-weighted analysis of varying values for our common stock assuming possible future events for our Company, such as:
73
• contemporaneous valuations of our common stock performed by unrelated third-party valuation firms;
• our stage of development;
• our operational and financial performance;
• the nature of our services and our competitive position in the marketplace;
• the value of companies that we consider peers based on a number of factors, including similarity to us with respect to industry and business model;
• the likelihood of achieving a liquidity event, such as an initial public offering or sale given prevailing market conditions, and the nature and history of our business;
• issuances of preferred stock and the rights, preferences and privileges of our preferred stock relative to those of our common stock;
• current business conditions and projections;
• the history of our company and our introduction of new solutions; and
• the lack of marketability of our common stock.
• a “liquidation” scenario, where we assume the Company is dissolved and the book value less the applicable liquidation preferences represents the amount available to the common stockholders;
Table of Contents
Index to Financial Statements
Application of these approaches involves the use of estimates, judgment and assumptions that are highly complex and subjective, such as those regarding our expected future revenue, expenses and future cash flows, discount rates, market multiples, the selection of comparable companies and the probability of possible future events. Changes in any or all of these estimates and assumptions or the relationships between those assumptions impact our valuations as of each valuation date and may have a material impact on the valuation of our common stock.
For valuations after the completion of this initial public offering, our board of directors will determine the fair value of each share of underlying common stock based on the closing price of our common stock as reported on the New York Stock Exchange on the date of grant.
74
• a strategic sale in the near term;
• an initial public offering, or IPO; or
• a downside scenario in which we sell the Company at a lower than expected stockholder liquidation value.
Table of Contents
Index to Financial Statements
Letter from our Chief Executive Officer
Dear Prospective Stockholder,
Ten years ago we founded Xactly with a vision to change the world of incentive compensation. We built the company on the simple belief that incentives are motivating forces that shape behaviors and inspire employee performance to achieve better business results. Incentives do not simply drive compensation outcomes, but align employee behaviors with company goals. In the U.S., businesses have paid more than $800 billion a year in sales compensation alone, representing one of the single largest investments for most companies. Over 90% of businesses in the U.S. use some form of variable pay to motivate their employees. We see businesses rapidly moving toward pay-for-performance cultures and we are passionate about helping them use best-in-class incentives that drive the highest levels of performance.
We have grown to over 200,000 subscribers, currently processing on average over 1.2 billion transactions a month, and our customers have paid over $16 billion in incentive payments in the last two calendar years using our service. Our scale, combined with our technology platform, allows us to derive commercial insights that inform our customers on best incentive practices. We use this information to create industry-specific insights to strategically help our customers incent their employees more effectively.
Key to our success are our core values — what we call C.A.R.E. We use these values to guide our behaviors and decisions every day. C.A.R.E. stands for:
We have reached an important milestone in our history — the opportunity to share our future with you in the public market. We do not see going public as a destination, but simply another step in our journey. We have focused on building a business for the long run, making sure that each brick in the foundation is solid. The capital raised by going public will allow us to build upon this foundation.
We hope you will share in our journey.
Sincerely,
/s/ Christopher W. Cabrera Christopher W. Cabrera
Founder & Chief Executive Officer
75
• Customer. Every day we strive to achieve total customer success. We are committed to delivering solutions and services that make our customers thrive. To succeed and earn the trust of our customers we must meet their expectations every single day with every interaction.
• Accountability. Accountability and integrity are at the core of everything we do. We are accountable for our actions to our customers, our partners and to each other. We do not make commitments we do not intend to keep.
• Respect. We foster an environment of teamwork and mutual respect. We respect our peers, our customers and our partners. We respect diversity and openness.
• Excellence. We are passionate about innovation and quality. We strive to achieve excellence in our solutions, services, support and partnerships. We set high standards for excellence and aim to exceed them.
Table of Contents
Index to Financial Statements
Business
Overview
Xactly is a leading provider of enterprise-class, cloud-based, incentive compensation solutions for employee and sales performance management. We address a critical business need: to incentivize employees and align their behaviors with company goals. Our solutions allow organizations to make better strategic decisions, optimize behaviors, increase sales and employee performance, improve margins, increase operational efficiencies, mitigate risk, design better incentive compensation plans and reduce error rates in incentive compensation calculations. We were the first 100% cloud-based, multi-tenant provider focusing solely on the incentive compensation and employee and sales performance management market and we achieved our leadership position through domain expertise and innovative technology. We deliver our solutions through a SaaS business model.
We believe that our solutions are strategic for our customers. We go beyond automation by providing our customers with commercially actionable insights so that they can optimize their employees’ behaviors. We believe that we are the first and only company to make commercially available insights derived from an empirical set of aggregated and anonymized data which helps customers make fact-based decisions to motivate employees and drive business performance. Our solutions help executives design, manage and analyze incentive programs and provide visibility into employee and incentive program performance. At the same time, employees use our solutions to monitor, estimate and track their own and their team’s performance in real-time, and modify their behaviors to maximize their payout consistent with company goals.
The design and management of incentive compensation is often highly complex. Traditional systems such as spreadsheets, manual processes and homegrown solutions are inadequate to deal with the complexity associated with variable forms of pay, such as commissions, bonuses and non-cash rewards. According to an August 2014 research study by Aon Hewitt, 91% of organizations currently offer a variable pay program for their broad based employee populations and expect to spend 13% of payroll on variable pay. Further, according to Aon Hewitt, variable pay budgets and spending have nearly doubled in the last 20 years.
We have a diverse and rapidly growing customer base ranging from FORTUNE 50 enterprises to small, emerging companies in a variety of industries such as business & financial services, communications, high-tech manufacturing, life sciences, media & internet and SaaS & traditional software, which provides us with large, unique, industry-specific data sets. Customers use our solutions to manage and incent a broad range of employees, from bank tellers to post office employees to sales people.
We strive to be a thought leader in incentives and employee performance, identifying and interpreting emerging trends, shaping and guiding industry dialogue, and creating and sharing best practices. Our thought leadership is based on our big-data insights as well as our significant industry experience. We deliver our thought leadership and innovation through the expertise of our employees as well as the authoring and dissemination of information about incentives that complement and leverage our technology solutions. We believe our thought leadership differentiates us and allows us to increase the value of our solutions to our customers.
We have achieved significant growth. As of January 31, 2015, we had approximately 194,000 subscribers, compared to approximately 140,000 subscribers as of January 31, 2014, representing an increase of approximately 39%. We estimate that during the 2014 calendar year approximately 24% of the payees whose compensation was administered through our solution were in non-sales roles. While approximately 54% of our customers were enterprise and mid-market companies, we derived approximately 91% of our revenue from enterprise and mid-market customers for the fiscal year ended January 31, 2015. As of January 31, 2015, we had approximately 725 customers.
76
Table of Contents
Index to Financial Statements
We offer our solutions on a subscription basis, typically through non-cancellable contracts with one to three year terms, which provides us with visibility into a substantial portion of our future revenue. We had total revenue of $36.3 million, $47.2 million and $61.1 million for the fiscal years ended January 31, 2013, 2014 and 2015, respectively, resulting in year-over-year increases of 30% and 29%. Our subscription revenue for the fiscal years ended January 31, 2013, 2014 and 2015 was $27.5 million, $35.9 million and $47.3 million, respectively, resulting in year-over-year increases of 30% and 32%. Our professional services revenue for the fiscal years ended January 31 2013, 2014 and 2015 was $8.8 million, $11.3 million and $13.8 million, respectively, resulting in year-over-year increases of 29% and 22%. For the fiscal year ended January 31, 2015, our subscription services revenue accounted for 77% of total revenue and our professional services revenue accounted for the remaining 23%. In addition, for the three months ended April 30, 2014 and 2015, our total revenue was $15.3 million and $17.8 million, respectively, resulting in a period-over-period increase of 17%. Our subscription revenue for the three months ended April 30, 2014 and 2015 was $11.1 million and $13.5 million, respectively, resulting in a period-over-period increase of 22%. We have made and expect to continue to make significant investments to support our growth and our transition to becoming a public company, and accordingly have incurred net losses of $9.4 million, $14.5 million and $18.5 million for the fiscal years ended January 31, 2013, 2014 and 2015, respectively. For the three months ended April 30, 2014 and 2015, our net losses were $3.9 million and $5.0 million, respectively.
Industry background
Market overview and history. To determine variable pay and communicate results, companies have traditionally used spreadsheets or other manual processes that are often error prone and are not designed for use by mobile users. Spreadsheets and manual processes tend to provide untimely results with limited visibility to employees and management and are difficult to understand by employees, encouraging employees to build their own incentive compensation spreadsheets. In addition, spreadsheets, manual processes, and homegrown systems are difficult to integrate with CRM, CPQ, HCM, SCM and ERP applications. The incentive compensation programs employed by today’s companies have increased in complexity as management teams seek to implement more innovative variable compensation structures and use incentive compensation plans more broadly across their organizations. The importance and complexity of incentive compensation programs drive a need for sophisticated employee and sales performance management solutions.
Emergence of cloud-based solutions. Over the past decade, cloud-based solutions have emerged, enabling enterprises to improve a range of business and technology operations. In comparison to legacy systems, cloud-based solutions can provide a number of benefits to enterprises, including improved application performance, broader user adoption, simpler integration, greater flexibility and lower costs of ownership. Over time, we believe that enterprises will continue to shift their information technology budgets from legacy software, hardware and information technology services to cloud-based solutions. As a result of the functionality and flexibility provided by cloud-based applications, the annual growth rate of the SaaS and cloud software market is expected to be significantly greater than that of the overall software market. According to IDC, the worldwide SaaS and cloud software market reached $39.3 billion in revenue in 2013, a 22.6% year-over-year growth rate, and will grow to $102.9 billion by 2018, at a compound annual growth rate of 21.3%, compared to an expected compound annual growth rate of 6.3% for the broader software market for the same time period.
Market challenges. As outlined above, companies often face numerous challenges associated with incentive compensation and employee and sales performance management, which create the need for an easy-to-use, mobile, effective, cloud-based solution. Although many companies have invested in legacy and manual incentive compensation systems, these solutions often do not meet the evolving needs of today’s companies for a number of reasons, including:
Expensive to install, implement and maintain . Legacy systems have generally been deployed on-premise, requiring substantial investments in infrastructure and resources in order to enhance, upgrade and maintain such
77
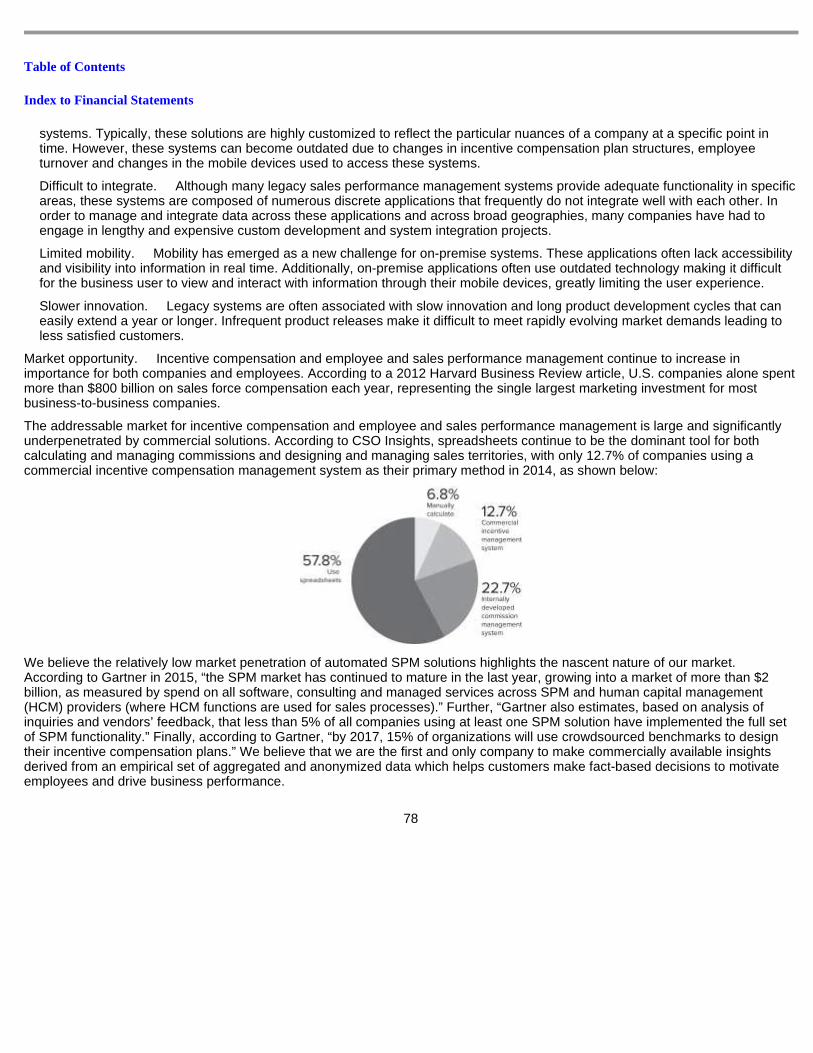
Table of Contents
Index to Financial Statements
systems. Typically, these solutions are highly customized to reflect the particular nuances of a company at a specific point in time. However, these systems can become outdated due to changes in incentive compensation plan structures, employee turnover and changes in the mobile devices used to access these systems.
Difficult to integrate. Although many legacy sales performance management systems provide adequate functionality in specific areas, these systems are composed of numerous discrete applications that frequently do not integrate well with each other. In order to manage and integrate data across these applications and across broad geographies, many companies have had to engage in lengthy and expensive custom development and system integration projects.
Limited mobility. Mobility has emerged as a new challenge for on-premise systems. These applications often lack accessibility and visibility into information in real time. Additionally, on-premise applications often use outdated technology making it difficult for the business user to view and interact with information through their mobile devices, greatly limiting the user experience.
Slower innovation. Legacy systems are often associated with slow innovation and long product development cycles that can easily extend a year or longer. Infrequent product releases make it difficult to meet rapidly evolving market demands leading to less satisfied customers.
Market opportunity. Incentive compensation and employee and sales performance management continue to increase in importance for both companies and employees. According to a 2012 Harvard Business Review article, U.S. companies alone spent more than $800 billion on sales force compensation each year, representing the single largest marketing investment for most business-to-business companies.
The addressable market for incentive compensation and employee and sales performance management is large and significantly underpenetrated by commercial solutions. According to CSO Insights, spreadsheets continue to be the dominant tool for both calculating and managing commissions and designing and managing sales territories, with only 12.7% of companies using a commercial incentive compensation management system as their primary method in 2014, as shown below:
We believe the relatively low market penetration of automated SPM solutions highlights the nascent nature of our market. According to Gartner in 2015, “the SPM market has continued to mature in the last year, growing into a market of more than $2 billion, as measured by spend on all software, consulting and managed services across SPM and human capital management (HCM) providers (where HCM functions are used for sales processes).” Further, “Gartner also estimates, based on analysis of inquiries and vendors’ feedback, that less than 5% of all companies using at least one SPM solution have implemented the full set of SPM functionality.” Finally, according to Gartner, “by 2017, 15% of organizations will use crowdsourced benchmarks to design their incentive compensation plans.” We believe that we are the first and only company to make commercially available insights derived from an empirical set of aggregated and anonymized data which helps customers make fact-based decisions to motivate employees and drive business performance.
78
Table of Contents
Index to Financial Statements
We believe the total addressable market is significantly larger than the market currently being served. Based on our internal analysis and industry experience, together with third-party data, we estimate the total addressable market was approximately $7 billion in 2014. We estimate that the number of persons in sales and related occupations in the United States and the European Union was 14 million and 15.6 million in 2013, respectively, based on reports by the U.S. Bureau of Labor Statistics and by ICF and Cedefop for the European Commission. We then applied what we believe is a reasonable 15% discount to this total of 29.6 million people. Finally, we multiplied the result by our fiscal year 2015 average subscription revenue per subscriber, which was approximately $280. Our estimate of the total addressable market of approximately $7 billion does not account for revenue from potential sales to non-sales employees, markets outside the United States and the European Union and for professional services.
Our solutions
We provide cloud-based incentive compensation solutions for employee and sales performance management. Our solutions include the following key attributes:
Automation . A fundamental purpose of automating incentive processes is to reduce errors and inefficiencies that result from manual or spreadsheet based systems. Our solutions automate costly and cumbersome processes, such as estimating and calculating commissions and bonuses, assigning sales territories, forecasting accruals and modeling business outcomes. As a result, our solutions enhance productivity by allowing companies to focus on the strategic aspects of incentive compensation.
Intuitive user experience . We designed the user interface and user workflows of our solutions to align with the way users naturally think and act. Our solutions are designed for use by the entire workforce, including top executives, sales, finance and human resources employees. Our focus on an intuitive and simple user experience enables the adoption of our solutions by even novice users with minimal training. We believe that we enable our customers to generate higher productivity and better business results through broad access to more timely and reliable information. For example, our solutions include gamification elements, such as leaderboards and badges, which encourage employees to exceed goals.
Mobility . We offer mobile solutions for phones and tablets across the major operating systems so our subscribers have convenient, anytime, anywhere access to real-time performance information, allowing them to optimize their performance no matter where and when. We believe these characteristics result in greater user adoption and higher utilization of our solutions.
Scalable, secure and reliable cloud architecture . Our solutions are 100% cloud-based, built upon a multi-tenant, single instance architecture. A multi-tenant architecture is one that allows multiple customers to use the same hardware and software infrastructure. Our platform architecture allows all of our customers to use a single and most updated version of our solutions, which enables us to accelerate our speed of implementation, upgrades and support. Because we do not need to customize, make improvements or upgrade our solutions for individual customers, our customers benefit from greater scalability, reliability and performance. Our customers have access to Xactly Incent Trust, our trust site that provides real-time availability monitoring of our solutions, including privacy and security information and uptime.
Data integration with other business applications . Our open APIs allow our customers to integrate our solutions into their existing business processes and systems. Our customers use our APIs to import data into our solutions from CRM, ERP, HCM and CPQ solutions, such as those provided by Microsoft, Oracle, Salesforce, SAP and Workday, as well as to extract data from our solutions for use in CRM, finance and payroll solutions such as those provided by ADP, Ceridian and Paychex.
79
Table of Contents
Index to Financial Statements
Actionable big data . We believe that we are the only company that has empirical incentive compensation data combined with the associated metadata across companies and multiple industries. We anonymize and aggregate the data from the billions of transactions we process annually, allowing us to provide value-added, commercially actionable insights. Our customers can use this information to design optimal incentive compensation programs to drive the right behaviors and maximize business results. Metadata is the information necessary to interpret large amounts of data and relate sets of data to others to determine correlations. Without this metadata, it is extremely difficult to draw meaningful conclusions from big data.
Key customer benefits
Finance leaders . Our solutions help finance leaders gain control of incentive compensation, mitigate risk and increase accuracy through automation, which create more efficient workflows. In addition, finance executives can make better strategic decisions, design optimal plans and forecast and monitor the performance of their incentive compensation expenditures.
Compensation administrators . Compensation administrators more quickly and accurately process incentive compensation using our solutions, leading to faster, more accurate financial closes with fewer disputes and greater trust from the sales teams they support. Moreover, they can add strategic value to their organizations by providing analyses and insights into compensation expenditures beyond simply managing the compensation process.
Sales leaders . We help sales leaders inspire performance, drive top line results and align employee behaviors with company goals. Our solutions allow sales leaders to incent the right behaviors, bring visibility to front-line sales representatives, coach them to drive better results and adjust incentives to better compete in a complex, competitive environment.
Technology leaders . We help chief information officers support business users more effectively while adding strategic value to the organization. Our customers are able to quickly implement and easily integrate our solutions with other systems and applications. Chief information officers can safely and securely scale their companies for growth since they do not have to manage costly hardware and are assured of always using the latest version of our solutions.
Human resources teams. We help human resources teams inspire performance by enabling companies to bring incentive compensation not only to sales teams, but to all employees. With our solutions, human resources professionals can retain top talent by incenting and rewarding the right behavior and delivering incentives with timeliness, visibility and transparency.
Our growth strategy
The key elements of our growth strategy include:
Acquire new customers . We believe the market for incentive compensation and employee and sales performance management is large and underserved and there is substantial opportunity for us to continue to increase the size of our customer base across a broad range of industries. We intend to continue to make investments in our business to pursue this market opportunity.
Sell more subscriptions and modules to our existing customer base . Frequently, an organization will purchase our solutions for one division and later expand its deployment to other divisions within the organization. We believe there is a significant opportunity for us to sell more subscriptions to existing customers as well as to increase the number of modules deployed by our existing customers.
80
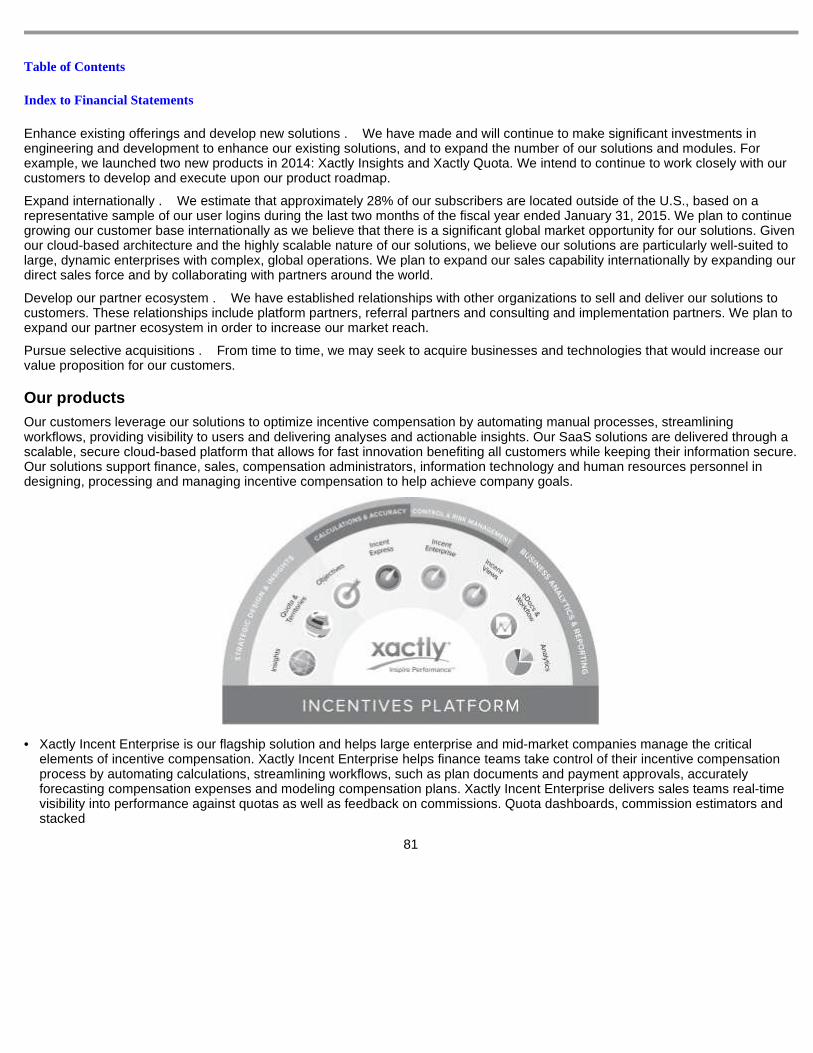
Table of Contents
Index to Financial Statements
Enhance existing offerings and develop new solutions . We have made and will continue to make significant investments in engineering and development to enhance our existing solutions, and to expand the number of our solutions and modules. For example, we launched two new products in 2014: Xactly Insights and Xactly Quota. We intend to continue to work closely with our customers to develop and execute upon our product roadmap.
Expand internationally . We estimate that approximately 28% of our subscribers are located outside of the U.S., based on a representative sample of our user logins during the last two months of the fiscal year ended January 31, 2015. We plan to continue growing our customer base internationally as we believe that there is a significant global market opportunity for our solutions. Given our cloud-based architecture and the highly scalable nature of our solutions, we believe our solutions are particularly well-suited to large, dynamic enterprises with complex, global operations. We plan to expand our sales capability internationally by expanding our direct sales force and by collaborating with partners around the world.
Develop our partner ecosystem . We have established relationships with other organizations to sell and deliver our solutions to customers. These relationships include platform partners, referral partners and consulting and implementation partners. We plan to expand our partner ecosystem in order to increase our market reach.
Pursue selective acquisitions . From time to time, we may seek to acquire businesses and technologies that would increase our value proposition for our customers.
Our products
Our customers leverage our solutions to optimize incentive compensation by automating manual processes, streamlining workflows, providing visibility to users and delivering analyses and actionable insights. Our SaaS solutions are delivered through a scalable, secure cloud-based platform that allows for fast innovation benefiting all customers while keeping their information secure. Our solutions support finance, sales, compensation administrators, information technology and human resources personnel in designing, processing and managing incentive compensation to help achieve company goals.
81
• Xactly Incent Enterprise is our flagship solution and helps large enterprise and mid-market companies manage the critical elements of incentive compensation. Xactly Incent Enterprise helps finance teams take control of their incentive compensation process by automating calculations, streamlining workflows, such as plan documents and payment approvals, accurately forecasting compensation expenses and modeling compensation plans. Xactly Incent Enterprise delivers sales teams real-time visibility into performance against quotas as well as feedback on commissions. Quota dashboards, commission estimators and stacked

Table of Contents
Index to Financial Statements
82
rankings help focus sales representatives on achieving performance goals. Managers can also use these tools to run reports, analyze performance and identify any sales representatives who need coaching. Our users, including sales representatives, merchandizers, bank tellers, postal employees, wedding planners and retail clerks, can access Xactly Incent Enterprise through their desktop or mobile device anytime, anywhere. Key modules for Xactly Incent Enterprise include:
• Xactly eDocs & Approvals is a module that works in conjunction with Xactly Incent Enterprise and is Xactly’s automated document routing and approval solution. With Xactly eDocs & Approvals customers dynamically generate plan documents, certification letters, and payment files based on details provided by Xactly Incent Enterprise. Document routing, review, and approval processes are managed with customizable workflows to automate document management. Customers can choose from a variety of pre-built workflows, or alternatively, they can create their own using a simple and intuitive interface. Xactly eDocs & Approvals sends automatic email notifications and reminders when action is required and allows users to track document status.
• Xactly Analytics is a module that works in conjunction with Xactly Incent Enterprise and helps customers gain a deep understanding of their incentive compensation programs performance. With Xactly Analytics, customers see incentive data and reports in real-time and share these insights across the company without having to spend hours sifting through databases and spreadsheets. This increased visibility helps align employee behavior, which drives employee performance and helps reach company goals. With customized dashboards and reports customers have access to real-time intelligence and insights, therefore allowing them to make important business decisions or adjust business strategies to maximize sales performance and return on investments. From 2012 to 2014, the number of unique users of Xactly Analytics has grown at a compound annual growth rate of 40%.
• Xactly Incent Express is designed to help companies with generally fewer than 350 employees drive behavior to achieve company goals by creating, processing and managing their incentive compensation. This solution is built on the force.com platform offered by Salesforce and, like Xactly Incent Enterprise, delivers features that companies need to incent right with automated calculations, streamlined workflows, real-time visibility through dashboards and commission estimators, and an easy-to-use plan engine to build and modify compensation plans. Xactly Incent Express also has built-in gamification features with leaderboards, badges and other options to keep sales representatives engaged and focused on achieving their goals. Administrators, sales representatives and managers can use mobile devices to access important compensation information on demand.
• Xactly Objectives is built for both sales and non-sales personnel, allowing managers and employees to collaboratively track and achieve individual and shared goals. Xactly Objectives enables managers and employees to clearly define goals while also aligning them to a company’s business objectives. Xactly Objectives provides visibility into, and feedback relating to, incentives that drive employee behavior. Through an intuitive user interface, managers easily input goals and values that employees can then track throughout the week, month, quarter or year. Employees gain visibility into how their work helps the business reach its objectives, and managers gain visibility into employee performance.
• Xactly Territories enables companies to manage sales team alignment by assigning individual sales representatives to specific territories of sales operations, using metrics such as geography, customer size, vertical market, or a set of product offerings. The mapping interface portion of Xactly Territories is provided by one of our partners.
• Xactly Insights enables our customers to create industry-specific benchmarks using our empirical set of aggregated and anonymized data. We gather empirical data, including incentive compensation structures,
Table of Contents
Index to Financial Statements
Customers
Our customer base is diverse, and as of January 31, 2015 we had approximately 725 customers with subscribers located internationally across numerous industries such as business & financial services, communications, high-tech manufacturing, life sciences, media & internet, and SaaS & traditional software. We define our enterprise customers as those customers with a minimum of 4,000 employees and our mid-market customers as those customers with at least 350 and less than 4,000 employees. We also sell to customers with fewer than 350 employees. No single customer accounted for more than 5% of our revenue in the fiscal year ended January 31, 2013, 2014 or 2015. The following is a list of representative customers by industry segment, as selected from our top ten largest customers within each industry segment based on the number of subscribers under contract, as of January 31, 2015:
Case studies
The case studies below illustrate the results some of our customers have achieved by using our solution.
DocuSign
DocuSign, Inc. (DocuSign) is the leading Digital Transaction Management platform that helps companies keep business 100% digital from start to finish. Their platform includes electronic signature technology,
83
performance results, demographic and other data, from the billions of transactions that we process. Our customers are able to compare their compensation plans and practices with those of a peer group or other benchmark that they select. The commercial insights derived from our data help customers make fact-based decisions to motivate employees and drive business performance.
• Xactly Quota automates and improves the quota-setting process based on corporate objectives and disseminates those quotas throughout an organization. With Xactly Quota, managers are able to assign quotas based on a range of inputs including past team performance, customer run-rates and territory potential. Managers are able to review and distribute their teams’ quotas. Once quotas are set, managers initiate a workflow approval process. Xactly Quota integrates with Xactly Incent Enterprise and Xactly Insights.
• Xactly Incent Views brings visibility and understanding to the incentive compensation information trapped inside a customer’s spreadsheet, homegrown or third-party compensation system. Xactly Incent Views gives customers the ability to benefit from Xactly Incent Enterprise’s reporting, analytics and mobile features without the need to replace their existing systems. Xactly Incent Views integrates with Xactly Analytics, Xactly eDocs & Approvals and Xactly Insights.
Business Services High Tech Manufacturing SaaS & Cloud
Long View Systems Corporation MultiView, Inc.
Regus plc
ARRIS Group, Inc. Carl Zeiss AG
Lexmark International, Inc. National Instruments Corporation
DocuSign, Inc. QlikTech International AB
salesforce.com, inc. ServiceNow, Inc.
Workday, Inc.
Communications Life Sciences & Pharma Media & Internet
Akamai Technologies, Inc. Level 3 Communications, Inc.
Palo Alto Networks, Inc. Riverbed Technology, Inc.
Carestream Health, Inc. PerkinElmer, Inc.
Stryker Corporation
Angie’s List, Inc. LinkedIn Corporation
Monster Worldwide, Inc. Tribune Publishing Company
Twitter, Inc.
Table of Contents
Index to Financial Statements
authentication services, bank class security and carrier grade availability for executing business transactions around the world. In 2010, DocuSign wanted to implement a cloud-based solution for its internal compensation process. DocuSign wanted an internal system that would integrate with its CRM system, provide access to its sales people via mobile devices and improve the accuracy of its variable compensation forecasts.
DocuSign selected Xactly Incent Express, which offered integration with Salesforce, rapid implementation and overall cost effectiveness. As of January 31, 2015, the number of Xactly subscribers within DocuSign had increased by several hundred, resulting in an over 1,000% increase, since DocuSign became a customer in 2010, and in 2014, DocuSign migrated from Xactly Incent Express to Xactly Incent Enterprise to take advantage of Xactly’s enterprise solution, including Xactly Analytics and Xactly eDocs & Approvals.
Using Xactly has allowed DocuSign to improve its internal processes and make incentive compensation payments more quickly. In addition, DocuSign has stated that allowing its sales representatives to compare their performance to the incentive compensation plan and estimate their commissions on-demand has improved their performance. DocuSign has also been able to tailor its compensation plans to better optimize outcomes, reduce operational risk and improve internal controls. By using Xactly, DocuSign has been able to develop more accurate variable compensation forecasts, which provide its finance department with more predictability.
Frost Bank
Cullen/Frost Bankers, Inc. (Frost Bank) is a financial holding company, headquartered in San Antonio, Texas. With $28.3 billion in assets at December 31, 2014, Frost Bank is among the top 50 largest banks based in the U.S. For the past three years, Frost Bank had been using an Excel and Access Database system for incentive compensation. Seeking to improve the effectiveness of its commercial bankers, Frost Bank was looking for a more sophisticated incentive administration system to centralize all lines of its business incentives programs. In addition, Frost Bank needed a reporting and analysis capability that would improve management’s ability to both review banker performance and conduct internal audits of the incentive system.
In late 2011, Frost Bank selected Xactly to replace its existing Excel spreadsheets and internal access database systems. Through the use of Xactly Incent Enterprise, Xactly Analytics and Xactly eDocs & Approvals, Frost Bank has achieved enhanced data quality and integrity, along with better adherence to standard business rules and payment and performance results for new incentive programs that can be audited. Frost Bank now uses incentive compensation to pay its front-line branch sales personnel, commercial lending officers, treasury management officers and private bankers.
As a result, Frost Bank’s incentive plans drive the sales teams to improve sales and meet the bank’s corporate goals as staff can access performance information on demand. The program also allows management to monitor banker performance and other financial metrics, leading to overall improved internal controls for the bank’s incentive plans and processes.
LegalZoom
LegalZoom.com, Inc. (LegalZoom) is a nationally recognized online service that meets the legal needs of small business and consumers in the United States. By leveraging the power of technology and people, LegalZoom’s proprietary online legal platform allows its users to create their own legal documents, including corporate formation documents, real estate leases and sales agreements, wills and other estate planning documents and applications to register and protect intellectual property. In addition, LegalZoom offers subscription legal plans, compliance and registered agent services. In 2013, LegalZoom wanted an easily understood, cloud-based incentive compensation system that better aligned the behaviors of its employees with the company’s overall corporate strategy of ensuring long-term customer success.
84
Table of Contents
Index to Financial Statements
LegalZoom selected Xactly Incent Enterprise and Xactly Analytics because it believed Xactly had the most comprehensive incentive solution in the market and the best understanding of LegalZoom’s business needs. With Xactly, LegalZoom has designed and implemented sales incentive plans that both align with the company objectives and provide management the important business intelligence they need to guide the company. Xactly provides sales representatives with optimal visibility into their incentive compensation in real time, which then helps redirect their efforts towards focusing on the needs of the customer and overall lifetime value.
Twitter, Inc. (Twitter) is a global platform for public self-expression and conversation in real time. In 2012, Twitter needed a sales compensation solution that would meet the needs of its rapidly changing and evolving sales force, particularly increased incentive compensation visibility for its sales teams and improved internal controls.
Twitter selected Xactly Incent Enterprise, Xactly Analytics and Xactly eDocs & Approvals to automate its sales compensation processes. In addition to providing the increased visibility and improved internal controls that Twitter’s management needed, the sales teams gained more visibility with respect to their commissions. This increased on-demand transparency has enabled sales representatives to better understand their performance incentives and how their commissions are calculated.
Xactly Incent provided Twitter with the flexibility to easily change internal incentive compensation structures and add new regions and verticals as Twitter’s business grew. As of January 31, 2015, the number of Xactly subscribers at Twitter has more than doubled by several hundred since Twitter became a customer in 2012.
According to Twitter, using Xactly reduced errors and disputes regarding incentive compensation and provided greater visibility for sales representatives. In addition, Twitter’s management reported reduced processing time, improved internal processes and more accurate commission payouts.
Professional services
We believe our professional services are a strategic part of our business. We strive to provide our customers with high-quality configuration and implementation services in order to better ensure a successful customer experience.
We offer a range of professional services, which include assisting customers in implementing our solutions and optimizing their use, such as application configuration, system integration, data transformation and automation services, education and training services and strategic services. These offerings are strategically designed to increase customer retention and ensure optimal use of our solutions. Our implementation and professional services engagements range in duration from a few weeks to several months, depending on the type and size of project. We use a mix of employees, consultants and partners to provide professional services.
We also offer training to both compensation administrators and other users. These training sessions are offered both over the internet and in-person at a central location in San Jose or on-site at our customers’ places of business. In addition, we regularly offer more advanced classes on how to use, administer and customize our service to customers.
Strategic services
As part of our professional services, we launched Xactly Strategic Services in early 2015, which include consulting and subscription offerings that advance our customers’ understanding of industry best practices. Our strategic services include compensation plan design, incentive compensation management program
85
Table of Contents
Index to Financial Statements
optimization and benchmarking through big data analytics and insights. Using Xactly Insights, research and onsite consulting, Xactly Strategic Services helps our customers achieve best practices throughout the incentive compensation lifecycle.
Customer success and support
A cornerstone of our strategy is to focus on customer success, helping to ensure high customer retention rates. We believe that superior customer support is critical to generating growth in new customers, as well as new subscribers and sales of additional modules to existing customers. Our customer support functions are focused on ensuring that our customers use our solutions, and identifying, analyzing and solving problems related to our solutions and services.
Our technical support program provides customers with access to a broad knowledge base so they can better use our solutions. Our standard offering is included in the subscription fee and provides customers with case support and telephone support, along with access to a variety of resources, including a customer success portal and webinars. Our Premium and Premium Plus support offerings are provided at an additional cost and include services such as customer case management and telephone support 24 hours a day, seven days a week. Our customer support offerings are provided by technical support specialists located in San Jose, California, London, United Kingdom and Bangalore, India.
Sales and marketing
We target companies of various sizes, ranging from FORTUNE 50 enterprises to small, emerging companies. We sell our solutions primarily through our direct sales force located in San Jose, California, Denver, Colorado, Washington D.C. and London, United Kingdom. Our direct sales organization, consisting of field representatives, inside sales representatives and account development representatives, is organized by geography and account size and is also responsible for selling our solutions, services and support to new and existing customers. We also go to market with our partners, which include Apttus Corporation (Apttus), BigMachines, Inc. (a division of Oracle Corporation) (BigMachines), Ceridian, DocuSign, FPX, LLC (FPX), Intacct Corporation (Intacct), OpenSymmetry, Inc, (OpenSymmetry), Salesforce, SAP, SteelBrick, Inc. (SteelBrick) and ZS Associates, Inc. (ZS Associates).
Our marketing activities are designed to build awareness of our brand and solutions and to generate customer demand and leads. While our marketing programs have traditionally targeted finance executives and those in sales operations and senior sales roles, we are also increasingly targeting information technology and human resources professionals. We engage in a broad range of marketing activities and our principal marketing programs include:
86
• engaging in online marketing activities, including through our website, direct email, online web advertising, blogs and webinars;
• participating in field marketing events for customers and prospects, including user conferences, trade shows and industry events;
• staffing business and account development representatives who help convert leads into new sales opportunities;
• engaging in public relations, media relations and analyst relations;
• engaging in cooperative marketing efforts with partners, including joint press announcements, joint trade shows, channel marketing campaigns and joint seminars; and
Table of Contents
Index to Financial Statements
In addition, we host our annual CompCloud global user conference where current and potential customers participate in programs designed to help drive business results through the use of our solutions. This conference features a variety of prominent keynote and customer speakers, panelists and presentations focused on businesses of all sizes, across a wide range of industries. Attendees also gain insight into our recent solution releases and enhancements and participate in interactive sessions that give them the opportunity to express opinions on new features and functionality.
Partnerships
An important element of our strategy is to establish and maintain relationships with key industry leaders to help us evangelize, enable and ensure the adoption and continued use of our solutions. We have established a network of relationships that broaden and complement our solution offerings and increase our value to our customers. These key partnerships break down into three categories:
Technology infrastructure and operations
We believe that our cloud-based, SaaS solutions enable us to develop and deliver functionality to customers more efficiently than traditional on-premise enterprise software vendors can. We have designed true multi-tenant cloud solutions and we have built our solutions on a modular, secure, highly available and scalable platform.
We build our solutions using service-oriented architecture principles and employ proprietary and third-party technologies. Our applications are written in industry-standard software programming languages including a standardized Java-based development environment, Hadoop and SQL relational database query language. We use commercially available hardware and a combination of proprietary, open source and commercially available software to provide our service. We have a purpose-built, modular, service-oriented platform that allows us to balance customer workloads tuned to our specific environment, allowing us to continue to scale in a fault-tolerant fashion. The platform architecture is designed to allow us to provide the high levels of uptime required by our customers, and to meet or exceed our 99.7% uptime commitment in our service-level agreements, excluding planned downtime. Our customers can access our solutions through mobile devices or through any certified web browser without installing or downloading applets.
Our solutions treat all customers as logically separate tenants utilizing shared application services and databases. We are able to spread the cost of delivering our service across our user base. In addition, because we do not have to manage thousands of distinct applications or application versions with their own business logic and database schemas, we can rapidly scale our business. As a result, we are able to simultaneously and seamlessly update our solutions on a monthly basis for all our customers.
87
• providing thought leadership by authoring and disseminating information about incentive compensation, sales and employee performance management.
• Platform partners allow us to interoperate with their APIs, which is an important part of our solutions strategy and includes providers such as Oracle Corporation, Salesforce and SAP AG.
• Referral partners work closely with us on joint go-to-market strategies and refer new opportunities to us. Our key referral partners include Apttus, BigMachines, Ceridian, DocuSign, FPX, Intacct, Salesforce, SAP, SteelBrick and ZS Associates.
• Consulting and implementation partners engage with us on consulting and implementation services at both the strategic and tactical levels. Our key consulting and implementation partners include Deloitte LLP, OpenSymmetry and ZS Associates.
Table of Contents
Index to Financial Statements
Our solution is flexible. Every page is dynamically rendered for each user, adhering to role-based security settings, including dynamic currency conversion support. As a result, our solution can display different views of data based on a number of factors, including user, department and area of responsibility in the company. We have also developed extensive reporting and analytics functionality that provides near real-time analysis of a customer’s data.
Our solutions can be integrated into other applications using secure internet network protocols. Through our platform, we allow customers and partners to insert, update, delete and query information in our solutions. We also have mechanisms to protect and govern the use of our solutions to ensure that all customers, regardless of size, have access to our solutions.
Security is central to our solutions and includes physical security, network security, application security and security at our third-party data centers. Our security measures are audited as part of our Statements on Standards for Attestation Engagements No. 16 (SSAE-16) attestations by a third-party auditor. In addition, our customers only interact with our solutions over secure internet protocols.
We serve all our customers and subscribers from primary data centers located in Virginia and Northern California. Both data centers are SSAE-16 Type 2 audited and are secured by around-the-clock guards, biometric access screening and escort-controlled access, and are supported by on-site backup generators in the event of a power failure, with fully redundant heating, ventilation and air conditioning systems.
Research and development
Our ability to compete depends in large part on our continuous commitment to research and development and our ability to rapidly introduce new applications, technologies, features and functionality into our solutions. Our research and development efforts are focused on improving and enhancing our existing service offerings by working closely with our customers, conducting quality assurance testing and improving our core technology as well as developing new proprietary services and solutions. Performance, security, functional depth and breadth, and usability of our solutions drive our technology decisions and product development.
We devote a significant portion of our resources to research and development. Research and development expenses were $6.6 million, $9.1 million and $11.9 million for the fiscal years ended January 31, 2013, 2014 and 2015, respectively, and $3.5 million for the three months ended April 30, 2015.
Competition
The market for incentive compensation solutions for employee and sales performance management is evolving, highly competitive and significantly fragmented. With the introduction of new technologies and the potential entry of new competitors into the market, we expect competition to increase and intensify in the future, which could harm our ability to increase sales, maintain or increase renewals and maintain our prices.
We compete primarily with companies offering incentive compensation and employee and sales performance management applications via hybrid cloud-based and on-premise solutions. We also compete with spreadsheets, homegrown systems, and toolsets and products developed by software providers that allow customers to build new applications that run on the customers’ current infrastructure or as hosted services. Our competitors include Callidus, Cognos and Oracle.
We believe the principal competitive factors in our market include the following:
88
• technology architecture (multi-tenant SaaS versus on-premise or hosted); • level of customer satisfaction; • ease of deployment;
Table of Contents
Index to Financial Statements
Some of our current competitors have, and future competitors may have, greater financial, technical, marketing and other resources, greater resources to devote to the development, promotion, sale and support of their products and services, more extensive customer bases and broader customer relationships, and longer operating histories and greater name recognition. As a result, these competitors may be better able to respond quickly to new technologies and to undertake more extensive marketing campaigns. In a few cases, some competitors may also be able to offer competing solutions at little or no additional cost by bundling them with their existing suite of solutions.
Intellectual property
We rely on a combination of copyrights, trademarks, service marks, trade secrets, confidentiality procedures and contractual restrictions to establish and protect our proprietary rights in our solutions and services. As of June 25, 2015, we had three pending U.S. patent applications. We intend to pursue additional patent protection. We have registered trademarks for “Xactly,” the Xactly logo, “Inspire Performance,” and certain other marks in the U.S. and several other jurisdictions. We are also the registered holder of a variety of domestic and international domain names that include “xactlycorp.com” and similar variations. We license software from third parties for integration into our solutions, including open source software and other software available on commercially reasonable terms. All our employees and independent contractors are required to sign agreements acknowledging that all inventions, trade secrets, works of authorship, developments and other processes generated by them on our behalf are our property and assigning to us any ownership that they may claim in those works. In addition, we generally enter into confidentiality agreements with our employees, consultants, vendors and customers, and generally limit access to and distribution of our proprietary information.
Despite our precautions, it may be possible for unauthorized third parties to copy our solutions or otherwise circumvent our intellectual property protection and use information that we regard as proprietary to create competing products and services. Some license provisions protecting against unauthorized use, copying, transfer and disclosure of our solutions may be unenforceable under the laws of certain jurisdictions and foreign countries. In addition, the laws of some countries do not protect proprietary rights to the same extent as the laws of the U.S., and many foreign countries do not enforce these laws as diligently as government agencies and private parties in the U.S. To the extent we expand our international activities, our exposure to unauthorized copying and use of our solutions and misappropriation of our proprietary information may increase.
We expect that software and other solutions in our industry increasingly may be subject to third-party infringement claims as the number of competitors grows and the functionality of solutions in different industry
89
• ease of use; • breadth and depth of application functionality; • total costs of ownership; • pricing of solutions; • brand awareness and reputation; • sophistication of technology platform; • actionable insights through big data analytics; • capability for customization, configurability, integration, security, scalability and reliability of applications; • ability to innovate and respond to customer needs rapidly; • domain expertise; • size of customer base and level of user adoption; and • ability to integrate with legacy enterprise infrastructures and third-party applications.
Table of Contents
Index to Financial Statements
segments overlaps. Moreover, many of our competitors and other industry participants have been issued patents and/or have filed patent applications, and have asserted claims and related litigation regarding patent and other intellectual property rights. From time to time, third parties, including certain of these companies, have asserted patent, copyright, trademark, trade secret and other intellectual property rights within the industry. Any of these third parties might in the future make a claim of infringement against us.
Government regulation
We are subject to a number of federal, state, and international laws and regulations regarding data governance and the privacy and protection of consumer data that affect companies conducting business on the internet. In particular, we comply with the U.S.-E.U. and U.S.-Swiss Safe Harbor Frameworks as set forth by the U.S. Department of Commerce, under which we commit to treat the personal data of E.U. residents in accordance with identified privacy principles.
In addition, many of our customers and potential customers, including those in the healthcare, financial services and other industries are subject to substantial regulation in the U.S. and in foreign jurisdictions regarding their collection, use and protection of data and may be the subject of further regulation in the future. These various laws and regulations are often evolving and sometimes conflict. Many international and domestic laws require notification to users when there is a security breach of their sensitive personal data, such as the 2002 amendment to California’s Information Practices Act. Other domestic and foreign laws and regulations require the adoption and maintenance of information security standards to protect certain types of data. We expect the costs of compliance with these laws and regulations to increase in the future as a result of additional laws and regulations and changes in legal interpretation. Furthermore, any failure on our part to comply with these laws and regulations, or any laws or regulations that may be promulgated in the future, may subject us to significant liabilities and fines.
Employees
As of April 30, 2015, we had 345 employees, with 95 in research and development, 135 in sales and marketing, 87 in operations, customer support and professional services, and 28 in general and administrative. Of these employees, 267 were located in the U.S. and 78 were located internationally. Our employees are not covered by collective bargaining agreements. We believe our employee relations are good.
XactlyOne Foundation
In May 2015, we established the XactlyOne Foundation as a non-profit organization, and we issued 50,000 shares of our common stock to it. The proposed programs of the XactlyOne Foundation include grants, volunteerism and other projects. We believe the XactlyOne Foundation will foster employee morale, strengthen our community presence and provide increased brand visibility. We will incur a non-cash expense in the quarter ending July 31, 2015 equal to the fair value of the shares of our common stock issued to the XactlyOne Foundation.
Facilities
Our corporate headquarters and executive offices are located in San Jose, California, where we currently occupy approximately 40,000 square feet of office space under a lease that expires January 31, 2021, with an option to extend the lease until January 31, 2026. We maintain additional offices in Denver, Colorado, Washington, D.C., London, United Kingdom and Bangalore, India. We lease all our facilities, and we do not own any real property. We believe that our existing facilities are adequate for our current needs and that we will be able to lease suitable additional or alternative space on commercially reasonable terms if and when we need it.
90

Table of Contents
Index to Financial Statements
Legal proceedings
From time to time we may become involved in legal proceedings or be subject to claims arising in the ordinary course of our business. We have been, and may in the future be, put on notice and/or sued by third parties for alleged infringement of their proprietary rights. Although the results of litigation and claims cannot be predicted with certainty, we currently believe that the final outcome of these ordinary course matters will not have a material adverse effect on our business, operating results, financial condition or cash flows. Regardless of the outcome, litigation can have an adverse impact on us because of defense and settlement costs, diversion of management resources and other factors.
91
Table of Contents
Index to Financial Statements
Management
Executive officers, key employees and directors
The following table sets forth the names, ages and positions of our executive officers, key employees and directors as of May 31, 2015:
Executive officers
Christopher W. Cabrera is our founder and has served as our Chief Executive Officer and a director since March 2005. Mr. Cabrera also served as our President from March 2005 to April 2015. Prior to joining us, Mr. Cabrera served in various executive positions and most recently as Senior Vice President, Operations at Callidus, a publicly listed enterprise software company, from December 1998 until February 2005. Mr. Cabrera was named the 2011 “Alumni Entrepreneur of the Year” by the Lloyd Greif Center for Entrepreneurial Studies at the USC Marshall School of Business. We believe that Mr. Cabrera possesses specific attributes that qualify him to serve as a member of our board of directors, including the perspective and experience he brings as our Chief Executive Officer and his substantial expertise in sales performance management, sales compensation and SaaS delivery models. As our founder and the longest serving member of our board of directors, Mr. Cabrera also has a deep understanding of our customer base and our business as it has evolved over time. Mr. Cabrera holds a B.S. in Business Administration from University of Southern California and an M.B.A from Santa Clara University.
92
Name Age Position
Executive officers
Christopher W. Cabrera 48 Chief Executive Officer and Director
Joseph C. Consul 55 Chief Financial Officer, Treasurer and Assistant Secretary
L. Evan Ellis, Jr. 60 President and Chief Operating Officer
Key employees
Scott R. Broomfield 58 Chief Marketing Officer
Steven J. De Marco 49 Vice President of Worldwide Sales and Alliances
Bernard G. Kassar 44 Senior Vice President Customer Success and Support
Colleen M. Pouliot 57 General Counsel and Secretary
Ron W. Rasmussen 53 Chief Technology Officer and Senior Vice President of Engineering
Non-employee directors
Gerald S. Casilli 76 Director
Neal Dempsey 74 Director
Earl E. Fry 56 Director
Carol G. Mills 61 Chair of the Board
Cynthia B. Padnos 58 Director
David W. Pidwell 67 Director
John P. Ward, Jr. 49 Director
(1) Member of the audit committee.
(2) Member of the compensation committee.
(3) Member of the nominating and corporate governance committee.
(1)
(2)(3)
(1)
(2)(3)
(1)
(2)
Table of Contents
Index to Financial Statements
Joseph C. Consul has served as our Chief Financial Officer since June 2012 and our Treasurer and Assistant Secretary since February 2014. Prior to joining us, Mr. Consul served as Executive Vice President and Chief Financial Officer at LogLogic, Inc., a security management platform company acquired by TIBCO Software Inc. in April 2012, from May 2008 to April 2012. Prior to that, Mr. Consul served as Chief Financial Officer at several companies, including Everdream Corporation, Arcot Systems, Inc. and Tumbleweed Communications Corp., a then-publicly listed company. Mr. Consul holds a B.S. in Business Administration from San Jose State University and an M.B.A from University of Southern California.
L. Evan Ellis, Jr. has served as our President and Chief Operating Officer since April 2015 and served as our Chief Operating Officer from January 2009 to April 2015. Prior to that Mr. Ellis served as our Senior Vice President of Worldwide Operations from November 2007 to April 2009. Earlier in his career, Mr. Ellis held management positions at various companies, including Chief Operating Officer at Serena Software, Inc., a then-publicly listed company, President & Chief Operating Officer at CyberSource Corporation, a then-publicly listed company, Senior Vice President of Marketing and Americas Field Operations at Silicon Graphics, Inc., a then-publicly listed company, and senior management positions at International Business Machines Corporation. Mr. Ellis holds a B.A. in Economics from the University of California, Los Angeles.
Key employees
Scott R. Broomfield has served as our Chief Marketing Officer since May 2013. He previously served as our Senior Vice President and General Manager SMB from June 2012 to May 2013 and as our Chief Financial Officer from September 2010 to June 2012. From January 2007 to September 2010, Mr. Broomfield served as Chairman and Chief Executive Officer at Veeple, Inc., an interactive on-line video business he co-founded. Earlier in his career Mr. Broomfield held senior management positions at various companies, including Chief Executive Officer at Xtegra Corporation, Visuale, Inc. and Centura Software Corporation, a then-publicly listed company. Mr. Broomfield holds a B.A. in Psychology from Azusa Pacific University and an M.B.A from Santa Clara University.
Steven J. De Marco has served as our Vice President of Worldwide Sales since May 2013 and as our Vice President of Worldwide Sales and Alliances since April 2015. He previously served as our Vice President, Corporate Sales from June 2011 to May 2013 and as Vice President of Worldwide Sales from September 2008 to June 2011. Prior to that he served as our Vice President, Business Development from August 2005 to September 2008. Earlier in his career, Mr. De Marco held a variety of sales and sales management positions at various companies, including Callidus, Informatica Corporation (Informatica), a publicly listed company, and Influence Software. Mr. De Marco holds a B.S. in Industrial Engineering from Cal Polytechnic State University.
Bernard G. Kassar has served as our Senior Vice President Customer Success and Support since November 2013 and as our Vice President of Customer Success and Support since July 2008. Prior to joining us, Mr. Kassar served as Director, Strategic Business Development at Endeca Technologies, a data management and web commerce software company acquired by Oracle, from 2006 to 2007. From July 1999 to November 2006, he held a variety of positions, including Senior Director of Business Development and Global Alliances and Director of Customer Advocacy and Field Marketing, at Callidus. Earlier in his career, he held various roles in sales and business development at Compuware Corporation, a publicly listed company, Great Lakes InfoTronics, Inc. and Deluxe Corporation. Mr. Kassar holds a B.S. in Speech Communications from University of Minnesota.
Colleen M. Pouliot has served as our General Counsel since October 2013 and Secretary since February 2014. Prior to joining us, Ms. Pouliot was engaged in the private practice of law from April 2002 to September 2013. She served as a member of the board of directors of Adobe Systems Incorporated from November 2001 to March 2009. Earlier in her career, Ms. Pouliot was Senior Vice President, General Counsel and Secretary at
93
Table of Contents
Index to Financial Statements
Adobe Systems Incorporated and practiced law at Gray Cary Ware & Freidenrich LLP, now DLA Piper (US) LLP. Ms. Pouliot holds a B.S. in Economics, summa cum laude, from Santa Clara University and a J.D. from University of California, Davis.
Ron W. Rasmussen has served as our Chief Technical Officer and Senior Vice President, Engineering since November 2013 and as our Vice President, Engineering since November 2011. Prior to joining us, Mr. Rasmussen served as Vice President of Engineering at Quova Inc., an IP intelligence and geolocation data company acquired by NeuStar, Inc., from March 2010 to November 2011. From August 2008 to October 2009, he served as Vice President of Engineering at Lithium Technologies, Inc., a provider of social customer experience management software. Earlier in his career, Mr. Rasmussen held a variety of engineering roles at various companies, including KnowNow, Inc. and Digital Impact, Inc. Mr. Rasmussen holds a B.A. in Computer and Information Sciences and in Economics from University of California, Santa Cruz.
Board of directors
Gerald S. Casilli has served as a member of our board of directors since August 2005. Mr. Casilli has been a general partner of Rembrandt Venture Partners, a venture capital firm he co-founded, since March 2004. Prior to that, Mr. Casilli served as Chairman of the board of directors of IKOS Systems, Inc. and previously served as its Chief Executive Officer from 1989 to 1995. Mr. Casilli previously was a founding member of Trinity Ventures and Genesis Capital. Earlier in his career, Mr. Casilli also founded Millennium Systems. Mr. Casilli serves on the board of directors of several privately-held companies and has previously served on the board of directors of several public companies. We believe that Mr. Casilli possesses specific attributes that qualify him to serve as a member of our board of directors, including his experience as a director of several technology companies and his substantial experience as a venture capital investment professional.
Neal Dempsey has served as a member of our board of directors since April 2008. Mr. Dempsey joined Bay Partners, a venture capital firm, as a general partner in May 1989 and has served as the managing general partner since July 2001. Since April 2005, he has been a member of the board of directors of Apigee Corporation, a provider of a software platform for application programming interfaces, since April 2010, he has been a member of the board of directors of Enphase Energy, Inc., a solar energy management device maker, and previously he served as a member of the board of directors of Eloqua, Inc. from August 2006 to February 2013 and Guidewire Software, Inc. from 2006 to December 2013. We believe that Mr. Dempsey possesses specific attributes that qualify him to serve as a member of our board of directors, including his experience as a director of several technology software companies.
Earl E. Fry has served as a member of our board of directors since September 2005. Since November 2014, Mr. Fry has been Chief Customer Officer and Executive Vice President, Operations Strategy at Informatica, an enterprise data integration software company he joined in December 1999, having previously held the positions of Chief Financial Officer, Chief Administrative Officer and Executive Vice President, Global Customer Support and Services. Since April 2005, Mr. Fry has been a member of the board of directors of Central Pacific Financial Corp., a bank holding company. We believe that Mr. Fry possesses specific attributes that qualify him to serve as a member of our board of directors, including his professional experience in the areas of finance, accounting and audit oversight.
Carol G. Mills has served as the chair of our board of directors since February 2010. Ms. Mills has been an independent consultant since February 2006. Since September 2013, Ms. Mills has been a member of the board of directors of Alaska Communications Systems Group, Inc., a provider of broadband solutions, since September 2013 and Ingram Micro Inc., an electronics company and information technology distributor, since June 2014, and previously served as a member of the board of directors of Adobe Systems Incorporated from 1998 to April
94
Table of Contents
Index to Financial Statements
2011, Blue Coat Systems, Inc. from January 2009 to February 2012 and Tekelec from June 2007 to January 2012. We believe that Ms. Mills possesses specific attributes that qualify her to serve as the chair of our board of directors, including her substantial corporate governance, operational and financial experience gained from serving on the boards of directors of several public companies.
Cynthia B. Padnos has served as a member of our board of directors since March 2006. Ms. Padnos has been a managing partner at Illuminate Ventures, a venture capital firm she founded, since January 2009. From March 2004 to December 2008, she served as a director at Outlook Ventures, a venture capital firm. Ms. Padnos serves on the board of directors of a number of privately-held companies. We believe that Ms. Padnos possesses specific attributes that qualify her to serve as a member of our board of directors, including her experience as a venture capital investment professional and her substantial expertise in SaaS and technology services companies.
David W. Pidwell has served as a member of our board of directors since September 2005. Mr. Pidwell has been a venture partner at Alloy Ventures since January 1996. Mr. Pidwell serves on the board of directors of a privately-held company and previously served on the board of directors of Informatica from February 1996 to May 2012. We believe that Mr. Pidwell possesses specific attributes that qualify him to serve as a director, including his substantial experience as a venture capital investment professional and his expertise in technology companies.
John P. Ward, Jr. has served as a member of our board of directors since January 2009. Mr. Ward has been a managing director at Key Venture Partners since January 2007 and a managing partner at Unit Economic Investors, LLC, since April 2011. Mr. Ward serves on the board of directors of several privately-held companies. We believe that Mr. Ward possesses specific attributes that qualify him to serve as a director, including his experience as a venture capital investment professional, his substantial expertise in on-demand delivery models and technology services companies.
There are no family relationships among any of our directors or executive officers.
Code of business conduct and ethics
Effective upon the closing of this offering, our board of directors will adopt a code of business conduct and ethics that applies to all of our employees, officers and directors, including our Chief Executive Officer and Chief Financial Officer. The full text of our code of business conduct and ethics will be posted on the investor relations page on our website at www.xactlycorp.com. We intend to disclose any amendments to or waivers of our code of business conduct and ethics on our website or in filings under the Exchange Act. The inclusion of our website address in this prospectus does not incorporate by reference the information on or accessible through our website into this prospectus.
Board of directors
Our business and affairs are managed under the direction of our board of directors. The number of directors will be fixed by our board of directors, subject to the terms of our amended and restated certificate of incorporation and amended and restated bylaws that will become effective immediately prior to the completion of this offering. Upon the completion of this offering, our board of directors will consist of eight directors, seven of whom will qualify as “independent” under the New York Stock Exchange listing standards.
In accordance with our amended and restated certificate of incorporation and our amended and restated bylaws, immediately after the completion of this offering our board of directors will be divided into three classes with staggered three-year terms. Only one class of directors will be elected at each annual meeting of
95
Table of Contents
Index to Financial Statements
our stockholders, with the other classes continuing for the remainder of their respective three-year terms. Our directors will be divided among the three classes as follows:
The division of our board of directors into three classes with staggered three-year terms may delay or prevent a change of our management or a change of control. Under Delaware law, our directors may be removed for cause by the affirmative vote of the holders of a majority of our outstanding voting stock. Directors may not be removed by our stockholders without cause.
Any increase or decrease in the number of directors will be distributed among the three classes so that, as nearly as possible, each class will consist of one-third of the directors.
Director independence
Our board of directors has undertaken a review of the independence of each director. Based on information provided by each director concerning his or her background, employment and affiliations, our board of directors has determined that Messrs. Casilli, Dempsey, Fry, Pidwell, and Ward and Mses. Mills and Padnos do not have a relationship that would interfere with the exercise of independent judgment in carrying out the responsibilities of a director and that each of these directors is “independent” as that term is defined under the listing standards of the New York Stock Exchange. In making these determinations, our board of directors considered the current and prior relationships that each non-employee director has with our company and all other facts and circumstances our board of directors deemed relevant in determining each non-employee director’s independence, including the beneficial ownership of our capital stock by each non-employee director, and the transactions involving any non-employee director described in the section titled “Certain relationships, related party and other transactions.”
Committees of the board of directors
Our board of directors has established an audit committee, a compensation committee and a nominating and corporate governance committee. The composition and responsibilities of each of the committees of our board of directors is described below. Members will serve on these committees until their resignation or until as otherwise determined by our board of directors.
Audit committee
Our audit committee consists of Messrs. Casilli and Fry and Ms. Padnos, with Mr. Fry serving as Chair, each of whom meets the requirements for independence under the applicable rules and regulations of the Securities and Exchange Commission (SEC) and the listing standards of the New York Stock Exchange. Each member of our audit committee also meets the financial literacy and sophistication requirements of the listing standards of the New York Stock Exchange. In addition, our board of directors has determined that Mr. Fry is an audit committee financial expert within the meaning of Item 407(d) of Regulation S-K under the Securities Act. Our audit committee, among other things:
96
• the Class I directors will be Messrs. Cabrera and Fry, and their terms will expire at the annual meeting of stockholders to be held in 2016;
• the Class II directors will be Ms. Mills and Messrs. Pidwell and Ward, and their terms will expire at the annual meeting of stockholders to be held in 2017; and
• the Class III directors will be Messrs. Casilli and Dempsey and Ms. Padnos, and their terms will expire at the annual meeting of stockholders to be held in 2018.
• selects a qualified firm to serve as the independent registered public accounting firm to audit our financial statements;
Table of Contents
Index to Financial Statements
Our audit committee operates under a written charter that satisfies the applicable rules and regulations of the SEC and the listing standards of the New York Stock Exchange.
Compensation committee
Our compensation committee consists of Ms. Mills and Messrs. Dempsey and Ward, with Ms. Mills serving as Chair, each of whom meets the requirements for independence under the applicable rules and regulations of the SEC and the listing standards of the New York Stock Exchange. Each member of our compensation committee is also a non-employee director, as defined pursuant to Rule 16b-3 promulgated under the Exchange Act (Rule 16b-3), and an outside director, as defined pursuant to Section 162(m) of the Code. Our compensation committee, among other things:
Our compensation committee operates under a written charter that satisfies the applicable rules and regulations of the SEC and the listing standards of the New York Stock Exchange.
Nominating and corporate governance committee
Our nominating and corporate governance committee consists of Mr. Dempsey and Ms. Mills, with Mr. Dempsey serving as Chair, each of whom meets the requirements for independence under the applicable rules and regulations of the SEC and the listing standards of the New York Stock Exchange. Our nominating and corporate governance committee, among other things:
97
• helps to ensure the independence and performance of the independent registered public accounting firm;
• discusses the scope and results of the audit with the independent registered public accounting firm, and reviews, with management and the independent registered public accounting firm, our interim and year-end operating results;
• develops procedures for employees to submit concerns anonymously about questionable accounting or audit matters;
• reviews our policies on and oversees risk assessment and risk management, including enterprise risk management;
• reviews related party transactions; and
• approves or, as required, pre-approves, all audit and all permissible non-audit services, other than de minimis non-audit services, to be performed by the independent registered public accounting firm.
• reviews, approves and determines the compensation of our executive officers and key employees;
• reviews, approves and determines compensation and benefits, including equity awards, to directors for service on the board of directors or any committee thereof;
• administers our equity compensation plans;
• reviews, approves and makes recommendations to our board of directors regarding incentive compensation and equity compensation plans; and
• establishes and reviews general policies relating to compensation and benefits of our employees.
• identifies, evaluates and selects, or makes recommendations to our board of directors regarding, nominees for election to our board of directors and its committees;
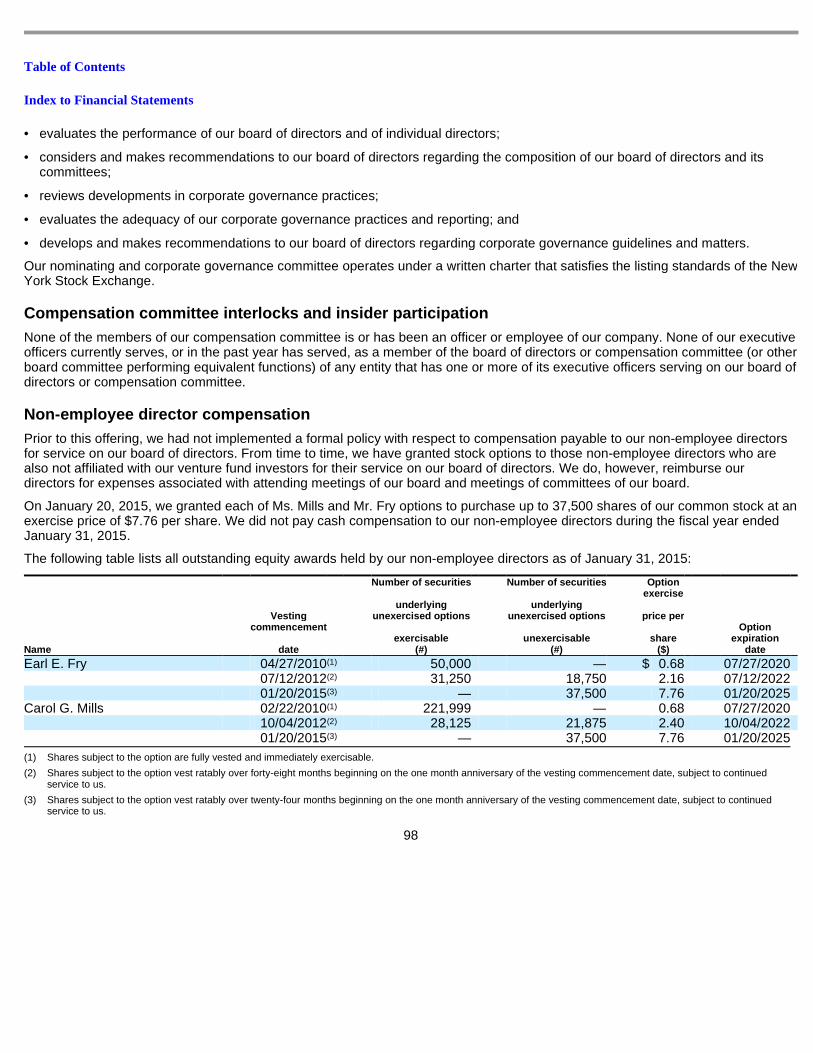
Table of Contents
Index to Financial Statements
Our nominating and corporate governance committee operates under a written charter that satisfies the listing standards of the New York Stock Exchange.
Compensation committee interlocks and insider parti cipation
None of the members of our compensation committee is or has been an officer or employee of our company. None of our executive officers currently serves, or in the past year has served, as a member of the board of directors or compensation committee (or other board committee performing equivalent functions) of any entity that has one or more of its executive officers serving on our board of directors or compensation committee.
Non-employee director compensation
Prior to this offering, we had not implemented a formal policy with respect to compensation payable to our non-employee directors for service on our board of directors. From time to time, we have granted stock options to those non-employee directors who are also not affiliated with our venture fund investors for their service on our board of directors. We do, however, reimburse our directors for expenses associated with attending meetings of our board and meetings of committees of our board.
On January 20, 2015, we granted each of Ms. Mills and Mr. Fry options to purchase up to 37,500 shares of our common stock at an exercise price of $7.76 per share. We did not pay cash compensation to our non-employee directors during the fiscal year ended January 31, 2015.
The following table lists all outstanding equity awards held by our non-employee directors as of January 31, 2015:
98
• evaluates the performance of our board of directors and of individual directors;
• considers and makes recommendations to our board of directors regarding the composition of our board of directors and its committees;
• reviews developments in corporate governance practices;
• evaluates the adequacy of our corporate governance practices and reporting; and
• develops and makes recommendations to our board of directors regarding corporate governance guidelines and matters.
Name
Vesting commencement
date
Number of securities
underlying unexercised options
exercisable
(#)
Number of securities
underlying unexercised options
unexercisable
(#)
Option exercise
price per
share
($)
Option expiration
date
Earl E. Fry 04/27/2010 50,000 — $ 0.68 07/27/2020 07/12/2012 31,250 18,750 2.16 07/12/2022 01/20/2015 — 37,500 7.76 01/20/2025
Carol G. Mills 02/22/2010 221,999 — 0.68 07/27/2020 10/04/2012 28,125 21,875 2.40 10/04/2022 01/20/2015 — 37,500 7.76 01/20/2025
(1) Shares subject to the option are fully vested and immediately exercisable.
(2) Shares subject to the option vest ratably over forty-eight months beginning on the one month anniversary of the vesting commencement date, subject to continued service to us.
(3) Shares subject to the option vest ratably over twenty-four months beginning on the one month anniversary of the vesting commencement date, subject to continued service to us.
(1)
(2)
(3)
(1)
(2)
(3)
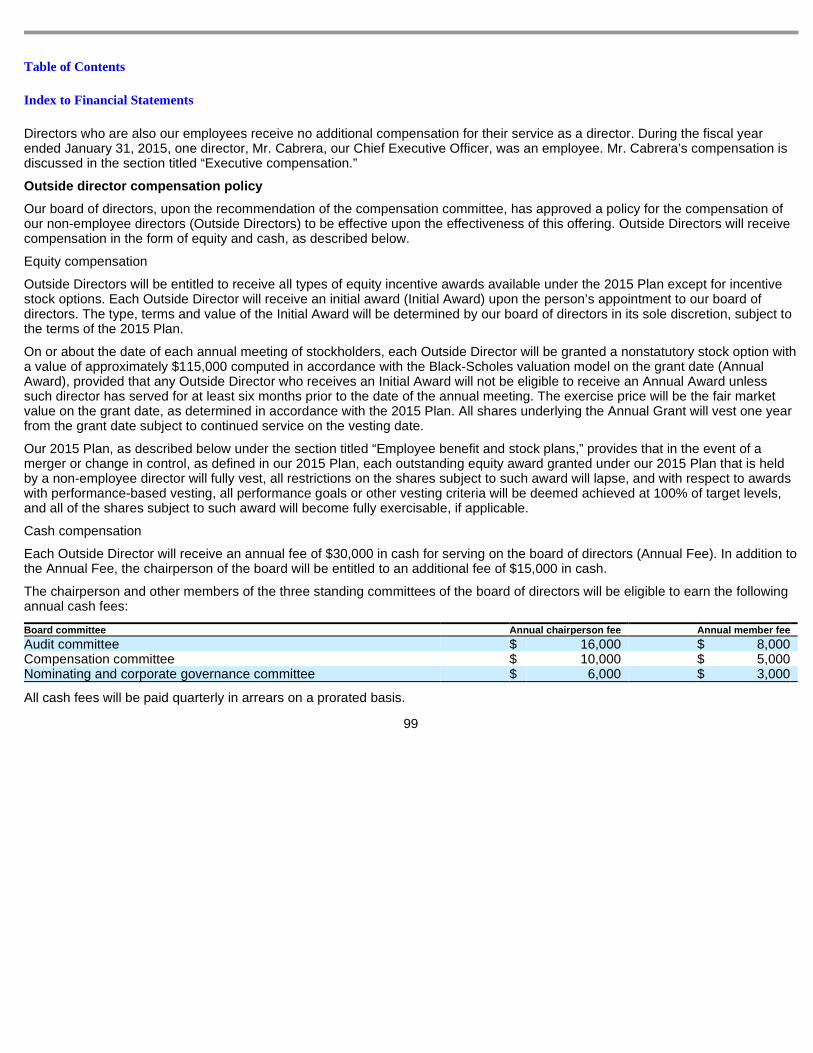
Table of Contents
Index to Financial Statements
Directors who are also our employees receive no additional compensation for their service as a director. During the fiscal year ended January 31, 2015, one director, Mr. Cabrera, our Chief Executive Officer, was an employee. Mr. Cabrera’s compensation is discussed in the section titled “Executive compensation.”
Outside director compensation policy
Our board of directors, upon the recommendation of the compensation committee, has approved a policy for the compensation of our non-employee directors (Outside Directors) to be effective upon the effectiveness of this offering. Outside Directors will receive compensation in the form of equity and cash, as described below.
Equity compensation
Outside Directors will be entitled to receive all types of equity incentive awards available under the 2015 Plan except for incentive stock options. Each Outside Director will receive an initial award (Initial Award) upon the person’s appointment to our board of directors. The type, terms and value of the Initial Award will be determined by our board of directors in its sole discretion, subject to the terms of the 2015 Plan.
On or about the date of each annual meeting of stockholders, each Outside Director will be granted a nonstatutory stock option with a value of approximately $115,000 computed in accordance with the Black-Scholes valuation model on the grant date (Annual Award), provided that any Outside Director who receives an Initial Award will not be eligible to receive an Annual Award unless such director has served for at least six months prior to the date of the annual meeting. The exercise price will be the fair market value on the grant date, as determined in accordance with the 2015 Plan. All shares underlying the Annual Grant will vest one year from the grant date subject to continued service on the vesting date.
Our 2015 Plan, as described below under the section titled “Employee benefit and stock plans,” provides that in the event of a merger or change in control, as defined in our 2015 Plan, each outstanding equity award granted under our 2015 Plan that is held by a non-employee director will fully vest, all restrictions on the shares subject to such award will lapse, and with respect to awards with performance-based vesting, all performance goals or other vesting criteria will be deemed achieved at 100% of target levels, and all of the shares subject to such award will become fully exercisable, if applicable.
Cash compensation
Each Outside Director will receive an annual fee of $30,000 in cash for serving on the board of directors (Annual Fee). In addition to the Annual Fee, the chairperson of the board will be entitled to an additional fee of $15,000 in cash.
The chairperson and other members of the three standing committees of the board of directors will be eligible to earn the following annual cash fees:
All cash fees will be paid quarterly in arrears on a prorated basis.
99
Board committee Annual chairperson fee Annual member fee
Audit committee $ 16,000 $ 8,000 Compensation committee $ 10,000 $ 5,000 Nominating and corporate governance committee $ 6,000 $ 3,000
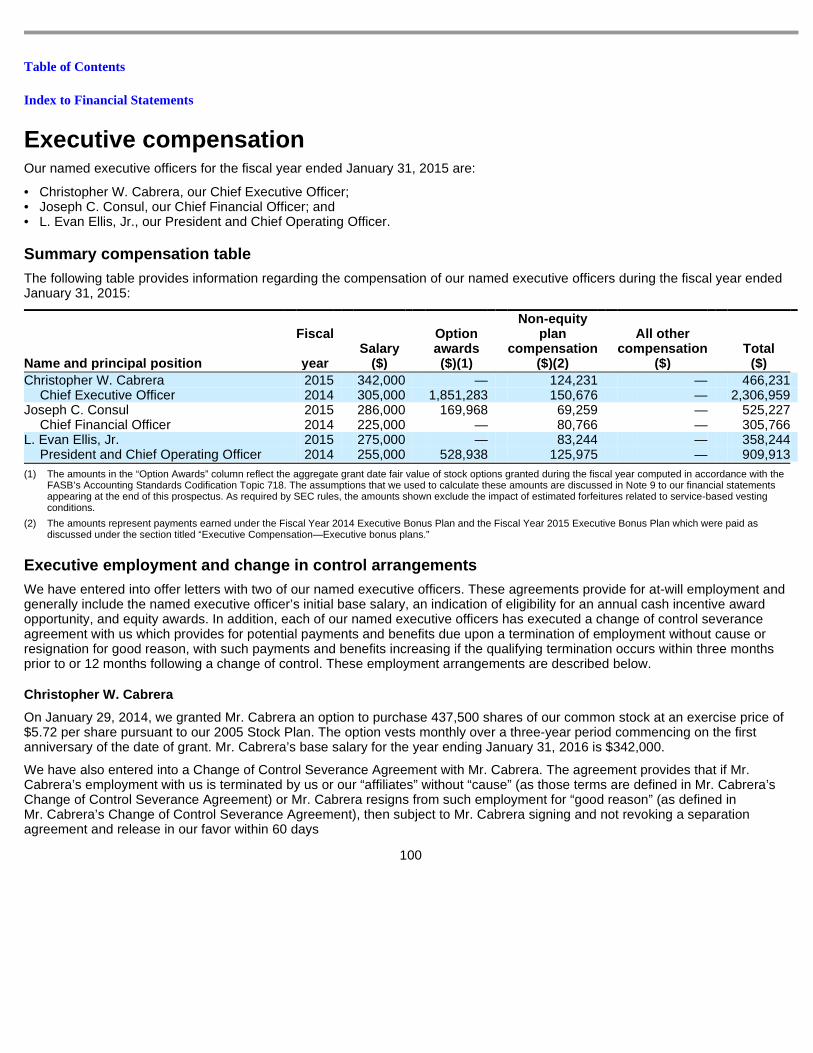
Table of Contents
Index to Financial Statements
Executive compensation
Our named executive officers for the fiscal year ended January 31, 2015 are:
Summary compensation table
The following table provides information regarding the compensation of our named executive officers during the fiscal year ended January 31, 2015:
Executive employment and change in control arrangem ents
We have entered into offer letters with two of our named executive officers. These agreements provide for at-will employment and generally include the named executive officer’s initial base salary, an indication of eligibility for an annual cash incentive award opportunity, and equity awards. In addition, each of our named executive officers has executed a change of control severance agreement with us which provides for potential payments and benefits due upon a termination of employment without cause or resignation for good reason, with such payments and benefits increasing if the qualifying termination occurs within three months prior to or 12 months following a change of control. These employment arrangements are described below.
Christopher W. Cabrera
On January 29, 2014, we granted Mr. Cabrera an option to purchase 437,500 shares of our common stock at an exercise price of $5.72 per share pursuant to our 2005 Stock Plan. The option vests monthly over a three-year period commencing on the first anniversary of the date of grant. Mr. Cabrera’s base salary for the year ending January 31, 2016 is $342,000.
We have also entered into a Change of Control Severance Agreement with Mr. Cabrera. The agreement provides that if Mr. Cabrera’s employment with us is terminated by us or our “affiliates” without “cause” (as those terms are defined in Mr. Cabrera’s Change of Control Severance Agreement) or Mr. Cabrera resigns from such employment for “good reason” (as defined in Mr. Cabrera’s Change of Control Severance Agreement), then subject to Mr. Cabrera signing and not revoking a separation agreement and release in our favor within 60 days
100
• Christopher W. Cabrera, our Chief Executive Officer; • Joseph C. Consul, our Chief Financial Officer; and • L. Evan Ellis, Jr., our President and Chief Operating Officer.
Name and principal position
Fiscal
year
Salary ($)
Option awards ($)(1)
Non-equity plan
compensation ($)(2)
All other compensation
($)
Total ($)
Christopher W. Cabrera 2015 342,000 — 124,231 — 466,231 Chief Executive Officer 2014 305,000 1,851,283 150,676 — 2,306,959
Joseph C. Consul 2015 286,000 169,968 69,259 — 525,227 Chief Financial Officer 2014 225,000 — 80,766 — 305,766
L. Evan Ellis, Jr. 2015 275,000 — 83,244 — 358,244 President and Chief Operating Officer 2014 255,000 528,938 125,975 — 909,913
(1) The amounts in the “Option Awards” column reflect the aggregate grant date fair value of stock options granted during the fiscal year computed in accordance with the FASB’s Accounting Standards Codification Topic 718. The assumptions that we used to calculate these amounts are discussed in Note 9 to our financial statements appearing at the end of this prospectus. As required by SEC rules, the amounts shown exclude the impact of estimated forfeitures related to service-based vesting conditions.
(2) The amounts represent payments earned under the Fiscal Year 2014 Executive Bonus Plan and the Fiscal Year 2015 Executive Bonus Plan which were paid as discussed under the section titled “Executive Compensation—Executive bonus plans.”
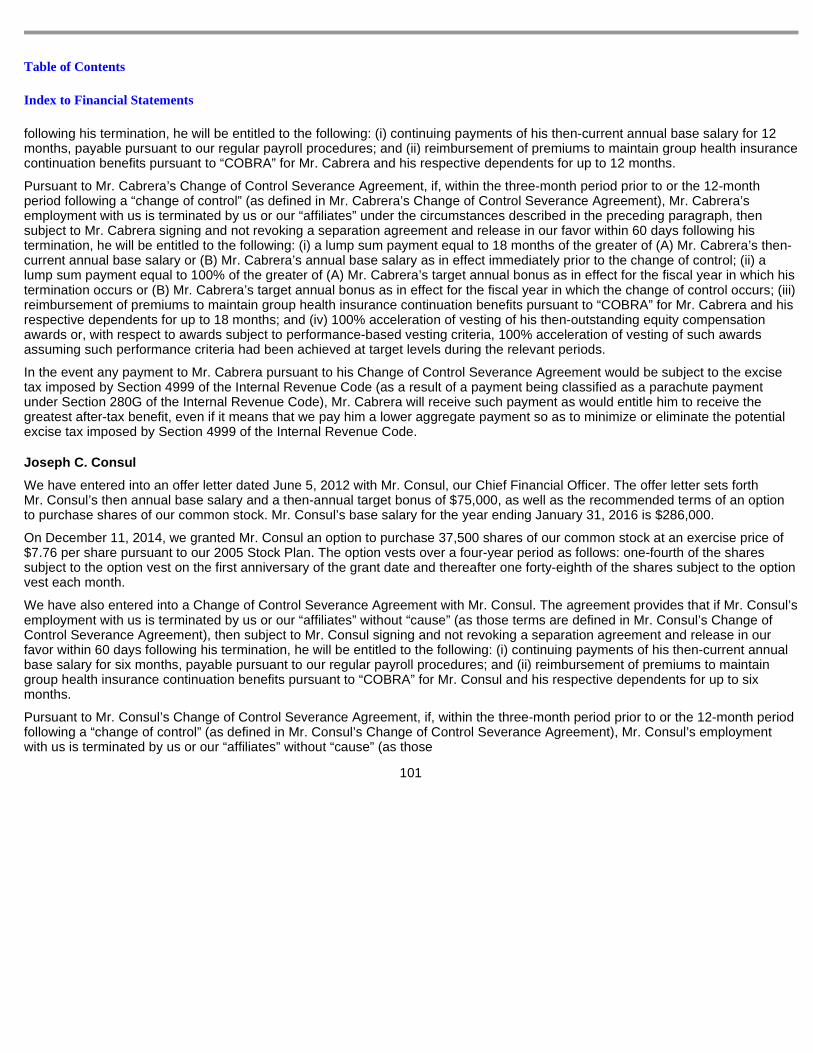
Table of Contents
Index to Financial Statements
following his termination, he will be entitled to the following: (i) continuing payments of his then-current annual base salary for 12 months, payable pursuant to our regular payroll procedures; and (ii) reimbursement of premiums to maintain group health insurance continuation benefits pursuant to “COBRA” for Mr. Cabrera and his respective dependents for up to 12 months.
Pursuant to Mr. Cabrera’s Change of Control Severance Agreement, if, within the three-month period prior to or the 12-month period following a “change of control” (as defined in Mr. Cabrera’s Change of Control Severance Agreement), Mr. Cabrera’s employment with us is terminated by us or our “affiliates” under the circumstances described in the preceding paragraph, then subject to Mr. Cabrera signing and not revoking a separation agreement and release in our favor within 60 days following his termination, he will be entitled to the following: (i) a lump sum payment equal to 18 months of the greater of (A) Mr. Cabrera’s then-current annual base salary or (B) Mr. Cabrera’s annual base salary as in effect immediately prior to the change of control; (ii) a lump sum payment equal to 100% of the greater of (A) Mr. Cabrera’s target annual bonus as in effect for the fiscal year in which his termination occurs or (B) Mr. Cabrera’s target annual bonus as in effect for the fiscal year in which the change of control occurs; (iii) reimbursement of premiums to maintain group health insurance continuation benefits pursuant to “COBRA” for Mr. Cabrera and his respective dependents for up to 18 months; and (iv) 100% acceleration of vesting of his then-outstanding equity compensation awards or, with respect to awards subject to performance-based vesting criteria, 100% acceleration of vesting of such awards assuming such performance criteria had been achieved at target levels during the relevant periods.
In the event any payment to Mr. Cabrera pursuant to his Change of Control Severance Agreement would be subject to the excise tax imposed by Section 4999 of the Internal Revenue Code (as a result of a payment being classified as a parachute payment under Section 280G of the Internal Revenue Code), Mr. Cabrera will receive such payment as would entitle him to receive the greatest after-tax benefit, even if it means that we pay him a lower aggregate payment so as to minimize or eliminate the potential excise tax imposed by Section 4999 of the Internal Revenue Code.
Joseph C. Consul
We have entered into an offer letter dated June 5, 2012 with Mr. Consul, our Chief Financial Officer. The offer letter sets forth Mr. Consul’s then annual base salary and a then-annual target bonus of $75,000, as well as the recommended terms of an option to purchase shares of our common stock. Mr. Consul’s base salary for the year ending January 31, 2016 is $286,000.
On December 11, 2014, we granted Mr. Consul an option to purchase 37,500 shares of our common stock at an exercise price of $7.76 per share pursuant to our 2005 Stock Plan. The option vests over a four-year period as follows: one-fourth of the shares subject to the option vest on the first anniversary of the grant date and thereafter one forty-eighth of the shares subject to the option vest each month.
We have also entered into a Change of Control Severance Agreement with Mr. Consul. The agreement provides that if Mr. Consul’s employment with us is terminated by us or our “affiliates” without “cause” (as those terms are defined in Mr. Consul’s Change of Control Severance Agreement), then subject to Mr. Consul signing and not revoking a separation agreement and release in our favor within 60 days following his termination, he will be entitled to the following: (i) continuing payments of his then-current annual base salary for six months, payable pursuant to our regular payroll procedures; and (ii) reimbursement of premiums to maintain group health insurance continuation benefits pursuant to “COBRA” for Mr. Consul and his respective dependents for up to six months.
Pursuant to Mr. Consul’s Change of Control Severance Agreement, if, within the three-month period prior to or the 12-month period following a “change of control” (as defined in Mr. Consul’s Change of Control Severance Agreement), Mr. Consul’s employment with us is terminated by us or our “affiliates” without “cause” (as those
101
Table of Contents
Index to Financial Statements
terms are defined in Mr. Consul’s Change of Control Severance Agreement) or Mr. Consul resigns from such employment for “good reason” (as defined in Mr. Consul’s Change of Control Severance Agreement), then subject to Mr. Consul signing and not revoking a separation agreement and release in our favor within 60 days following his termination, he will be entitled to the following: (i) a lump sum payment equal to 12 months of the greater of (A) Mr. Consul’s then-current annual base salary or (B) Mr. Consul’s annual base salary as in effect immediately prior to the change of control; (ii) a lump sum payment equal to 100% of the greater of (A) Mr. Consul’s target annual bonus as in effect for the fiscal year in which his termination occurs or (B) Mr. Consul’s target annual bonus as in effect for the fiscal year in which the change of control occurs; (iii) reimbursement of premiums to maintain group health insurance continuation benefits pursuant to “COBRA” for Mr. Consul and his respective dependents for up to 12 months; and (iv) 100% acceleration of vesting of his then-outstanding equity compensation awards or, with respect to awards subject to performance-based vesting criteria, 50% acceleration of vesting of such awards assuming such performance criteria had been achieved at target levels during the relevant periods.
In the event any payment to Mr. Consul pursuant to his Change of Control Severance Agreement would be subject to the excise tax imposed by Section 4999 of the Internal Revenue Code (as a result of a payment being classified as a parachute payment under Section 280G of the Internal Revenue Code), Mr. Consul will receive such payment as would entitle him to receive the greatest after-tax benefit, even if it means that we pay him a lower aggregate payment so as to minimize or eliminate the potential excise tax imposed by Section 4999 of the Internal Revenue Code.
L. Evan Ellis, Jr.
We have entered into an offer letter dated November 19, 2007 with Mr. Ellis, our President and Chief Operating Officer. The offer letter sets forth Mr. Ellis’ then annual base salary and target bonus, as well as the recommended terms of an option to purchase shares of our common stock. Mr. Ellis’ base salary for the year ending January 31, 2016 is $275,000.
On January 29, 2014, we granted Mr. Ellis an option to purchase 125,000 shares of our common stock at an exercise price of $5.72 per share pursuant to our 2005 Stock Plan. The option vests monthly over a three-year period commencing on the first anniversary of the date of grant.
We have also entered into a Change of Control Severance Agreement with Mr. Ellis. The agreement provides that if Mr. Ellis’s employment with us is terminated by us or our “affiliates” without “cause” (as those terms are defined in Mr. Ellis’s Change of Control Severance Agreement), then subject to Mr. Ellis signing and not revoking a separation agreement and release in our favor within 60 days following his termination, he will be entitled to the following: (i) continuing payments of his then-current annual base salary for six months, payable pursuant to our regular payroll procedures; and (ii) reimbursement of premiums to maintain group health insurance continuation benefits pursuant to “COBRA” for Mr. Ellis and his respective dependents for up to six months.
Pursuant to Mr. Ellis’ Change of Control Severance Agreement, if, within three months prior to or 12 months following a “change of control” (as defined in Mr. Ellis’ Change of Control Severance Agreement), Mr. Ellis’ employment with us is terminated by us or our “affiliates” without “cause” (as those terms are defined in Mr. Ellis’ Change of Control Severance Agreement) or Mr. Ellis resigns from such employment for “good reason” (as defined in Mr. Ellis’ Change of Control Severance Agreement), then subject to Mr. Ellis signing and not revoking a separation agreement and release in our favor within 60 days following his termination, he will be entitled to the following: (i) a lump sum payment equal to 12 months of the greater of (A) Mr. Ellis’ then-current annual base salary or (B) Mr. Ellis’ annual base salary as in effect immediately prior to the change of control; (ii) a lump sum payment equal to 100% of the greater of (A) Mr. Ellis’ target annual bonus as in effect for the fiscal year in which his termination occurs or (B) Mr. Ellis’ target annual bonus as in effect for the fiscal year in
102
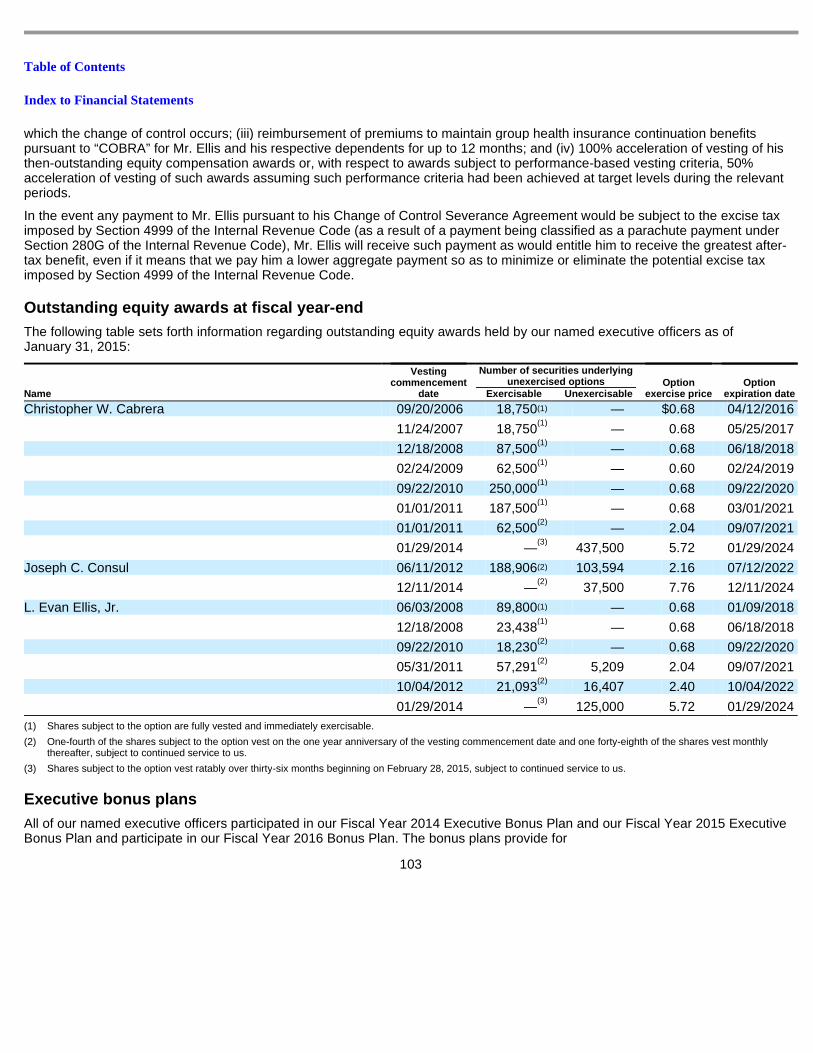
Table of Contents
Index to Financial Statements
which the change of control occurs; (iii) reimbursement of premiums to maintain group health insurance continuation benefits pursuant to “COBRA” for Mr. Ellis and his respective dependents for up to 12 months; and (iv) 100% acceleration of vesting of his then-outstanding equity compensation awards or, with respect to awards subject to performance-based vesting criteria, 50% acceleration of vesting of such awards assuming such performance criteria had been achieved at target levels during the relevant periods.
In the event any payment to Mr. Ellis pursuant to his Change of Control Severance Agreement would be subject to the excise tax imposed by Section 4999 of the Internal Revenue Code (as a result of a payment being classified as a parachute payment under Section 280G of the Internal Revenue Code), Mr. Ellis will receive such payment as would entitle him to receive the greatest after-tax benefit, even if it means that we pay him a lower aggregate payment so as to minimize or eliminate the potential excise tax imposed by Section 4999 of the Internal Revenue Code.
Outstanding equity awards at fiscal year-end
The following table sets forth information regarding outstanding equity awards held by our named executive officers as of January 31, 2015:
Executive bonus plans
All of our named executive officers participated in our Fiscal Year 2014 Executive Bonus Plan and our Fiscal Year 2015 Executive Bonus Plan and participate in our Fiscal Year 2016 Bonus Plan. The bonus plans provide for
103
Vesting
commencement date
Number of securities underlying
unexercised options Option exercise price
Option expiration date Name Exercisable Unexercisable
Christopher W. Cabrera 09/20/2006 18,750 — $ 0.68 04/12/2016
11/24/2007 18,750 — 0.68 05/25/2017
12/18/2008 87,500 — 0.68 06/18/2018
02/24/2009 62,500 — 0.60 02/24/2019
09/22/2010 250,000 — 0.68 09/22/2020
01/01/2011 187,500 — 0.68 03/01/2021
01/01/2011 62,500 — 2.04 09/07/2021
01/29/2014 — 437,500 5.72 01/29/2024
Joseph C. Consul 06/11/2012 188,906 103,594 2.16 07/12/2022
12/11/2014 — 37,500 7.76 12/11/2024
L. Evan Ellis, Jr. 06/03/2008 89,800 — 0.68 01/09/2018
12/18/2008 23,438 — 0.68 06/18/2018
09/22/2010 18,230 — 0.68 09/22/2020
05/31/2011 57,291 5,209 2.04 09/07/2021
10/04/2012 21,093 16,407 2.40 10/04/2022
01/29/2014 — 125,000 5.72 01/29/2024
(1) Shares subject to the option are fully vested and immediately exercisable.
(2) One-fourth of the shares subject to the option vest on the one year anniversary of the vesting commencement date and one forty-eighth of the shares vest monthly thereafter, subject to continued service to us.
(3) Shares subject to the option vest ratably over thirty-six months beginning on February 28, 2015, subject to continued service to us.
(1)
(1)
(1)
(1)
(1)
(1)
(2)
(3)
(2)
(2)
(1)
(1)
(2)
(2)
(2)
(3)
Table of Contents
Index to Financial Statements
bonus payments to eligible employees determined based upon our achievement of annual financial performance objectives. Funding of the Fiscal Year 2014 Executive Bonus Plan and Fiscal Year 2015 Executive Bonus Plan was based upon our achievement of financial performance targets that measured new revenue, customer renewals and adjusted EBITDA during the fiscal years ended January 31, 2014 and January 31, 2015, respectively, and funding of the Fiscal Year 2016 Executive Bonus Plan will be based upon our achievement of the same financial performance targets. To fund the bonus plan, we were required to achieve a minimum of 80% of these targets. Upon reaching the 80% level, we would fund 50% of the bonus amounts, with incremental increases and an accelerator from 110% to 130% of the attainment of targets, and a maximum bonus payout of 130%. Payments were made semi-annually for the Fiscal Year 2014 Executive Bonus Plan and quarterly for the Fiscal Year 2015 Executive Bonus Plan, in each case based upon the year-to-date results, with a true-up calculated as applicable for the full year payment in February 2014 and February 2015. Payments will be made quarterly for the Fiscal Year 2016 Executive Bonus Plan, based on the year-to-date results, with a true-up to be calculated as applicable for the full year payment in February 2016. The target bonuses at 100% funding for each named executive officer under the Fiscal Year 2014 Executive Bonus Plan were: Mr. Cabrera: $152,500; Mr. Consul: $81,743; and Mr. Ellis: $127,500. The target bonuses at 100% funding for each named executive officer under the Fiscal Year 2015 Executive Bonus Plan were: Mr. Cabrera: $205,000; Mr. Consul: $114,000; and Mr. Ellis: $138,000. The target bonuses at 100% funding for each named executive officer under the Fiscal Year 2016 Executive Bonus Plan will be the same as under the Fiscal Year 2015 Executive Bonus Plan. The annual payments made under both the Fiscal Year 2014 Executive Bonus Plan and the Fiscal Year 2015 Executive Bonus Plan to each executive officer are reflected above under “Executive compensation—Summary compensation table.”
Employee benefit and stock plans
2015 Equity Incentive Plan
Our board of directors adopted, and our stockholders approved, a 2015 Equity Incentive Plan. The 2015 Plan provides for the grant of incentive stock options, within the meaning of Section 422 of the Code, to our employees and any of our subsidiary corporations’ employees, and for the grant of nonstatutory stock options, restricted stock, restricted stock units, stock appreciation rights, performance units and performance shares to our employees, directors and consultants and our subsidiary corporations’ employees and consultants.
Authorized shares . A total of 3,000,000 shares of our common stock are reserved for issuance pursuant to the 2015 Plan, of which no awards are issued and outstanding. In addition, the shares to be reserved for issuance under the 2015 Plan also includes shares returned to our 2005 Stock Plan as the result of expiration or termination of awards or the forfeiture or our repurchase of shares issued pursuant to awards (provided that the maximum number of shares that may be added to the 2015 Plan from previously granted awards under the 2005 Plan is 4,718,589 shares). The number of shares available for issuance under the 2015 Plan also includes an annual increase on the first day of each fiscal year beginning in fiscal 2017, equal to the least of:
If an award expires or becomes unexercisable without having been exercised in full, is surrendered pursuant to an exchange program, or, with respect to restricted stock, restricted stock units, performance units or performance shares, is forfeited to or repurchased due to failure to vest, the unpurchased shares (or for awards other than stock options or stock appreciation rights, the forfeited or repurchased shares) will become available for future grant or sale under the 2015 Plan. With respect to stock appreciation rights, the net shares
104
• 3,000,000 shares; • 5% of the outstanding shares of common stock as of the last day of our immediately preceding fiscal year; or • such other amount as our board of directors may determine.
Table of Contents
Index to Financial Statements
issued will cease to be available under the 2015 Plan and all remaining shares will remain available for future grant or sale under the 2015 Plan. Shares used to pay the exercise price of an award or satisfy the tax withholding obligations related to an award will become available for future grant or sale under the 2015 Plan. To the extent an award is paid out in cash rather than shares, such cash payment will not result in reducing the number of shares available for issuance under the 2015 Plan.
Plan administration . Our compensation committee administers the 2015 Plan. In the case of awards intended to qualify as “performance-based compensation” within the meaning of Section 162(m) of the Code, the committee will consist of two or more “outside directors” within the meaning of Section 162(m). In addition, if we determine it is desirable to qualify transactions under the 2015 Plan as exempt under Rule 16b-3 of the Exchange Act, such transactions will be structured to satisfy the requirements for exemption under Rule 16b-3. Subject to the provisions of the 2015 Plan, the administrator has the power to administer the plan, including but not limited to, the power to interpret the terms of the 2015 Plan and awards granted under it, to create, amend and revoke rules relating to the 2015 Plan, including creating sub-plans, and to determine the terms of the awards, including the exercise price, the number of shares subject to each such award, the exercisability of the awards, and the form of consideration, if any, payable upon exercise. The administrator also has the authority to amend existing awards to reduce or increase their exercise price, to allow participants the opportunity to transfer outstanding awards to a financial institution or other person or entity selected by the administrator, and to institute an exchange program by which outstanding awards may be surrendered in exchange for awards of the same type which may have a higher or lower exercise price or different terms, awards of a different type and/or cash.
Stock options . Stock options may be granted under the 2015 Plan. The exercise price of options granted under the 2015 Plan must at least be equal to the fair market value of our common stock on the date of grant. The term of an incentive stock option may not exceed 10 years, except that with respect to any participant who owns more than 10% of the voting power of all classes of our outstanding stock, the term must not exceed five years and the exercise price must equal at least 110% of the fair market value on the grant date. The administrator will determine the methods of payment of the exercise price of an option, which may include cash, shares or other property acceptable to the administrator, as well as other types of consideration permitted by applicable law. After the termination of service of an employee, director or consultant, he or she may exercise his or her option for the period of time stated in his or her option agreement. Generally, if termination is due to death or disability, the option will remain exercisable for 12 months. In all other cases, the option will generally remain exercisable for three months following the termination of service. However, in no event may an option be exercised later than the expiration of its term. Subject to the provisions of the 2015 Plan, the administrator determines the other terms of options.
Stock appreciation rights . Stock appreciation rights may be granted under the 2015 Plan. Stock appreciation rights allow the recipient to receive the appreciation in the fair market value of our common stock between the exercise date and the date of grant. Stock appreciation rights may not have a term exceeding 10 years. After the termination of service of an employee, director or consultant, he or she may exercise his or her stock appreciation right for the period of time stated in his or her option agreement. However, in no event may a stock appreciation right be exercised later than the expiration of its term. Subject to the provisions of the 2015 Plan, the administrator determines the other terms of stock appreciation rights, including when such rights become exercisable and whether to pay any increased appreciation in cash or with shares of our common stock, or a combination thereof, except that the per share exercise price for the shares to be issued pursuant to the exercise of a stock appreciation right will be no less than 100% of the fair market value per share on the date of grant.
Restricted stock . Restricted stock may be granted under the 2015 Plan. Restricted stock awards are grants of shares of our common stock that vest in accordance with terms and conditions established by the
105

Table of Contents
Index to Financial Statements
administrator. The administrator will determine the number of shares of restricted stock granted to any employee, director or consultant and, subject to the provisions of the 2015 Plan, will determine the terms and conditions of such awards. The administrator may impose whatever conditions to vesting it determines to be appropriate (for example, the administrator may set restrictions based on the achievement of specific performance goals or continued service to us); provided, however, that the administrator, in its sole discretion, may accelerate the time at which any restrictions will lapse or be removed. Recipients of restricted stock awards generally will have voting and dividend rights with respect to such shares upon grant without regard to vesting, unless the administrator provides otherwise. Shares of restricted stock that do not vest are subject to our right of repurchase or forfeiture.
Restricted stock units . Restricted stock units may be granted under the 2015 Plan. Restricted stock units are bookkeeping entries representing an amount equal to the fair market value of one share of our common stock. Subject to the provisions of the 2015 Plan, the administrator determines the terms and conditions of restricted stock units, including the vesting criteria (which may include accomplishing specified performance criteria or continued service to us) and the form and timing of payment. Notwithstanding the foregoing, the administrator, in its sole discretion, may accelerate the time at which any restrictions will lapse or be removed.
Performance units and performance shares . Performance units and performance shares may be granted under the 2015 Plan. Performance units and performance shares are awards that will result in a payment to a participant only if performance goals established by the administrator are achieved or the awards otherwise vest. The administrator will establish organizational or individual performance goals or other vesting criteria in its discretion, which, depending on the extent to which they are met, will determine the number and/or the value of performance units and performance shares to be paid out to participants. After the grant of a performance unit or performance share, the administrator, in its sole discretion, may reduce or waive any performance criteria or other vesting provisions for such performance units or performance shares. Performance units shall have an initial dollar value established by the administrator prior to the grant date. Performance shares shall have an initial value equal to the fair market value of our common stock on the grant date. The administrator, in its sole discretion, may pay earned performance units or performance shares in the form of cash, in shares or in some combination thereof.
Outside directors . Our 2015 Plan provides that all non-employee directors are eligible to receive all types of awards (except for incentive stock options) under the 2015 Plan. Our 2015 Plan provides that in any given fiscal year, a non-employee director may not receive equity awards under the 2015 Plan having a grant date fair value greater than $400,000, increased to $600,000 in connection with his or her initial service. With respect to stock options and stock appreciation rights, grant date fair value will be calculated in accordance with the Black-Scholes option valuation methodology on the grant date of such award. With respect to an award other than a stock option or stock appreciation right, the grant date fair value will equal the product of (i) the fair market value of one share on the grant date of the award and (ii) the aggregate number of shares subject to the award.
Our 2015 Plan further provides that, in the event of a merger or change in control, as defined in our 2015 Plan, each outstanding equity award granted under our 2015 Plan that is held by a non-employee director will fully vest, all restrictions on the shares subject to such award will lapse, and with respect to awards with performance-based vesting, all performance goals or other vesting criteria will be deemed achieved at 100% of target levels, and all of the shares subject to such award will become fully exercisable, if applicable.
Non-transferability of awards . Unless the administrator provides otherwise, the 2015 Plan generally does not allow for the transfer of awards and only the recipient of an award may exercise an award during his or her lifetime.
Certain adjustments . In the event of certain changes in our capitalization, to prevent diminution or enlargement of the benefits or potential benefits available under the 2015 Plan, the administrator will adjust
106
Table of Contents
Index to Financial Statements
the number and class of shares that may be delivered under the 2015 Plan and/or the number, class and price of shares covered by each outstanding award, and the numerical share limits set forth in the 2015 Plan. In the event of our proposed liquidation or dissolution, the administrator will notify participants as soon as practicable and all awards will terminate immediately prior to the consummation of such proposed transaction.
Merger or change of control . The 2015 Plan provides that in the event of a merger or change of control, as defined under the 2015 Plan, each outstanding award will be treated as the administrator determines, except that if a successor corporation or its parent or subsidiary does not assume or substitute an equivalent award for any outstanding award, then such award will fully vest, all restrictions on such award will lapse, all performance goals or other vesting criteria applicable to such award will be deemed achieved at 100% of target levels and such award will become fully exercisable, if applicable, for a specified period prior to the transaction. The award will then terminate upon the expiration of the specified period of time.
Amendment, termination . The administrator has the authority to amend, suspend or terminate the 2015 Plan provided such action does not impair the existing rights of any participant. The 2015 Plan will automatically terminate in 2025, unless we terminate it sooner.
2005 Stock Plan, as amended
Our board of directors and our stockholders adopted the 2005 Stock Plan in March 2005. The 2005 Stock Plan was most recently amended in March 2015.
Authorized shares . The 2005 Stock Plan has been terminated in connection with this offering and no shares are available for issuance under this plan. The 2005 Stock Plan will continue to govern outstanding awards granted thereunder. The 2005 Stock Plan provides for, among other things, the grant of incentive stock options, nonqualified stock options and restricted stock units. As of April 30, 2015, options to purchase 4,697,339 shares of our common stock remained outstanding under the 2005 Stock Plan (including 27,500 shares to be sold in this offering by certain selling stockholders upon the exercise of options).
Plan administration . The board of directors or a committee thereof appointed by our board of directors has the authority to administer the 2005 Stock Plan. Following this offering, the compensation committee will administer the 2005 Stock Plan. Subject to the provisions of the 2005 Stock Plan, the administrator has the full authority and discretion to take any actions it deems necessary or advisable for the administration of the 2005 Stock Plan. All decisions, interpretations and other actions of the administrator will be final and binding on all participants.
Options . Stock options may be granted under the 2005 Stock Plan. The exercise price per share of all options must equal at least 100% of the fair market value per share of our common stock on the date of grant. The term of an option may not exceed 10 years. The administrator will determine the methods of payment of the exercise price of an option, which may include cash or cash equivalents or other consideration acceptable to the administrator in its discretion. After the termination of service of an employee, director or consultant, the participant may generally exercise his or her options, to the extent vested as of such date of termination, for generally three months after termination. If termination is due to disability or death, the option will generally remain exercisable, to the extent vested as of such date of termination, for at least 12 months. However, in no event may an option be exercised later than the expiration of its term.
Stock purchase rights . Stock purchase rights may be granted under the 2005 Stock Plan. The administrator shall determine the purchase price of the shares subject to each stock purchase right. The offer to purchase shares underlying this stock purchase right shall be accepted by the recipient’s execution of a restricted stock purchase agreement. This restricted stock purchase agreement may subject the acquired shares to a repurchase option, which we could exercise within 90 days of the voluntary or involuntary termination of the purchaser’s service with the Company for any reason.
107
Table of Contents
Index to Financial Statements
Restricted stock and restricted stock units . Restricted stock and restricted stock units may be granted under our 2005 Stock Plan. Restricted stock awards are grants of shares of our common stock that are subject to various restrictions, including restrictions on transferability and forfeiture provisions. Restricted stock units are phantom stock units that may be settled in cash or shares upon vesting. Shares of restricted stock and restricted stock units will vest in accordance with terms and conditions established by the administrator.
Adjustments . In the event of certain changes in our capitalization, the number of shares reserved under our 2005 Stock Plan, the number of shares covered by outstanding options or restricted stock units, and the exercise price of outstanding options will be proportionately adjusted.
Merger or change of control . The 2005 Stock Plan provides that in the event that we are a party to a merger or change in control, outstanding options and stock purchase rights may be assumed or substituted by the successor corporation or a parent or subsidiary thereof. However, for any award granted after March 10, 2015, the board of directors or any committee thereof administering the 2005 Stock Plan may, subject to the following sentence, treat such award as it determines without the consent of the award’s holder, including, but not limited to, (i) terminating the award immediately prior to the merger or change of control, (ii) deeming the award as fully or partially vested and/or removing restrictions pertaining to the award or (iii) terminating the award in exchange for cash or other property, or any combination of these alternatives. In the event the successor corporation refuses to assume or substitute for the option or stock purchase right, then the vesting of such awards will be fully accelerated and the administrator will notify the holder in writing or electronically that such awards will be fully exercisable and vested for a period as determined by the administrator, and such awards will terminate upon expiration of such period.
Amendment, termination . Our board of directors may amend our 2005 Stock Plan at any time, provided that such amendment does not impair the rights under outstanding awards without the award holder’s written consent. Upon the completion of this offering, our 2005 Stock Plan will be terminated and no further awards will be granted thereunder. All outstanding awards will continue to be governed by their existing terms.
2015 Employee Stock Purchase Plan
Our board of directors adopted, and our stockholders approved, a 2015 Employee Stock Purchase Plan. The 2015 ESPP will become effective after the completion of this offering.
Authorized shares . A total of 600,000 shares of our common stock will be made available for sale. In addition, the 2015 ESPP provides for annual increases in the number of shares available for issuance under the 2015 ESPP on the first day of each fiscal year beginning in fiscal 2017, equal to the lesser of:
Plan administration . Our board of directors or a committee appointed by our board of directors will administer the 2015 ESPP. We anticipate that our compensation committee will administer the 2015 ESPP. The administrator will have authority to administer the plan, including but not limited to, full and exclusive authority to interpret the terms of the 2015 ESPP, determining eligibility to participate subject to the conditions of the 2015 ESPP as described below, and to establish procedures for the administration of the 2015 ESPP, including creating sub-plans.
108
• 2% of the outstanding shares of our common stock on the first day of such fiscal year; • 1,180,000 shares; or • such other amount as may be determined by our board of directors.
Table of Contents
Index to Financial Statements
Eligibility . Generally, all of our employees will be eligible to participate if they are employed by us, or any participating subsidiary, for at least 20 hours per week and more than five months in any calendar year. However, an employee may not be granted an option to purchase stock under the 2015 ESPP if such employee:
Offering periods . The 2015 ESPP is intended to qualify under Section 423 of the Code, and provides for 24-month offering periods, which generally will include six-month purchase periods. The offering periods will generally start on the first trading day on or after March 20 and September 20 of each year, except that the first offering period will commence on the first trading day following the effective date of the registration statement to which this prospectus is a part. The administrator may, in its discretion, modify the terms of future offering periods and purchase periods.
Payroll deductions . The 2015 ESPP will permit participants to purchase common stock through payroll deductions of up to 15% of their eligible compensation, which includes a participant’s base straight time gross earnings, commissions, overtime and shift premium, but exclusive of payments for incentive compensation, bonuses and other compensation. A participant may purchase a maximum of shares during an offering period.
Exercise of option . Amounts deducted and accumulated by the participant are used to purchase shares of our common stock at the end of each six-month purchase period. The first purchase period will end on the first trading day following March 20, 2016. The purchase price of the shares will be 85% of the lower of the fair market value of our common stock on the first trading day of each offering period or on the exercise date. Participants may end their participation at any time during an offering period, and will be paid their accrued payroll deductions that have not yet been used to purchase shares of common stock. Participation ends automatically upon termination of employment with us.
Non-transferability . A participant may not transfer rights granted under the 2015 ESPP other than by will, the laws of descent and distribution, or as otherwise provided under the 2015 ESPP.
Merger or change in control . In the event of our merger or change in control, as defined under the 2015 ESPP, a successor corporation may assume or substitute for each outstanding option. If the successor corporation refuses to assume or substitute for the option, the offering period then in progress will be shortened, and a new exercise date will be set. The administrator will notify each participant that the exercise date has been changed and that the participant’s option will be exercised automatically on the new exercise date unless prior to such date the participant has withdrawn from the offering period.
Amendment, termination . The 2015 ESPP will automatically terminate in 2035, unless we terminate it sooner. The administrator has the authority to amend, suspend or terminate the 2015 ESPP, except that, subject to certain exceptions described in the 2015 ESPP, no such action may adversely affect any outstanding rights to purchase stock under the 2015 ESPP.
Executive Incentive Compensation Plan
Our board of directors has adopted an Executive Incentive Compensation Plan, or the Bonus Plan. The Bonus Plan will be administered by our compensation committee following the completion of this offering. The Bonus Plan allows our compensation committee to provide cash incentive awards to selected employees, including our named executive officers, based upon performance goals established by our compensation committee.
109
• immediately after the grant would own stock possessing 5% or more of the total combined voting power or value of all classes of our capital stock; or
• holds rights to purchase stock under all of our employee stock purchase plans that accrue at a rate that exceeds $25,000 worth of stock for each calendar year in which the option is outstanding.
Table of Contents
Index to Financial Statements
Under the Bonus Plan, our compensation committee determines the performance goals applicable to any award, which goals may include, without limitation, subscription revenue, sales bookings, business divestitures and acquisitions, cash flow, cash position, earnings (which may include any calculation of earnings, including but not limited to earnings before interest and taxes, earnings before taxes, earnings before interested, taxes, depreciation and amortization and net earnings), earnings per share, net income, net profit, net sales, operating cash flow, operating expenses, operating income, operating margin, overhead or other expense reduction, product defect measures, product release timelines, productivity, churn, return on assets, return on capital, return on equity, return on investment, return on sales, revenue, revenue growth, sales results, sales growth, stock price, time to market, total stockholder return, working capital, individual objectives such as peer reviews or other subjective or objective criteria, and adjusted earnings before interested, taxes, depreciation and amortization. Performance goals that include our financial results may be determined in accordance with GAAP or such financial results may consist of non-GAAP financial measures and any actual results may be adjusted by the compensation committee for one-time items or unbudgeted or unexpected items when performance goals that include our financial results may be determined in accordance with GAAP, or such financial results may consist of non-GAAP financial measures, and any actual results may be adjusted by the compensation committee for one-time items or unbudgeted or unexpected items when determining whether the performance goals have been met. The goals may be on the basis of any factors the compensation committee determines relevant, and may be adjusted on an individual, divisional, business unit or company-wide basis. The performance goals may differ from participant to participant and from award to award.
Our compensation committee may, in its sole discretion and at any time, increase, reduce or eliminate a participant’s actual award, and/or increase, reduce or eliminate the amount allocated to the bonus pool for a particular performance period. The actual award may be below, at or above a participant’s target award, in the compensation committee’s discretion. Our compensation committee may determine the amount of any reduction on the basis of such factors as it deems relevant, and it is not required to establish any allocation or weighting with respect to the factors it considers.
Actual awards are paid in cash only after they are earned, which usually requires continued employment through the date a bonus is paid. Our compensation committee has the authority to amend, alter, suspend or terminate the Bonus Plan provided such action does not impair the existing rights of any participant with respect to any earned bonus.
401(k) plan
We maintain a tax-qualified retirement plan that provides eligible U.S. employees with an opportunity to save for retirement on a tax advantaged basis. Eligible employees are able to defer eligible compensation subject to applicable annual Code limits. We have the ability to make discretionary contributions to the 401(k) plan. Employees’ pre-tax contributions are allocated to each participant’s individual account and are then invested in selected investment alternatives according to the participants’ directions. Employees are immediately and fully vested in their contributions. The 401(k) plan is intended to be qualified under Section 401(a) of the Code with the 401(k) plan’s related trust intended to be tax exempt under Section 501(a) of the Code. As a tax-qualified retirement plan, contributions to the 401(k) plan and earnings on those contributions are not taxable to the employees until distributed from the 401(k) plan.
Rule 10b5-1 sales plans
Our directors and executive officers may adopt written plans, known as Rule 10b5-1 plans, in which they will contract with a broker to buy or sell shares of our common stock on a periodic basis. Under a Rule 10b5-1 plan, a broker executes trades pursuant to parameters established by the director or executive officer when entering
110
Table of Contents
Index to Financial Statements
into the plan, without further direction from them. The director or executive officer may amend a Rule 10b5-1 plan in some circumstances and may terminate a plan at any time. Our directors and executive officers also may buy or sell additional shares outside of a Rule 10b5-1 plan when they are not in possession of material nonpublic information subject to compliance with the terms of our insider trading policy. Without the prior written consent of the representatives of the underwriters, prior to 180 days after the date of this offering, the sale of any shares under such plan would be subject to the lock-up agreement that the director or executive officer has entered into with the underwriters.
Limitation on liability and indemnification matters Our amended and restated certificate of incorporation and amended and restated bylaws, each to be effective upon the completion of this offering, will provide that we will indemnify our directors and officers, and may indemnify our employees and other agents, to the fullest extent permitted by Delaware law. Delaware law prohibits our amended and restated certificate of incorporation from limiting the liability of our directors for any of the following:
If Delaware law is amended to authorize corporate action further eliminating or limiting the personal liability of a director, then the liability of our directors will be eliminated or limited to the fullest extent permitted by Delaware law, as so amended. Our amended and restated certificate of incorporation will not eliminate a director’s duty of care and, in appropriate circumstances, equitable remedies, such as injunctive or other forms of non-monetary relief, remain available under Delaware law. This provision also will not affect a director’s responsibilities under any other laws, such as the federal securities laws or other state or federal laws. Under our amended and restated bylaws, we will also be empowered to purchase insurance on behalf of any person whom we are required or permitted to indemnify.
In addition to the indemnification required in our amended and restated certificate of incorporation and amended and restated bylaws, we have entered into an indemnification agreement with each member of our board of directors and each of our officers. These agreements provide for the indemnification of our directors, officers and some employees for certain expenses and liabilities incurred in connection with any action, suit, proceeding or alternative dispute resolution mechanism, or hearing, inquiry or investigation that may lead to the foregoing, to which they are a party, or are threatened to be made a party, by reason of the fact that they are or were a director, officer, employee, agent or fiduciary of our company, or any of our subsidiaries, by reason of any action or inaction by them while serving as a director, officer, employee, agent or fiduciary, or by reason of the fact that they were serving at our request as a director, officer, employee, agent or fiduciary of another entity. In the case of an action or proceeding by or in the right of our company or any of our subsidiaries, no indemnification will be provided for any claim where a court determines that the indemnified party is prohibited from receiving indemnification. We believe that these charter and bylaw provisions and indemnification agreements are necessary to attract and retain qualified persons as directors and officers.
The limitation of liability and indemnification provisions in our amended and restated certificate of incorporation and amended and restated bylaws may discourage stockholders from bringing a lawsuit against directors for breach of their fiduciary duties. They may also reduce the likelihood of derivative litigation against directors and officers, even though an action, if successful, might benefit us and our stockholders. Moreover, a stockholder’s investment may be harmed to the extent we pay the costs of settlement and damage awards against directors and officers pursuant to these indemnification provisions. Insofar as indemnification for liabilities arising under the Securities Act may be permitted to our directors, officers and controlling persons
111
• any breach of a director’s duty of loyalty to us or to our stockholders; • acts or omissions not in good faith or that involve intentional misconduct or a knowing violation of law; • unlawful payment of dividends or unlawful stock repurchases or redemptions; and • any transaction from which a director derived an improper personal benefit.

Table of Contents
Index to Financial Statements
pursuant to the foregoing provisions, or otherwise, we have been advised that, in the opinion of the SEC, such indemnification is against public policy as expressed in the Securities Act, and is, therefore, unenforceable. There is no pending litigation or proceeding naming any of our directors or officers as to which indemnification is being sought, nor are we aware of any pending or threatened litigation that may result in claims for indemnification by any director or officer.
112
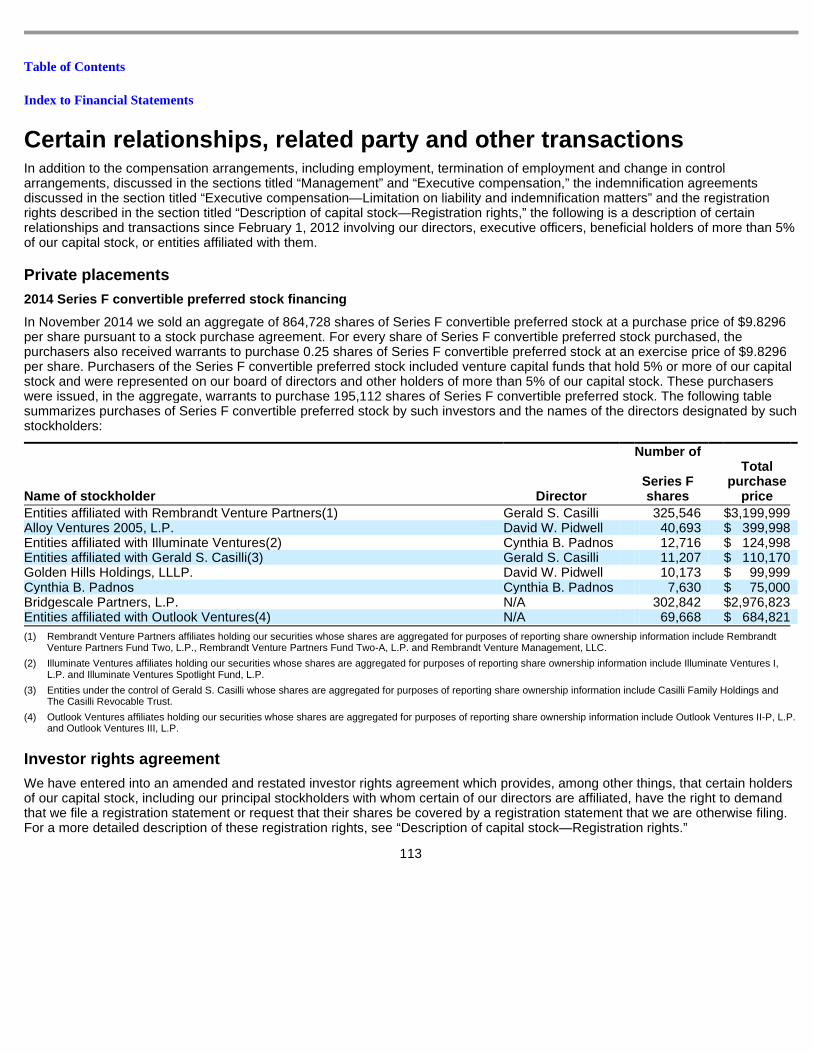
Table of Contents
Index to Financial Statements
Certain relationships, related party and other tran sactions
In addition to the compensation arrangements, including employment, termination of employment and change in control arrangements, discussed in the sections titled “Management” and “Executive compensation,” the indemnification agreements discussed in the section titled “Executive compensation—Limitation on liability and indemnification matters” and the registration rights described in the section titled “Description of capital stock—Registration rights,” the following is a description of certain relationships and transactions since February 1, 2012 involving our directors, executive officers, beneficial holders of more than 5% of our capital stock, or entities affiliated with them.
Private placements
2014 Series F convertible preferred stock financing
In November 2014 we sold an aggregate of 864,728 shares of Series F convertible preferred stock at a purchase price of $9.8296 per share pursuant to a stock purchase agreement. For every share of Series F convertible preferred stock purchased, the purchasers also received warrants to purchase 0.25 shares of Series F convertible preferred stock at an exercise price of $9.8296 per share. Purchasers of the Series F convertible preferred stock included venture capital funds that hold 5% or more of our capital stock and were represented on our board of directors and other holders of more than 5% of our capital stock. These purchasers were issued, in the aggregate, warrants to purchase 195,112 shares of Series F convertible preferred stock. The following table summarizes purchases of Series F convertible preferred stock by such investors and the names of the directors designated by such stockholders:
Investor rights agreement
We have entered into an amended and restated investor rights agreement which provides, among other things, that certain holders of our capital stock, including our principal stockholders with whom certain of our directors are affiliated, have the right to demand that we file a registration statement or request that their shares be covered by a registration statement that we are otherwise filing. For a more detailed description of these registration rights, see “Description of capital stock—Registration rights.”
113
Name of stockholder Director
Number of
Series F shares
Total purchase
price
Entities affiliated with Rembrandt Venture Partners(1) Gerald S. Casilli 325,546 $ 3,199,999 Alloy Ventures 2005, L.P. David W. Pidwell 40,693 $ 399,998 Entities affiliated with Illuminate Ventures(2) Cynthia B. Padnos 12,716 $ 124,998 Entities affiliated with Gerald S. Casilli(3) Gerald S. Casilli 11,207 $ 110,170 Golden Hills Holdings, LLLP. David W. Pidwell 10,173 $ 99,999 Cynthia B. Padnos Cynthia B. Padnos 7,630 $ 75,000 Bridgescale Partners, L.P. N/A 302,842 $ 2,976,823 Entities affiliated with Outlook Ventures(4) N/A 69,668 $ 684,821
(1) Rembrandt Venture Partners affiliates holding our securities whose shares are aggregated for purposes of reporting share ownership information include Rembrandt Venture Partners Fund Two, L.P., Rembrandt Venture Partners Fund Two-A, L.P. and Rembrandt Venture Management, LLC.
(2) Illuminate Ventures affiliates holding our securities whose shares are aggregated for purposes of reporting share ownership information include Illuminate Ventures I, L.P. and Illuminate Ventures Spotlight Fund, L.P.
(3) Entities under the control of Gerald S. Casilli whose shares are aggregated for purposes of reporting share ownership information include Casilli Family Holdings and The Casilli Revocable Trust.
(4) Outlook Ventures affiliates holding our securities whose shares are aggregated for purposes of reporting share ownership information include Outlook Ventures II-P, L.P. and Outlook Ventures III, L.P.
Table of Contents
Index to Financial Statements
Transactions with directors, executive officers and their affiliates
A member of our board of directors, Earl E. Fry, is the Chief Customer Officer and Executive Vice President, Operations Strategy at Informatica, a customer of ours. We billed Informatica $402,000, $441,000 and $921,000 for the fiscal years ended January 31, 2013, 2014 and 2015, respectively. In addition, we made payments to Informatica totaling $155,000, $255,000 and $118,000 for the fiscal years ended January 31, 2013, 2014 and 2015, respectively.
We employ Sonia Cabrera Rossi as our Senior Manager, Educational Services, who is the sister of Christopher W. Cabrera, our founder and Chief Executive Officer. Ms. Rossi became an employee in July 2008. Ms. Rossi’s compensation totaled $142,633 and $148,161 for the fiscal years ended January 31, 2015 and 2014, respectively. Since February 1, 2012, Ms. Rossi has been granted an option to purchase a total of 2,000 shares of our common stock, which has an exercise price of $2.40 per share. The option granted to Ms. Rossi is subject to our standard four-year vesting schedule.
We employ Brian Ellis as our Manager, Corporate Sales, who is the son of L. Evan Ellis, Jr., our President and Chief Operating Officer. Mr. Brian Ellis became an employee in July 2007. Mr. Brian Ellis’ base salary and sales incentive compensation totaled $200,680 and $179,314 for the fiscal years ended January 31, 2015 and 2014, respectively. Since February 1, 2012, Mr. Brian Ellis has been granted options to purchase a total of 5,000 shares of our common stock, with exercise prices per share ranging from $2.16 to $4.64. The options granted to Mr. Brian Ellis are subject to our standard four-year vesting schedule.
Policies and procedures for related party transacti ons
Following the completion of this offering, our audit committee will have the primary responsibility for reviewing and approving or disapproving “related party transactions,” which are transactions between us and related persons in which the aggregate amount involved exceeds or may be expected to exceed $120,000 and in which a related person has or will have a direct or indirect material interest. Upon the completion of this offering, our policy regarding transactions between us and related persons will provide that a related person is defined as a director, executive officer, nominee for director or greater than 5% beneficial owner of our common stock, in each case since the beginning of the most recently completed fiscal year, and any of their immediate family members. Our audit committee charter that will be in effect upon the completion of this offering will provide that our audit committee shall review and approve or disapprove any related party transactions.
114
Table of Contents
Index to Financial Statements
Principal and selling stockholders
The following table sets forth information regarding beneficial ownership of our common stock as of April 30, 2015, as adjusted to reflect the shares of common stock to be issued and sold by us in this offering, by:
We have determined beneficial ownership in accordance with the rules of the SEC and the information is not necessarily indicative of beneficial ownership for any other purpose. Unless otherwise indicated below, to our knowledge, the persons and entities named in the table have sole voting and sole investment power with respect to all shares that they beneficially own, subject to community property laws where applicable. In computing the number of shares of our common stock beneficially owned by a person and the percentage ownership of that person, we deemed outstanding shares of our common stock subject to options or warrants held by that person that are currently exercisable or exercisable within 60 days of April 30, 2015. We did not deem these shares outstanding, however, for the purpose of computing the percentage ownership of any other person.
We have based percentage ownership of our common stock prior to this offering on 20,827,158 shares of our common stock outstanding as of April 30, 2015, which includes 17,871,971 shares of common stock resulting from the automatic conversion of all outstanding shares of our convertible preferred stock upon the completion of this offering, as if this conversion had occurred as of April 30, 2015. Percentage ownership of our common stock after this offering is based on 27,708,158 shares of common stock outstanding immediately after the closing of this offering (including the issuance of 27,500 shares of our common stock to be acquired by certain selling stockholders upon the exercise of options in order to sell those shares in this offering and assuming no exercise of the underwriters’ over-allotment option to purchase additional shares of our common stock from us).
Funds affiliated with Rembrandt Venture Partners, an existing stockholder for which our director, Gerald S. Casilli, shares voting and dispositive power, are expected to purchase an aggregate of 375,000 shares of our common stock in this offering at the initial public offering price. The underwriting discount for the shares sold to these stockholders in the offering will be the same as the underwriting discount for the shares sold to the public.
115
• each person or group of affiliated persons known by us to be the beneficial owner of more than 5% of our common stock;
• each of our named executive officers;
• each of our directors;
• all of our executive officers and directors as a group; and
• all selling stockholders, consisting of the individuals shown as having shares listed in the column “Shares Being Offered.”
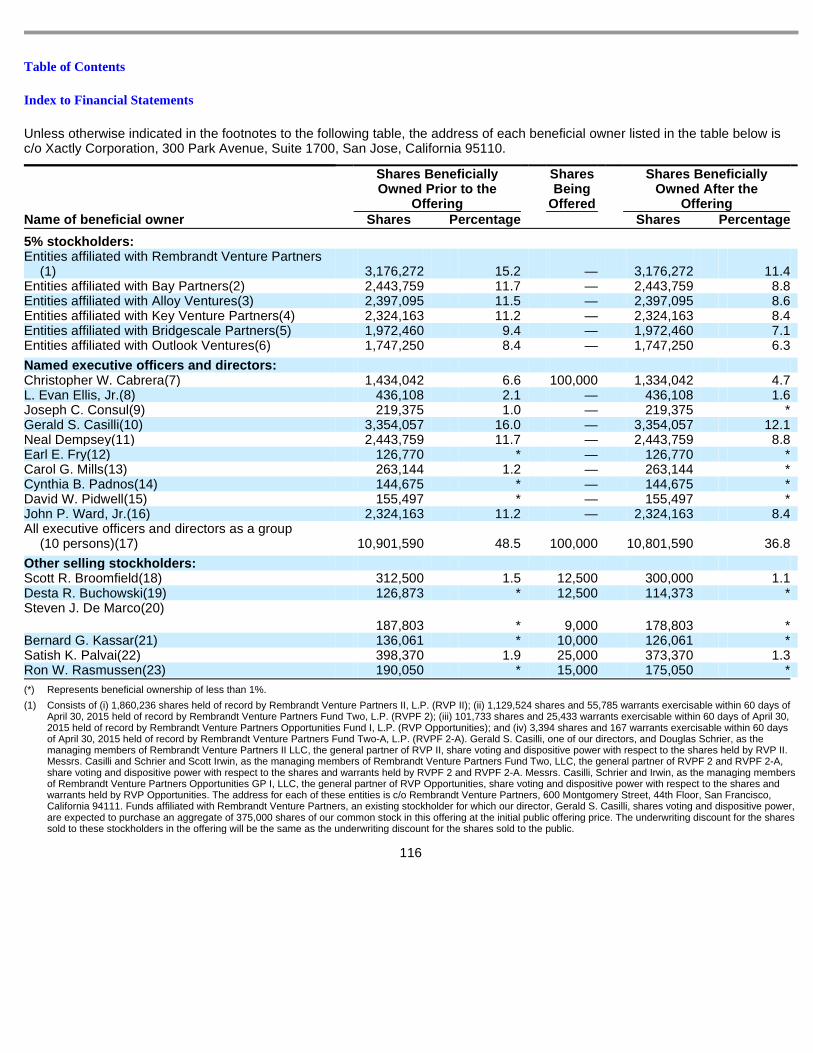
Table of Contents
Index to Financial Statements
Unless otherwise indicated in the footnotes to the following table, the address of each beneficial owner listed in the table below is c/o Xactly Corporation, 300 Park Avenue, Suite 1700, San Jose, California 95110.
116
Name of beneficial owner
Shares Beneficially Owned Prior to the
Offering
Shares Being
Offered
Shares Beneficially Owned After the
Offering
Shares Percentage Shares Percentage
5% stockholders:
Entities affiliated with Rembrandt Venture Partners(1) 3,176,272 15.2 — 3,176,272 11.4
Entities affiliated with Bay Partners(2) 2,443,759 11.7 — 2,443,759 8.8 Entities affiliated with Alloy Ventures(3) 2,397,095 11.5 — 2,397,095 8.6 Entities affiliated with Key Venture Partners(4) 2,324,163 11.2 — 2,324,163 8.4 Entities affiliated with Bridgescale Partners(5) 1,972,460 9.4 — 1,972,460 7.1 Entities affiliated with Outlook Ventures(6) 1,747,250 8.4 — 1,747,250 6.3
Named executive officers and directors:
Christopher W. Cabrera(7) 1,434,042 6.6 100,000 1,334,042 4.7 L. Evan Ellis, Jr.(8) 436,108 2.1 — 436,108 1.6 Joseph C. Consul(9) 219,375 1.0 — 219,375 * Gerald S. Casilli(10) 3,354,057 16.0 — 3,354,057 12.1 Neal Dempsey(11) 2,443,759 11.7 — 2,443,759 8.8 Earl E. Fry(12) 126,770 * — 126,770 * Carol G. Mills(13) 263,144 1.2 — 263,144 * Cynthia B. Padnos(14) 144,675 * — 144,675 * David W. Pidwell(15) 155,497 * — 155,497 * John P. Ward, Jr.(16) 2,324,163 11.2 — 2,324,163 8.4 All executive officers and directors as a group
(10 persons)(17) 10,901,590 48.5 100,000 10,801,590 36.8
Other selling stockholders:
Scott R. Broomfield(18) 312,500 1.5 12,500 300,000 1.1 Desta R. Buchowski(19) 126,873 * 12,500 114,373 * Steven J. De Marco(20)
187,803 *
9,000
178,803 *
Bernard G. Kassar(21) 136,061 * 10,000 126,061 * Satish K. Palvai(22) 398,370 1.9 25,000 373,370 1.3 Ron W. Rasmussen(23) 190,050 * 15,000 175,050 *
(*) Represents beneficial ownership of less than 1%.
(1) Consists of (i) 1,860,236 shares held of record by Rembrandt Venture Partners II, L.P. (RVP II); (ii) 1,129,524 shares and 55,785 warrants exercisable within 60 days of April 30, 2015 held of record by Rembrandt Venture Partners Fund Two, L.P. (RVPF 2); (iii) 101,733 shares and 25,433 warrants exercisable within 60 days of April 30, 2015 held of record by Rembrandt Venture Partners Opportunities Fund I, L.P. (RVP Opportunities); and (iv) 3,394 shares and 167 warrants exercisable within 60 days of April 30, 2015 held of record by Rembrandt Venture Partners Fund Two-A, L.P. (RVPF 2-A). Gerald S. Casilli, one of our directors, and Douglas Schrier, as the managing members of Rembrandt Venture Partners II LLC, the general partner of RVP II, share voting and dispositive power with respect to the shares held by RVP II. Messrs. Casilli and Schrier and Scott Irwin, as the managing members of Rembrandt Venture Partners Fund Two, LLC, the general partner of RVPF 2 and RVPF 2-A, share voting and dispositive power with respect to the shares and warrants held by RVPF 2 and RVPF 2-A. Messrs. Casilli, Schrier and Irwin, as the managing members of Rembrandt Venture Partners Opportunities GP I, LLC, the general partner of RVP Opportunities, share voting and dispositive power with respect to the shares and warrants held by RVP Opportunities. The address for each of these entities is c/o Rembrandt Venture Partners, 600 Montgomery Street, 44th Floor, San Francisco, California 94111. Funds affiliated with Rembrandt Venture Partners, an existing stockholder for which our director, Gerald S. Casilli, shares voting and dispositive power, are expected to purchase an aggregate of 375,000 shares of our common stock in this offering at the initial public offering price. The underwriting discount for the shares sold to these stockholders in the offering will be the same as the underwriting discount for the shares sold to the public.
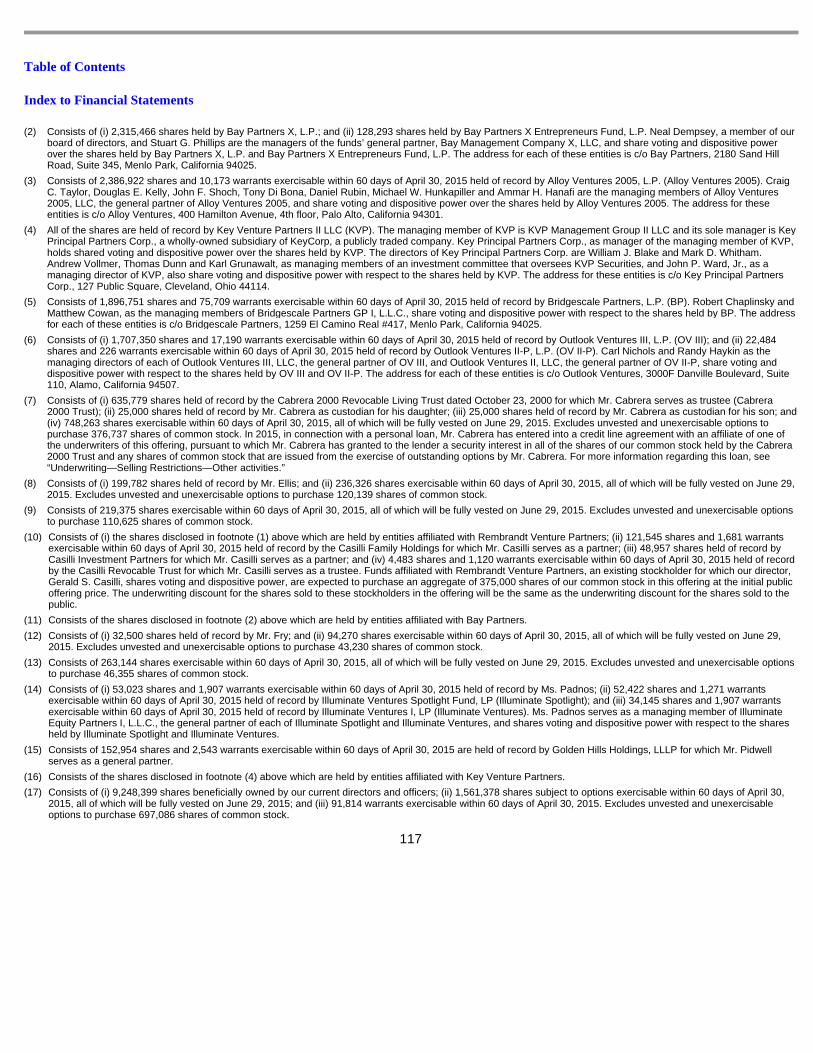
Table of Contents
Index to Financial Statements
117
(2) Consists of (i) 2,315,466 shares held by Bay Partners X, L.P.; and (ii) 128,293 shares held by Bay Partners X Entrepreneurs Fund, L.P. Neal Dempsey, a member of our board of directors, and Stuart G. Phillips are the managers of the funds’ general partner, Bay Management Company X, LLC, and share voting and dispositive power over the shares held by Bay Partners X, L.P. and Bay Partners X Entrepreneurs Fund, L.P. The address for each of these entities is c/o Bay Partners, 2180 Sand Hill Road, Suite 345, Menlo Park, California 94025.
(3) Consists of 2,386,922 shares and 10,173 warrants exercisable within 60 days of April 30, 2015 held of record by Alloy Ventures 2005, L.P. (Alloy Ventures 2005). Craig C. Taylor, Douglas E. Kelly, John F. Shoch, Tony Di Bona, Daniel Rubin, Michael W. Hunkapiller and Ammar H. Hanafi are the managing members of Alloy Ventures 2005, LLC, the general partner of Alloy Ventures 2005, and share voting and dispositive power over the shares held by Alloy Ventures 2005. The address for these entities is c/o Alloy Ventures, 400 Hamilton Avenue, 4th floor, Palo Alto, California 94301.
(4) All of the shares are held of record by Key Venture Partners II LLC (KVP). The managing member of KVP is KVP Management Group II LLC and its sole manager is Key Principal Partners Corp., a wholly-owned subsidiary of KeyCorp, a publicly traded company. Key Principal Partners Corp., as manager of the managing member of KVP, holds shared voting and dispositive power over the shares held by KVP. The directors of Key Principal Partners Corp. are William J. Blake and Mark D. Whitham. Andrew Vollmer, Thomas Dunn and Karl Grunawalt, as managing members of an investment committee that oversees KVP Securities, and John P. Ward, Jr., as a managing director of KVP, also share voting and dispositive power with respect to the shares held by KVP. The address for these entities is c/o Key Principal Partners Corp., 127 Public Square, Cleveland, Ohio 44114.
(5) Consists of 1,896,751 shares and 75,709 warrants exercisable within 60 days of April 30, 2015 held of record by Bridgescale Partners, L.P. (BP). Robert Chaplinsky and Matthew Cowan, as the managing members of Bridgescale Partners GP I, L.L.C., share voting and dispositive power with respect to the shares held by BP. The address for each of these entities is c/o Bridgescale Partners, 1259 El Camino Real #417, Menlo Park, California 94025.
(6) Consists of (i) 1,707,350 shares and 17,190 warrants exercisable within 60 days of April 30, 2015 held of record by Outlook Ventures III, L.P. (OV III); and (ii) 22,484 shares and 226 warrants exercisable within 60 days of April 30, 2015 held of record by Outlook Ventures II-P, L.P. (OV II-P). Carl Nichols and Randy Haykin as the managing directors of each of Outlook Ventures III, LLC, the general partner of OV III, and Outlook Ventures II, LLC, the general partner of OV II-P, share voting and dispositive power with respect to the shares held by OV III and OV II-P. The address for each of these entities is c/o Outlook Ventures, 3000F Danville Boulevard, Suite 110, Alamo, California 94507.
(7) Consists of (i) 635,779 shares held of record by the Cabrera 2000 Revocable Living Trust dated October 23, 2000 for which Mr. Cabrera serves as trustee (Cabrera 2000 Trust); (ii) 25,000 shares held of record by Mr. Cabrera as custodian for his daughter; (iii) 25,000 shares held of record by Mr. Cabrera as custodian for his son; and (iv) 748,263 shares exercisable within 60 days of April 30, 2015, all of which will be fully vested on June 29, 2015. Excludes unvested and unexercisable options to purchase 376,737 shares of common stock. In 2015, in connection with a personal loan, Mr. Cabrera has entered into a credit line agreement with an affiliate of one of the underwriters of this offering, pursuant to which Mr. Cabrera has granted to the lender a security interest in all of the shares of our common stock held by the Cabrera 2000 Trust and any shares of common stock that are issued from the exercise of outstanding options by Mr. Cabrera. For more information regarding this loan, see “Underwriting—Selling Restrictions—Other activities.”
(8) Consists of (i) 199,782 shares held of record by Mr. Ellis; and (ii) 236,326 shares exercisable within 60 days of April 30, 2015, all of which will be fully vested on June 29, 2015. Excludes unvested and unexercisable options to purchase 120,139 shares of common stock.
(9) Consists of 219,375 shares exercisable within 60 days of April 30, 2015, all of which will be fully vested on June 29, 2015. Excludes unvested and unexercisable options to purchase 110,625 shares of common stock.
(10) Consists of (i) the shares disclosed in footnote (1) above which are held by entities affiliated with Rembrandt Venture Partners; (ii) 121,545 shares and 1,681 warrants exercisable within 60 days of April 30, 2015 held of record by the Casilli Family Holdings for which Mr. Casilli serves as a partner; (iii) 48,957 shares held of record by Casilli Investment Partners for which Mr. Casilli serves as a partner; and (iv) 4,483 shares and 1,120 warrants exercisable within 60 days of April 30, 2015 held of record by the Casilli Revocable Trust for which Mr. Casilli serves as a trustee. Funds affiliated with Rembrandt Venture Partners, an existing stockholder for which our director, Gerald S. Casilli, shares voting and dispositive power, are expected to purchase an aggregate of 375,000 shares of our common stock in this offering at the initial public offering price. The underwriting discount for the shares sold to these stockholders in the offering will be the same as the underwriting discount for the shares sold to the public.
(11) Consists of the shares disclosed in footnote (2) above which are held by entities affiliated with Bay Partners.
(12) Consists of (i) 32,500 shares held of record by Mr. Fry; and (ii) 94,270 shares exercisable within 60 days of April 30, 2015, all of which will be fully vested on June 29, 2015. Excludes unvested and unexercisable options to purchase 43,230 shares of common stock.
(13) Consists of 263,144 shares exercisable within 60 days of April 30, 2015, all of which will be fully vested on June 29, 2015. Excludes unvested and unexercisable options to purchase 46,355 shares of common stock.
(14) Consists of (i) 53,023 shares and 1,907 warrants exercisable within 60 days of April 30, 2015 held of record by Ms. Padnos; (ii) 52,422 shares and 1,271 warrants exercisable within 60 days of April 30, 2015 held of record by Illuminate Ventures Spotlight Fund, LP (Illuminate Spotlight); and (iii) 34,145 shares and 1,907 warrants exercisable within 60 days of April 30, 2015 held of record by Illuminate Ventures I, LP (Illuminate Ventures). Ms. Padnos serves as a managing member of Illuminate Equity Partners I, L.L.C., the general partner of each of Illuminate Spotlight and Illuminate Ventures, and shares voting and dispositive power with respect to the shares held by Illuminate Spotlight and Illuminate Ventures.
(15) Consists of 152,954 shares and 2,543 warrants exercisable within 60 days of April 30, 2015 are held of record by Golden Hills Holdings, LLLP for which Mr. Pidwell serves as a general partner.
(16) Consists of the shares disclosed in footnote (4) above which are held by entities affiliated with Key Venture Partners.
(17) Consists of (i) 9,248,399 shares beneficially owned by our current directors and officers; (ii) 1,561,378 shares subject to options exercisable within 60 days of April 30, 2015, all of which will be fully vested on June 29, 2015; and (iii) 91,814 warrants exercisable within 60 days of April 30, 2015. Excludes unvested and unexercisable options to purchase 697,086 shares of common stock.
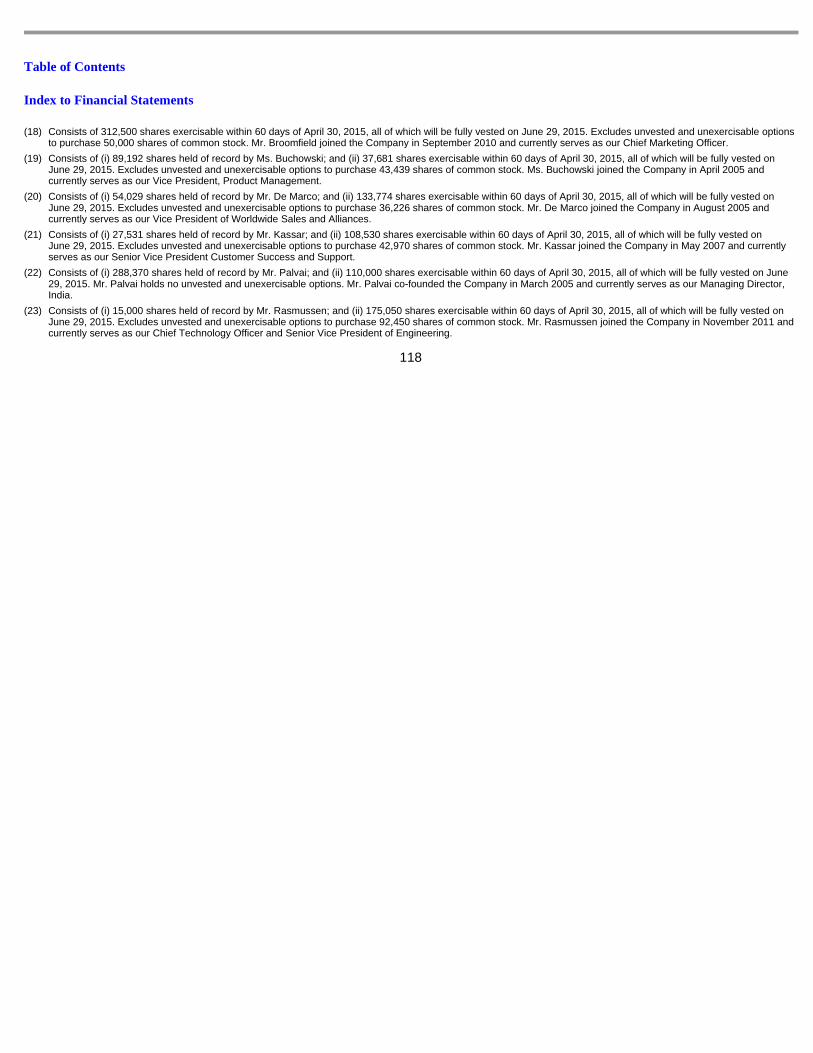
Table of Contents
Index to Financial Statements
118
(18) Consists of 312,500 shares exercisable within 60 days of April 30, 2015, all of which will be fully vested on June 29, 2015. Excludes unvested and unexercisable options to purchase 50,000 shares of common stock. Mr. Broomfield joined the Company in September 2010 and currently serves as our Chief Marketing Officer.
(19) Consists of (i) 89,192 shares held of record by Ms. Buchowski; and (ii) 37,681 shares exercisable within 60 days of April 30, 2015, all of which will be fully vested on June 29, 2015. Excludes unvested and unexercisable options to purchase 43,439 shares of common stock. Ms. Buchowski joined the Company in April 2005 and currently serves as our Vice President, Product Management.
(20) Consists of (i) 54,029 shares held of record by Mr. De Marco; and (ii) 133,774 shares exercisable within 60 days of April 30, 2015, all of which will be fully vested on June 29, 2015. Excludes unvested and unexercisable options to purchase 36,226 shares of common stock. Mr. De Marco joined the Company in August 2005 and currently serves as our Vice President of Worldwide Sales and Alliances.
(21) Consists of (i) 27,531 shares held of record by Mr. Kassar; and (ii) 108,530 shares exercisable within 60 days of April 30, 2015, all of which will be fully vested on June 29, 2015. Excludes unvested and unexercisable options to purchase 42,970 shares of common stock. Mr. Kassar joined the Company in May 2007 and currently serves as our Senior Vice President Customer Success and Support.
(22) Consists of (i) 288,370 shares held of record by Mr. Palvai; and (ii) 110,000 shares exercisable within 60 days of April 30, 2015, all of which will be fully vested on June 29, 2015. Mr. Palvai holds no unvested and unexercisable options. Mr. Palvai co-founded the Company in March 2005 and currently serves as our Managing Director, India.
(23) Consists of (i) 15,000 shares held of record by Mr. Rasmussen; and (ii) 175,050 shares exercisable within 60 days of April 30, 2015, all of which will be fully vested on June 29, 2015. Excludes unvested and unexercisable options to purchase 92,450 shares of common stock. Mr. Rasmussen joined the Company in November 2011 and currently serves as our Chief Technology Officer and Senior Vice President of Engineering.
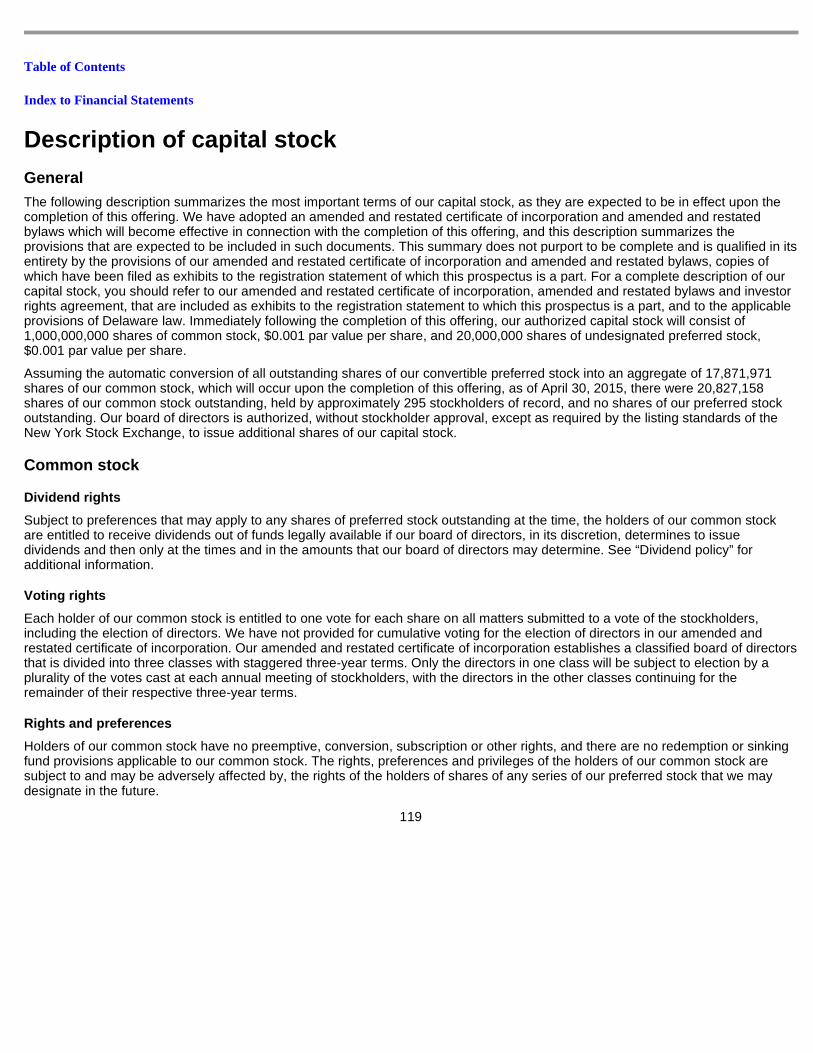
Table of Contents
Index to Financial Statements
Description of capital stock
General
The following description summarizes the most important terms of our capital stock, as they are expected to be in effect upon the completion of this offering. We have adopted an amended and restated certificate of incorporation and amended and restated bylaws which will become effective in connection with the completion of this offering, and this description summarizes the provisions that are expected to be included in such documents. This summary does not purport to be complete and is qualified in its entirety by the provisions of our amended and restated certificate of incorporation and amended and restated bylaws, copies of which have been filed as exhibits to the registration statement of which this prospectus is a part. For a complete description of our capital stock, you should refer to our amended and restated certificate of incorporation, amended and restated bylaws and investor rights agreement, that are included as exhibits to the registration statement to which this prospectus is a part, and to the applicable provisions of Delaware law. Immediately following the completion of this offering, our authorized capital stock will consist of 1,000,000,000 shares of common stock, $0.001 par value per share, and 20,000,000 shares of undesignated preferred stock, $0.001 par value per share.
Assuming the automatic conversion of all outstanding shares of our convertible preferred stock into an aggregate of 17,871,971 shares of our common stock, which will occur upon the completion of this offering, as of April 30, 2015, there were 20,827,158 shares of our common stock outstanding, held by approximately 295 stockholders of record, and no shares of our preferred stock outstanding. Our board of directors is authorized, without stockholder approval, except as required by the listing standards of the New York Stock Exchange, to issue additional shares of our capital stock.
Common stock
Dividend rights
Subject to preferences that may apply to any shares of preferred stock outstanding at the time, the holders of our common stock are entitled to receive dividends out of funds legally available if our board of directors, in its discretion, determines to issue dividends and then only at the times and in the amounts that our board of directors may determine. See “Dividend policy” for additional information.
Voting rights
Each holder of our common stock is entitled to one vote for each share on all matters submitted to a vote of the stockholders, including the election of directors. We have not provided for cumulative voting for the election of directors in our amended and restated certificate of incorporation. Our amended and restated certificate of incorporation establishes a classified board of directors that is divided into three classes with staggered three-year terms. Only the directors in one class will be subject to election by a plurality of the votes cast at each annual meeting of stockholders, with the directors in the other classes continuing for the remainder of their respective three-year terms.
Rights and preferences
Holders of our common stock have no preemptive, conversion, subscription or other rights, and there are no redemption or sinking fund provisions applicable to our common stock. The rights, preferences and privileges of the holders of our common stock are subject to and may be adversely affected by, the rights of the holders of shares of any series of our preferred stock that we may designate in the future.
119
Table of Contents
Index to Financial Statements
Right to receive liquidation distributions
In the event of our liquidation, dissolution or winding up, holders of our common stock will be entitled to share ratably in the net assets legally available for distribution to stockholders after the payment of all of our debts and other liabilities and the satisfaction of any liquidation preference granted to the holders of any then outstanding shares of preferred stock.
Fully paid and non-assessable
All of the outstanding shares of our common stock are, and the shares of our common stock to be issued pursuant to this offering will be, fully paid and non-assessable.
Preferred stock
Each currently outstanding share of our convertible preferred stock will be automatically converted into common stock on a one-to-one basis immediately prior to the completion of this offering pursuant to the automatic conversion provisions in our certificate of incorporation based on the proposed offering size or based on the requisite consent of the various series of convertible preferred stock. Holders of at least two-thirds of the voting power of the Series A, B, C, D and E convertible preferred stock, holders of at least 75% of the voting power of the Series D-1 convertible preferred stock and holders of at least 60% of the voting power of the Series F convertible preferred stock have provided their written consent to approve this conversion contingent upon this offering.
Following this offering, our board of directors will be authorized, subject to limitations prescribed by Delaware law, to issue preferred stock in one or more series, to establish from time to time the number of shares to be included in each series, and to fix the designation, powers, preferences and rights of the shares of each series and any of its qualifications, limitations or restrictions, in each case without further vote or action by our stockholders. Our board of directors can also increase or decrease the number of shares of any series of preferred stock, but not below the number of shares of that series then outstanding, without any further vote or action by our stockholders. Our board of directors may authorize the issuance of preferred stock with voting or conversion rights that could adversely affect the voting power or other rights of the holders of our common stock. The issuance of preferred stock, while providing flexibility in connection with possible acquisitions and other corporate purposes, could, among other things, have the effect of delaying, deferring or preventing a change in our control of our company and might adversely affect the market price of our common stock and the voting and other rights of the holders of our common stock. We have no current plan to issue any shares of preferred stock.
Registration rights
After the completion of this offering, the holders of approximately 18.0 million shares of our common stock, or their permitted transferees, are entitled to rights with respect to the registration of these shares under the Securities Act. These rights are provided under the terms of an amended and restated investor rights agreement between us and the holders of these shares, and include demand registration rights, piggyback registration rights and short form registration rights.
These registration rights will expire (i) five years following the completion of this offering or (ii) with respect to any particular stockholder, when such stockholder is able to sell all of its shares pursuant to Rule 144 of the Securities Act during any 90-day period. We will pay the registration expenses (other than underwriting discounts and selling commissions) of the holders of the shares registered pursuant to the registrations described below. In an underwritten offering, the managing underwriter, if any, has the right, subject to specified conditions, to limit the number of shares such holders may include. In connection with the completion of this offering, we expect that each stockholder that has registration rights will agree not to sell or otherwise
120
Table of Contents
Index to Financial Statements
dispose of any securities without the prior written consent of the underwriters for a period of 180 days after the date of this prospectus, subject to certain terms and conditions. See “Underwriting” for additional information regarding such restrictions.
Demand registration rights
Six months after the completion of this offering, the holders of 50% or more of the then outstanding registrable securities can request that we register the offer and sale of their shares if the anticipated aggregate offering price of such shares is at least $10.0 million. We are not required to effect more than two demand registrations. If we determine that it would be materially detrimental to us and our stockholders to effect a demand registration, we have the right to defer such registration, not more than once in any 12-month period, for a period of up to 90 days. Additionally, we are not required to effect a demand registration during the period beginning with the date 90 days prior to our good faith estimate of the date of filing, and ending 180 days following the effectiveness of a registration statement relating to the initial public offering of our securities.
Piggyback registration rights
If we propose to register the offer and sale of any of our securities under the Securities Act in connection with the public offering of such securities, the holders of registrable securities will be entitled to certain “piggyback” registration rights allowing such holders to include their shares in such registration, subject to certain limitations. As a result, whenever we propose to file a registration statement under the Securities Act, other than with respect to a registration related to a company stock option, stock purchase or similar benefit plan or an SEC Rule 145 transaction or any other registration statement that would not customarily provide for the sale of secondary equity shares for cash, the holders of these shares are entitled to notice of the registration and have the right to include their shares in the registration.
Form S-3 registration rights
The holders of our registrable securities may make a written request that we register the offer and sale of their shares on Form S-3 if we are eligible to file a registration statement on Form S-3 so long as the sale of securities registered pursuant to such request would result in an aggregate price to the public (net of any underwriters’ discounts and commissions) of at least $2.0 million. These holders may make an unlimited number of requests for registration on Form S-3; however, we will not be required to effect a registration on Form S-3 if we have effected one such registration within the 12-month period preceding the date of the request. Additionally, if we determine that it would be materially detrimental to us and our stockholders to effect such a registration, we have the right to defer such registration, not more than once in any 12-month period, for a period of up to 90 days.
Exclusive jurisdiction
Our amended and restated bylaws include a provision that unless we consent in writing to the selection of an alternative forum, the Court of Chancery of the State of Delaware will be the sole and exclusive forum for: (i) any derivative action or proceeding brought on behalf of us; (ii) any action asserting a claim of breach of a fiduciary duty owed by any of our directors, officers or other employees or agents to us or our stockholders; (iii) any action asserting a claim against us arising pursuant to any provision of the Delaware General Corporation Law or our amended and restated certificate of incorporation or amended and restated bylaws; (iv) any action to interpret, apply, enforce or determine the validity of our amended and restated certificate of incorporation or our amended and restated bylaws; or (v) any action asserting a claim against us governed by the internal affairs doctrine, in each such case, subject to said Court of Chancery having personal jurisdiction
121
Table of Contents
Index to Financial Statements
over the indispensable parties named as defendants therein. The enforceability of similar choice of forum provisions in other companies’ bylaws has been challenged in legal proceedings, and it is possible that, in connection with any action, a court could find the choice of forum provisions contained in our amended and restated bylaws to be inapplicable or unenforceable in such action.
Anti-takeover effects of Delaware law and our certi ficate of incorporation and bylaws
The provisions of Delaware law, our amended and restated certificate of incorporation and our amended and restated bylaws may have the effect of delaying, deferring or discouraging another person from acquiring control of our company. These provisions, which are summarized below, may have the effect of discouraging takeover bids. They are also designed, in part, to encourage persons seeking to acquire control of us to negotiate first with our board of directors. We believe that the benefits of increased protection of our potential ability to negotiate with an unfriendly or unsolicited acquirer outweigh the disadvantages of discouraging a proposal to acquire us because negotiation of these proposals could result in an improvement of their terms.
Delaware law
We are governed by the provisions of Section 203 of the Delaware General Corporation Law. In general, Section 203 prohibits a public Delaware corporation from engaging in a “business combination” with an “interested stockholder” for a period of three years after the date of the transaction in which the person became an interested stockholder, unless the business combination is approved in a prescribed manner. A “business combination” includes mergers, asset sales or other transactions resulting in a financial benefit to the stockholder. An “interested stockholder” is a person who, together with affiliates and associates, owns, or within three years of the date on which it is sought to be determined whether such person is an “interested stockholder,” did own, 15% or more of the corporation’s outstanding voting stock. These provisions may have the effect of delaying, deferring or preventing a change in our control.
Amended and restated certificate of incorporation a nd amended and restated bylaw provisions
Our amended and restated certificate of incorporation and our amended and restated bylaws include a number of provisions that could deter hostile takeovers or delay or prevent changes in control of our management team, including the following:
122
• Board of directors vacancies . Our amended and restated certificate of incorporation and amended and restated bylaws authorize only our board of directors to fill vacant directorships, including newly created seats. In addition, the number of directors constituting our board of directors will be permitted to be set only by a resolution adopted by our board of directors. These provisions would prevent a stockholder from increasing the size of our board of directors and then gaining control of our board of directors by filling the resulting vacancies with its own nominees. This will make it more difficult to change the composition of our board of directors but promotes continuity of management.
• Classified board . Our amended and restated certificate of incorporation and amended and restated bylaws provide that our board is classified into three classes of directors. A third party may be discouraged from making a tender offer or otherwise attempting to obtain control of us as it is more difficult and time consuming for stockholders to replace a majority of the directors on a classified board of directors. See “Management—Board of directors” for additional information.
• Stockholder action; Special meeting of stockholders . Our amended and restated certificate of incorporation provides that our stockholders may not take action by written consent, but may only take action at annual or special meetings of our stockholders. As a result, a holder controlling a majority of our capital stock would
Table of Contents
Index to Financial Statements
Limitations of liability and indemnification
See the section of this prospectus entitled ‘‘Executive compensation—Limitation on liability and indemnification matters.’’
Transfer agent and registrar
Upon the completion of this offering, the transfer agent and registrar for our common stock will be Computershare Trust Company, N.A. The transfer agent and registrar’s address is 250 Royall Street, Canton, Massachusetts 02021. Our shares of common stock will be issued in uncertificated form only, subject to limited circumstances.
Market listing
Our common stock has been approved for listing on the New York Stock Exchange under the symbol “XTLY.”
123
not be able to amend our amended and restated bylaws or remove directors without holding a meeting of our stockholders called in accordance with our amended and restated bylaws. Our amended and restated bylaws further provide that special meetings of our stockholders may be called only by our board of directors, the Chair of our board of directors, our Chief Executive Officer or our President, thus prohibiting a stockholder from calling a special meeting. These provisions might delay the ability of our stockholders to force consideration of a proposal or for stockholders controlling a majority of our capital stock to take any action, including the removal of directors.
• Advance notice requirements for stockholder proposals and director nominations . Our amended and restated bylaws provide advance notice procedures for stockholders seeking to bring business before our annual meeting of stockholders or to nominate candidates for election as directors at our annual meeting of stockholders. Our amended and restated bylaws also specify certain requirements regarding the form and content of a stockholder’s notice. These provisions might preclude our stockholders from bringing matters before our annual meeting of stockholders or from making nominations for directors at our annual meeting of stockholders if the proper procedures are not followed. We expect that these provisions may also discourage or deter a potential acquiror from conducting a solicitation of proxies to elect the acquiror’s own slate of directors or otherwise attempting to obtain control of our company.
• No cumulative voting . The Delaware General Corporation Law provides that stockholders are not entitled to the right to cumulate votes in the election of directors unless a corporation’s certificate of incorporation provides otherwise. Our amended and restated certificate of incorporation does not provide for cumulative voting.
• Directors removed only for cause . Our amended and restated certificate of incorporation provides that stockholders may remove directors only for cause.
• Amendment of charter provisions . Any amendment of the above provisions in our amended and restated certificate of incorporation would require approval by holders of at least 55% of our then outstanding common stock.
• Issuance of undesignated preferred stock . Our board of directors have the authority, without further action by the stockholders, to issue up to 20,000,000 shares of undesignated preferred stock with rights and preferences, including voting rights, designated from time to time by our board of directors. The existence of authorized but unissued shares of preferred stock would enable our board of directors to render more difficult or to discourage an attempt to obtain control of us by means of a merger, tender offer, proxy contest or other means.
Table of Contents
Index to Financial Statements
Shares eligible for future sale
Prior to this offering, there has been no public market for our common stock, and we cannot predict the effect, if any, that market sales of shares of our common stock or the availability of shares of our common stock for sale will have on the market price of our common stock prevailing from time to time. Future sales of our common stock in the public market, or the availability of such shares for sale in the public market, could adversely affect market prices prevailing from time to time. As described below, only a limited number of shares will be available for sale shortly after this offering due to contractual and legal restrictions on resale. Nevertheless, sales of our common stock in the public market after such restrictions lapse, or the perception that those sales may occur, could adversely affect the prevailing market price at such time and our ability to raise equity capital in the future.
Following the completion of this offering, and after giving effect to the automatic conversion of all outstanding shares of our convertible preferred stock which will occur upon the completion of this offering and the issuance of 27,500 shares of common stock to be acquired by certain selling stockholders upon the exercise of options in order to sell those shares in this offering, based on the number of shares of our capital stock outstanding as of April 30, 2015, we will have a total of 27,708,158 shares of our common stock outstanding. Of these outstanding shares, all of the shares of common stock sold in this offering, plus any shares sold upon exercise of the underwriters’ over-allotment option to purchase up to 1,055,625 additional shares of common stock from us in this offering, will be freely tradable, except that any shares purchased in this offering by our affiliates, as that term is defined in Rule 144 under the Securities Act, would only be able to be sold in compliance with the Rule 144 limitations described below.
The remaining outstanding shares of our common stock will be deemed “restricted securities” as defined in Rule 144. Restricted securities may be sold in the public market only if they are registered or if they qualify for an exemption from registration under Rule 144 or Rule 701 under the Securities Act, which rules are summarized below. In addition, holders of all or substantially all of our equity securities have entered into lock-up agreements with the underwriters under which they have agreed, subject to specific exceptions, not to sell any of our stock for at least 180 days following the date of this prospectus, as described below. As a result of these agreements and the provisions of our amended and restated investor rights agreement described above under “Description of capital stock—Registration rights,” and subject to the provisions of Rule 144 or Rule 701, shares will be available for sale in the public market as follows:
Lock-up agreements
We, our officers and directors and holders of substantially all of our common stock and securities convertible into or exchangeable for our common stock have agreed that, subject to certain exceptions and under certain conditions, for a period of 180 days after the date of this prospectus, we and they will not, without the prior written consent of the representatives of the underwriters, dispose of or hedge any shares or any securities convertible into or exchangeable for shares of our capital stock. The representatives may, in their discretion, release any of the securities subject to these lock-up agreements at any time.
124
• beginning on the date of this prospectus, the shares of common stock sold in this offering will be immediately available for sale in the public market;
• beginning 181 days after the date of this prospectus, additional shares of common stock will become eligible for sale in the public market, of which shares will be held by affiliates and subject to the volume and other restrictions of Rule 144, as described below; and
• the remainder of the shares of common stock will be eligible for sale in the public market from time to time thereafter, subject in some cases to the volume and other restrictions of Rule 144, as described below.
Table of Contents
Index to Financial Statements
Rule 144
In general, under Rule 144 as currently in effect, once we have been subject to the public company reporting requirements of Section 13 or Section 15(d) of the Exchange Act for at least 90 days, a person who is not deemed to have been one of our affiliates for purposes of the Securities Act at any time during the 90 days preceding a sale and who has beneficially owned the shares proposed to be sold for at least six months, including the holding period of any prior owner other than our affiliates, is entitled to sell those shares without complying with the manner of sale, volume limitation or notice provisions of Rule 144, subject to compliance with the public information requirements of Rule 144. If such a person has beneficially owned the shares proposed to be sold for at least one year, including the holding period of any prior owner other than our affiliates, then that person would be entitled to sell those shares without complying with any of the requirements of Rule 144.
In general, under Rule 144, as currently in effect, and upon expiration of the lock-up agreements described above, our affiliates or persons selling shares on behalf of our affiliates are entitled to sell within any three-month period, a number of shares that does not exceed the greater of:
provided, in each case, that we have been subject to the Exchange Act periodic reporting requirements for at least 90 days before the sale. Sales under Rule 144 by our affiliates or persons selling shares on behalf of our affiliates are also subject to certain manner of sale provisions and notice requirements and to the availability of current public information about us.
Rule 701
Rule 701 generally allows a stockholder who purchased shares of our common stock pursuant to a written compensatory plan or contract and who is not deemed to have been an affiliate of our company during the immediately preceding 90 days to sell these shares in reliance upon Rule 144, but without being required to comply with the public information, holding period, volume limitation or notice provisions of Rule 144. Rule 701 also permits affiliates of our company to sell their Rule 701 shares under Rule 144 without complying with the holding period requirements of Rule 144. All holders of Rule 701 shares, however, are required by that rule to wait until 90 days after the date of this prospectus before selling those shares pursuant to Rule 701.
Registration rights
Pursuant to an amended and restated investor rights agreement, the holders of approximately 18.0 million shares of our common stock, or their transferees, will be entitled to certain rights with respect to the registration of the offer and sale of those shares under the Securities Act. For a description of these registration rights, see “Description of capital stock—Registration rights.” If the offer and sale of these shares is registered, the shares will be freely tradable without restriction under the Securities Act, and a large number of shares may be sold into the public market.
125
• 1% of the number of shares of our common stock then outstanding, which will equal approximately 277,000 shares immediately after this offering, assuming no exercise by the underwriters of their option to purchase additional shares of common stock from us in this offering; or
• the average weekly trading volume of our common stock during the four calendar weeks preceding the filing of a notice on Form 144 with respect to that sale;

Table of Contents
Index to Financial Statements
Equity incentive plans
In connection with this offering, we intend to file a registration statement on Form S-8 under the Securities Act to register shares of our common stock issued or reserved for issuance under the 2005 Stock Plan, the 2015 Plan and the 2015 ESPP. The registration statement on Form S-8 is expected to become effective immediately upon filing, and shares covered by such registration statement will thereupon be eligible for sale in the public markets, subject to vesting restrictions, the lock-up agreements described above and Rule 144 limitations applicable to affiliates. See “Executive compensation—Employee benefit and stock plans” for additional information.
126
Table of Contents
Index to Financial Statements
Material U.S. federal income tax and estate tax con sequences to non-U.S. holders
The following is a summary of the material U.S. federal income tax consequences of the ownership and disposition of our common stock to non-U.S. holders, but does not purport to be a complete analysis of all the potential tax considerations relating thereto. This summary is based upon the provisions of the Code, Treasury regulations promulgated thereunder, administrative rulings and judicial decisions, all as of the date hereof. These authorities may be changed, possibly retroactively, so as to result in U.S. federal income tax consequences different from those set forth below. We have not sought any ruling from the Internal Revenue Service (IRS) with respect to the statements made and the conclusions reached in the following summary, and there can be no assurance that the IRS will agree with such statements and conclusions.
This summary also does not address the tax considerations arising under the laws of any non-U.S., state or local jurisdiction or under U.S. federal gift and estate tax laws, except to the limited extent set forth below. In addition, this discussion does not address tax considerations applicable to an investor’s particular circumstances or to investors that may be subject to special tax rules, including, without limitation:
In addition, if a partnership or entity classified as a partnership for U.S. federal income tax purposes holds our common stock, the tax treatment of a partner generally will depend on the status of the partner and upon the activities of the partnership. Accordingly, partnerships that hold our common stock, and partners in such partnerships, should consult their tax advisors.
You are urged to consult your tax advisor with respect to the application of the U.S. federal income tax laws to your particular situation, as well as any tax consequences of the purchase, ownership and disposition of our common stock arising under the U.S. federal estate or gift tax rules or under the laws of any state, local, non-U.S. or other taxing jurisdiction or under any applicable tax treaty.
127
• banks, insurance companies or other financial institutions;
• persons subject to the alternative minimum tax or net investment income tax;
• tax-exempt organizations;
• controlled foreign corporations, passive foreign investment companies and corporations that accumulate earnings to avoid U.S. federal income tax;
• dealers in securities or currencies;
• traders in securities that elect to use a mark-to-market method of accounting for their securities holdings;
• persons that own, or are deemed to own, more than 5% of our capital stock (except to the extent specifically set forth below);
• certain former citizens or long-term residents of the U.S.;
• persons who hold our common stock as a position in a hedging transaction, “straddle,” “conversion transaction” or other risk reduction transaction;
• persons who do not hold our common stock as a capital asset within the meaning of Section 1221 of the Code (generally, property held for investment); or
• persons deemed to sell our common stock under the constructive sale provisions of the Code.
Table of Contents
Index to Financial Statements
Non-U.S. holder defined
For purposes of this discussion, you are a non-U.S. holder if you are any holder other than:
Distributions
We do not anticipate making any distributions on our common stock following the completion of this offering. However, if we do make distributions on our common stock, those payments will constitute dividends for U.S. tax purposes to the extent paid from our current or accumulated earnings and profits, as determined under U.S. federal income tax principles. To the extent those distributions exceed both our current and our accumulated earnings and profits, they will constitute a return of capital and will first reduce your basis in our common stock, but not below zero, and then will be treated as gain from the sale of stock.
Any dividend paid to you generally will be subject to U.S. withholding tax either at a rate of 30% of the gross amount of the dividend or such lower rate as may be specified by an applicable income tax treaty. In order to receive a reduced treaty rate, you must provide us with an IRS Form W-8BEN or other appropriate version of IRS Form W-8 certifying qualification for the reduced rate. A non-U.S. holder of shares of our common stock eligible for a reduced rate of U.S. withholding tax pursuant to an income tax treaty may obtain a refund of any excess amounts withheld by filing an appropriate claim for refund with the IRS. If the non-U.S. holder holds the stock through a financial institution or other agent acting on the non-U.S. holder’s behalf, the non-U.S. holder will be required to provide appropriate documentation to the agent, which then will be required to provide certification to us or our paying agent, either directly or through other intermediaries.
Dividends received by you that are effectively connected with your conduct of a U.S. trade or business (and, if an income tax treaty applies, are attributable to a permanent establishment maintained by you in the U.S.), generally are includible in your gross income in the taxable year received, and are exempt from such withholding tax. In order to obtain this exemption, you must provide us with an IRS Form W-8ECI or other applicable IRS Form W-8 properly certifying such exemption. Such effectively connected dividends, although not subject to withholding tax, are taxed at the same graduated rates applicable to U.S. persons, net of certain deductions and credits. In addition, if you are a corporate non-U.S. holder, dividends you receive that are effectively connected with your conduct of a U.S. trade or business may also be subject to a branch profits tax at a rate of 30% or such lower rate as may be specified by an applicable income tax treaty.
Gain on disposition of common stock
You generally will not be required to pay U.S. federal income tax on any gain realized upon the sale or other disposition of our common stock unless:
128
• a partnership for U.S. federal income tax purposes;
• an individual citizen or resident of the U.S. (for tax purposes);
• a corporation or other entity taxable as a corporation created or organized in the U.S. or under the laws of the U.S. or any political subdivision thereof;
• an estate whose income is subject to U.S. federal income tax regardless of its source; or
• a trust (1) whose administration is subject to the primary supervision of a U.S. court and that has one or more U.S. persons who have the authority to control all substantial decisions of the trust or (2) that has made an election to be treated as a U.S. person.
• the gain is effectively connected with your conduct of a U.S. trade or business (and, if an income tax treaty applies, the gain is attributable to a permanent establishment maintained by you in the U.S.);
Table of Contents
Index to Financial Statements
We believe that we are not currently and will not become a USRPHC. However, because the determination of whether we are a USRPHC depends on the fair market value of our U.S. real property relative to the fair market value of our other business assets, there can be no assurance that we will not become a USRPHC in the future. Even if we become a USRPHC, however, as long as our common stock is regularly traded on an established securities market, your common stock will be treated as U.S. real property interests only if you actually or constructively hold more than 5% of such regularly traded common stock at any time during the shorter of the five-year period preceding your disposition of, or your holding period for, our common stock.
If you are a non-U.S. holder described in the first bullet above, you will be required to pay tax on the net gain derived from the sale under regular graduated U.S. federal income tax rates, and a corporate non-U.S. holder described in the first bullet above also may be subject to the branch profits tax at a 30% rate, or such lower rate as may be specified by an applicable income tax treaty. If you are an individual non-U.S. holder described in the second bullet above, you will be required to pay a flat 30% tax on the gain derived from the sale, which tax may be offset by U.S. source capital losses for the year. You should consult any applicable income tax or other treaties that may provide for different rules.
Federal estate tax
Our common stock beneficially owned by an individual who is not a citizen or resident of the U.S. (as defined for U.S. federal estate tax purposes) at the time of their death will generally be includable in the decedent’s gross estate for U.S. federal estate tax purposes, unless an applicable estate tax treaty provides otherwise.
Backup withholding and information reporting
Generally, we must report annually to the IRS the amount of dividends paid to you, your name and address, and the amount of tax withheld, if any. A similar report will be sent to you. Pursuant to applicable income tax treaties or other agreements, the IRS may make these reports available to tax authorities in your country of residence.
Payments of dividends or of proceeds on the disposition of stock made to you may be subject to information reporting and backup withholding at a current rate of 28% unless you establish an exemption, for example, by properly certifying your non-U.S. status on an IRS Form W-8BEN or another appropriate version of IRS Form W-8. Notwithstanding the foregoing, backup withholding and information reporting may apply if either we or our paying agent has actual knowledge, or reason to know, that you are a U.S. person.
Backup withholding is not an additional tax; rather, the U.S. income tax liability of persons subject to backup withholding will be reduced by the amount of tax withheld. If withholding results in an overpayment of taxes, a refund or credit may generally be obtained from the IRS, provided that the required information is furnished to the IRS in a timely manner.
Legislation affecting taxation of our common stock held by or through foreign entities
The Foreign Account Tax Compliance Act of 2012 (FATCA), and the regulations issued thereunder generally impose a U.S. federal withholding tax of 30% on dividends, and the gross proceeds of a disposition of our
129
• you are an individual who is present in the U.S. for a period or periods aggregating 183 days or more during the calendar year in which the sale or disposition occurs and certain other conditions are met; or
• our common stock constitutes a U.S. real property interest by reason of our status as a “United States real property holding corporation” (USRPHC), for U.S. federal income tax purposes at any time within the shorter of the five-year period preceding your disposition of, or your holding period for, our common stock.
Table of Contents
Index to Financial Statements
common stock, paid to a “foreign financial institution” (as specially defined under FATCA), unless such institution enters into an agreement with the U.S. government to withhold on certain payments and to collect and provide to the U.S. tax authorities substantial information regarding the U.S. account holders of such institution (which includes certain equity and debt holders of such institution, as well as certain account holders that are foreign entities with U.S. owners) or otherwise qualifies for an exemption. FATCA also generally imposes a U.S. federal withholding tax of 30% on dividends and the gross proceeds of a disposition of our common stock paid to a non-financial foreign entity unless such entity provides the withholding agent with a certification identifying the direct and indirect U.S. owners of the entity or otherwise qualifies for an exemption. These withholding obligations with respect to dividends on our common stock began July 1, 2014 and with respect to the gross proceeds of a sale or other disposition of our common stock will not begin until January 1, 2017. Under certain circumstances, a non-U.S. holder might be eligible for refunds or credits of such taxes. An intergovernmental agreement between the U.S. and an applicable foreign country may modify the requirements described in this paragraph. Prospective investors are encouraged to consult with their own tax advisors regarding the possible implications of FATCA on their investment in our common stock.
Each prospective investor should consult its own tax advisor regarding the particular U.S. federal, state and local and non-U.S. tax consequences of purchasing, holding and disposing of our common stock, including the consequences of any proposed change in applicable laws.
130
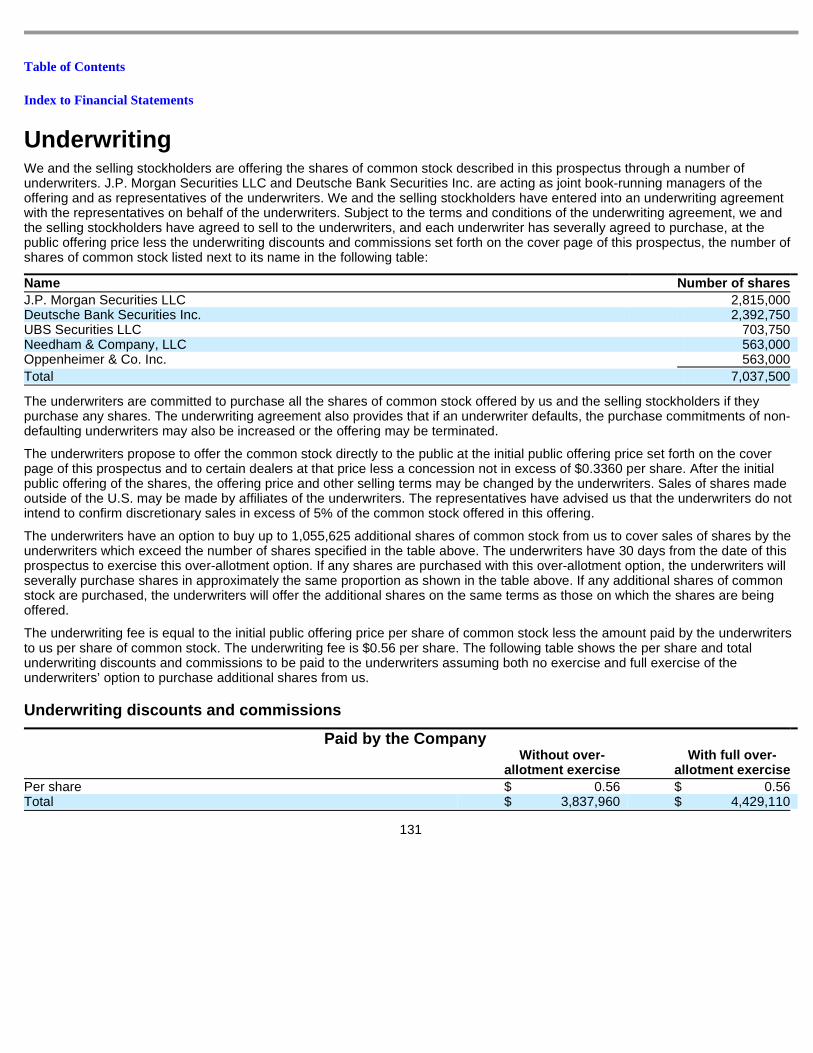
Table of Contents
Index to Financial Statements
Underwriting
We and the selling stockholders are offering the shares of common stock described in this prospectus through a number of underwriters. J.P. Morgan Securities LLC and Deutsche Bank Securities Inc. are acting as joint book-running managers of the offering and as representatives of the underwriters. We and the selling stockholders have entered into an underwriting agreement with the representatives on behalf of the underwriters. Subject to the terms and conditions of the underwriting agreement, we and the selling stockholders have agreed to sell to the underwriters, and each underwriter has severally agreed to purchase, at the public offering price less the underwriting discounts and commissions set forth on the cover page of this prospectus, the number of shares of common stock listed next to its name in the following table:
The underwriters are committed to purchase all the shares of common stock offered by us and the selling stockholders if they purchase any shares. The underwriting agreement also provides that if an underwriter defaults, the purchase commitments of non-defaulting underwriters may also be increased or the offering may be terminated.
The underwriters propose to offer the common stock directly to the public at the initial public offering price set forth on the cover page of this prospectus and to certain dealers at that price less a concession not in excess of $0.3360 per share. After the initial public offering of the shares, the offering price and other selling terms may be changed by the underwriters. Sales of shares made outside of the U.S. may be made by affiliates of the underwriters. The representatives have advised us that the underwriters do not intend to confirm discretionary sales in excess of 5% of the common stock offered in this offering.
The underwriters have an option to buy up to 1,055,625 additional shares of common stock from us to cover sales of shares by the underwriters which exceed the number of shares specified in the table above. The underwriters have 30 days from the date of this prospectus to exercise this over-allotment option. If any shares are purchased with this over-allotment option, the underwriters will severally purchase shares in approximately the same proportion as shown in the table above. If any additional shares of common stock are purchased, the underwriters will offer the additional shares on the same terms as those on which the shares are being offered.
The underwriting fee is equal to the initial public offering price per share of common stock less the amount paid by the underwriters to us per share of common stock. The underwriting fee is $0.56 per share. The following table shows the per share and total underwriting discounts and commissions to be paid to the underwriters assuming both no exercise and full exercise of the underwriters’ option to purchase additional shares from us.
Underwriting discounts and commissions
131
Name Number of shares
J.P. Morgan Securities LLC 2,815,000 Deutsche Bank Securities Inc. 2,392,750 UBS Securities LLC 703,750 Needham & Company, LLC 563,000 Oppenheimer & Co. Inc. 563,000
Total 7,037,500
Paid by the Company
Without over - allotment exercise
With full over - allotment exercise
Per share $ 0.56 $ 0.56 Total $ 3,837,960 $ 4,429,110
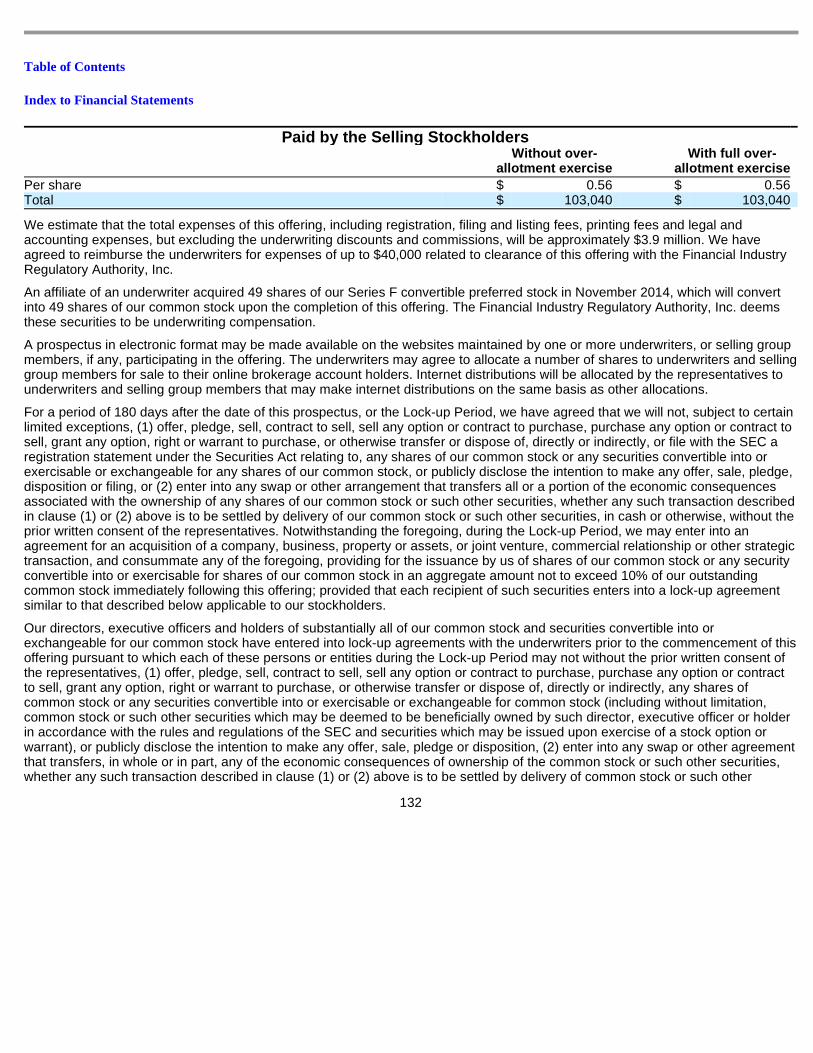
Table of Contents
Index to Financial Statements
We estimate that the total expenses of this offering, including registration, filing and listing fees, printing fees and legal and accounting expenses, but excluding the underwriting discounts and commissions, will be approximately $3.9 million. We have agreed to reimburse the underwriters for expenses of up to $40,000 related to clearance of this offering with the Financial Industry Regulatory Authority, Inc.
An affiliate of an underwriter acquired 49 shares of our Series F convertible preferred stock in November 2014, which will convert into 49 shares of our common stock upon the completion of this offering. The Financial Industry Regulatory Authority, Inc. deems these securities to be underwriting compensation.
A prospectus in electronic format may be made available on the websites maintained by one or more underwriters, or selling group members, if any, participating in the offering. The underwriters may agree to allocate a number of shares to underwriters and selling group members for sale to their online brokerage account holders. Internet distributions will be allocated by the representatives to underwriters and selling group members that may make internet distributions on the same basis as other allocations.
For a period of 180 days after the date of this prospectus, or the Lock-up Period, we have agreed that we will not, subject to certain limited exceptions, (1) offer, pledge, sell, contract to sell, sell any option or contract to purchase, purchase any option or contract to sell, grant any option, right or warrant to purchase, or otherwise transfer or dispose of, directly or indirectly, or file with the SEC a registration statement under the Securities Act relating to, any shares of our common stock or any securities convertible into or exercisable or exchangeable for any shares of our common stock, or publicly disclose the intention to make any offer, sale, pledge, disposition or filing, or (2) enter into any swap or other arrangement that transfers all or a portion of the economic consequences associated with the ownership of any shares of our common stock or such other securities, whether any such transaction described in clause (1) or (2) above is to be settled by delivery of our common stock or such other securities, in cash or otherwise, without the prior written consent of the representatives. Notwithstanding the foregoing, during the Lock-up Period, we may enter into an agreement for an acquisition of a company, business, property or assets, or joint venture, commercial relationship or other strategic transaction, and consummate any of the foregoing, providing for the issuance by us of shares of our common stock or any security convertible into or exercisable for shares of our common stock in an aggregate amount not to exceed 10% of our outstanding common stock immediately following this offering; provided that each recipient of such securities enters into a lock-up agreement similar to that described below applicable to our stockholders.
Our directors, executive officers and holders of substantially all of our common stock and securities convertible into or exchangeable for our common stock have entered into lock-up agreements with the underwriters prior to the commencement of this offering pursuant to which each of these persons or entities during the Lock-up Period may not without the prior written consent of the representatives, (1) offer, pledge, sell, contract to sell, sell any option or contract to purchase, purchase any option or contract to sell, grant any option, right or warrant to purchase, or otherwise transfer or dispose of, directly or indirectly, any shares of common stock or any securities convertible into or exercisable or exchangeable for common stock (including without limitation, common stock or such other securities which may be deemed to be beneficially owned by such director, executive officer or holder in accordance with the rules and regulations of the SEC and securities which may be issued upon exercise of a stock option or warrant), or publicly disclose the intention to make any offer, sale, pledge or disposition, (2) enter into any swap or other agreement that transfers, in whole or in part, any of the economic consequences of ownership of the common stock or such other securities, whether any such transaction described in clause (1) or (2) above is to be settled by delivery of common stock or such other
132
Paid by the Selling Stockholders
Without over - allotment exercise
With full over - allotment exercise
Per share $ 0.56 $ 0.56 Total $ 103,040 $ 103,040
Table of Contents
Index to Financial Statements
securities, in cash or otherwise or (3) make any demand for or exercise any right with respect to the registration of any shares of common stock or any security convertible into or exercisable or exchangeable for common stock. The restrictions described in this paragraph do not apply to (A) sales of shares of common stock in this offering, (B) transfers of common stock acquired by such director, executive officer or holder in open market transactions on or after this offering, (C) transfers of shares of common stock (i) by bona fide gift or gifts or other dispositions by will or intestacy, (ii) to an immediate family member, defined as a spouse, domestic partner, parent, child, grandchild or first cousin, regardless of whether such relationship is by blood, marriage or adoption, of such director, executive officer or holder, or to a trust formed for the benefit of such director, executive officer or holder or an immediate family member of such director, executive officer or holder, (iii) if the holder is a corporation, partnership, limited liability company or other business entity, as part of a transfer or distribution of common stock or such other securities to partners, members, affiliates (as defined in Rule 405 promulgated under the Securities Act) or stockholders of such holder or (iv) if the holder is a trust, to a trustor or beneficiary of the trust, (D) the establishment of a trading plan pursuant to Rule 10b5-1 under the Exchange Act for the transfer of common stock, provided that such plan does not provide for the transfer of common stock during the Lock-up Period, and provided that if the entry into a plan is publicly disclosed, such disclosure indicates that no sales may be made thereunder during the Lock-up Period, (E) in connection with the “net” or “cashless” exercise or settlement of stock options, restricted stock units or other equity awards (including any transfer for the payment of taxes due as a result of such vesting or exercise whether by means of a “net settlement” or otherwise; provided that any such transfer shall only be permitted to us) pursuant to an employee benefit plan disclosed in the final prospectus used for this offering, provided that any such shares of common stock received upon such vesting or exercise shall be subject to the terms of this provision, (F) to us in connection with the repurchase of shares of common stock issued pursuant to an employee benefit plan disclosed in the final prospectus used for this offering or pursuant to the agreements pursuant to which such shares were issued as disclosed in the final prospectus used for this offering, (G) pursuant to a bona fide third-party tender offer, merger, consolidation or other similar transaction made to all holders of our capital stock on substantially the same terms for holders of at least 50.1% of the outstanding common stock and involving a change of control of us, provided that in the event that such tender offer, merger, consolidation or other such transaction is not completed, the common stock held by such director, executive officer or holder shall remain subject to the restrictions described in this paragraph, (H) transfers of up to a certain number of shares of our common stock that are pledged to UBS Credit Corp. (or its assigns or affiliates), provided that (i) UBS Credit Corp. is the recipient of any such transfer and (ii) UBS Credit Corp. shall execute and deliver to the representatives a lock-up agreement with the same terms as those agreements entered into by our directors, executive officers and other holders as described in this paragraph, or (I) by operation of law, such as pursuant to a qualified domestic order or in connection with a divorce settlement, provided that each such transferee executes an agreement stating that the transferee is receiving and holding such common stock subject to the restrictions described in this paragraph; provided that in the case of any transfer or distribution pursuant to clause (B), such transfer or distribution shall not involve a disposition for value and each transferee, donee or distributee shall execute and deliver to the representatives a lock-up letter in the form of this paragraph; provided, further, that in the case of any transfer or distribution pursuant to clause (B), (C), (D), (E) or (I) no filing by any party under the Exchange Act or other public announcement shall be required or shall be made voluntarily in connection with such transfer or distribution (other than a filing on a Form 5 made after the expiration of the Lock-up Period).
We and the selling stockholders have agreed to indemnify the underwriters against certain liabilities, including liabilities under the Securities Act.
Our common stock has been approved for listing on the New York Stock Exchange under the symbol “XTLY.”
133
Table of Contents
Index to Financial Statements
In connection with this offering, the underwriters may engage in stabilizing transactions, which involves making bids for, purchasing and selling shares of common stock in the open market for the purpose of preventing or retarding a decline in the market price of the common stock while this offering is in progress. These stabilizing transactions may include making short sales of the common stock, which involves the sale by the underwriters of a greater number of shares of common stock than they are required to purchase in this offering, and purchasing shares of common stock on the open market to cover positions created by short sales. Short sales may be “covered” shorts, which are short positions in an amount not greater than the underwriters’ over-allotment option referred to above, or may be “naked” shorts, which are short positions in excess of that amount. The underwriters may close out any covered short position either by exercising their over-allotment option, in whole or in part, or by purchasing shares in the open market. In making this determination, the underwriters will consider, among other things, the price of shares available for purchase in the open market compared to the price at which the underwriters may purchase shares through the over-allotment option. A naked short position is more likely to be created if the underwriters are concerned that there may be downward pressure on the price of the common stock in the open market that could adversely affect investors who purchase in this offering. To the extent that the underwriters create a naked short position, they will purchase shares in the open market to cover the position.
The underwriters have advised us that, pursuant to Regulation M promulgated under the Securities Act, they may also engage in other activities that stabilize, maintain or otherwise affect the price of the common stock, including the imposition of penalty bids. This means that if the representatives of the underwriters purchase common stock in the open market in stabilizing transactions or to cover short sales, the representatives can require the underwriters that sold those shares as part of this offering to repay the underwriting discount received by them.
These activities may have the effect of raising or maintaining the market price of the common stock or preventing or retarding a decline in the market price of the common stock, and as a result, the price of the common stock may be higher than the price that otherwise might exist in the open market. If the underwriters commence these activities, they may discontinue them at any time. The underwriters may carry out these transactions on the New York Stock Exchange, in the over-the-counter market or otherwise.
Prior to this offering, there has been no public market for our common stock. The initial public offering price has been determined by negotiations between us and the representatives of the underwriters. In determining the initial public offering price, we and the representatives of the underwriters considered a number of factors including:
Neither we nor the underwriters can assure investors that an active trading market will develop for our common stock, or that the shares will trade in the public market at or above the initial public offering price.
134
• the information set forth in this prospectus and otherwise available to the representatives;
• our prospects and the history and prospects for the industry in which we compete;
• an assessment of our management;
• our prospects for future earnings;
• the general condition of the securities markets at the time of this offering;
• the recent market prices of, and demand for, publicly traded common stock of generally comparable companies; and
• other factors deemed relevant by the underwriters and us.
Table of Contents
Index to Financial Statements
Selling restrictions
General
Other than in the U.S., no action has been taken by us or the underwriters that would permit a public offering of the securities offered by this prospectus in any jurisdiction where action for that purpose is required. The securities offered by this prospectus may not be offered or sold, directly or indirectly, nor may this prospectus or any other offering material or advertisements in connection with the offer and sale of any such securities be distributed or published in any jurisdiction, except under circumstances that will result in compliance with the applicable rules and regulations of that jurisdiction. Persons into whose possession this prospectus comes are advised to inform themselves about and to observe any restrictions relating to the offering and the distribution of this prospectus. This prospectus does not constitute an offer to sell or a solicitation of an offer to buy any securities offered by this prospectus in any jurisdiction in which such an offer or a solicitation is unlawful.
United Kingdom
This document is only being distributed to and is only directed at (i) persons who are outside the United Kingdom, (ii) investment professionals falling within Article 19(5) of the Financial Services and Markets Act 2000 (Financial Promotion) Order 2005, as amended (the Order), or (iii) high net worth entities, and other persons to whom it may lawfully be communicated, falling within Article 49(2)(a) to (d) of the Order (all such persons together being referred to as “relevant persons”). The securities are only available to, and any invitation, offer or agreement to subscribe, purchase or otherwise acquire such securities will be engaged in only with, relevant persons. Any person who is not a relevant person should not act or rely on this document or any of its contents.
European Economic Area
In relation to each Member State of the European Economic Area which has implemented the Prospectus Directive (each, a Relevant Member State), from and including the date on which the E.U. Prospectus Directive (E.U. Prospectus Directive) was implemented in that Relevant Member State (Relevant Implementation Date), an offer of securities described in this prospectus may not be made to the public in that Relevant Member State prior to the publication of a prospectus in relation to the shares which has been approved by the competent authority in that Relevant Member State or, where appropriate, approved in another Relevant Member State and notified to the competent authority in that Relevant Member State, all in accordance with the E.U. Prospectus Directive, except that, with effect from and including the Relevant Implementation Date, an offer of securities described in this prospectus may be made to the public in that Relevant Member State at any time:
For the purposes of this provision, the expression an ‘‘offer of securities to the public’’ in relation to any securities in any Relevant Member State means the communication in any form and by any means of sufficient information on the terms of the offer and the securities to be offered so as to enable an investor to decide to purchase or subscribe for the securities, as the same may be varied in that Member State by any measure
135
• to any legal entity which is a qualified investor as defined under the E.U. Prospectus Directive;
• to fewer than 100 or, if the Relevant Member State has implemented the relevant provision of the 2010 PD Amending Directive, 150 natural or legal persons (other than qualified investors as defined in the E.U. Prospectus Directive); or
• in any other circumstances falling within Article 3(2) of the E.U. Prospectus Directive, provided that no such offer of securities described in this prospectus shall result in a requirement for the publication by us of a prospectus pursuant to Article 3 of the E.U. Prospectus Directive.
Table of Contents
Index to Financial Statements
implementing the E.U. Prospectus Directive in that Member State. The expression “E.U. Prospectus Directive” means Directive 2003/71/EC (and any amendments thereto, including the 2010 PD Amending Directive, to the extent implemented in the Relevant Member State) and includes any relevant implementing measure in each Relevant Member State, and the expression “2010 PD Amending Directive” means Directive 2010/73/EU.
Hong Kong
This prospectus has not been approved by or registered with the Securities and Futures Commission of Hong Kong or the Registrar of Companies of Hong Kong. The shares may not be offered or sold in Hong Kong by means of any document other than (i) in circumstances which do not constitute an offer to the public within the meaning of the Companies Ordinance (Cap.32, Laws of Hong Kong), (ii) to “professional investors” within the meaning of the Securities and Futures Ordinance (Cap.571, Laws of Hong Kong) and any rules made thereunder or (iii) in other circumstances which do not result in the document being a “prospectus” within the meaning of the Companies Ordinance (Cap.32, Laws of Hong Kong), and no advertisement, invitation or document relating to the shares may be issued or may be in the possession of any person for the purpose of issue (in each case whether in Hong Kong or elsewhere), which is directed at, or the contents of which are likely to be accessed or read by, the public in Hong Kong (except if permitted to do so under the laws of Hong Kong) other than with respect to shares which are or are intended to be disposed of only to persons outside Hong Kong or only to “professional investors” within the meaning of the Securities and Futures Ordinance (Cap. 571, Laws of Hong Kong) and any rules made thereunder.
Singapore
This prospectus has not been registered as a prospectus with the Monetary Authority of Singapore. Accordingly, this prospectus and any other document or material in connection with the offer or sale, or invitation for subscription or purchase, of the shares may not be circulated or distributed, nor may the shares be offered or sold, or be made the subject of an invitation for subscription or purchase, whether directly or indirectly, to persons in Singapore other than (i) to an institutional investor under Section 274 of the Securities and Futures Act (Chapter 289) (the SFA), (ii) to a relevant person, or any person pursuant to Section 275(1A), and in accordance with the conditions, specified in Section 275 of the SFA or (iii) otherwise pursuant to, and in accordance with the conditions of, any other applicable provision of the SFA.
Where the shares are subscribed or purchased under Section 275 by a relevant person which is: (a) a corporation (which is not an accredited investor) the sole business of which is to hold investments and the entire share capital of which is owned by one or more individuals, each of whom is an accredited investor; or (b) a trust (where the trustee is not an accredited investor) whose sole purpose is to hold investments and each beneficiary is an accredited investor, then shares, debentures and units of shares and debentures of that corporation or the beneficiaries’ rights and interest in that trust shall not be transferable for six months after that corporation or that trust has acquired the shares under Section 275 except: (1) to an institutional investor under Section 274 of the SFA or to a relevant person, or any person pursuant to Section 275(1A), and in accordance with the conditions, specified in Section 275 of the SFA; (2) where no consideration is given for the transfer; or (3) by operation of law.
Switzerland
This document, as well as any other material relating to the shares of our common stock, which are the subject of the offering contemplated by this prospectus, does not constitute an issue prospectus pursuant to Article 652a or 1156 of the Swiss Code of Obligations. The shares will not be listed on the SIX Swiss Exchange and, therefore, the documents relating to the shares, including, but not limited to, this document, do not claim to
136
Table of Contents
Index to Financial Statements
comply with the disclosure standards of the listing rules of SIX Swiss Exchange and corresponding prospectus schemes annexed to the listing rules of the SIX Swiss Exchange.
The shares are being offered in Switzerland by way of a private placement, i.e. to a small number of selected investors only, without any public offer and only to investors who do not purchase the shares with the intention to distribute them to the public. The investors will be individually approached by us from time to time.
Other activities
Certain of the underwriters and their affiliates have provided in the past to us and our affiliates and may provide from time to time in the future certain commercial banking, financial advisory, investment banking and other services for us and such affiliates in the ordinary course of their business, for which they have received and may continue to receive customary fees and commissions. Beginning in January 2015, UBS Credit Corp., an affiliate of UBS Securities LLC, has made extensions of credit to Mr. Cabrera and the Cabrera 2000 Trust. Interest on the loan accrues at market rates. UBS Credit Corp. received customary fees and expense reimbursements in connection with these loans. As a regulated entity, UBS Credit Corp. makes decisions regarding making and managing its loans independent of UBS Securities LLC. We are not a party to this loan, which is full recourse against Mr. Cabrera and the Cabrera 2000 Trust and is secured by pledges of our common stock currently owned, and any shares of common stock that are issued from the exercise of outstanding options, by Mr. Cabrera and the Cabrera 2000 Trust. The terms of these loans were negotiated directly between Mr. Cabrera and UBS Credit Corp. In addition, from time to time, certain of the underwriters and their affiliates may effect transactions for their own account or the account of customers, and hold on behalf of themselves or their customers, long or short positions in our debt or equity securities or loans, and may do so in the future.
137
Table of Contents
Index to Financial Statements
Legal matters
The validity of the shares of common stock offered hereby will be passed upon for us by Wilson Sonsini Goodrich & Rosati, Professional Corporation, Palo Alto, California. Investment funds affiliated with Wilson Sonsini Goodrich & Rosati own an interest representing less than 0.2% of our outstanding convertible preferred stock as of the date of this prospectus.
The underwriters are being represented by Davis Polk & Wardwell LLP, Menlo Park, California, in connection with this offering.
Experts
The consolidated financial statements of Xactly Corporation and its subsidiaries as of January 31, 2014 and 2015, and for each of the years in the three-year period ended January 31, 2015, have been included herein in reliance upon the report of KPMG LLP, independent registered public accounting firm, appearing elsewhere herein, and upon the authority of said firm as experts in accounting and auditing.
Where you can find more information
We have filed with the SEC a registration statement on Form S-1 under the Securities Act with respect to the shares of common stock offered by this prospectus. The rules and regulations of the SEC allow us to omit certain information from this prospectus that is included in the registration statement. Statements made in this prospectus concerning the contents of any contract, agreement or other document are summaries of all material information about the contract, agreement or other document summarized, but are not complete descriptions of all terms of those contracts, agreements or other documents. If we filed any of those contracts, agreements or other documents as an exhibit to the registration statement, you may read the contract, agreement or other document itself for a complete description of its terms. You may obtain copies of this information by mail from the Public Reference Room of the SEC, 100 F Street, N.E., Room 1580, Washington, D.C. 20549, at prescribed rates. You may obtain information on the operation of the public reference rooms by calling the SEC at 1-800-SEC-0330. The SEC also maintains an internet website that contains reports, proxy statements and other information about issuers, like us, that file electronically with the SEC. The address of that website is www.sec.gov.
As a result of this offering, we will become subject to the information and reporting requirements of the Exchange Act and, in accordance with this law, will file periodic reports, proxy statements and other information with the SEC. These periodic reports, proxy statements and other information will be available for inspection and copying at the SEC’s public reference facilities and the website of the SEC referred to above. We also maintain a website at www.xactlycorp.com. Upon completion of this offering, you may access these materials free of charge as soon as reasonably practicable after they are electronically filed with, or furnished to, the SEC. Information contained on our website is not a part of this prospectus and the inclusion of our website address in this prospectus is an inactive textual reference only.
138
Table of Contents
Index to Financial Statements
Xactly Corporation
Index to consolidated financial statements
F-1
Page Report of independent registered public accounting firm F-2 Consolidated balance sheets F-3 Consolidated statements of operations F-4 Consolidated statements of comprehensive loss F-5 Consolidated statements of stockholders’ equity (deficit) F-6 Consolidated statements of cash flows F-7 Notes to consolidated financial statements F-8
Table of Contents
Index to Financial Statements
Report of independent registered public accounting firm
The Board of Directors and Stockholders Xactly Corporation:
We have audited the accompanying consolidated balance sheets of Xactly Corporation and subsidiaries (the Company) as of January 31, 2014 and 2015, and the related consolidated statements of operations, comprehensive loss, stockholders’ equity (deficit), and cash flows for each of the years in the three-year period ended January 31, 2015. These consolidated financial statements are the responsibility of the Company’s management. Our responsibility is to express an opinion on these consolidated financial statements based on our audits.
We conducted our audits in accordance with the standards of the Public Company Accounting Oversight Board (United States). Those standards require that we plan and perform the audit to obtain reasonable assurance about whether the financial statements are free of material misstatement. An audit includes examining, on a test basis, evidence supporting the amounts and disclosures in the financial statements. An audit also includes assessing the accounting principles used and significant estimates made by management, as well as evaluating the overall financial statement presentation. We believe that our audits provide a reasonable basis for our opinion.
In our opinion, the consolidated financial statements referred to above present fairly, in all material respects, the financial position of Xactly Corporation and subsidiaries as of January 31, 2014 and 2015, and the results of their operations and their cash flows for each of the years in the three-year period ended January 31, 2015, in conformity with U.S. generally accepted accounting principles.
/s/ KPMG
Santa Clara, California April 17, 2015, except for Note 15 to the Consolidated Financial Statements, which is as of June 11, 2015
F-2
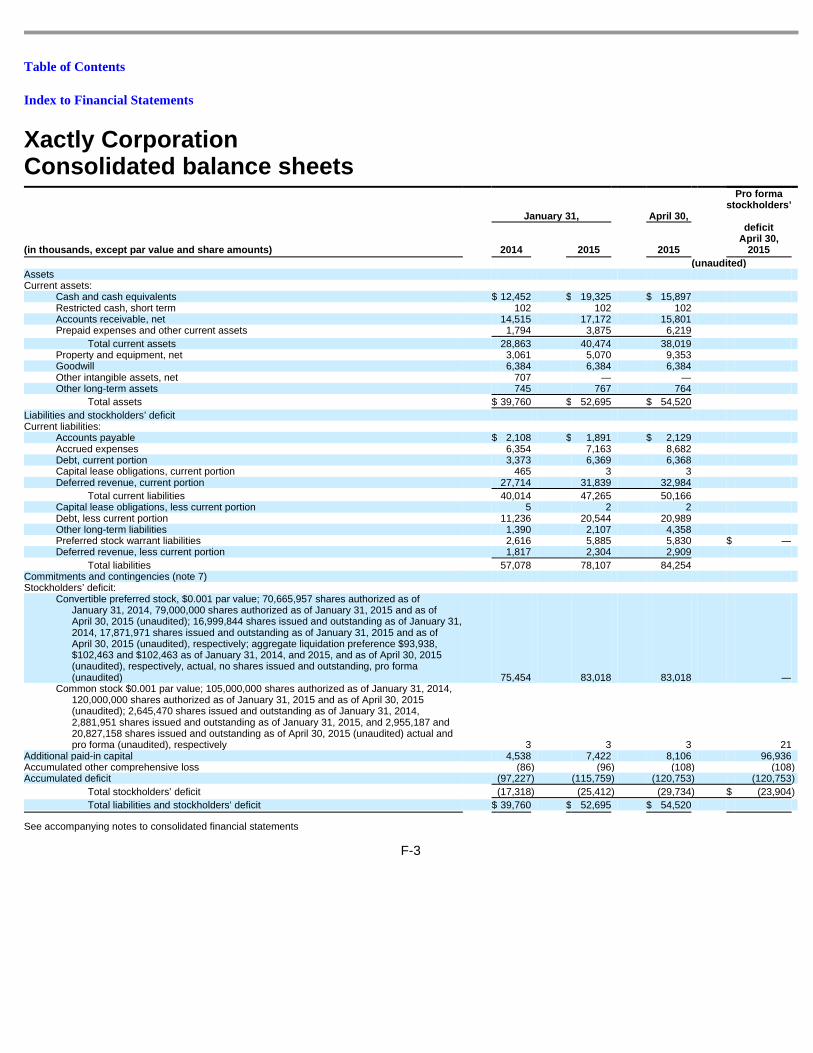
Table of Contents
Index to Financial Statements
Xactly Corporation
Consolidated balance sheets
See accompanying notes to consolidated financial statements
F-3
January 31, April 30,
Pro forma stockholders’
deficit
April 30, 2015 (in thousands, except par value and share amounts) 2014 2015 2015
(unaudited) Assets Current assets:
Cash and cash equivalents $ 12,452 $ 19,325 $ 15,897 Restricted cash, short term 102 102 102 Accounts receivable, net 14,515 17,172 15,801 Prepaid expenses and other current assets 1,794 3,875 6,219
Total current assets 28,863 40,474 38,019 Property and equipment, net 3,061 5,070 9,353 Goodwill 6,384 6,384 6,384 Other intangible assets, net 707 — — Other long-term assets 745 767 764
Total assets $ 39,760 $ 52,695 $ 54,520
Liabilities and stockholders’ deficit Current liabilities:
Accounts payable $ 2,108 $ 1,891 $ 2,129 Accrued expenses 6,354 7,163 8,682 Debt, current portion 3,373 6,369 6,368 Capital lease obligations, current portion 465 3 3 Deferred revenue, current portion 27,714 31,839 32,984
Total current liabilities 40,014 47,265 50,166 Capital lease obligations, less current portion 5 2 2 Debt, less current portion 11,236 20,544 20,989 Other long-term liabilities 1,390 2,107 4,358 Preferred stock warrant liabilities 2,616 5,885 5,830 $ — Deferred revenue, less current portion 1,817 2,304 2,909
Total liabilities 57,078 78,107 84,254 Commitments and contingencies (note 7) Stockholders’ deficit:
Convertible preferred stock, $0.001 par value; 70,665,957 shares authorized as of January 31, 2014, 79,000,000 shares authorized as of January 31, 2015 and as of April 30, 2015 (unaudited); 16,999,844 shares issued and outstanding as of January 31, 2014, 17,871,971 shares issued and outstanding as of January 31, 2015 and as of April 30, 2015 (unaudited), respectively; aggregate liquidation preference $93,938, $102,463 and $102,463 as of January 31, 2014, and 2015, and as of April 30, 2015 (unaudited), respectively, actual, no shares issued and outstanding, pro forma (unaudited) 75,454 83,018 83,018 —
Common stock $0.001 par value; 105,000,000 shares authorized as of January 31, 2014, 120,000,000 shares authorized as of January 31, 2015 and as of April 30, 2015 (unaudited); 2,645,470 shares issued and outstanding as of January 31, 2014, 2,881,951 shares issued and outstanding as of January 31, 2015, and 2,955,187 and 20,827,158 shares issued and outstanding as of April 30, 2015 (unaudited) actual and pro forma (unaudited), respectively 3 3 3 21
Additional paid-in capital 4,538 7,422 8,106 96,936 Accumulated other comprehensive loss (86 ) (96 ) (108 ) (108 ) Accumulated deficit (97,227 ) (115,759 ) (120,753 ) (120,753 )
Total stockholders’ deficit (17,318 ) (25,412 ) (29,734 ) $ (23,904 )
Total liabilities and stockholders’ deficit $ 39,760 $ 52,695 $ 54,520
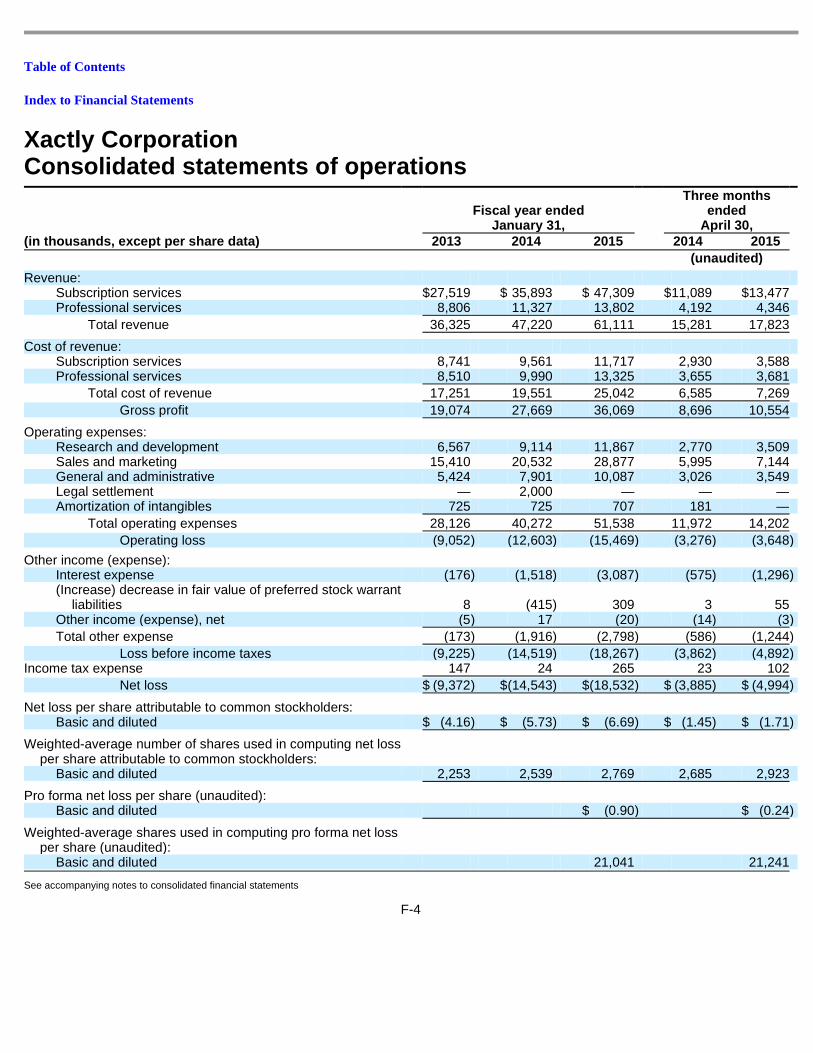
Table of Contents
Index to Financial Statements
Xactly Corporation
Consolidated statements of operations
See accompanying notes to consolidated financial statements
F-4
Fiscal year ended January 31,
Three months ended
April 30,
(in thousands, except per share data) 2013 2014 2015 2014 2015
(unaudited)
Revenue:
Subscription services $ 27,519 $ 35,893 $ 47,309 $ 11,089 $ 13,477 Professional services 8,806 11,327 13,802 4,192 4,346
Total revenue 36,325 47,220 61,111 15,281 17,823
Cost of revenue:
Subscription services 8,741 9,561 11,717 2,930 3,588 Professional services 8,510 9,990 13,325 3,655 3,681
Total cost of revenue 17,251 19,551 25,042 6,585 7,269
Gross profit 19,074 27,669 36,069 8,696 10,554
Operating expenses:
Research and development 6,567 9,114 11,867 2,770 3,509 Sales and marketing 15,410 20,532 28,877 5,995 7,144 General and administrative 5,424 7,901 10,087 3,026 3,549 Legal settlement — 2,000 — — — Amortization of intangibles 725 725 707 181 —
Total operating expenses 28,126 40,272 51,538 11,972 14,202
Operating loss (9,052 ) (12,603 ) (15,469 ) (3,276 ) (3,648 )
Other income (expense):
Interest expense (176 ) (1,518 ) (3,087 ) (575 ) (1,296 ) (Increase) decrease in fair value of preferred stock warrant
liabilities 8 (415 ) 309 3 55 Other income (expense), net (5 ) 17 (20 ) (14 ) (3 )
Total other expense (173 ) (1,916 ) (2,798 ) (586 ) (1,244 )
Loss before income taxes (9,225 ) (14,519 ) (18,267 ) (3,862 ) (4,892 ) Income tax expense 147 24 265 23 102
Net loss $ (9,372 ) $ (14,543 ) $ (18,532 ) $ (3,885 ) $ (4,994 )
Net loss per share attributable to common stockholders:
Basic and diluted $ (4.16 ) $ (5.73 ) $ (6.69 ) $ (1.45 ) $ (1.71 )
Weighted-average number of shares used in computing net loss per share attributable to common stockholders:
Basic and diluted 2,253 2,539 2,769 2,685 2,923
Pro forma net loss per share (unaudited):
Basic and diluted $ (0.90 ) $ (0.24 )
Weighted-average shares used in computing pro forma net loss per share (unaudited):
Basic and diluted 21,041 21,241
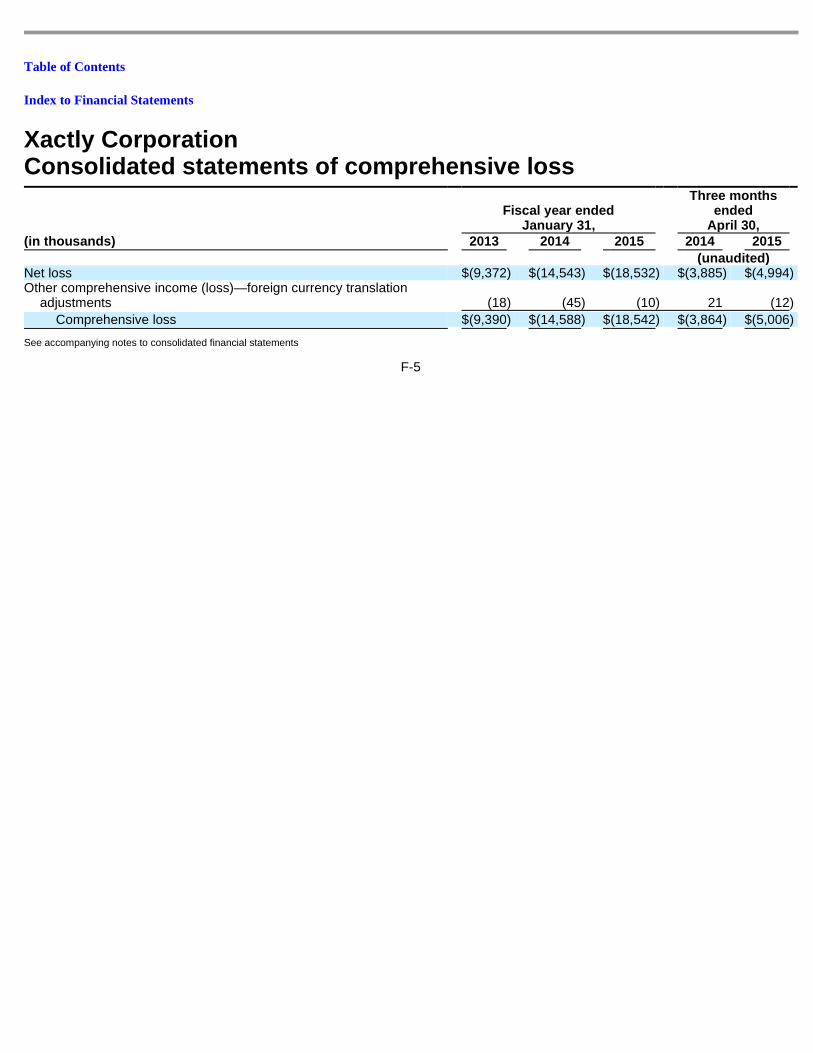
Table of Contents
Index to Financial Statements
Xactly Corporation
Consolidated statements of comprehensive loss
See accompanying notes to consolidated financial statements
F-5
Fiscal year ended January 31,
Three months ended
April 30,
(in thousands) 2013 2014 2015 2014 2015
(unaudited)
Net loss $ (9,372 ) $ (14,543 ) $ (18,532 ) $ (3,885 ) $ (4,994 ) Other comprehensive income (loss)—foreign currency translation
adjustments (18 ) (45 ) (10 ) 21 (12 )
Comprehensive loss $ (9,390 ) $ (14,588 ) $ (18,542 ) $ (3,864 ) $ (5,006 )
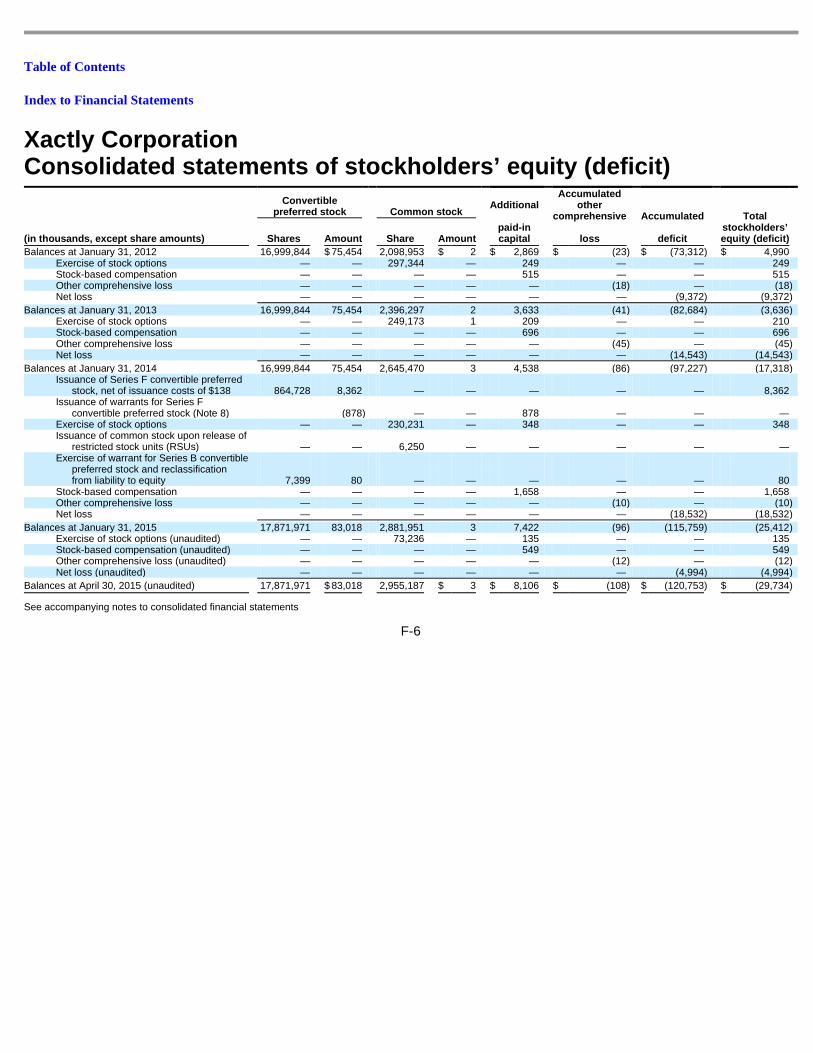
Table of Contents
Index to Financial Statements
Xactly Corporation
Consolidated statements of stockholders’ equity (de ficit)
See accompanying notes to consolidated financial statements
F-6
Convertible
preferred stock Common stock Additional
paid-in capital
Accumulated other
comprehensive
loss
Accumulated
deficit
Total stockholders’ equity (deficit) (in thousands, except share amounts) Shares Amount Share Amount
Balances at January 31, 2012 16,999,844 $ 75,454 2,098,953 $ 2 $ 2,869 $ (23 ) $ (73,312 ) $ 4,990 Exercise of stock options — — 297,344 — 249 — — 249 Stock-based compensation — — — — 515 — — 515 Other comprehensive loss — — — — — (18 ) — (18 ) Net loss — — — — — — (9,372 ) (9,372 )
Balances at January 31, 2013 16,999,844 75,454 2,396,297 2 3,633 (41 ) (82,684 ) (3,636 ) Exercise of stock options — — 249,173 1 209 — — 210 Stock-based compensation — — — — 696 — — 696 Other comprehensive loss — — — — — (45 ) — (45 ) Net loss — — — — — — (14,543 ) (14,543 )
Balances at January 31, 2014 16,999,844 75,454 2,645,470 3 4,538 (86 ) (97,227 ) (17,318 ) Issuance of Series F convertible preferred
stock, net of issuance costs of $138 864,728 8,362 — — — — — 8,362 Issuance of warrants for Series F
convertible preferred stock (Note 8) (878 ) — — 878 — — — Exercise of stock options — — 230,231 — 348 — — 348 Issuance of common stock upon release of
restricted stock units (RSUs) — — 6,250 — — — — — Exercise of warrant for Series B convertible
preferred stock and reclassification from liability to equity 7,399 80 — — — — — 80
Stock-based compensation — — — — 1,658 — — 1,658 Other comprehensive loss — — — — — (10 ) — (10 ) Net loss — — — — — — (18,532 ) (18,532 )
Balances at January 31, 2015 17,871,971 83,018 2,881,951 3 7,422 (96 ) (115,759 ) (25,412 ) Exercise of stock options (unaudited) — — 73,236 — 135 — — 135 Stock-based compensation (unaudited) — — — — 549 — — 549 Other comprehensive loss (unaudited) — — — — — (12 ) — (12 ) Net loss (unaudited) — — — — — — (4,994 ) (4,994 )
Balances at April 30, 2015 (unaudited) 17,871,971 $ 83,018 2,955,187 $ 3 $ 8,106 $ (108 ) $ (120,753 ) $ (29,734 )
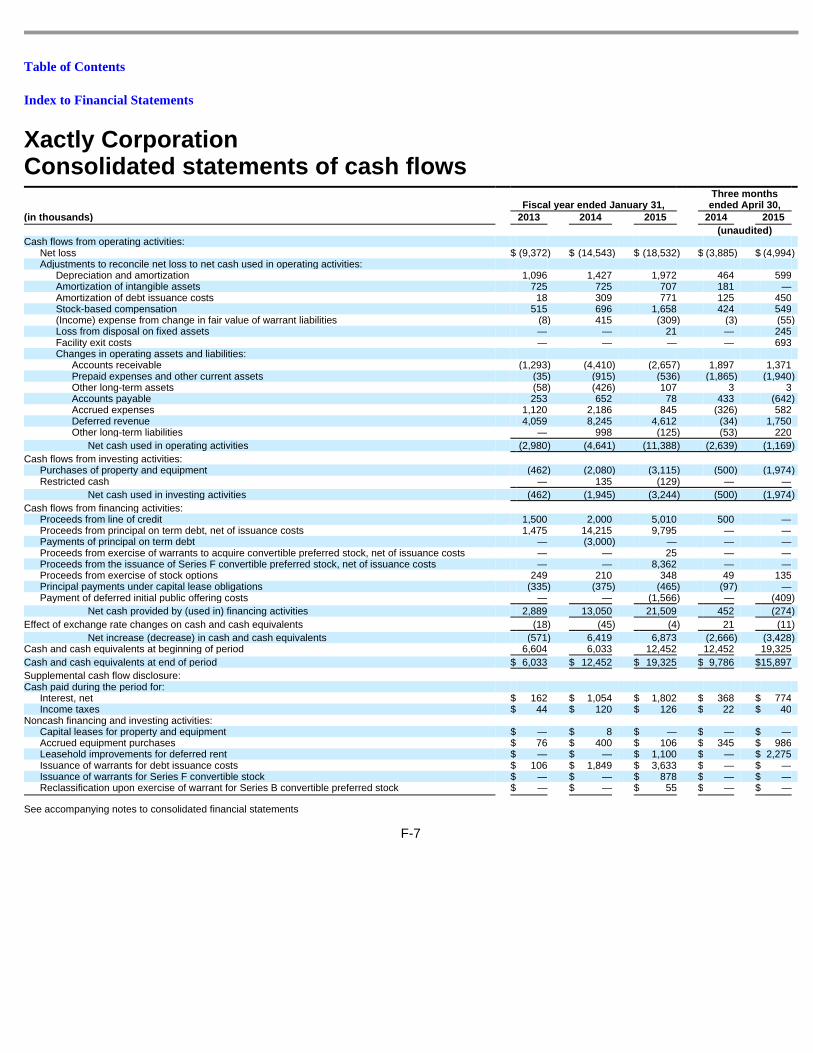
Table of Contents
Index to Financial Statements
Xactly Corporation
Consolidated statements of cash flows
See accompanying notes to consolidated financial statements
F-7
Fiscal year ended January 31, Three months ended April 30,
(in thousands) 2013 2014 2015 2014 2015
(unaudited) Cash flows from operating activities:
Net loss $ (9,372 ) $ (14,543 ) $ (18,532 ) $ (3,885 ) $ (4,994 ) Adjustments to reconcile net loss to net cash used in operating activities:
Depreciation and amortization 1,096 1,427 1,972 464 599 Amortization of intangible assets 725 725 707 181 — Amortization of debt issuance costs 18 309 771 125 450 Stock-based compensation 515 696 1,658 424 549 (Income) expense from change in fair value of warrant liabilities (8 ) 415 (309 ) (3 ) (55 ) Loss from disposal on fixed assets — — 21 — 245 Facility exit costs — — — — 693 Changes in operating assets and liabilities:
Accounts receivable (1,293 ) (4,410 ) (2,657 ) 1,897 1,371 Prepaid expenses and other current assets (35 ) (915 ) (536 ) (1,865 ) (1,940 ) Other long-term assets (58 ) (426 ) 107 3 3 Accounts payable 253 652 78 433 (642 ) Accrued expenses 1,120 2,186 845 (326 ) 582 Deferred revenue 4,059 8,245 4,612 (34 ) 1,750 Other long-term liabilities — 998 (125 ) (53 ) 220
Net cash used in operating activities (2,980 ) (4,641 ) (11,388 ) (2,639 ) (1,169 )
Cash flows from investing activities: Purchases of property and equipment (462 ) (2,080 ) (3,115 ) (500 ) (1,974 ) Restricted cash — 135 (129 ) — —
Net cash used in investing activities (462 ) (1,945 ) (3,244 ) (500 ) (1,974 )
Cash flows from financing activities: Proceeds from line of credit 1,500 2,000 5,010 500 — Proceeds from principal on term debt, net of issuance costs 1,475 14,215 9,795 — — Payments of principal on term debt — (3,000 ) — — — Proceeds from exercise of warrants to acquire convertible preferred stock, net of issuance costs — — 25 — — Proceeds from the issuance of Series F convertible preferred stock, net of issuance costs — — 8,362 — — Proceeds from exercise of stock options 249 210 348 49 135 Principal payments under capital lease obligations (335 ) (375 ) (465 ) (97 ) — Payment of deferred initial public offering costs — — (1,566 ) — (409 )
Net cash provided by (used in) financing activities 2,889 13,050 21,509 452 (274 )
Effect of exchange rate changes on cash and cash equivalents (18 ) (45 ) (4 ) 21 (11 )
Net increase (decrease) in cash and cash equivalents (571 ) 6,419 6,873 (2,666 ) (3,428 ) Cash and cash equivalents at beginning of period 6,604 6,033 12,452 12,452 19,325
Cash and cash equivalents at end of period $ 6,033 $ 12,452 $ 19,325 $ 9,786 $ 15,897
Supplemental cash flow disclosure: Cash paid during the period for:
Interest, net $ 162 $ 1,054 $ 1,802 $ 368 $ 774 Income taxes $ 44 $ 120 $ 126 $ 22 $ 40
Noncash financing and investing activities: Capital leases for property and equipment $ — $ 8 $ — $ — $ — Accrued equipment purchases $ 76 $ 400 $ 106 $ 345 $ 986 Leasehold improvements for deferred rent $ — $ — $ 1,100 $ — $ 2,275 Issuance of warrants for debt issuance costs $ 106 $ 1,849 $ 3,633 $ — $ — Issuance of warrants for Series F convertible stock $ — $ — $ 878 $ — $ — Reclassification upon exercise of warrant for Series B convertible preferred stock $ — $ — $ 55 $ — $ —
Table of Contents
Index to Financial Statements
Xactly Corporation
Notes to consolidated financial statements
Note 1. Description of the business and summary of significant accounting policies
Description of business
Xactly Corporation (the Company) was incorporated in Delaware in 2005. The Company is a provider of enterprise-class, cloud-based incentive compensation solutions for employee and sales performance management. The Company’s customers leverage these solutions to optimize incentive compensation and drive behavior by automating manual processes, streamlining workflows, providing visibility to users and delivering actionable analyses and insights. The Company’s solutions are delivered through a scalable, secure cloud-based platform that allows for fast innovation benefiting all customers while keeping their information secure. The Company is headquartered in San Jose, California. The Company’s fiscal year end is January 31 and its fiscal quarters end on April 30, July 31, October 31 and January 31.
Basis of presentation and liquidity
The accompanying consolidated financial statements have been prepared in accordance with U.S. generally accepted accounting principles (U.S. GAAP). All intercompany accounts and transactions have been eliminated. As the Company is an emerging growth company, as defined in the Jumpstart Our Business Startups Act of 2012 (the JOBS Act), the Company can delay the adoption of new accounting standards until those standards would otherwise apply to privately held companies. However, the Company has elected to comply with all new or revised accounting standards on the relevant dates on which adoption of such standards is required for non-emerging growth publicly held companies. Under the JOBS Act, such election is irrevocable.
The Company operates in a dynamic high-technology industry and believes that changes in any of the following areas could have a material adverse effect on the Company’s future financial position, results of operations, or cash flows: ability to obtain future financing; trends in new technologies and industry standards; market acceptance of the Company’s services; certain strategic relationships; litigation or claims against the Company based on intellectual property, patent, services, regulatory or other factors; and the Company’s ability to attract and retain employees necessary to support its growth.
The Company has funded its operations through preferred stock financings with net proceeds totaling $83,841,000 through April 30, 2015, sales to customers, and debt financing under its credit agreements. However, the Company has historically incurred losses and negative cash flows from operations. As of April 30, 2015, the Company had an accumulated deficit of $120,753,000. Management of the Company expects that operating losses and negative cash flows from operations will continue for the foreseeable future. The Company’s existing sources of liquidity include cash and cash equivalents. While management believes that the Company’s existing sources of liquidity are adequate to fund operations (including continued growth in revenue and employees) through at least the next twelve months, the Company may need to raise additional debt or equity financing to fund operations until it generates positive cash flows from profitable operations. There can be no assurance that such additional debt or equity financing will be available on terms acceptable to the Company or at all. To the extent that the Company is unsuccessful in additional debt or equity financings, management’s plans for continued growth may need to be curtailed.
Unaudited pro forma stockholders’ deficit
Immediately prior to the closing of a qualifying initial public offering as defined in Note 8, all of the outstanding shares of convertible preferred stock will automatically convert into shares of common stock. In addition, the
F-8
Table of Contents
Index to Financial Statements
outstanding preferred stock warrants will be converted into warrants to purchase common stock upon effectiveness of a Qualified IPO. The unaudited pro forma stockholders’ deficit information, as set forth in the accompanying consolidated balance sheets, gives effect to the automatic conversion of all outstanding shares of convertible preferred stock and preferred stock warrants and options as of April 30, 2015. The shares of common stock issuable and the proceeds expected to be received in a Qualified IPO are excluded from such pro forma information.
Use of estimates
The preparation of consolidated financial statements in conformity with U.S. GAAP requires management to make estimates and assumptions that affect the reported amounts of assets and liabilities and disclosure of contingent assets and liabilities at the date of the consolidated financial statements and the reported amounts of revenue and expenses during the reporting period. Significant items subject to such estimates and assumptions include, but are not limited to, revenue and sales allowances, allowance for doubtful accounts, determination of the fair value of common and preferred stock, preferred stock warrant liabilities, stock-based compensation, determination of the fair value of acquired intangible assets, contingent liabilities and accounting for income taxes. These estimates and assumptions are based on management’s best judgment. Management evaluates its estimates and assumptions using historical experience and other factors, including the current economic environment, which management believes to be reasonable under the circumstances. The current economic environment has increased the degree of uncertainty inherent in those estimates and assumptions. As future events and their effects cannot be determined with precision, actual results could differ significantly from these estimates.
Revenue recognition
The Company’s revenue is derived from subscription services and professional services arrangements.
Subscription services include revenue from the Company’s incentive compensation solutions. Subscriptions are typically sold through non-cancellable contracts with one to three year terms. Subscription fees are primarily based on the number of subscribers per customer per month. Customers are not permitted to take possession of the Company’s software.
Professional services include revenue from assisting customers in implementing the Company’s solution and optimizing its use. These services include application configuration, system integration, data transformation and automation services, education and training services and strategic services. Professional services are billed predominantly on a time-and-materials basis with some fixed-fee arrangements. Professional services are performed by the Company directly or by third-party professional service providers engaged by the Company. Customers may also choose to perform these services themselves or engage their own third-party service providers.
The Company recognizes revenue when all of the following conditions are met:
The Company’s subscription services are recognized ratably over the term of the arrangement as delivered. Professional services are recognized as the services are performed using the proportional-performance method. Performance is based on hours of work performed, or upon project completion for certain fixed-fee contracts.
F-9
• persuasive evidence of an arrangement exists; • the service is being provided to the customer or delivery has occurred; • the fee is fixed or determinable; and • collection of the fees are reasonably assured
Table of Contents
Index to Financial Statements
The Company also enters into multiple-element arrangements that include both subscription and professional services.
When subscription services arrangements involve multiple elements that qualify as separate units of accounting, the Company allocates arrangement consideration to all deliverables based on the relative stand-alone selling price method in accordance with the selling price hierarchy, which includes: (i) vendor-specific objective evidence (VSOE) if available; (ii) third-party evidence (TPE) if VSOE is not available; and (iii) best estimate of selling price (BESP) if neither VSOE nor TPE is available. Revenue allocated to each deliverable, limited to the amount not contingent on future performance, is then recognized when the basic revenue recognition criteria are met for the respective deliverable.
The Company determines whether VSOE can be established based on its historical pricing and discounting practices for the specific service when sold separately. In determining VSOE, the Company requires that a substantial majority of the selling prices for these services fall within a reasonably narrow pricing range. The Company limits its assessment of VSOE for each element to either the price charged when the same element is sold separately or the price established by management, having the relevant authority to do so, for an element not yet sold separately. The Company has not yet been able to establish VSOE for its subscription or professional services because it has not historically priced its offerings within a sufficiently narrow range.
When VSOE cannot be established, the Company applies judgment with respect to whether it can establish a selling price based on TPE. TPE is determined based on third-party prices for similar deliverables when sold separately. Generally, the Company’s pricing strategy differs from that of its peers and its offerings contain a significant level of differentiation such that the comparable pricing of services with similar functionality cannot be obtained. Furthermore, the Company is unable to reliably determine what similar competitor services’ selling prices are on a stand-alone basis. As a result, the Company has not been able to establish selling prices based on TPE.
When the Company is unable to establish a selling price using VSOE or TPE, the Company uses BESP in its allocation of arrangement consideration. The objective of BESP is to determine the price at which the Company would transact a sale if the product or service were sold on a stand-alone basis. The Company estimates BESP for services by considering multiple factors including, but not limited to, prices it charges for similar offerings, market conditions, competitive landscape, and pricing practices. The Company currently uses BESP in order to allocate the selling price to its deliverables.
Deferred revenue
Deferred revenue primarily consists of billings or payments received in advance of revenue recognition from the Company’s subscription service and is recognized as the revenue recognition criteria are met. The Company generally invoices its customers annually in advance. Accordingly, the deferred revenue balance does not include the unbilled portion of subscription agreements. Deferred revenue also includes certain deferred professional service fees, which are recognized as revenue over the period services are provided. Also included in deferred revenue is a sales allowance for estimated future customer sales credits of $110,000 as of January 31, 2014 and 2015 and as of April 30, 2015 that is recorded as a reduction in revenue. This amount is estimated based on historical sales credit activity.
Cash and cash equivalents and short-term investment s
The Company considers all highly liquid investments with original maturities of three months or less at the time of purchase to be cash equivalents. Cash equivalents as of January 31, 2014 and 2015 and as of April 30, 2015 consisted of money market funds. The Company considers all investments with original maturities of more than three months but less than one year to be short-term investments.
F-10
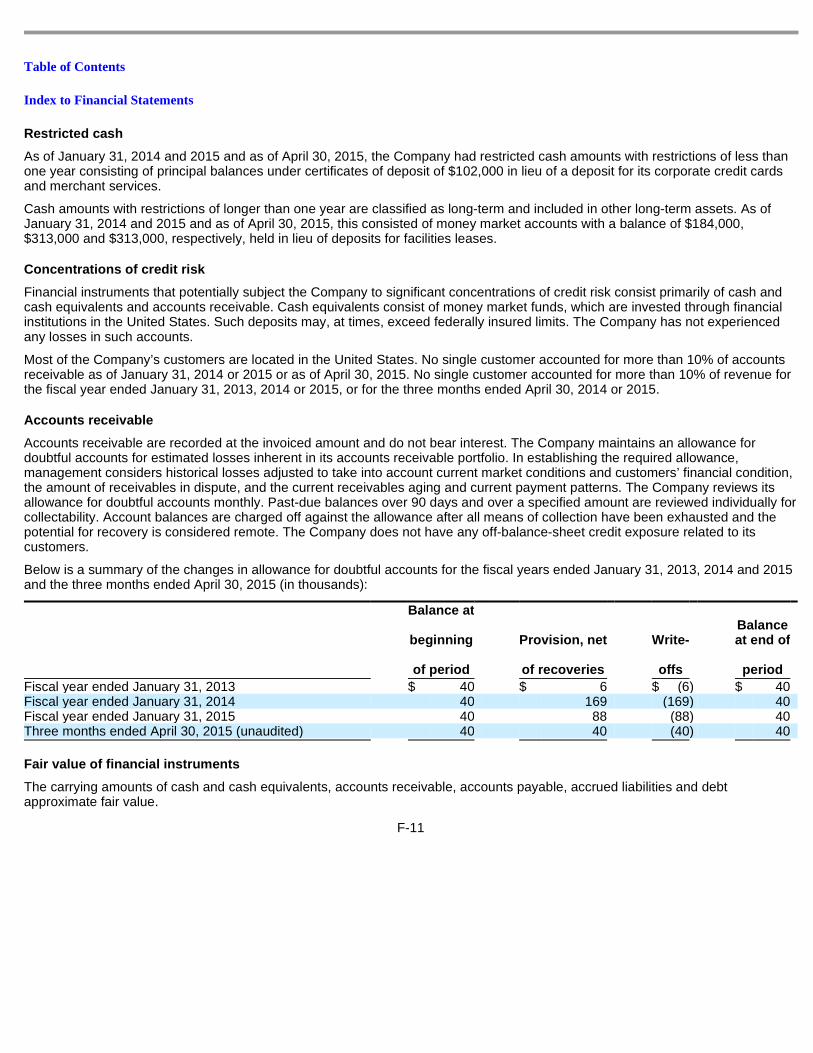
Table of Contents
Index to Financial Statements
Restricted cash
As of January 31, 2014 and 2015 and as of April 30, 2015, the Company had restricted cash amounts with restrictions of less than one year consisting of principal balances under certificates of deposit of $102,000 in lieu of a deposit for its corporate credit cards and merchant services.
Cash amounts with restrictions of longer than one year are classified as long-term and included in other long-term assets. As of January 31, 2014 and 2015 and as of April 30, 2015, this consisted of money market accounts with a balance of $184,000, $313,000 and $313,000, respectively, held in lieu of deposits for facilities leases.
Concentrations of credit risk
Financial instruments that potentially subject the Company to significant concentrations of credit risk consist primarily of cash and cash equivalents and accounts receivable. Cash equivalents consist of money market funds, which are invested through financial institutions in the United States. Such deposits may, at times, exceed federally insured limits. The Company has not experienced any losses in such accounts.
Most of the Company’s customers are located in the United States. No single customer accounted for more than 10% of accounts receivable as of January 31, 2014 or 2015 or as of April 30, 2015. No single customer accounted for more than 10% of revenue for the fiscal year ended January 31, 2013, 2014 or 2015, or for the three months ended April 30, 2014 or 2015.
Accounts receivable
Accounts receivable are recorded at the invoiced amount and do not bear interest. The Company maintains an allowance for doubtful accounts for estimated losses inherent in its accounts receivable portfolio. In establishing the required allowance, management considers historical losses adjusted to take into account current market conditions and customers’ financial condition, the amount of receivables in dispute, and the current receivables aging and current payment patterns. The Company reviews its allowance for doubtful accounts monthly. Past-due balances over 90 days and over a specified amount are reviewed individually for collectability. Account balances are charged off against the allowance after all means of collection have been exhausted and the potential for recovery is considered remote. The Company does not have any off-balance-sheet credit exposure related to its customers.
Below is a summary of the changes in allowance for doubtful accounts for the fiscal years ended January 31, 2013, 2014 and 2015 and the three months ended April 30, 2015 (in thousands):
Fair value of financial instruments
The carrying amounts of cash and cash equivalents, accounts receivable, accounts payable, accrued liabilities and debt approximate fair value.
F-11
Balance at
beginning
of period
Provision, net
of recoveries
Write -
offs
Balance at end of
period
Fiscal year ended January 31, 2013 $ 40 $ 6 $ (6 ) $ 40 Fiscal year ended January 31, 2014 40 169 (169 ) 40 Fiscal year ended January 31, 2015 40 88 (88 ) 40 Three months ended April 30, 2015 (unaudited) 40 40 (40 ) 40
Table of Contents
Index to Financial Statements
Property and equipment
Property and equipment are recorded at cost less accumulated depreciation and amortization. Equipment and software under capital leases are stated at the present value of minimum lease payments.
Depreciation on property and equipment is calculated using the straight-line method over the estimated useful lives of the related assets, generally two to five years. Leasehold improvements are amortized over the shorter of the estimated useful lives of the leased assets or the lease term.
The following table summarizes the useful lives of the Company’s major assets:
Intangible assets
Intangible assets consist of acquired customer relationships, intellectual property and contract rights acquired in business combinations and are recorded at fair value, less accumulated amortization. Intangible assets are amortized on a straight-line basis over their estimated useful lives ranging from two to six years. Amortization of intellectual property and contract rights are included in cost of revenue. Amortization of acquired customer relationships is included in operating expenses.
Impairment of long-lived assets, including goodwill
Long-lived assets such as property and equipment and intangible assets subject to depreciation and amortization are reviewed for impairment whenever events or changes in circumstances indicate that the carrying amount of such assets may not be recoverable. Recoverability is measured by comparison of the carrying amount of the asset or asset group to the future net undiscounted cash flows expected to be generated by the asset or asset group. If such assets are considered impaired, an impairment loss would be recognized as the amount by which the carrying amount of the asset exceeds the fair value of the asset or asset group.
Costs in excess of fair value of tangible and other identifiable intangible assets acquired and liabilities assumed in a business combination are recorded as goodwill, which is tested for impairment using a two-step approach. The Company evaluates goodwill, at a minimum, on an annual basis in the fourth quarter, and whenever events or changes in circumstances suggest that the carrying amount may not be recoverable. Impairment of goodwill is tested at the reporting unit level by comparing the reporting unit’s carrying amount, including goodwill, to its fair value. For purposes of this analysis, the Company considers itself a single reporting unit. If the carrying amount of the reporting unit exceeds its fair value, goodwill is considered impaired and a second step is performed to measure the amount of the impairment loss, if any. To the extent the carrying value of the reporting unit is zero or negative, the Company would perform the second step of the impairment test to measure the amount of any impairment loss if it is more likely than not that a goodwill impairment exists. As of January 31, 2014 and 2015, the carrying value of the Company’s single reporting unit was negative. However, the Company did not believe it was more likely than not that a goodwill impairment existed because historically, the reporting unit’s fair value has been significantly in excess of the reporting unit’s carrying value and the fair value of the reporting unit has increased in each of the fiscal years ended January 31, 2013, 2014 and 2015.
There were no impairment losses on long-lived assets, including goodwill, for the fiscal years ended January 31, 2013, 2014 or 2015, or for the three months ended April 30, 2015.
F-12
Asset category Useful life
Computer software and equipment 3 years Furniture and fixtures 2 to 5 years Leasehold improvements 2 to 6 years
Table of Contents
Index to Financial Statements
Stock-based compensation
The Company accounts for stock-based payment transactions in which the Company receives employee services in exchange for equity instruments, based on the estimated fair values of the Company’s equity instruments on the date of grant. For stock options, the Company uses the Black-Scholes option pricing model to estimate the fair value of the awards. Stock-based compensation expense is recognized on a straight-line basis over the requisite service period. See Note 9 for further information on stock-based compensation.
Income taxes
Income taxes are accounted for under the asset and liability method. Deferred tax assets and liabilities are recognized for the future tax consequences attributable to differences between the consolidated financial statement carrying amounts of existing assets and liabilities and their respective tax bases and operating loss and tax credit carryforwards. Deferred tax assets and liabilities are measured using enacted tax rates expected to apply to taxable income in the years in which those temporary differences are expected to be recovered or settled. The effect on deferred tax assets and liabilities of a change in tax rates is recognized in income in the period that includes the enactment date. The measurement of deferred tax assets is reduced, if necessary, by a valuation allowance for any tax benefits for which future realization is not more likely than not to be realized. As of January 31, 2014 and 2015 and April 30, 2015, the Company has a full valuation allowance against its net deferred tax assets.
The Company recognizes the effect of income tax positions only if those positions are more likely than not of being sustained. Recognized income tax positions are measured at the largest amount that is greater than 50% likely of being realized. Changes in recognition or measurement are reflected in the period in which the change in judgment occurs. The Company records interest related to unrecognized tax benefits as part of income tax expense. See Note 10 for further information on income taxes.
Foreign currency
The functional currency of each foreign subsidiary is its respective local currency. Accordingly, all assets and liabilities related to these operations are translated into U.S. dollars at the current exchange rates at the end of each period and recorded as part of a separate component of stockholders’ equity and reported in the statement of comprehensive loss. Revenue and expenses are translated at average exchange rates in effect during the period. Foreign currency transaction gains and losses are included in the results of operations and have not been material to date. As of January 31, 2014 and 2015, and as of April 30, 2015, no foreign currency transactions were hedged.
Comprehensive loss
The Company reports by major components, and as a single total, the change in its net assets during the period from nonowner sources. Comprehensive loss consists of net loss and other comprehensive loss, which includes certain changes in equity that are excluded from net loss. The only difference between the Company’s net loss and items of comprehensive loss are effects of foreign exchange rate translation adjustments.
Advertising expenses
Advertising is expensed as incurred as a component of sales and marketing expenses in the consolidated statements of operations. Advertising expense was approximately $305,000, $501,000, $1,131,000, $344,000 and $251,000 for the fiscal years ended January 31, 2013, 2014 and 2015, and for the three months ended April 30, 2014 and 2015, respectively.
F-13
Table of Contents
Index to Financial Statements
Software development costs
The Company’s software and website development costs are accounted for under the guidance for internal use software and website development costs. The costs incurred in the preliminary stages of development are expensed as incurred. Once an application has reached the development stage, if: (1) the costs are direct and incremental and (2) management has determined that it is probable that the project will be completed and the software will be used to perform the function intended, internal and external costs are capitalized until the application is substantially complete and ready for its intended use. Because the majority of the Company’s development efforts are categorized in the operation stage (post-implementation) or do not result in additional functionality, no costs have been capitalized to date. These costs are included in the accompanying consolidated statements of operations as research and development expenses.
Deferred offering costs
Deferred offering costs consisted primarily of accounting, legal and other fees related to the Company’s proposed initial public offering. There were $1.7 million and $2.4 million of deferred offering costs included in prepaid expenses and other current assets on the Company’s consolidated balance sheets as of January 31, 2015 and April 30, 2015, respectively. Upon completion of the initial public offering contemplated herein, these amounts will be recorded as a reduction of stockholders’ equity as an offset against the proceeds of the offering. If the offering is terminated, the deferred offering costs will be expensed.
Net loss per share
Basic earnings per share is computed by dividing income available to common shareholders by the weighted-average number of shares of common stock outstanding during the period. Diluted earnings per share is computed by dividing income available to common shareholders by the weighted-average number of shares of common stock outstanding during the period increased to include the number of additional shares of common stock that would have been outstanding if the potentially dilutive securities had been issued. The dilutive effect of potentially dilutive securities is reflected in diluted earnings per share by application of the treasury stock method.
The Company applies the two-class method to calculate basic and diluted net loss per share of common stock as shares of convertible preferred stock are participating securities due to their dividend rights. The two-class method is an earnings allocation method under which earnings per share is calculated for common stock considering a participating security’s rights to undistributed earnings as if all such earnings had been distributed during the period. The Company’s participating securities are not included in the computation of net loss per share in periods of net loss because the preferred stockholders have no contractual obligation to participate in losses.
Segment information
The Company has determined that the chief executive officer is the chief operating decision maker. The Company’s chief executive officer reviews financial information presented on a consolidated basis for purposes of assessing performance and making decisions on how to allocate resources. Accordingly, the Company has determined that it operates in a single reporting segment.
Recent accounting pronouncements
In July 2013, the Financial Accounting Standards Board (FASB) issued an accounting standards update (ASU) on presentation of an unrecognized tax benefit when a net operating loss carryforward, a similar tax loss or a tax
F-14
Table of Contents
Index to Financial Statements
credit carryforward exists. The standard requires that unrecognized tax benefits should be presented as a reduction to deferred tax assets for net operating loss carryforwards, a similar tax loss or a tax credit carryforward, or collectively, a carryforward, if such carryforward is required or expected to settle the additional income taxes in the event the uncertain tax position is disallowed. The standard also requires in situations that a carryforward cannot be used or the deferred tax asset is not intended to be used for such purpose, the unrecognized tax benefit should be recorded as a liability and should not offset deferred tax assets. The Company adopted this standard during the first quarter of the fiscal year ending January 31, 2015 and it did not have a material impact on its consolidated financial position or results of operations.
In April 2014, the FASB issued an ASU on reporting discontinued operations and disclosures of disposals of components of an entity. The standard changes the requirements for reporting discontinued operations. The amendment is effective on a prospective basis for financial statements issued for fiscal years, and interim periods within those fiscal years, beginning on or after December 15, 2014. Early adoption is permitted for disposals that have not been reported in financial statements previously issued. The Company does not expect this standard to have a material impact on its consolidated financial position or results of operations.
In May 2014, the FASB issued an ASU on revenue from contracts with customers, which supersedes the current revenue recognition requirements. This ASU is based on the principle that revenue is recognized to depict the transfer of goods or services to customers in an amount that reflects the consideration to which the entity expects to be entitled in exchange for those goods or services. The standard also requires additional disclosure about the nature, amount, timing and uncertainty of revenue and cash flows arising from customer contracts, including significant judgments and changes in judgments and assets recognized from costs incurred to obtain or fulfill a contract. The standard’s effective date will be the first quarter of fiscal year 2018 using one of two adoption methods. However, in April 2015, the FASB issued an exposure draft that would provide the Company with the option to adopt the new standard in either the first quarter of fiscal year 2018 or fiscal year 2019. The Company has not determined the potential effects of this standard on its consolidated financial statements or the planned method or timing of adoption.
In August 2014, the FASB issued new guidance related to the disclosures around going concern. The new standard provides guidance around management’s responsibility to evaluate whether there is substantial doubt about an entity’s ability to continue as a going concern and to provide related footnote disclosures. The new standard is effective for fiscal years, and interim periods within those fiscal years, beginning after December 15, 2016. Early adoption is permitted. The Company will apply the guidance and disclosure provisions of the new standard and assess the impact upon effectiveness.
In April 2015, the FASB issued an ASU on the presentation of debt issuance costs. This ASU amends existing guidance to require the presentation of debt issuance costs in the balance sheet as a deduction from the carrying amount of the related debt liability instead of a deferred charge. It is effective for annual reporting periods beginning after December 15, 2015, but early adoption is permitted. The Company does not expect this standard to have a material impact on its consolidated financial position or results of operations.
F-15
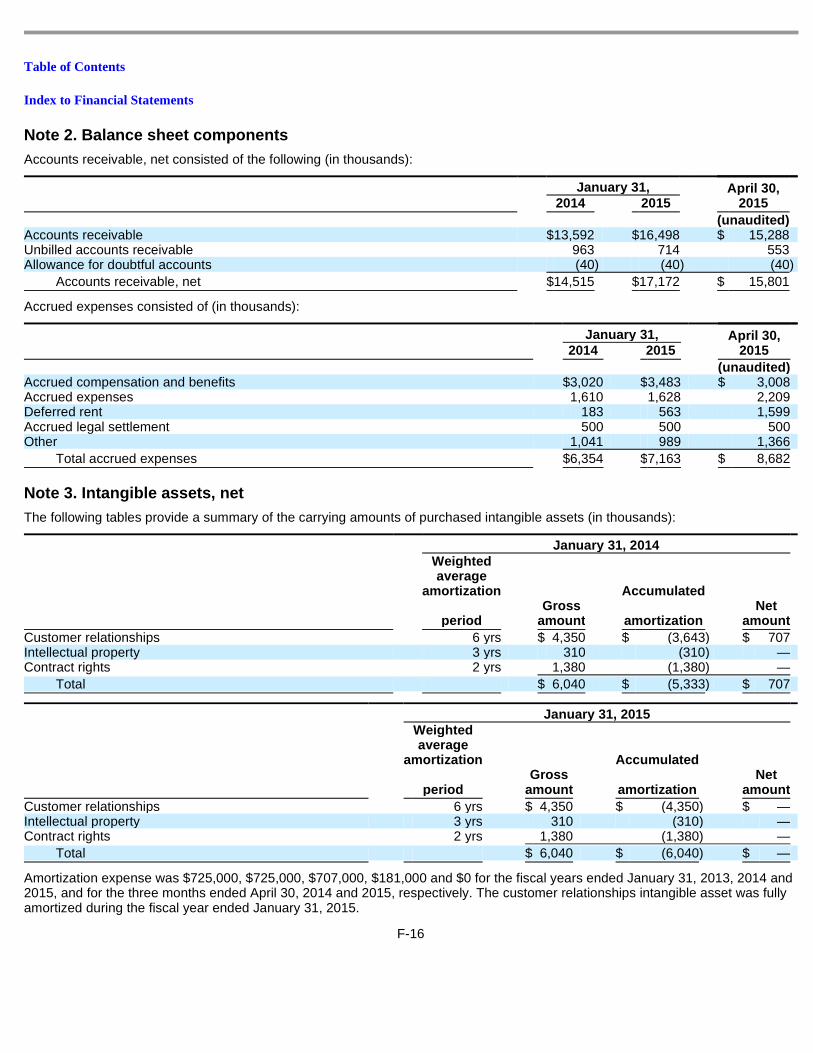
Table of Contents
Index to Financial Statements
Note 2. Balance sheet components
Accounts receivable, net consisted of the following (in thousands):
Accrued expenses consisted of (in thousands):
Note 3. Intangible assets, net
The following tables provide a summary of the carrying amounts of purchased intangible assets (in thousands):
Amortization expense was $725,000, $725,000, $707,000, $181,000 and $0 for the fiscal years ended January 31, 2013, 2014 and 2015, and for the three months ended April 30, 2014 and 2015, respectively. The customer relationships intangible asset was fully amortized during the fiscal year ended January 31, 2015.
F-16
January 31, April 30, 2015 2014 2015
(unaudited)
Accounts receivable $ 13,592 $ 16,498 $ 15,288 Unbilled accounts receivable 963 714 553 Allowance for doubtful accounts (40 ) (40 ) (40 )
Accounts receivable, net $ 14,515 $ 17,172 $ 15,801
January 31, April 30, 2015 2014 2015
(unaudited)
Accrued compensation and benefits $ 3,020 $ 3,483 $ 3,008 Accrued expenses 1,610 1,628 2,209 Deferred rent 183 563 1,599 Accrued legal settlement 500 500 500 Other 1,041 989 1,366
Total accrued expenses $ 6,354 $ 7,163 $ 8,682
January 31, 2014
Weighted average
amortization
period
Gross amount
Accumulated
amortization
Net amount
Customer relationships 6 yrs $ 4,350 $ (3,643 ) $ 707 Intellectual property 3 yrs 310 (310 ) — Contract rights 2 yrs 1,380 (1,380 ) —
Total $ 6,040 $ (5,333 ) $ 707
January 31, 2015
Weighted average
amortization
period
Gross amount
Accumulated
amortization
Net amount
Customer relationships 6 yrs $ 4,350 $ (4,350 ) $ — Intellectual property 3 yrs 310 (310 ) — Contract rights 2 yrs 1,380 (1,380 ) —
Total $ 6,040 $ (6,040 ) $ —
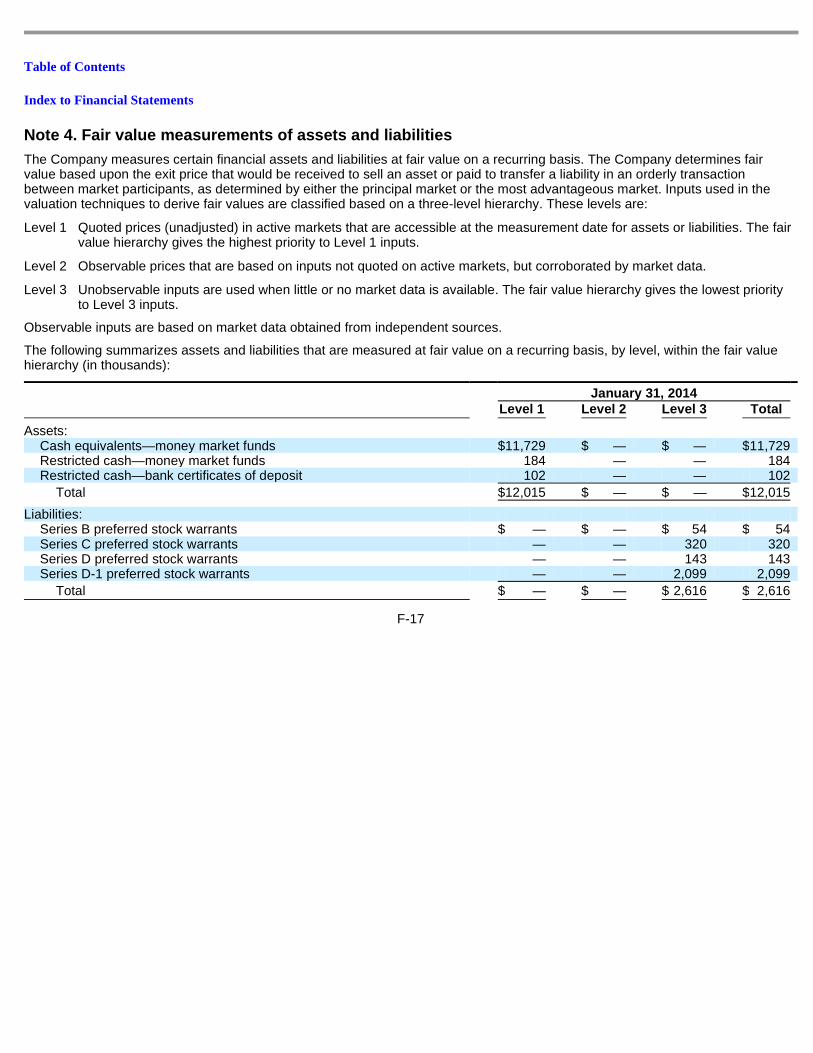
Table of Contents
Index to Financial Statements
Note 4. Fair value measurements of assets and liabi lities
The Company measures certain financial assets and liabilities at fair value on a recurring basis. The Company determines fair value based upon the exit price that would be received to sell an asset or paid to transfer a liability in an orderly transaction between market participants, as determined by either the principal market or the most advantageous market. Inputs used in the valuation techniques to derive fair values are classified based on a three-level hierarchy. These levels are:
Observable inputs are based on market data obtained from independent sources.
The following summarizes assets and liabilities that are measured at fair value on a recurring basis, by level, within the fair value hierarchy (in thousands):
F-17
Level 1 Quoted prices (unadjusted) in active markets that are accessible at the measurement date for assets or liabilities. The fair value hierarchy gives the highest priority to Level 1 inputs.
Level 2 Observable prices that are based on inputs not quoted on active markets, but corroborated by market data.
Level 3 Unobservable inputs are used when little or no market data is available. The fair value hierarchy gives the lowest priority to Level 3 inputs.
January 31, 2014
Level 1 Level 2 Level 3 Total
Assets:
Cash equivalents—money market funds $ 11,729 $ — $ — $ 11,729 Restricted cash—money market funds 184 — — 184 Restricted cash—bank certificates of deposit 102 — — 102
Total $ 12,015 $ — $ — $ 12,015
Liabilities:
Series B preferred stock warrants $ — $ — $ 54 $ 54 Series C preferred stock warrants — — 320 320 Series D preferred stock warrants — — 143 143 Series D-1 preferred stock warrants — — 2,099 2,099
Total $ — $ — $ 2,616 $ 2,616
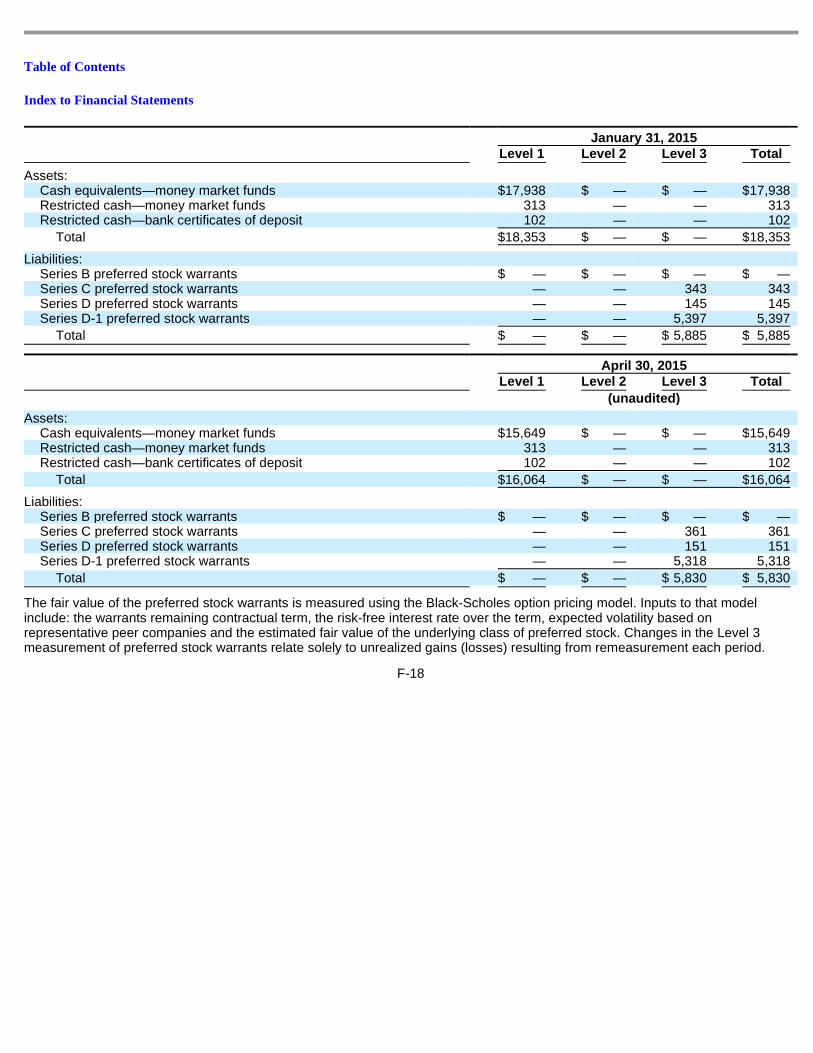
Table of Contents
Index to Financial Statements
The fair value of the preferred stock warrants is measured using the Black-Scholes option pricing model. Inputs to that model include: the warrants remaining contractual term, the risk-free interest rate over the term, expected volatility based on representative peer companies and the estimated fair value of the underlying class of preferred stock. Changes in the Level 3 measurement of preferred stock warrants relate solely to unrealized gains (losses) resulting from remeasurement each period.
F-18
January 31, 2015
Level 1 Level 2 Level 3 Total
Assets:
Cash equivalents—money market funds $ 17,938 $ — $ — $ 17,938 Restricted cash—money market funds 313 — — 313 Restricted cash—bank certificates of deposit 102 — — 102
Total $ 18,353 $ — $ — $ 18,353
Liabilities:
Series B preferred stock warrants $ — $ — $ — $ — Series C preferred stock warrants — — 343 343 Series D preferred stock warrants — — 145 145 Series D-1 preferred stock warrants — — 5,397 5,397
Total $ — $ — $ 5,885 $ 5,885
April 30, 2015
Level 1 Level 2 Level 3 Total
(unaudited)
Assets:
Cash equivalents—money market funds $ 15,649 $ — $ — $ 15,649 Restricted cash—money market funds 313 — — 313 Restricted cash—bank certificates of deposit 102 — — 102
Total $ 16,064 $ — $ — $ 16,064
Liabilities:
Series B preferred stock warrants $ — $ — $ — $ — Series C preferred stock warrants — — 361 361 Series D preferred stock warrants — — 151 151 Series D-1 preferred stock warrants — — 5,318 5,318
Total $ — $ — $ 5,830 $ 5,830
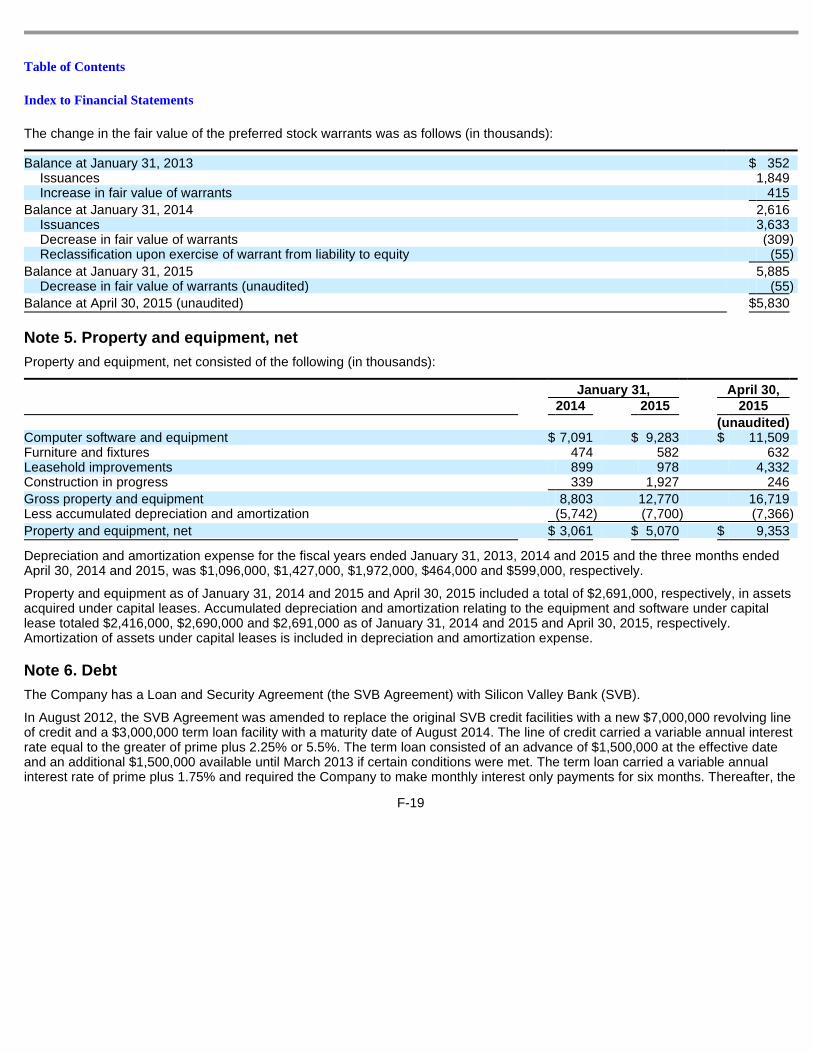
Table of Contents
Index to Financial Statements
The change in the fair value of the preferred stock warrants was as follows (in thousands):
Note 5. Property and equipment, net
Property and equipment, net consisted of the following (in thousands):
Depreciation and amortization expense for the fiscal years ended January 31, 2013, 2014 and 2015 and the three months ended April 30, 2014 and 2015, was $1,096,000, $1,427,000, $1,972,000, $464,000 and $599,000, respectively.
Property and equipment as of January 31, 2014 and 2015 and April 30, 2015 included a total of $2,691,000, respectively, in assets acquired under capital leases. Accumulated depreciation and amortization relating to the equipment and software under capital lease totaled $2,416,000, $2,690,000 and $2,691,000 as of January 31, 2014 and 2015 and April 30, 2015, respectively. Amortization of assets under capital leases is included in depreciation and amortization expense.
Note 6. Debt
The Company has a Loan and Security Agreement (the SVB Agreement) with Silicon Valley Bank (SVB).
In August 2012, the SVB Agreement was amended to replace the original SVB credit facilities with a new $7,000,000 revolving line of credit and a $3,000,000 term loan facility with a maturity date of August 2014. The line of credit carried a variable annual interest rate equal to the greater of prime plus 2.25% or 5.5%. The term loan consisted of an advance of $1,500,000 at the effective date and an additional $1,500,000 available until March 2013 if certain conditions were met. The term loan carried a variable annual interest rate of prime plus 1.75% and required the Company to make monthly interest only payments for six months. Thereafter, the
F-19
Balance at January 31, 2013 $ 352 Issuances 1,849 Increase in fair value of warrants 415
Balance at January 31, 2014 2,616 Issuances 3,633 Decrease in fair value of warrants (309 ) Reclassification upon exercise of warrant from liability to equity (55 )
Balance at January 31, 2015 5,885 Decrease in fair value of warrants (unaudited) (55 )
Balance at April 30, 2015 (unaudited) $ 5,830
January 31, April 30,
2014 2015 2015
(unaudited)
Computer software and equipment $ 7,091 $ 9,283 $ 11,509 Furniture and fixtures 474 582 632 Leasehold improvements 899 978 4,332 Construction in progress 339 1,927 246
Gross property and equipment 8,803 12,770 16,719 Less accumulated depreciation and amortization (5,742 ) (7,700 ) (7,366 )
Property and equipment, net $ 3,061 $ 5,070 $ 9,353
Table of Contents
Index to Financial Statements
Company was required to make 30 equal monthly installments of principal and accrued interest, payable at the beginning of each month through the maturity date of August 2015. All of the Company’s assets have been pledged as collateral to SVB on a first priority, senior basis.
In connection with the August 2012 SVB amendment, the Company paid fees aggregating $25,000. The Company also issued warrants to purchase 9,868 shares of Series D-1 convertible preferred stock with an exercise price of $7.60 per share or, at the option of the holder, shares of the Company’s preferred stock issued at its next round of equity financing. If, instead of Series D-1, the holder elects to receive preferred shares in the Company’s next round of equity financing, the number of shares is calculated by multiplying the aggregate original principal amount by 2.5% and then dividing by the price per share in the equity round. The initial fair value of the Series D-1 warrants was $106,000 (see Note 8). Both the cash fees and the fair value of the warrants are being amortized as interest expense over the term of the debt.
In March 2013, the Company borrowed the additional $1,500,000 available under the SVB term loan facility. The advance carried a variable annual interest rate of prime plus 1.75% and required the Company to make monthly interest only payments for six months. Thereafter, the Company was required to make 30 equal monthly installments of principal and accrued interest, payable at the beginning of each month through the maturity date of March 2016. As of January 31, 2014, the term loan had been fully repaid.
In May 2013, the Company entered into a Loan and Security Agreement with Wellington Financial LP (Wellington). The Loan and Security Agreement (the Wellington Agreement) consists of a $10,000,000 term loan facility and a $2,000,000 operating line of credit. The term loan carries a fixed interest rate of 9.5% per annum. The term loan consisted of an advance of $10,000,000 at the effective date with monthly interest only payments to be made through the maturity date, at which time the entire outstanding principal amount becomes due and payable. Additional interest will accrue on the unpaid principal amount of the term loan at a per annum rate of 2.5% which will also be due at the maturity date. The operating line of credit carries a variable interest rate of the greater of prime plus 2.5% or 6.0% per annum. Interest is payable monthly on the outstanding principal amount of the operating line of credit. Under the operating line of credit, the Company may borrow, prepay, and reborrow from time to time before the maturity date. All of the Company’s assets were pledged as collateral to Wellington on a senior basis (subordinated to the security interest of SVB by up to $8,000,000 in aggregate principal amount). Both the term loan and the operating line of credit mature in May 2016, but may be extended annually to May 2017 and 2018 at the option of the Company, upon the satisfaction of certain conditions.
In connection with the Wellington Agreement, the Company paid direct fees of $154,000. The Company also issued warrants to purchase 126,315 shares of Series D-1 convertible preferred stock with an exercise price of $7.60 per share or, at the option of the holder, shares of the Company’s preferred stock issued at its next round of equity financing. If, instead of Series D-1, the holder elects to receive preferred shares in the Company’s next round of equity financing, the number of shares is calculated by dividing $960,000 by the price per share of the equity round. The initial fair value of the Series D-1 warrants was $1,446,000 (see Note 8). Both the cash fees and the fair value of the warrants are being amortized as interest expense over the term of the debt.
Also in connection with the Wellington Agreement, the Company further amended the SVB Agreement to cancel the $3,000,000 term loan facility and reduce the revolving line of credit from $7,000,000 to $5,000,000. Therefore, the amount outstanding under the term loan facility of $2,850,000 became due and was repaid. In connection with this SVB amendment, the Company paid SVB fees of $25,000 and additional fees of $18,000 were due May 2014.
In January 2014, the SVB agreement was amended to increase the amount available under the revolving line of credit to $8,000,000 and extend the maturity date to August 2015.
F-20
Table of Contents
Index to Financial Statements
Also during January 2014, the Wellington Agreement was amended to increase the term loan facility from $10,000,000 to $13,000,000, bringing the total loan commitment to $15,000,000. In connection with the January 2014 amendment to the Wellington Agreement, the Company paid direct fees of $45,000. The Company also issued warrants to purchase 31,579 shares of Series D-1 convertible preferred stock with an exercise price of $7.60 per share or, at the option of the holder, shares of the Company’s stock of the same class and series as issued at its next round of equity financing, if such financing generates proceeds of at least $5,000,000. In addition, the Company authorized an additional 250,000 shares of Series D-1 convertible preferred stock. The initial fair value of the Series D-1 warrants was $403,000 (see Note 8). Both the cash fees and the fair value of the warrants are being amortized as interest expense over the term of the debt. As of January 31, 2014 and April 30, 2015, the Company had borrowed $13,000,000 under the term loan facility and $2,000,000 under the operating line of credit.
In October 2014, the Wellington Agreement was amended to consolidate the operating loan and related accrued interest into one term loan. The face value of the term loan became $15,408,000 ($13,000,000 original term loan plus the $2,000,000 operating loan plus the $408,000 interest accrued on the term loan). The terms of the amended agreement were not substantially different and therefore the amendment was accounted for as a debt modification. As such, the existing unamortized debt issuance costs were added to the new issuance costs and to be amortized over the new remaining term of the debt. The payment terms of the term loan were amended whereby the Company is required to make monthly interest only payments through the maturity date, which was extended to October 2017, and a final payment ranging from 2.5% to 7.5% of the aggregate principal balance of the term loan depending on the payment date along with the outstanding principal balance. The interest rate remained the same at a fixed rate of 9.5% and the accrued interest no longer continues to exist. In connection with the October 2014 amendment to the Wellington Agreement, the Company paid direct fees of $97,500. The Company also issued warrants to purchase 147,936 shares of Series D-1 convertible preferred stock with an exercise price of $7.60 per share or, at the option of the holder, shares of the Company’s stock of the same class and series as issued at its next round of equity financing, if such financing generates proceeds of at least $5,000,000. The initial fair value of the Series D-1 warrants was $1,767,000 (see Note 8). Both the cash fees and the fair value of the warrants are being amortized as interest expense over the term of the debt.
Also during October 2014, the Company entered into a Sixth Amendment to the Amended and Restated Loan and Security Agreement as well as a new Mezzanine Loan and Security Agreement with SVB. The amendment extended the due date of the $8,000,000 revolving line of credit from August 2015 to August 2016 and allowed for an increase up to $13,000,000 if the Company met certain equity milestones as defined in the amendment. In November 2014, the first equity milestone had been met and therefore the revolving line of credit was increased to $11,000,000. The terms of the amended agreement were not substantially different and therefore the amendment was accounted for as a debt modification. As such, the existing unamortized debt issuance costs were added to the new issuance costs and to be amortized over the new remaining term of the debt. The Mezzanine Loan and Security Agreement provided for a new $10,000,000 term loan with a fixed interest rate of 9.5%. The payment terms of the term loan require the Company to make monthly interest only payments through the maturity date in October 2017, and a final payment ranging from 2.5% to 7.5% of the aggregate principal balance of the term loan depending on the payment date along with the outstanding principal balance. The Company borrowed $10,000,000 million under such term loan facility in October 2014. In connection with the October 2014 amendment to the SVB Agreement, the Company paid direct fees of $50,000. The Company also issued warrants to purchase 156,250 shares of Series D-1 convertible preferred stock with an exercise price of $7.60. The initial fair value of the Series D-1 warrants was $1,866,000 (see Note 8). Both the cash fees and the fair value of the warrants are being amortized as interest expense over the term of the debt. As of January 31, 2014, $1,500,000 has been borrowed under the SVB revolving line of credit. As of January 31, 2015, $6,500,000 has been borrowed under the SVB revolving line of credit, leaving $4,500,000 available for borrowing. As of January 31, 2015 and as of April 30, 2015, the interest rate on the revolving line of credit was 5.5%.
F-21
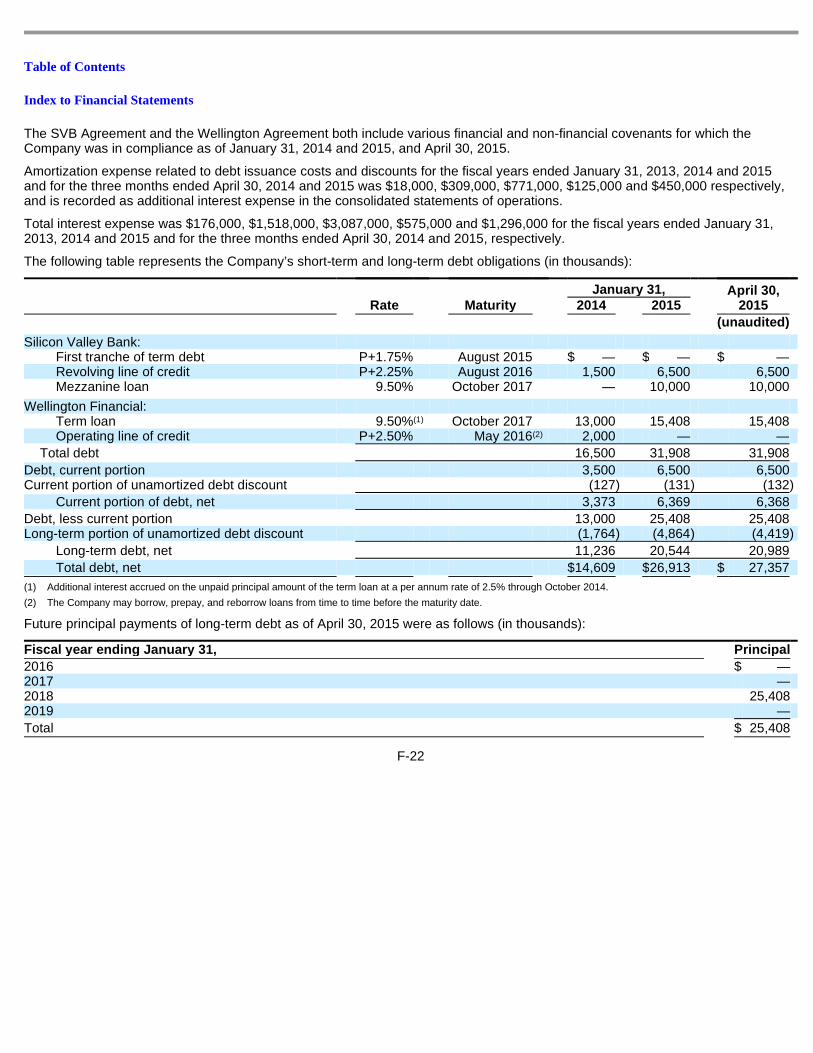
Table of Contents
Index to Financial Statements
The SVB Agreement and the Wellington Agreement both include various financial and non-financial covenants for which the Company was in compliance as of January 31, 2014 and 2015, and April 30, 2015.
Amortization expense related to debt issuance costs and discounts for the fiscal years ended January 31, 2013, 2014 and 2015 and for the three months ended April 30, 2014 and 2015 was $18,000, $309,000, $771,000, $125,000 and $450,000 respectively, and is recorded as additional interest expense in the consolidated statements of operations.
Total interest expense was $176,000, $1,518,000, $3,087,000, $575,000 and $1,296,000 for the fiscal years ended January 31, 2013, 2014 and 2015 and for the three months ended April 30, 2014 and 2015, respectively.
The following table represents the Company’s short-term and long-term debt obligations (in thousands):
Future principal payments of long-term debt as of April 30, 2015 were as follows (in thousands):
F-22
Rate
Maturity
January 31, April 30, 2015 2014 2015
(unaudited)
Silicon Valley Bank:
First tranche of term debt P+1.75% August 2015 $ — $ — $ — Revolving line of credit P+2.25% August 2016 1,500 6,500 6,500 Mezzanine loan 9.50% October 2017 — 10,000 10,000
Wellington Financial:
Term loan 9.50% October 2017 13,000 15,408 15,408 Operating line of credit P+2.50% May 2016 2,000 — —
Total debt 16,500 31,908 31,908
Debt, current portion 3,500 6,500 6,500 Current portion of unamortized debt discount (127 ) (131 ) (132 )
Current portion of debt, net 3,373 6,369 6,368
Debt, less current portion 13,000 25,408 25,408 Long-term portion of unamortized debt discount (1,764 ) (4,864 ) (4,419 )
Long-term debt, net 11,236 20,544 20,989
Total debt, net $ 14,609 $ 26,913 $ 27,357
(1) Additional interest accrued on the unpaid principal amount of the term loan at a per annum rate of 2.5% through October 2014.
(2) The Company may borrow, prepay, and reborrow loans from time to time before the maturity date.
Fiscal year ending January 31, Principal
2016 $ — 2017 — 2018 25,408 2019 —
Total $ 25,408
(1)
(2)
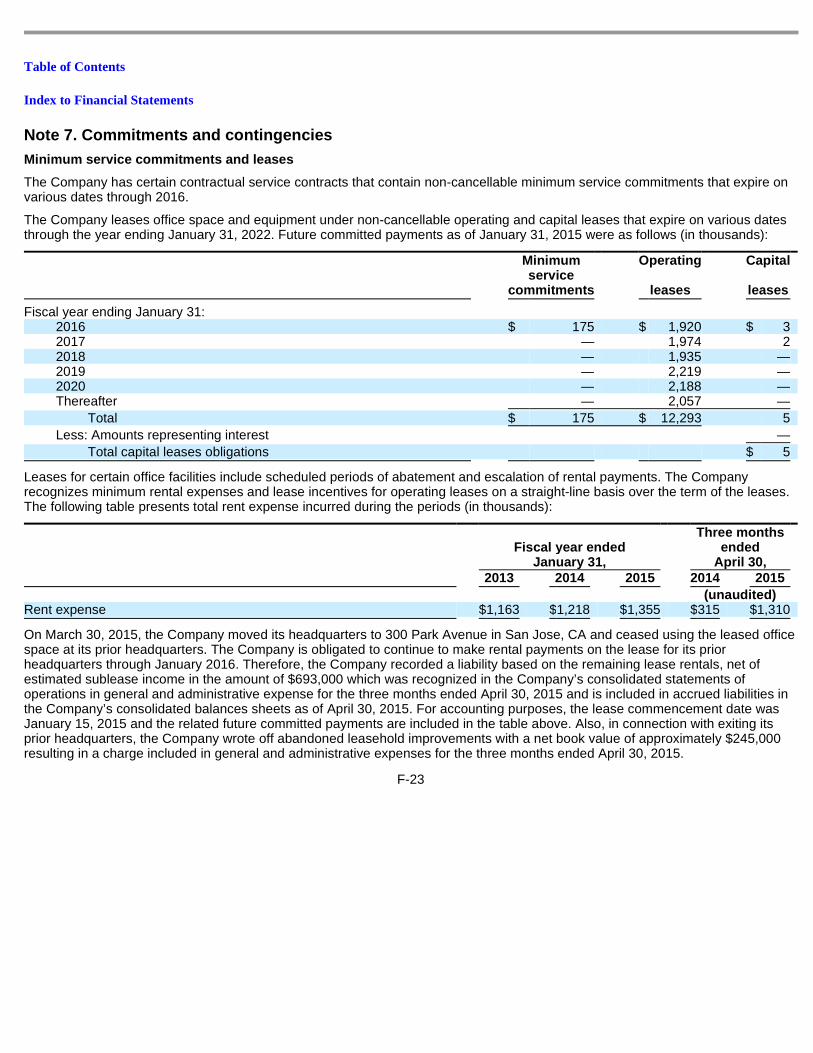
Table of Contents
Index to Financial Statements
Note 7. Commitments and contingencies
Minimum service commitments and leases
The Company has certain contractual service contracts that contain non-cancellable minimum service commitments that expire on various dates through 2016.
The Company leases office space and equipment under non-cancellable operating and capital leases that expire on various dates through the year ending January 31, 2022. Future committed payments as of January 31, 2015 were as follows (in thousands):
Leases for certain office facilities include scheduled periods of abatement and escalation of rental payments. The Company recognizes minimum rental expenses and lease incentives for operating leases on a straight-line basis over the term of the leases. The following table presents total rent expense incurred during the periods (in thousands):
On March 30, 2015, the Company moved its headquarters to 300 Park Avenue in San Jose, CA and ceased using the leased office space at its prior headquarters. The Company is obligated to continue to make rental payments on the lease for its prior headquarters through January 2016. Therefore, the Company recorded a liability based on the remaining lease rentals, net of estimated sublease income in the amount of $693,000 which was recognized in the Company’s consolidated statements of operations in general and administrative expense for the three months ended April 30, 2015 and is included in accrued liabilities in the Company’s consolidated balances sheets as of April 30, 2015. For accounting purposes, the lease commencement date was January 15, 2015 and the related future committed payments are included in the table above. Also, in connection with exiting its prior headquarters, the Company wrote off abandoned leasehold improvements with a net book value of approximately $245,000 resulting in a charge included in general and administrative expenses for the three months ended April 30, 2015.
F-23
Minimum service
commitments
Operating
leases
Capital
leases
Fiscal year ending January 31:
2016 $ 175 $ 1,920 $ 3 2017 — 1,974 2 2018 — 1,935 — 2019 — 2,219 — 2020 — 2,188 — Thereafter — 2,057 —
Total $ 175 $ 12,293 5
Less: Amounts representing interest —
Total capital leases obligations $ 5
Fiscal year ended January 31,
Three months ended
April 30,
2013 2014 2015 2014 2015
(unaudited)
Rent expense $ 1,163 $ 1,218 $ 1,355 $ 315 $ 1,310
Table of Contents
Index to Financial Statements
Indemnifications
In the normal course of business, the Company provides indemnifications of varying scope to customers against claims of intellectual property infringement made by third parties arising from the use of our services and the Company may be subject to claims by customers under these indemnification provisions. Historically, costs related to these indemnification provisions have not been significant and the Company is unable to estimate the maximum potential impact of these indemnification provisions on future results of operations.
To the extent permitted under Delaware law, the Company has agreements to indemnify directors and officers for certain events or occurrences while the director or officer is or was serving at the Company’s request in such capacity. The indemnification period covers all pertinent events and occurrences during the director’s or officer’s lifetime. The maximum potential amount of future payments the Company could be required to make under these indemnification agreements is unlimited; however, the Company has director and officer insurance coverage that limits our exposure and enables the Company to recover a portion of any future amounts paid. The Company believes that the estimated fair value of these indemnification agreements in excess of applicable insurance coverage is minimal.
Other taxes
The Company conducts operations in many tax jurisdictions throughout the United States. In many of these jurisdictions, non-income based taxes, such as property taxes, sales and use taxes, and value-added taxes are assessed on our operations in that particular location. While the Company strives to ensure compliance with these various non-income based tax filing requirements, there have been instances where potential non-compliance exposures have been identified. In accordance with U.S. GAAP, the Company makes a provision for these exposures when it is both probable that a liability has been incurred and the amount of the exposure can be reasonably estimated.
Settlement liability
During the fiscal year ended January 31, 2013, the Company was involved a patent infringement litigation case with Callidus Software Inc. (Callidus). In the opinion of management, this was a normal business matter and would not have resulted in a probable and reasonably estimable material adverse effect on the financial position or results of operations of the Company as of October 9, 2013, the date the consolidated financial statements for fiscal 2013 were originally issued.
On November 25, 2013, the Company and Callidus entered into a settlement agreement, in which both parties agreed to a mutual covenant not to sue in respect of patents for a period of seven years and to mutual releases. On November 26, 2013, all claims were dismissed by the United States District Court, Northern District of California. Under the settlement agreement the Company agreed to pay Callidus $2,000,000 in installments with the first and second payments of $500,000 paid in November 2013 and 2014, respectively. The Company shall make two further payments of $500,000 each no later than November 30 of 2015 and 2016, respectively. As of January 31, 2015 and April 30, 2015, the amount payable of $500,000 was recorded in accrued expenses and $500,000 was recorded in other long-term liabilities in the accompanying consolidated balance sheets.
F-24
Table of Contents
Index to Financial Statements
Note 8. Stockholders’ equity
Convertible preferred stock
The Company designated six and seven series of convertible preferred stock as of January 31, 2014 and 2015, respectively (collectively, convertible preferred stock). All convertible preferred stock has a par value of $0.001 per share.
Convertible preferred stock as of January 31, 2014 consisted of the following (in thousands, except share and per share data):
Convertible preferred stock as of January 31, 2015 and April 30, 2015 consisted of the following (in thousands, except share and per share data):
Preferred stock rights
The rights, preferences, privileges and restrictions granted to and imposed on the convertible preferred stock are as set forth below.
Dividends
Holders of shares of convertible preferred stock shall be entitled to receive noncumulative dividends when and if declared by the board of directors at the following annual rates: Series A—$0.128 per share, Series B—$0.2704 per share, Series C—$0.4064 per share, Series D—$0.608 per share, Series E—$0.2556 per share, Series D-1—
F-25
Period issued Shares
authorized
Shares issued and outstanding
Price per share
Gross amount
Issuance
costs Net
amount
Liquidation
preference
Series A August 2005 10,652,633 2,663,142 $ 1.20 and 1.60 $ 4,000 $ 72 $ 3,928 $ 4,261 Series B March 2006 9,501,539 2,367,964 3.36 8,000 95 7,905 8,000 Series C April 2007 12,031,497 2,972,423 5.08 15,100 113 14,987 15,100 Series D April 2008 15,563,652 3,875,111 7.60 29,451 263 29,188 29,451 Series E January 2009 15,166,636 3,391,686 1.92 6,498 — 6,498 10,837 Series D-1
June 2010, August 2010
and June 2011
7,750,000 1,729,518 7.60 13,145 197 12,948 26,289
70,665,957 16,999,844 $ 76,194 $ 740 $ 75,454 $ 93,938
Period issued Shares
authorized
Shares issued and outstanding
Price per share
Gross amount
Issuance
costs
Net amount
Liquidation
preference
Series A August 2005 10,652,633 2,663,142 $ 1.20 and 1.60 $ 4,000 $ 72 $ 3,928 $ 4,261 Series B March 2006 9,501,539 2,375,363 3.36 8,025 95 7,930 8,025 Series C April 2007 12,031,497 2,972,423 5.08 15,100 113 14,987 15,100 Series D April 2008 15,563,652 3,875,111 7.60 29,451 263 29,188 29,451 Series E January 2009 15,166,636 3,391,686 1.92 6,498 — 6,498 10,837 Series D-1
June 2010, August 2010
and June 2011
8,810,000 1,729,518 7.60 13,145 197 12,948 26,289
Series F November 2014 6,868,000 864,728 9.84 8,500 138 8,362 8,500 Undesignated Shares 406,043 — — — — — —
79,000,000 17,871,971 $ 84,719 $ 878 $ 83,841 $ 102,463
(1) Net amount for Series B excludes the reclassification of the warrant liability associated with the exercise of Series B warrants of $55,000 and net amount for Series F excludes the warrant for Series F convertible preferred stock with allocated proceeds of $878,000 which is presented as a discount to the Series F convertible preferred stock.
(1)
Table of Contents
Index to Financial Statements
$0.608 per share and Series F—$0.7864 per share. Such dividends are payable in preference to any dividends on common stock declared by the board of directors. No dividends have been declared or paid to date.
Liquidation rights
In the event of a voluntary or involuntary liquidation of the Company, the assets and funds of the Company available for distribution to stockholders shall be distributed as follows:
First, to holders of Series F convertible preferred stock an amount equal to $9.8296 per share, as adjusted for any recapitalization events, plus all declared and unpaid dividends on the Series F convertible preferred stock. If upon the occurrence of a liquidation event, the assets of the Company legally available for distribution are insufficient to permit the payment to the holders of Series F convertible preferred stock of the full preferential amounts, then the entire amount of the assets available for distribution to stockholders shall be distributed to the holders of the Series F convertible preferred stock pari passu and ratably in proportion to the full preferential amounts, which they would otherwise be entitled to receive.
Second, to holders of Series D-1 convertible preferred stock an amount equal to two times $7.60 per share, as adjusted for any recapitalization events, plus all declared and unpaid dividends on the Series D-1 convertible preferred stock. If upon the occurrence of a liquidation event, the assets of the Company legally available for distribution after the payment to Series F convertible preferred stock are insufficient to permit the payment to the holders of Series D-1 convertible preferred stock of the full preferential amounts, then the entire amount of the assets available for distribution to stockholders shall be distributed to the holders of the Series D-1 convertible preferred stock pari passu and ratably in proportion to the full preferential amounts, which they would otherwise be entitled to receive.
Third, the holders of the remaining convertible preferred stock shall be entitled to receive, out of the assets of the Company available for distribution to its stockholders, before any payment or distribution shall be made in respect of the Company’s common stock, an amount equal to $3.1952 per share of Series E convertible preferred stock, $7.60 per share of Series D convertible preferred stock, $5.08 per share of Series C convertible preferred stock, $3.3784 per share of Series B convertible preferred stock and $1.60 per share of Series A convertible preferred stock, plus all declared and unpaid dividends on the remaining preferred stock. If upon the occurrence of a liquidation event the assets of the Company legally available for distribution after the payment to Series F convertible preferred stock and Series D-1 convertible preferred stock holders are insufficient to permit the payment to the holders of the remaining preferred stock of the full preferential amounts described above, then the entire amount of such remaining assets available for distribution shall be distributed pari passu and ratably in proportion to the full preferential amounts, which they would otherwise be entitled to receive.
Fourth, to the holders of common stock, Series A convertible preferred stock, Series B convertible preferred stock, Series C convertible preferred stock, Series D convertible preferred stock, Series E convertible preferred stock, Series D-1 convertible preferred stock and Series F convertible preferred stock pari passu and ratably in proportion to the number of shares of common stock held by each holder, assuming full conversion of preferred stock, provided that holders of Series A, Series B, Series C and/or Series D-1 convertible preferred stock shall cease participating in the distribution of assets once such holder has received an aggregate of four times their respective original issuance price applicable to the shares of such series of preferred stock held, and Series D and/or Series E convertible preferred stock shall cease participating in the distribution of assets once such holder has received an aggregate of three times their respective original issuance price. Once all shares of Series A, B, C, D, E and D-1 preferred stock have ceased participating, the remaining assets of the Company available for distribution to its stockholders, if any, shall be distributed to the holders of Series F convertible preferred stock and common stock pro rata.
F-26
Table of Contents
Index to Financial Statements
Conversion
Each share of preferred stock is convertible, at the option of the holder, at any time after the date of issuance of such share, at the office of the Company or the transfer agent into such number of fully paid and non-assessable shares of common stock as is determined by dividing the original issue price by the conversion price in effect on the date the certificate is surrendered for conversion.
Each share of Series A, Series B, Series C, Series D and Series E convertible preferred stock (Junior Preferred Stock) shall automatically be converted, at the conversion rate then applicable upon: (i) the vote or written consent of the holders of at least two-thirds of the voting power represented by the then outstanding shares of Junior Preferred Stock; or (ii) the closing of a firm commitment underwritten public offering pursuant to an effective registration statement under the Securities Act of 1933, as amended (the Securities Act), covering the offer and sale of common stock with aggregate gross proceeds to the Company of not less than $40,000,000 (Qualified IPO).
Each share of Series D-1 convertible preferred stock shall automatically be converted, at the conversion rate then applicable, upon: (i) the closing of a Qualified IPO; (ii) the vote or written consent of holders of at least 75% of the voting power represented by the then outstanding shares of Series D-1 convertible preferred stock, voting as a separate class; or (iii) the vote or written consent of the holders of at least two-thirds of the voting power represented by the then outstanding shares of all convertible preferred stock, voting together as a single class, provided that, in the case of (iii) only, all outstanding shares of convertible preferred stock are to be concurrently converted into shares of common stock (a) as a condition to, and effective upon, the closing of an equity financing by the Company resulting in gross proceeds of not less than $5,000,000 and (b) not in connection with or in contemplation of any liquidation event in which the aggregate net proceeds available for distribution is an amount less than $33,000,000.
Each share of Series F convertible preferred stock shall automatically be converted, at the conversion rate then applicable, upon: (i) the closing of a Qualified IPO; (ii) the vote or written consent of holders of at least 60% of the voting power represented by the then outstanding shares of Series F convertible preferred stock, voting as a separate class; or (iii) the vote or written consent of the holders of at least two-thirds of the voting power represented by the then outstanding shares of all convertible preferred stock, voting together as a single class, provided that, in the case of (iii) only, all outstanding shares of convertible preferred stock are to be concurrently converted into shares of common stock (a) as a condition to, and effective upon, the closing of an equity financing by the Company resulting in gross proceeds of not less than $5,000,000 and (b) not in connection with or in contemplation of any liquidation event in which the aggregate net proceeds available for distribution is an amount less than $33,000,000.
Voting rights
The holder of each share of Series A, Series B, Series C, Series D, Series D-1, Series E and Series F convertible preferred stock has the number of votes equal to the number of shares of common stock into which it is convertible. Holders of common stock, voting as a single class, shall be entitled to elect one director; the holders of preferred stock, voting together as a single class, shall be entitled to elect five directors; and the holders of preferred stock and common stock, voting together as a single class, shall be entitled to elect two directors.
Redemption
The convertible preferred stock is not redeemable.
F-27
Table of Contents
Index to Financial Statements
Common stock
As of January 31, 2014 and 2015 and April 30, 2015, the Company was authorized to issue 105,000,000, 120,000,000 and 120,000,000 shares of common stock, respectively. Shares of common stock reserved for future issuance are as follows:
Series E preferred stock options
In connection with our acquisition of Centive, Inc. (Centive) in January 2009, the Company reserved for issuance 399,960 shares of Series E convertible preferred stock related to Series E convertible preferred stock options with an exercise price of $0.9580 per share, granted to former members of Centive management as designated by the former Centive shareholders. The shares may be issued to the former members of Centive management upon exercise of the options only upon the completion of a sale event of the Company or if the shares become freely tradable in a public securities market. In either case, the proceeds from the exercise of the options, once received by the Company or, in the case of a cashless exercise, any shares tendered back to the Company to satisfy the exercise price, will be distributed to the former Centive shareholders. If the shares underlying the options are not issued to the former members of Centive management, either because they are never exercised or they terminate by their expiration date of January 22, 2019, then the shares will be distributed to the former Centive shareholders.
Warrants
In connection with an equipment leasing arrangement in 2006, the Company issued a warrant to purchase 7,399 shares of Series B convertible preferred stock with an exercise price of $3.36 per share. The warrant is exercisable at any time up through June 30, 2014. The initial fair value of the warrant was amortized to interest expense over the term of the leasing arrangement.
In connection with a bank debt facility agreement in 2008, the Company issued a warrant to purchase 35,433 shares of Series C convertible preferred stock with an exercise price of $5.08 per share and 15,789 shares of Series D convertible preferred stock with an exercise price of $7.60 per share. The warrant is
F-28
January 31, April 30, 2015 2014 2015
(unaudited)
Shares reserved for convertible preferred stock and warrants:
Series A 2,663,142 2,663,142 2,663,142 Series B 2,367,964 2,375,363 2,375,363 Series C 2,972,423 2,972,423 2,972,423 Series D 3,875,111 3,875,111 3,875,111 Series E 3,791,659 3,791,659 3,791,659 Series D-1 1,769,738 1,730,552 1,730,552 Series F — 1,500,825 1,500,825 Undesignated — 101,510 101,510 Preferred stock warrants 226,383 739,345 739,345
Total reserved for preferred stock 17,666,420 19,749,930 19,749,930 Common stock outstanding 2,645,470 2,881,951 2,955,187 Stock options and restricted stock units outstanding 4,408,230 4,703,974 4,697,339 Shares reserved for future stock option issuances 253,211 220,938 154,337
Total shares reserved 24,973,331 27,556,793 27,556,793
Table of Contents
Index to Financial Statements
exercisable at any time during its term, which is the longer of 10 years from the date of issuance or seven years after a registered initial public offering of the Company’s common stock. The initial fair values of the warrants were amortized to interest expense over the term of the debt.
In August 2012, in connection with the SVB Agreement, the Company issued a warrant to purchase 9,868 shares of Series D-1 convertible preferred stock with an exercise price of $7.60 per share or, at the option of the holder, warrants to purchase shares of the Company’s preferred shares issued at its next round of equity financing. If the holder elects to receive warrants for the Company’s next round of equity financing, the number of shares is calculated by multiplying the aggregate original principal amount by 2.5% and then dividing by the price per share of the equity round. The warrant is exercisable at any time during its term, prior to 10 years from the date of issuance. The initial fair value of the warrants is being amortized to interest expense over the term of the debt.
In May 2013, in connection with the May 2013 Wellington Agreement, the Company issued warrants to purchase 126,315 shares of Series D-1 convertible preferred stock with an exercise price of $7.60 per share or, at the option of the holder, warrants to purchase shares of the Company’s preferred stock of the same class and series as issued at its next round of equity financing, if such financing generates proceeds of at least $5,000,000. If, instead of Series D-1, the holder elects to receive warrants for the Company’s next round of equity financing, the number of shares is calculated by dividing $960,000 by the price per share of the equity round. The warrant is exercisable at any time during its term, prior to the earlier of 10 years from the date of issuance or five years after a registered initial public offering of the Company’s common stock. The initial fair value of the warrants is being amortized to interest expense over the term of the facility.
In January 2014, in connection with the January 2014 Wellington Agreement amendment, the Company issued warrants to purchase 31,579 shares of Series D-1 convertible preferred stock with an exercise price of $7.60 per share or, at the option of the holder, warrants to purchase the Company’s stock of the same class and series as issued at its next round of equity financing, if such financing generates proceeds of at least $5,000,000. If, instead of Series D-1, the holder elects to receive warrants for the Company’s next round of equity financing, the number of shares is calculated by dividing $240,000 by the price per share of the equity round. The warrant is exercisable at any time during its term, prior to the earlier of 10 years from the date of issuance or five years after a registered initial public offering of the Company’s common stock. The initial fair value of the warrants is being amortized to interest expense over the term of the facility.
In November 2014, in connection with the October 2014 Wellington Agreement amendment, the Company issued warrants to purchase 147,936 shares of Series D-1 convertible preferred stock with an exercise price of $7.60 per share or, at the option of the holder, warrants to purchase the Company’s stock of the same class and series as issued at its next round of equity financing, if such financing generates proceeds of at least $5,000,000. If, instead of Series D-1, the holder elects to receive warrants for the Company’s next round of equity financing, the number of shares is calculated by dividing $1,124,315 by the price per share of the equity round. The warrant is exercisable at any time during its term, prior to the earlier of 10 years from the date of issuance or five years after a registered initial public offering of the Company’s common stock. The initial fair value of the warrants is being amortized to interest expense over the term of the facility. Also in November 2014, in connection with the SVB Agreement amendment, the Company issued warrants to purchase 156,250 shares of Series D-1 convertible preferred stock with an exercise price of $7.60 per share. The warrant is exercisable at any time during its term, prior to the earlier of 10 years from the date of issuance. The initial fair value of the warrants is being amortized to interest expense over the term of the facility.
F-29
Table of Contents
Index to Financial Statements
Fair value of the warrants at the date of issuance was determined using the Black-Scholes option pricing model with the following assumptions:
The Company has determined that the warrants should be liability classified with changes in the fair value at each reporting period included under the consolidated statements of operations under the caption “(Increase) decrease in fair value of warrant liabilities” until the earlier of: (1) exercise or (2) the expiration of the warrants. The outstanding preferred stock warrants will automatically be converted into warrants to purchase common stock upon effectiveness of an initial public offering.
In November 2014, in connection with the issuance of Series F convertible preferred stock, the Company issued warrants to purchase 216,175 shares of Series F convertible preferred stock with an exercise price of $9.8296 per share. The warrant is exercisable at any time during its term, prior to the earlier of (i) 5 years from the date of issuance, (ii) an acquisition of the Company by another entity, or (iii) immediately prior to the closing of a firm commitment underwritten initial public offering pursuant to an effective registration statement filed under the Securities Act covering the offering and the sale of the Company’s common stock. The initial fair value of the warrants was recorded as a discount to the Series F convertible preferred stock.
Fair value of the warrants at the date of issuance was determined using the Black-Scholes option pricing model with the following assumptions (in thousands):
The Company has determined that the warrants should be equity classified. The outstanding preferred stock warrants will automatically be converted into warrants to purchase common stock upon effectiveness of an initial public offering.
Note 9. Stock-based awards and stock-based compensa tion
Stock option plan
In 2005, the Company adopted a stock plan (the Stock Plan) pursuant to which the Company’s board of directors may grant options to purchase common stock or unvested common shares to employees, consultants and advisors of the Company. In September 2011, the Company amended the Stock Plan to permit the Company to grant Restricted Stock Units (RSUs). As of January 31, 2014 and 2015, and as of April 30, 2015, the Company has granted stock options and RSUs. The Stock Plan, as amended, authorizes grants to purchase up to 4,661,441, 4,924,912 and 4,851,676 shares of authorized but unissued common stock as of January 31, 2014 and 2015 and April 30, 2015, respectively. Stock options can be granted with an exercise price less than, equal
F-30
Series B Series C Series D Series D -1 Series D -1 Series D -1 Series D -1
Date of issuance November 2006 March 2008 April 2008 August 2012 May 2013 January 2014 November 2014 Fair value at date
of issuance (in thousands) $ 18 $ 143 $ 82 $ 106 $ 1,446 $ 403 $ 3,633
Expected term in years 7.56 10.00 10.00 10.00 10.00 10.00 10.00
Expected volatility 70% 55% 55% 55% 55% 52% 52%
Risk-free interest rate 4.61% 3.45% 3.45% 1.51% 2.16% 2.88% 2.34%
Series F
Date of issuance November 2014 Fair value at date of issuance $ 878 Expected term in years 5 Expected volatility 52% Risk-free interest rate 1.64%
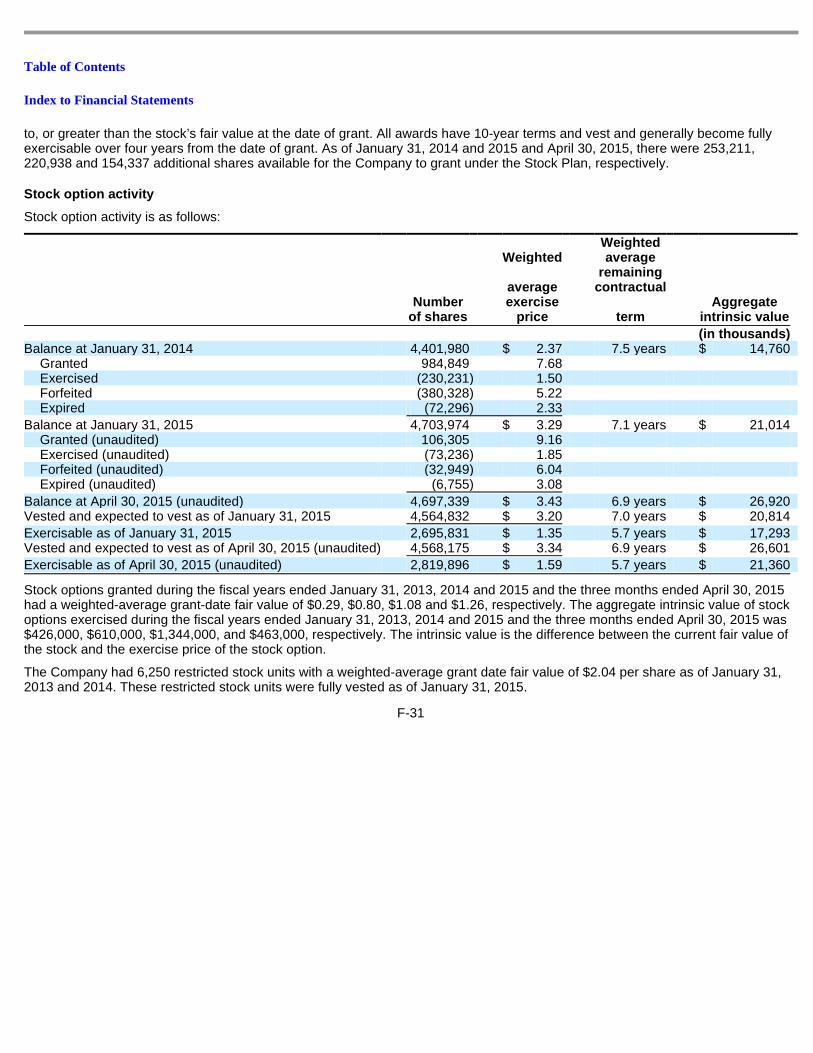
Table of Contents
Index to Financial Statements
to, or greater than the stock’s fair value at the date of grant. All awards have 10-year terms and vest and generally become fully exercisable over four years from the date of grant. As of January 31, 2014 and 2015 and April 30, 2015, there were 253,211, 220,938 and 154,337 additional shares available for the Company to grant under the Stock Plan, respectively.
Stock option activity
Stock option activity is as follows:
Stock options granted during the fiscal years ended January 31, 2013, 2014 and 2015 and the three months ended April 30, 2015 had a weighted-average grant-date fair value of $0.29, $0.80, $1.08 and $1.26, respectively. The aggregate intrinsic value of stock options exercised during the fiscal years ended January 31, 2013, 2014 and 2015 and the three months ended April 30, 2015 was $426,000, $610,000, $1,344,000, and $463,000, respectively. The intrinsic value is the difference between the current fair value of the stock and the exercise price of the stock option.
The Company had 6,250 restricted stock units with a weighted-average grant date fair value of $2.04 per share as of January 31, 2013 and 2014. These restricted stock units were fully vested as of January 31, 2015.
F-31
Number of shares
Weighted
average exercise
price
Weighted average
remaining contractual
term
Aggregate intrinsic value
(in thousands)
Balance at January 31, 2014 4,401,980 $ 2.37 7.5 years $ 14,760 Granted 984,849 7.68
Exercised (230,231 ) 1.50
Forfeited (380,328 ) 5.22
Expired (72,296 ) 2.33
Balance at January 31, 2015 4,703,974 $ 3.29 7.1 years $ 21,014 Granted (unaudited) 106,305 9.16
Exercised (unaudited) (73,236 ) 1.85
Forfeited (unaudited) (32,949 ) 6.04
Expired (unaudited) (6,755 ) 3.08
Balance at April 30, 2015 (unaudited) 4,697,339 $ 3.43 6.9 years $ 26,920 Vested and expected to vest as of January 31, 2015 4,564,832 $ 3.20 7.0 years $ 20,814
Exercisable as of January 31, 2015 2,695,831 $ 1.35 5.7 years $ 17,293 Vested and expected to vest as of April 30, 2015 (unaudited) 4,568,175 $ 3.34 6.9 years $ 26,601
Exercisable as of April 30, 2015 (unaudited) 2,819,896 $ 1.59 5.7 years $ 21,360
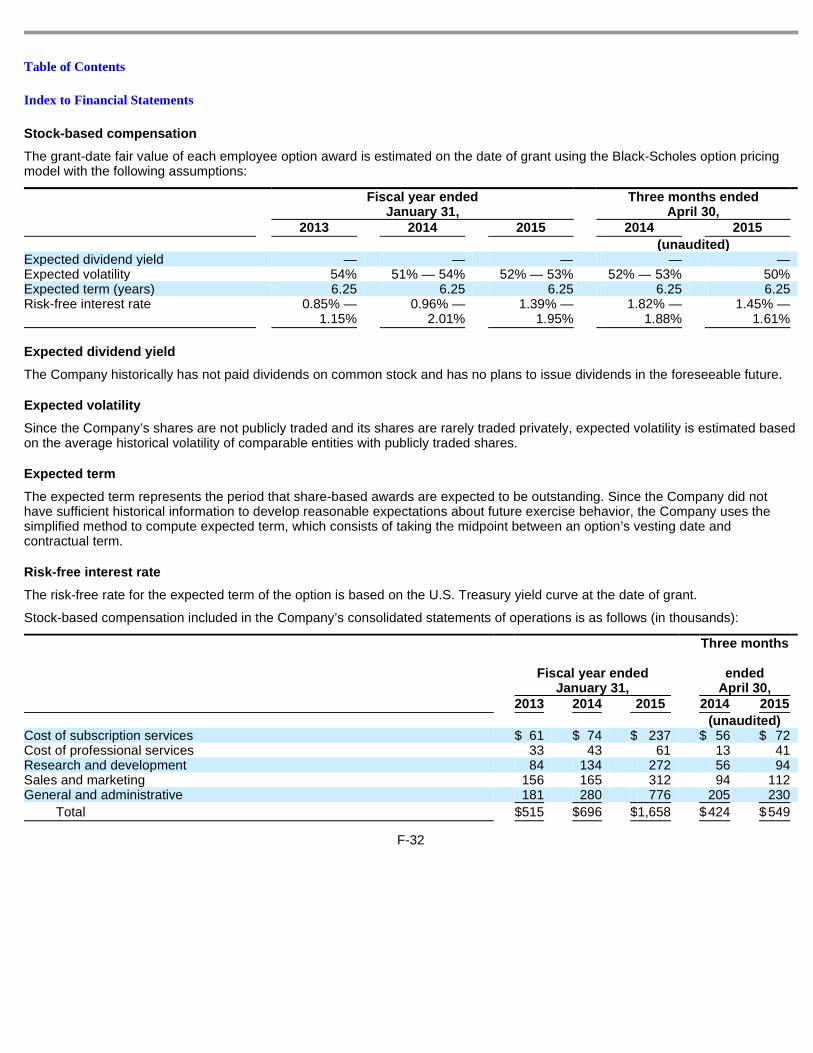
Table of Contents
Index to Financial Statements
Stock-based compensation
The grant-date fair value of each employee option award is estimated on the date of grant using the Black-Scholes option pricing model with the following assumptions:
Expected dividend yield
The Company historically has not paid dividends on common stock and has no plans to issue dividends in the foreseeable future.
Expected volatility
Since the Company’s shares are not publicly traded and its shares are rarely traded privately, expected volatility is estimated based on the average historical volatility of comparable entities with publicly traded shares.
Expected term
The expected term represents the period that share-based awards are expected to be outstanding. Since the Company did not have sufficient historical information to develop reasonable expectations about future exercise behavior, the Company uses the simplified method to compute expected term, which consists of taking the midpoint between an option’s vesting date and contractual term.
Risk-free interest rate
The risk-free rate for the expected term of the option is based on the U.S. Treasury yield curve at the date of grant.
Stock-based compensation included in the Company’s consolidated statements of operations is as follows (in thousands):
F-32
Fiscal year ended January 31,
Three months ended April 30,
2013 2014 2015 2014 2015
(unaudited)
Expected dividend yield — — — — — Expected volatility 54% 51% — 54% 52% — 53% 52% — 53% 50% Expected term (years) 6.25 6.25 6.25 6.25 6.25 Risk-free interest rate
0.85% —
1.15% 0.96% —
2.01% 1.39% —
1.95% 1.82% —
1.88% 1.45% —
1.61%
Fiscal year ended January 31,
Three months
ended April 30,
2013 2014 2015 2014 2015
(unaudited)
Cost of subscription services $ 61 $ 74 $ 237 $ 56 $ 72 Cost of professional services 33 43 61 13 41 Research and development 84 134 272 56 94 Sales and marketing 156 165 312 94 112 General and administrative 181 280 776 205 230
Total $ 515 $ 696 $ 1,658 $ 424 $ 549
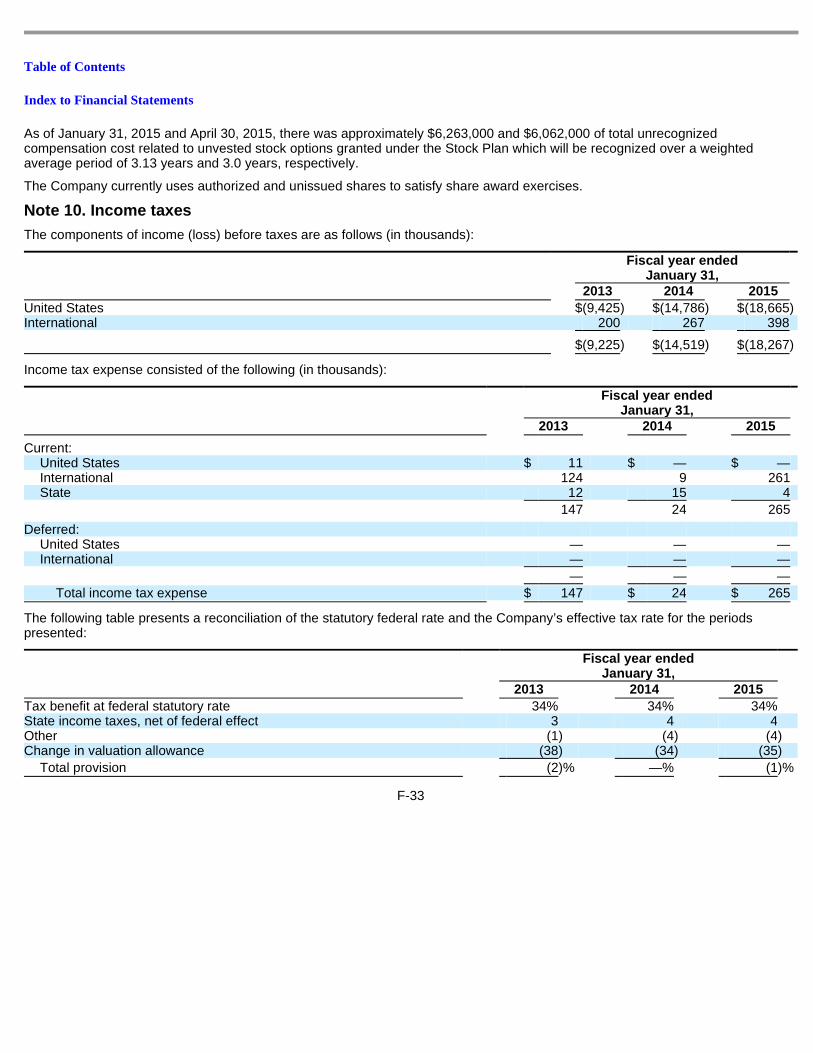
Table of Contents
Index to Financial Statements
As of January 31, 2015 and April 30, 2015, there was approximately $6,263,000 and $6,062,000 of total unrecognized compensation cost related to unvested stock options granted under the Stock Plan which will be recognized over a weighted average period of 3.13 years and 3.0 years, respectively.
The Company currently uses authorized and unissued shares to satisfy share award exercises.
Note 10. Income taxes
The components of income (loss) before taxes are as follows (in thousands):
Income tax expense consisted of the following (in thousands):
The following table presents a reconciliation of the statutory federal rate and the Company’s effective tax rate for the periods presented:
F-33
Fiscal year ended January 31,
2013 2014 2015
United States $ (9,425 ) $ (14,786 ) $ (18,665 ) International 200 267 398
$ (9,225 ) $ (14,519 ) $ (18,267 )
Fiscal year ended January 31,
2013 2014 2015
Current:
United States $ 11 $ — $ — International 124 9 261 State 12 15 4
147 24 265
Deferred:
United States — — — International — — —
— — —
Total income tax expense $ 147 $ 24 $ 265
Fiscal year ended January 31,
2013 2014 2015
Tax benefit at federal statutory rate 34% 34% 34% State income taxes, net of federal effect 3 4 4 Other (1 ) (4 ) (4 ) Change in valuation allowance (38 ) (34 ) (35 )
Total provision (2 )% —% (1 )%
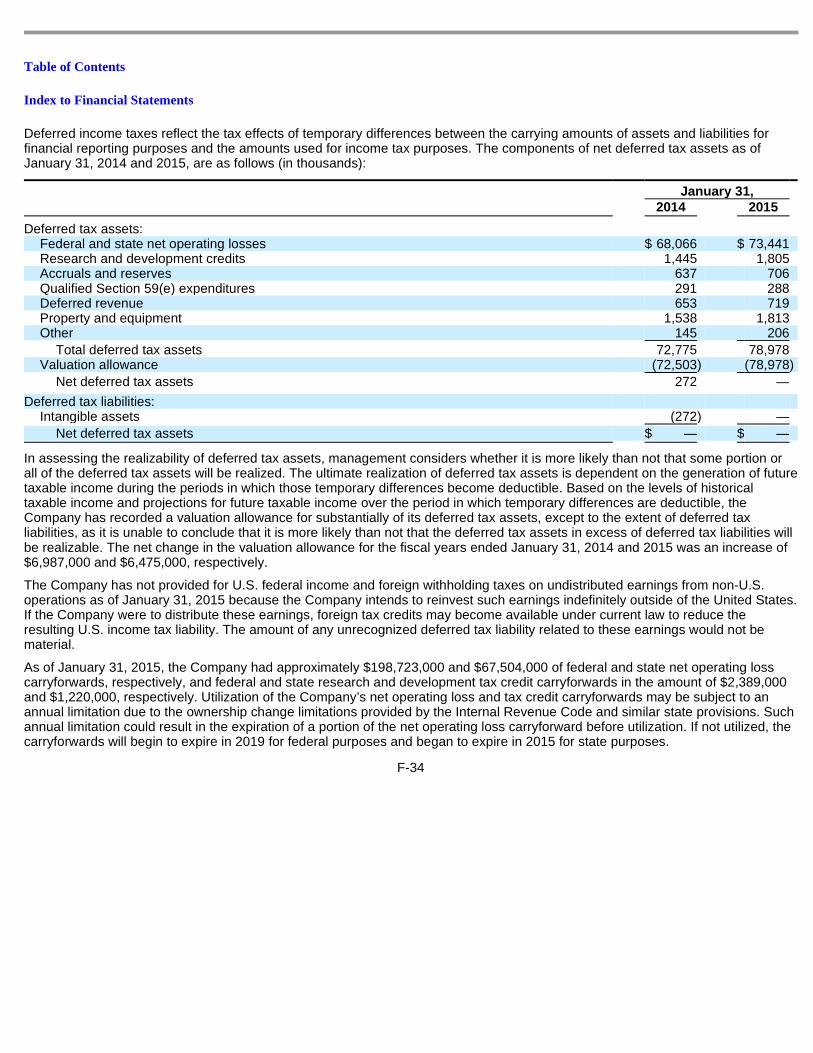
Table of Contents
Index to Financial Statements
Deferred income taxes reflect the tax effects of temporary differences between the carrying amounts of assets and liabilities for financial reporting purposes and the amounts used for income tax purposes. The components of net deferred tax assets as of January 31, 2014 and 2015, are as follows (in thousands):
In assessing the realizability of deferred tax assets, management considers whether it is more likely than not that some portion or all of the deferred tax assets will be realized. The ultimate realization of deferred tax assets is dependent on the generation of future taxable income during the periods in which those temporary differences become deductible. Based on the levels of historical taxable income and projections for future taxable income over the period in which temporary differences are deductible, the Company has recorded a valuation allowance for substantially of its deferred tax assets, except to the extent of deferred tax liabilities, as it is unable to conclude that it is more likely than not that the deferred tax assets in excess of deferred tax liabilities will be realizable. The net change in the valuation allowance for the fiscal years ended January 31, 2014 and 2015 was an increase of $6,987,000 and $6,475,000, respectively.
The Company has not provided for U.S. federal income and foreign withholding taxes on undistributed earnings from non-U.S. operations as of January 31, 2015 because the Company intends to reinvest such earnings indefinitely outside of the United States. If the Company were to distribute these earnings, foreign tax credits may become available under current law to reduce the resulting U.S. income tax liability. The amount of any unrecognized deferred tax liability related to these earnings would not be material.
As of January 31, 2015, the Company had approximately $198,723,000 and $67,504,000 of federal and state net operating loss carryforwards, respectively, and federal and state research and development tax credit carryforwards in the amount of $2,389,000 and $1,220,000, respectively. Utilization of the Company’s net operating loss and tax credit carryforwards may be subject to an annual limitation due to the ownership change limitations provided by the Internal Revenue Code and similar state provisions. Such annual limitation could result in the expiration of a portion of the net operating loss carryforward before utilization. If not utilized, the carryforwards will begin to expire in 2019 for federal purposes and began to expire in 2015 for state purposes.
F-34
January 31,
2014 2015
Deferred tax assets:
Federal and state net operating losses $ 68,066 $ 73,441 Research and development credits 1,445 1,805 Accruals and reserves 637 706 Qualified Section 59(e) expenditures 291 288 Deferred revenue 653 719 Property and equipment 1,538 1,813 Other 145 206
Total deferred tax assets 72,775 78,978 Valuation allowance (72,503 ) (78,978 )
Net deferred tax assets 272 —
Deferred tax liabilities:
Intangible assets (272 ) —
Net deferred tax assets $ — $ —
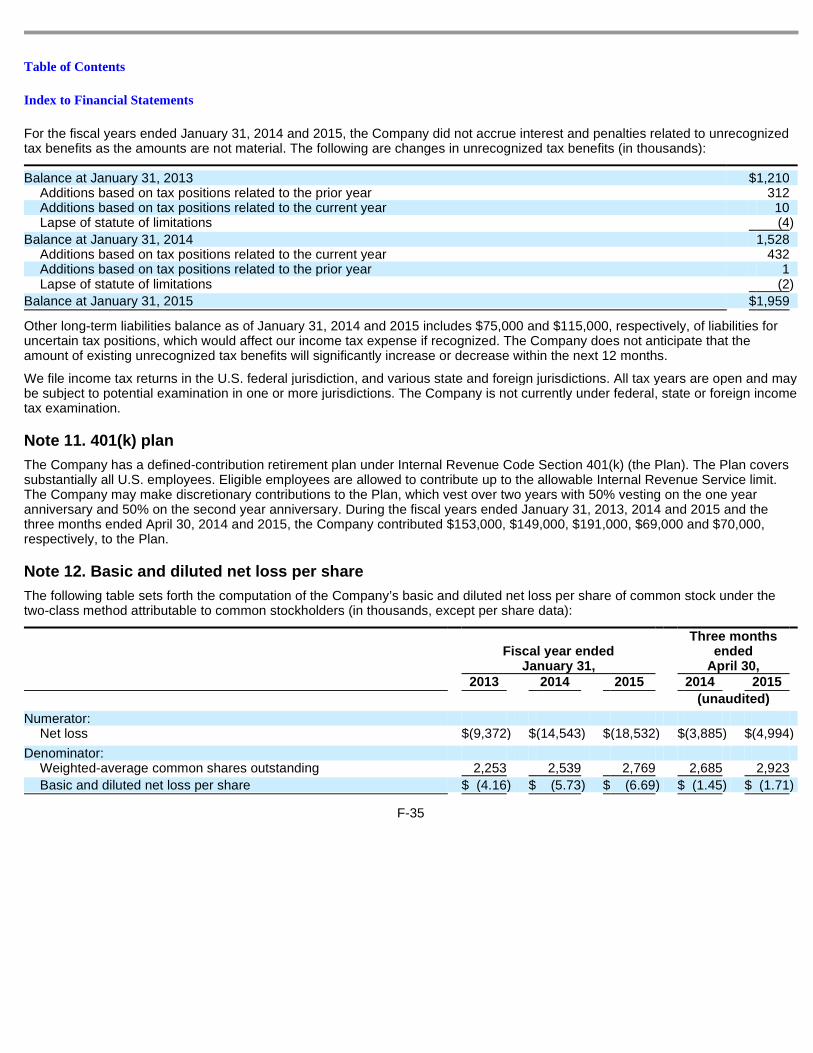
Table of Contents
Index to Financial Statements
For the fiscal years ended January 31, 2014 and 2015, the Company did not accrue interest and penalties related to unrecognized tax benefits as the amounts are not material. The following are changes in unrecognized tax benefits (in thousands):
Other long-term liabilities balance as of January 31, 2014 and 2015 includes $75,000 and $115,000, respectively, of liabilities for uncertain tax positions, which would affect our income tax expense if recognized. The Company does not anticipate that the amount of existing unrecognized tax benefits will significantly increase or decrease within the next 12 months.
We file income tax returns in the U.S. federal jurisdiction, and various state and foreign jurisdictions. All tax years are open and may be subject to potential examination in one or more jurisdictions. The Company is not currently under federal, state or foreign income tax examination.
Note 11. 401(k) plan
The Company has a defined-contribution retirement plan under Internal Revenue Code Section 401(k) (the Plan). The Plan covers substantially all U.S. employees. Eligible employees are allowed to contribute up to the allowable Internal Revenue Service limit. The Company may make discretionary contributions to the Plan, which vest over two years with 50% vesting on the one year anniversary and 50% on the second year anniversary. During the fiscal years ended January 31, 2013, 2014 and 2015 and the three months ended April 30, 2014 and 2015, the Company contributed $153,000, $149,000, $191,000, $69,000 and $70,000, respectively, to the Plan.
Note 12. Basic and diluted net loss per share
The following table sets forth the computation of the Company’s basic and diluted net loss per share of common stock under the two-class method attributable to common stockholders (in thousands, except per share data):
F-35
Balance at January 31, 2013 $ 1,210 Additions based on tax positions related to the prior year 312 Additions based on tax positions related to the current year 10 Lapse of statute of limitations (4 )
Balance at January 31, 2014 1,528 Additions based on tax positions related to the current year 432 Additions based on tax positions related to the prior year 1 Lapse of statute of limitations (2 )
Balance at January 31, 2015 $ 1,959
Fiscal year ended January 31,
Three months ended
April 30,
2013 2014 2015 2014 2015
(unaudited)
Numerator:
Net loss $ (9,372 ) $ (14,543 ) $ (18,532 ) $ (3,885 ) $ (4,994 )
Denominator:
Weighted-average common shares outstanding 2,253 2,539 2,769 2,685 2,923
Basic and diluted net loss per share $ (4.16 ) $ (5.73 ) $ (6.69 ) $ (1.45 ) $ (1.71 )
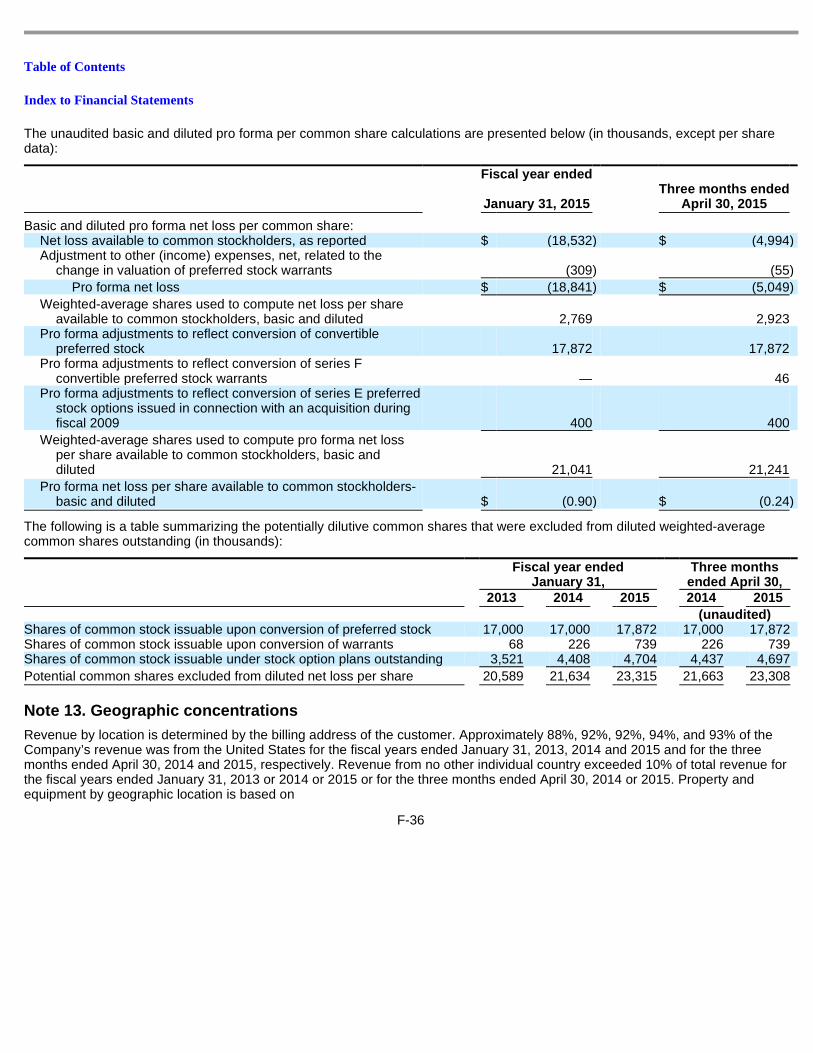
Table of Contents
Index to Financial Statements
The unaudited basic and diluted pro forma per common share calculations are presented below (in thousands, except per share data):
The following is a table summarizing the potentially dilutive common shares that were excluded from diluted weighted-average common shares outstanding (in thousands):
Note 13. Geographic concentrations
Revenue by location is determined by the billing address of the customer. Approximately 88%, 92%, 92%, 94%, and 93% of the Company’s revenue was from the United States for the fiscal years ended January 31, 2013, 2014 and 2015 and for the three months ended April 30, 2014 and 2015, respectively. Revenue from no other individual country exceeded 10% of total revenue for the fiscal years ended January 31, 2013 or 2014 or 2015 or for the three months ended April 30, 2014 or 2015. Property and equipment by geographic location is based on
F-36
Fiscal year ended
January 31, 2015
Three months ended April 30, 2015
Basic and diluted pro forma net loss per common share:
Net loss available to common stockholders, as reported $ (18,532 ) $ (4,994 ) Adjustment to other (income) expenses, net, related to the
change in valuation of preferred stock warrants (309 ) (55 )
Pro forma net loss $ (18,841 ) $ (5,049 )
Weighted-average shares used to compute net loss per share available to common stockholders, basic and diluted 2,769 2,923
Pro forma adjustments to reflect conversion of convertible preferred stock 17,872 17,872
Pro forma adjustments to reflect conversion of series F convertible preferred stock warrants — 46
Pro forma adjustments to reflect conversion of series E preferred stock options issued in connection with an acquisition during fiscal 2009 400 400
Weighted-average shares used to compute pro forma net loss per share available to common stockholders, basic and diluted 21,041 21,241
Pro forma net loss per share available to common stockholders-basic and diluted $ (0.90 ) $ (0.24 )
Fiscal year ended January 31,
Three months ended April 30,
2013 2014 2015 2014 2015
(unaudited)
Shares of common stock issuable upon conversion of preferred stock 17,000 17,000 17,872 17,000 17,872 Shares of common stock issuable upon conversion of warrants 68 226 739 226 739 Shares of common stock issuable under stock option plans outstanding 3,521 4,408 4,704 4,437 4,697
Potential common shares excluded from diluted net loss per share 20,589 21,634 23,315 21,663 23,308
Table of Contents
Index to Financial Statements
the location of the legal entity that owns the asset. As of January 31, 2014 and 2015, and as of April 30, 2015, more than 95% of the Company’s property and equipment was located in the United States.
Note 14. Related party transactions
The Company has a vendor and a customer relationship with a software company that has an executive on the Company’s board of directors. This software company provides software to the Company that allows the transfer of data between the Company’s products. For the fiscal years ended January 31, 2013, 2014 and 2015, the Company licensed software from this related party for approximately $155,000, $255,000 and $118,000, respectively, and billed this related party approximately $402,000, $441,000 and $921,000, respectively. For the three months ended April 30, 2014 and 2015, the Company had no payments for licensed software from this related party and billed this related party approximately $4,000 and $3,000, respectively. Amounts payable to and receivable from this related party were de minimus for all periods presented.
Note 15. Subsequent events
The Company has evaluated subsequent events from the most recent balance sheet date through June 11, 2015.
(a) Reverse Stock Split
On June 5, 2015, the Company’s Board approved a four-to-one reverse stock split of its common stock and convertible preferred stock (collectively referred to as “Capital Stock”). On June 11, 2015, the reverse stock split was approved by the stockholders and became effective. On the effective date of the reverse stock split, (i) each four shares of outstanding Capital Stock were exchanged and combined into one share of Capital Stock of the same class and series, as applicable; (ii) the number of shares of Capital Stock into which each outstanding warrant or option to purchase Capital Stock is exercisable was proportionately reduced on a four-to-one basis; and (iii) the exercise price of each outstanding warrant or option to purchase Capital Stock was proportionately increased on a four-to-one basis. All of the share and per share amounts in these consolidated financial statements and footnotes have been adjusted to reflect the four-to-one reverse stock split.
(b) XactlyOne Foundation
In May 2015, the Company established the XactlyOne Foundation as a non-profit organization and issued it 50,000 shares of the Company’s common stock. The proposed programs of the XactlyOne Foundation include grants, volunteerism and other projects. The Company will recognize a non-cash expense in the quarter ending July 31, 2015 equal to the fair value of the shares of the Company’s common stock issued to the XactlyOne Foundation on the date of issuance.
F-37
Table of Contents
Index to Financial Statements
Xactly® Inspire PerformanceTM
Table of Contents
Index to Financial Statements
7,037,500 shares
Common stock
Prospectus
June 25, 2015
J.P. Morgan Deutsche Bank Securities
UBS Investment Bank Needham & Company Oppenheimer & Co.