Solving Unknown Structures Using NMR Organic Structure Analysis, Crews, Rodriguez and Jaspars.

proteinsSTRUCTURE O FUNCTION O BIOINFORMATICS
X-ray vs. NMR structures as templates forcomputational protein designMichael Schneider, Xiaoran Fu,y and Amy E. Keating*
MIT Department of Biology, 77 Massachusetts Avenue, Cambridge, Massachusetts 02139
INTRODUCTION
Protein design was cast in 1983 as an ‘‘inverted’’ folding problem
by Pabo, who discussed how finding sequences compatible with a
given structure might be easier than predicting how a sequence folds.1
The inverted folding problem requires identifying combinations of
amino acids that fit well onto a designated structural template, similar
to solving a complex and combinatorial molecular jigsaw puzzle. In
the 1990s, this approach to protein design was rendered practical for
real problems by the advent of powerful algorithms and fast com-
puters.2–4 Since that time, many experimentally validated examples
have shown that not only folds but also functions can be encoded in
protein sequences rationally using such procedures.4–14
Despite very significant progress, many basic questions related to
computational protein-design methodology remain. One important
issue is how to choose a structural template for the target.8,11,15
Building a target structure from scratch (de novo protein design) has
been successful in a few cases,10,11,13,16 but a much more common
approach is to use an existing high-resolution structure. This guaran-
tees that the target backbone is ‘‘designable,’’ that is, that at least one
sequence exists that will adopt the desired structure.
Most protein-design studies have used high-resolution crystal struc-
tures as templates.5,6,8,17–19 In only a few examples have nuclear
magnetic resonance (NMR) structures been used, and even fewer of
these examples have been experimentally characterized.20,21 Yet the
number of structures solved by NMR in the protein data bank
(PDB)22 has significantly increased over the last 10 years, and a rela-
tively small fraction of all NMR structures are also solved by X-ray
crystallography. This means that for many possible design candidates,
only NMR templates are available.
Beyond expanding the range of accessible protein targets, there
could be other advantages to using NMR structures for design. Solu-
tion structures are free of artifacts from crystal packing interactions,
and NMR structural ensembles that result from refinement, in con-
trast to the single structures from X-ray studies, may also provide a
way to account for backbone flexibility in protein design. Backbone
Additional Supporting Information may be found in the online version of this article.
Grant sponsor: The German National Academic Foundation; Grant sponsor: NIH; Grant number:
GM084181; Grant sponsor: NSF (equipment award); Grant number: 0216437.yPresent address: Monsanto Company, GG3E, 700 Chesterfield Pkwy West, Chesterfield, MO 63017.
*Correspondence to: A. E. Keating, MIT Department of Biology, 77 Massachusetts Avenue, Cambridge,
MA 02139. E-mail: [email protected].
Received 25 November 2008; Revised 3 March 2009; Accepted 9 March 2009
Published online 19 March 2009 in Wiley InterScience (www.interscience.wiley.com).
DOI: 10.1002/prot.22421
ABSTRACT
Certain protein-design calculations involve
using an experimentally determined high-reso-
lution structure as a template to identify new
sequences that can adopt the same fold. This
approach has led to the successful design of
many novel, well-folded, native-like proteins.
Although any atomic-resolution structure can
serve as a template in such calculations, most
successful designs have used high-resolution
crystal structures. Because there are many pro-
teins for which crystal structures are not avail-
able, it is of interest whether nuclear magnetic
resonance (NMR) templates are also appropri-
ate. We have analyzed differences between
using X-ray and NMR templates in side-chain
repacking and design calculations. We
assembled a database of 29 proteins for which
both a high-resolution X-ray structure and an
ensemble of NMR structures are available.
Using these pairs, we compared the rotameric-
ity, v1-angle recovery, and native-sequence re-
covery of X-ray and NMR templates. We car-
ried out design using RosettaDesign on both
types of templates, and compared the energies
and packing qualities of the resulting struc-
tures. Overall, the X-ray structures were better
templates for use with Rosetta. However, for
�20% of proteins, a member of the reported
NMR ensemble gave rise to designs with simi-
lar properties. Re-evaluating RosettaDesign
structures with other energy functions indi-
cated much smaller differences between the
two types of templates. Ultimately, experiments
are required to confirm the utility of particular
X-ray and NMR templates. But our data sug-
gest that the lack of a high-resolution X-ray
structure should not preclude attempts at
computational design if an NMR ensemble is
available.
Proteins 2009; 77:97–110.VVC 2009 Wiley-Liss, Inc.
Key words: side-chain packing; native-sequence
recovery; v-angle recovery; packing quality.
VVC 2009 WILEY-LISS, INC. PROTEINS 97

flexibility has been shown to be important for increasing
the diversity of designed sequences.8,23
It is not obvious, however, that NMR structures provide
suitable templates for current protein-design methods, which
have been developed primarily for use with X-ray structures.
Many people have suggested that NMR ensembles, which
represent sets of structures consistent with measured con-
straints and stereochemical principles, are less accurate and
precise than structures arising from high-resolution X-ray
diffraction experiments.24–26 A study comparing the use of
NMR and X-ray structures as starting points for molecular
dynamics simulations found NMR derived structures to be
less stable.27 And Lee et al. observed in molecular mechan-
ics-Poisson/Boltzmann calculations that NMR structures of
water soluble proteins were energetically less favorable than a
significant number of structural decoys, in contrast to results
obtained using X-ray structures.28 Finally, Kuhlman et al.
reported that protein-design results obtained from NMR
templates using Rosetta gave higher design energies and
lower sequence recoveries than X-ray templates.29 A compli-
cating issue is that the validation of NMR structure quality is
difficult. There is no equivalent of the Rfree value that is used
to measure the agreement between the experimental data
and the modeled structure in X-ray crystallography.30,31
Although several groups have proposed methods to assess
NMR goodness-of-fit,32–35 there is still no metric that is
generally accepted and widely applied.
Here, we explore whether NMR structures are likely to
be suitable as templates for protein design. Although this
question can only be answered definitively by carrying out
large numbers of experiments, NMR structures can be
compared with X-ray structures in terms of their behavior
in tests related to protein-design calculations. We used X-
ray structures as a standard because of their demonstrated
utility in large numbers of published design studies. For
our analyses, we compiled 29 proteins with structures
solved by both high-resolution X-ray crystallography and
NMR. We analyzed the side-chain conformations of these
structures and compared the behavior of NMR and high-
resolution X-ray structures in side-chain repacking calcula-
tions. Then, we designed sequences using RosettaDesign
on both types of templates to probe the ‘‘designability’’ of
NMR templates. Our results suggest that X-ray structures
provide better templates when using Rosetta but that
NMR ensemble members may also be suitable for use in
real design applications for a subset of structures.
RESULTS
A test set of X-ray/NMR structure pairsfor comparison using discreteconformational modeling
We compiled the set of 29 X-ray/NMR structure pairs
shown in Table I as described in the Methods. The tested
proteins all have X-ray structures with resolution �2.0 A,
and range in length from 90 to 226 residues. In each
case, an ensemble of NMR-derived structures with
between 10 and 45 members is available. We used the
protein structure validation software suite36 to compute
quality scores based on PROCHECK,37 PROCHECK
NMR,38 and MolProbity.39 Results were reported as
Z-scores relative to values for high-resolution X-ray
structures. Z-scores of large magnitude indicate high
deviations from expected structural properties. All native
structures were evaluated and additionally, before evalua-
tion, all structures were subjected to a brief minimization
procedure to regularize stereochemistry according to the
CHARMM param19 force field (referred to as C-RELAX,
see Methods). The quality scores before and after mini-
mization are in Table II.
PROCHECK and PROCHECK_NMR assess the molec-
ular geometries of main-chain bond lengths, bond angles,
and dihedral angles. The 29 test-set X-ray-structure PRO-
CHECK Z-scores ranged from 21.46 to 2.46, with an
average of 20.06. This confirms the overall good stereo-
chemical quality of the X-ray structures in our test set.36
The relaxed X-ray structures had a similar average
Z-score of 20.25. PROCHECK Z-scores for NMR struc-
tures ranged from 27.59 to 2.12 with an average of
22.67. This is similar to the mean Z-score for NMR
structures reported in a large-scale test by Bhattacharya
et al.36 Seven of our 29 NMR structures had PROCHECK
Z-scores < 24, indicating unfavorable backbone confor-
mations, but relaxation improved the average over all
NMR structures to 21.04, with only one relaxed structure
still giving a PROCHECK Z-score < 24 (1AEL).
MolProbity is used to detect unfavorable contacts and
atomic overlaps within protein structures.39 The MolPro-
bity Z-scores for the X-ray structures in the test set
ranged from 29.66 to 1.06, with an average of 20.67,
suggesting that there are only minor clashes in the high-
resolution structures. Minimization removes most of the
clashes, as reflected by the range of 0.23–1.27 (mean 50.83) for the minimized structures. The NMR set has
numerous structures with extremely low MolProbity
Z-scores (239.05 to 1.45, mean 5 29.84), but the aver-
age Z-score for relaxed NMR structures, 0.17, falls in the
range expected for high-resolution crystal structures.
We also examined the backbone hydrogen bonds
formed in the different structures. Garbuzynskiy et al.
have demonstrated backbone hydrogen bonding differen-
ces between X-ray and NMR structures.40 Using the
metric proposed by Ramelot et al. for backbone hydro-
gen-bond coincidence,41 we found an average of 65.2%
coincidence between X-ray and NMR structures for our
structure set, which was improved to 70.2% following
C-RELAX minimization.
Overall, when compared with the values reported by
Bhattacharya et al.,36 the quality of our test set of X-ray
and NMR structures agrees well with the average scores
of a larger number of structures. Also, a small amount of
M. Schneider et al.
98 PROTEINS

relaxation via minimization improves the quality of both
X-ray and NMR structural templates.
For each structure pair, we selected two different clus-
ters of residues: a buried cluster of 14–43 residues and a
surface cluster of 7–25 residues. For many applications, it
is common to redesign a relatively small fraction of the
total protein sequence (e.g., in design of a binding site or
engineering of protein mutants with higher thermostabil-
ities).42 Buried clusters were chosen to reduce the influ-
ence of crystal packing on native-v1-angle and native-
sequence recovery, and to allow the comparison of more
accurate side-chain repacking results. Energy functions
used in design calculations typically perform better when
satisfying packing constraints of the protein core as
opposed to modeling solvent interactions and electro-
statics on the surface. And core designs tend to give rela-
tively high native-sequence recoveries, which were used
in this work to assess candidate templates. For these rea-
sons, most analyses in this work were carried out using
only the buried clusters. However, because some applica-
tions may require the design of surface sites, surface clus-
ters were included for selected comparisons (where ex-
plicitly noted). The design of surface-residue clusters
does not reflect expected performance in problems such
as protein interface design, or enzyme active site design,
because the presence of a protein partner or substrate
will introduce significant additional constraints.
Both buried and surface clusters were chosen from core
regions of the test-set structures as defined using the pro-
gram FindCore.25 Core regions have only a small amount
of coordinate variation between NMR ensemble members
and thus identify those parts of the protein that are best
defined by an NMR experiment. For example, the average
pairwise backbone RMSD for the buried design cluster res-
idues was <1.1 A for all but two NMR structures.
NMR ensembles contain highlyrotameric structures
We investigated the side-chain configuration of the
NMR structures when compared with their X-ray coun-
Table ITest Set of X-ray/NMR Structure Pairs Used for Comparison Calculations
PDB ID
X-rayResolution (�)
Number ofNMR structures Residues
Core residuesa Cluster sites
X-ray NMRNumber of
core residuesFraction of
total residuesNumber of
cluster residuesFraction of
total residues
1AGI 1GIO 1.5 10 125 76 0.61 27 0.221BED 2IJY 2.0 22 181 81 0.45 43 0.241BP2 1BVM 1.7 20 123 65 0.53 26 0.211C44 1QND 1.5 20 123 71 0.58 25 0.201CHN 1DJM 1.78 27 126 66 0.52 28 0.221EKG 1LY7 1.8 15 119 71 0.60 28 0.241FKJ 1FKR 1.7 20 102 58 0.57 21 0.211GNU 1KOT 1.75 15 117 57 0.49 28 0.241GPR 1AX3 1.9 16 158 83 0.53 38 0.241GSV 3PHY 1.75 26 122 65 0.53 26 0.211HCV 1G9E 1.85 20 116 56 0.48 34 0.291IFB 1AEL 1.96 20 131 67 0.51 30 0.231IFR 1IVT 1.4 15 111 64 0.58 30 0.271J2A 1CLH 1.8 12 159 80 0.50 37 0.231JF4 1VRE 1.4 29 140 79 0.56 34 0.241KF5 2AAS 1.15 32 124 70 0.56 30 0.241KM8 1BC4 1.9 15 105 55 0.52 17 0.161LDS 1JNJ 1.8 20 97 48 0.49 25 0.261MG4 1UF0 1.5 20 101 46 0.46 21 0.211OPC 2JPB 1.95 20 99 67 0.68 19 0.191RRO 2NLN 1.3 20 108 53 0.49 19 0.181UOH 1TR4 2.0 20 223 81 0.36 43 0.191WHO 1BMW 1.9 38 89 55 0.62 22 0.251YV6 1PU3 1.78 20 103 70 0.68 17 0.172CWR 2CZN 1.7 38 97 53 0.55 27 0.282E1F 2DGZ 2.0 20 94 42 0.45 16 0.172GRC 2H60 1.5 11 105 50 0.48 14 0.132SAK 1SSN 1.8 20 121 68 0.60 29 0.242V75 2JPS 1.8 45 89 45 0.51 17 0.19
Min 1.15 10 89 42 0.36 14 0.13Max 2.0 45 223 83 0.68 43 0.29Mean 1.72 21.59 120.97 63.52 0.53 26.59 0.22Std. dev. 0.22 8.18 29.07 11.86 0.07 7.76 0.04
aAs defined by FindCore.25
NMR vs. X-ray Templates for Protein Design
PROTEINS 99

terparts by evaluating the ‘‘rotamericity’’ of each struc-
ture. Rotamer libraries compile statistics describing side-
chain conformations in high-quality structures in the
PDB, and analysis of such libraries shows that most side
chains exhibit strong v1 and v2 preferences. Most
rotamer libraries, including the one that we used, are
derived using X-ray, not NMR, structures.43 A side-chain
conformation was defined as ‘‘rotameric’’ in this study if
its v1 value was within 408 of a member of the rotamer
library, using the minimized structures described above
and in the Methods (method C-RELAX). The rotameric-
ity of a cluster was defined as the percentage of design-
cluster sites that were rotameric. The rotamericity of a
structure may be important for protein design because if
a residue adopts a nonrotameric conformation, it may
not be possible to fit even the native amino acid into its
appropriate position in the structure.
The v1 rotamericity for the test-set X-ray structures
was high: 100% for 19 of 29 structures and higher than
90% for all but one example, indicating that only one or
two design-site v1 rotamers were not represented in the
rotamer library. When compared with the X-ray set, the
average rotamericity of the NMR structures was lower
(97.3% for X-ray vs. 91.9% for NMR). The average dif-
ference in rotamericity with respect to the X-ray struc-
ture, for all members within each NMR ensemble, is
shown in Figure 1(a). Only seven NMR structures
showed higher average rotamericities. However, most (27
of 29) NMR ensembles included at least one structure
with 90% rotamericity or higher, and in all cases an en-
semble member that was at least as rotameric as the X-
ray structure was identified [Fig. 1(b)]. Thus, although
NMR structures are less rotameric on average, highly
rotameric templates can nevertheless be identified.
Table IIPROCHECK and MolProbity Z-Scores for the Test Set, Before and After Minimizing the Structures
Quality
No minimization Minimized structures
PDB ID PROCHECK MolProbity PROCHECK MolProbityH2bond
coincidenceaX-ray NMR X-ray NMRa X-ray NMRa X-ray NMRa X-ray NMRa
1AGI 1GIO 20.87 22.28 0.58 1.31 20.98 21.22 0.84 0.49 0.611BED 2IJY 0.43 0.94 0.02 222.37 0.83 0.9 0.74 20.14 0.821BP2 1BVM 1.18 20.43 21.46 28.61 0.67 0.28 0.23 0.32 0.791C44 1QND 20.55 22.32 29.66 20.14 20.63 21.49 0.43 0.37 0.631CHN 1DJM 0.71 20.31 0.91 0.24 0.75 0.59 1.18 0.32 0.701EKG 1LY7 0.28 23.5 20.89 25 20.24 21.53 0.88 0.6 0.701FKJ 1FKR 20.55 24.8 1.09 23.49 -1.49 21.22 0.98 0.89 0.771GNU 1KOT 0.35 23.03 20.56 217.79 0.04 20.39 0.92 0.23 0.801GPR 1AX3 21.26 23.54 20.71 0.51 21.61 22.95 1.02 0.11 0.661GSV 3PHY 20.35 23.78 20.31 220.53 20.59 20.47 0.88 20.09 0.711HCV 1G9E 21.22 23.82 21.16 28.41 21.53 22.12 0.62 20.03 0.731IFB 1AEL 21.18 27.59 24.57 231.53 21.18 24.48 0.88 21.43 0.491IFR 1IVT 21.46 23.54 21.17 21.84 20.98 22.36 0.63 20.23 0.671J2A 1CLH 21.22 27.12 21.1 239.06 21.61 21.34 0.82 20.28 0.611JF4 1VRE 2.24 20.34 0.84 213.98 2.32 1.57 1.27 0.03 0.781KF5 2AAS 20.2 21.38 0.51 21.91 20.35 20.87 0.69 0.03 0.751KM8 1BC4 20.83 24.52 20.88 27.85 21.49 22.87 0.8 0.08 0.641LDS 1JNJ 21.1 23.89 0.22 0.38 21.22 22.64 1.2 0.09 0.571MG4 1UF0 20.94 22.32 0.57 20.97 1.18 21.61 0.83 0.83 0.651OPC 2JPB 20.43 22.83 23.57 29.29 21.26 20.16 1.1 0.39 0.741RRO 2NLN 1.65 21.89 0.58 222.11 1.06 21.18 1.21 20.82 0.591UOH 1TR4 0.9 0 0.1 213.06 0.67 0.55 0.71 0.02 0.781WHO 1BMW 20.71 26.57 0.78 27.14 21.3 21.97 0.78 0.55 0.591YV6 1PU3 20.63 22.08 21.53 24.19 21.02 21.46 0.27 20.01 0.882CWR 2CZN 21.42 24.09 20.02 232.74 21.57 22.36 0.69 0.16 0.762E1F 2DGZ 1.46 21.69 0.14 25.4 1.18 0.75 0.83 0.6 0.862GRC 2H60 2.01 1.38 0.83 22.31 1.65 1.3 0.95 0.72 0.792SAK 1SSN 20.59 24.13 0.74 1.45 20.98 23.27 0.83 0.49 0.602V75 2JPS 2.64 2.12 0.16 29.45 2.4 1.89 0.9 0.6 0.86
Min 21.46 27.59 29.66 239.06 21.61 24.48 0.23 21.43 0.49Max 2.64 2.12 1.09 1.45 2.4 1.89 1.27 0.89 0.88Mean 20.06 22.67 20.67 29.84 20.25 21.04 0.83 0.17 0.71Std. dev. 1.19 2.37 2.16 11.04 1.25 1.57 0.25 0.48 0.10
aValues for NMR structures are averages over members of the ensemble.
M. Schneider et al.
100 PROTEINS

Many NMR ensembles contain structuresthat perform well in side-chainrepacking tests
Repacking of side chains, that is, selecting the best
rotamer for each residue at each site, given a fixed
sequence, is a key step in almost every computational
protein design algorithm. Good design protocols applied
to good structural templates should recognize that the
native sequence fits well on its own backbone, using
mostly native-like rotamers for buried residues. We used
two different protocols to assess repacking of native
sequences on CHARMM-based prerelaxed X-ray and
NMR backbones (C-RELAX, see Methods) in the test set.
The first was a CHARMM-based approach that used
dead-end elimination search, similar to that used by Ali
et al.5 The second was the widely used program Rosetta-
Design.11 We judged repacking performance using v1-
angle recovery and compared energies for re-packing
NMR templates to re-packing X-ray templates.
Native v1-angle recovery was high on X-ray templates:
23 out of the 29 X-ray structures gave better than 90%
v1 recovery, four X-ray structures had recovery rates
�80% and two structures performed below 80%. Differ-
ences between X-ray and NMR performance are shown
in Figure 1, panels (c–f). Using either CHARMM-based
or RosettaDesign methods, v1 recovery averaged over
NMR backbones in an ensemble was worse than that for
X-ray templates for most structure pairs. As in the rota-
mericity analysis, however, an NMR template with v1 re-
covery close to the X-ray template was found for many
structure pairs. The results varied according to which
repacking method was used. In both cases [Fig. 1(d,f)],
NMR templates could be identified that gave equivalent
or higher v1 recovery than the X-ray template; there were
Figure 1Side-chain repacking performance on X-ray and NMR templates. In panels (a, c, and e) performance on the X-ray template is compared to the
average performance over all NMR templates in the corresponding ensemble. In panels (b, d, and f) performance on the X-ray template is
compared to performance on the best-performing NMR template. (a) and (b) Differences in rotamericity between X-ray and NMR templates (see
text). Values are positive for pairs in which the X-ray structure is better described using the rotamer approximation. (c–f) Recovery of the v1 anglein the structure upon re-packing the entire cluster. For (c) and (d), repacking was done using the CHARMM-based energy function. For (e) and
(f), repacking was done using RosettaDesign.
NMR vs. X-ray Templates for Protein Design
PROTEINS 101

22 such test-set examples using the CHARMM method
and 15 using Rosetta (13 of which overlapped). Rosetta
exhibits a greater preference than the CHARMM proce-
dure for the X-ray structure.
Repacking energies are shown in Figure 2, where the
energy obtained using the X-ray structure is plotted
against the energy for each NMR ensemble structure.
There is a significant difference between repacking meth-
ods. Using the CHARMM-based protocol, the repacked
energies for most NMR structures were higher than the
corresponding X-ray energy. However, for 17 out of 29
structure pairs, the lowest energy NMR solution provided
a lower energy than its X-ray counterpart. In contrast,
Rosetta showed a greater preference for X-ray templates.
The spread of the NMR repacking energies was very large
for some ensembles [Fig. 2(b)], suggesting that most of
the NMR ensemble members could not accommodate
the native sequence well using the approximations of
RosettaDesign. Excluding two structure pairs where
Rosetta gave extremely large, unrealistic data for the
X-ray templates [see Fig. 2(b)], only 7 of the test-set
examples included an NMR template that gave an energy
less than 2 kcal/mol greater than that for the X-ray tem-
plate. Here, and below, the arbitrary choice of a 2 kcal/
mol cutoff is intended to capture those NMR designs
that are ‘‘better than or almost as good as’’ an X-ray
design. The trends in the results are not highly sensitive
to choice of cutoff in the 0–4 kcal/mol range.
In an attempt to better fit the native sequences onto
their own native templates using Rosetta, we replaced the
C-RELAX CHARMM-based prerelaxation procedure with
one guided by the Rosetta energy function (R-RELAX,
see Methods). However, this still left several X-ray tem-
plate models with very high energies, and also large
energy ranges for the NMR ensembles. The R-RELAX
procedure reduced the preference of Rosetta for the X-
ray templates, to an average difference of just 21.6 �24.4 kcal/mol (when two structures with very high X-ray
energies were excluded from the analysis). There were 11
out of 27 examples where the lowest-energy NMR model
was no more than 2 kcal/mol higher in energy than the
X-ray model.
Rosetta gives lower energy designs for X-raytemplates than for most NMR templates
Because of the computational demands of treating 655
templates, only the computationally less expensive Rosetta-
Design method was used for design calculations. Sequences
designed using Rosetta were also evaluated using other
energy functions. Templates were prepared as for repack-
ing, using the C-RELAX or R-RELAX procedures, and
amino acids for all design-cluster sites were selected from
an alphabet of 18 residues. Both C-RELAX and R-RELAX
calculations gave similar results and showed a strong pref-
erence for the X-ray template over most NMR ensemble
members, but a quite modest average preference for X-ray
structures over the best available NMR template (Table
III). For 6 or 9 examples (R-RELAX and C-RELAX, respec-
tively), NMR templates provided a design within 2 kcal/
mol of the X-ray design [Fig. 3(a,b)].
The RosettaDesign package has recently been expanded
to allow iterative optimization of sequence and structure.
This has proven effective in a number of applica-
tions11,44,45 and could make calculations less sensitive
to the quality of the input structure. We used iterative
sequence-structure optimization (R-ITER, see Methods)
with the X-ray and NMR structures as starting geome-
tries for the calculations summarized in Figure 3(c).
Interestingly, this made the range of the design energies
Figure 2Energies of repacked X-ray vs. NMR structures. CHARMM (a) or
Rosetta (b) were used to repack all clusters for all templates. Templates
were prepared using the C-RELAX procedure. Repacking results using
RosettaDesign with R-RELAX relaxed structures are depicted in panel
(c). Repacking energies on NMR templates are plotted as a function of
the repacking energy on the X-ray template, for each pair. Unreasonably
high-energy outliers (highest 5 % of all energies) are not plotted for the
sake of clarity. [Color figure can be viewed in the online issue, which is
available at www.interscience.wiley.com.]
M. Schneider et al.
102 PROTEINS

significantly smaller and eliminated outliers, but did not
alter the overall trends. The lowest energy NMR design
was within 2 kcal/mol of the X-ray design for seven
examples. Iterative sequence-structure optimization
should significantly expand the accessible sequence and
structure space. The fact that our R-ITER derived designs
are not much lower in energy may be due to the limited
number of runs (10 per template) used. A more extensive
search (100 runs) for one selected protein suggests that
lower energy designs can be found by more extensive
sampling, especially on the NMR template, for which
there were larger fluctuations in energy throughout the
simulation (data not shown).
The design calculations were repeated for the surface
clusters, giving results that showed similar trends but
gave better relative performance of the NMR structures
when compared with the X-ray templates. Tables III and
IV summarize the results. Although the spread of the
design energies within an NMR ensemble remained large
(several tens of kcal/mol in most cases), the lowest
energy NMR design and the X-ray design were closer in
energy, on average, than for buried clusters. A greater
fraction of NMR designs have energies not above 2 kcal/
mol of the X-ray design (C-RELAX: 13 out of 29; R-
RELAX: 14 out of 27; R-ITER: 16 out of 27). It seems
reasonable that surface designs would be less sensitive to
the detailed structure of the template, as the potential for
bad interactions is much lower.
The systematic preference for X-ray designs over most
NMR designs could be due to the energy function used
in RosettaDesign. To explore this, we re-evaluated the
Rosetta-designed buried clusters using a more physical,
CHARMM-based energy function (see Methods). The
results were very different from the Rosetta results for all
three template-relaxation methods. The CHARMM-based
function frequently predicted NMR-derived designs to
have energies comparable to the corresponding X-ray
designs (for 67 out of 83 total examples, considering all
three design protocols, the best NMR design was no
more than 2 kcal/mol higher than the X-ray, Supporting
Information Figure S1; the corresponding number for
Rosetta was 22 out of 83). Re-evaluation of the designs
Table IIIProperties of Designs on X-ray vs. NMR Templates
MethodAvg. minimum
NMR-X-ray energy differencea
Native-sequence recovery SASApack
X-ray NMR Bestb NMR Average X-ray NMR Besta NMR Average
Buried C-RELAX 6.7 � 7.9 52.9 � 14.2 49.9 � 19.7 36.3 � 13.0 2.7 � 1.5 2.5 � 1.8 4.2 � 1.6R-RELAX 6.6 � 6.8 56.5 � 13.7 58.2 � 15.7 45.6 � 11.4 2.1 � 1.8 2.0 � 1.6 4.5 � 1.8R-ITER 5.6 � 7.1 70.2 � 14.7 61.8 � 13.1 53.2 � 13.1 0.7 � 2.0 0.8 � 1.0 3.2 � 1.6
Surface C-RELAX 2.13 � 4.1 19.9 � 8.8 28.5 � 9.1 16.2 � 6.5 1.07 � 0.5 0.80 � 0.6 1.52 � 0.7R-RELAX 0.17 � 7.9 22.2 � 11.1 34.7 � 9.8 20.8 � 6.7 0.81 � 0.6 0.49 � 0.6 1.42 � 0.6R-ITER 1.12 � 3.5 30.7 � 10.1 38.3 � 9.6 24.1 � 7.4 0.39 � 0.6 0.19 � 0.6 1.00 � 0.6
aThe average of the difference [(lowest-energy-NMR-design)–(X-ray design)] over all structure pairs.bNMR Best refers to the best native-sequence recovery or SASApack score among NMR designs with energies less than 2 kcal/mol above the X-ray design.
Figure 3Design using RosettaDesign on X-ray vs. NMR templates. Backbones
were prepared in varying ways and sequences were designed on each
structure, as described in the text. The design energies from the NMR
templates are plotted as a function of the design energy on the X-ray
template, for each pair. (a) C-RELAX method, (b) R-RELAX method,
(c) R-ITER method. A small number of high-energy outliers are
omitted for clarity (C-RELAX: 16, R-RELAX: 3, R-ITER: 0). [Color
figure can be viewed in the online issue, which is available at
www.interscience.wiley.com.]
NMR vs. X-ray Templates for Protein Design
PROTEINS 103

with the structure-based energy function FOLDEF46 gave
results intermediate between Rosetta and CHARMM,
with 39 out of 83 of the lowest-energy NMR designs sat-
isfying the 2 kcal/mol cutoff (Supporting Information
Fig. S2).
Other metrics suggest that the best NMRtemplates in an ensemble can beappropriate for design
It is not straightforward to interpret the results of Fig-
ure 3 in terms of their likely consequences for actual
designs. Most protein-design energy functions do not
achieve good correlation between predicted and meas-
ured energy differences, and design energy functions are
very sensitive to the definition of the unfolded reference
state.47 This makes it difficult to judge the significance
of energy gaps in absolute terms or to reconcile differen-
ces such as those observed between Rosetta, CHARMM,
and FOLDEF energy evaluations. To partially address
this, we compared two other properties of designs result-
ing from X-ray vs. NMR templates. The frequency with
which the native amino acid is recovered at a design site
is sometimes used as a metric.29,45 High native-sequence
similarity does not guarantee that designs will be of high
quality, but the relative sequence recovery of different
methods and templates can be used as a basis for com-
parison. Another measure is the packing of designed resi-
dues, which can be compared with packing of similar
amino acids in similar environments using the SASApack
metric of Hu et al.44.
It is striking that although template-preparation meth-
ods C-RELAX, R-RELAX, and R-ITER gave very similar
lowest-energy-NMR vs. X-ray energy differences (Table
III), the frequencies of native-sequence recovery were
very different. Using Rosetta to modify the starting tem-
plates with R-REALX or R-ITER led to higher native-
sequence recoveries. This was true for native-sequence re-
covery on the X-ray templates and for the average recov-
ery on all NMR templates. Interestingly, examining the
low-energy NMR designs with the highest native-
sequence recovery showed a trend similar to the X-ray-
template results (the ‘‘NMR best’’ column in Table III
shows the best native-sequence recovery among NMR
designs with energies no more than 2 kcal/mol higher
than the X-ray design, averaged over structure pairs).
These data support the proposition that some low-energy
NMR designs behave similarly to X-ray templates and are
thus probably suitable for use in protein-design applica-
tions.
SASApack data show a similar trend. For this measure,
a larger then average difference (>0) indicates poor pack-
ing due to the existence of small voids that cannot be
filled with water44. Values reported in Table III and
below indicate average packing quality values for all
designed residues. SASApack averaged over all NMR
designs was high when compared with that for the X-ray
designs, for all methods. In fact, the average SASApack
values for both X-ray and NMR designs were greater
than for either the native X-ray or NMR structures
(which were both very low). The design process increases
SASApack values and, because SASApack does not penal-
ize clashes, even the procedure of preparing the templates
for design using a small amount of minimization
increases these values (mean C-RELAX value of 1.45 for
relaxed X-ray templates vs. 0.64 for native X-ray tem-
plates). This indicates that SASApack alone is not a good
measure of structure quality, but as with native-sequence
recovery, it can be used for comparisons.
When compared with the C-RELAX procedure, prepar-
ing structures with the Rosetta energy function (R-
RELAX) improved the packing scores for X-ray derived
designs. Using R-ITER design improved packing further,
achieving values very close to the scores for the
unchanged original PDB X-ray templates. SASApack
scores for NMR structures were poor on average. But the
best packed low-energy NMR structures (‘‘NMR best,’’
Table III) behaved very similarly to the X-ray designs,
again suggesting that these may be good templates.
As expected, the surface clusters gave much lower
native-sequence recoveries than the core clusters. When
compared with surface positions on average, however,
both X-ray and the best NMR surface-design residues
were of good quality, giving low SASApack values (Table
III). Interestingly, although native-sequence recoveries
were low at surface sites, NMR surface clusters gave
higher recoveries than X-ray surface clusters.
Identifying good NMR templates
Among low-energy NMR designs, templates could be
identified that had similar native-sequence recovery and
SASApack scores as the X-ray designs. These are likely
good candidate design templates, but how common are
they? Table IV shows that for only 22–31% of test-set
proteins was an NMR ensemble member identified that
gave an energy comparable to or better than the X-ray
design (using the Rosetta energy function, and depending
on how the structures were relaxed). The table also quan-
tifies how often at least one of the low-energy NMR
designs had X-ray-like native-sequence recovery and/or
SASApack scores. Good NMR templates were not very
common by these criteria.
For real design applications, a slightly different ques-
tion may be of interest: How frequently do NMR ensem-
bles yield designs with high native-sequence recovery and
low SASApack scores that are also low in energy? This is
of interest because native-sequence recovery and SASA-
pack can be evaluated in the absence of an X-ray tem-
plate for energy comparison. Data are given in Table V.
Using Rosetta energies, the frequencies were low (14–
M. Schneider et al.
104 PROTEINS
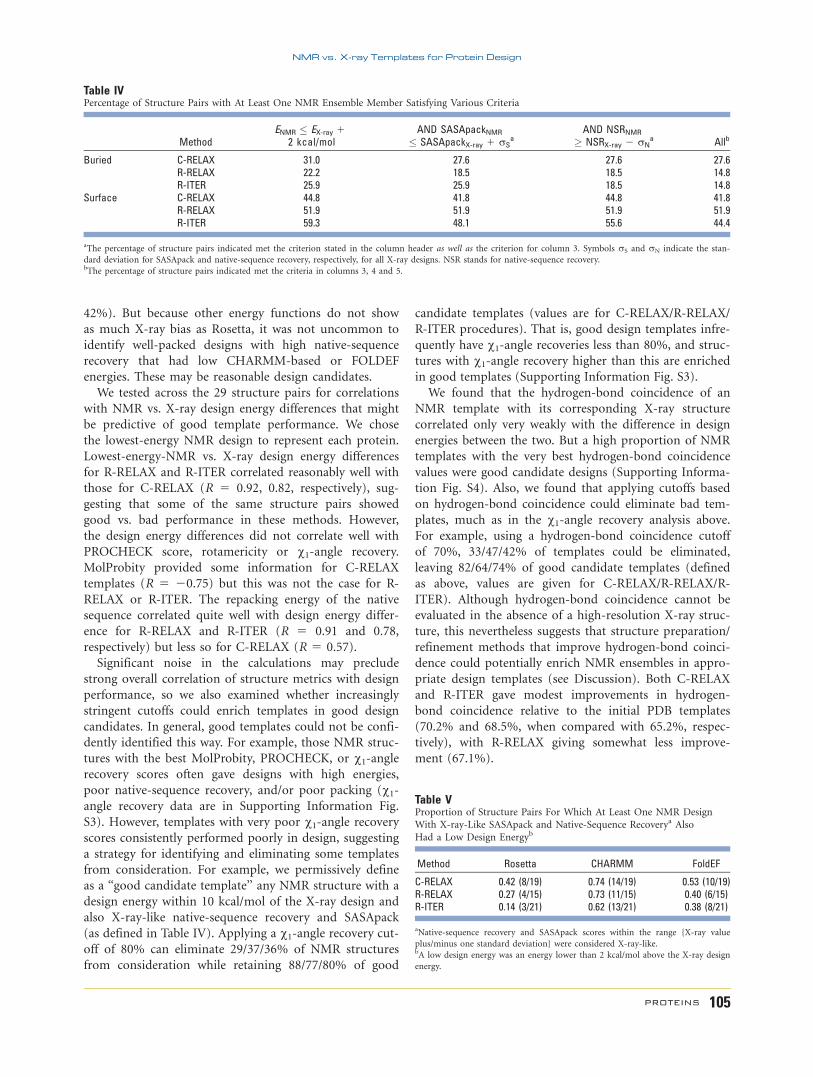
42%). But because other energy functions do not show
as much X-ray bias as Rosetta, it was not uncommon to
identify well-packed designs with high native-sequence
recovery that had low CHARMM-based or FOLDEF
energies. These may be reasonable design candidates.
We tested across the 29 structure pairs for correlations
with NMR vs. X-ray design energy differences that might
be predictive of good template performance. We chose
the lowest-energy NMR design to represent each protein.
Lowest-energy-NMR vs. X-ray design energy differences
for R-RELAX and R-ITER correlated reasonably well with
those for C-RELAX (R 5 0.92, 0.82, respectively), sug-
gesting that some of the same structure pairs showed
good vs. bad performance in these methods. However,
the design energy differences did not correlate well with
PROCHECK score, rotamericity or v1-angle recovery.
MolProbity provided some information for C-RELAX
templates (R 5 20.75) but this was not the case for R-
RELAX or R-ITER. The repacking energy of the native
sequence correlated quite well with design energy differ-
ence for R-RELAX and R-ITER (R 5 0.91 and 0.78,
respectively) but less so for C-RELAX (R 5 0.57).
Significant noise in the calculations may preclude
strong overall correlation of structure metrics with design
performance, so we also examined whether increasingly
stringent cutoffs could enrich templates in good design
candidates. In general, good templates could not be confi-
dently identified this way. For example, those NMR struc-
tures with the best MolProbity, PROCHECK, or v1-anglerecovery scores often gave designs with high energies,
poor native-sequence recovery, and/or poor packing (v1-angle recovery data are in Supporting Information Fig.
S3). However, templates with very poor v1-angle recovery
scores consistently performed poorly in design, suggesting
a strategy for identifying and eliminating some templates
from consideration. For example, we permissively define
as a ‘‘good candidate template’’ any NMR structure with a
design energy within 10 kcal/mol of the X-ray design and
also X-ray-like native-sequence recovery and SASApack
(as defined in Table IV). Applying a v1-angle recovery cut-off of 80% can eliminate 29/37/36% of NMR structures
from consideration while retaining 88/77/80% of good
candidate templates (values are for C-RELAX/R-RELAX/
R-ITER procedures). That is, good design templates infre-
quently have v1-angle recoveries less than 80%, and struc-
tures with v1-angle recovery higher than this are enriched
in good templates (Supporting Information Fig. S3).
We found that the hydrogen-bond coincidence of an
NMR template with its corresponding X-ray structure
correlated only very weakly with the difference in design
energies between the two. But a high proportion of NMR
templates with the very best hydrogen-bond coincidence
values were good candidate designs (Supporting Informa-
tion Fig. S4). Also, we found that applying cutoffs based
on hydrogen-bond coincidence could eliminate bad tem-
plates, much as in the v1-angle recovery analysis above.
For example, using a hydrogen-bond coincidence cutoff
of 70%, 33/47/42% of templates could be eliminated,
leaving 82/64/74% of good candidate templates (defined
as above, values are given for C-RELAX/R-RELAX/R-
ITER). Although hydrogen-bond coincidence cannot be
evaluated in the absence of a high-resolution X-ray struc-
ture, this nevertheless suggests that structure preparation/
refinement methods that improve hydrogen-bond coinci-
dence could potentially enrich NMR ensembles in appro-
priate design templates (see Discussion). Both C-RELAX
and R-ITER gave modest improvements in hydrogen-
bond coincidence relative to the initial PDB templates
(70.2% and 68.5%, when compared with 65.2%, respec-
tively), with R-RELAX giving somewhat less improve-
ment (67.1%).
Table IVPercentage of Structure Pairs with At Least One NMR Ensemble Member Satisfying Various Criteria
MethodENMR � EX-ray 1
2 kcal/molAND SASApackNMR
� SASApackX-ray 1 rSa
AND NSRNMR
� NSRX-ray 2 rNa Allb
Buried C-RELAX 31.0 27.6 27.6 27.6R-RELAX 22.2 18.5 18.5 14.8R-ITER 25.9 25.9 18.5 14.8
Surface C-RELAX 44.8 41.8 44.8 41.8R-RELAX 51.9 51.9 51.9 51.9R-ITER 59.3 48.1 55.6 44.4
aThe percentage of structure pairs indicated met the criterion stated in the column header as well as the criterion for column 3. Symbols rS and rN indicate the stan-
dard deviation for SASApack and native-sequence recovery, respectively, for all X-ray designs. NSR stands for native-sequence recovery.bThe percentage of structure pairs indicated met the criteria in columns 3, 4 and 5.
Table VProportion of Structure Pairs For Which At Least One NMR Design
With X-ray-Like SASApack and Native-Sequence Recoverya Also
Had a Low Design Energyb
Method Rosetta CHARMM FoldEF
C-RELAX 0.42 (8/19) 0.74 (14/19) 0.53 (10/19)R-RELAX 0.27 (4/15) 0.73 (11/15) 0.40 (6/15)R-ITER 0.14 (3/21) 0.62 (13/21) 0.38 (8/21)
aNative-sequence recovery and SASApack scores within the range {X-ray value
plus/minus one standard deviation} were considered X-ray-like.bA low design energy was an energy lower than 2 kcal/mol above the X-ray design
energy.
NMR vs. X-ray Templates for Protein Design
PROTEINS 105

DISCUSSION
In this work, we explored whether NMR structures can
serve as good templates for protein design. Because pro-
tein-design energy functions and procedures are not
highly reliable, it is not possible to answer this defini-
tively without carrying out many experimental tests. In
lieu of this, we evaluated a range of computable metrics
that allowed us to compare the performance of NMR
and X-ray structures. At a minimum, a protein-design
procedure should give reasonable results when modeling
native structures on native templates, and we explored
this using side-chain repacking. An additional require-
ment, necessary but not sufficient for a good template, is
that a design procedure return low-energy sequences
with reasonable structural properties. Applying a range of
criteria to evaluate design energy, native-sequence recov-
ery and packing quality, our tests indicated that NMR
ensemble members are, on average, not as useful as X-
ray structures for design. However, in some cases, one or
more members of an NMR ensemble could be identified
that performed as well as, or better than, a high-quality
X-ray structure of the same protein (Table III). These are
good candidates for testing as protein-design templates.
Our results support the possible utility of NMR struc-
tures, despite an overall strong preference for X-ray tem-
plates when using RosettaDesign. Whether this preference
reflects inherently higher quality or suitability of X-ray
structures for design, or a pro-X-ray bias in RosettaDe-
sign, is difficult to determine. However, a role for bias is
suggested by the much better relative performance of
NMR structures in the CHARMM-based repacking tests,
(Figs. 1 and 2) and in the CHARMM- and FOLDEF-
based re-evaluations of Rosetta designs (Supporting In-
formation Figs. S1 and S2). It is not surprising that
Rosetta exhibits a preference for X-ray structures over
most NMR ensemble members. The rotamer library and
energy function used in RosettaDesign are both parame-
terized using X-ray structures, and the method relies
heavily on statistical terms derived from such structures
in the PDB. The critical reference energies are optimized
by maximizing the frequency with which native residues
are recovered in X-ray structure-based modeling.
We found significant differences in behavior when pre-
paring the template structures in different ways. Prerelax-
ation of the PDB-reported NMR structures consistently
lowered the design energy of NMR templates, when com-
pared with energies obtained on untreated PDB tem-
plates. We recommend that at least this simple procedure
be applied before any use of NMR structures in design
calculations. In contrast, X-ray design energies on native
PDB structures were relatively close to their relaxed-tem-
plate design energies (data not shown). The C-RELAX
protocol involved only a small amount of minimization,
carried out to relieve steric clashes, and it did not change
the structures very much. R-RELAX and R-ITER were
introduced to prepare the structures in accord with the
Rosetta energy function. In particular, R-ITER is a
powerful method in which the template structure can be
continuously updated throughout the design process. An
interesting observation was that these different methods
had little impact on the energy differences between NMR
and X-ray designs, but showed a large effect at the
sequence level. In particular, native-sequence recovery
was higher for the R-RELAX method, and much higher
for the R-ITER methods, than for C-RELAX. Also,
R-ITER stood out because it achieved a low (native-struc-
ture-like) value of SASApack for designs on X-ray tem-
plates and for some low-energy NMR designs, in contrast
to the other methods. Because the results of Rosetta are
nondeterministic, it is appropriate to run a large number
of calculations and evaluate the best results. We found that
NMR design energies using R-ITER fluctuated more than
X-ray design energies across runs (data not shown). Hence,
more R-ITER design simulations per structure might be
required to achieve a low energy sequence-structure com-
bination on an NMR template. This was not tested here
due to the large computational demands.
In the best case, techniques would exist for determin-
ing whether an NMR ensemble is likely to provide a
good design template before calculations are undertaken,
especially in those cases where an X-ray template is not
available. We found that correlations between many dif-
ferent structural metrics and measures of design perform-
ance were weak. In particular, those NMR ensemble
members that gave the lowest energy designs were not
the ones with the highest native-sequence recovery or
lowest SASApack values, suggesting that multiple criteria
must be evaluated to judge the possible utility of an
NMR model. MolProbity scores did correlate moderately
with C-RELAX NMR vs. X-ray design energies, but did
not work well for R-RELAX or R-ITER. One approach to
evaluating a prospective NMR template is to run design
calculations and evaluate the results using metrics such
as native-sequence recovery and SASApack, which can be
compared with what is expected for good X-ray tem-
plates. This can be computationally expensive, especially
when using iterative design, and good sequence recovery
and packing do not indicate that designs will be low in
energy. But we have not yet identified a way to determine
a priori whether reasonable design energies can be
obtained from an input NMR structure.
An alternative is to carry out more extensive premi-
nimization or iterative optimization of the starting NMR
structures. Recent work by Qian et al. and by Ramelot
et al. suggests that NMR structures can be significantly
improved by extensive refinement using Rosetta. In an
analysis of human protein HSPC034, Ramelot et al. gen-
erated 1000 candidate structures for each ensemble mem-
ber, varying both backbone and side-chain positions.
During this optimization, the average hydrogen-bond
coincidence with a high-resolution X-ray structure
M. Schneider et al.
106 PROTEINS

improved from 65 to 71%. Although such a protocol was
too computationally expensive to test extensively in this
study, we did observe that templates that gave high
hydrogen-bond coincidence were enriched in good candi-
date designs. This supports re-refinement or more exten-
sive iterative refinement during design as an appealing
option for attempting NMR-based design.
In summary, our results support the conclusion that
while X-ray templates are to be preferred for protein
design, NMR structures can provide promising templates
for protein-design calculations in some cases. Of note,
we examined design in core and surface regions of NMR
structures with relatively low heterogeneity in the ensem-
ble. This may be a best-case scenario. Even then, X-ray
template performance was better than the average per-
formance for NMR structures, by many metrics, espe-
cially when using RosettaDesign. This work did not
address whether and how NMR templates may represent
improvements over X-ray templates, because X-ray tem-
plate performance was used as the standard. It is possi-
ble, however, that appropriate use of preminimized, pre-
refined, or iteratively refined NMR backbones may make
protein-design calculations more effective by relaxing the
fixed-backbone approximation and thus rendering a
larger sequence space accessible to the designs. This type
of advance may be increasingly important as the
demands places on designed proteins, in terms of func-
tion, solubility, specificity, and other features, increase.
METHODS
Test set
The test set consisted of the 29 X-ray/NMR structure
pairs listed in Table I. Nineteen of these were extracted
from a data set by Andrec et al.,48 and 10 were identified
directly from the PDB. The following criteria were used
to include candidates in the test set: structures contained
a single chain in both the X-ray and NMR examples; the
X-ray structure had resolution �2 A; both proteins were
derived from the same organism; structure pairs with sig-
nificantly different conformations, insertions, deletions,
or a large number of mutations were excluded. Minor
deviations in sequence (e.g., point mutations, if not at
one of the cluster sites) were tolerated.
Definition of design/repack cluster sites
Clusters of sites to be repacked or designed were
defined with the following procedure. First, FindCore25
was used to identify core atoms within the NMR ensem-
ble. FindCore uses an inter-atomic-variance matrix
(IVM)49 to compute an order parameter e that can be
used to define a core atom set via a simple clustering algo-
rithm. These core regions define sets of atoms with minor
coordinate deviations within the NMR ensemble. Core
residues were defined as those for which their Ca atom
was a core atom. Second, the solvent accessible surface
area relative to reference residues (SAS) was computed for
the first NMR ensemble member and the X-ray structure
using the program NACCESS50, with a default probe
value (1.4 A). Every core residue with a relative SAS value
�20% in both structures was defined to be a repack/
design cluster site. Cluster sizes are given in Table I.
Structure preparation
To prepare the structure pairs for design calculations,
we applied the following procedure. The sequences of the
X-ray and NMR structures were aligned with ClustalW.51
Nonoverlapping sequence at the C- and N-termini, most
likely arising from the use of different constructs in the
X-ray and NMR experiments, was eliminated to generate
structures with the same length. The truncated structures
were renumbered to ease site-specific comparisons. Pro-
tons were added by using the HBUILD command in
CHARMM with the CHARMM 19 parameter set.52
Because the deposited structures in the PDB do not
necessarily coincide with a global or local minimum in
most molecular force fields, structures were prerelaxed
before repacking and design calculations. Two different
procedures were used.
In the C-RELAX method, energy minimization for
each member of the NMR ensemble and for the X-ray
structure was carried out using CHARMM. The energy
function included van der Waals energy (100% radii),
bond-stretching terms, bond-angle terms, dihedral-angle,
and improper-dihedral potentials. Electrostatics was
modeled using the CHARMM Effective Energy Function
(EEF1).53 Minimization was carried out using 100 steps
of steepest-descent minimization followed by 100 steps of
adapted-basis Newton Raphson, with all atoms included
(backbone and side-chain atoms). This number of steps
was chosen because it accomplished most of the reduc-
tion in energy of longer minimizations, without signifi-
cantly perturbing the structure.
In the R-RELAX method, RosettaDesign was used to
reoptimize/fine-tune the structure using the native
sequence. For this purpose, the sequence of each protein
was used to generate 3- and 9-residue fragment libraries
as described.54,55 PSIPRED was used for secondary
structure prediction,56 and we excluded near homologs
in the fragment search. Given the fragment libraries,
RosettaDesign was used to adjust the native-protein
structure via iterative side-chain and backbone optimiza-
tion. During backbone optimization steps, segments of
the structure were replaced with members of the frag-
ment library, or small random perturbations in torsion
angle space were performed. Ten independent runs for
each X-ray or NMR structure were carried out, each con-
sisting of thousands of small backbone adjustments, and
the lowest-energy structure from the 10 runs was used as
NMR vs. X-ray Templates for Protein Design
PROTEINS 107

input for fixed-backbone design. Sometimes this proce-
dure dramatically altered the experimentally determined
structure. This was deemed unrealistic, and an all-back-
bone atom RMSD limit of 4 A from the experimental
structure was imposed to eliminate some templates. This
applied to 134 out of 655 structures.
Side-chain conformation analysis
To characterize the side-chain conformations of the
NMR structures when compared with the corresponding
X-ray structures, we evaluated whether the conformations
of design-site side chains were represented in the rotamer
library of Dunbrack et al.43 The relative fraction of
design-site side chains with a conformation represented
in the rotamer library is referred to as ‘‘rotamericity.’’
Here a side chain was defined to be rotameric if its v1-angle was within 408 of a member of the rotamer library
using the minimized template structure. Side chains that
have no v1 variable, alanine, glycine and proline, were
not included in this analysis.
Hydrogen-bond coincidence analysis
We used the method of Ramelot et al. to characterize
backbone hydrogen bonding.41 Briefly, those hydrogen
bonds with DSSP energies <20.5 kcal/mol were identi-
fied in each structure and a filter was applied to exclude
bivalent hydrogen bonds. Hydrogen bond coincidence
between an X-ray and an NMR structure was defined as
100 3 (number of hydrogen bonds in both structures)/
(total hydrogen bonds, i.e., hydrogen bonds in either the
X-ray or NMR structures). Coincidence values were com-
puted for PDB entries (unmodified), C-RELAX and R-
RELAX prepared templates, and R-ITER designs. In each
case, NMR templates were compared to an X-ray tem-
plate that was relaxed using the same technique. Because
the analysis was applied only to backbone hydrogen
bonds, coincidence values were meaningful even when
comparing R-ITER designs that had different sequences.
Side-chain repacking calculations
Repack calculations were carried out with two different
protocols, one based on a CHARMM energy function and
similar to that used by Ali et al.,5 and RosettaDesign.11
The repack/design cluster residues were allowed to move,
whereas all other residues of the protein were held fixed.
The CHARMM-based method used a Dead-End-Elimina-
tion/A* algorithm2,57 to find the optimal combination of
rotamer conformations, given a rotamer library. The 2002
backbone-dependent rotamer library of Dunbrack et al.43
was used. The energy function included CHARMM
param19 van der Waals (with 90% atomic radii), dis-
tance-dependent dielectric electrostatics with e 5 4r, and
EEF1 desolvation. To report the energies of repacked or
designed clusters, we used a cluster energy defined as the
full energy contribution of single residues and residue
pairs within a cluster, plus 50% of the interaction energy
of the cluster residues with the fixed residues.
Because the Monte Carlo search procedure in Rosetta-
Design is not deterministic, repacking using that program
was performed 10 times for each structure and the lowest
energy solution was used for analysis. RosettaDesign
also used the backbone dependent rotamer library of
Dunbrack et al.,43 with v1 and selected v2 angles
expanded � one standard deviation as described by
Saunders et al.45 The energy function used was very sim-
ilar to that of Kuhlman et al.29 and contained modified
attractive and repulsive Lennard-Jones terms (95%
atomic radii), an implicit Lazaridis-Karplus solvation
model,54 an internal rotamer energy derived using statis-
tics,43 an intraresidue clash term, a statistics based pair
term, a Ramachandran preference term for each amino
acid, a side-chain-main-chain orientation-dependent
hydrogen bond term, and a reference energy term. In
repacking tests, rotamer-based v1 angles were considered
to be equivalent to the X-ray or NMR structure values if
these differed by <408.
RosettaDesign
All redesign calculations were done using RosettaDe-
sign version 2.1. Design-cluster sites were allowed to
mutate to any of the 20 common amino acids except
proline or cysteine. Fixed-backbone redesign calculations
were performed 100 times for each structure and the
lowest energy solution was taken for analysis.
We tested the performance of the X-ray/NMR struc-
ture pairs in three different protocols that introduced
varying amounts of structural variation to the original
template. C-RELAX and R-RELAX are described above.
The Rosetta flexible-backbone design method R-ITER
involved iterative optimization of sequence (of the
design-cluster residues) and structure (of all residues).
The fragment libraries and torsional sampling described
for the R-RELAX method (above) were used to sample
backbone structures, and the starting structures were the
R-RELAX templates. For R-ITER, changes to the protein
sequence were performed and followed by reoptimization
of the backbone structure. Starting with random sequen-
ces for the design-site residues, 10 independent flexible-
backbone design calculations, each consisting of 10
sequence-design and backbone optimization cycles, were
performed for each input template and the lowest energy
designed structure was analyzed.
For all methods described above, the final energies
reported were those resulting from the RosettaDesign cal-
culations. Rosetta designs were also evaluated with other
potential functions. To compute a CHARMM-based
energy, designs were subjected to a small amount of
relaxation after restoring 100% van der Waals radii. The
relaxation was similar to C-RELAX, differing only in the
M. Schneider et al.
108 PROTEINS

respect that the backbone was held fixed. The re-evalua-
tion was carried out with an energy function that
included a CHARMM param 19 van der Waals term
(100% radii), a CHARMM param 19 torsion energy
term, a Coulomb energy term with a dielectric constant
of 4, CHARMM EEF1 for desolvation only (not interac-
tion), and a polarization energy pairwise screening term,
computed from a generalized Born model58 using PEP59
to compute Born radii for the transfer of a protein with
internal dielectric of 4 from external dielectric of 4 to
external dielectric of 80. All designs were also re-eval-
uated with the Fold-X energy function (FOLDEF).46
ACKNOWLEDGMENTS
We would like to thank members of the Keating lab,
particularly J.R. Apgar, G. Grigoryan, and K. Gutwin, for
useful discussions, and T.C.S. Chen and B.A. Joughin for
comments on the manuscript.
REFERENCES
1. Pabo C. Molecular technology–designing proteins and peptides. Na-
ture 1983;301:200.
2. Desmet J, Maeyer MD, Hazes B, Lasters I. The dead-end elimina-
tion theorem and its use in protein side-chain positioning. Nature
1992;356:539–542.
3. Dahiyat BI, Mayo SL. Protein design automation. Protein Sci 1996;
5:895–903.
4. Dahiyat BI, Sarisky CA, Mayo SL. De novo protein design: towards
fully automated sequence selection. J Mol Biol 1997;273:789–796.
5. Ali MH, Taylor CM, Grigoryan G, Allen KN, Imperiali B, Keating
AE. Design of a heterospecific, tetrameric, 21-residue miniprotein
with mixed alpha/beta structure. Structure 2005;13:225–234.
6. Bolon DN, Mayo SL. Enzyme-like proteins by computational
design. Proc Natl Acad Sci U S A 2001;98:14274–14279.
7. Cochran FV, Wu SP, Wang W, Nanda V, Saven JG, Therien MJ,
DeGrado WF. Computational de novo design and characterization
of a four-helix bundle protein that selectively binds a nonbiological
cofactor. J Am Chem Soc 2005;127:1346–1347.
8. Fu X, Apgar JR, Keating AE. Modeling backbone flexibility to
achieve sequence diversity: the design of novel alpha-helical ligands
for Bcl-xL. J Mol Biol 2007;371:1099–1117.
9. Jiang L, Althoff EA, Clemente FR, Doyle L, Rothlisberger D, Zan-
ghellini A, Gallaher JL, Betker JL, Tanaka F, Barbas CF, 3rd, Hilvert
D, Houk KN, Stoddard BL, Baker D. De novo computational design
of retro-aldol enzymes. Science 2008;319:1387–1391.
10. Rothlisberger D, Khersonsky O, Wollacott AM, Jiang L, DeChancie
J, Betker J, Gallaher JL, Althoff EA, Zanghellini A, Dym O, Albeck
S, Houk KN, Tawfik DS, Baker D. Kemp elimination catalysts by
computational enzyme design. Nature 2008;453:190–195.
11. Kuhlman B, Dantas G, Ireton GC, Varani G, Stoddard BL, Baker D.
Design of a novel globular protein fold with atomic-level accuracy.
Science 2003;302:1364–1368.
12. Lippow SM, Wittrup KD, Tidor B. Computational design of anti-
body-affinity improvement beyond in vivo maturation. Nat Bio-
technol 2007;25:1171–1176.
13. Lombardi A, Summa CM, Geremia S, Randaccio L, Pavone V,
DeGrado WF. Inaugural article: retrostructural analysis of metallo-
proteins: application to the design of a minimal model for diiron
proteins. Proc Natl Acad Sci U S A 2000;97:6298–6305.
14. Reina J, Lacroix E, Hobson SD, Fernandez-Ballester G, Rybin V,
Schwab MS, Serrano L, Gonzalez C. Computer-aided design of a
PDZ domain to recognize new target sequences. Nat Struct Biol
2002;9:621–627.
15. Butterfoss GL, Kuhlman B. Computer-based design of novel protein
structures. Annu Rev Biophys Biomol Struct 2006;35:49–65.
16. Bender GM, Lehmann A, Zou H, Cheng H, Fry HC, Engel D, Ther-
ien MJ, Blasie JK, Roder H, Saven JG, DeGrado WF. De novo
design of a single-chain diphenylporphyrin metalloprotein. J Am
Chem Soc 2007;129:10732–10740.
17. Ashworth J, Havranek JJ, Duarte CM, Sussman D, Monnat RJ, Jr,
Stoddard BL, Baker D. Computational redesign of endonuclease
DNA binding and cleavage specificity. Nature 2006;441:656–659.
18. Joachimiak LA, Kortemme T, Stoddard BL, Baker D. Computational
design of a new hydrogen bond network and at least a 300-fold
specificity switch at a protein-protein interface. J Mol Biol 2006;
361:195–208.
19. Slovic AM, Kono H, Lear JD, Saven JG, DeGrado WF. Computa-
tional design of water-soluble analogues of the potassium channel
KcsA. Proc Natl Acad Sci U S A 2004;101:1828–1833.
20. Kono H, Saven JG. Statistical theory for protein combinatorial
libraries. Packing interactions, backbone flexibility, and the
sequence variability of a main-chain structure. J Mol Biol 2001;306:
607–628.
21. Green DF, Dennis AT, Fam PS, Tidor B, Jasanoff A. Rational design
of new binding specificity by simultaneous mutagenesis of calmod-
ulin and a target peptide. Biochemistry 2006;45:12547–12559.
22. Berman HM, Westbrook J, Feng Z, Gilliland G, Bhat TN, Weissig
H, Shindyalov IN, Bourne PE. The Protein Data Bank. Nucleic
Acids Res 2000;28:235–242.
23. Larson SM, England JL, Desjarlais JR, Pande VS. Thoroughly sam-
pling sequence space: large-scale protein design of structural ensem-
bles. Protein Sci 2002;11:2804–2813.
24. Spronk CA, Linge JP, Hilbers CW, Vuister GW. Improving the qual-
ity of protein structures derived by NMR spectroscopy. J Biomol
NMR 2002;22:281–289.
25. Snyder DA, Montelione GT. Clustering algorithms for identifying
core atom sets and for assessing the precision of protein structure
ensembles. Proteins 2005;59:673–686.
26. Ban YE, Rudolph J, Zhou P, Edelsbrunner H. Evaluating the quality
of NMR structures by local density of protons. Proteins 2006;62:
852–864.
27. Fan H, Mark AE. Relative stability of protein structures determined
by X-ray crystallography or NMR spectroscopy: a molecular dy-
namics simulation study. Proteins 2003;53:111–120.
28. Lee MR, Kollman PA. Free-energy calculations highlight differences
in accuracy between X-ray and NMR structures and add value to
protein structure prediction. Structure 2001;9:905–916.
29. Kuhlman B, Baker D. Native protein sequences are close to optimal
for their structures. Proc Natl Acad Sci U S A 2000;97:10383–
10388.
30. Brunger AT. Free R value: a novel statistical quantity for assessing
the accuracy of crystal structures. Nature 1992;355:472–475.
31. Brunger AT. Assessment of phase accuracy by cross validation: the
free R value. Methods and applications. Acta Crystallogr Sect D
1993;49:24–36.
32. Brunger AT, Clore GM, Gronenborn AM, Saffrich R, Nilges M.
Assessing the quality of solution nuclear magnetic resonance struc-
tures by complete cross-validation. Science 1993;261:328–331.
33. Gronwald W, Kirchhofer R, Gorler A, Kremer W, Ganslmeier B,
Neidig KP, Kalbitzer HR. RFAC, a program for automated NMR R-
factor estimation. J Biomol NMR 2000;17:137–151.
34. Huang YJ, Powers R, Montelione GT. Protein NMR recall, preci-
sion, and F-measure scores (RPF scores): structure quality assess-
ment measures based on information retrieval statistics. J Am
Chem Soc 2005;127:1665–1674.
35. Nabuurs SB, Spronk CA, Krieger E, Maassen H, Vriend G, Vuister
GW. Quantitative evaluation of experimental NMR restraints. J Am
Chem Soc 2003;125:12026–12034.
NMR vs. X-ray Templates for Protein Design
PROTEINS 109

36. Bhattacharya A, Tejero R, Montelione GT. Evaluating protein struc-
tures determined by structural genomics consortia. Proteins 2007;
66:778–795.
37. Morris AL, MacArthur MW, Hutchinson EG, Thornton JM. Stereo-
chemical quality of protein structure coordinates. Proteins 1992;12:
345–364.
38. Laskowski RA, Rullmannn JA, MacArthur MW, Kaptein R, Thorn-
ton JM. AQUA and PROCHECK-NMR: programs for checking the
quality of protein structures solved by NMR. J Biomol NMR 1996;
8:477–486.
39. Davis IW, Murray LW, Richardson JS, Richardson DC. MOLPRO-
BITY: structure validation and all-atom contact analysis for nucleic
acids and their complexes. Nucleic Acids Res 2004;32:W615–
W619.
40. Garbuzynskiy SO, Melnik BS, Lobanov MY, Finkelstein AV, Galzit-
skaya OV. Comparison of X-ray and NMR structures: is there a sys-
tematic difference in residue contacts between X-ray- and NMR-
resolved protein structures? Proteins 2005;60:139–147.
41. Ramelot TA, Raman S, Kuzin AP, Xiao R, Ma LC, Acton TB, Hunt
JF, Montelione GT, Baker D, Kennedy MA. Improving NMR protein
structure quality by Rosetta refinement: a molecular replacement
study. Proteins 2008;75:147–167.
42. Korkegian A, Black ME, Baker D, Stoddard BL. Computational
thermostabilization of an enzyme. Science 2005;308:857–860.
43. Dunbrack RL. Rotamer libraries in the 21st century. Curr Opin
Struct Biol 2002;12:431–440.
44. Hu X, Wang H, Ke H, Kuhlman B. High-resolution design of a pro-
tein loop. Proc Natl Acad Sci U S A 2007;104:17668–17673.
45. Saunders CT, Baker D. Recapitulation of protein family divergence
using flexible backbone protein design. J Mol Biol 2005;346:631–644.
46. Guerois R, Nielsen JE, Serrano L. Predicting changes in the stability
of proteins and protein complexes: a study of more than 1000
mutations. J Mol Biol 2002;320:369–387.
47. Lippow SM, Tidor B. Progress in computational protein design.
Curr Opin Biotechnol 2007;18:305–311.
48. Andrec M, Snyder DA, Zhou Z, Young J, Montelione GT, Levy RM.
A large data set comparison of protein structures determined by
crystallography and NMR: statistical test for structural differences
and the effect of crystal packing. Proteins 2007;69:449–465.
49. Kelley LA, Gardner SP, Sutcliffe MJ. An automated approach for
defining core atoms and domains in an ensemble of NMR-derived
protein structures. Protein Eng 1997;10:737–741.
50. Hubbard SJ, Thornton JM. Naccess, computer program. Depart-
ment of Biochemistry and Molecular Biology, London: University
College; 1993.
51. Thompson JD, Higgins DG, Gibson TJ. CLUSTAL W: improving
the sensitivity of progressive multiple sequence alignment through
sequence weighting, position-specific gap penalties and weight ma-
trix choice. Nucleic Acids Res 1994;22:4673–4680.
52. Brooks B, Bruccoleri R, Olafson B, States D, Swaminathan S, Kar-
plus M. CHARMM: a program for macromolecular energy, minimi-
zation, and dynamics calculations. J Comput Chem 1983;4:187–217.
53. Lazaridis T, Karplus M. Effective energy function for proteins in so-
lution. Proteins 1999;35:133–152.
54. Bonneau R, Strauss CE, Rohl CA, Chivian D, Bradley P, Malmstrom
L, Robertson T, Baker D. De novo prediction of three-dimensional
structures for major protein families. J Mol Biol 2002;322:65–78.
55. Simons KT, Kooperberg C, Huang E, Baker D. Assembly of protein
tertiary structures from fragments with similar local sequences
using simulated annealing and Bayesian scoring functions. J Mol
Biol 1997;268:209–225.
56. Jones DT. Protein secondary structure prediction based on posi-
tion-specific scoring matrices. J Mol Biol 1999;292:195–202.
57. Goldstein RF. Efficient rotamer elimination applied to protein side-
chains and related spin glasses. Biophys J 1994;66:1335–1340.
58. Dominy BN, Brooks CL. Development of a generalized born model
parametrization for proteins and nucleic acids. J Phys Chem B
1999;103:3765–3773.
59. Beroza P, Case DA. Calculations of proton-binding thermodynamics
in proteins. Methods Enzymol 1998;295:170–189.
M. Schneider et al.
110 PROTEINS