X-ray Properties of Sgr A* Flares A Detailed X-ray View of the Central Parsecs Frederick Baganoff...
42
X-ray Properties of Sgr A* Flares A Detailed X-ray View of the Central Parsecs Frederick Baganoff MIT Kavli Institute MIT Mark Bautz George Ricker Zhongxiang Wang UCLA Mark Morris Mike Muno Penn State Neil Brandt Eric Feigelson Gordon Garmire Sangwook Park ISAS Yoshitomo Maeda
-
Upload
landyn-province -
Category
Documents
-
view
214 -
download
0
Transcript of X-ray Properties of Sgr A* Flares A Detailed X-ray View of the Central Parsecs Frederick Baganoff...

X-ray Properties of Sgr A* FlaresA Detailed X-ray View of the Central Parsecs
Frederick BaganoffMIT Kavli Institute
MIT
Mark Bautz
George Ricker
Zhongxiang Wang
UCLA
Mark
Morris
Mike Muno
Penn State
Neil Brandt
Eric Feigelson
Gordon Garmire
Sangwook Park
ISASYoshitomo Maeda
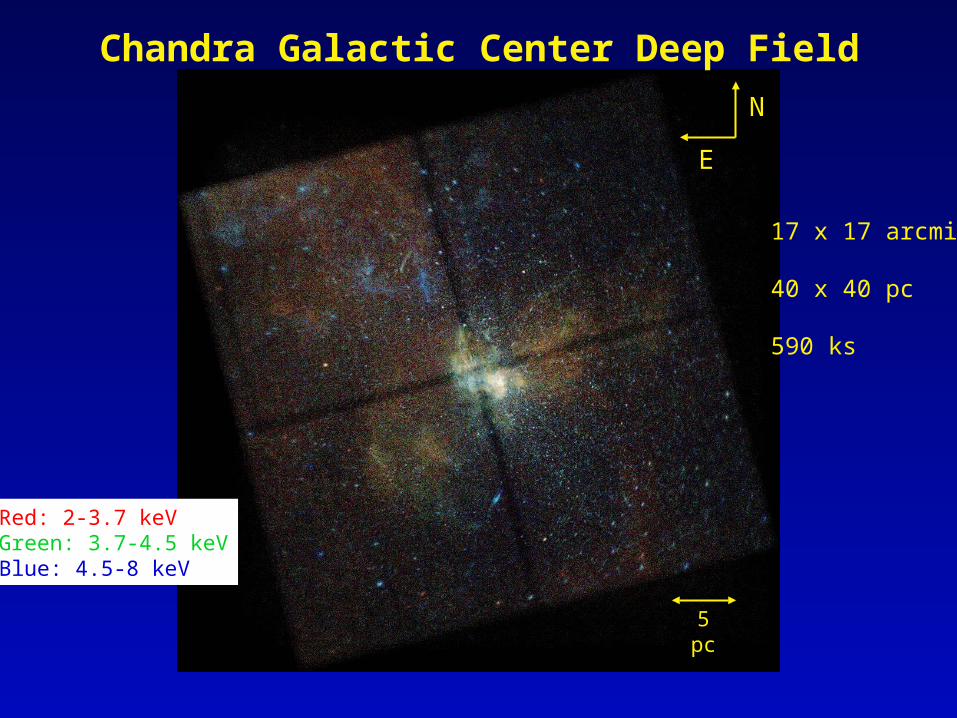
Chandra Galactic Center Deep Field
Red: 2-3.7 keVGreen: 3.7-4.5 keVBlue: 4.5-8 keV
17 x 17 arcmin
40 x 40 pc
590 ks
N
E
5 pc

Chandra Galactic Center Deep Field
8.4 x 8.4 arcmin

20 cm (yellow) and HCN (blue) Contours
20 cm: Yusef-Zadeh & MorrisHCN: Christopher et al. 2005
X-ray: Baganoff et al. 6 cm: Yusef-Zadeh & Morris
VLA 6 cm ImageChandra 0.5-8 keV Image
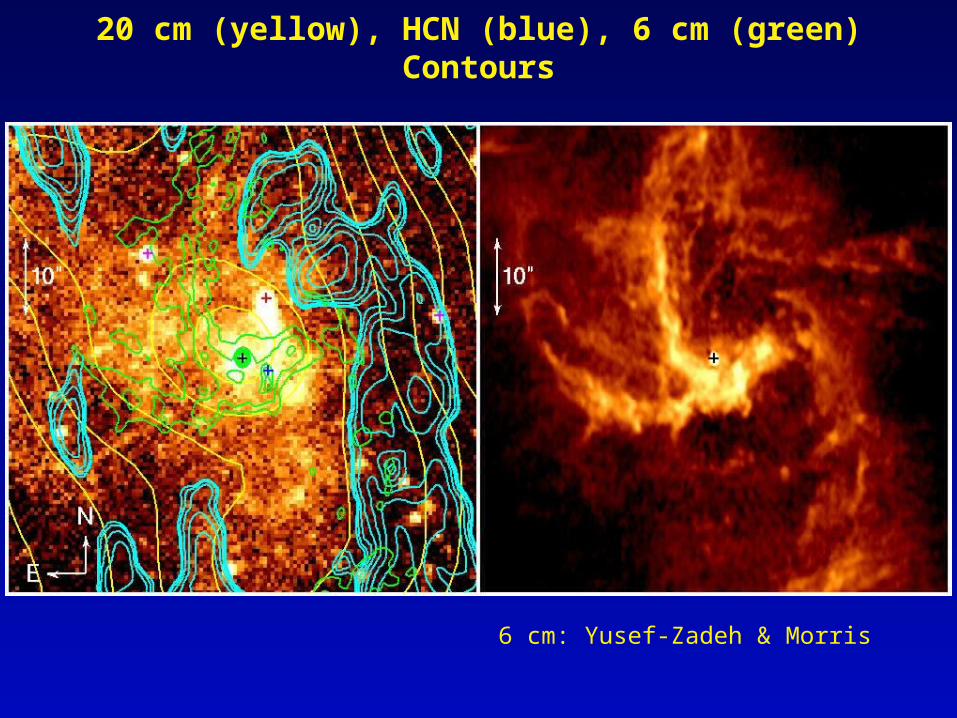
20 cm (yellow), HCN (blue), 6 cm (green) Contours
6 cm: Yusef-Zadeh & Morris
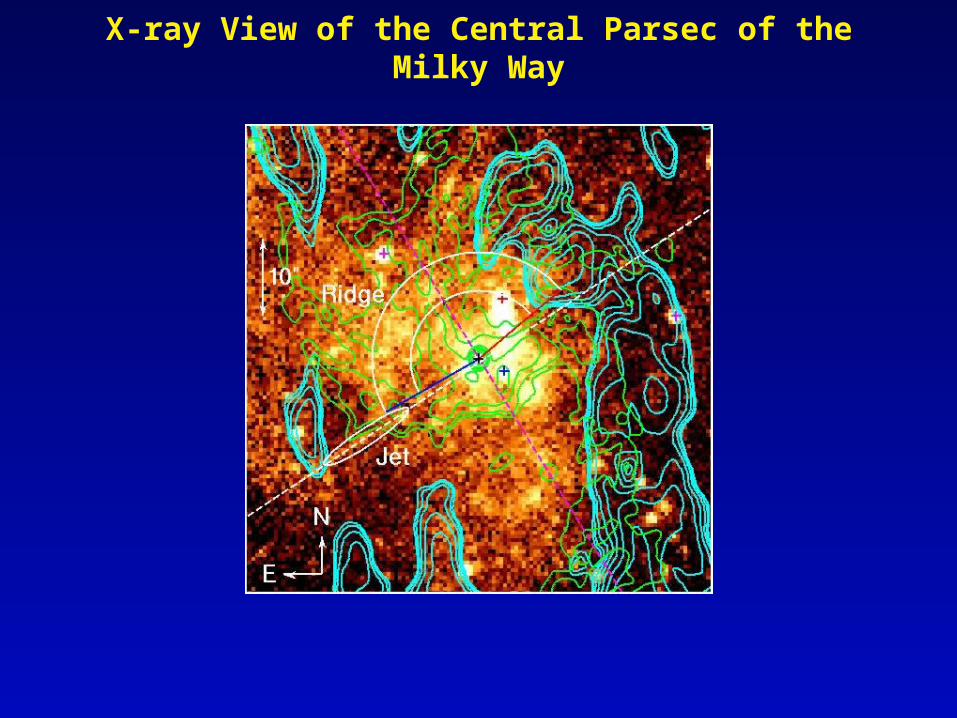
X-ray View of the Central Parsec of the Milky Way

X-ray View of the Central Few Parsecs of the Milky Way
725 ks exposure using ACIS subpixel analysis
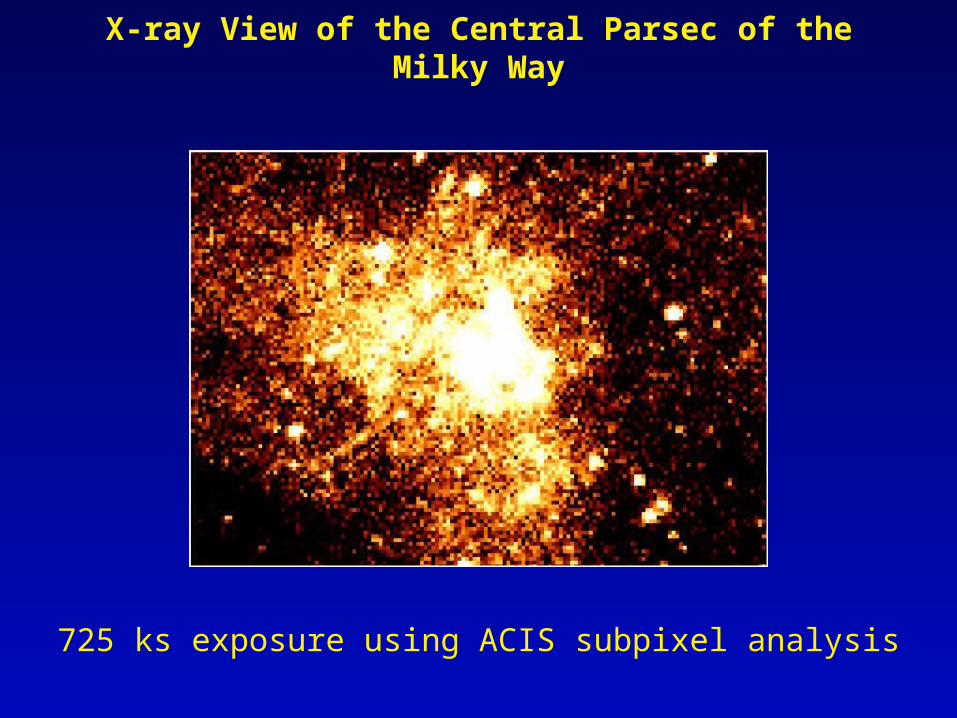
X-ray View of the Central Parsec of the Milky Way
725 ks exposure using ACIS subpixel analysis
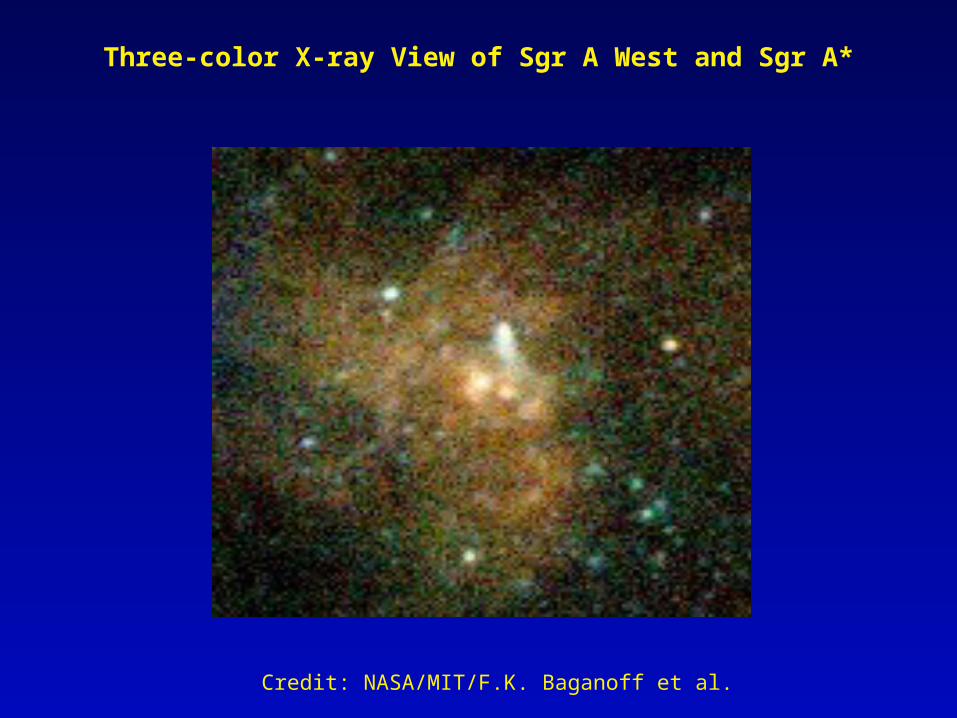
Three-color X-ray View of Sgr A West and Sgr A*
Credit: NASA/MIT/F.K. Baganoff et al.
Stand-off Distance for Central Parsec Cluster Stellar Wind – Sgr A East
Interaction
R ~ 45 ( Mdotsw / 10-3 Msun/yr )1/2 x ( NSN / 10 cm-3 )-1/2 ( vsw / 100 km/s )-1/2
x (vsw/cs) arcsec (or ~ 1.8 pc)
Consistent with radius of X-ray ridge feature to within a factor of ~2
Central parsec is inside the Sgr A East SNR
Role for SNR and windy stars in regulating accretion onto SMBHs in normal galaxies
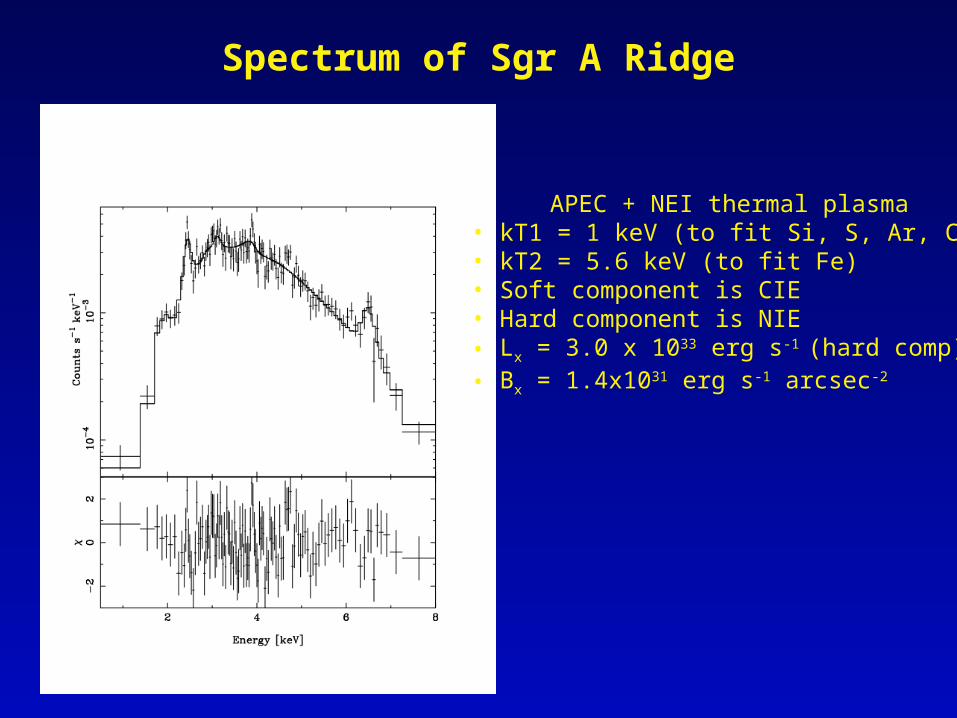
Spectrum of Sgr A Ridge
APEC + NEI thermal plasma• kT1 = 1 keV (to fit Si, S, Ar, Ca)• kT2 = 5.6 keV (to fit Fe)• Soft component is CIE• Hard component is NIE• Lx = 3.0 x 1033 erg s-1 (hard comp)• Bx = 1.4x1031 erg s-1 arcsec-2
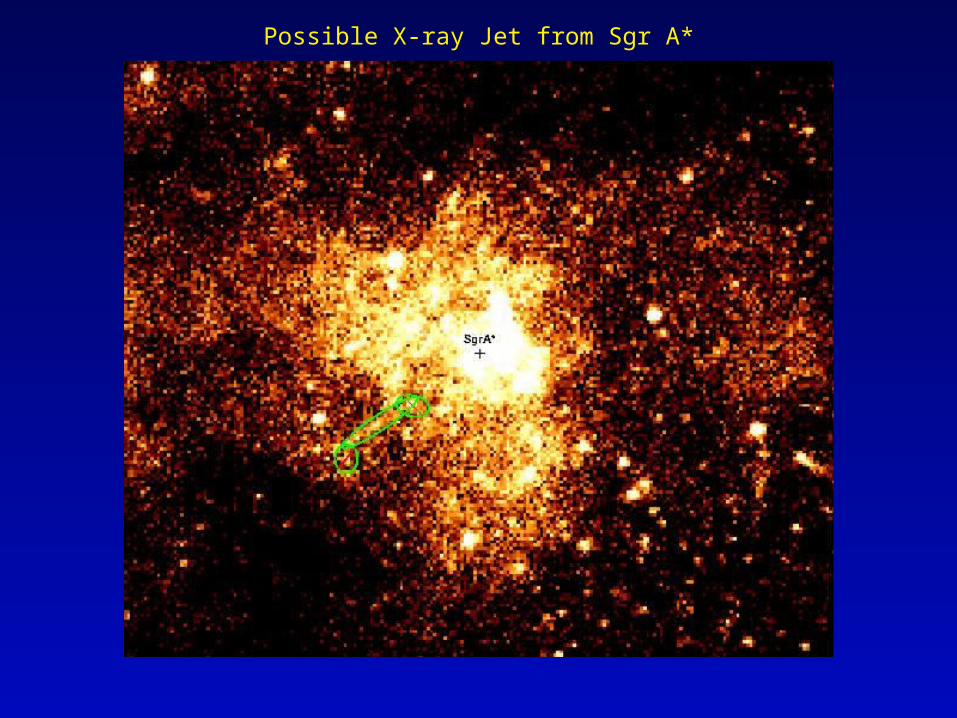
Possible X-ray Jet from Sgr A*

Jet Oriented Nearly Perpendicular to Galactic Plane
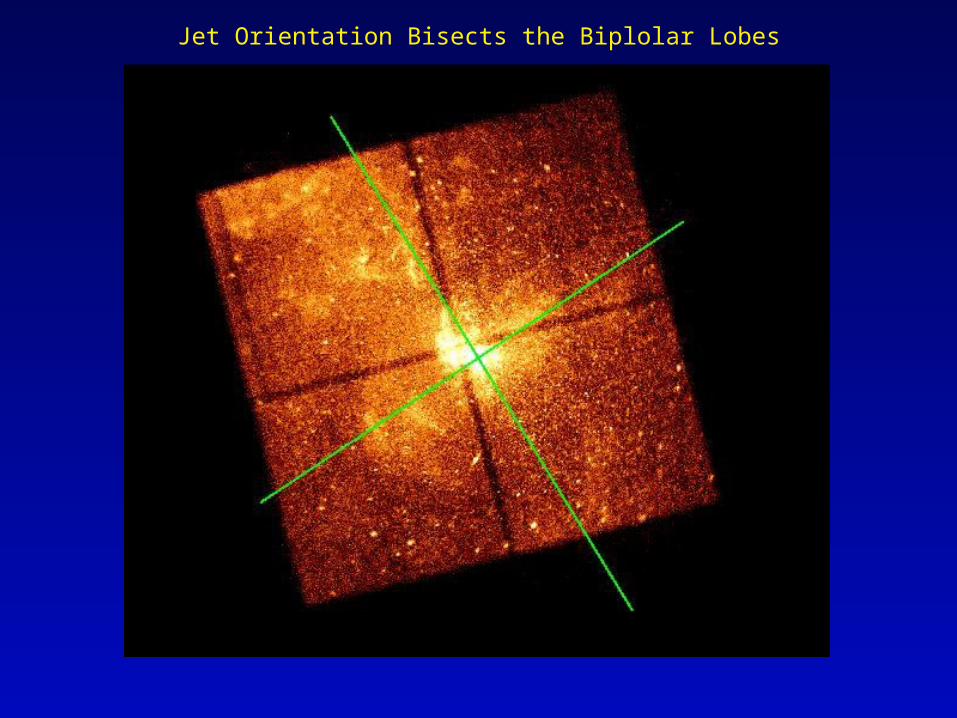
Jet Orientation Bisects the Biplolar Lobes

• Gamma = 1.8• NH = 8.0 x 1022 cm-2
• May 2002 (1st epoch)• July 2005 (2nd epoch)• Search for large proper
motions of knots in jet
Absorbed Power-law Model – Dust Corrected
Spectrum of Possible Jet-like Feature Near Sgr A*
Summary – X-ray Jet
• Discovery of an apparent X-ray jet from the Milky Way’s central black hole
• Not seen in any other waveband• Jet is 1 light-year long and located 1.5 light-years from the black hole
• Jet aligned with large-scale bipolar X-ray lobes
• Lobes may be due to past ejections or outflows from the supermassive black hole
• Strongly suggests we are seeing “fingerprints” of activity over the past few thousand years
• X-ray flares tell us about the current activity
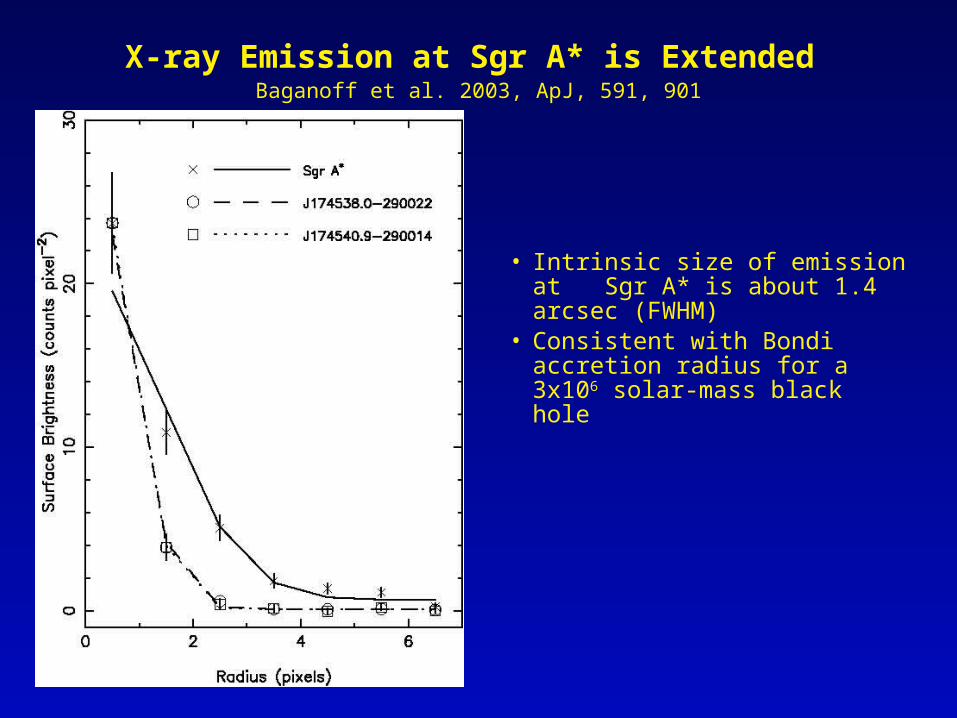
X-ray Emission at Sgr A* is Extended
• Intrinsic size of emission at Sgr A* is about 1.4 arcsec (FWHM)
• Consistent with Bondi accretion radius for a 3x10⁶ solar-mass black hole
Baganoff et al. 2003, ApJ, 591, 901
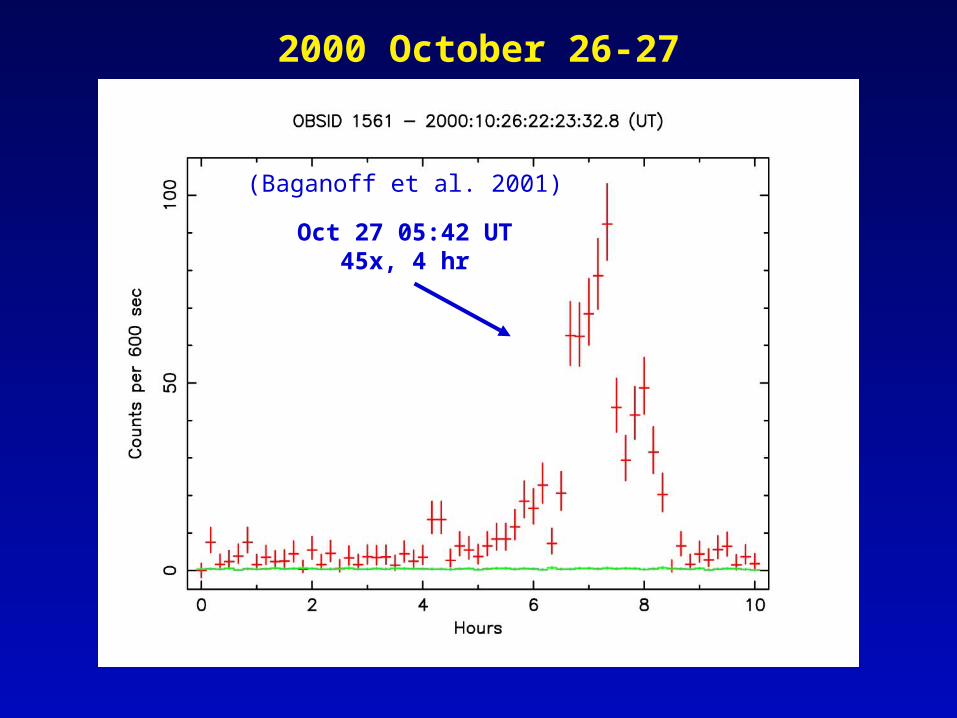
2000 October 26-27
Oct 27 05:42 UT45x, 4 hr
(Baganoff et al. 2001)

Jet Models
Markoff et al. 2001, A&A, 379, L13
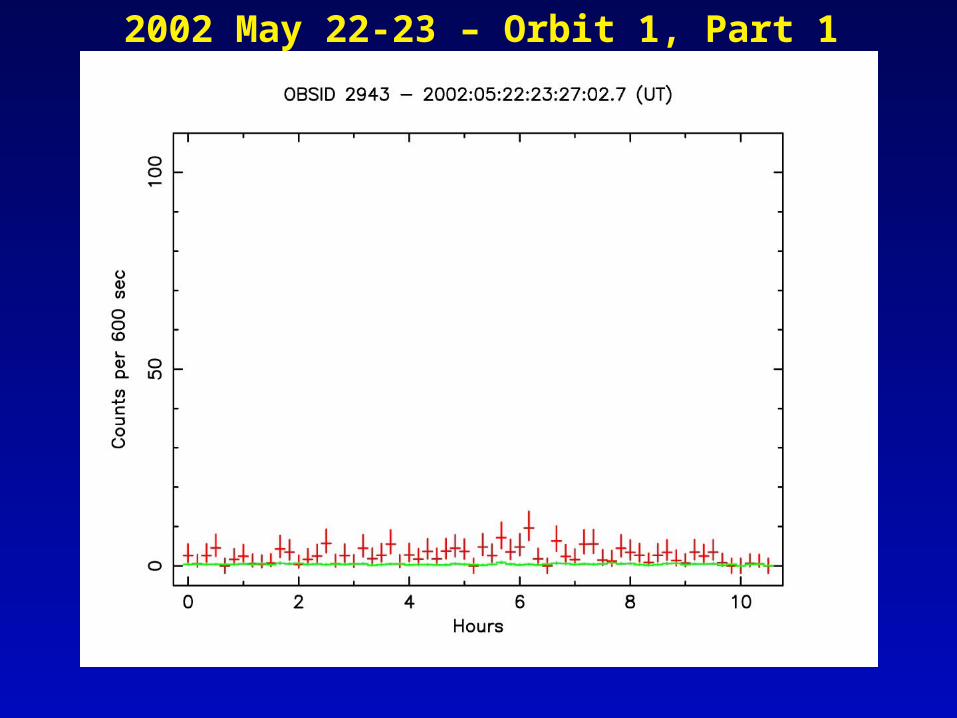
2002 May 22-23 – Orbit 1, Part 1

2002 May 24 – Orbit 1, Part 2
May 24 19:42 UT5x, 1.7 hr
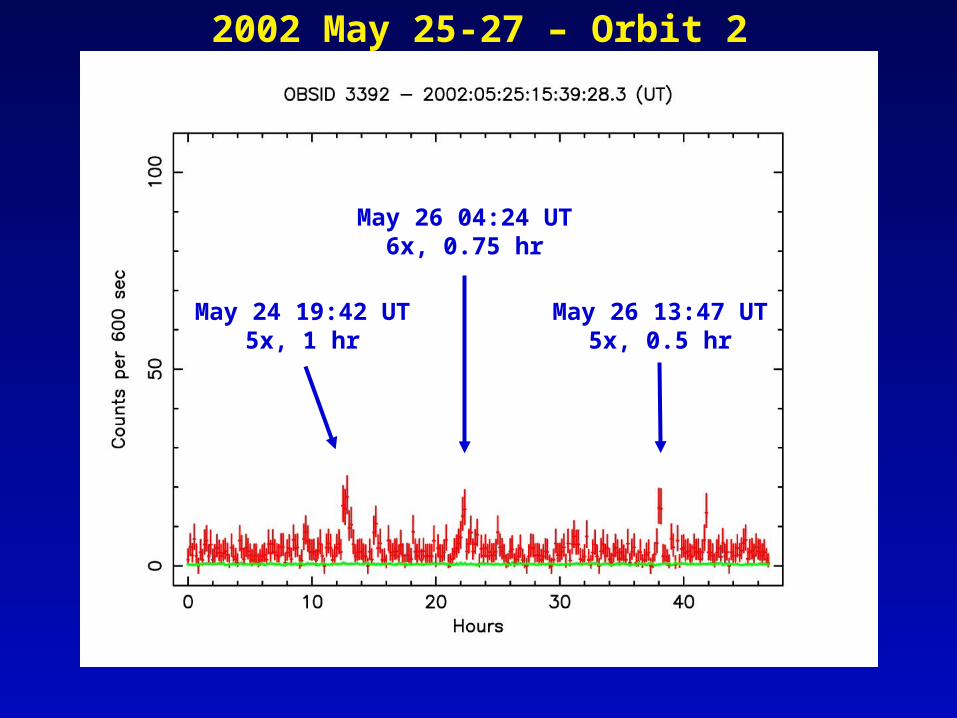
2002 May 25-27 – Orbit 2
May 26 04:24 UT6x, 0.75 hr
May 24 19:42 UT5x, 1 hr
May 26 13:47 UT5x, 0.5 hr

2002 May 28-30 – Orbit 3May 28 15:36 UT
25x, 1 hrMay 29 18:33 UT
13x, 0.5 hr
May 29 06:03 UT12x, 1.5 hr

2002 June 3-4 – Orbit 5
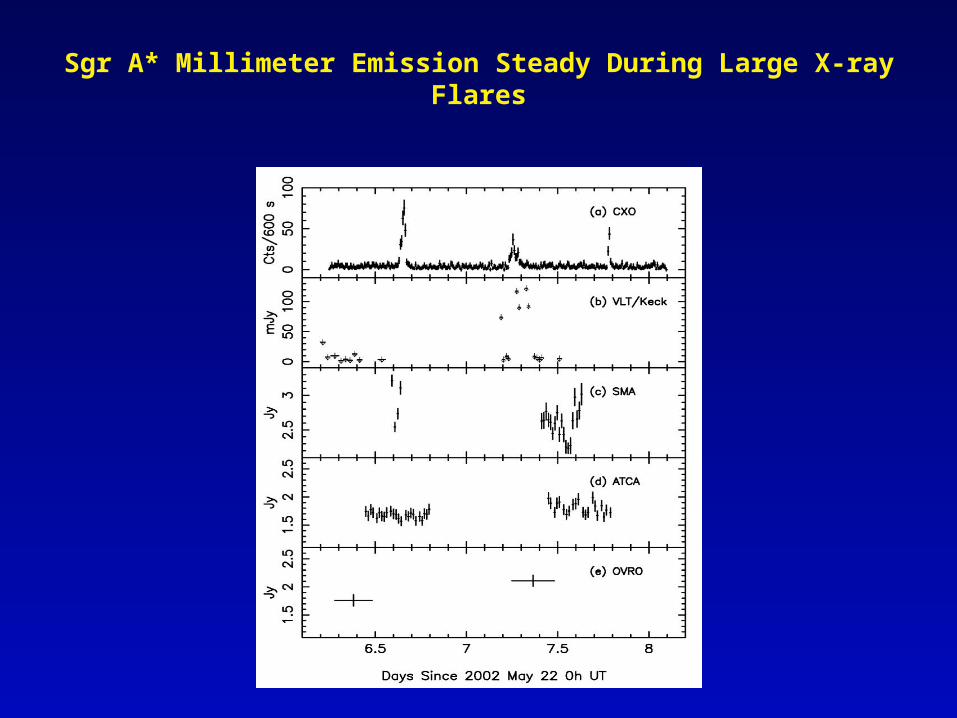
Sgr A* Millimeter Emission Steady During Large X-ray Flares
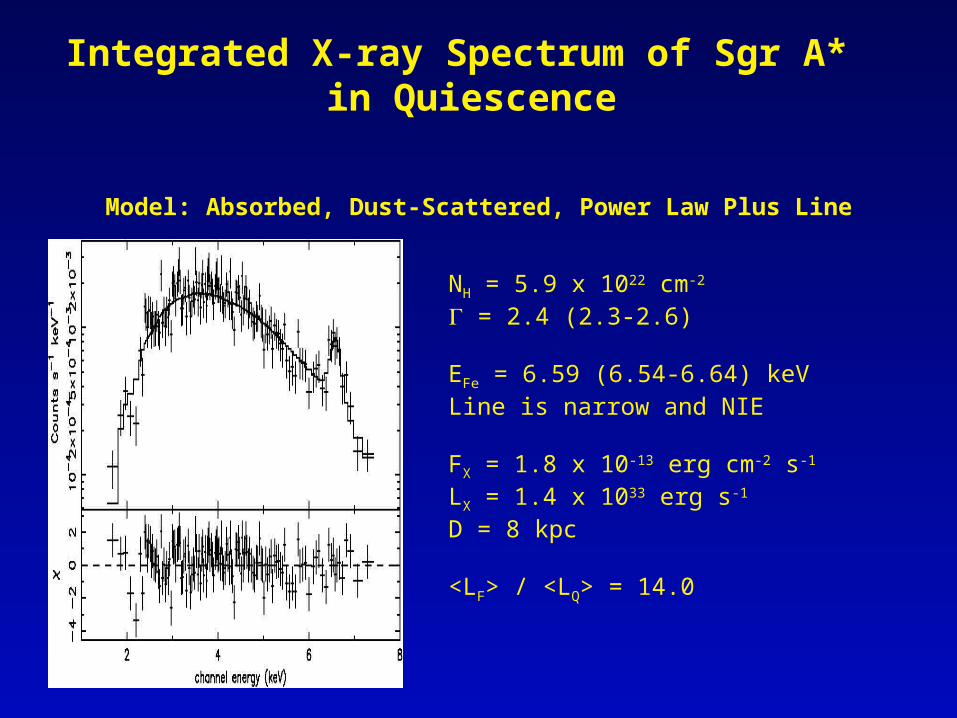
Integrated X-ray Spectrum of Sgr A* in Quiescence
Model: Absorbed, Dust-Scattered, Power Law Plus Line
NH = 5.9 x 1022 cm-2
= 2.4 (2.3-2.6)
EFe = 6.59 (6.54-6.64) keVLine is narrow and NIE
FX = 1.8 x 10⁻¹³ erg cm-2 s-1
LX = 1.4 x 1033 erg s-1
D = 8 kpc
<LF> / <LQ> = 14.0
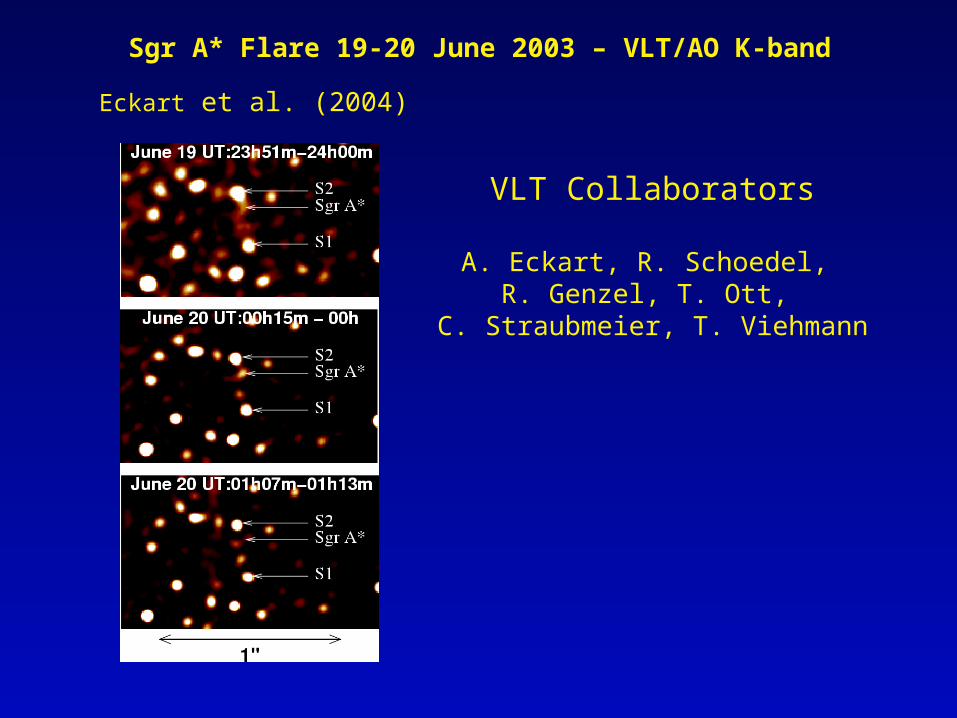
Sgr A* Flare 19-20 June 2003 – VLT/AO K-band
Eckart et al. (2004)
VLT Collaborators
A. Eckart, R. Schoedel, R. Genzel, T. Ott, C. Straubmeier, T.
Viehmann

Eckart et al. (2004)
Sgr A* Flare 19-20 June 2003 – Chandra 2-8 keV
Bayesian Blocks Representation Raw X-ray Light Curve
• Excess amplitude factor of ~2x• Duration ~40-60 min• 99.92% confidence using Bayesian blocks algorithm (Scargle 1998)

•First detection of simultaneous X-ray and NIR flaring
•In this case at least, X-ray and NIR photons appear to come from same electron population
•Lx ~ 6x1033 erg s-1
•Lnir ~ 5x1034 erg s-1
•Spectral index ~ 1.3•X-rays coincident within 180 mas
•NIR coincident within 14 mas
•X-ray flares are from Sgr A*!
Eckart et al. (2004)
Sgr A* 19-20 June 2003 – NIR/X-ray Flare

2004 July Sgr A* Campaign
No significant X-ray flares on July 5/6

scan: 07:06:22:35:11.8 - 07:07:12:53:44.9
flare: 07:07:03:12:20.0 - 07:07:03:54:12.8
July 2004: Detection of a Strong X-ray flare
18x

Bayesian Blocks Analysis of July 6/7 X-ray Lightcurve
• Bayesian blocks algorithm of Scargle (1998) models the lightcurve as piecewise constant segments or blocks.
• For a discussion of the algorithm, see Eckart et al. (2004).
• Only the large flare ~18 ks into the observation is significant at the 99% CL.
• At 90% CL, a possible second event is found by the algorithm near the beginning of the observation.
99% CL
90% CL
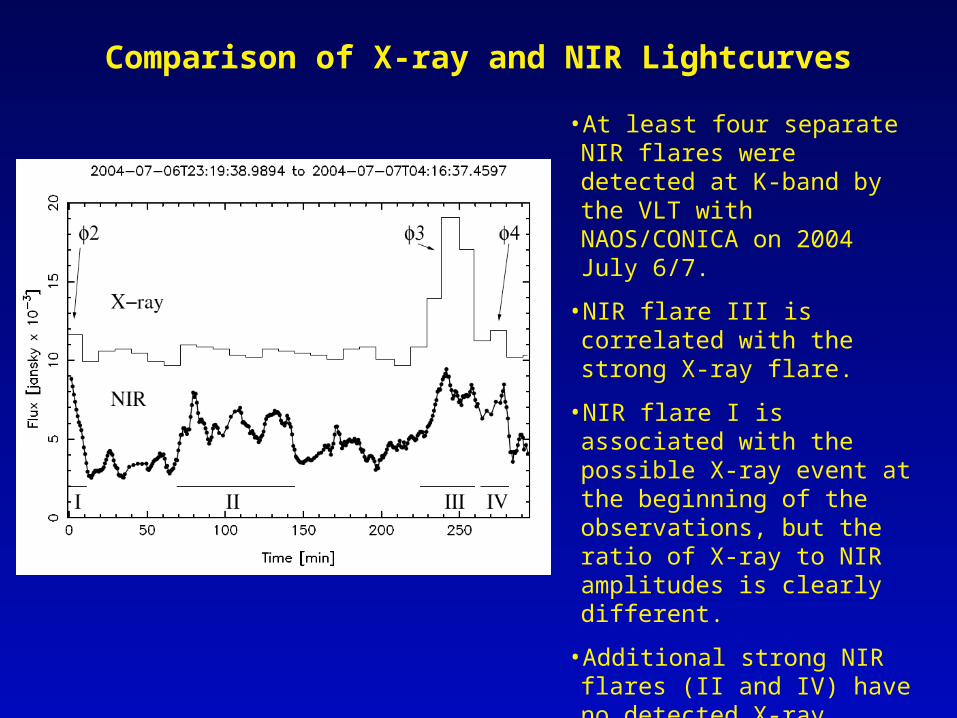
Comparison of X-ray and NIR Lightcurves
•At least four separate NIR flares were detected at K-band by the VLT with NAOS/CONICA on 2004 July 6/7.
•NIR flare III is correlated with the strong X-ray flare.
•NIR flare I is associated with the possible X-ray event at the beginning of the observations, but the ratio of X-ray to NIR amplitudes is clearly different.
•Additional strong NIR flares (II and IV) have no detected X-ray counterparts.
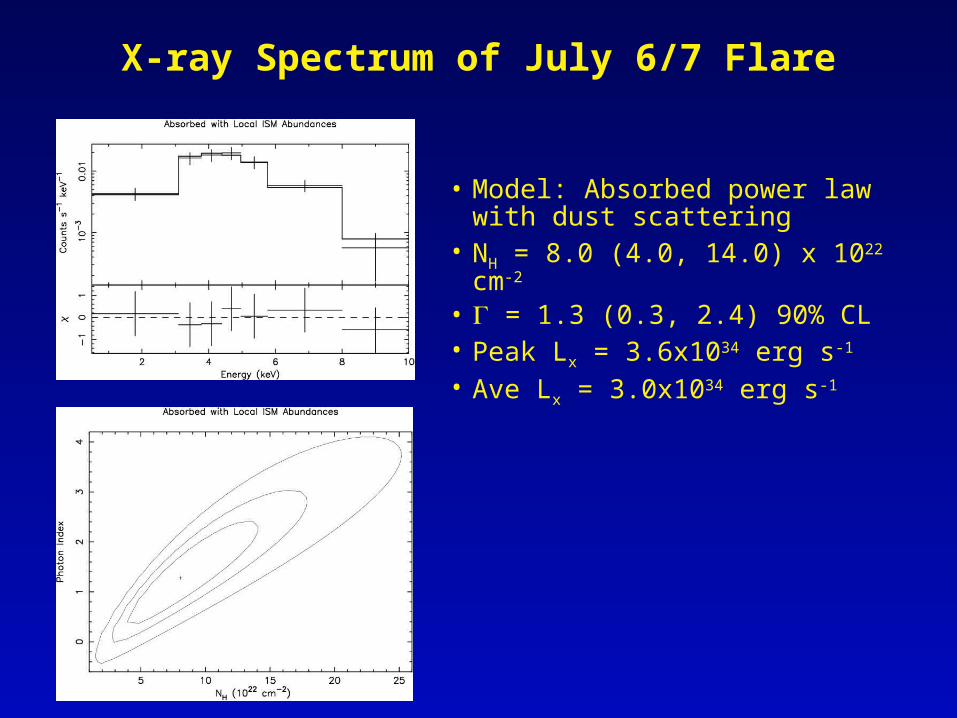
X-ray Spectrum of July 6/7 Flare
• Model: Absorbed power law with dust scattering
• NH = 8.0 (4.0, 14.0) x 1022 cm-2
• = 1.3 (0.3, 2.4) 90% CL• Peak Lx = 3.6x1034 erg s-1
• Ave Lx = 3.0x1034 erg s-1

Sgr A* NIR Flares are Red
Implies that at least some X-ray flares must be SSC
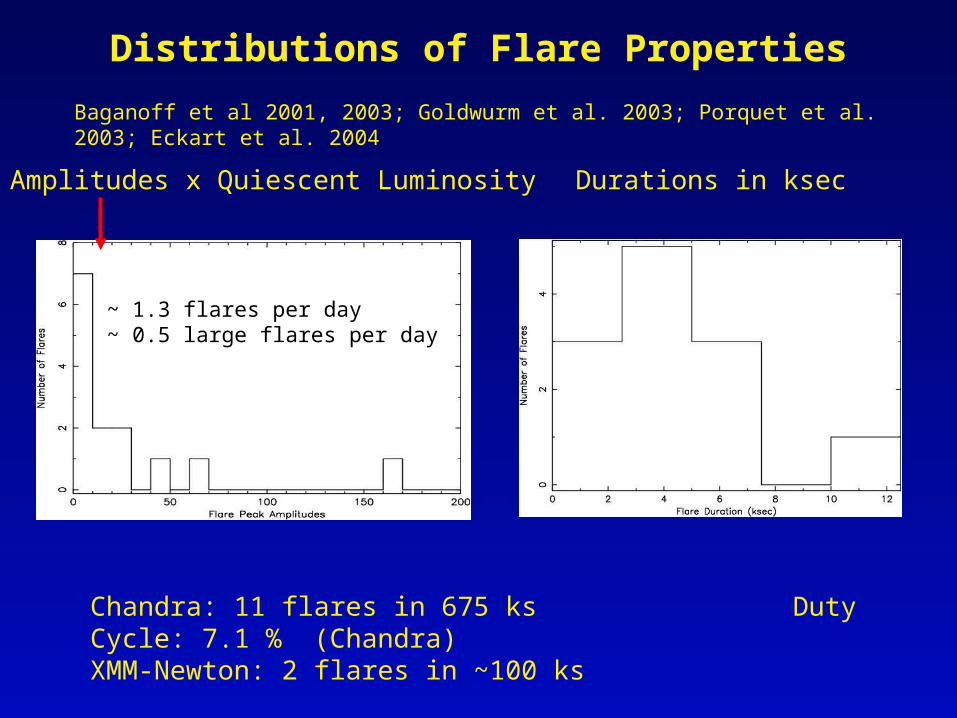
Distributions of Flare Properties
Amplitudes x Quiescent Luminosity Durations in ksec
Chandra: 11 flares in 675 ks Duty Cycle: 7.1 % (Chandra)XMM-Newton: 2 flares in ~100 ks
~ 1.3 flares per day~ 0.5 large flares per day
Baganoff et al 2001, 2003; Goldwurm et al. 2003; Porquet et al. 2003; Eckart et al. 2004
Sgr A* Flares and X-ray Transients in the Central Parsec of the Galaxy
QuickTime™ and aYUV420 codec decompressorare needed to see this picture.
• 3 hr/frame (moving avg)
• 6 days 17 hr total• Lowest color level 15 above background
• Tail of PWN candidate has ~3 ct/pix, so Poisson statistics causes apparent variability
• 7 X-ray transients detected within central 25 pc in past 5 yr
• 4 of 7 detected within central pc => 20x overabundant per unit stellar mass (Muno et al. 2005)

Model: Absorbed, Dust-Scattered Power Law
Integrated X-ray Spectrum of Sgr A*During Flares
NH = 6.0 x 1022 cm-2
= 1.3 (0.9-1.8)
FX = 1.6 x 10⁻¹² erg cm-2 s-1
LX = 2.0 x 1034 erg s-1
D = 8 kpc

Integrated Quiescent X-ray Spectrum of Sgr A*
Model: Absorbed, Dust-Scattered, MEKAL
Bad fit to Fe line
Line energy too high
Abundances of light elements forced to zero

Integrated Quiescent X-ray Spectrum of Sgr A*
Model: Absorbed, Dust-Scattered, NIE Plasma
NH = 5.9 x 1022 cm-2
kT = 4-5 keV
EFe = 6.59 (6.54-6.64) keVLine is narrow and NIE
FX = 1.8 x 10⁻¹³ erg cm-2 s-1
LX = 1.4 x 1033 erg s-1
D = 8 kpc
<LF> / <LQ> = 14.0
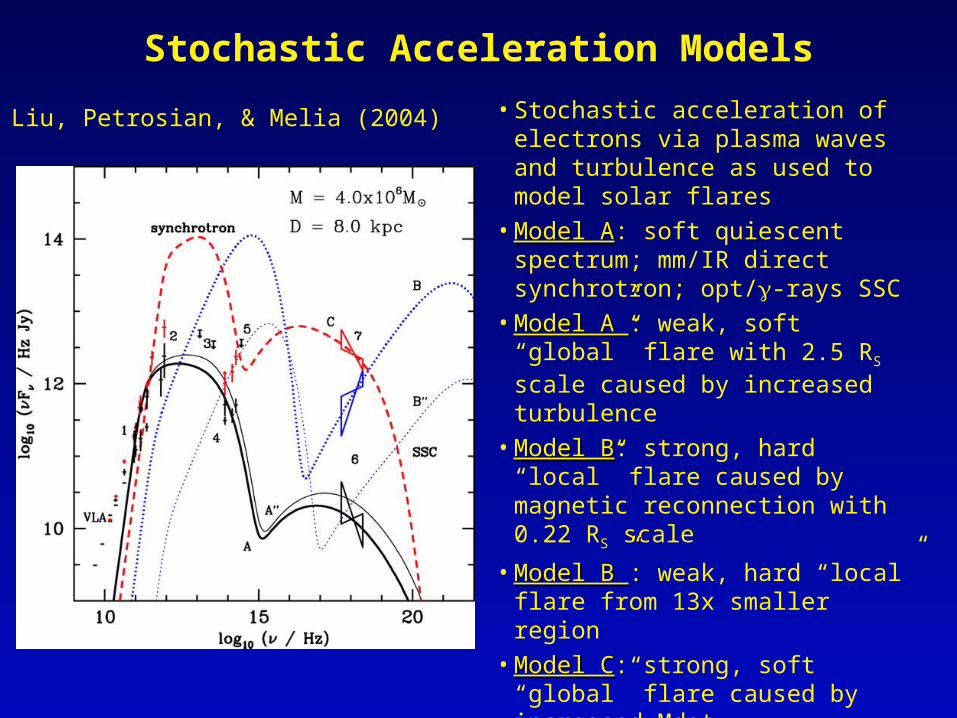
Stochastic Acceleration Models
Liu, Petrosian, & Melia (2004) •Stochastic acceleration of electrons via plasma waves and turbulence as used to model solar flares
•Model AModel A: soft quiescent spectrum; mm/IR direct synchrotron; opt/-rays SSC
•Model A”Model A”: weak, soft “global” flare with 2.5 RS scale caused by increased turbulence
•Model BModel B: strong, hard “local” flare caused by magnetic reconnection with 0.22 RS scale
•Model B”Model B”: weak, hard “local” flare from 13x smaller region
•Model CModel C: strong, soft “global” flare caused by increased Mdot

Summary
• Diffuse X-ray emission in central pc is due to colliding winds of stars in the central pc cluster (see Rockefeller et al. 2004, Quataert 2004)
• Discovery of an X-ray ridge 9-15” NE of Sgr A* shows that the cluster wind is interacting with the SN ejecta of Sgr A East; hence the central pc is inside the SNR
• Chandra detected a possible X-ray jet from Sgr A* that is oriented nearly perpendicular to the Galactic plane and that bisects the X-ray bipolar lobes
• Sgr A* flares occur daily on average with a range of amplitudes, durations, and spectral slopes; Chandra detects flares with a duty cycle of about 7%
• X-ray and NIR monitoring in 2003 & 2004 detected two flares in both wavebands with maximum lags between wavebands of ~10 minutes
• Steep spectral slopes of NIR flares (see talk by R. Schoedel) indicate the emission process is direct synchrotron, while the X-ray emission must be SSC of submm photons from the same population of electrons
• NIR and X-ray flares show a distribution of spectral slopes; stochastic acceleration models may provide a means of deriving physical properties of the emitting plasmas from the various flares