Development of X-Ray Powder Diffraction Methods for Biomolecules
0/63Frank Girgsdies, Nanostructures, Inorganic Chemistry Department, Fritz Haber Institute of the Max Planck Society, Berlin, Germany
X-ray Powder Diffraction in Catalysis December 18th 2009
X-ray Powder Diffractionin Catalysis
1/63Frank Girgsdies, Nanostructures, Inorganic Chemistry Department, Fritz Haber Institute of the Max Planck Society, Berlin, Germany
X-ray Powder Diffraction in Catalysis December 18th 2009
This lecture is designed as a practically oriented guide to powder XRD in catalysis, not as an introduction into the theoretical basics of X-ray diffraction.
Thus, the following topics are NOT covered here (refer to standard textbooks instead):
• generation of X-rays / working principle of an X-ray tube
•
X-ray spectrum:
continuous spectrum (bremsstrahlung) and line spectrum (characteristic spectrum)
• monochromatization
of X-rays
• derivation of the Bragg equation
• lattice planes, Miller indices (hkl), d-spacing
Disclaimer:
All references made here to particular hard-
or software are based solely on their availability to the author; this does not imply that these are preferable over alternative choices!
Introduction: scope of this lecture
Introduction
2/63Frank Girgsdies, Nanostructures, Inorganic Chemistry Department, Fritz Haber Institute of the Max Planck Society, Berlin, Germany
X-ray Powder Diffraction in Catalysis December 18th 2009
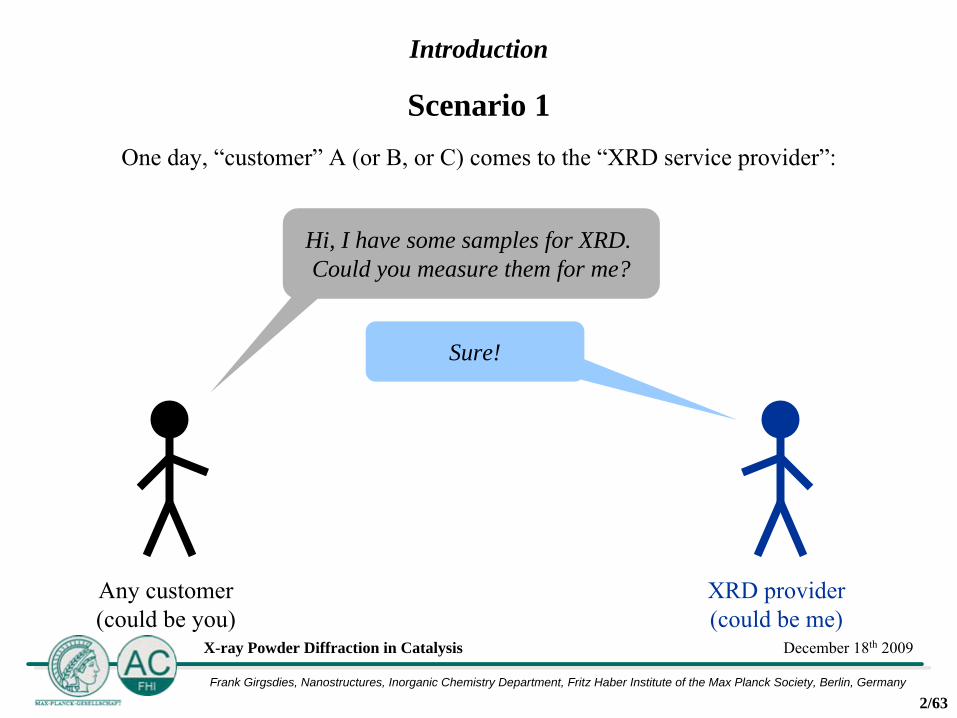
One day, “customer”
A (or B, or C) comes to the “XRD service provider”:
Scenario 1
Any customer(could be you)
XRD provider(could be me)
Hi, I have some samples for XRD. Could you measure them for me?
Sure!
Introduction
3/63Frank Girgsdies, Nanostructures, Inorganic Chemistry Department, Fritz Haber Institute of the Max Planck Society, Berlin, Germany
X-ray Powder Diffraction in Catalysis December 18th 2009
Another day (the measurements are finished), customer A comes again to the XRD service provider:
Scenario 2
Customer A
I’d like to analyze my XRD data, but I don’t have the necessary software.
Could you help me with that?
Sure!
XRD provider
Introduction
4/63Frank Girgsdies, Nanostructures, Inorganic Chemistry Department, Fritz Haber Institute of the Max Planck Society, Berlin, Germany
X-ray Powder Diffraction in Catalysis December 18th 2009
Yet another day, customer B comes again to the XRD service provider:Scenario 3
Customer B
Sure!
I’m not an expert in XRD, could you help me with the data analysis?
XRD provider
Introduction
5/63Frank Girgsdies, Nanostructures, Inorganic Chemistry Department, Fritz Haber Institute of the Max Planck Society, Berlin, Germany
X-ray Powder Diffraction in Catalysis December 18th 2009
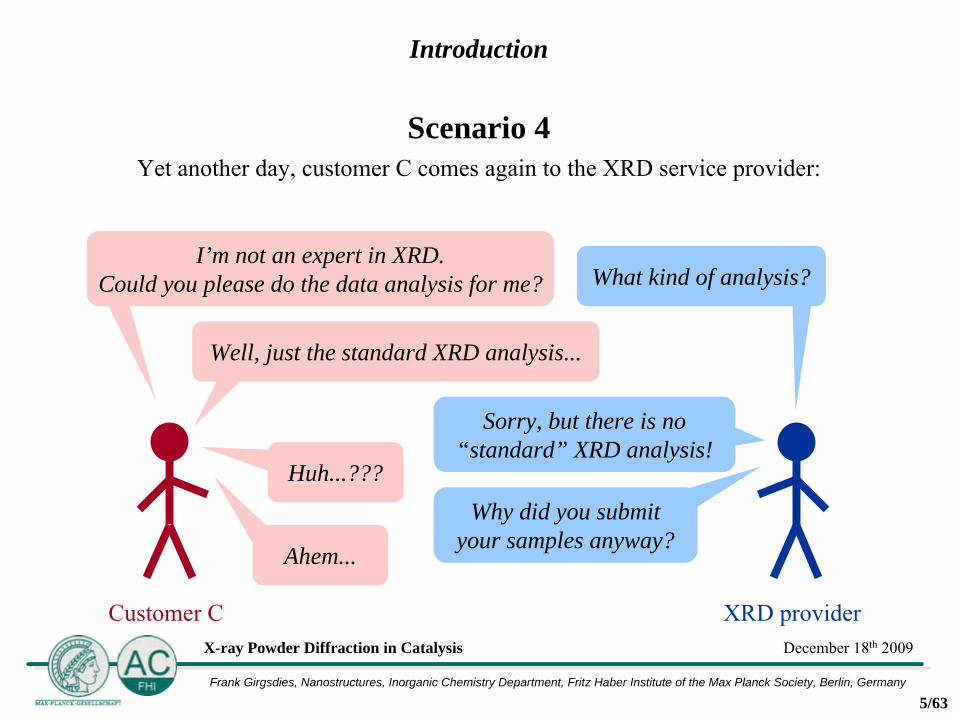
Yet another day, customer C comes again to the XRD service provider:Scenario 4
Customer C
I’m not an expert in XRD. Could you please do the data analysis for me?
XRD provider
Well, just the standard XRD analysis...
Huh...???
Ahem...
Sorry, but there is no “standard” XRD analysis!
Why did you submit your samples anyway?
What kind of analysis?
Introduction

6/63Frank Girgsdies, Nanostructures, Inorganic Chemistry Department, Fritz Haber Institute of the Max Planck Society, Berlin, Germany
X-ray Powder Diffraction in Catalysis December 18th 2009
• There is no such thing as a “standard XRD data analysis”.
• Powder XRD is able to address various questions (with varying amount of effort).
• The data analysis will depend on the kind of scientific question to be answered.
•
Ideally, even the measurement conditions should be optimized accordingly
(although this is rarely done).
• Communication between “customer”
and “service provider”
is important!
Lessons to be learned:
Goal of this lecture:After this lecture, you should be able to act like customer A or
B
(depending on your dedication and skill), and not like customer C!
Introduction

7/63Frank Girgsdies, Nanostructures, Inorganic Chemistry Department, Fritz Haber Institute of the Max Planck Society, Berlin, Germany
X-ray Powder Diffraction in Catalysis December 18th 2009
...
i.e. it is not• “X-ray spectrum”
(that’s a different method!),• “XRD spectrum”, • or “X-ray diffraction spectrum”,
but• XRD pattern,• X-ray diffraction pattern,• or diffractogram!
What is diffraction?• The type of diffraction we will talk about is more properly called Bragg diffraction.
• It occurs when waves of a suitable wavelength interact with periodically ordered matter.
•
In the chemical context “periodically ordered matter”
usually means crystalline substances, but it may also be ordered arrangements of clusters or pores.
Note: Diffraction is not spectroscopy!
Introduction

8/63Frank Girgsdies, Nanostructures, Inorganic Chemistry Department, Fritz Haber Institute of the Max Planck Society, Berlin, Germany
X-ray Powder Diffraction in Catalysis December 18th 2009
Diffraction methods
Note: In order to interact with a periodic array of atoms (crystal lattice), the wavelength needs to be roughly in the Ångtröm
range (1 Å
= 10−10
m).
Diffraction methods can be distinguished according to
a) the particles/waves that are diffracted:•
photons (electromagnetic waves): X-rays → X-ray diffraction (XRD)•
electrons: ~10 kV (SEM), ~120 kV (TEM) → electron diffraction•
neutrons: thermal or cold neutrons (slowed down by a moderator when
leaving the nuclear reactor) → neutron diffraction
b) the diffracting specimen:•
single crystals → single crystal diffraction•
crystalline powders (and other polycrystalline specimens)
→ powder diffraction
Introduction
9/63Frank Girgsdies, Nanostructures, Inorganic Chemistry Department, Fritz Haber Institute of the Max Planck Society, Berlin, Germany
X-ray Powder Diffraction in Catalysis December 18th 2009
Characteristics of X-ray diffraction
•
X-rays interact with the electron shells of atoms. •
Both the “diffraction power”
and the absorption for X-rays increase with the number of electrons (and thus the atomic number), i.e. samples containing heavy elements give higher diffraction intensities, but are also
more susceptible to absorption effects.
•
Atoms or ions with a very similar number of electrons cannot be distinguished in a crystal structure by XRD.
•
XRD is a method to analyze the average bulk structure of long range ordered materials (crystalline substances above a minimum crystallite size).
Introduction
10/63Frank Girgsdies, Nanostructures, Inorganic Chemistry Department, Fritz Haber Institute of the Max Planck Society, Berlin, Germany
X-ray Powder Diffraction in Catalysis December 18th 2009
Diffractometer geometries
Classic reflection geometry (Bragg-Brentano geometry)
•
divergent primary beam → relatively large sample area illuminated
•
illuminated area decreases with increasing diffraction angle (unless variable slits are used)
•
sample focuses diffracted beams into the detector slit
•
best for strongly absorbing samples
•
in addition to powders, solid specimens with a flat surface can be measured (wafers, thin films on a substrate, pellets, ...)
•
easily adapted for in situ investigations
•
secondary monochromatization
→ usually Kα1+2
radiation, removal of fluorescence (except anode element)
Diffractometer geometries

11/63Frank Girgsdies, Nanostructures, Inorganic Chemistry Department, Fritz Haber Institute of the Max Planck Society, Berlin, Germany
X-ray Powder Diffraction in Catalysis December 18th 2009
Diffractometer geometries
Simplified representation of the Bragg-Brentano geometry
Diffractometer geometries
X-ray tubedetector
sample holder with sample

12/63Frank Girgsdies, Nanostructures, Inorganic Chemistry Department, Fritz Haber Institute of the Max Planck Society, Berlin, Germany
X-ray Powder Diffraction in Catalysis December 18th 2009
Diffractometer geometries
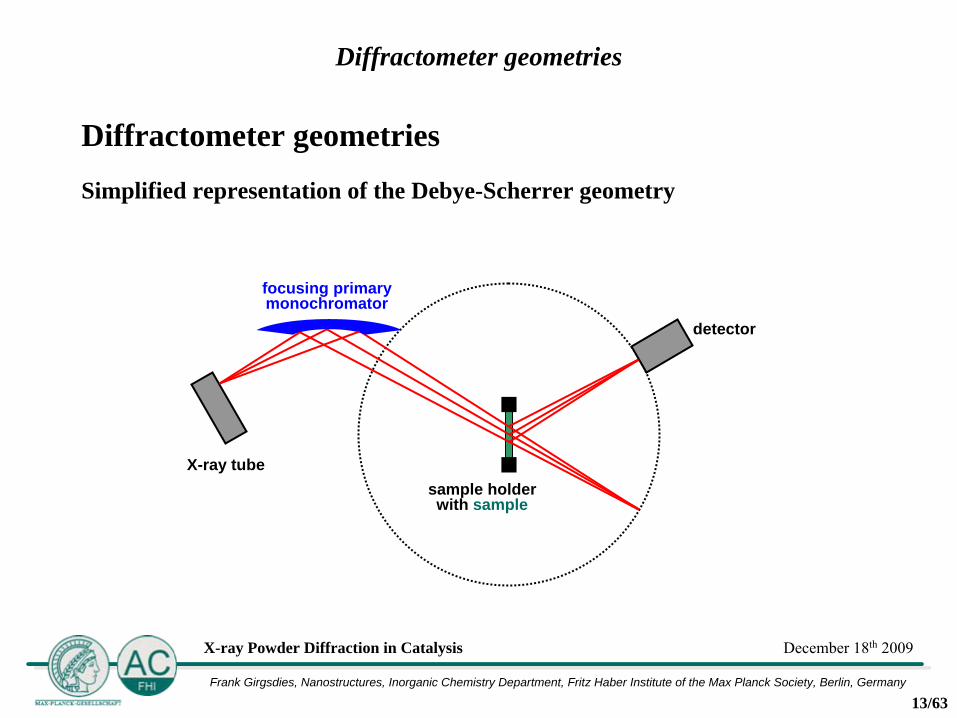
Classic transmission geometry (Debye-Scherrer geometry)
•
bent primary monochromator focuses the primary beam through the sample into the detector slit → relatively small sample area illuminated
•
illuminated area increases with increasing diffraction angle
•
pure Kα1
radiation
•
usually no secondary monochromator → fluorescence background from elements left of anode material in the periodic system
•
best for samples with low absorption
•
capillaries can be used as sample holders (air sensitive samples, suspensions)
Diffractometer geometries
13/63Frank Girgsdies, Nanostructures, Inorganic Chemistry Department, Fritz Haber Institute of the Max Planck Society, Berlin, Germany
X-ray Powder Diffraction in Catalysis December 18th 2009
Diffractometer geometries
Simplified representation of the Debye-Scherrer geometry
Diffractometer geometries
X-ray tube
detector
sample holder with sample
focusing primary monochromator

14/63Frank Girgsdies, Nanostructures, Inorganic Chemistry Department, Fritz Haber Institute of the Max Planck Society, Berlin, Germany
X-ray Powder Diffraction in Catalysis December 18th 2009
Diffractometer geometries
Parallel beam geometry
•
Göbel
mirror (parabolically
bent multilayer mirror → total reflection of X-rays at take-off angle <1°) focuses divergent primary beam into parallel beam
•
small illuminated area with high beam intensity
•
can be used for both reflection and transmission measurements
•
no displacement (sample positioning) problems → investigation of irregularly shaped samples
Diffractometer geometries

15/63Frank Girgsdies, Nanostructures, Inorganic Chemistry Department, Fritz Haber Institute of the Max Planck Society, Berlin, Germany
X-ray Powder Diffraction in Catalysis December 18th 2009
Diffractometer geometries
Simplified representation of the parallel beam geometry
Diffractometer geometries
X-ray tube detector
sample holder with sample
Göbel mirror
irregularly shaped bulk sample
16/63Frank Girgsdies, Nanostructures, Inorganic Chemistry Department, Fritz Haber Institute of the Max Planck Society, Berlin, Germany
X-ray Powder Diffraction in Catalysis December 18th 2009
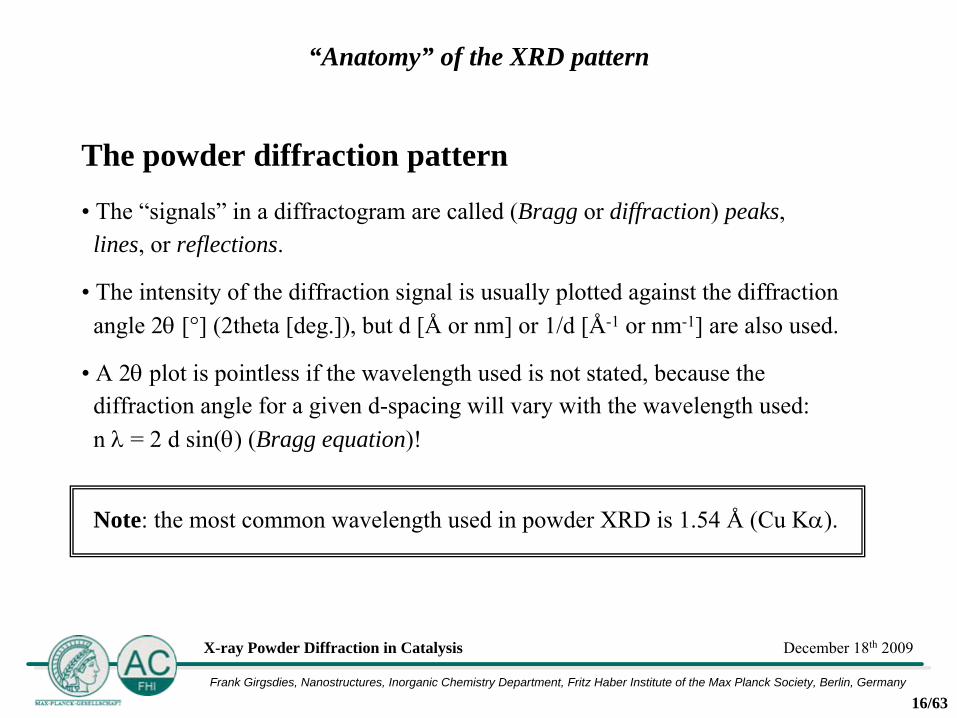
The powder diffraction pattern
•
The “signals”
in a diffractogram are called (Bragg or diffraction) peaks,
lines, or reflections.
•
The intensity of the diffraction signal is usually plotted against the diffraction
angle 2θ
[°]
(2theta [deg.]), but d [Å
or nm] or 1/d [Å-1
or nm-1] are also used.
•
A 2θ
plot is pointless if the wavelength used is not stated, because
the
diffraction angle for a given d-spacing will vary with the wavelength used:
n λ
= 2 d sin(θ) (Bragg equation)!
Note: the most common wavelength used in powder XRD is 1.54 Å
(Cu Kα).
“Anatomy” of the XRD pattern

17/63Frank Girgsdies, Nanostructures, Inorganic Chemistry Department, Fritz Haber Institute of the Max Planck Society, Berlin, Germany
X-ray Powder Diffraction in Catalysis December 18th 2009
peak area (integral intensity)→ real measure for peak intensity
→ • crystal structure (contents of the unit cell)
•
phase amount (in a mixture)
peak shape (peak profile)→ crystallite size, defects
(strain, disorder)
0
1000
2000
3000
4000
5000
6000
7000
20 25 30 35 40 45 50 55 60 65 702theta [°]
Inte
nsity
[cou
nts]
peak position→ d-spacing
→ lattice parameters (metrics of the unit cell)
peak height (maximum intensity)→ approximation
for peak intensity
peak width→ crystallite size, defects (strain, disorder)•
full width at half maximum (FWHM), also known as “half width” → depends on peak profile!
•
integral breadth (= integral intensity / maximum intensity) → less dependent on peak profile
Information content of an idealized diffraction pattern
“Anatomy” of the XRD pattern

18/63Frank Girgsdies, Nanostructures, Inorganic Chemistry Department, Fritz Haber Institute of the Max Planck Society, Berlin, Germany
X-ray Powder Diffraction in Catalysis December 18th 2009
Idealized diffraction peaks
Change of peak height with FWHM (peak shape and area constant)→ the stronger the peak broadening,
the worse the peak-height
approximation for intensity!
Change of peak height with peak shape (FWHM and area constant)→ Lorentzian
peak profiles extend
relatively far from peak center
GaussianPseudo-Voigt (50% Gauss)Lorentzian
FWHM = xFWHM = 2xFWHM = 4x
“Anatomy” of the XRD pattern
19/63Frank Girgsdies, Nanostructures, Inorganic Chemistry Department, Fritz Haber Institute of the Max Planck Society, Berlin, Germany
X-ray Powder Diffraction in Catalysis December 18th 2009
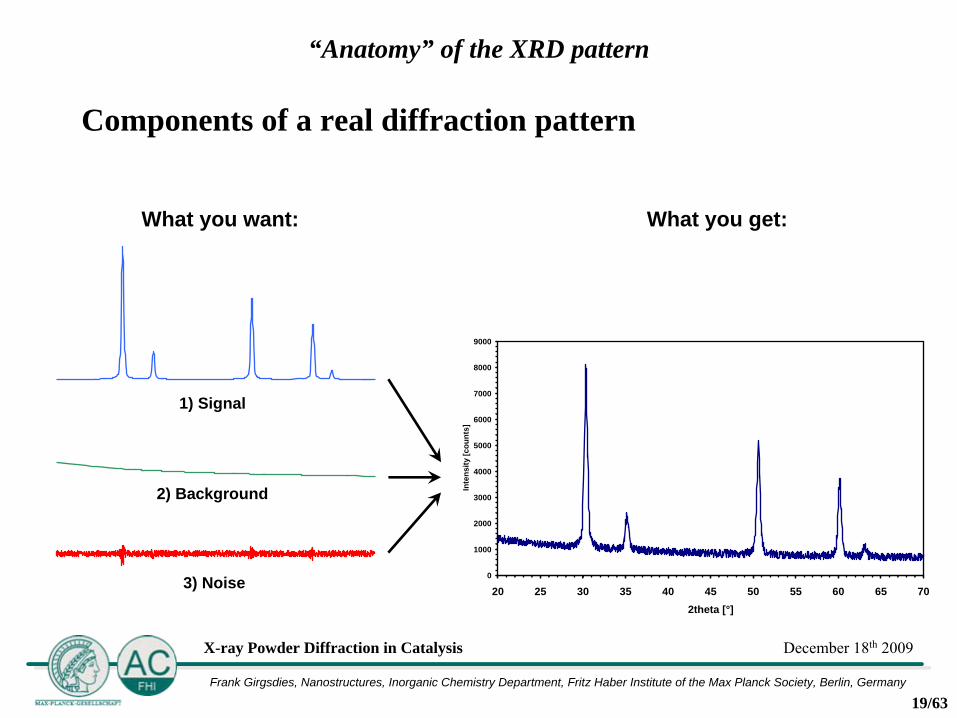
What you want:
0
1000
2000
3000
4000
5000
6000
7000
8000
9000
20 25 30 35 40 45 50 55 60 65 702theta [°]
Inte
nsity
[cou
nts]
What you get:
1) Signal
2) Background
3) Noise
Components of a real diffraction pattern
“Anatomy” of the XRD pattern

20/63Frank Girgsdies, Nanostructures, Inorganic Chemistry Department, Fritz Haber Institute of the Max Planck Society, Berlin, Germany
X-ray Powder Diffraction in Catalysis December 18th 2009
Components of a real diffraction pattern
Precise analysis of XRD data requires “separation”
of the sample signal frombackground and noise.
•
The signal/noise ratio can be enhanced by measuring more counts,
e.g. by
increasing the incoming beam intensity(usually not much room for improvement)
increasing the amount of sample in the beam(illuminated area rather than sample thickness!)
increasing the counting time (but: square-root law!)
•
The separation of signal and background is not trivial and thus should be iterative (background refinement instead of background subtraction).
background subtraction only for displaying data, not for analysis(except qualitative analysis)!
“Anatomy” of the XRD pattern
21/63Frank Girgsdies, Nanostructures, Inorganic Chemistry Department, Fritz Haber Institute of the Max Planck Society, Berlin, Germany
X-ray Powder Diffraction in Catalysis December 18th 2009
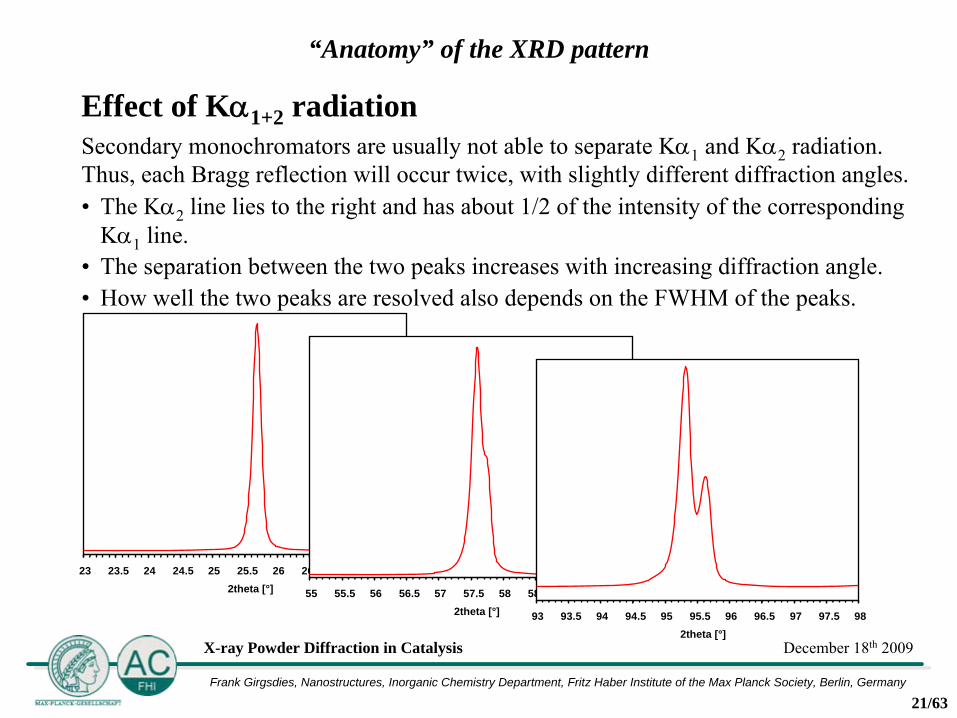
Effect of Kα1+2 radiationSecondary monochromators
are usually not able to separate Kα1
and Kα2
radiation. Thus, each Bragg reflection will occur twice, with slightly different diffraction angles.•
The Kα2
line lies to the right and has about 1/2 of the intensity of the corresponding
Kα1
line.• The separation between the two peaks increases with increasing diffraction angle.• How well the two peaks are resolved also depends on the FWHM of the peaks.
“Anatomy” of the XRD pattern
23 23.5 24 24.5 25 25.5 26 26.5 27 27.5 282theta [°] 55 55.5 56 56.5 57 57.5 58 58.5 59 59.5 60
2theta [°] 93 93.5 94 94.5 95 95.5 96 96.5 97 97.5 982theta [°]
22/63Frank Girgsdies, Nanostructures, Inorganic Chemistry Department, Fritz Haber Institute of the Max Planck Society, Berlin, Germany
X-ray Powder Diffraction in Catalysis December 18th 2009
Possibilities of XRD analysis
•
Qualitative analysis (identification of crystalline phases)
needs: peak positions, approximate relative intensities (“fingerprint”)
tools: PDF database (powder diffraction file)
• Quantitative analysis (amount of phases in a crystalline mixture)
a) crude method: free-hand scaling of PDF patterns to measured data
needs: I/Icor
value for ALL phases involved tools: PDF database
b) sophisticated method: Rietveld quantification
(fit of calculated intensities to measured data)
needs: appropriate crystal structure model for ALL phases involved
tools: crystal structure database (e.g. ICSD, CRYSTMET, CSD,
...)
Possibilities of XRD analysis

23/63Frank Girgsdies, Nanostructures, Inorganic Chemistry Department, Fritz Haber Institute of the Max Planck Society, Berlin, Germany
X-ray Powder Diffraction in Catalysis December 18th 2009
Possibilities of XRD analysis
• Quantification of crystalline vs. amorphous material
a) using internal standard of known crystallinity (spiking method)
needs: XRD quantification standard of known crystallinity,
sophisticated mixing
b) using external standards
needs: two reference samples (100% amorphous, 100% crystalline)
c) using standard free approach
needs: very precise XRD measurement, reference measurements
to
correct for air and sample holder contribution, sophisticated
software
Possibilities of XRD analysis
24/63Frank Girgsdies, Nanostructures, Inorganic Chemistry Department, Fritz Haber Institute of the Max Planck Society, Berlin, Germany
X-ray Powder Diffraction in Catalysis December 18th 2009
Possibilities of XRD analysis
• Analysis of phase properties
lattice parametersneeds: peak positions
crystallite size, strainneeds: peak profile shape & width; instrument function (for correction)
crystal structure refinement (Rietveld)needs: peak intensities (as accurate as possible!), crystal structure model
•
Crystal structure determination (structure solution)
needs: peak intensities (as accurate as possible!);
unit cell parameters / indexing of diffraction peaks;
space group (at least a guess);
chemical information (e.g. empirical formula)
Possibilities of XRD analysis
25/63Frank Girgsdies, Nanostructures, Inorganic Chemistry Department, Fritz Haber Institute of the Max Planck Society, Berlin, Germany
X-ray Powder Diffraction in Catalysis December 18th 2009
Peak fitting methods
There are three classes of peak fitting methods:
a)
Single peak fitting•
One or more peaks are fitted individually.•
The resulting parameters (e.g. intensity, FWHM, profile shape, peak position) are usually assembled in a peak list.
•
The peak list may be the basis for further analysis (pattern matching/identification, refinement of lattice parameters, indexing ...).
b)
Whole pattern fitting•
One or more types of parameters are correlated for a set of peaks (which are assumed to belong all to the same phase), some options are:
peak shape/width are the samepeak shape/width are a smooth function of 2θpeak positions are correlated via the lattice parameters
•
Peak intensities are usually free running parameters.
Possibilities of XRD analysis: peak fitting
26/63Frank Girgsdies, Nanostructures, Inorganic Chemistry Department, Fritz Haber Institute of the Max Planck Society, Berlin, Germany
X-ray Powder Diffraction in Catalysis December 18th 2009
Peak fitting methods
c)
Rietveld fitting•
The peak intensities are not fit parameters but are calculated from the crystal structure of the compound.
•
Optional: The calculated intensities are modified by refinement of a preferred orientation model.
•
Peak shape/width are a smooth function of 2θ.•
Peak positions are correlated via the lattice parameters.
Possibilities of XRD analysis: peak fitting
27/63Frank Girgsdies, Nanostructures, Inorganic Chemistry Department, Fritz Haber Institute of the Max Planck Society, Berlin, Germany
X-ray Powder Diffraction in Catalysis December 18th 2009
Phase identification (qualitative analysis)
There are various ways to perform a phase identification. Usually, the diffraction pattern is matched against reference patterns from a database:
•
diffraction pattern:
either the measured data (may require background subtraction)
or a peak list (positions and intensities) derived thereof
•
peak list generation:
peak search (position and intensity at maximum height of the peak)
or peak fitting (position and intensity more accurate)
•
database:
commercial (PDF = powder diffraction file, maintained by the ICDD)
or user defined (or combination of both)
•
matching process:
manual or automatic
Possibilities of XRD analysis: qualitative analysis

28/63Frank Girgsdies, Nanostructures, Inorganic Chemistry Department, Fritz Haber Institute of the Max Planck Society, Berlin, Germany
X-ray Powder Diffraction in Catalysis December 18th 2009
Phase identification: FAQ
Q: How many peaks must match between a reference PDF pattern and
a measured diffractogram?
A: Generally, ALL
peaks found in a PDF pattern
must also be seen in in the diffractogram, otherwise it is not a valid match.
Possible exceptions:
a)
Small peaks may be not detectable if the noise level is too high.
b)
Missing peaks may be the result of a very strong preferred orientation effect. → If this is the case, the relative intensities in general are changed and show
a systematic dependence from hkl.
c)
“Missing”
peaks may be the result of anisotropic disorder. → If this is the case, the FWHM of the peaks should show a systematic
dependence from hkl (some reflections become so broad and low that they
are not recognized anymore).
Possibilities of XRD analysis: qualitative analysis
obs
ref
obs
ref
obs
ref

29/63Frank Girgsdies, Nanostructures, Inorganic Chemistry Department, Fritz Haber Institute of the Max Planck Society, Berlin, Germany
X-ray Powder Diffraction in Catalysis December 18th 2009
Phase identification: FAQ
Q:
All peaks of a PDF pattern are in the measured data, but the measurement contains additional peaks. What does this mean?
A:
The identification is probably correct, but the measured pattern
represents a phase mixture. →Keep the reference pattern you found, then continue searching for references
to explain the additional peaks. Proceed until all peaks are explained.
Possibilities of XRD analysis: qualitative analysis
obs
ref ?
obs
ref1
ref2
30/63Frank Girgsdies, Nanostructures, Inorganic Chemistry Department, Fritz Haber Institute of the Max Planck Society, Berlin, Germany
X-ray Powder Diffraction in Catalysis December 18th 2009
Phase identification: FAQ
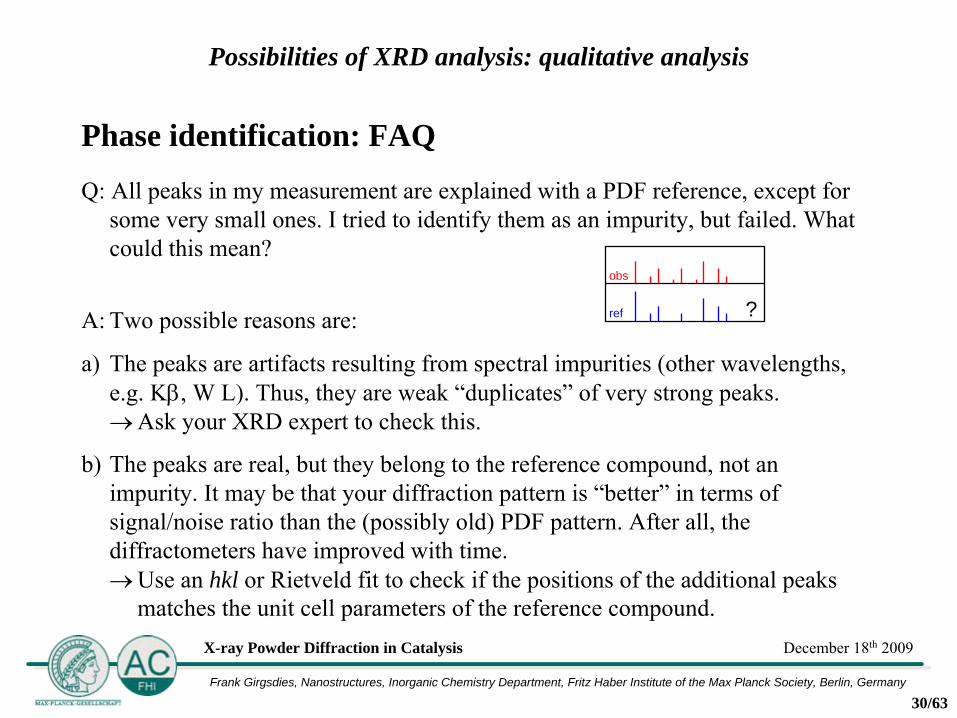
Q: All peaks in my measurement are explained with a PDF reference, except for some very small ones. I tried to identify them as an impurity, but failed. What could this mean?
A:
Two possible reasons are:
a)
The peaks are artifacts resulting from spectral impurities (other wavelengths, e.g. Kβ, W L). Thus, they are weak “duplicates”
of very strong peaks.
→Ask your XRD expert to check this.
b)
The peaks are real, but they belong to the reference compound, not an impurity. It may be that your diffraction pattern is “better”
in terms of signal/noise ratio than the (possibly old) PDF pattern. After all, the diffractometers have improved with time.
→Use an hkl or Rietveld fit to check if the positions of the additional peaks
matches the unit cell parameters of the reference compound.
Possibilities of XRD analysis: qualitative analysis
obs
ref ?

31/63Frank Girgsdies, Nanostructures, Inorganic Chemistry Department, Fritz Haber Institute of the Max Planck Society, Berlin, Germany
X-ray Powder Diffraction in Catalysis December 18th 2009
Phase identification: FAQ
Q:
The position of all peaks matches between PDF reference and measurement, but the relative intensities disagree. What does this mean?
A:
There are various possible reasons:
a)
The identification is correct, but there are preferred orientation effects in the measured data. →The deviation of intensities should be systematic with hkl →Check with Rietveld fit including a preferred orientation model
b)
The identification is correct, but the PDF intensities have a low level of precision.
→Check if the PDF intensities have only discrete,
round values (e.g. 100%, 80%, 50% etc.). If so, this data originally comes from visual
evaluation of a photographic film.
c)
The identification is incorrect, the peak positions coincide by chance
(not very likely, but possible).
Possibilities of XRD analysis: qualitative analysis
obs
ref ?
obs
ref

32/63Frank Girgsdies, Nanostructures, Inorganic Chemistry Department, Fritz Haber Institute of the Max Planck Society, Berlin, Germany
X-ray Powder Diffraction in Catalysis December 18th 2009
Phase identification: FAQ
Q:
The intensity pattern of the PDF reference and the measured peaks look very similar, but the peaks positions deviate. What does this mean?
A:
The identification is more or less correct, but the lattice parameters differ slightly. Possible reasons are:
a)
Thermal expansion leads to a change in the lattice parameters and thus of the peak positions.
→The reference pattern may have been measured at a different temperature.
→Check the details of the PDF entry!
b)
The chemical composition is different (doping, solid solution, isostructural
compound, variable amount of vacancies, ...).
→Check if adjustment of the lattice parameters gives a satisfactory match.
If so, you have at least identified the structure type.
Possibilities of XRD analysis: qualitative analysis
obs
ref ?
Example: Instead of AO2
, you may have A1-x
Bx
O2
, BO2
, AO2-x
, ...
33/63Frank Girgsdies, Nanostructures, Inorganic Chemistry Department, Fritz Haber Institute of the Max Planck Society, Berlin, Germany
X-ray Powder Diffraction in Catalysis December 18th 2009
Phase identification: FAQ
Q:
All peaks of my diffraction pattern are explained with the reference PDF card of my target compound. The peak positions and intensities agree very well. Does this mean that my sample is pure?
A:
No. Your sample may or may not be pure. There could be impurities which are invisible to XRD, either because the amount is below the detection limit, or because they are “XRD amorphous”.
Possibilities of XRD analysis: qualitative analysis
34/63Frank Girgsdies, Nanostructures, Inorganic Chemistry Department, Fritz Haber Institute of the Max Planck Society, Berlin, Germany
X-ray Powder Diffraction in Catalysis December 18th 2009
Phase identification: FAQ
Q:
My diffraction pattern shows no peaks. Does this mean that my sample is amorphous?
A:
Not necessarily. If you want to be safe, you should say that it is “XRD amorphous”. This means that it may be either truly amorphous, or that the crystallite size is below the detection limit for XRD (roughly 30 Å). In the latter case, a TEM analysis may reveal small crystallites with lattice fringes.
Possibilities of XRD analysis: qualitative analysis
35/63Frank Girgsdies, Nanostructures, Inorganic Chemistry Department, Fritz Haber Institute of the Max Planck Society, Berlin, Germany
X-ray Powder Diffraction in Catalysis December 18th 2009
Quantitative Rietveld analysis
Rietveld fitting can be used to quantify crystalline compounds in a mixture.
Preconditions and limitations:
•
A crystal structure model is required for each
compound to be accounted for.
•
The accuracy of the fit will not only depend from the usual factors like data quality (signal/noise ration) and detection limits, but also from the appropriateness of the structure models used.
•
The level of accuracy is usually unknown, unless the procedure can be checked with known mixtures.
•
“100%”
corresponds to the total of all phases accounted for in the fit, which is not necessarily identical to 100% of the sample (neglected: XRD amorphous material, unknown phases, known phases without crystal structure
model).
•
The results may be re-scaled using a known amount of an internal diffraction standard.
Possibilities of XRD analysis: quantitative analysis

36/63Frank Girgsdies, Nanostructures, Inorganic Chemistry Department, Fritz Haber Institute of the Max Planck Society, Berlin, Germany
X-ray Powder Diffraction in Catalysis December 18th 2009
Quantitative Rietveld analysis: theoretical example
Let us assume that a sample has the following composition:
40% crystalline phase A
(crystal structure known)
30% crystalline phase B
(crystal structure known)
20% unknown crystalline phase
10% XRD amorphous material
A Rietveld fit using structure models of phases A and B will yield:
57.1% phase A
42.9% phase B
(plus extra peaks...)
→ You can quantify only what you know and what you can see!
The result is limited to the determination of the ratio between the phases A and B,
and the realization that there is at least one unknown crystalline phase.
Possibilities of XRD analysis: quantitative analysis

37/63Frank Girgsdies, Nanostructures, Inorganic Chemistry Department, Fritz Haber Institute of the Max Planck Society, Berlin, Germany
X-ray Powder Diffraction in Catalysis December 18th 2009
Quantitative Rietveld analysis: theoretical example
The sample composition is now:
50% diffraction standard
20% crystalline phase A
15% crystalline phase B
10% unknown crystalline phase
5% XRD amorphous material
A Rietveld fit will yield:
58.8% standard
23.5% phase A 17.6% phase B
The absolute amounts of the phases A and B are now determined. However, how much XRD amorphous material is present (if any) must remain unknown,
because of the presence of an undescribed
crystalline phase!
Now we mix the same sample with a diffraction standard (100% crystalline, crystal structure known), e.g. in an amount of 50 wt.% (spiking method).
Re-scaling the standard to 50% gives:
50.0% standard
20.0% phase A 15.0% phase B
15.0% unknown
material
Re-calculating the result gives:
40.0% phase A 30.0% phase B
30.0% unknown
material
Possibilities of XRD analysis: quantitative analysis
38/63Frank Girgsdies, Nanostructures, Inorganic Chemistry Department, Fritz Haber Institute of the Max Planck Society, Berlin, Germany
X-ray Powder Diffraction in Catalysis December 18th 2009
Note on quantitative Rietveld analysis:Unlike in spectroscopy, the diffraction intensities of the components in a phase
mixture are NOT strictly proportional to the concentration of the compounds.
Thus, the previous examples are not really correct, they are used only to demonstrate the principle of calculating using an internal standard.
Quantitative Rietveld analysis requires sophisticated software to solve the iterative problem of determining concentrations in phase mixtures.
Possibilities of XRD analysis: quantitative analysis
39/63Frank Girgsdies, Nanostructures, Inorganic Chemistry Department, Fritz Haber Institute of the Max Planck Society, Berlin, Germany
X-ray Powder Diffraction in Catalysis December 18th 2009
Using an internal XRD quantification standard: practical aspects
For successful use of an internal quantification standard, the portion of sample exposed to the X-ray beam must be representative for the whole sample.
→
The original sample must be homogeneous (this is true for all quantification!).
→
The original sample must be homogeneously mixed with the standard.
→
Ideally, standard and sample should have the same particle size
(differently sized particles tend to unmix
easily!).
The standard should have an absorption coefficient which is similar to that of the sample. Otherwise, microabsorption
effects may distort the results.
Possibilities of XRD analysis: quantitative analysis
40/63Frank Girgsdies, Nanostructures, Inorganic Chemistry Department, Fritz Haber Institute of the Max Planck Society, Berlin, Germany
X-ray Powder Diffraction in Catalysis December 18th 2009
Lattice parameter determinationThe diffraction angle of a peak is related to the d-spacing of the corresponding lattice planes via the Bragg equation. If both d-spacings
and Miller indices (hkl)* are known for a set of reflections, the lattice parameters (a, b, c; α, β, γ) of the unit cell can be refined.•
The minimum number of independent reflections required is equal to the
number of lattice parameters.
•
Refinement of angle correction parameters (zero shift and/or displacement)
requires a minimum of one additional reflection (per parameter).
• More reflections will yield better results.• Higher angle reflections have a higher precision than lower angle peaks.
* Note: the Miller indices of individual reflections need not be known
explicitly.
Knowing the approximate unit cell parameters is usually sufficient to allow an
assignment of hkl indices to the reflections.
Possibilities of XRD analysis: lattice parameters
41/63Frank Girgsdies, Nanostructures, Inorganic Chemistry Department, Fritz Haber Institute of the Max Planck Society, Berlin, Germany
X-ray Powder Diffraction in Catalysis December 18th 2009
Lattice parameter determinationThere are various routes to obtain refined lattice parameters, which can be divided into two groups:a)
The determination of d-spacings
(peak list generation) and unit cell refinement
are conducted as two consecutive steps.•
Advantage: Relatively simple procedures/software (only single peak fitting
required).
•
Disadvantage: Errors in the first step will irreversibly influence the second step.
b)
Peak fitting and cell parameter refinement are performed simultaneously.•
Advantage: The simultaneous refinement imposes restrictions on the refined parameters, which minimizes errors.
•
Disadvantage: More sophisticated fitting procedure/software is needed (whole pattern fitting or Rietveld fitting required).
Possibilities of XRD analysis: lattice parameters
42/63Frank Girgsdies, Nanostructures, Inorganic Chemistry Department, Fritz Haber Institute of the Max Planck Society, Berlin, Germany
X-ray Powder Diffraction in Catalysis December 18th 2009
Size/strain analysis: peak broadening
A sample consisting of ideal crystallites measured on an ideal diffractometer would yield sharp (zero width) diffraction lines. However, no ideal crystals or diffractometers exist in reality.
→ XRD peak profile shape and width are the result of imperfections in both the
experimental setup and the sample.
Observed peak broadening combines the effects of instrumental broadening and sample broadening.
→ In order to investigate sample broadening, the contribution of instrumental
broadening (instrument function) must be known!
Possibilities of XRD analysis: size/strain analysis

43/63Frank Girgsdies, Nanostructures, Inorganic Chemistry Department, Fritz Haber Institute of the Max Planck Society, Berlin, Germany
X-ray Powder Diffraction in Catalysis December 18th 2009
Size/strain analysis: instrument function
The instrumental broadening contribution to a diffraction peak profile is a function of the diffraction angle 2θ
(thus the term instrument function).
The instrument function of any setup can be determined by measuring an appropriate diffraction standard material.
→ Sample broadening of the standard must be negligible.
For some diffraction geometries (Bragg-Brentano and parallel beam), a good approximation for the instrument function can be calculated from
the hardware parameters (goniometer
radius, slit width, sample size, ...) if they are known sufficiently well (fundamental parameters approach).
→ Standard-free analysis of sample broadening possible!
Possibilities of XRD analysis: size/strain analysis
44/63Frank Girgsdies, Nanostructures, Inorganic Chemistry Department, Fritz Haber Institute of the Max Planck Society, Berlin, Germany
X-ray Powder Diffraction in Catalysis December 18th 2009
Size/strain analysis: sample broadening
The Bragg diffraction occurs within coherently scattering regions of the crystals. Thus, both the finite size of these coherent regions and disturbances within the regions will lead to a broadening of the diffraction peaks. These two sources of sample broadening are usually termed size and strain effect, respectively.
Size effect: Bragg diffraction would be perfect only with infinitely large crystals. The termination of the crystal periodicity at the crystallite boundaries is an imperfection leading to peak broadening:
smaller crystallite → smaller number of periods (unit cells) = smaller column length → larger imperfection → stronger broadening.
Size broadening usually becomes apparent for crystallites smaller than ca. 1000 Å.
Below ca. 30 Å, the peaks become so broad and low that they cannot be distinguished from the background. The material is then “XRD amorphous”.
Strain effect: dislocations, vacancies, interstitials, substitutionals, and similar defects are imperfections which generate a distribution in the d-spacings
of lattice planes and thus result in peak broadening.
Possibilities of XRD analysis: size/strain analysis

45/63Frank Girgsdies, Nanostructures, Inorganic Chemistry Department, Fritz Haber Institute of the Max Planck Society, Berlin, Germany
X-ray Powder Diffraction in Catalysis December 18th 2009
Size/strain analysis: size effect
First, the term “size”
needs to be defined more carefully:
(Figure taken from the TOPAS Users Manual, Bruker
AXS)
particle or grain size crystal size crystallite size domain size ≥ ≥ ≥
Methods:
light microscopy, SEM, laser size analysis, sieving, ...
Problems:
agglomeration
Methods:
XRD, HRTEM
Problems:
XRD only indirect!
Possibilities of XRD analysis: size/strain analysis
46/63Frank Girgsdies, Nanostructures, Inorganic Chemistry Department, Fritz Haber Institute of the Max Planck Society, Berlin, Germany
X-ray Powder Diffraction in Catalysis December 18th 2009
Size/strain analysis: size effect
Powder XRD is only able to determine the so-called column length from the size broadening effect. How this translates into crystallite size depends on many (usually unknown) factors, like crystallite shape, domain structure, nature of the size distribution etc.→ Work with column lengths rather than crystallite sizes!
There are dozens of methods for crystallite size determination by XRD, which will all yield different results. Even when using the same method on the same material, different choice of calibration or pre-assumptions may yield different results. → Comparison of results from different groups or people is impossible in most cases.→ Results should be published with a detailed description of the determination procedure if the absolute crystallite size values are meant to be used for external comparison.→ Use a constant procedure for a series of samples and rely on the relative trends seen in the results rather than believe in absolute values!
Possibilities of XRD analysis: size/strain analysis
47/63Frank Girgsdies, Nanostructures, Inorganic Chemistry Department, Fritz Haber Institute of the Max Planck Society, Berlin, Germany
X-ray Powder Diffraction in Catalysis December 18th 2009
Size/strain analysis: the Scherrer formula
1918 Scherrer
proposed the following equation for the dependence of the peak width from the crystallite size:
β
= λ
/ (ε
· cosθ)
β:
FWHM of the peak profile (corrected for instrumental broadening)
ε:
“apparent crystallite size”
→ depends on “true crystallite size”
and hkl → no physical interpretation!
A relation between ε
and the volume weighted mean column length LVol
can be established by introduction of the Scherrer
constant k:
ε
= LVol
/ k k depends on the crystallite shape and is usually unknown,
but is often assumed to be ≅
0.89
Thus, we get:
β
= k ·
λ
/ (LVol
· cosθ)
Possibilities of XRD analysis: size/strain analysis
48/63Frank Girgsdies, Nanostructures, Inorganic Chemistry Department, Fritz Haber Institute of the Max Planck Society, Berlin, Germany
X-ray Powder Diffraction in Catalysis December 18th 2009
Size/strain analysis: LVol
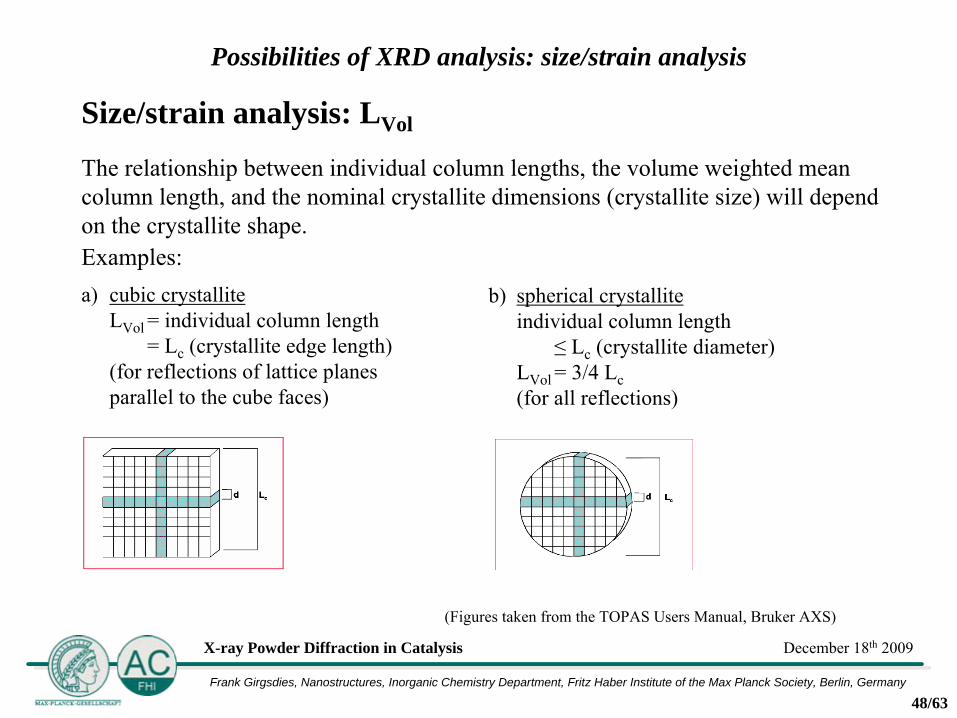
The relationship between individual column lengths, the volume weighted mean column length, and the nominal crystallite dimensions (crystallite size) will depend on the crystallite shape.Examples:
Possibilities of XRD analysis: size/strain analysis
(Figures taken from the TOPAS Users Manual, Bruker
AXS)
a)
cubic crystallite
LVol
= individual column length = Lc
(crystallite edge length)
(for reflections of lattice planes parallel to the cube faces)
b)
spherical crystallite
individual column length
≤
Lc
(crystallite diameter)
LVol
= 3/4 Lc
(for all reflections)
49/63Frank Girgsdies, Nanostructures, Inorganic Chemistry Department, Fritz Haber Institute of the Max Planck Society, Berlin, Germany
X-ray Powder Diffraction in Catalysis December 18th 2009
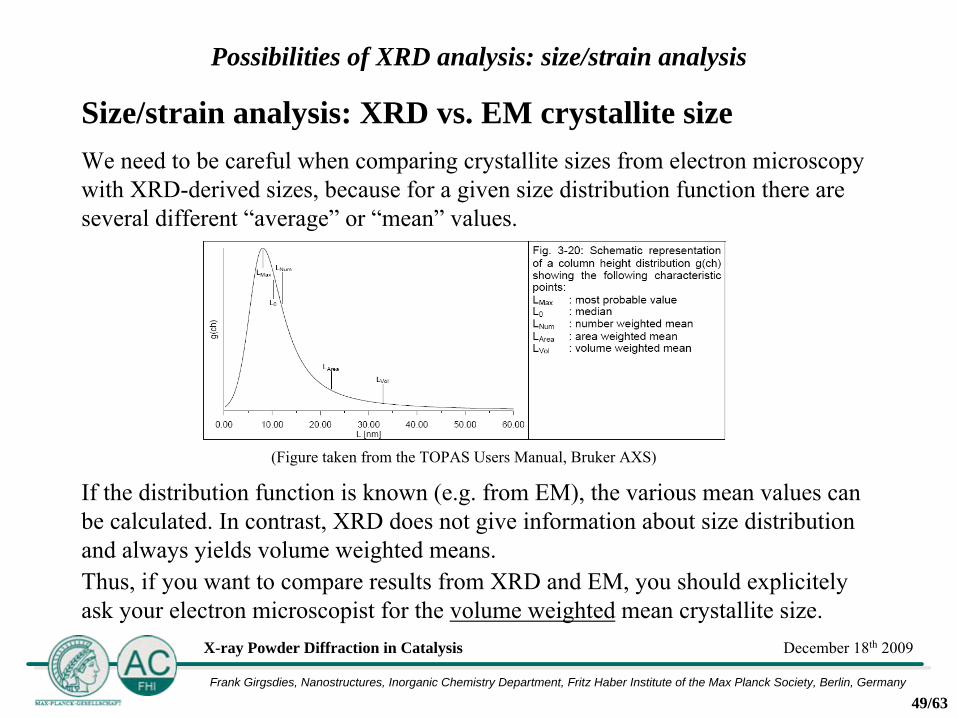
Size/strain analysis: XRD vs. EM crystallite sizeWe need to be careful when comparing crystallite sizes from electron microscopy with XRD-derived sizes, because for a given size distribution function there are several different “average”
or “mean”
values.
Possibilities of XRD analysis: size/strain analysis
If the distribution function is known (e.g. from EM), the various mean values can be calculated. In contrast, XRD does not give information about size distribution and always yields volume weighted means.Thus, if you want to compare results from XRD and EM, you should
explicitely
ask your electron microscopist
for the volume weighted
mean crystallite size.
(Figure taken from the TOPAS Users Manual, Bruker
AXS)

50/63Frank Girgsdies, Nanostructures, Inorganic Chemistry Department, Fritz Haber Institute of the Max Planck Society, Berlin, Germany
X-ray Powder Diffraction in Catalysis December 18th 2009
Size/strain analysis: strain effect
Lattice strain (microstrain) is caused by lattice defects like dislocations, vacancies, interstitials, substitutionals, etc. These defects lead to displacements of atoms from their sites in the idealized crystal structure, thus causing a variation in the lattice plane d-spacings.Strain is usually quantified as ε0
= Δd/d, with d the idealized d-spacing and Δd
the most extreme deviation from d.The peak broadening due to strain is assumed to have the following dependence:
β
= 4 ·
ε0
· tanθ
Possibilities of XRD analysis: size/strain analysis
51/63Frank Girgsdies, Nanostructures, Inorganic Chemistry Department, Fritz Haber Institute of the Max Planck Society, Berlin, Germany
X-ray Powder Diffraction in Catalysis December 18th 2009
Size/strain analysis: peak broadening summary
The observed peak broadening βobs
is composed of instrumental and sample broadening, where the latter encompasses size and strain broadening:
βobs
= βinstr
+ βsample
= βinstr
+ βsize
+ βstrain
The instrumental broadening βinstr
can be determined experimentally with a diffraction standard or calculated with the fundamental parameters approach. The separation of the size and the strain effect on the sample broadening, however, is more complicated and depends on the method used.Most methods consider the following angular dependencies:
βsize
∝
1/cosθβstrain
∝
tanθ
Note: depending on the analysis method used, β
may either mean the FWHM or the integral breadth of the peak!
Possibilities of XRD analysis: size/strain analysis

52/63Frank Girgsdies, Nanostructures, Inorganic Chemistry Department, Fritz Haber Institute of the Max Planck Society, Berlin, Germany
X-ray Powder Diffraction in Catalysis December 18th 2009
Size/strain analysis: methods
The various methods for size/strain analysis can be systematized
in the following way:1)
Model independent approaches•
Mainly instrumental broadening correction with Fourier-deconvolution
(Stokes method), followed by
•
Warren-Averbach
method for separation of size and strain effect.•
Yields area weighted mean column lengths and mean-square strain.2)
Model dependent approaches•
Mainly integral breadth methods.•
Preceding instrumental broadening correction (which depends on the method).•
Profile fitting to model the peak broadening (e.g. Double-Voigt approach).•
Yields volume weighted mean column lengths and maximum strain.
Possibilities of XRD analysis: size/strain analysis
53/63Frank Girgsdies, Nanostructures, Inorganic Chemistry Department, Fritz Haber Institute of the Max Planck Society, Berlin, Germany
X-ray Powder Diffraction in Catalysis December 18th 2009
Practical aspects of size/strain analysis: conclusion
Possibilities of XRD analysis: size/strain analysis
• Do not trust the results too much in terms of absolute values.• Do not seriously compare results from different sources.•
If you have a set of samples to be analyzed and want to compare them with each
other, make sure that the same procedure is applied to the whole
set.• Interpret the results in relative terms, i.e. use them to identify trends in the series.• Don’t be surprised if other analytical methods (e.g. TEM) yield different results.•
Unfortunately, people tend to believe in numbers. Uncertainties which do not appear
as “error bars”
are easily forgotten. Thus, if you give results from an XRD size/strain
analysis to other people (e.g. as a table in your thesis), be aware that they will probably be taken more serious than they should ...
54/63Frank Girgsdies, Nanostructures, Inorganic Chemistry Department, Fritz Haber Institute of the Max Planck Society, Berlin, Germany
X-ray Powder Diffraction in Catalysis December 18th 2009
Non ambient XRD (in situ XRD): terminology
“Non ambient XRD”
simply means XRD under non ambient conditions, e.g. • elevated or reduced temperature,• elevated or reduced pressure,• vacuum,• defined gas atmosphere.In catalysis research, the equivalent term “in situ XRD”
is used more often.Literally, the Latin in situ means “at location”.However, when some catalysis researchers say “in situ”, they often mean specifically “under catalytic reaction conditions”, which is just a special case of “in situ”.Thus, the term “in operando”
was coined to refer explicitly to investigations under catalytic reaction conditions.
In situ XRD
55/63Frank Girgsdies, Nanostructures, Inorganic Chemistry Department, Fritz Haber Institute of the Max Planck Society, Berlin, Germany
X-ray Powder Diffraction in Catalysis December 18th 2009
In situ XRD
In situ and in operando investigations can yield valuable information on catalytically relevant materials, which would otherwise not be available.Thus, there is a strong interest in developing in situ versions of all characterization techniques used in this field of research.Among the various in situ analytical techniques, X-ray based methods have a comparably long tradition.This is due to the fact that the matter penetrating properties of X-rays facilitate the construction of environmental cells (sample holders), while other methods may have more problems (e.g. choice of appropriate window materials, absorption of the gas phase).
In situ XRD
56/63Frank Girgsdies, Nanostructures, Inorganic Chemistry Department, Fritz Haber Institute of the Max Planck Society, Berlin, Germany
X-ray Powder Diffraction in Catalysis December 18th 2009
In situ XRD
In general, in situ XRD is a useful analytical tool in solid state chemistry and physics. It may help to access the following information:
• Temperature or pressure induced phase transitions
• Solid/solid reactions
• Solid/gas reactions
• Formation of reaction intermediates
• Time resolved measurements → reaction kinetics
In situ XRD

57/63Frank Girgsdies, Nanostructures, Inorganic Chemistry Department, Fritz Haber Institute of the Max Planck Society, Berlin, Germany
X-ray Powder Diffraction in Catalysis December 18th 2009
In situ XRD
In the catalysis context, the application of in situ XRD may help with:
• Characterization of the active catalyst
• Activation/deactivation behavior of the catalyst
• Characterization of catalyst precursor materials
•
Investigation of some catalyst preparation steps
(e.g. in situ calcination)
•
Investigation of catalyst material reactivity
(oxidation, reduction, decomposition reactions)
→ Clues for understanding activity/mechanisms
Example: If the onset temperatures of reduction and catalytic activity coincide, we may suspect that lattice oxygen is involved in the catalytic reaction mechanism.
In situ XRD
⎫⎬ → Structure/activity⎭
correlations⎫⎬ → Preparation/structure⎪
correlations⎭
(chemical memory)
⎫⎪⎪
Knowledge⎬ → based⎪
catalyst⎪
design!⎭
58/63Frank Girgsdies, Nanostructures, Inorganic Chemistry Department, Fritz Haber Institute of the Max Planck Society, Berlin, Germany
X-ray Powder Diffraction in Catalysis December 18th 2009
In operando XRD
In order to take full advantage of in situ investigations on catalysts under operation conditions, the catalytic activity must
be monitored simultaneously!This is the only way to ensure that the catalyst is characterized in a state which is catalytically relevant.Different in situ techniques may require different compromises concerning operation conditions. Thus, monitoring the activity may provide a common scale to correlate the results of several in situ methods applied to a system.On-line monitoring of the gas phase is usually performed by either•
mass spectrometry (high time resolution, but often only semi-quantitative),
or•
gas chromatography (lower time resolution (minutes scale), but better quantification).
In situ XRD

59/63Frank Girgsdies, Nanostructures, Inorganic Chemistry Department, Fritz Haber Institute of the Max Planck Society, Berlin, Germany
X-ray Powder Diffraction in Catalysis December 18th 2009
In situ XRD: relevance for catalysis
X-ray diffraction is a method to characterize the average bulk structure of crystalline material. Thus, it is valid to ask if the results obtained with
XRD are relevant for catalysis, because:• Catalytic reactions usually occur at the surface of a heterogeneous catalyst.• Active sites will usually be different from the average structure.• The catalytically active phase may be XRD amorphous.The answer to this is: Depending on the system under investigation, XRD may potentially give clues relevant for catalysis, since:•
There is no surface without bulk, and no bulk without surface. Modifications of the bulk structure will probably affect the surface structure!
•
Careful analysis of XRD data may shed light on specific defects (i.e. deviations
of the real structure from the ideal structure, like disorder or strain)
which can be relevant for catalytic activity.
In situ XRD
60/63Frank Girgsdies, Nanostructures, Inorganic Chemistry Department, Fritz Haber Institute of the Max Planck Society, Berlin, Germany
X-ray Powder Diffraction in Catalysis December 18th 2009
XRD and complementary methods
Like all other analytical methods, XRD has strengths on the one hand, and limitations and weaknesses on the other hand. It is generally a good idea to combine a number of characterization techniques in order to answer specific scientific questions. Some techniques are particularly well suited to complement XRD, which are listed comparatively in the following.
Complementary methods

61/63Frank Girgsdies, Nanostructures, Inorganic Chemistry Department, Fritz Haber Institute of the Max Planck Society, Berlin, Germany
X-ray Powder Diffraction in Catalysis December 18th 2009
XRD and TEM (transmission electron microscopy)
XRD TEM
averaging over the whole sample
local
limited to larger crystallites limited to smaller crystallites (> 30 Å)
(beam transparency required!)
amorphous material invisible
amorphous material visible
3D distribution of d-spacings
2D projection of d-spacings
(but collapsed into 1D)
usually no beam damage
beam damage quite possible
Complementary methods
62/63Frank Girgsdies, Nanostructures, Inorganic Chemistry Department, Fritz Haber Institute of the Max Planck Society, Berlin, Germany
X-ray Powder Diffraction in Catalysis December 18th 2009
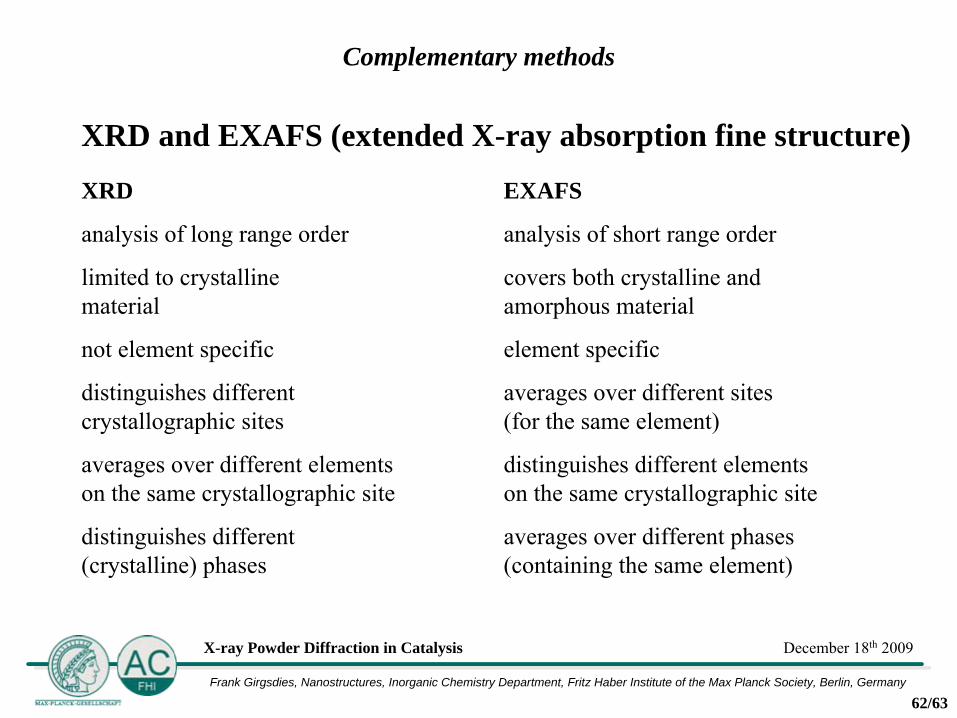
XRD and EXAFS (extended X-ray absorption fine structure)
XRD EXAFS
analysis of long range order
analysis of short range order
limited to crystalline covers both crystalline and material amorphous material
not element specific
element specific
distinguishes different
averages over different sites
crystallographic sites
(for the same element)
averages over different elements distinguishes different elements
on the same crystallographic site
on the same crystallographic site
distinguishes different
averages over different phases (crystalline) phases
(containing the same element)
Complementary methods
63/63Frank Girgsdies, Nanostructures, Inorganic Chemistry Department, Fritz Haber Institute of the Max Planck Society, Berlin, Germany
X-ray Powder Diffraction in Catalysis December 18th 2009
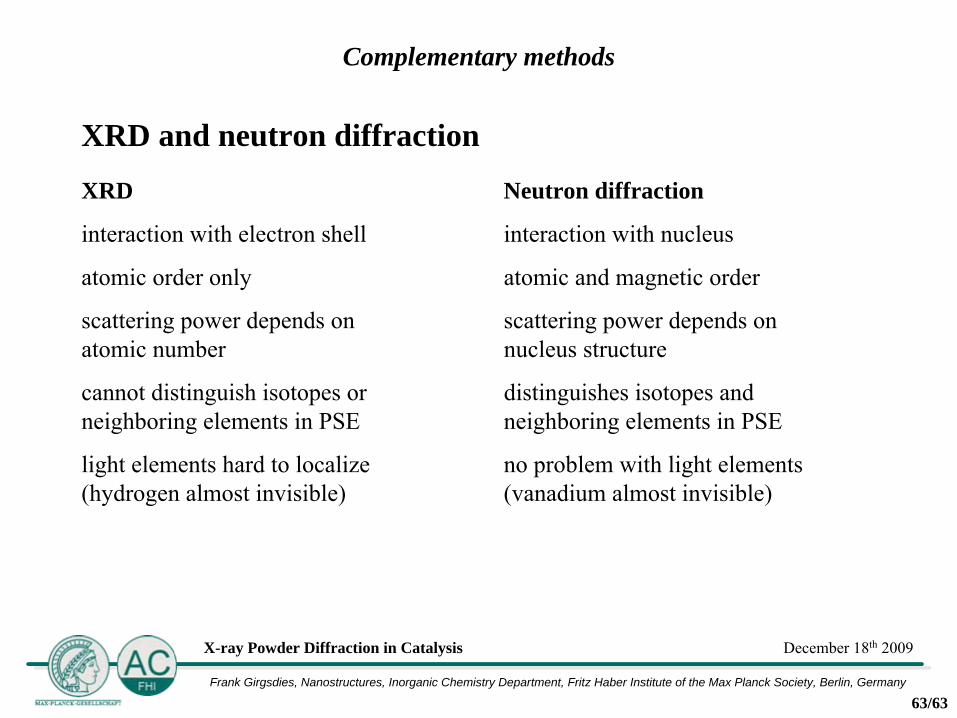
XRD and neutron diffraction
XRD Neutron diffraction
interaction with electron shell
interaction with nucleus
atomic order only atomic and magnetic order
scattering power depends on
scattering power depends on
atomic number
nucleus structure
cannot distinguish isotopes or
distinguishes isotopes and neighboring elements in PSE
neighboring elements in PSE
light elements hard to localize no problem with light elements
(hydrogen almost invisible)
(vanadium almost invisible)
Complementary methods