
X-RAY DIFFRACTION FROM MULTIPLE QUANTUM WELL … Bound... · X-RAY DIFFRACTION FROM MULTIPLE...
22
Philips J. Res. 41,268-289,1986 R 1130 X-RAY DIFFRACTION FROM MULTIPLE QUANTUM WELL STRUCTURES by P. F. FEWSTER Philips Research Laboratories, Redhil/ Surrey RH] 5HA, England Abstract X-ray diffraction offers a powerful way of obtaining structural informa- tion on multiple quantum.well structures. The technique is non-destructive and can be used to determine quantum well widths and barrier widths to - lA and the alloy compositions within the structure. Also estimates of growth imperfections and cladding layer thicknesses and overall structural quality can be assessed. Structural modelling using both kinematical and dynamical theories to obtain this information is described. PACS number: 61.10. 1. Introduction There is an increasing interest in the use of multiple quantum well (MQW) structures to expand the properties of bulk semiconductors. The semiconduc- tors are deposited epitaxially on a bulk semiconductor, but they are suffi- ciently thin to exploit the quantum size effects. In general these structures con- sist of alternating layers of two semiconductors which constitute a MQW struc- ture. The energy bands for these very thin layers are changed such that short wavelength GaAs lasers can be fabricated 1) and tunable non-linear optical properties can be used for making specialized devices 2). The two alternating semiconductor layers have thicknesses below 500 A to exploit these effects. The results discussed here are from structures which are all grown by mole- cular beam epitaxy (MBE) and consist of GaAsAI x Gal_xAs alloys. The typical thicknesses of the GaAs and AIxGal-xAs layers range from 25 A to 200 A and the number of repeats (or periods) of these alternating layers range from 5 to 120. The thickness of the semiconducting layers is not a limitation for X-ray diffraction techniques, since at Philips research laboratories (PRL) we have studied diffraction from (GaAs)nl(AIAs)n2 superstructures for n, and n« = 1, 2 and 3, where ni and n« are the number of monolayers of GaAs and AlAs in each period, where 1monolayer - 2.83 A. The limiting factors can be the total thickness of the superlattice the intensity of the X-ray source and the quality 268 Phillps Journal of Research Vol.41 No.3 1986
Transcript of X-RAY DIFFRACTION FROM MULTIPLE QUANTUM WELL … Bound... · X-RAY DIFFRACTION FROM MULTIPLE...

Philips J. Res. 41,268-289,1986 R 1130
X-RAY DIFFRACTION FROM MULTIPLE QUANTUMWELL STRUCTURES
by P. F. FEWSTERPhilips Research Laboratories, Redhil/ Surrey RH] 5HA, England
Abstract
X-ray diffraction offers a powerful way of obtaining structural informa-tion on multiple quantum.well structures. The technique is non-destructiveand can be used to determine quantum well widths and barrier widths to- lA and the alloy compositions within the structure. Also estimates ofgrowth imperfections and cladding layer thicknesses and overall structuralquality can be assessed. Structural modelling using both kinematical anddynamical theories to obtain this information is described.PACS number: 61.10.
1. Introduction
There is an increasing interest in the use of multiple quantum well (MQW)structures to expand the properties of bulk semiconductors. The semiconduc-tors are deposited epitaxially on a bulk semiconductor, but they are suffi-ciently thin to exploit the quantum size effects. In general these structures con-sist of alternating layers of two semiconductors which constitute a MQW struc-ture. The energy bands for these very thin layers are changed such that shortwavelength GaAs lasers can be fabricated 1) and tunable non-linear opticalproperties can be used for making specialized devices 2). The two alternatingsemiconductor layers have thicknesses below 500 A to exploit these effects.The results discussed here are from structures which are all grown by mole-
cular beam epitaxy (MBE) and consist of GaAsAIxGal_xAs alloys. The typicalthicknesses of the GaAs and AIxGal-xAs layers range from 25 A to 200 A andthe number of repeats (or periods) of these alternating layers range from 5 to120. The thickness of the semiconducting layers is not a limitation for X-raydiffraction techniques, since at Philips research laboratories (PRL) we havestudied diffraction from (GaAs)nl(AIAs)n2 superstructures for n, and n« = 1,2 and 3, where ni and n« are the number of monolayers of GaAs and AlAs ineach period, where 1monolayer - 2.83 A. The limiting factors can be the totalthickness of the superlattice the intensity of the X-ray source and the quality
268 Phillps Journal of Research Vol.41 No.3 1986

Xi-ray diffraction from multiple quantum well structures
of the material. A structure containing only 5X 25A GaAs wells 175A apartin the centre of a AlO.4GaO.6Asalloy 2800 A thick, gave subsidiary maximawhich could easily ~e measured to obtain the well and barrier thicknesses.
In addition to the determination of the quantum well and barrier thicknessesof these MQW structures an estimate can be obtained for the roughness of theinterfaces arising from incomplete growth or additional growth islands at thetermination of a layer. The variation of the period can also be estimated as canthe alloy mixing between the wells and barriers by diffusion. The structuralquality can be checked by comparing the measured diffraction profiles withtheoretically derived profiles. The crystalline quality is such that kinematicaltheory is only relevant to modelling very thin layers or weak reflections, forexample satellite maxima from the MQW, but to model strong reflectionsdynamical theory must be used. This means that for strong reflections astructural model must be proposed and the diffractograms compared; this isan iterative process until agreement with the measured profile is achieved.Therefore for this study modelling using both dynamical and kinematicaltheory has been used.
2. Method
The evaluation of the structural parameters of an MQW is most easily ob-tained by using a double-crystal diffractometer and a powder diffractometer.The first is a high-resolution diffractometer which is ideal for the study ofnear-perfect crystals, but deviations from crystalline perfection limit its use,since fluctuations in the periodicity of a structure significantly broaden thepeaks and make their observation difficult. On the other hand, the powderdiffractometer can accommodate crystal imperfections. The structures arenow analysed in a systematic way by:(2.1) measuring the alloy composition, x, for AlxGal-xAs in the MQW and
the cladding regions,(2.2) determining the period (well + barrier thickness) of the MQW,(2.3) determining the well and barrier thickness and x in the barriers,(2.4) estimating the period variation, interface roughness and composition
grading, and(2.5) determining the thicknesses and checking composition profiles in the
cladding layers, by comparing experimental diffractograms with com-puter simulated profiles with an iterative procedure.
2.1. Measurement of alloy composition
The experimental arrangement for determining the alloy composition isgiven in fig. 1. The X-rays from a copper target are collimated to restrict the
Phlllps Journalof Research Vol. 41 No.3 1986 269

P. F. Fewster
[111]orientatedcrystal 115reflection
*====~======~~X-raysource
GaAs substrate[001] orientation-115 reflection
Slit inserted1=== for bent
sample crystal
AlxGo,_xASlayers ofvarious composition x
Fig. 1. Schematic diagram of the double-crystal diffractometer geometry.
wavelength range, and the first crystal is rotated to isolate the CuKal charac-teristic line. The first crystal is a zero-dislocation [111] orientated germaniumcrystal and the 115 reflection is used. This asymmetrie reflection reduces thefinal diffraction profile full width at half maximum intensity (FWHM) 3). Thesample crystal reflection is also an asymmetrie lIS-type. Since the differences inlattice constant for Ge and AIxGal_xAs (0 ~ x ~ 1) are very small the netangular deviation for any wavelength emerging from SI, fig. I, and arriving atthe detector is very small. The wavelength dispersion is therefore negligible andthe diffraction peak is purely dependent on the crystal thickness and quality,geometry, chosen reflection and the mean wavelength. The alignment proce-dure used for this diffractometer is given by Fewster 4) and for the sample crys-tal alignment and data collection it is fully automated. The lattice parameterfor AIxGal-xAs is linearly related to the AI concentration x for 0 ~ x::::;; 1 andtherefore conforms to Vegard's Law. Hence by measuring the difference in lat-tice parameter between this alloy and the GaAs substrate a value for the AI con-centration, x can be obtained. For good epitaxial growth the lattice parametersin the plane of the layer/substrate interface should match exactly. The layer,being much thinner than the substrate, will therefore distort tetragonally andaccount is made for this effect on the lattice parameter by considering the elas-tic constants (see Hornstra and Bartels 5». From fig. 2 it is clear that the separa-tion of the layer and substrate peaks in the diffractograms is given by dw where
270 Phillps Journalof Research Vol.41 No. 3 1986
dWo = (OL - Os) + «(/JL - (/Js)
or for X-rays travelling in the reverse direction

X-ray diffraction from multiple quantum well structures
Fig. 2. Beam paths for X-rays diffracted from inclined planes in the layer and substrate.
Hence!::..() = H!::..coo + !::..COn)
and from the differentiation of Bragg's Law and geometrical considerations
cot ()!::..()cos" ([J ,
where a is the substrate lattice parameter perpendicular to the surface and Sais the difference between the layer and substrate lattice parameters. Now fromsimple geometry we can relate Aé and !::..([Jand hence by performing one ex-periment we can use the expression
(!::..a) !::..COn--;; .L = - cos" ([J(tan()+ tan ([J)
to obtain the change in lattice spacing normal to the surface i.e. tetragonal dis-tortion. Alternatively if two experiments are performed then a check can bemade on whether the tetragonal distortion can be considered as elastic. The'relaxed' lattice parameter is then related to that measured by
(!::..a) (!::..a) 1 - v--;; relaxed = a.L ~ ,
where v is Poisson's ratio. Therefore the Al composition x is given by
aOaAs (_!::..a)a relaxedx= --------~~~
The average composition throughout the MQW can be measured in this way
Phlllps Journalof Research Vol. 41 No. 3 1986 271

P. F. Fewster
as well as the composition in the AIxGal-xAs cladding layers, provided theyare not masked by others features. This will be considered later.
2.2. Measurement of the MQW period
A periodically layered structure will produce a subsidiary diffraction patternsuperimposed on the diffraction pattern for the rest of the structure. The unitcell parameters for GaAs and AIxGal-xAs are similar and dominate the dif-fraction along the S[OO/] scattering vector, that is there are peaks at 002,004,006, etc. The subsidiary maxima are in general much weaker than these prin-cipal maxima. For a MQW period of A the distance between subsidiarymaxima is I/A in reciprocal space, hence by Bragg's Law
2Asin81 = LIÀ
2A sin 82 = L2 À, etc.
for the diffraction orders Li, L2' ... , hence
Therefore by measuring the diffraction angles () for various diffraction ordersL, a very good estimate of the average period, A, can be obtained (with a stan-dard deviation, a(A) < 1 Á) by determining A for combinations of 11L.
In general the satellites (or subsidiary) maxima are most intense close to theprincipal maxima, except for certain combinations of layer thicknesses. Theintensity of the satellites is also most intense close to the low order principalmaxima because of geometrical and structure factor considerations and devia-tions from perfect periodicity. Therefore satellites close to the 002 principalmaxima were used in these calculations for the period, with the diffractogramfrom the double-crystal diffractometer. If the satellites were too weak to bemeasured with this method then the powder diffractometer was used.
2.3. Determination of the quantum well and barrier thicknesses and Al concen-tration in the latter
The satellite intensities referred to above not only give the period of theMQW,but also structural information for this large unit cell oflength A 6,7).This is in common with any diffraction experiment. The structure of the unitcell, given in fig. 3, is composed of ni monolayers of GaAs and n2 monolayersof AIxGal_xAs. The deposition of materials is in monolayers and thereforerepresents the smallest growth step (1 monolayer corresponds to ~ unit celllength for GaAs or AIxGal_xAs along the [001] growth direction).
272 Phlllps Journalof Research Vol.41 No.3 1986

n2 (Alx Go,_x As) n, (Ga As)
Xi-ray diffraction from multiple quantum well structures
_----d2----<-----d, -- _
_-------A--------Fig. 3. The large unit cell, or repeat unit for a MQW structure to be modelled.
There are some relations we can derive. The fractional Al composition x inthe barriers is given by
where
and x is the average Al composition through the MQW. Also
A=dl+d2,
where
ih aOaAsdl= ---2
We shall assume in the first instance that the MQW structure is perfect suchthat all the GaAs wells have the same lengths and the period is constantthroughout the structure. We therefore relax these relationships, such that
xAx= _-d2
A = dl + ds ,
where A is the best-fit value for the period for an integral number of mono-layers and dl and d2 are the well and barrier widths which are in integralmonolayers. It is clear from these that since A and x are known, only oneparameter needs to be determined; either dl, ds or x.The structure factor for this larger unit cell is given by
'F. = L jjexp(2n is- rj),2(n,+n.)
Phillps Journalof Research Vol. 41 No.3 1986 273

P. F. Fewster
where ij and r, represents the scattering factor for Ga, Al or As and its posi-tion in this cell and s is the scattering vector. Since we are only concerned withthe [001] growth direction
274 Phillps Journal of Research Vol.41 No.3 1986
s : rj = Lzj,
where L is the Miller index for the large unit cell and the order of the satellitereflection and Zj is the fractional co-ordinate for the ph atom along [001]direction.
Since the diffracted intensities are weak we can make the assumption thatthe interaction between the incident and scattered waves is negligible, and usekinematical theory, therefore the observed structure factor E; is given by
IFol2 = !._,x
where I is the measured intensity and x is a correction term to account forsystematic effects during data collection; partial polarization of the diffractedbeam and a geometrical (or Lorentz factor) such that:
(1 + cos 2p cos" 2(J) ( - 2pm tm) - 2Pi tiX = 1 - exp IT exp ,
sin 26(1 + cos22(J) sin 6 I sin 6
where P is the first or analyser crystal Bragg angle, f.l and t are the linear massabsorption coefficient and thickness respectively for the MQW (m) and the ithlayer above the MQW. The integrated intensities ofthe satellite reflections arecollected on an arbitrary scale and therefore a scaling factor is an extra para-meter to be determined.
The intensities are collected on a computer automated powder diffracto-meter, with Bragg-Brentano geometry and analyser crystal, using the standardsuite of programmes CODBA written by the author. The intensities are meas-ured using an analysis programme from this suite, which will undertake back-ground removal. Each satellite peak is individually analysed using computergraphic displays.
The structure factors Fo are determined for all measurable satellite reflec-tions in the vicinity of the 002 principal reflection. The structure factors F, arethen calculated for a given value of dl (and hence ds and x) and comparedwith the Fo values after choice of an appropriate Scale factor. The observedand calculated structure factors are compared by evaluating the discrepancyindex or 'R-factor',
R=L WL IlFolL - IFslLINL

X -ray diffraction from multiple quantum well structures
where N can be 1 or 2 and w is a weighting function related to the measuredintensities or equated to 1. If the R-factor has a low value then there is goodagreement between the observed lFo I and calculated IFs I structure factormoduli and therefore the simple model of fig. 3 is a good representation of theperiod. Since the calculation is performed for parameters giving the best fit toa perfect structure, we must now relate these to the average widths dl and d2•
By plotting R versus the parameter dl the minimum R-value corresponds to d{which is the average value for the best-fit period and not necessarily anintegral number of monolayers. The measured period is also an average valueA and therefore the widths dl and d2 are given by
- ( A -A)dl = d{ 1 + A
d2=A-dl•
Similarly therefore the Al composition in the AlxGal-xAs layer is
xAx = ---=-.
d2
2.4. Estimation of interface roughness, grading and period variation
Although growth of layers by MBE is very well controlled, the terminationof layer growth to produce a perfect atomically flat surface is unlikely. Thereare very likely to be regions where the growth is incomplete or where anothermonolayer has nucleated, fig. 4. This we shall term interface roughness and it
Fig.4. Interface roughness from imperfect completion of a quantum well showing monolayer stepimperfections.
results in local areas of different thicknesses. The thickness will probablyfollow a Gaussian distribution, see fig. 5. We can therefore define interfaceroughness purely by one parameter, the FWHM or the mean deviation of aGaussian distribution.
Phillps Journolof Research Vol. 41 No. 3 1986 275

P. F. Fewster
Fig. 5. The distribution of the total number of GaAs monolayers constituting a quantum welllayer with interface roughness, averaged throughout the structure.
Similarly the overal period will have a distribution about its mean value, A.There is evidence that AlGaAs growth on GaAs leads to rougher interfacesthan growth of GaAs on AlGaAs 8). Therefore the period variation cannot becorrelated to the interface roughness and must be defined by another variable,the FWHM or mean deviation in the Gaussian distribution of A, see fig. 6.
t PtA)
Fig. 6. The distribution of the total number of GaAs and AJGaAs monolayers in a period averagedthroughout the structure.
Compositional grading, where inter-diffusion at the various interfaces cantake place, can be defined by an interface width, W, see fig. 7. Ideally theAl concentration should be represented by an error function, but this is ap-proximated to a linear function to reduce computation time. Across thisgraded region the lattice parameter and structure factors will vary.
These three additional parameters are then incorporated into the structurefactor calculation for the satellites. These parameters will therefore modify
276 Philip, Journalof Research Vol. 41 NO.3 1986

w
X-ray diffraction from multiple quantum well structures
x
A
Barri er
Fig. 7. The aluminium concentration through a given period A, used to model the compositiongrading at the GaAs/AlGaAs interfaces.
the calculated satellite structure factors compared with the perfect structuremodel used in the previous section. The variation in the period must be con-sidered carefully however, since the diffraction peak order for the subsidiaryreflections is different for different periods. Therefore each satellite will becomposed of several convoluted peaks for each period following the distribu-tion of their frequency, and since the separation of the satellite peaks for eachperiod Ai is I/Ai in reciprocal space, these satellite peaks will be broadened,see fig. 8. The lattice constants for GaAs and AIxGal-xAs are very similar,
002 reflection
w
Fig. 8. Period variations throughout the structure broadens the satellites peaks more the furtherthey are from the 002 principal maximum. The histogram lines represent the peak intersities cor-responding to the periods given in fig. 6.
hence the MQW diffraction peak Closeto the principal maximum 002 will besharp but the satellite peaks will be progressively broadened away from thisMQW peak. This is why fewer satellites are observed when a high resolutiondiffractometer is used rather than a low resolution instrument.
Phlllps Journalof Research Vol.41 No. 3 1986 277

P. F. Fewster
The effects of coherence must also be considered. All periods of the samelength are assumed to diffract maintaining their phase relationships and alsoassumed to be so for different periods, except when the various diffractedbeams are spatially separated after diffraction. This is dependent on the geo-metry for the data collection technique and the beam coherence length acrossthe sample. This coherence length is generally very long for X-rays and con-sidered not to be a problem. To determine which periods diffract with a main-tained phase relationship the angular divergence accepted by the receiving slitsis related to the angular separation of the contributions to a satellite byeachperiod, see fig. 9. The individual contributions without a phase relationshiphave their intensities added to determine the satellite F;
l.. a "I"~Angular Angularacceptance for step sizediffractametergeometry
Fig. 9. Determination of the angular range over which coherent diffraction occurs for a satellitepeak from a structure with a range of periods.
Each possible period, whose contribution to the final structure factor isscaled according to the distribution, has a distribution of GaAs to AlxGa1-xAsthicknesses and a given interface grading imposed on each interface. Theseparameters are determined either by evaluating the R-factor (defined in theprevious section) for discrete values or by a least-squares refinement.
2.5. Computer simulation of diffractograms
To obtain further structural information and to check the structure, simul-ated diffraction profiles are determined and compared with those observed.Since in general the high intensity maxima will be used the interaction betweenthe diffracted and incident beams must be considered. To account for this andassuming that no other beams are excited in the crystal we can use dynamical
278 Phlllps Journalof Research Vol.41 No. 3 1986
...X-ray diffraction from multiple quantum well structures
theory in the two-beam approximation. The different layers of the structurehave different lattice parameters and these are accommodated in a distortionparameter a(cv), where cv is the crystal rotation angle P-!"). The diffraction isdescribed with two coupled equations, where subscripts 0 and H correspondto the incident and diffracted beams,
iÀ YH dDH-- -- = If/ODH + C If/HDO - aH DH ,n dz
i À Yo dDo-- -- = lf/oDo + Clf/HDH.n dz
DH is the electric displacement, YH= n- k» (n and k» are the surface normaland diffracted beam vector), À the wavelength, z the depth into the crystal,C the polarization factor (= 1 or Icos 20 I) and If/H is related to the structurefactor by:
where V is the volume of the unit cell, re the electron radius and FH the com-plex structure factor to account for absorption in the crystal. These two equa-tions reduce to one equation in terms of the amplitude ratio X = DH/Do
dX in { (YH) 2 [ (YH) ] }& = - À YH If/H - If/H y:- X + If/o 1 - -;- - aH(cv) X ,
which is solved for X(cv) as a function of z, with the boundary condition thatX(cv) = 0 deep inside the crystal. We can therefore obtain the crystal reflec-tivity curve as a function of cv for a given structure. In the double-crystal case,reflectivity profiles from the reference and sample crystals are obtained andthen convoluted to give the expected profile. In general this has to be repeatedto include the (J and n polarisation states to obtain the final profile.
A series of iterations are performed, altering layer thicknesses and compo-sitional grading - assuming the average composition as derived, sec. (2.1) -until a good fit between calculated and observed profiles is achieved. The ob-served data are collected on Apple 11microcomputers and the simulations arecalculated on the same microcomputers. The profiles are compared using thesame analysis program which can smooth out noise from the experimentalprofile, and introduce the effects of bent sample crystals on the simulatedprofile.
Phillps Journalof Research Vol.41 No. 3 1986 279

.;
P. F. Fewster
3. Experimental
To illustrate the preceding methods for analysing multiple quantum wellstructures a few examples will be given, including results from a relativelythick high quality structure (3.1), a structure with only 5 periods (3.2), a struc-ture showing the modelling of the growth imperfections (3.3) and a laser struc-ture giving an example of the usefulness of diffraction profile modelling (3.4).
3.1. ·Sample KLB269 (in relatively thick MQW structure)
This sample has the nominal parameters given in fig. 10. The 115 diffractionprofiles are given in fig. 11 for diffraction from the two directions, fig. 2.The measured angles between the peaks show that the distortion is tetragonaland elastic and also give the aluminium composition in the cladding regions(layer 1, x = 0.69; layer 2 and 3, x = 0.38) and the average in the MQW struc-ture (x = 0.302). The period was derived from the double-crystal diffracto-gram close to the 002 principal maximum, see fig. 12, and the satellite inten-sities measured using the powder diffractometer. The L = 106 satellite peak
Fig. 10. The expected structure from the growth conditions of sample KLB269.
115Reflection30' incident angle
115Reflection60' incident angle
;;::5~secs ~
M.,Ne,
":>,.3
se'-1iî.D::JVl
;;:: ~50~ secs ~ ~
.D::JVl
'-":>,o--'
~ N'- '-
" ":>, :>,c c--' --'
w
Fig. 11. The double-crystal diffraction profiles from sample KLB269 for two incident beam direc-tions.
280 Philip. Journulof ResearchVol.41 No. 3 1986

X-ray diffraction from multiple quantum well structures
002 main reflectionfrom substrate, MOW, etc
t
w
Fig. 12. The double-crystal diffraction profile close to the 002 principal maximum for KLB269,showing the first 2 satellite orders.
TABLE IListing for the 'best-fit' unit cell for KLB269, where L is the satellite
diffraction order, Fo the observed and F, the calculated structure factors.Also listed are the final R-factor and average derived parameters.
L r; Fs Fo-Fs
90 51 ·37 1391 99 117 -1792 139 152 -1393 103 107 -394 30 31 -0.395 258 240 1896 484 476 897 683 699 -1698 0 2878 Principal
002maximum99 536 550 -14100 469 447 21101 270 255 14102 74 58 15103 64 84 -21104 155 145 10105 120 123 -2106 24 51 -26107 44 29 14
GaAs well thickness: dl = 63.70 A, AlGaAs barrier thickness: d2 - 212.70 A, Alcornposition inbarrier: x = 0.392, discrepancy index: R = 6.43%.
Philips Journalof Research Vol. 41 No. 3 1986 281

P. F. Fewster
was too weak to be measured, see table I, so its intensity was included with itsmost probable value of I minimum/2, Hamilton 11). The calculated and ob-served structure factors for the best fit A, dl and ds in integral numbers ofmonolayers are given in table I, as well as the final average well width, barrierwidth and aluminium composition in the barrier. The final R-factor was low,see fig. 13, and comparable with that expected from uncertainties in the data.This suggests that the abrupt interface model is a good approximation.
R(OJo)
Plot R-factor versus d,30
15
\ /\ I\ .I
0"'-01
20
10
oL_---- ~ ~ ~50 60 70 80
-d,(A)
Fig. 13. The determination of the well thickness a; (for A) from the minimum in the R-factorcurve.
3.2. Sample 056This structure, outlined in fig. 14, was composed of only 5 GaAs quantum
wells 25 Á wide with 175 Á AlGaAs barriers and 0.14 urn AlGaAs claddingregions. The average 5ë value throughout the structure was determined from
Expected structure
Substrate
Fig. 14. The expected structural dimensions and composition for sample 056.
282 Phlllps Journalof Research Vol.41 No.3 1986

[ 50counts s-1
[150counts s-1
X-ray diffraction from multiple quantum well structures
the 115diffractograms but was reduced from its maximum value of x becauseof the presence of the quantum wells. The relationship between x and x isgiven by tax
X = ----=---to - SdI'
where to is the whole layer thickness and dl is the average quantum well thick-ness. Therefore the aluminium composition in the barrier is known if to and dlare known. Since to ~ Sd«, provided to is known approximately x will be agood estimate. Ten measurable satellites shown in fig. 15were included in thestructure factor calculation. The period .iï was determined from the powderdiffractometer and dl and ds determined from the satellite intensities for thefixed value of x in the barriers. The 115diffractogram was modelled with these
-wFig. IS. The satellites close to the 002 principal maximum for sample 056, obtained with Bragg-Brentano geometry.
TABLE IIStructure factor listing and final average derived parameters for sample 056,where L is the satellite diffraction order, Fa the observed and F, the calculated
structure factor
L Fa Fs Fo-Fs
60 376 151 25561 732 629 10562 1169 1151 '1763 1633 ·1638 -464 1957 2041 -8365 0 11920 Principal
002 maximum66 1758 1776 -1867 .1356 1558 -20168 1113 1144 -3069 638 655 -1670 198 188 10
GaAs well thickness dl = 31.4 Á, AIGaAs barrier thickness d2 = 153.5Á, AI composition in thebarrier and cladding regions x = 0.317, discrepancy index R = 6.5%.
PhllIps Journalof Research Vol.41 No. 3 1986 283

P. F. Fewster
parameters dl and tofrom. to expected' d2
to = -----=----d2 expected
From this towas checked and the simulation was repeated to give an improvedestimate of to and hence x and consequently dl and d«. The 'best-fit' structurefactor listing, R-factor, dl, d2 andÄ are given in table Il. The final fit betweenF, and Fa was good and suggested the abrupt interface model to be a goodrepresentation of this structure.
TABLE IIIStructure factor listing for sample KLB266 without (a) and with (b)structural imperfections included, where Fa is the observed and F, the
calculated structure factor
satellite order Fa Fs r-r.-9 173 134 68-8 39 132 59-7 290 305 248-6 496 452 413-5 420 384 376-4 41 62 12-3 773 730 744-2 1769 1592 1680-1 2627 2434 26110 0 10104 10832 Principal
002 maximum1 1963 1904 20492 1553 1483 15713 770 772 7934 45 120 955 301 314 3106 386 421 3897 219 309 2578 47 143 789 68 116 51
Discrepancy index, R = 11.2% 7.160/0(a) (b)
GaAs well thickness dl = 62.2 Á, AlGaAs barrier thickness d2 = 189.6 Á, Al composition in thebarrier x = 0.442, interface roughness 6.7 Á, interface grading < 1 Á, period variation < 1 Á.
284 PhllIps Journalof Research Vol.41 No. 3 1986

Xi-ray diffraction from multiple quantum wel! structures
3.3. Sample KLB266
This structure was expected to be composed of 60 X 55 Á quantum wellswith 175 Á Alo.4Gao.6As barriers and cladded with 0.14 urn Alo.4Gao.6As topand bottom. The initial analysis was similar to KLB269 but the final R-factorwas high suggesting the assumptions of abrupt interfaces to be invalid. Theinterface roughness, period variation and interface grading were changed indiscrete amounts. The introduetion of interface grading (AI diffusion at theinterface) increases the R-factor and therefore indicates that it is unlikely inthis structure. The period variation also appears to be small (less than - 1 Ámean deviation), but the variation of the well to barrier width ratio gives thebest fit to - 6 Á mean deviation. An explanation of this could be that althoughroughness is probably present, it is smoothed out by a subsequent layer. Thecontributions to the period variation are therefore on average smaller thanthose to the individual layer thickness variations. This can not be taken asgeneral since this is not always the case; other structures have shown betteragreement with significant period variations and modest interface roughness,but all have negligible compositional grading. The final parameters andstructure factor listings are given in table Ill.
3.4. Sample KLB276 laser structure
This was an early laser structure of a series, see fig. 16, but serves to illus-trate the usefulness of computer simulation methods. The well and barrierwidths could not be determined with any accuracy because of significant varia-tions in their thicknesses, giving rise to smearing of the satellite peaks. The 115double-crystal diffractogram is given in fig. 17a obtained with a narrow slit S2,see fig. 1, and displayed with data smoothing by convolution with a triangular
Expected structure
GaAsAlo_4GaO.6As
Fig. 16. A MQW laser structure (KLB276) showing the expected dimensions and compositions.
Philips Journalof Research Vol. 41 NO.3 1986 285
P. F. Fewster
72 er-e secs
2
-w
-w
72 arc secs~
(a)
72 arc secs~
72 er-e secs
(b) -w
(e)
72~ secs
(d) -w
72 :::.:Jees
(f) -w
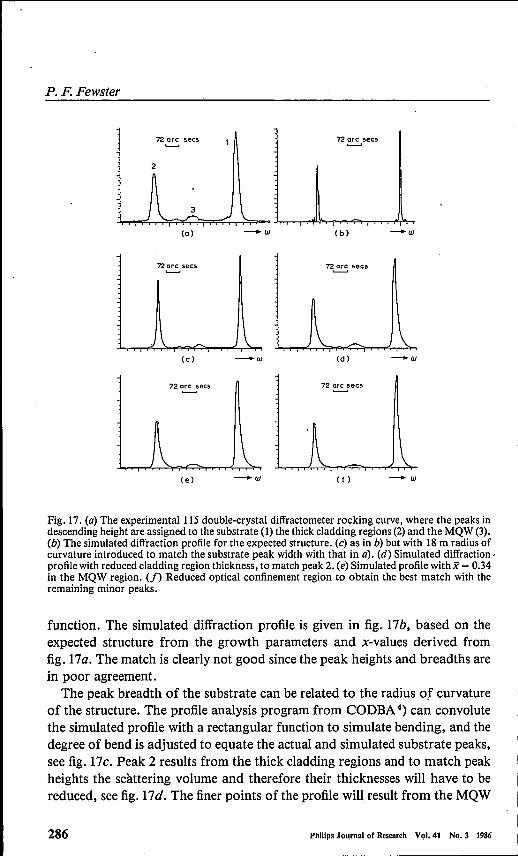
Fig.17. (0) The experimental1l5 double-crystal diffractometer rocking curve, where the peaks indescending height are assigned to the substrate (1) the thick cladding regions (2)and the MQW (3).(b) The simulated diffraction profile for the expected structure. (c) as in b) but with 18 m radius ofcurvature introduced to match the substrate peak width with that in 0). (d) Simulated diffraction-profile with reduced cladding region thickness, to match peak 2. (e) Simulated profile with x = 0.34in the MQW region. (f) Reduced optical confinement region to obtain the best match with theremaining minor peaks.
function. The simulated diffraction profile is given in fig. 17b, based on theexpected structure from the growth parameters and x-values derived fromfig. 17a. The match is clearly not good since the peak heights and breadths arein poor agreement.
The peak breadth of the substrate can be related to the radius of curvatureof the structure. The profile analysis program from CODBA 4) can convolutethe simulated profile with a rectangular function to simulate bending, and thedegree of bend is adjusted to equate the actual and simulated substrate peaks,see fig. 17c. Peak 2 results from the thick cladding regions and to match peakheights the scattering volume and therefore their thicknesses will have to bereduced, see fig. 17d. The finer points of the profile will result from the MQW
286 Phlllps Journalof Research Vol.41 No.3 1986

X-ray diffraction from multiple quantum well structures
and inner cladding regions with grading. The match here is poor since morepeaks are present in the simulated profile than in the observed profile, which isnot indicative of more layers but of interference between layers. If peak 3,fig. 17a, is tentatively assigned as resultingfrom the-M'Q'W then the x value is0.34, see fig. 17e. This worsens the fit and the best agreement is for 0.3. Thewidth of the confinement region was reduced from 6000 Á to 4000 Á and thesimulated profile was very close so that obtained experimentally, see fig. 17f·The peak heights of the diffraction profile that do not match perfectly (e.g.:peak 3) could well result from high defect levels. The final structuralparameters are given in table IV.
TABLE IV
Estimated parameters from the laser structure KLB276, which proved difficultto analyse by normal methods.
The expected parameters from the growth conditions are given in brackets
~easured valuesPeriodic A from satellite positions
A is 99 Á (100 Á)Aluminium composition x in outer cladding from 115 diffractogram
Xoc = 0.63 (0.6)
Best-fit values from 115 diffractogram simulationx in MQW = 0.31x in inner cladding = 0.45 (0.4)D2 inner cladding thickness = 0.06 urn (0.1 urn)Dl outer cladding thickness = 1.1 urn (1.4 urn)De graded region thickness = 0.05 urn (0.1 urn)
Derived valuesGaAs well width = 31 Á (25 Á)AIxGal-xAs barrier width = 68 À (75 Á)
It is interesting to note in the simulated profile for the perfect unbentcrystal, fig. 17b, that peak 2 is a doublet resulting from the two thick AlGaAscladding regions, although both layers are included with the same composi-tion. This arises from interference of the diffracted beam from the two layers.Also the peak 3 (tentatively assigned to the MQW) points to have an averageAl composition higher than the actual value. It is clear from this that buriedlayers give rise to diffraction effects that can give the wrong result if only
Phllips Journalof Research Vol. 41 No.3 1986 287

P. F. Pewster
measurement of the mismatch is considered -,Thereforethe determination ofsimulated profiles is.essential, foorfull and correct interpretation.
4. Summary
From these few examples it is clear that X-ray diffraction can characterisenearly all the structural parameters of these MQW structures, despite the factthat these layer structures are in general of the order of one J.LIll thick. Itmustalso be remembered that this analysis is completely non-destructive so theanalysed crystal can still be processed into devices.To summarise, the MQW well and barrier thicknesses can be obtained to
accuracies of - 1 A. The alloy composition in the barriers and the claddingregions can be obtained to within 0.005 in x, and the thickness of claddingregions, MQW period variations, interface roughness and interface gradingcan all be estimated. The general structural quality can be assessed by com-parison with computer simulations; structures that are not bent contain manymore diffraction features which can be analysed giving additional high resolu-tion structural information.
The determination of well widths and AI compositions by these methods arein very good agreement with those obtained by photoluminescence excitationspectroscopy (PLE) oh a large range of samples. Furthermore those sampleswhich indicate structural imperfections by X-ray diffraction methods, alsoindicate well-width variations in their PLE spectra 12).
X-ray diffraction is a very powerful method of analysing these structuresand additional structural defect information could be obtained by X-raytopography.
288 Philip. Journalof Research Vol.41 No.3 1986
Acknowledgements
The author is grateful to Dr P. J. Dobson for helpful discussions on thiswork and Drs K. Woodbridge and C. T. B. Foxon for growing the structuresand to Dr. J. Morice for assisting with certain aspects of the computermodelling of the interfaces.
REFERENCES1) K. Wood bridge, P. Blood, E. D. Fletcher and P. J. Hulyer, J. Vac. Sci. Techno!. B 3,
779 (1985).2) N. Payghambarian and H. M. Gibbs, Optical Engineering 24, 68 (1985).3) B. W. Batterman and G. Hildebrandt, Acta Cryst, A24, 150 (1968).4) P. F. Fewster, J. App!. Cryst. 18, 334 (1985).5) J. Hornstra and W. J. Bartels, J. Cryst. Growth 44,513 (1978).6) A. Segmüller, P. Krishna and L. Esaki, J. App!. Cryst. 10, 1 (1977).7) J. Kervarec, M. Baudet, J. Caulet, P. Auvray, J. Y. Emery and A. Regreny, J. Appl,
Cryst, 17, 196 (1984).

Xi-ray diffraction from multiple quantum well structures
8) P. J. Dobson, B. A. Joyce and J. H. Neave, Philips Research Labs, RedhilI, Private corn-munication (1985).
9) S. Takagi, Acta Cryst. 15, 1311 (1962) and J. Phys. Soc. Japan 26, 1239 (1969).10) D. Taupin, Bull. Soc. Franç. Minéral Crist. 87, 469 (1964).11) W. C. Hamilton, Acta Cryst. 8, 185 (1955).12) P. J. Dobson, K. J. Moore and G. Duggan (1985), Philips.Research Labs, RedhilI,
Private communication.
Phlllps Journalof Research Vol. 41 No.3 1986 289


![X-ray atomic mapping of quantum dotsbedzyk.mccormick.northwestern.edu › files › ...and buried nanostructures using resonant x-ray-diffraction microscopy [11], coherent x-ray diffraction](https://static.fdocuments.us/doc/165x107/5f233214dd8d8e4af97dde2d/x-ray-atomic-mapping-of-quantum-a-files-a-and-buried-nanostructures-using.jpg)


