x€ .. o - Defense Technical Information Center · cise delimitation of desert areas is difficult....
144
x€ S.........RT....... ....... ..................... .. ......... ..... ........ ........... ... ........ ..... o Sf-,, UNITED STATES ARMY -,f C4 r. anCL YUJMA PROVING GROUND YUMA, ARIZONA t AvabIble op C' . 4 ) ''" • •"•-- - ,,
Transcript of x€ .. o - Defense Technical Information Center · cise delimitation of desert areas is difficult....
x€
S.........RT....... ....... ...................... .. ......... ..... ........ ............ ... ........ ..... oSf-,,
UNITED STATES ARMY-,f C4 r. anCL
YUJMA PROVING GROUND
YUMA, ARIZONA
t AvabIble op C' . 4 )
''" • •"•-- -,,

iiNCI ATFrTmnSECURITY CLASSIFICATION OF THIS PAGE (r1t.n Data Erftered)
REPORT DOCUMENTATION PAGE READ INSTRUCTIONSBEFORE COMPLETING FORM1. REPORT NUMBER 12 GOVT ACCESSION NO 3. RECIPIENT'S CATALOG NUMBER
4. TITLE (and Subtitle) S. TYPE OF REPORT & PERIOD COVERED
lFirst Edition NOV 1977DESERT ENVIRONMENTAL HANDBOOK
6. PERFORMING ORG. REPORT NUMBER
7. AUTHOR(&) .8. CONTRACT OR GRANT NUMBER(&)
Harry A. Greveris9. PERFORMING ORGANIZATION NAME AND ADDRESS 10. PROGRAM ELEMENT. PROJECT, TASK
AREA & WORK UNIT NUMBERS
US Army Yuma Proving Ground "UATTN: STEYP-PLYuma, Arizona 85364
11. CONTROLLING OFFICE NAME AND ADDRESS 2Z. REPORT DATESNOVEMBER 1977US Army Test and Evaluation Command 13. NUMER OF PAGES
Aberdeen Proving Ground, MD 2100514. MONITORING AGENCY NAME & AOORESS,'If dllofftnt from Controlling Cif'tco) I5. SECURITY CLASS. (of this report)
Unclassified1Sa. DECL ASSI FI CATION/DOWNGRADING
SCHEDULE
16. DISTRIBUTION STATEMENT (of this Report)
Approved for public release; Distribution unlimited.
17. DISTRIBUTION STATEMENT (of the abstract eter.d in Block 20, If different from Report)
19. KEY WORDS (Continue on reveree side It necassary aMd Identify by block number)
Desert Testing Human PerformanceEnvironmental Effects Desert ClimateDesert Analogs Yuma, ArizonaHuman Factors in Desert Tests Maintenance
20. AB'STR'ACT (Continue an reverse alt" It neceseary and Identity by block number)
This handbook is a compendium of the US Army's experience in testingequipment in a desert environment. Topics covered include world areas analo-gous to Yuma Proving Ground, Yuma Proving Ground environment, environmentaleffects, materiel degradation, human factors engineering, and desert main-tenance, r: .
This document should provide valuable information for those who design,use, or test equipment for eventual deployment in hot-dry. areas of the world.,<
"DD , 1473 ErITIOP4 OF I NOV fUSNC LASSIFBest p^.vaua..lP•" i •" SECk UNCLASSIFIED
FORE0ORD
This document was prepared at the request of the US Army Test and EvaluationCommand (TECOM) to provide industry information on the adverse effects a 'desertenvironment can have on materiel and on the similarities between the environmentof Yume, Proving Ground (YPG) and the major desert areas of the world.
Although testing has been conducted at the proving ground since World War II,there is a paucity of specific published information on desert testi.nq P-'4 effert.sMuch valuable information has been lost. This Installation is continuously updatingand refining information on desert effects to broaden the data base. Recipients of'this report who have knowledge of any relevant reports or specific data not coveredin this document should send such information to Yuma Proving Ground.
It is hoped that this document will promote a better understanding by materieldevelopers of the physical and mechanical stresses that a desert environment mayimpose on man and materiel and provide information on the probability that materieltested in the environment at YPG will successfully ooerate in other desert areas ofthe world.
Wh~te ectloERNEST E. BEACHColonel, Qi.CCommander
YPG - THE PROVING GROUND OF THE FUTURE
eest Available copy
* -K ,~, ~ r2
S.-0
K'.'t
UIXI q 44k~ I ',,J IN
4w Y
.5 "t4/.
'o K ,
IKI
'K I;~-'- ~ ' I
TABLE OF CONTENTS
FOREWORD .............. .. ................FRONTISPIECE. .. .. ...... ... ... .. .. . . ... ... .. . . . 2
SECTION 1. INTRODUCTION
*1.1 Desert Definition and Classification . . . . . . . . . . .* . 61.2 World Areas Analogous to Yuma Proving Ground .. .. ...... . . 81.2.1 Middle East. .. .. .... ........ ...... ........ ...... ......1.2.2 North Africa .. .. ...... ........ .. .. .. .. .. .. ... 81.2.3 Australia..... .. .. .. .. . .* . . . . . . e . e.. .. .. .. 91.2.4 T urkestan .10 ..........
1.2.8 South America .. .. .. ........ ...... ........ .......... . 101.2.9 South Central Asia . . . . . . ., . .. .. .. . 10
1.3 Desert Environmental Aspects .. .. ....... 10
1.3.2 Terrain .. . . ... .. . . .. . ... . . . . . . e. e. .... 11
tSECTION 2. YUMA ENVIRONMENT
2.1 Climate. .. .. ..... . .. ... . .. ..... . .. ........ . . . . .. 122.1.1 Temperature . . e* 12.2.2 Precipitation......... . .... 122.1.3 Humidity....... ..............C . . 132.1.4 Cloudiness. .. .... ........ ...... ......... . .. .. . .132.1.5 Barometric Pressure .. .. .. ...... .... .. .. .. .. .... 132.1.6 Surface Inversion .. .. .. ........ ...... ........ ........ 132.1.7 Density Altitude .. .. ...... ........ ...... ........ ......142.1.8 Winds. .. .. ...... ...... ........ ...... ........ ........142.1.9 Radiation .. .. .. ........ ...... ........ ...... ..........162.2 Surface and Terrain .. .. .. .. ............... 162.2.1 Vegetation. .. .... ...... ........ ...... ...... . . e 162.2.2 Soils.................**12.2,3 Sand and Dust............. .... 181
SECTION 3. HUMAN PERFORMANCE UNDER DESERT CONDITIONS
3.1 Physiological .. .. .... ...... ........ ...... .... .. ... 203.2 Psychophysical.... .. .. .. .. .. .. .... . . . . . . . . 203.3 Psychomotor and Mental... .. .. .. .. .... . . . . . . . . 21
3
Alix
I
SECTION 4. DESERT OPERATIONS
Par'e4.1 Heat Stress . . . . . . . . . . . . . ...... ...... . .. . . .4.2 Mechanical Stress .................... . . . . 254.2.1 Particle Si:e and Distribution . . . . . . . .*. . . . . . . 254.2.2 Dust Concentration . . . . ........ ................... 2...
SECTION 5. DESERT IAINITENANCE
5.2 San / u . . . . . . . . . . . . . . . . . . . . . . . . .
5.3 Terrain ........................... 3n
SECTION 6. APPENDICES
A. Climatic Elements of World Deserts . . . . ..... ............ 32B. YPG Climatologiical Calendar and Climatic Summary . . . *. . IIIC. References . . . . . . . . . . . .. . .*. . .. . .. . 129D. Bibliography . . . . . . . .... .. ................... . . 132E. Distribution List . . . . . . .... ............. . . . . . . 139 1:
4
';'4
. .. . . ..1...... ..: ... i i i i
LIST OF FIGURES AND TApLES
Figure janQe
1 Distribution of World Deserts ............ .. . . . 7Arizona . 17~2.: Amount of Sunshine Yuma$ Arzn .i ... . .. .. .. .. . 1
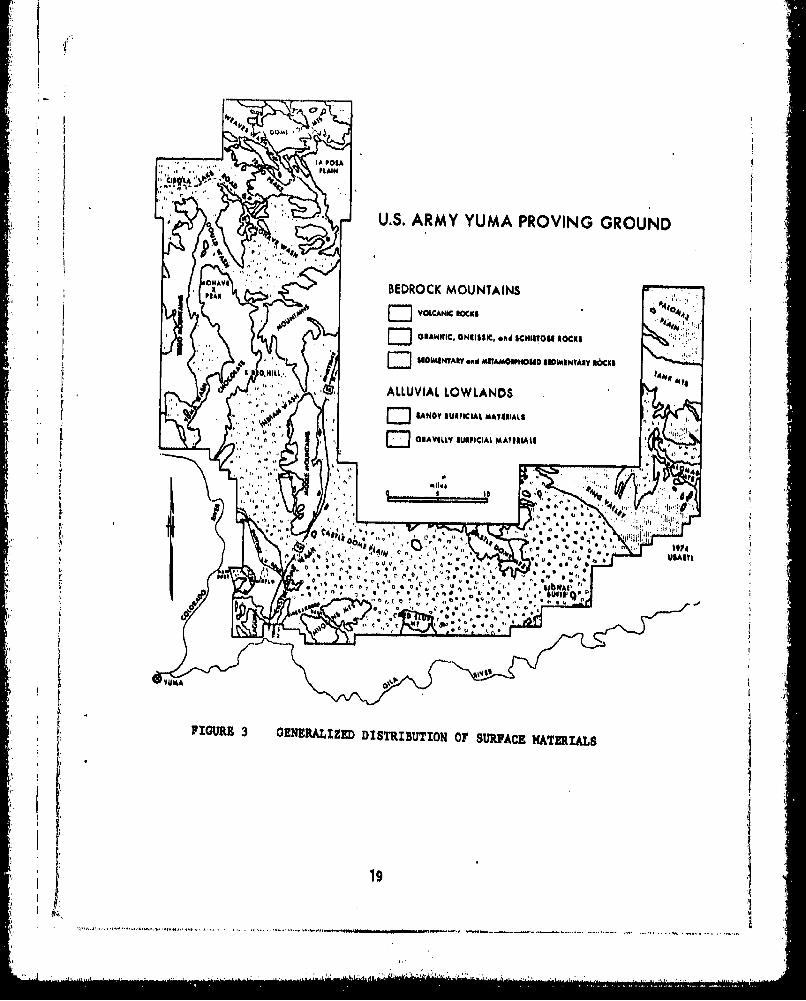
3 Generalized Distribution of Surface Materl"........... . . 194 Human Performance as Function of Temperature . ... . 22
I YPG Average Hourly Density Alti':',,,'- ............. is2 YPG Average Hourly Solar Insolation . . . . ......... 16a3 Typical Midday Outdoor Brightness . . . . . . . . . . . . 204 Typical Maximum Equipment Temperatures .. .. .. 235 Matorial TomDPv.,IPrAs Expn•,* to Direct Solar Radiation . . . 24
Particle Size Distribution YPG Dust Course ... 267 Dust ,untentri±L i,• ýo which Army versorait1 are Exposed . . . 27
51P1..
,L, 5
SECTION 1 - INTRODUCTION
1 1 Desert Definition and Classification. The sole common characteristic ofall deserts is their aridity. It is this lack of moisture that lies at theheart of desert problems, from the adaptation of plants and animals for exis-tence under desert conditions to the utilization of desert areas by man. "True"deserts result from a deficiency in the amount of precipitation received rela-tive to water loss by evaporation. Deserts, then, as the term is generally used,are basically a climatic phenomena.
The world's deserts can be classified In many different ways. As a result, pre-cise delimitation of desert areas is difficult. While all authorities generallyagree upon the "core" areas or the desert outer limits. Variation is based uponthe severity of the aridity and consequent effects on vegetation and soil. By
. the most widely accepted classification system set by Koeppen, the boundary be-tween humid and semiarid is drawn where the evaporation rate equals the precipi-tation rate; and similarly the boundary between semiarid and arid is set at thepoint where the evaporation rate is twice as great as the precipitation rate.
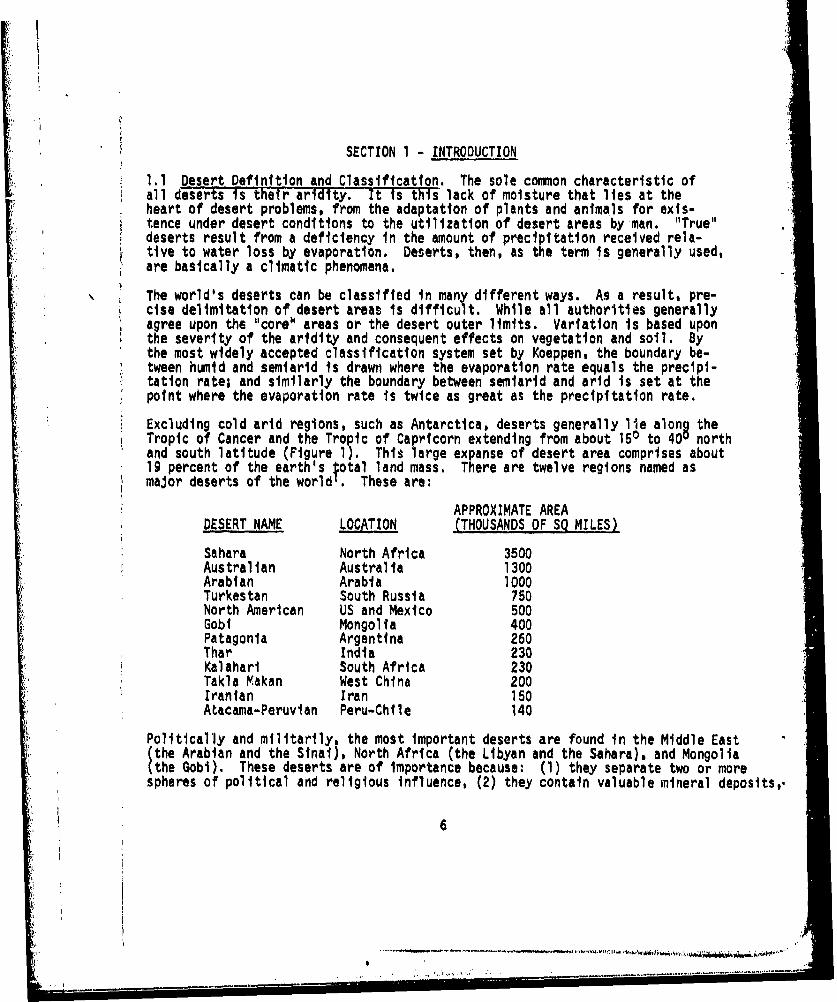
Excluding cold arid regions, such as Antarctica, deserts generally lie along theTropic of Cancer and the Tropic of Capricorn extending from about 150 to 40U northand south latitude (Figure 1). This large expanse of desert area comprises about19 percent of the earth's total land mass. There are twelve regions named asmajor deserts of the world'. These are:
APPROXIMATE AREADESERT NAME LOCATION (THOUSANDS OF SQ MILES)
Sahara North Africa 3500Australian Australia 1300Arabian Arabia 1000Turkestan South Russia 750North American US and Mexico 500Gobi Mongolia 400Patagonia Argentina 260Thar India 230Kalahari South Africa 230Takla Kakan West China 200Iranian Iran 150Atacama-Peruvian Peru-Chile 140
Politically and militarily, the most important deserts are found in the Middle East(the Arabian and the Sinai), North Africa (the Libyan and the Sahara), and Mongolia(the Gobi). These deserts are of importance because: (1) they separate two or morespheres of political and religious influence, (2) they contain valuable mineral deposits,.
6
•"" ~ ~ ~~~....... ..................................."*.*.'• k '-.•+'• •'"•"'""

0
* @3 �IIb
A
@3 @3
@3
@3 .1�*
a
@3 *�: -
U.'B'
* U�
a
II� @3 @3
@3 ___________ @3* I I
7
I '�**'� * .
............................ *1- --
(3) they have strategic Implications because of their locations, and4) the Middle East deserts are the site of major petroleum producing
activities,,
1.2 World Climate Areas Analogous to Yuma Proving Ground. The desertof the Yuma, Arizona, area is of particular interest to the Army becausethis is the desert locale In which the majority of Army materiel isfield tested and evaluated, It is, therefore, important that the environmentat Yuma be comparable to that of the world deserts in which the US Armyequipment will be deployed. Numerous analog studies have been conductedby the US Army Natick Development Center , and the US Army WaterwaysExperiment Station comparing the Yuma climate and terrain with otherdesert areas of the world. These studies indicate extensive analogybetween environmental factors at Yuma Proving Ground and the majordesert areas of the world Annex A cnntains the climatic elements ofeach of the world desert areas used Tn the analog studies.
1..2.1 Middle East (Arabian and Syrian) Desert. Of all the major desertsof the world, the Middle East environment most closely corresponds tothat of Yuma Proving Ground.. The similarity is particularly close inall important respects, both winter and summer, in the valley of theJordan River in Israel and Jordan, and in the southern part of theMesopotamian lowland between Baghdad and Basra. Although these areas ofclose analogy are of small extont, areas in which single elements of theclimate, such as winter temperatures, summer temperatures, and annualprecipitation are analogous include very considerable parts of theMiddle East. The yearly distribution of precipitation is roughly comparableto that of Yuma only on the south coast of Arabia where rain is receivedin both summer and winter, while the mean annual precipitation of theMediterranean coast and the highlands is in excess of that at Yuma.Average and extreme values of temperature are closely analogous to thoseat Yuma over considerable areas Wind speeds In general are much higherthan in Yuma expecially during daytime accompanied by clouds of dustfrom the dry, dusty plains to heights above 5000 feet. Reduction invisibility due to dust storms is more frequent in eastern and southernIraq than in Syria, and Jordan Radiation load, In terms of both dailytotal and peak intensity, is similar to that measured at Yunma ProvingGround,
1.2.2 North Afraca (Sahara L nq_.Nubian). This vast area consistsof the Sahar'and Libyan deserts which form a continuous arid regionfrom the Atlantic Ocean to the Red Sea. This region is drier than Yumaeverywhere except in a few elevated places, Rainfall is quite differentfrom Yuma with respert to seasonality in that this region has a pronouncedwinter maximum in the north and summer maximum in the south in contrastto the occurrence of both summer and winter maxima at Yuma. The interiorof the Sahara and Libyan deserts are less humid and even more sunny thanYuma. Winds in the interior desert, although predominantly lighter thanYuma are more persistent and often blow steadily in one direction forweeks or even months resulting in frequent sandstorms and reduced visibility.
II
8.
l.i.3 Australian.. The climate in much of Australia 'is J3nloqous tn thatat Yuma in one or more elements, especially mean monthly temperature. Thecuntinent is much more comparable to Yuma in winter than in summer. Mostof the continent receives too much precipitation for close analogy of morethan two elements, except in the Lake Eyre basin. Even the driest stationIn Australia receives more rain than Yuma. Mean relative humidities, how-
• •ever, are analogous to those at Yuma.
1.2.4 Turkestan. The climate of this region is governed by two climaticcontrols.Fiirst, the region is completely open toward the north, butseparated by high mountain ranges from the seuth ang'west; and second,the latitude of the region extending from 36 to 54 N is higher thanthat of most regions considered "hot" deserts., Winter is extremely coldin the north and moderately cold in the south, and is not comparable tothe mild winter at Yuma.. In summer, however, the continentality of theregion is reflected in clear skies, strong insolation, resultant hightemperatures, and moderately large daily range of temperature. Precipi-tation in the lowlands of the region is meager, varying from 4 to 10inches a year, Dust storms are frequent in the area especially duringthe summer dry months,
1.2.5 Chinese Inner-Asia (Takla Makan and Gobi). The harsh dry climateof this area is a result argery of 1ts relatively high latitude, itselevation, its location within the interior of the world's largestcontinent, and its mountain borders, Because of these factors, wintersare extremely cold with mean temperatures below freezing throughout theregion and below zero in the north. The world's highest atmosphericpressue (reduced to sea level) is centered over Mongolia in winter.. Insummer, however, the continentality of the region is reflected in clearskies, strong insolation, resultant high temperatures, ans moderatelylarge daily range of temperatu,e, Temperatures above 100"F can beexpected in most days in July. A considerable portion of this area hasmean annual precipitation of less than two inches.
1 2..6 North American .oncran, MohaveLGreat Basin). A core area ofclose analogy to tF4_7e-ihe iTTFate exists-Insou-teas tern California, andin adjoining parts of Mexico. The Sonoran desert is generally corsideredthe hottest and driest In North American other than that of Deatn Valley.The MoJave Desert is warn in simmer with mean temperatures in the uppereighties; mean winter temperatures are in the forties. The higherelevation and slightly greater precipitation of this desert tend to makevegetation more pronounced thar in the hotter deserts. The Great Basindeserts are cooi in comparison with those farther south; their summermean temperatures are in the seventies, and winter mean temperatures arebelow freezing in many places.
~~~~~~~. .1 I.....1...1.. .....
1.2.7 Kalahari. The climate of the Kalahari might be described as ahigh altitude variant of the Yuma climate. In terms of temperaturerange, both diurnal and seasonal, the Kalahari and Yuma are similar.Differences In temperature reflects the depressslng effects of higherelevation, Kalahari temperatures being much lower than those of Yuma.The Kalahari is wetter than Yuma (15 to 20) inches; however, seasonalpattern is similar. The mean temperature for the coldest month isanalogous to Yuma,
1.2.8 South American (Atacama-Peruvian, Pataoonlan). The climate ofthe Atacama and the Patagonian Deserts, and the dry coastal areas of
SPeru differs greatly from that of Yuma. Mean summer temperatures are Inthe seventies in comparison to the nineties of Yuma, M1ean winter tem-peratures are in the sixties, closely analogous to those at Yuma.Precipitation is generally less than one inch annually thoughout theregion. In Patagonia the rainfall is comparable to Yuma, but summertemperatures are even lower than those in the Atacama Desert. Wintertemperatures are much colder than those at Yuma, averaging In thethirties.
1.2.9 South Central Asia (Iranian, Thar). Extensive areas of SouthCentral a ave summer temperatures analogous to those at Yuma. Onlyin the extremely hot Indus Valley of Pakistan and the interior basins ofIran, and in the perennially cool mountains of Kashmir, Afghanistan, andnorthern Iran are summer temperature regimes appreciably different fromthose at Yuma. Mean annual precipitation (loss than 9 inches) fallswithin some degree of analogy over most of the area. The only areaswith higher rainfall are the lowlands of India subject to monsoon rains,the northwestern part of Iran bordering Caspian Sea, and some of thehigher mountains.
1.3 Desert Environmental Aspects. Most materiel developed for the Armymust operate effectively anywhere in the world. However, vwhen placed inextreme environments, many items perform below the standards expected orfail entirely. A large number of these malfunctions can be traceddirectly to environmental factors that had not been considered when theequipment was developed or had been waived as unimportant by Individualswho were unaware of the severity of the stresses that can be imposed onmateriel, and personnel, by environmental conditions.
1.3.1 Climate. 4 Heat causes crazing and cracking of rubber, plasticsand other materials It causes gasoline and other fuels to deterioraterapidly due to build up of resins, gums, etc , which in turn may causeengine malfunction. Heat produces an expansion of metals, and wherebimetallic compounds are utilized, it may result in unequal expansionrates with consequent malfunction. Propellants break up resulting inhigher pressures and possibilities for explosion. Low humidity coupledwith actinic radiation dries out nylon fibers of parachutes and ropes,increasing the likelihood of malfunction, failure and disaster.
Owing to excessive expansion of liquids and excessive evaporation,coolant levels in vehicles, oils in crankcases, transmission fluid
10
,.- -- "-...,,--
levels, etc., must have preventative maintenace by frequent checks oftheir levels. These vital liquids are also frequently contaminated withsand oartlcles and dust, which rapidly multiply failure rates of enginesan bricated components. Heat dries out greases in the moving partsof vehicles, producing "hot boxes" and breakdowns. Surfaces of materiel(rifle barrels,^tank surfaces, etc.) may reach temperatures of 62.8-79.4-C (145-175 F) causing unprotected skin of personnel to blister.Heat inJuries are common when working personnel are exposed to highambient temperatures, especially in direct sunlight.
1.3.2 T rra&in. Slopes composed of loose materials such as boulderygravels on a uvial fans and fine sands in dune areas provide poortraction for vehicles. Stream beds, canyons, etc. provide gravel androad bases and may give good concealment in places for movement offorces. However, sudden thunderstorms may result in extremely highrunoff resulting in danger to personnel and equipment in wash areas.Dust particles in desert areas are frequently associated with chlorides,carbornates and sulfides which in their impure state are hygroscopic andthus cause corrosion of moving parts of equipment. Silica particles ofsand result in erosion of metals, erosion of moving parts and pitting ofglass in high winds. Exposed rocks shorten life of vehicle tires.Desert vegetation is normally sparse, providing little concealment fortroops or equipment and therefore concealment requires use of dispersalof equipment and camouflage materials. Downwash from the helicopterrotor raises sufficient dust and sand from the disturbed desert floor toenvelop the aircraft during take-off, hovering or landing. The amountof raised dust and sand may be sufficient to clog air filtering equipmentand to obliterate any visual reference with the ground. During afternoonhours, the high ambient temperatures reduce lift capacity, while windand air turbulence near the ground impair the craft's use as a gunplatform and also interfere with accuracy of fire. The marked airdensity gradient or air turbulence in the lower few hundred feet maylimit the effective length of line-of-sight for target acquisition.
11 :
I:.
tSecton 2 - Yuma Environment of
2.1 Climate. Yuma Proving Ground (1400 sq. miles) is situated in oneof theho-ttest and driest parts of the United States. It is located
S adJacent to the Colorado River in the extreme southwest corner of thestate of Arizona and forms a part of the physiographic S:egton known asSthe Sonoran Desect. The Installation is centered at 32 53' north--latitude and 114 27 west longitude. The climate variations result morefrom a lack of latitudinally-related lifting of wet air masses (from theEastern Pacific high off the west coast during the winter, and theBermuda high off the east coast and the Gulf of California circulationduring the summer) than from rain shadow effects of mountain highlands.Atmospheric moisture is available, occasionally abundant, but reachesthe ground as rain predominantly in the mountains where condensation bylocalized lifting of air masses compensates partipIly for the lack ofregional lifting. In the Castle Dome Mountains, 37 km (23 miles) north-east of the Proving Grounir meteorological stmtion, for example, yearlyrAitnfll is As murh s 25.4 cm (ten inches), but at the station it aver-ages 8.5 cm (3.4 inches). (1952-1976)
The year round climate of Yuma Proving Ground is characterized by highsolar radiation, high summer and moderate winter temperatures, lowprecipitation and relative humidity, clear skies and unlimited visi-bility, and light surface winds. Within this generalized characterization,however, there are rather wide yearly, seasonal, and even diurnalvariations in many of the climate elements.
2.1.1 Temperature. Yuma presents a fairly representative sample ofsubtropical desert condi•ions. Its summers are hot and long, withtemperatures 37.8"C (100F) or above being recorded on one third of thedays In the year and also og everyday from June to early September.Temperatures of 46.1 0 C (106 F), are not uncommon and the absolute maximumto date is 47.8 C (1180F) based on records from 1952. In July, thehottest-month, the mean maximum is 41.1 C (106 F), and the mean minimumIs 27.2%C (81 F) The high ambient air temperatures at YPG, particularlyin the summer, result from the cummulative effects of several environmentalconditions; high ground-surface temperatures induced by inPense solarradiation little Inhibited by cloudiness, long passage of air over theheated surface, horizontal movement of previously heated air into thearea, downward movement of air masses with resultant heating and eva-poration of any moisture droplets, and minor movement of hot dry airfrom the low sides of mountains. Appendix B contains the YPG climatologicalcalendar by month for the period 1954-1973.
2.1.2 Preciptation. Yuma has an annual average rainfall of only 8.5 cm(3.4 incli-), s-7'asured at the meteorological station in the MiobllityComplex. Amounts of rainfall in individual years, however, have variedfrom .53 cm (0.21 Inches)(1956) to 16.26 cm (6.40 inche,)(1965). Pre-cipitation occurs in two well defined seasons, winter and summer, withdistinctly drier springs and autumns. The winter precipitation is
12
...........................
characterized by long-lasting, soaking drizzles and light raits whilesummer rains are associated with thunderstorms, short-lived, local, yetproductive of large amounts of water, much of which runs off over theground surface. August, the rainiest month, has an average monthlyprecipitation of .24 cm (0,49 inches), with a recorded maximum of 7.62 cm(3 inches) (1972) in a 24 hour period.
2.1.3 Humidity.. The mean relative humidity is lowest during the periodApril t--u--une (less than 30 percent). During the remainder of theyear, the average daily humidity ranges from 34 percent to 42 percent inDecember. The humidity seems excessive to people only in July, August,and September, when temperatures are high and moist tropical air movesinto the area from the Gulf of California (the so called Arizona summermonsoon).
Dew point varies widely during the summer. In May and dune, ,pproxt-ma;ely 88 percent of all hourly values are between -1.1 C 530F)and10 C (50 F), b~t in July and August 80 percent lie between 100 C (509F)and 23.thC (75eF), revealing the iredominance of morc humid air duringthe latter period. During oth the dry and humid period there is adiurnal variation of 5 to 10 degrees with the maximum occurring around0800 and the minimum from 1500 to 1700, The dry and humid periods areeach marked by intervals of a few days during which dewpoint departsmarkedly from the general values.. In July and August, for example,nighttime dew points usually average between 600 and 75 0 F but occasionallydrop for a few nights to the 30's and 40's or even lower.
2,.1.4 Cloudiness, Most of the clouds over YPG are of the cirrus generatype, fomed largely of ice crystals and with bases at an average altitudeof about 25,000 feet. The cumulus cloud types are common over the mountainsfrom July to October and are formed by condensation of locally rising moistair; they also occur over broad areas of low relief as a result of convec-tion currents.
Cloudiness at YPG is low throughout the year. On a yearly average, theskies are clear, (0-0.3 total sky cover), 67 percent of the time, partlycloudy (0-3-0.7 cover) 24 percent of the time, and cloudy (0.8-1.0 cover)9 percent of the time. In winter, the cloudiest season, the averages are:clear 54 percent, partly cloudy 29 percent, and cloudy 17 percent. In thetransitional period, just before and after summer, the least cloudy seasonaverages are approximately- clear 74 percent, partly cloudy 20 percent,and cloudy 6 percent..
2.1.5 Barometric Pressure. The barometric pressure in the Yuma area isgenerally high throughout the year as shown in Annex B.
2.1.6 Surface Inversion. Air temperature normally decreases with risingelevation. However, wien it increases to some altitude above the surface,an inversion is formed. The boundary between the surface layer and overlying
13
...
layers of air may inhibit the escape of particulate matter, such as smoke,and also acts as a reflective and/or refractive surface important in con-siderations of noise propagation. Inversions occur almost daily but dis-sipate by noon.
2.1.7 Densiy Atltuit de. A critical factor in aircraft flight operation isdensity altitude which affects lift and hover capability at maximum weight.The density altitude is temperature sensitive, i.e., hi ghtemperaturesresult in high density altitudes. This factor is very Important in desertareas where summer temperatures are in excess of 37.80C (lO0OF) and con-sequently aircraft may be limited to reduced load operations. Yuma'sdensity altitude distribution is representative of n*st desert areas of theworld. Table 1 is the average hourly density altitude during regularoperating hours based on average temperature, pressure, and relativehumidity.
2.1.8 Winds. Winds above approximately 20,000 feet altitude In the Yumaarea are predominantly from the western quadrant. Below that height, thedirection varies, often from the southerly quadrant in the summer, Inlayers controlled by the Influences of other, often moist, incoming air.masses, and from the northerly quadrant in the winter.
Surface wind directions at YPG are modified by the local topography. On atypical summer afternoon the surface air is essentially from the GranDesierto of Northern Mexico, over the Colorado River lowlands, and throughthe river gap in the eastern rim of the Yuma Valley. Although comparativelyshallow (150 to 200 feet), the river gap often influences the wind directionat the Proving Ground.
Surface wind speeds at the meteorological station In the Mobility Complexare generally light throughout the year, averaging 4-6 miles per hour. Ifthere is a "windy" season at YPG, it is during the period April-August, butit is poorly defined and winds are always unpredictable, even capricious.Peak windspeeds (gusts) average 16 mph during December-February, 21 mph inMarch-May, and 22 mph in June-August and 17 mph in September-November. Thestrongest gust recorded at the Proving Ground was 71 mph in 1970.
Winds at all low-lying areas of the Proving Ground are strikingly similarat all hours, showing strength throughout the day and weakness and vari-ability of direction at night. From about 1800 hours in the evening to0700 in the morning, the air has little or no motion, with winds averaginga scant one to two mph during the period of nighttime inversion. Aftersunrise, the winds pick up rapidly with the average climbing to 5 to 7 mphby 1000 hours, a level maintained thoughout the remainder of the day. 4Winds at higher, mountainous areas are more consistent in direction than atlower lying areas and have greater velocities, even at night.
14
"! :
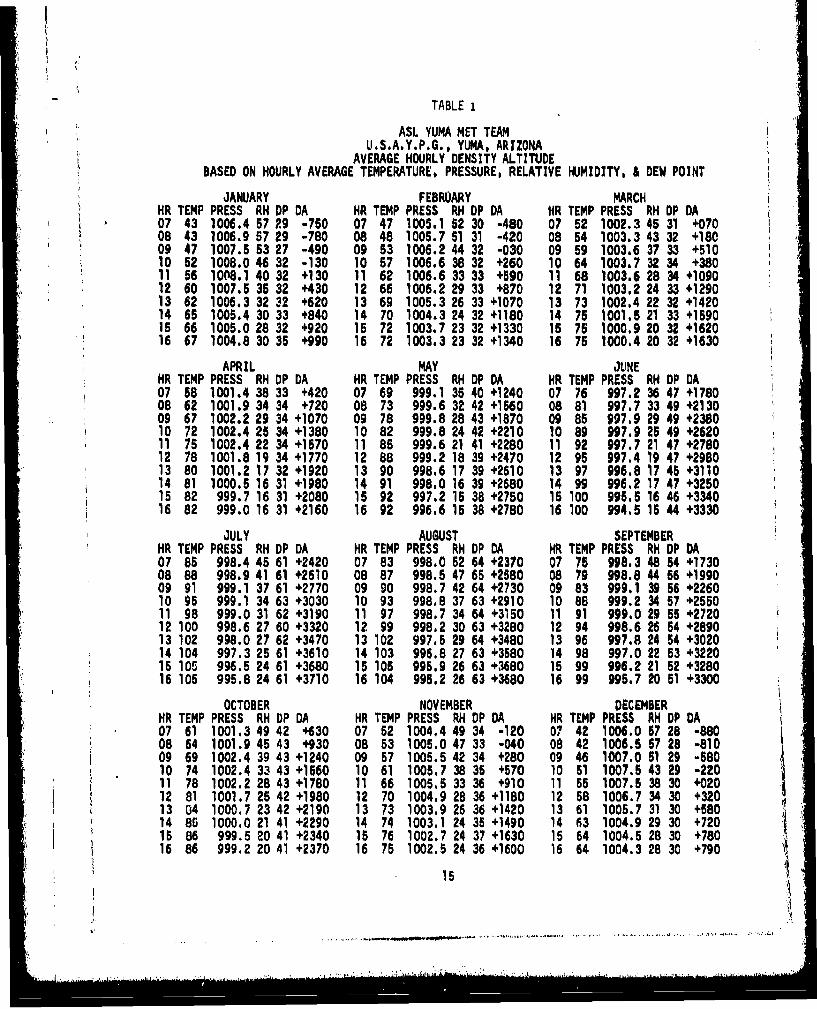
TABLE 1
ASL YUMA MET TEAMU.S.A.Y.P.G., YUMA, ARIZONA
AVERAGE HOURLY DENSITY ALTITUDEBASED ON HOURLY AVERAGE TEMPERATURE, PRESSURE, RELATIVE HUMIDITY, & DEW POINT
JANUARY FEBRUARY MARCHHR TEMP PRESS RH DP DA HR TEMP PRESS RH DP DA HR TEMP PRESS RH DP DA07 43 1006.4 5729 -750 07 47 1005.1 52 30 -480 07 52 1002.3 45 31 +07008 43 1006.9 57 29 -780 08 48 1005.7 51 31 -420 08 54 1003.3 43 32 +18009 47 1007.5 53 27 -490 09 53 1006.2 44 32 -030 09 59 1003.6 37 33 +51010 52 1008.0 46 32 -130 10 57 1006.6 38 32 +260 10 64 1003.7 32 34 +38011 56 1008.1 40 32 +130 11 62 1006.6 33 33 +590 11 68 1003.6 28 34 +109012 60 1007.5 35 32 +430 12 66 1006.2 29 33 +870 12 71 1003.2 24 33 +129013 62 1006.3 32 32 +620 13 69 1005.3 26 33 +1070 13 73 1002.4 22 32 +142014 65 1005.4 30 33 +840 14 70 1004.3 24 32 +1180 14 75 1001.5 21 33 +159015 66 1005.0 28 32 +920 15 72 1003.7 23 32 +1330 15 75 1000.9 20 32 +162016 67 1004.8 30 35 +990 16 72 1003.3 23 32 +1340 16 75 1000.4 20 32 +1630
APRIL MAY JUNEHR TEMP PRESS RH DP DA HR TEMP PRESS RH DP DA HR TEMP PRESS RH DP DA07 68 1001.4 38 33 +420 07 69 999.1 35 40 +1240 07 76 997.2 36 47 +178008 62 1001.9 34 34 +720 08 73 999.6 32 42 +1560 08 81 997.7 33 49 +213009 67 1002.2 29 34 +1070 09 78 999.8 28 43 +1870 09 85 997.9 29 49 +238010 72 1002.4 25 34 +1380 10 82 999.8 24 42 +2210 10 89 997.9 25 49 +262011 75 1002.4 22 34 +1670 11 85 999.6 21 41 +2280 11 92 997.7 21 47 +278012 78 1001.8 19 34 +1770 12 88 999.2 18 39 +2470 12 95 997.4 19 47 +298013 80 1001.2 17 32 +1920 13 90 998.6 17 39 +2610 13 97 996.8 17 45 +311014 81 1000.6 16 31 +1980 14 91 998.0 16 39 +2680 14 99 996.2 17 47 +325015 82 999.7 16 31 +2080 15 92 997.2 16 38 +2750 15 100 995.5 16 46 +334016 82 999.0 16 31 +2160 16 92 996.6 15 38 +2780 16 100 994.5 16 44 +3330
JULY AUGUST SEPTEMBERHR TEMP PRESS RH DP DA HR TEMP PRESS RH DP DA HR TEMP PRESS RH DP DA07 86 998.4 45 61 +2420 07 83 998.0 52 64 +2370 07 75 998.3 48 54 +173008 88 998.9 41 61 +2610 08 87 998.5 47 65 +2580 08 79 998.8 44 66 +199009 91 999.1 37 61 +2770 09 90 998.7 42 64 +2730 09 83 999.1 39 56 +226010 95 999.1 34 63 +3030 10 93 998.8 37 63 +2910 10 88 999.2 34 57 +255011 98 999.0 31 62 +3190 11 97 998.7 34 64 +3150 11 91 999.0 29 55 +272012 100 998.6 27 60 +3320 12 99 998.2 30 63 +3280 12 94 998.6 26 54 +289013 102 998.0 27 62 +3470 13 102 997.5 29 64 +3480 13 96 997.8 24 54 +302014 104 997.3 25 61 +3610 14 103 996.8 27 63 +3580 14 98 997.0 22 53 +3220
* 15 105 996.5 24 61 +3680 15 105 995.9 26 63 +3680 15 99 996.2 21 52 +328016 105 995.8 24 61 +3710 16 104 995.2 26 63 +3680 16 99 995.7 20 51 +3300
OCTOBER NOVEMBER DECEMBERHR TEMP PRESS RH DP DA HR TEMP PRESS RH DP DA HR TEMP PRESS RH DP DA07 61 1001.3 49 42 +630 07 52 1004.4 49 34 -120 0? 42 1006.0 67 28 -880
* 08 64 1001.9 45 43 +930 08 53 1005.0 47 33 -040 08 42 1006.5 57 28 -810* 09 69 1002.4 39 43 +1240 09 57 1005.5 42 34 +280 09 46 1007.0 41 29 -280
- 10 74 1002.4 33 43 +1660 10 61 1005.7 34 34 +570 10 51 1007.0 43 29 -22011 78 1002.2 28 43 +1780 11 66 1005.5 33 36 +910 11 55 1007.5 38 30 +02012 81 1001.7 25 42 +1980 12 70 1004.9 28 36 +1180 12 58 1006.7 34 30 +32013 04 1000.7 23 42 +2190 13 73 1003.9 26 36 +1420 13 61 1005.7 31 30 +58014 85 1000.0 21 41 +2290 14 74 1003.1 24 35 +1490 14 63 1004.9 29 30 +72015 86 999.5 20 41 +2340 15 76 1002.7 24 37 +1630 15 64 1004.5 28 30 +78016 86 999.2 20 41 +2370 16 75 1002.5 24 36 +1600 16 64 1004.3 28 30 +790
15
..,.. . . .. . .. . . .
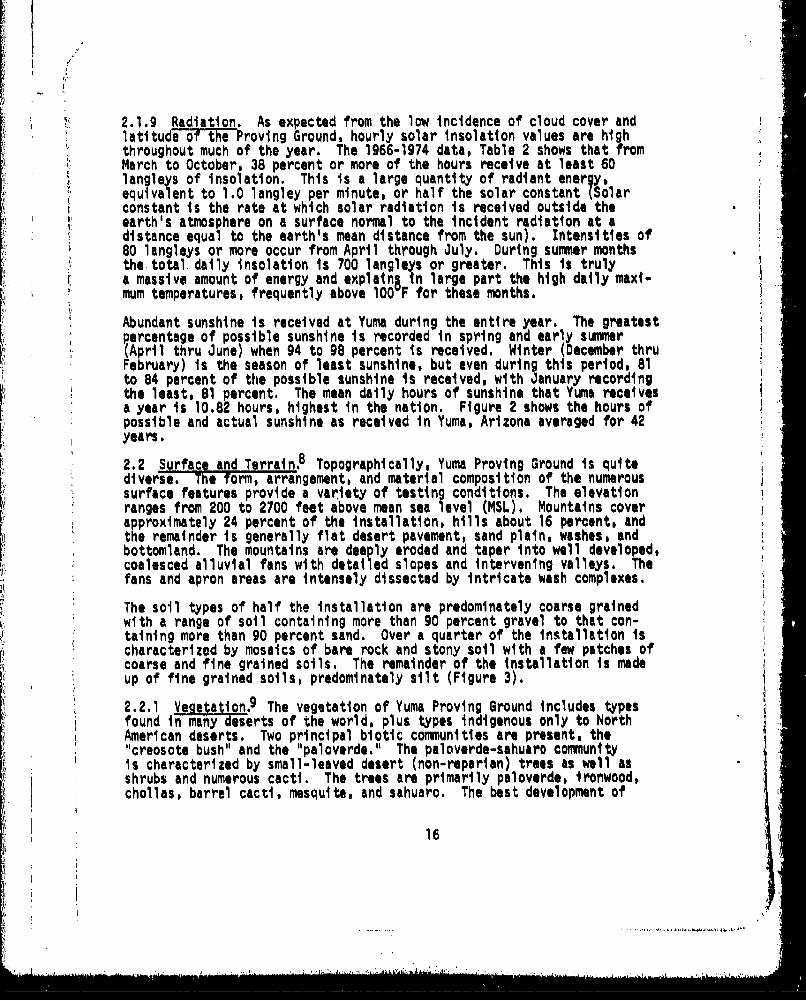
i 2.1.9 Radiation. As expected from the low Incidence of cloud cover andlatitud-eoftuhe Provfng Ground, hourly solar insolataon values are highfthroughout much of the year. The 1966-1974 data, Table 2 shows that fromMarch to October, 38 percent or more of the hours receive at least 60langleys of insolation. This is a large quantity of radiant energy,equivalent to 1.0 langley per minute, or half the solar constant (Solarconstant is the rate at which solar radiation is received outside theearth's atmosphere on a surface normal to the incident radiation at adistance equal to the earth's mean distance from the sun). Intensities of80 langleys or more occur from April through July. During summer monthsthemtotal daily insolation is 700 langleys or greater. This is trulya massive amount of energy and explain8 in large part the high daily maxi-mum temperatures, frequently above 100 F for these months.
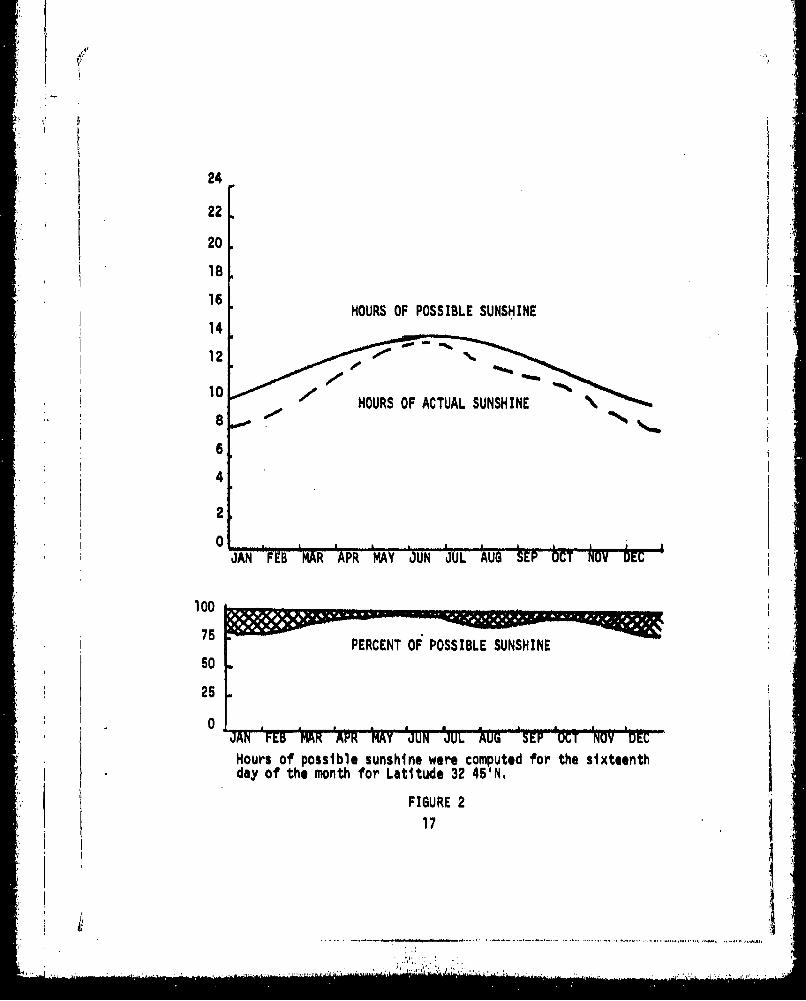
Abundant sunshine is received at Yuma during the entire year. The greatestpercentage of possible sunshine is recorded in spring and early summer
(Aprl thru June) when 94 to 98 percent is received. Winter (December thruFetruary) is the season of least sunshine, but even during this period, 81to 84 percent of the possible sunshine Is received, with January recordingthe least, 81 percent. The mean daily hours of sunshine that Yuma receivesa year is 10.82 hours, highest in the nation. Figure 2 shows the hours ofpossible and actual sunshine as received in Yuma, Arizona averaged for 42years.
2.2 Surface and Terrat *8 Topographically, Yuma Proving Ground is quitediverse. The form, arrangement, and material composition of the numeroussurface features provide a variety of testing conditions. The elevationranges from 200 to 2700 feet above mean sea level (MSL). Mountains coverapproximately 24 percent of the installation, hills about 16 percent, andthe remainder is generally flat desert pavement, sand plain, washes, endbottomland. The mountains are deeply eroded and taper into well developed,coalesced alluvial fans with detailed slopes and intervening valleys. Thefans and apron areas are intensely dissected by intricate wash complexes.
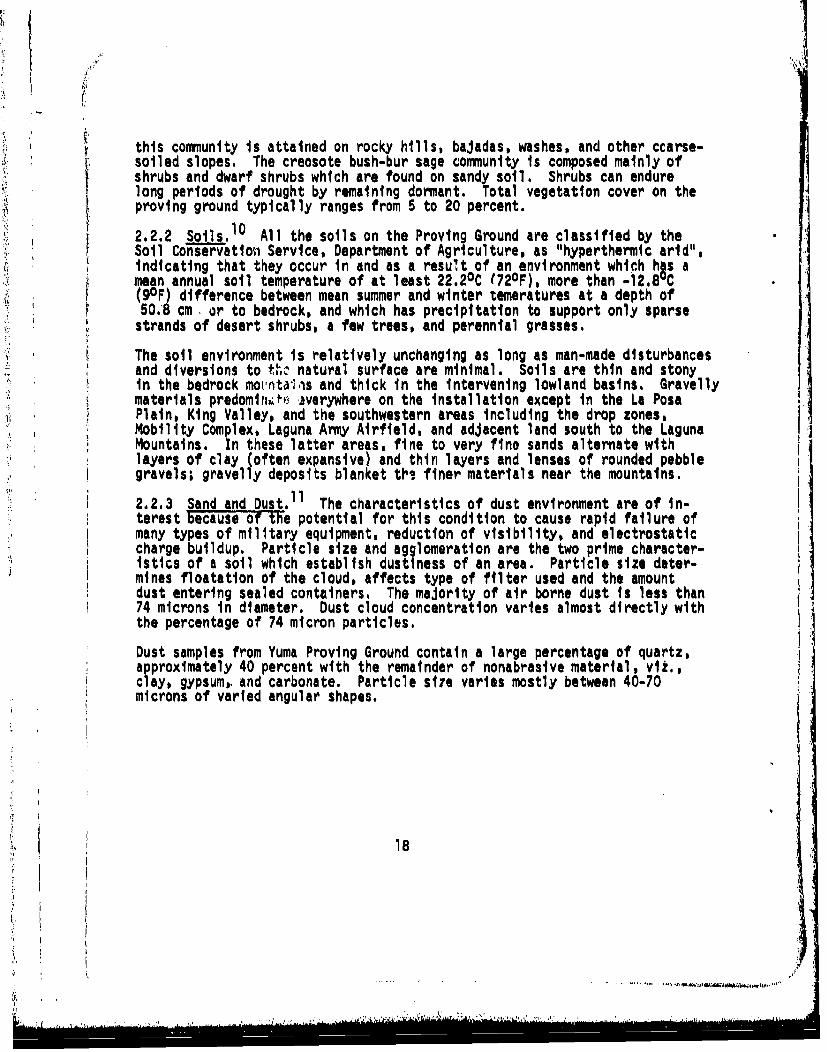
The soil types of half the Installation are predominately coarse grainedwith a range of soil containing more than 90 percent gravel to that con-taining more than 90 percent sand. Over a quarter of the installation ischaracterized by mosaics of bare rock and stony soil with a few patches ofcoarse and fine grained soils. The remainder of the installation is madeup of fine grained soils, predominately silt (Figure 3).2.2.1 Vegetation.9 The vegetation of Yuma Proving Ground includes typesfound Vn many deserts of the world, plus types indigenous only to North
American deserts. Two principal biotic communities are present, the"creosote bush" and the "paloverde." The paloverde-sahuaro communityis characterized by small-leaved desert (non-reparian) trees as well asshrubs and numerous cacti. The trees are primarily paloverde, ironwood,chollas, barrel cacti, mesquite, and sahuaro. The best development of
16
• - , ,
,'•.•,•., ................ • ••. ..,.,.,•,,,_ . ... ,• •,.. ,:,•._..L.'•......... ,,. •...,.l•.• ,•.• ,•.!,L-_,t•.• ..- :......................................-..,....................,........ ............- ,....'...... ....
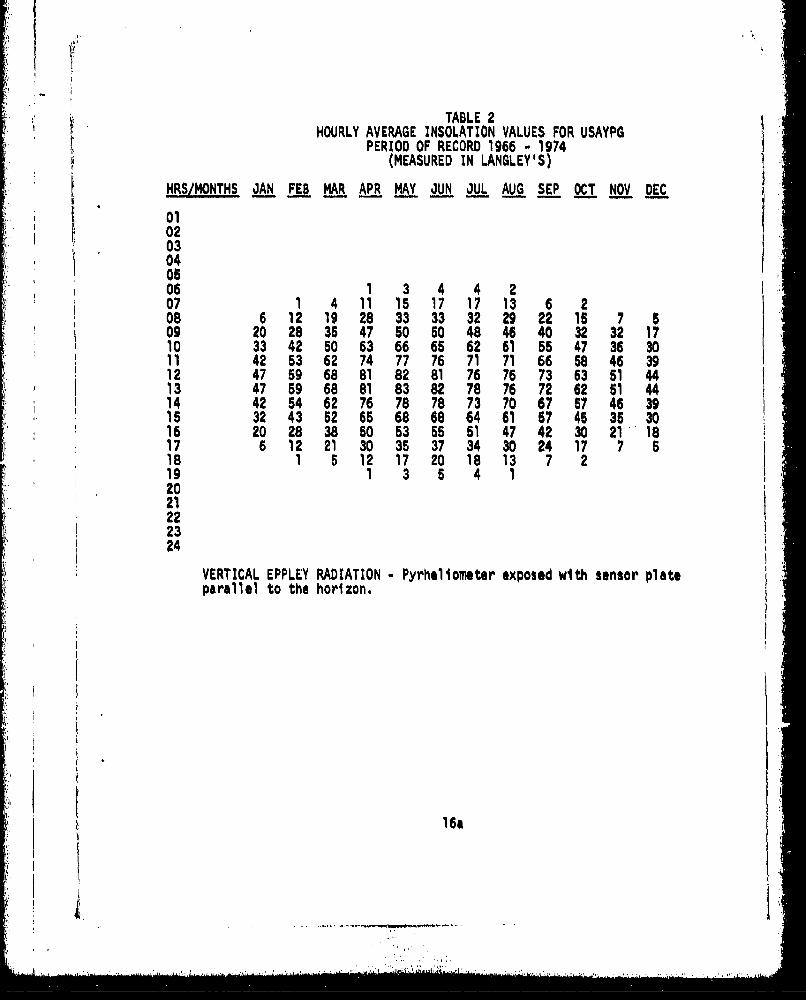
TABLE 2HOURLY AVERAGE INSOLATION VALUES FOR USAYPG
PERIOD OF RECORD 1966 - 1974(MEASURED IN LANGLEY'S)
HRS/MONTHS JAN FEB MAR APR MAY JUN JUL AUG SEP OCT NOV DEC
010202:,, ~03 -040506 1 3 4 4 207 1 4 11 15 17 17 13 6 208 12 19 28 33 33 32 29 22 15 7 509 20 28 35 47 50 50 48 46 40 32 32 1710 33 42 50 63 66 65 62 61 55 47 36 3011 42 53 62 74 77 76 71 71 66 58 46 3912 47 59 68 81 82 81 76 76 73 63 51 4413 47 59 68 81 83 82 78 76 72 62 51 4414 42 54 62 76 78 78 73 70 67 57 46 3915 32 43 52 65 68 68 64 61 57 45 35 3016 20 2 8 38 50 53 55 51 47 42 30 21 18176 12 21 30 35 37 34 30 24 17 7 518 1 5 12 17 20 18 13 7 219 1 3 5 4 12021222324
VERTICAL EPPLEY RADIATION - Pyrhellometer exposed with sensor plateparallel to the horizon.
16a
.24
22
20
18
16
14 HOURS OF POSSIBLE SUNSHINE
12
80 HOURS OF ACTUAL SUNSHI7NE
6
4
* 2
JAN FE AR 'APR WA 6JUN 'JUL AUG SEP OCT NOV E
100
* PERCENT OF POSSIBLE SUNSHINE
* 25
0JAN FEB- M AR MY 'IUN JUL WUi 'SEP 'OCT NOV tEC
Hours of possible sunshine were computed for the sixteenthday of the month for Latitude 32 451N.
FIGURE 2
17
this community is attained on rocky hills, bajadas, washes, and other ccarse-soiled slopes. The creosote bush-bur sage community is composed mainly ofshrubs and dwarf shrubs which are found on sandy soil. Shrubs can endurelong periods of drought by remaining dormant. Total vegetation cover on theproving ground typically ranges from 5 to 20 percent.
2.2.2 Soils.1 0 All the soils on the Proving Ground are classified by theSoil Consratio" Service, Department of Agriculture, as "hyperthermic arid",indicating that they occur In and as a result of an environment which his amean annual soil temperature of at least 22.2 0C (720F), more than -l2.8 C(90F) difference between mean summer and winter temeratures at a depth of650.8 cm. or to bedrock, and which has precipitation to support only sparse
strands of desert shrubs, a few trees, and perennial grasses.
The soil environment is relatively unchanging as long as man-made disturbancesand diversions to tl^ natural surface are minimal. Soils are thin and stonyin the bedrock movnta~i1s and thick in the intervening lowland basins. Gravellymaterials predomin~tf *verywhere on the installation except in the La PosaPlain, King Valley, and the southwestern areas including the drop zones,Mobility Complex, Laguna Army Airfield, and adjacent land south to the LagunaMountains. In these latter areas, fine to very fine sands alternate withlayers of clay (often expansive) and thin layers and lenses of rounded pebblegravels; gravelly deposits blanket thi finer materials near the mountains.
2.2.3 Sand and Dust. 1 1 The characteristics of dust environment are of in-terest because ofthe potential for this condition to cause rapid failure ofmany types of military equipment, reduction of visibility, and electrostaticcharge buildup. Particle size and agglomeration are the two prime character-istics of a soil which establish dustiness of an area. Particle size deter-mines floatation of the cloud, affects type of filter used and the amountdust entering sealed containers, The majority of air borne dust is less than74 microns In diameter. Dust cloud concentration varies almost directly withthe percentage of 74 micron particles.
Dust samples from Yuma Proving Ground contain a large percentage of quartz,approximately 40 percent with the remainder of nonabrasive material, vit.,clay, gypsum,,. and carbonate. Particle site varies mostly between 40-70microns of varied angular shapes.
18
!,1
SI A POSA.1~, PLAIN
* '~*~'*U.S. ARMY YUMA PROVING GROUND
CHV BE R C O N A NOKAYS BEDROCK K
ORAWIlTIC.ONNISSIC,an HST&ROK
SIIMAINTANY and MAMOAWPHOIUO AIIMINTARY k&cU
ALLUVIAL LOWLANDSGANDY SUIPICIAL MAIIIIIALS
* ****f '' CA VILLY IUEPICIAt MATIIALIl
ISI
.,Alo, f~s, SA~l
0 , c
Section 3- HumanPerformanceUnderDesertConditions
3.1 Physilog ical. The principal physiological stress placed upon an In-dividualbytypical desert heat conditions is the maintenance of normal bodytemperature . A resting body compl8tely insulated against heat exchange willincrease body temperature 2"C (3.6 F) per hour through internal processes.This increase in internal body temperature is correlated with loss Rf bodyliquids as well as metabolic heat production. In addition, at 37.8%C (1 000F)the solar radiation from the midday suo adds about 183 calories an hour toman's thermal load, and at 43.3"C (110 F) the Increase is over 210 caloriesper hour. Such increases in body heat when added to the other heat sourcesmay severely tax the body's temperature maintenance mechanism, especially ifmetabolic heat production is high.
The only mechanism the body has to regulate temperature is evaporation ofperspiration, which is facilitated by the dryness of the desert atmosphere.Where an adequate supply of water is present, perspiration rates in acclima-tized men are nearly proportional to the heat production in the body. Aninsufficient intake of liquids or heavy exertion will result In a rapid increasein body temperature leading to exhaustion or collapse.
Acclimatization Is a necessary process of physiological adaptation to thedesert. On the average, this process takes about eight days to be nearlycomplete.
3.2 Psyckihsical.l 2The principal human sense affected by desert conditionsis that of ision. Numerous anecdotal reports indicate that although visibil-ity In the desert is unrestricted, it is quite deceptive. During the heat ofmidday, contours of objects are unclear and it becomes very difficult todifferentiate between targets, trucks are mistaken for tanks, and stationaryvehicles for moving.
The primary characteristic of desert vision conditions is the intense bright-ness levels reached during the day. Table 3 indicates some typical outdoorbrightness values.
Table 3Typical Midday Outdoor Brightness
' *FootametBrightest sunlit cloud 00
*Sandy beach, dry 4,500Barren soil, light 1.,000Hazy sky 1,800Green grass in sun 700Dark soil, dry 675
20
These high brightness or reflected illumination levels produce a condition ofglare and in conjunction with atmospheric disturbances such as shimmer, boil,mirages, and haze tend to lower contrast of distant objects. These factors,together with the open, unrelieved nature of the desert terrain, make for In-creased difficulties in depth perception and distance Judgement.
Another result of the high levels of illumination in the desert is the rate ofdark adaptation of previously light adapted personnel. This can reduce theeffectiveness of such personnel during a cons-Iderable period after sunset foroperations requiring acute night vision.
- .Another factor which diminishes sense-of-sight efficiency is the refraction ofthe light waves due to heat. When magnification is used in the form of firecontrol equipment or telescopes, the heat waves are magnified and appear todistort vision even more. Targets at 1550 meters could not be resolved byobservers using 20-power telescopes due to the shimnering effects. Accurateranging therefore is almost impossible using optical equipment during the highmidday desert temperatures.
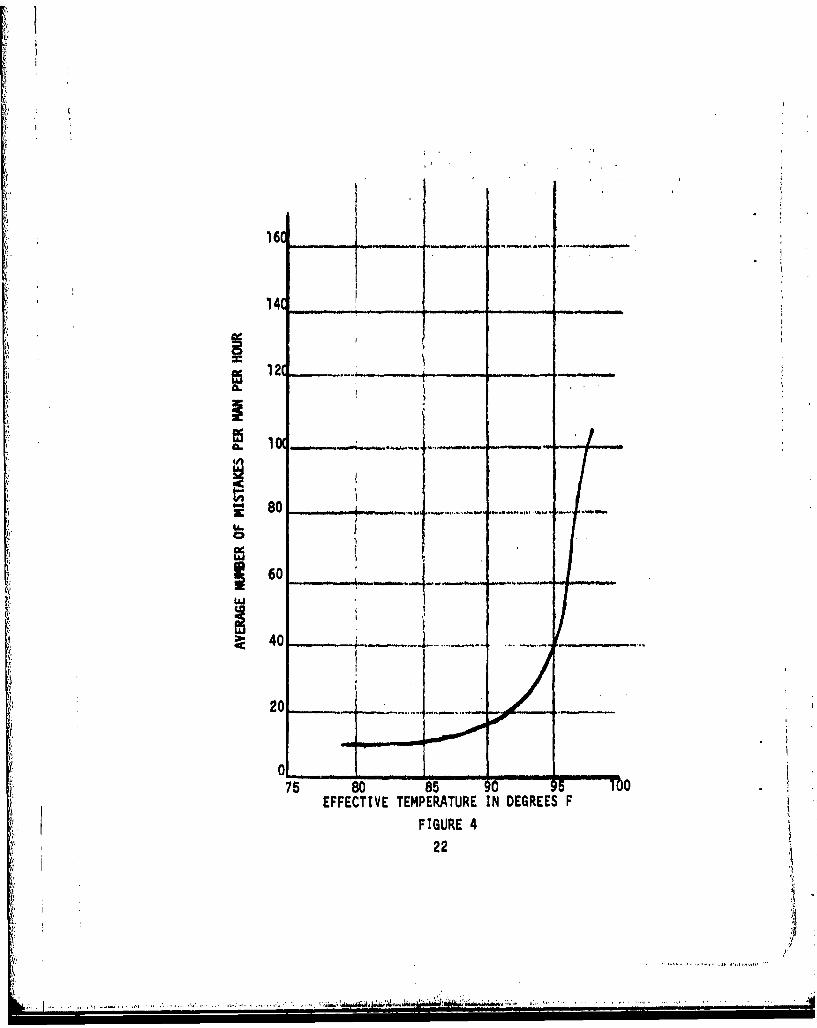
3.3 Psychomotor and Mental. The effectiveness of a man's work obviouslydepends upon the skill with which he can control his muscles and mental proc-esses. High temperature is the most important factor in reducing the opera-tional efficiency of personnel under desert conditions. The maximum limit otalrItemperature before human performance is adversely affected Is about 29.4 C(85 g) effective temperature (ET) which corresponds to a temperature of 40.6%C(105 F) at 20% relative humidity, Figure 4 shows the relation of human per-formance to effective temperature}3 Midday desert ambient temperatures quiteoften are-in excess of this limit, With the high desert ambient temperatures49vC (120"F) and the effect of intanse solar radiation, crew compartmenttemperatures can reach 65.5 0 C (1SOF) with hatches closed. These high internaltemperatures without adequate ventilation will result 'n greatly reduced per-formance effectiveness or, even worse, make the interior compartnment uninhabitable.
Threshold sensitivity to thermal gain according to Lewenstein and Dallenbach,was found to be about 46.7%C (116 F), Above this temperature, handling equip-ment requires wearing insulating gloves which reduces operators' finger dex-terity and sensitivity. The external and internal surfaces of vehicles andequipment reach temperatures far in excess of this limit. Table 4 showssome typical temperatures for equipment under desert conditions.
21
i .I-II . . . . . . .l
4
Y
16C
14C
I _102 _....
40-
a}
75 86 85 0
EFFECTIVE TEMPERATURE IN DEGREES FFIGURE 4
22
I,!
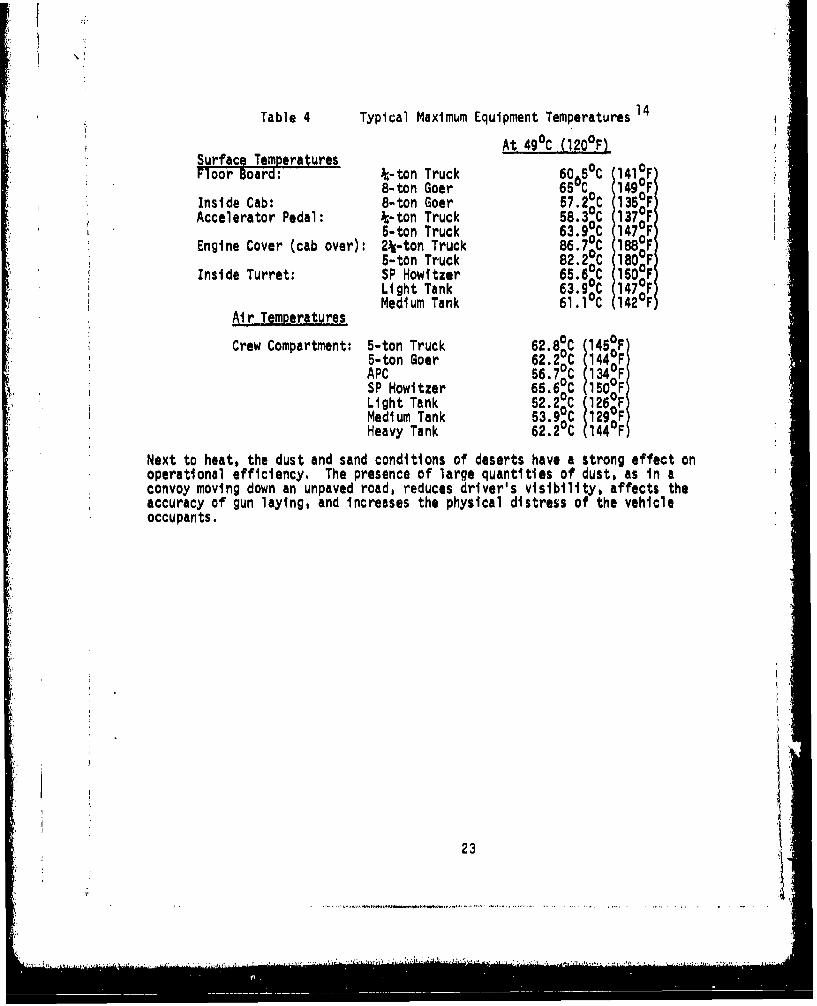
Table 4 Typical Maximum Equipment Temperatures 14
T aAt 49 C (120 0F)Surface Temperatures
Floor Board: ¾-ton Truck 60^50 C 1410F8-ton Goer 65 C 149OF
Inside Cab: 8-ton Goer 57.20C 1350FAccelerator Pedal: ¾-ton Truck 58.3 0C 1370F
5-ton Truck 63.90C 1470 FEngine Cover (cab over): 2k-ton Truck 86.7 0 C 188OF
5-ton Truck 82.2 0C 180OFInside Turret: SP Howitzer 65.60C 150OF
Light Tank 63 90C 1470FMedium Tank 61,1 0 C 1420F
Air Temperatures
Crew Compartment: 5-ton Truck 62.8C 14505-ton Goer 62.20C 144oFAPC 56.7 C 134 FSP Howitzer 65.6_C 150OFLight Tank 52 2 C 126OF)Medium Tank 63:9 0C 129OFHeavy Tank 62.2 0 C 1440F
Next to heat, the dust and sand conditions of deserts have a strong effect onoperational efficiency. The presence of large quantities of dust, as In aconvoy moving down an unpaved road, reduces driver's visibility, affects theaccuracy of gun laying, and increases the physical distress of the vehicleoccupants.
23;!.'1
Section 4 - Desert Operations
The arctic, tropic, and desert areas of the world all have one thing in common:conditions of extreme environment. These environments impose severe stresses onmen, material, and materiel. The causative factors producing these stressesare different for each of these environments, but the end result is frequentlythe same--failure of materiel to function as designed. The prime factors im-posing environmental stressis In the desert are the thermal stresses caused bysolar radiation and ambient temperatures and the physical and mechanical stressescaused by blowing sand and dust.
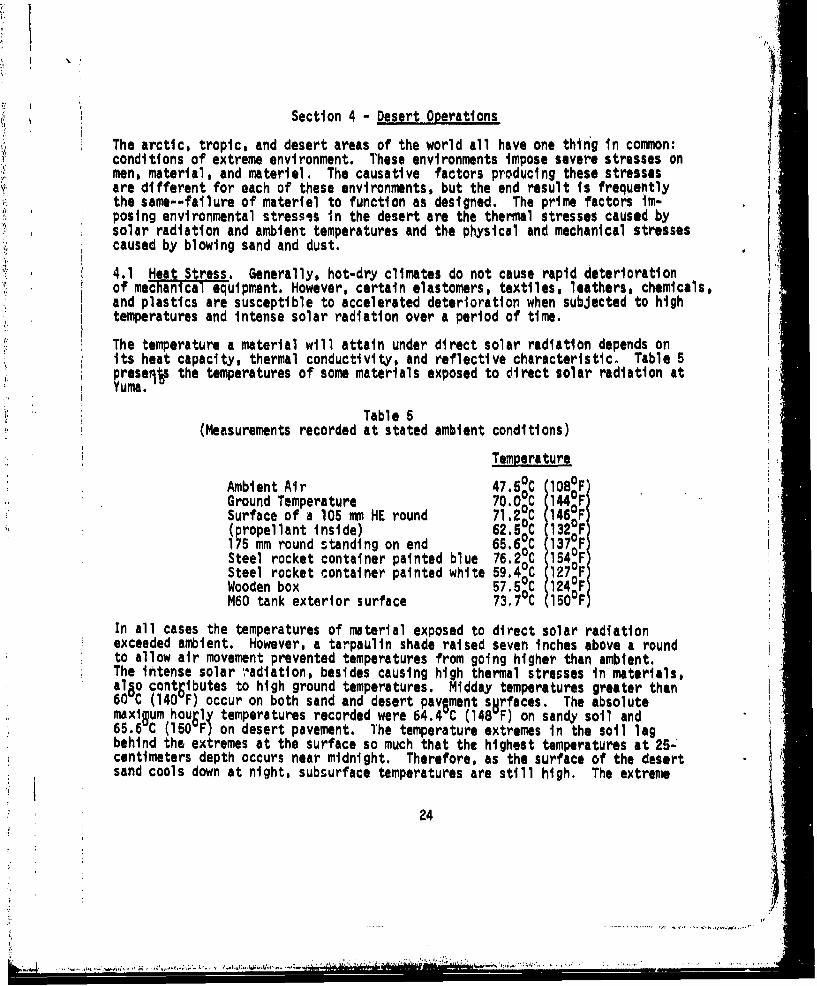
4.1 Heat Stress. Generally, hot-dry climates do not cause rapid deteriorationof mechanical equipment. However, certain elastomers, textiles, leathers, chemicals,and plastics are susceptible to accelerated deterioration when subjected to hightemperatures and Intense solar radiation over a period of time.
The temperature a material will attain under direct solar radiation depends onits heat capacity, thermal conductivity, and reflective characteristic. Table 5reserjfs the temperatures of some materials exposed to direct solar radiation aturea.
Table 5
(Measurements recorded at stated ambient conditions)
Temperature
Ambient Air 47.5 0C 108OFGround Temperature 70.0 0C 144,OFSurface of a 105 mm HE round 71.2 0C 1460F(propellant inside) 62.5oC 1320F175 mm round standing on end 65.6OC 1370FSteel rocket container painted blue 76.2:C 154oFSteel rocket container painted white 59.4 C 1274FWooden box 57.5 0C 1240FM60 tank exterior surface 73.7 0C 150 0 iF
In all cases the temperatures of material exposed to direct solar radiationexceeded ambient. However, a tarpaulin shade raised seven inches above a roundto allow air movement prevented temperatures from going higher than ambient.The intense solar radiation, besides causing high thermal stresses in materials,algo contributes to high ground temperatures. Midday temperatures greater than60 C (140'F) occur on both sand and desert pavement skrfaces. The absolutemaxiwum hou~ly temperatures recorded were 64.4wC (148'F) on sandy soil and65.6 C (150 F) on desert pavement. The temperature extremes in the soil lagbehind the extremes at the surface so much that the highest temperatures at 25-centimeters depth occurs near midnight. Therefore, as the surface of the desertsand cools down at night, subsurface temperatures are still high. The extreme
24
, • , . . . .
IJ
ground temperatures experienced in the desert can have a si gnificant effecton buried mines. Temperatures of mines burled in desert soil increased to 58.9°C(138"F). This high temperature can cause changes in chemical properties of theexplosive resulting in item malfunction.
Another facet of the solar radiation problem is that of high temperatures duringstorage. Studies have shown that the standing boxcars and the tarpaulin-coveredstorage modes were situations favoring maximum heat accumul 8tion. Ihe air nearthe top surface of the boxcar reached a temperature of 66.7 0C, (159'F). Cartonsstored in the boxcar achieved a maximum temperature of 44.4 C (112 F) for thebottgm c~rtgn. The load inside the boxcar retained temperatures in excess of37.8%C (100'F) for over 14 hours. Materials subject to chemical reaction, suchas propellants and explosives, may be markedly affected by extended storage insuch heated boxcars.
4.2 Mechanical Stress. The characteristics of dust environment are of interestbecauiseof the potenttal for this condition to cause rapid failure of many types ofArmy equipment. The Advent of faster vehicles, helicopters, and ground launchedmlssiies Intensify the dust problem. The sand and dust phenomena are not onlyassociated with desert areas but also with temperate and tropic areas as well.Generally all areas have dry periods, when sand and dust play havoc with mili-tary equipment. The dust environment is usually a result of vehicular or per-sonnel activity on the surface. Minor dust conditions can be a result ofclimatic conditions, however, the frequency is negligible when compared toman-made dust clouds.
4.2.1 Particle Size and Distribution. The size of a dust particle (expressedin microns) is usually understood to be the effective diameter of the dustparticle since dust particles do not have a definite shape. Particle size beersdirectly on dust formation and airborne dust movements.
Particle size distribution is represented as the percent of a dust sample smallerthan a given dust particle diameter. The size distribution is relatlvely in-dicative of the composition of the surface soil material since particles ofleast density and size will become available to the dust plume under moderateconditions. When a surface soil is composed of two or more basic soil materi4ls,the particle size distribution will indicate this distribution with a doubledistribution curve. For a clay-quartz soil the distribution below approximately30 microns is indicative of clay particles with those over 30 microns consti.tuting quartz particles. Table 6 shows the distribution and compostion of dustparticles from YPG vehicle test courses,. The values are averages from severaltest samples obtained from different courses.
26S.!
, ' I " "T -"'• J .... .•""i • .... I "-" '"''-- • "'J • "" •'""' '- -" .. . .......I I " ....... •" .. .. 'j
I Yi
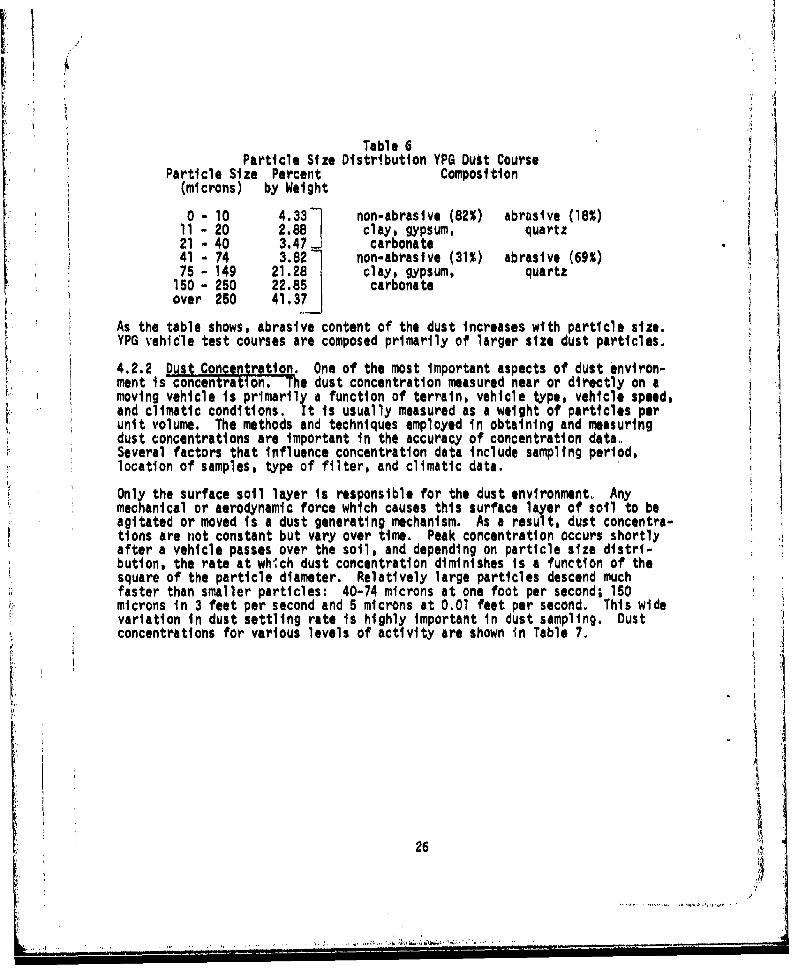
Table 6Particle Size Distribution YPG Duit CourseParticle Size Percent Composition(microns) by Weight
0 - 10 4.33 non-abrasive (82%) abrasive (18%)11 - 20 2.88 clay, gypsum, quartz21 - 40 3.47 carbonate41 - 74 3.82 non-abrasive (31%) abrasive (69%)75 - 149 21.28 clay, gypsum, quartz
150 - 250 22.85 carbonateover 250 41.37
-J
As the table shows, abrasive content of the dust increases with particle size.YPG vehicle test courses are composed primarily of larger size dust particles.
4.2.2 Dust Concentration. One of the most Important aspects of dust environ-ment is concentration. The dust concentration measured near or directly on amoving vehicle is primarily a function of terrain, vehicle type, vehicle speed,and climatic conditions. It is usually measured as a weight of particles perunit volume. The methods and techniques employed in obtaining and measuringdust concentrations are important in the accuracy of concentration data,Several factors that influence concentration data Include sampling period,location of samples, type of filter, and climatic data.
Only the surface soil layer is responsible for the dust environment. Anymechanical or aerodynamic force which causes this surface layer of soil to beagitated or moved is a dust generating mechanism. As a result, dust concentra-tions are rot constant but vary over time. Peak concentration occurs shortlyafter a vehicle passes over the soil, and depending on particle size distri-bution, the rate at which dust concentration diminishes is a function of thesquare of the particle diameter. Relatively large particles descend muchfaster than smaller particles: 40-74 microns at one foot per second; 150microns in 3 feet per second and 5 microns at 0.01 feet per second. This widevariation in dust settling rate is highly important In dust sampling. Dustconcentrations for various levels of activity are shown in Table 7ý
26
...............................,,I .,-...
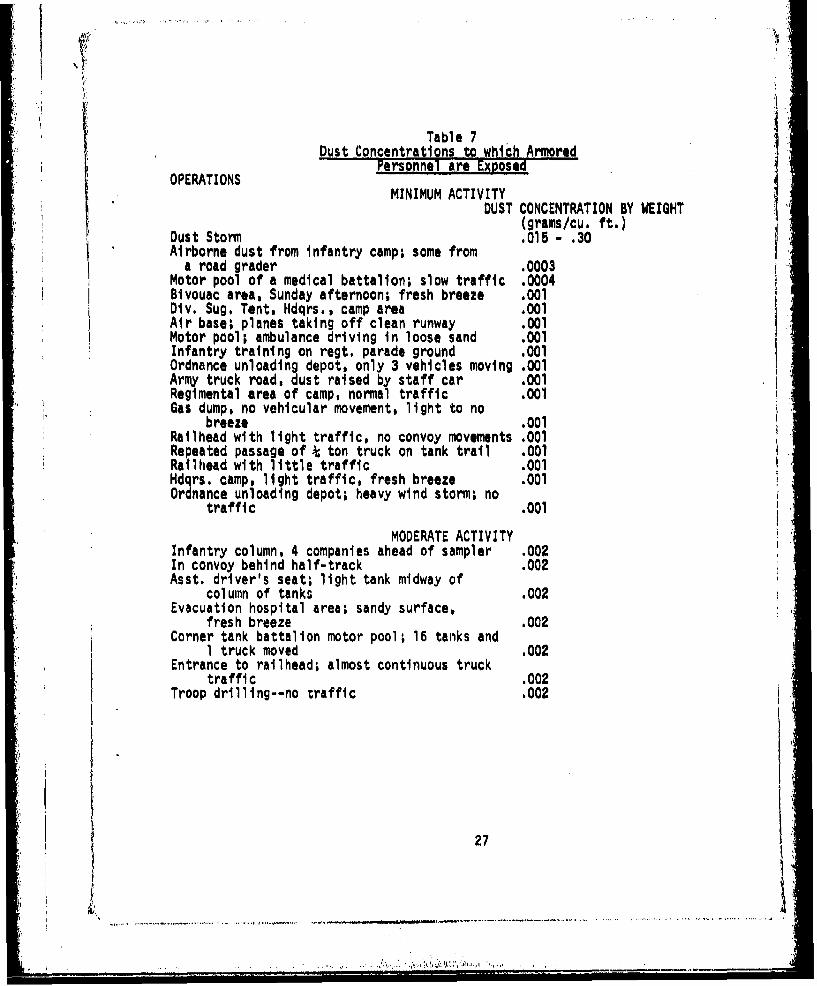
Table 7Dust Concentrations to which Armored
Personnel are ExPOsedOPERATIONS
MINIMUM ACTIVITYDUST CONCENTRATION BY WEIGHT
(grams/cu. ft.)Dust Storm .015 - .30Airborne dust from infantry camp; some from
A road grader .0003Motor pool of a medical battalion; slow traffic .0004Bivouac area, Sunday afternoon; fresh breeze .001Div. Sug. Tent, Hdqrs., camp area .001Air base; planes taking off clean runway .001Motor pool; ambulance driving in loose sand .001Infantry training on regt. parade ground .001Ordnance unloading depot, only 3 vehicles moving .001Army truck road, dust raised by staff car .001Regimental area of camp, normal traffic .001Gas dump, no vehicular movement, light to no
breeze .001Rallhead with light traffic, no convoy movements .001Repeated passage of t ton truck on tank trail .001Railhead with little traffic .001Hdqrs. camp, light traffic, fresh breeze .001Ordnance unloading depot; heavy wind storm; no
traffic .001
MODERATE ACTIVITYInfantry column, 4 companies ahead of sampler .002In convoy behind half-track .002Asst. driver's seat; light tank midway of
column of tanks .002Evacuation hospital area; sandy surface,
fresh breeze .002Corner tank battalion motor pool; 16 tanks and
I truck moved .002Entrance to ralihead; almost continuous truck
traffic .002Troop drilling--no traffic .002
27
K. . . ... .. .. .. .".', ..:.•.,•••,:/,..,•", . . .. . . . . . V
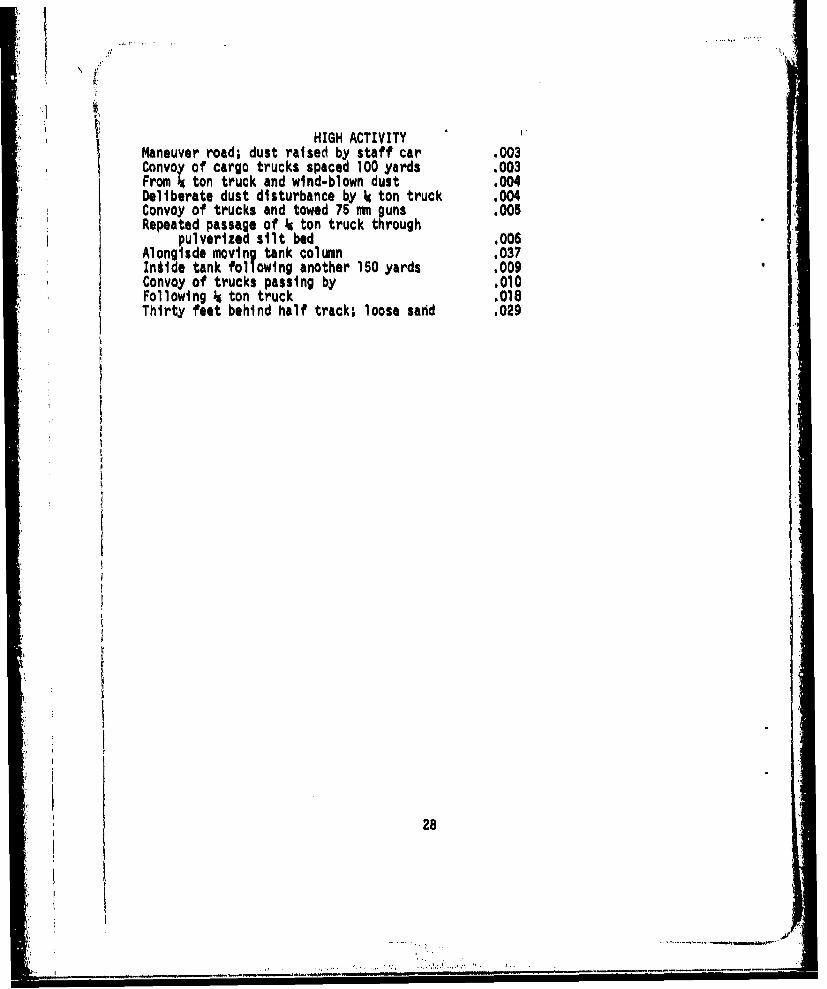
HIGH ACTIVITYManeuver road; dust raised by staff car .003Convoy of cargo trucks spaced 100 yards .003From 4 ton truck and wind-blown dust .004Deliberate dust disturbance by 4 ton truck .004Convoy of trucks and towed 75 mm guns .005Repeated passage of 4 ton truck through
pulverized silt bed .006Alongisde moving tank column .037Intide tank following another 150 yards .009Convoy of trucks passing by .010Following 4 ton truck .018Thirty feet behind half track; loose sand .029
28
E e i nSection 5 - DWsert maintenance
Equipment maintenance is highly critical in desert operations. Organizationalmaintenance cannQt be overlooked; It is at this stage that serious damage andfailure can be avoided by detecting and correcting minor deficiencies whichcould lead to a major breakdown. Gen, Charles L. Scott after WWII said,
". . . Anyone who doesn't believe in stressing motor maintenance orin providing liberally for it in armor or mechanized units should
take a trip to the desert and become converted. It is litteredwith millions of dollars worth of tanks and motor vehicles, manyof which could have been saved by preventive maintenance...
The excessive heat, abrasive materials of the sand/dust, and rugged terrain ofthe desert environment are constantly at work to disable equipment. One ofthese factors alone could put a vehicle out of action. However, together andacting simultaneously, they represent a formidable obstacle to military equip-ment operation.
5.1 Heat. The high temper&tures encountered in the desert prevent acequateheat Udssipatton of the cooling and lubricating system of vehicle engines.When a cooling system becomes ineffective it can adversely affect the lubri-cating system and vice versa. Temperatures in excess of 107.2 0C (225 F) havebeen recorded for engine oil during operation. Therefore, particular attentionshould be given to vehicle cooling systems as overheating is a major problem indesert operations. The operator should frequently check the temperature gauge.Liquid cooling systems should be flushed and cleaned frequently. Distilledwater should be used if possible, and a coorosion Inhibitor should be added.The coolant level needs checking often due to the high evaporation rate in thedesert. The radiator pressure caps should be checked for proper operation, asone pound of pressure raises the boiling point approximately three degrees.The exterior of the radiator should be cleaned to prevent the accumulation ofsand and dust which restricts airflow and impedes cooling. Hoses deterioratemore rapidly in the desert due to extreme heat. They should be inspected atmore frequent intervals than those prescribed in the technical manuals. Fanbelts deteriorate rapidly and should be checked for cracks and breaks, Sparesshould be available.
Frequent bleeding of hydraulic systems may be required to maintain pressure.This is due to the great diurnal temperature variations experienced in thedesert. A 40-degree difference between morning and afternoon temperatures Isnot unusual,
Excessive temperatures can be generated by a combination of ambient heat, radia-tion and friction, Rubber tires agd track pads have been known to blow out dueto concentration of heat above 121 C (250 0F) in the Interior rubber.
Batteries must be given special care by having water levels checked frequentlydue to excessive evaporation. Overcharging will result In higher evaporation
29
__________ ___________ ". #LZIb
rate; therefore, voltage regulators should be set to lowest practical chargingrate.
5.2 Sand/Dust. The adverse effect of the desert environment on maintenancerequirements of armament and individual weapons Is primarily due to blowingsand and dust. Moving parts in the recoil mechanism, brakes, and elevating andtraversing mechanisms can easily become contaminated by abrasive particles.This will lead to higher rates of wear for the affected parts. In smallcaliber weapons, sand and dust will cause clogging, and Jamming. Lubricationwill compound the problem due to formation of abrasive paste. Therefore,weapon systems should be kept dry and clean if possible. If the weapon is notbeing used, it should be covered to protect vulnerable parts.
Relays and contactors are easily contaminated by s,:nd and dust preventingcontacts from closing. Fixed equipment, such as stationary engines, generators,compressors, pumps, and machine tools, also suffer from the abrasive effects ofwindblown sand and dust. Rings are worn, cylinders scored, commutators scratched,and bearings damaged. Frequent inspection and cleaning of air filters andprotective screening is required. A higher than normal replacement rate shouldb anticipated and replacement parts kept on hand.
Erosion of helicopter rotor blades and turbine engine compressor bladesmay be a significant problem during desert operation. Numerous metallic andplastic compounds have been tried to reduce rotor erosion but with littlesuccess. The only sure method to alleviate high rotor replacement is bylimiting low level hovering and using surfaced helipads.
The infiltration of sand and dust occurs even in the most minute openings.This ability of fine-grained material to enter areas poses a severe problem tostored electronic equipment and delicate aircraft Instrumentation which requiresthe exclusion of foreign material. Extreme care should be exercised whenworking with such materiel.
Impact of windblown particles produces large electrostatic voltages. An elec-trostatic charge of as much as 150,000 volts was produced in Saudi Arabiaduring a severe dust storm. Proper grounding of equipment should be insuredprior to handling.
All maintenance should be performed in a protected environment to preventcontamination as much as possible. Tasks which require exposure of lubricatedsurfaces, should not be performed under adverse conditions.
5.3 Torrain. The rocky nature of many desert areas causes severe vibrationproblem% on vehicles and transports. Frequent inspection should be made of allair lines, bolts, nuts, etc. to insure proper tightness.
30
i4:
Tires of dual-wheeled vehicles must be inspected more frequently after drivingthrough rock covered areas, to remove any lodged rock particles and to insurethat the tires are properly inflated. A flat tire on one of the dual wheelswill not be noticed while driving and could result in premature failure of theother tire if load is excessive.
31
.i
~1
I I
ANNEX A
Climatic Elements
of
World Deserts
32
S~.. . . . .. . . . ...... .. .. ........ .. . ..........-
'I
A-i
Middle East
33
.*. ~ ~ I- , . *-R* ~
+.1
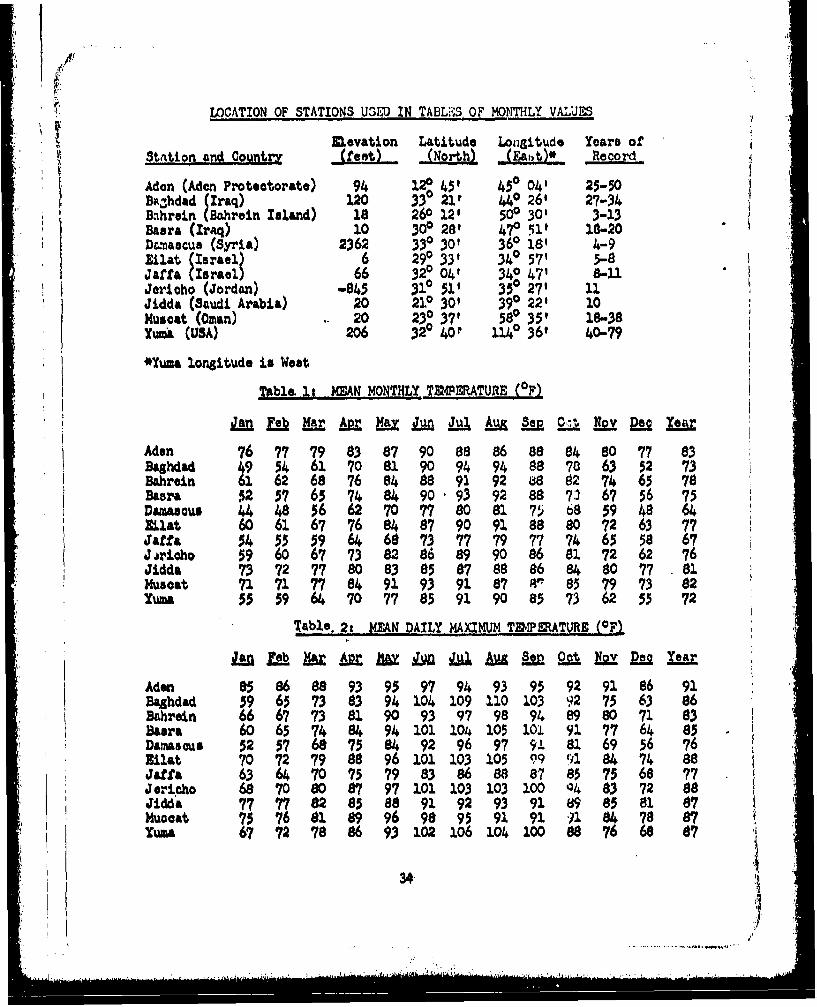
LOCATION OF STATIONS U3ED IN TABL'.S OF MONTHLY VALUE S
Elevation Latitude Loogitude Years of
Station and Countr (Leet) (North) (Eat•t)*. Record
Adon (Aden Protectorate) 94 12 45 450 04' 25-50DBRhdad (Iraq) 120 330 21r 440 26' 27-34Baihrein (Bahrein Island) 18 260 12' 500 301 3-13Basra (IrAq) 10 300 28' 470 51' 19-20Dc~naacus (yi)2362 330 30' 360 181 4-9Ellat (Israel) 6 290 331 340 571 5-8Jaffa (Israeal 66 320 041' 340 47 8-11Jericho (Jordan) -845 310 51, 350 27' 11Jidda (Saudi Arabia) 20 220 30' 390 22' 10Muscat (Oman) . 20 230 371 580 35' 18-38Yucia (USA) 206 320 40P 11e 36' 40-79
*Yumsa longitude is West
,ble. I i MEAN MONTHLY TWERATURE (cF)
L* Fe MI M a " Jul Au inp 0;a iipx Le2Ya
Aden 76 77 79 83 87 90 88 86 88 84 80 77 83Baghdad 49 54 61 70 81 90 94 94 88 70 63 52 73Bahrein 61 62 68 76 84 88 91 92 88 82 74 65 78Baura 52 57 65 74 84 90 93 92 88 7:3 6? 56 75DUmasus 44 48 56 62 70 77 80 81 7$ 68 59 48 64Rlat 60 61 67 76 84 87 90 91 88 80 72 63 77Jaffa 54 55 9 6 68 73 77 79 77 74 6 58 67Joi~cho 59 60 67 73 82 86 89 90 86 81 72 62 76Jidda 73 72 77 80 83 85 87 88 86848 0 77 81.Muscat 7171 77 84 91 93 91 87 85 79 73 82
5UA5 59 64 70 77 85 91 90 85 73 62 55 72
Table. 2t MEAN DAILY MAXMtUM TDIP•ATURE (OF
• Z' ILb AM i " "I A LU 2 Lv Doe -YeaI
Aden 85 86 88 93 93 97 94 93 95 92 91 86 91Baghdad 59 65 73 83 94 104 109 110 103 92 75 63 86Bahrein 66 67 73 81 90 93 97 98 94 89 80 71 83Basra 6065 74 84 94 101104105101 91 77 64 85Damascus 52 57 6875 8492 96 979.1 81 69 56 76silat 707279 88 96101103105 99 ril 84 74 88Jaffa 636470 7579 838688878$7568 77Jericho 68 7080 87 97 101 103 103 100 Q4 83 72 88Jidda 77 77 82 85 88 91 92 93 91 85 81 87)luocat 75 76 81 89 96 98 95 91 9184 78 87YUMA 67 7 72 8 6 93 102 106 104 10088 7668 87
34)1}
n- n n n ni
1*'
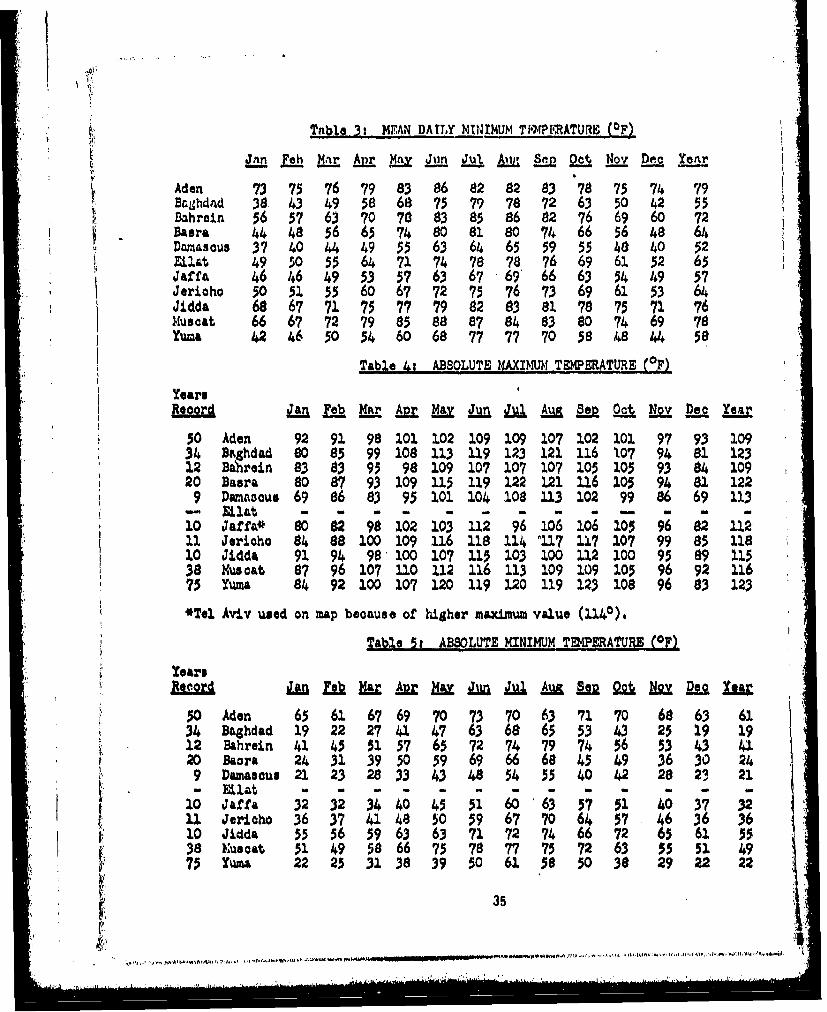
Table 3: MEAN DATLY NTNIMUM TI.PURATURE (OF)
!Jim eb W-r _Ar MU JIn Jul AM §:.e "C Lov Dmc Yea
Aden 73 75 76 79 83 86 82 82 83 78 75 74 79B&Shd~d 38 43 49 58 68 75 79 78 72 63 50 42 55Bahrain 56 57 63 70 70 83 85 86 82 76 69 60 72Basra 4 48 56 65 74 80 81 80 74 66 56 48 64D~masous 37 40 44 49 55 63 64 65 59 55 48 40 52Eilat 49 50 55 64 71 74 78 78 76 69 61 52 65Jaffa 46 46 49 53 5? 63 67 69 66 63 54 4 9 57Jerioho 50 51 55 60 67 72 75 76 73 69 61 53 64Jidda 68 67 71 75 77 79 82 83 81 78 75 71 76IHuseat 66 67 72 79 85 89 87 84 83 80 74 69 78Ywaa 42 46 50 54 60 68 77 77 70 58 48 44 58
Table 41 ABSOLUTE ,MAXIMUN TEWERATURE(°F
YearsRecrdJan Fab Mumr Ap May "a AM §n 2A &X De Year
50 Aden 92 91 98 101 102 109 109 107 102 101 97 93 10934 Baghdad 80 85 99 108 113 119 123 121 116 107 94 81 12312 Bahrain 83 83 95 98 109 107 107 107 105 105 93 84 10920 Basra 80 87 93 109 115 119 122 121 116 105 94 81 122
9 Damasoue 69 86 83 95 101 104 108 113 102 99 86 69 113, - ELZ~t~ -- - - -- - -'
10 Jaffa* 80 82 98 102 103 112 96 10"6 3.06 105 96 82 11'211 Jericho 84 88 100 109 116 118 114 2117 117 107 99 85 11810 Jidda 91 94 98' 100 107 115 103 100 112 100 95 89 11538 Muscat 87 96 107 110 112 116 113 109 109 105 96 92 11675 Yuma 84 92 100 107 120 119 120 119 123 108 96 83 123
*Tel Aviv used on map because of higher maximum value (1140)o
Table 51 ABSOLUTE MINIMUM TE4PERATURE (OF)
* rYears
30 Aden 65 61 67 69 70 73 70 63 71 70 68 63 6134 Baghdad 19 22 27 41 47 63 68 65 53 43 25 19 1912 Bahrein 41 45 51 57 65 72 74 79 74 56 53 43 4"120 Baara 24 31 39 50 59 69 66 684 54 9 36 30 249 Damuacu 21 23 28 33 43 48 54 55 40 42 28 2, 21
a- •lat 2. - - - - - - - -1 o Jaffa 32 32 34 40 45 51 60 '63 57 5• 40 37 3211 Jeriho 36 37 41 48 50 59 67 70 64 57 46 36 3610 Jidda 55 56 59 63 63 71 72 74 66 72 65 61 5538 Nuoat 51 49 58 66 75 78 77 75 72 63 55 51 497ýYuaa 22 25 31 38 39 50 61 58 50 38 2922 22
* 351 ' I
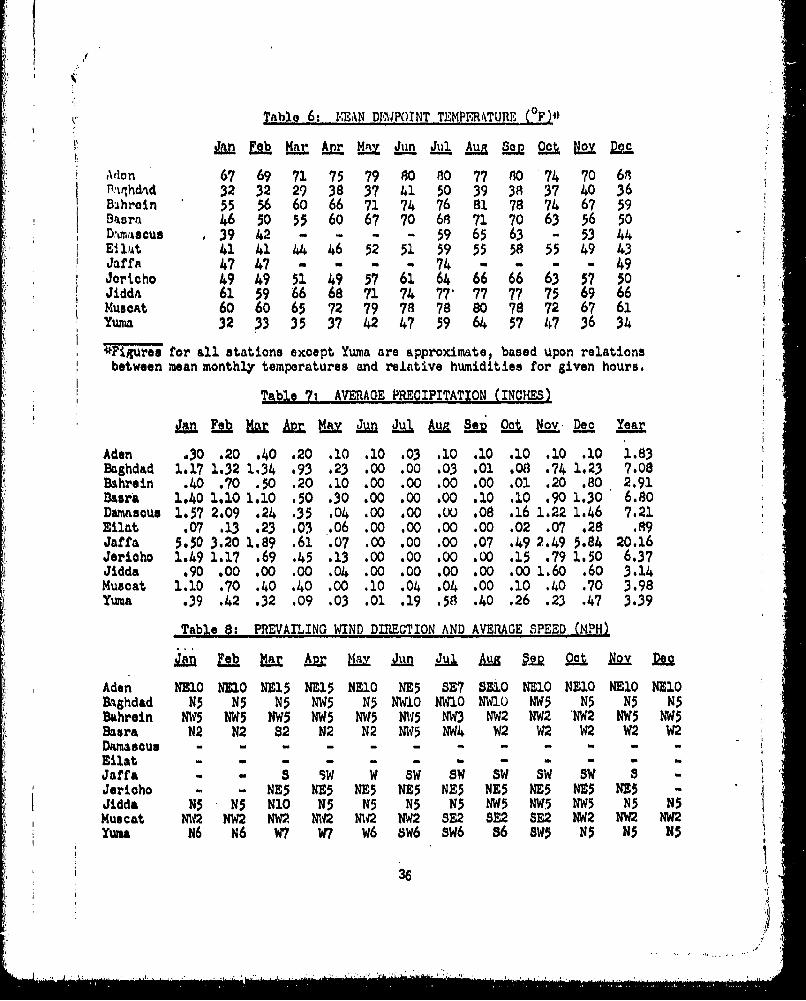
•,, ~~~Table 6: K,,EAN DTU•POINT TEMPF•RTURE (OF)* -
,Ion 67 69 71 75 79 74 80 77 80 75 70 66Sa.,%hdad 32 32 29 38 37 41 50 39 38 37 40 36
Bhroin 55 56 60 66 71 74 76 81 78 72 67 59Basra 46 50 55 60 67 70 68 71 70 63 36 50 ,
D.'MCUS 39 2 2 .. 3 5 74 4 59 65 63 - 53 444 l,•t 41 41 44 46 52 51 59 55 58 55 49 43Jaffit 47 47 -. . . . 74 . . .-h9 -Joricho 49 49 51 49 37 61 64 66 6; 63 57 50Jidda 61 59 '66 68 71 74 77' 77 77 75 69 66Muscat 6o 6o 65 72 79 78 78 80 78 72 67 61 i
Yurn 32 33 35 37 42 47 59 64 57 47 36 34
ZF-igures for all stations exoept Yuma are approximate, based upon relationsbetween mean monthly temperatures and relative humidities for given hours.
Table 7: AVERAGE PRECIPITATION (INCHES)
3Lan Fb U & U Jun lult &a Le2_ c Nv Dec Year
Aden .30 .20 .40 20 .10 .10 .03 .10 .10 .10 .10 .10 1,83Baghdad 1.17 1.32 1.34 .93 .23 .00 .00 .03 .01 .08 .74 1.23 7.08Bahrein .40 .70 .50 .20 .10 .00 .00 .00 .00 .01 .20 .80 2.91Basra 1.40 .10 1.10 .50 .30 .00 .00 .00 .10 .10 .90 1.30 6.80Dama3ous 1.57 2,09 .24 .35 .04 .00 .00 .L0 .08 .16 1.22 1.46 7.21Eilat .07 .13 .23 x3 o6 oo .00 ,00 .00 .02 .07 .28 .89Jaffa 5.50 3.20 1.99 .61 .07 ,00 .00 .00 .07 .49 2.49 5.84 20.16Jericho 1.49 1.17 .69 .45 .13 .00 .00 .00 .00 .15 .79 1.50 6.37Jidda .90 .00 .00 .00 .04 .00 .00 .00 .00 .00 1.60 .60 3.14Muscat 1.10 1 .0 .40 .00 .10 .04 .04 .00 .10 .40 .70 3.98Yuma .39 .42 .32 .09 .03 .01 .19 ,58 .40 .26 .23 .47 3.39
Table 8: PREVAILING WIND DIRECTION AND AVERAGE SPEED (MPH)
Aden NE10 NEI0 NE15 NE15 NE1O NE5 SET SEIe NE1O NE1O NE1O NEIOBaghdad N5 N5 N5 NW5 N5 NW1O NWIO NW1O NW5 N5 N5 N5Bahrain NW5 1415 ?N5 NW5 NW5 1M5 N13 NW2 N12 1NW2 NW15 NW514Basra N2 N2 82 N2 N2 N15 NW4 W2 W2 W2 W2 W2Damascus -,Eilat -......Jaffa - S SW W SW SW SW S;- "Jericho - - NE5 NZ5 NE5 NE5 NE5 NE5 NE5 1E5 NE5 -Jidda N5 N5 N10 N5 N5 N5 N5 NW5 NW5 NW5 N5 N3Muscat 1%12 NW2 NW2 142 M NW22 SE2 NW2 NW2 NW2YWua N6 N6 W7 W7 w W6w6 sW66 s6 sw 5 N$ N3 5
36! I"
-- - ....- - -I . -. - - .
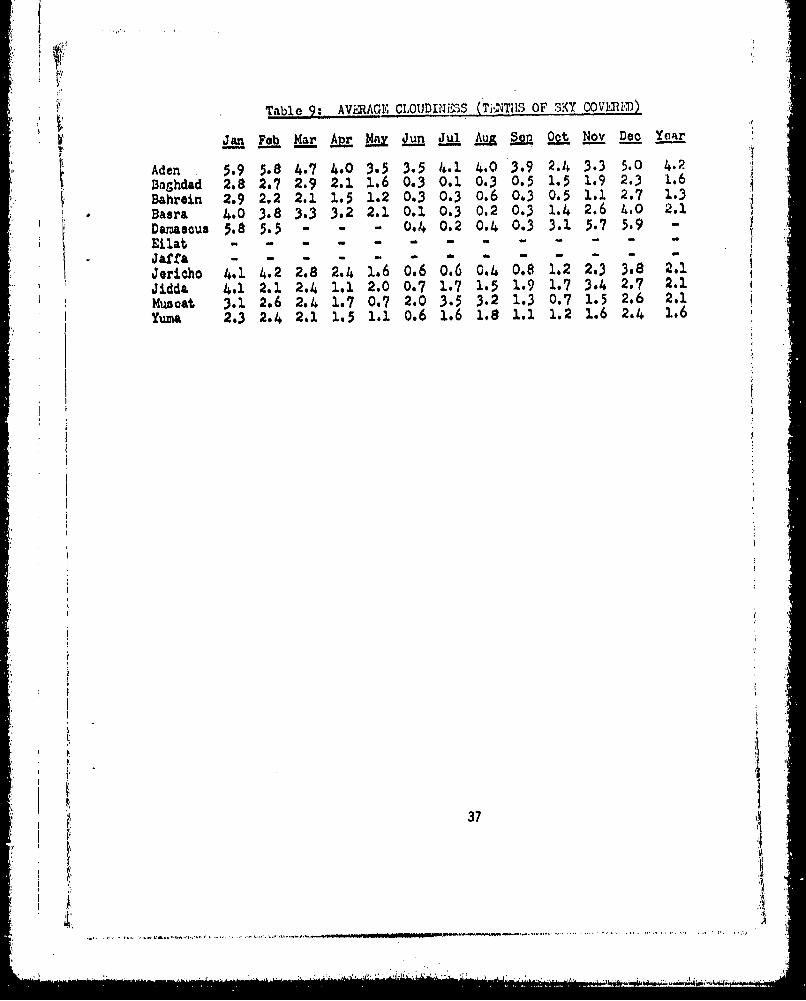
i!" ~Table,,9: AVWRAGE CLOUDINi=I• (Ti,,NTiIS OF SKY COVMHdD).
SJman Fab &a_ Apr May Jun Su e Oct. No_.. Dee._ e
Aden 5.9 5.8 4.7 4.0 3.5 3.5 4.1 4.0 3.9 2.4 3.3 5.0 4.2Baghdad 2.8 2.7 2.9 2.1 1.6 0.30.1 0.3 0.5 1.5 1.9 2.3 1.6Bahrein 2.9 2.2 2.1 1.5 1.2 0.3 0.3 0.6 0,3 0.5 1.1 2.7 1.3
•,Basra 4,0 3.8 3.3 3.2 2.1 0.1 0.3 0.2 0.3 1.4 2.6 4.0 2.1
SDamasous 5.8 5.5 - - - 0,4 0.2 0.4 0.3 3.1 5.7 5.9 -. '
Eilat . ...... -,, ~~~~Jaffa . ......: Jericho 4.1 4.2 2,8 2,4 1.6 0.6 C7,6 074 0,8 1.2 2.3 3.8 2.1
-:Jidda 4,1 2.1 2.4 1.1 2.0 0,7 1.7 1.5 1.9 1.7 3,4 2.7 2.1
Muscat 3.1 2.6 2,4 1.7 0.7 2,0 3.5 3.2 1,3 0.7 1.5 2.6 2.1 .
Yuma 2,3 2.4 2,1 1,5 1.1 0.6 1.6 1.8 1.1 1.2 1.6 2.4 1.6
.7 ,
I di4
A,
. . ' • •-..t• .... ... _ ••' .a•
.44i
A-2
Northeast Africa
.1
38
I,..
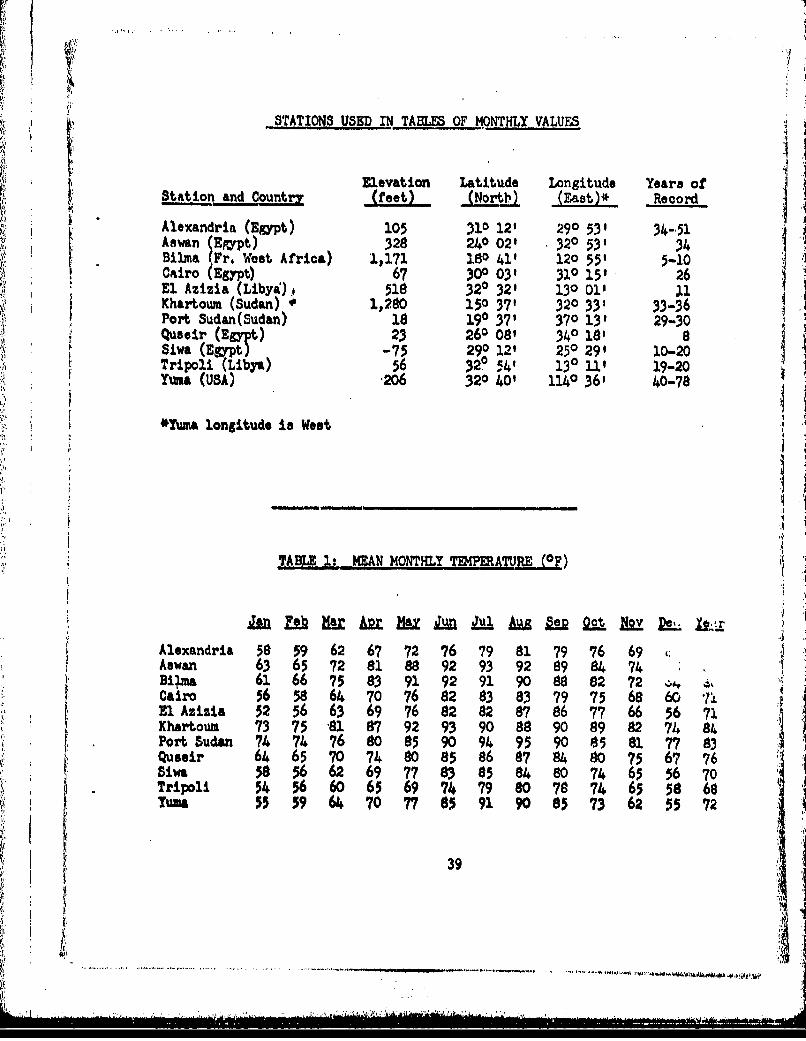
STATIONS USED IN TAHM OF MONTHLY VALUFS
. J
Elevation Latitude Longitude Years ofStation and Country (feet) (Nortb (a) Record
Alexandria (Egypt) 105 310 12' 290 531 34-51Aswan (EArapt) 328 240 02' 320 531 34Bilma1,171 180 41' 120 55' 5-10Cairo (Egypt) 67 300 03' 310 15' 26El Azizia (Libyi) , 518 320 32' 130 01' 11Khartoum (Sudan) ) 1,280 150 371 320 33' 33-36Port Sudan(Sudan) 23 190 37' 370 13' 29-30
18eir (E9t) 23 260 08, 370 18' 2Siwa (Eart) -75 290 12' 250 29' 10-20Tripoli (Libya) 56 320 941 130 11' 19-20Yuma (USA) .206 320 40' 1140 36' 40-78
*Yuma longitude is West
1
TABLE .: -,,MEAN MONTHLY T MAVRE (OF)
an Fab I U L Lax~r L Mz IU.. Am Lew ,. o9 1E• f.- 2e r
Alexandria 58 59 62 67 72 76 79 81 79 76 69Aswan 63 65 72 81 88 92 93 2 89 84 74Bi~jna 6 66 75 83 9 92 9 90 8 2 7Cairo 56 58 64 70 76 82 83 83 79 75 68 60 7i .El Azizia 52 56 63 69 76 82 82 87 86 77 66 56 71Khartoum 73 75 81 "87 92 93 90 88 90 89 82 74 84Port Sudan 74 74 76 80 85 90 94 95 90 153 81 77 83Queeir 64 65 70 74 80 85 86 87 84 80 75 67 76Siwa 58 56 62 69?? ? 83 85 8 8 074 65 56 70Tripoli 54 56 60 65 69 74 9 80 74 65 58 68Tua 55 59 64 70 77 85 91 90 85 73 62 55 72
39
.. ....... ...... . . .
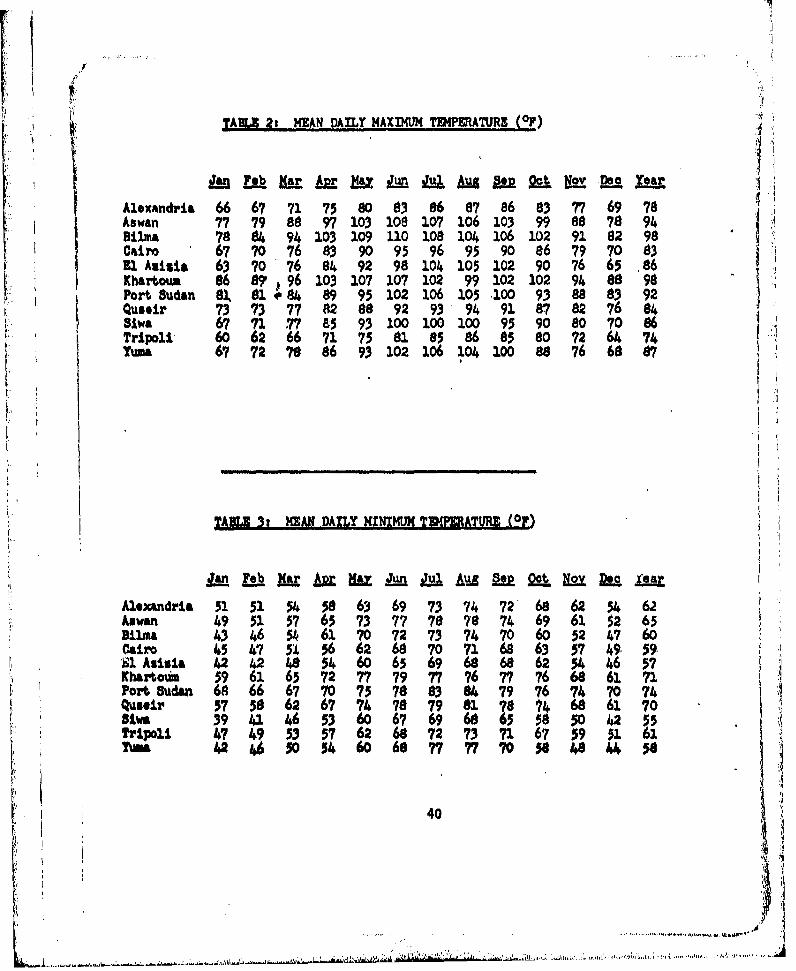
TAM. 2r MEAN DAILY IMAXIMhN TDEPER1ATURE (OF)
ih Ls ar Apr a!~ 61 ~ ~ NvDcY
Alexandria 66 71 75 80 386 87 86 8, 77 69 78
Aswan 77 79 88 97 103 108 107 106 103 99 S 76 94Bilma 7 4 94103109 110108104106 10286 82 98"Cairo 67 70 76 83 90 95 96 95 90 86 79 70 93E1Avisia 63 70 76 84 92 98 104 105 102 90 76 65 ,6Khartoua 86 96 103 107 107 102 99102102 94 88 98
k Port Sudan A~ 91 0 84 69 95 102 106 105 .100 93 88 63 92JQuseir 73 73 77 82 88 92 9394 91 87 8276 84Biwa 67 7177 5 93 100100 100 95 90 80 706Tripoli 60 626671 7515 86 5 80 72 6474TUma 6772 78 66 93 102106 104 100 8 76 68 7
TA= 31 MEAN DAILY XNINMW TMM-6AT12 (OF)
Alexxndria 51 51 54 58 63 69 73 74 72 60 62 54 62Aswan 4951 576573 7 8 776746961 $ 63Dilma 43 46 54617072 73 74 70 60524760Cairo 454 51 566260707168 63 574959.'S1Avivia 42 42 485460 6569 68 6662 5446 57Khartoim 59 61 65 72 77 7977767776666171Port Sudan 6 66 67 775 7 479 76 74 70 74Quesir 57862 67 74 6918l686757 8 7 81ZO 4 6 70Biwe 39 4146 5360 67 69 605 5 50 4~255Tripoli 47 49535762 6672 73 716759 5161
Tufta 4246 50 5460 6877 7770 ýd 48 445
40
ii41"" I , ,I
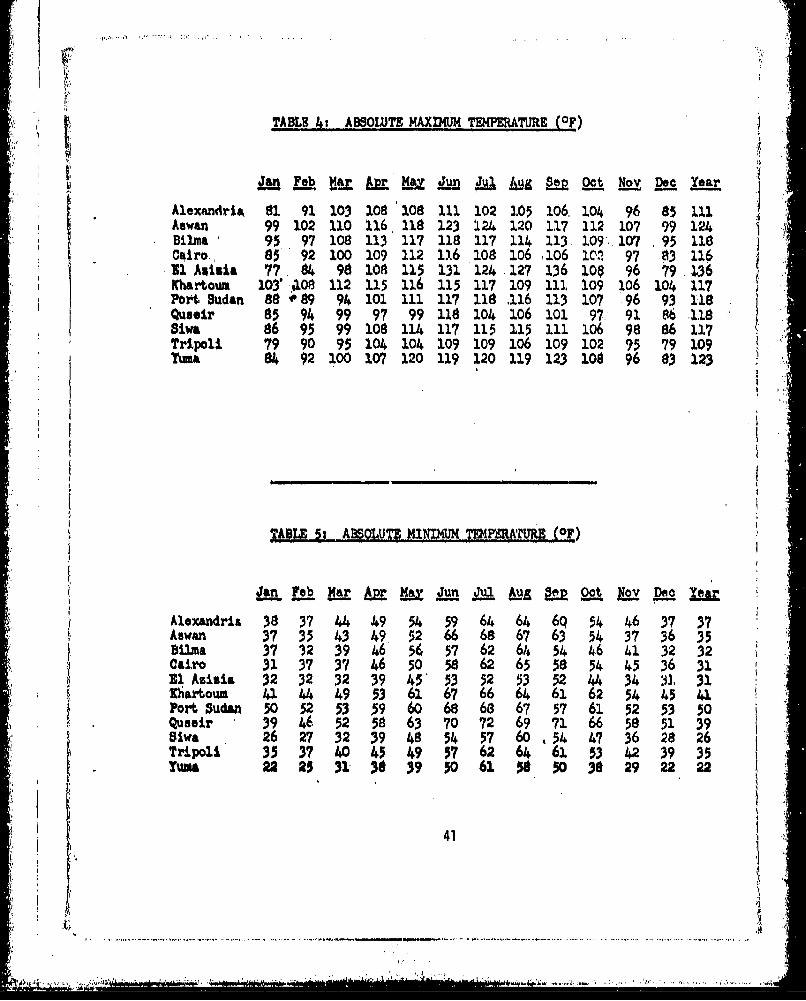
TABLE 4•, ABSOLUJTE MAXIMUM T UEITURE (0 F)
La Lo fr Ur HU Jun JA u g ___ Oct Nov Doec Year
Alexandri4 81 91 103 108 108 111 102 105 106. 104 96 85 111Aswan 99 102 110 116 118 123 124 120 117 112 107 99 124Bilma ' 95 97 108 113 117 118 117 114 113 109'. 107 95 118CAIro 85 92 100 109 112 1U.6 108 106 .106 10" 97 83 116Tr Aiplsi 77 89 98 108 115 131 124 127 136 102 96 79 160Khartoum 103' 408 112 115 116 115 117 109 111 109 io6 104 117Port Sudan 8a 0'89 94 101 111 117 118 116 113 107 '96 93 110
""W•eir 85 94 99 97 99 118 104 106 101 97 91 86 1B"".Siwa 86 95 99 108 114 117 115 115 Ill 106 98 86 1.7 ..Tripoli 79 90 95 104 104 109 109 106 109 102 95 79 109 ''-Tuma 84 92 100 107 120 119 120 119 123 108 96 83 123
TABLE 5: AIBOLUTE MINIMUM T14PEATUR! (OF)
Ja a Mar Ap && Ju gOp2c Deg -ea
Alexandr•a 38 37 44 49 54 59 64 64 6Q 54 46 37 37Awawn 3 35 4 49 52 66 68 67 63 54 37 36 35Bilma 37 32 39 46 56 57 62 64 54 46 41 32 32Cairo 31 37 37 46 50 58 62 65 58 54 45 36 3131lAsivia 32 32 32 39 45' 53 52 53 52 44 34 '.0 31K-iarboum 41 4449 336167 6664 6162 5445 41PortSuda 50 52 53 59 60 68 68 67 57 61 52• 53 50Qu•seir 39 46 52 58 63 70 72 69 71 66 58 51 39Siwa 26 27 32 39 48 54 57 60 ,54 47 36 28 26Tripoli 35 3740 454957 6264 61 53 4239 35Yuma 22 21 313 38 39 50 61 5 50 30 292222
414
.~
'.1i
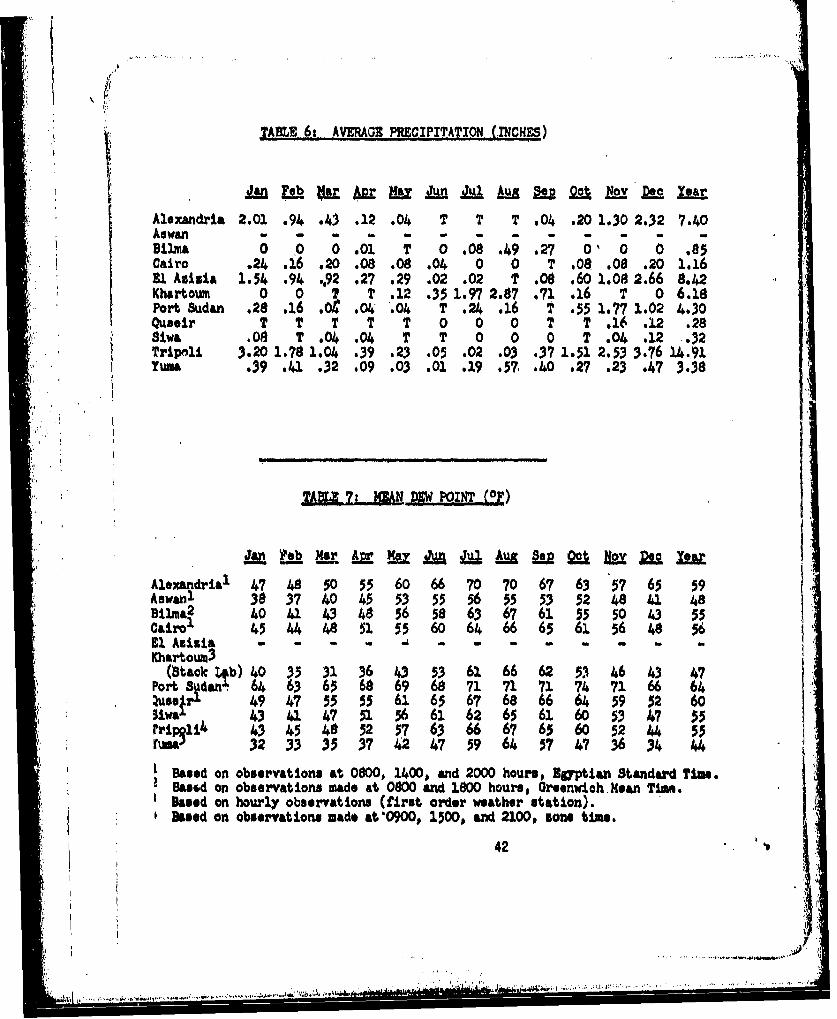
TABLE 6: AVEROE PRECIPITATION (INCHES)
Alexandria 2.01 .94 .43 .12 .04 T T T .04 .20 1.30 2.32 7.40Aswan - - - - - - - - - - - -Bilma 0 0 0 .01 T 0 .08 .49 .27 0' 0 0 .85Cairo .24 -16 .2o .08 .08 ,0a 0 0 T .08 .08 .20 1.16El Aisia& 1.54 .94 ,.92 .27 .29 .02 .02 T .08 .60 1.08 2.66 8.42Khartoum 0 0 2 T .12 .35 1.97 2.87 .71 .16 T 0 6.18Port Sudan .28 .16 Or .04 '.04 T .24 .16 T .55 1.77 1.02 4.30Queeir T T T T T 0 0 0 T T 16 .12 .28Siwa .0 T .04 .04 T T 0 0 0 T .04 .12 .32Tripoli 3.20 1.78 1.04 .39 .23 .05 .02 .03 .37 1.51 2.53 3.76 14.91YuM .39 .43. .32 .09 .03 .01 .19 .57. .40 .27 .23 .47 3.38
Z&U T 7:N. ML H POINT (OP)
Alsxaldria1 47 49 50 55 60 66 70 70 67 63 57 65 59Asw 3 7 40 45 53 55 56 55 53 52 48 41 48Bilja 2 40 41 43 48 56 58 63 67 61 55 50 43 55Cairo1 45 4 4 0 51 55 60 64• 66 65 6. 56 48 56El Auisia - - -- - - --
Khartoum3(Staok 74b) 40 35 31 36 43 53 61 66 62 53 46 43 47
Port Sdanr' 64 63 65 68 69 68 71 71 7174 7166 64Zug@. 49 4755 5 61 65 67 68 6664 59 52 60
wa.L 43 43 47 1 6 61 62 65 61605 47 54ri3•43 45 48 52 57 63 66 67 65 60 52 44 55
ruma 32 33 35 37 42 47 59 64 57 47 36 34 44
L Based on observations at 08001 1400, and 2000 hours, Egptian Standard Tim.! Based on observations made at 0800 and 1800 hours, Oreenwioh.Mean Time.
Based on hourly observations (first order weather station).hBaed on observations made at "0900 15009 and 2100, sons time.
42
i ' I
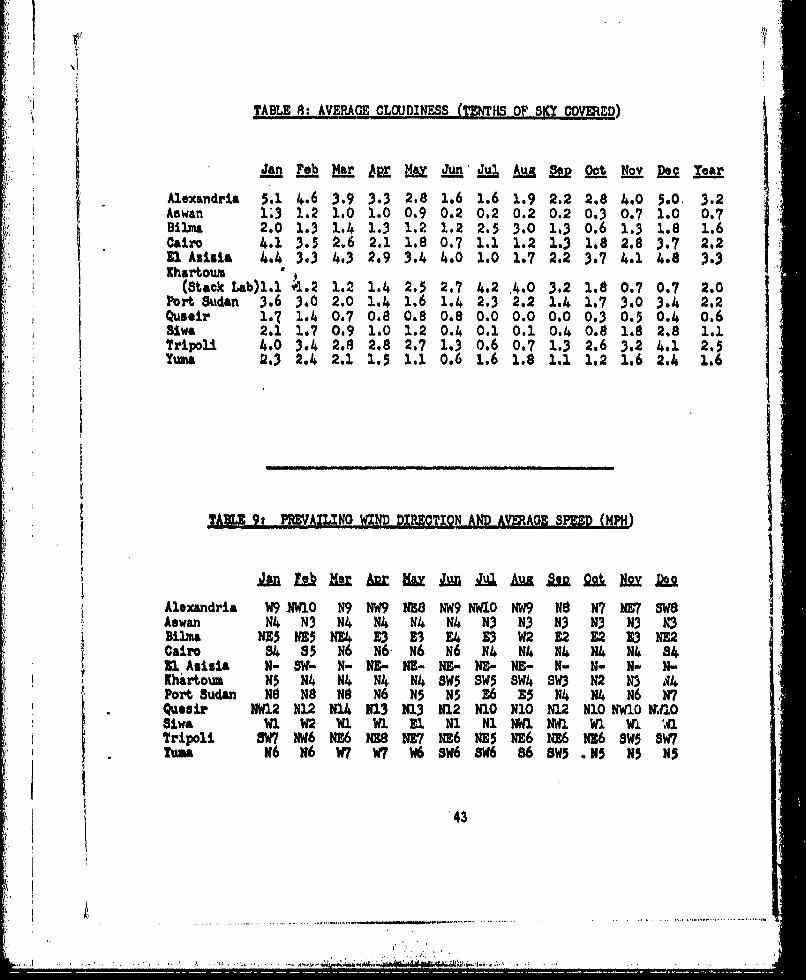
TABLE A: AVERAGE CLOUDINESS (TENTHS OF SKY 2CL.V.ED)
JAD Me Mr MM LMJu Jul Sep~2 c Nov Re- yearAlexandria 5.1 4.6 3.9 3.3 2.8 1.6 1.6 1.9 2.2 2.8 4.0 5.0. 3.2
Aswan 1.3 1.2 1.0 1.0 0.9 0.2 0.2 0.2 0.2 0.3 0.7 1.0 0.7Bilma 2.0 1.3 1.4 1.3 1.2 1.2 2.5 3.0 1.3 0.6 1.3 1.8 1.6Cairo 4.1 3.5 2.6 2.1 1.8 0.7 1.1 1.2 1.3 1.8 2.8 3.7 2.2El Azlsia 4.4 3.3 4.3 2.9 3.4 4.0 1.0 1.7 2.2 3.7 4.1 4.8 3.3Khartoum '
(Stack Lab)l.1 4 .2 1.2 1.4 2.5 2,7 4.2 4.0 3.2 1.8 0.7 0.7 2.0Port Sudan 3.6 3.0 2.0 1.4 1.6 1.4 2.3 2.2 1.4 1.7 3.0 3.4 2.2Quseir 1.7 1.4 0.7 0.8 0.8 0.8 0.0 0.0 0.0 0.3 0.5 0.4 0.6Biwa 2.1 1,? 0.9 1.0 1.2 0.4 0.1 0.1 0.4 0.8 1.8 2.8 1.1Tripoli 4.0 3.4 2.8 2.8 2.7 1.3 0.6 0.? 1.3 2.6 3.2 4.1 2.5Yuma 2.3 2.4 2.1 1.5 1.1 0,6 1.6 1.8 1.1 1.2 1.6 2.4 1.6
TAMI 9t PMEAILING WIND DIRECTION AND &AG~AE SPMD (M-PH)
Alexandria W9 fW10 N9 NW9N38NW9 NWIO NW9 N8 N7 E7 SW8SAswan N4 N3 N4 N4 N4 A N3 N3 N3 N3 N3Dibua N35 NE5 NU !33 E3 E4 E3 W2 E2 E2 Z3 NE2Cairo S4 4 5 N6 N6N6N6NA N4 N4N4N4 84E lAsiuia N- SW- N- NE- NE- NE- NE- NE- N- N- N- N-Khartoum N5 H4 H4 N4 N4 SW5 SW5 8W4 SW3 N2 N3 A4Port Sudan N181O8N161N5 N5 E6 E5 N4 N4 N6 7Quesir' NW12 N12 N14 313 N13 N12NIO N10 N12 o10 NWO ,*10Biwa Wi W2 W1 W1 El N1 Ni *a IW1 VI .1Tripoli W7 NW6NE6NENE7 N6 N5 E6E6 NE6SW5 SW7TumA M6 m6 w7 WI 6 SW6 81w6 86 MWM .N5 N5 N5
,• '43
,,, . . . . .•., . . . .

.1+
* I
A-3
Northwest Africa
1 44
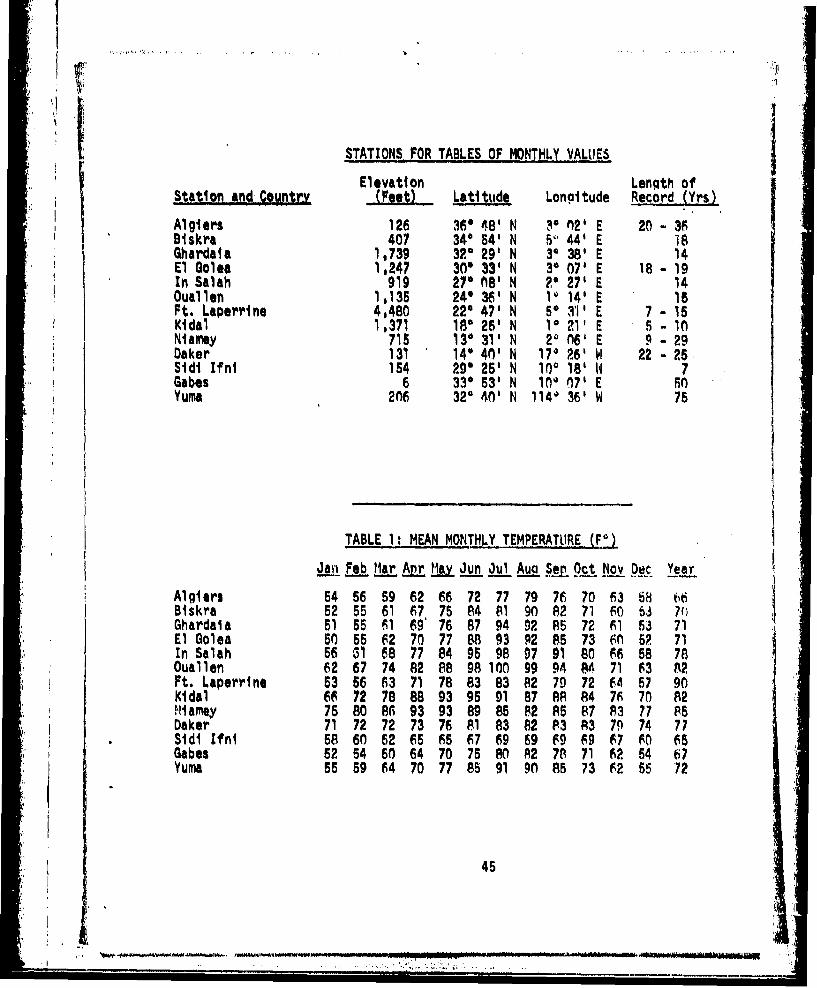
"STATIONS FOR TABLES OF MONTHLY VALUES
Sa. ' Elevation Length of"tu(eetL Latit ude Lon1itude Record (Yrs)
Algiers 126 360 481 N 10 02' E 20 - 36Biskra 407 340 64 N 5" 44' E 18Ghardaia 1,739 320 29' N 3° 38' E 14El Golea 1,247 30" 33' N 30 07' E 18 - 19In Salah 919 27' 08' N 20 27' E 14Ouallen 1,135 240 361 N 1, 14' E 15Ft. Laperrine 4,480 220 47' N 5' 31' E 7 - 15Kidal 1,371 180 26' N 10 21' E 5 - 1iNiamey 715 130 31' N 21 06' E 9 - 29Daker 131 14 40' N 170 26' W 22 - 26Sidi Ifni 154 290 25' N 100 18' W4 7Gabes 6 330 53' N 100 07' E snYuma 26 320 40' N 1140 36' W 75
TABLE 1: MEAN MONTHLY TEMPERATURE .F.)
Jani Feb la Apr !MX Jun Jul Augc.. Oct Nov Dec Year
Algiers 54 56 59 62 66 72 77 79 76 70 63 58 •6Biskra 52 55 61 67 75 84 81 90 82 71 FO 63 P)Ghardaia 51 55 61 69" 76 87 94 92 85 72 61 53 71El Golea 50 55 62 70 77 88 93 92 85 73 6n 5P 71In Salah 56 51 68 77 84 95 98 97 91 80 F6 58 78Ouallen 62 67 74 82 88 98 100 99 94 84 71 63 82Ft. Laperrine 53 56 63 71 78 83 3 82 70 72 64 57 90KMdal 66 72 78 88 93 95 91 87 88 84 76 70 821lam1ey 75 80 86 93 93 89 85 82 A5 87 P3 77 P6Daker 71 72 72 73 76 81 83 82 A3 A3 79 74 77Sidi Ifni 58 60 62 65 65 67 69 69 F9 69 67 60 65Gabes 52 54 60 64 70 75 80 82 78 71 62 54 67Yuma 55 59 64 70 77 85 91 90 85 736 2 55 72
45
I-~ ~ ~~~~~ ~~~ .... .-... . . ....... NONA..•,..! .. . .. .
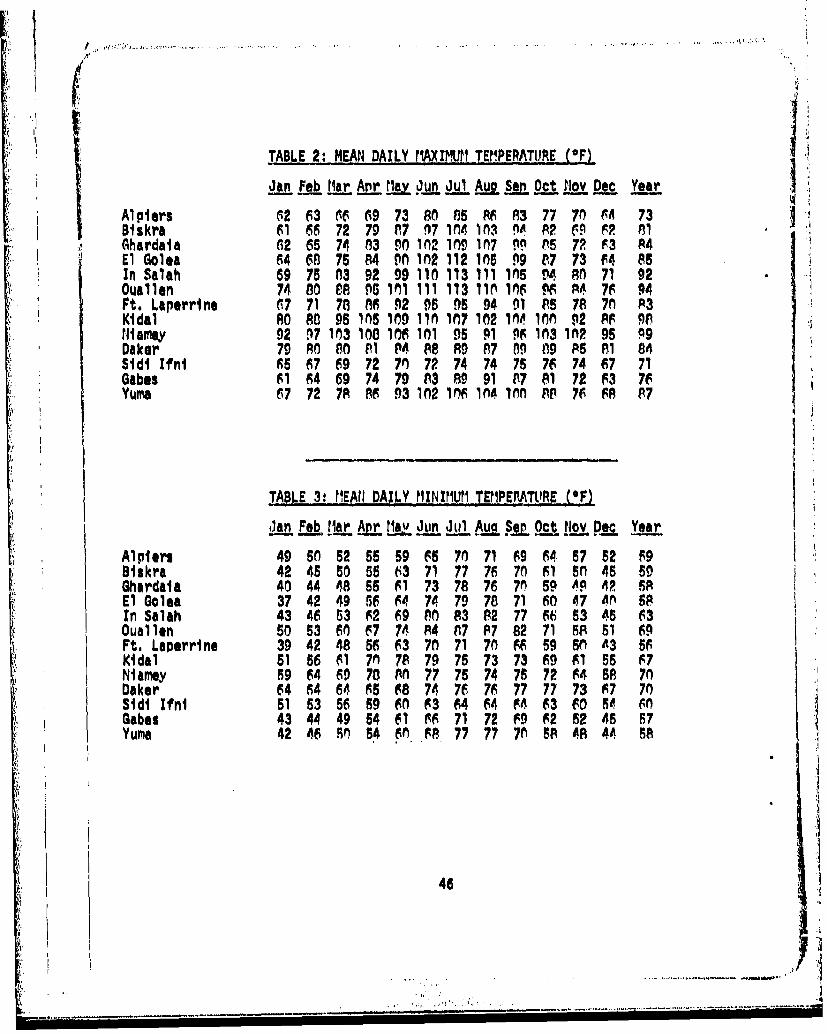
.I. ~TABLE 2: MEAN DAILY MAzXIMu91 TEM•4PERATURE. (*F)4 Jan f Fe.b tia.r Anr U •u.Jn Jul0 -A ua D Oct fl2oV Dec YearI>
Alg2ers 62 63 66• 69 73 80 1 5 A6 83 77 7n 06 73 FSBiskra 61 66 72 79 A•7 97 I•0 03 9 2 A? 69 62 AlGhardala 62 65 74 n3 9PIn2 I09 I07 PP P5 72 F3 A4El Gale& 64 08 75 84 1n0ln2 112 In5 99 P7 73 F4 86In Salah 69 75 03 92 99 110 113 111 115 94 P8 71 92Ouallen 74 80 N, 95 II111 113 11•l016 PS P4 76 94Ft. Laperrine 67 71 78 A36 92 95 95 94 91 85 78 70 A3Kidal Ro 88 96 1 8109 111n I7 102 1Inn 100 92 A F PH, amey 92 97 13 100 106 10 95 91 P9 13 I1f2 95 99Daker 79 P0 80 P1 P4 88 89 87 89 89 P5 81 84Sidli fnl 5 657 69 72 70 72 74 74 75 76 74 67 71Gabes 61 64 69 74 79 A3 89 91 P7 81 72 63 76Yuma 67 72 78 86 93 IN1021 0 w 1 n A8 76 68 P7
,TABLE 3.,HA D IY MINIUM TEPRTR
J Feb. Ma Ap Hav Jun Jul oI s. j Oct No.v Dec Year
Alpgier 49 S 52 55 59 66 70 71 69 64 57 52 F9Biskra 42 45 50 55 63 71 77 76 70 61 5 45 59Ghardaia 40 444•8 55 61 73 78 76 76 59 49 42 A8El Golea 37 42 49 56 64 74 79 78 71 604 7 An 58In Salah 43 46 53 F2 69 (n 83 P2 77 6 53 45 63Ouallen 50 53 60 f7 7 84 A 7 87 82 71 SA 51 69Ft. Laperrtne 39 42 48 56 63 70 71 70 66 59 6n A3 56Kidal 51 56 61 70 78 79 75 73 73 69 F1 55 67NIamey 59 64 69 78 AM 77 75 74 76 72 64 58 7nDaker 64 64 64 68 68 74 76 76 77 77 73 67 70Sidit fni 51 53 5656 0 16 F3 64 64 F4•63 60 54 0Gabes 43 44 49 54 61 SS 71 72 F9 F2 52 45 57Yuma 42 46 V 54 60 8 77 77 70 S8 4 44 8
46
•.? , i
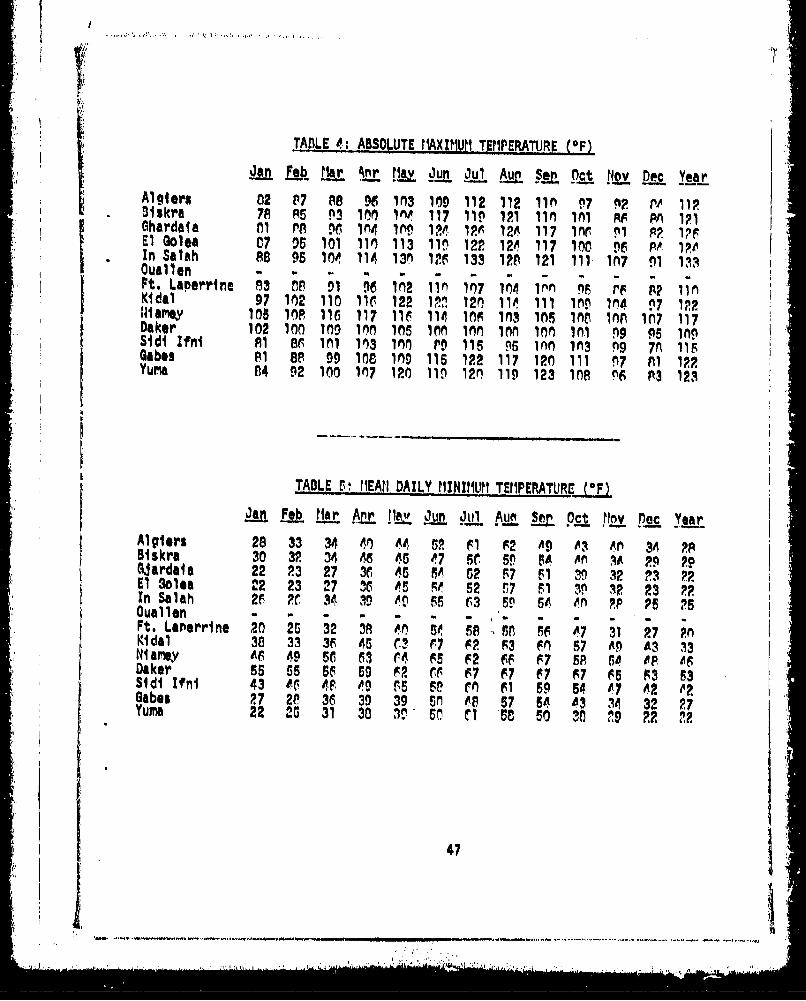
TALE 4-:, ABSOLUTE r.AXIMMU TEMPERATURE (OF)
Ja L Mar tm m Ju-n Jul Am ý-P Oc t ~o-v Dec YearAlgiers 02 P7 88 96 103 10n 112 112 Ji V7 p2 pe 112Biskra 78 AS P3 1 M I 117 11 121 110 1nl RF 1A 1 ,Ghardaia rI PIN 96 W• IAý IOA IPA 126 117 Inr p P P •E pf,El Golea 07 95 101 11 113 11 " 12 12 117 100 M 6 0$ 1pe
In Salah 88 95 104 114 13n 12F 133 12S 121 111. 107 91 111Ouallen . . . . . . . .-Ft. Laperrine 83 ns 91 ;6 102 110 107 10n4 10n0 P6 rf 11SKidal 97 102 110 116 122 12 12n 11 111 100 104 97 122Iliaty 105 10 116 117 116 114 106 103 105 102 100 107 117Baker 102 ion0 n 1 IM 1 ins 1 nn 1 n Inn Io n I0• 1 91 9 a.6 Ing 'Sidi Ifni1 86 11 103 1n P9 115 95 Inn 1n3 09 7A 116Gabes A1 8 99 108 1109 115 122 117 120 111 07 A1 122
Yumia 04 92 100 10 120 119 120 11p 123 10s p~6 s3 123
TABLE 5? 1iEAII DAILY MININM•1 TE?1PERATLRE (OF)
Lo Li r AJ a u ul A~f un r M Oct LOVNov DecYerAlgiers 28 33 34 40 m45 6 F1 6 2 A9 ) 3 A 0 34 ?pBiskra 30 3" 34 As 456 7 5 SP 64 An M Po 29Giardats 22 23 27 30 46 5$ 62 F7 61 Iq 32 p3 pp,El olea 22 23 27 3W 45 Re 52 r7 F1 3P V2 23 P?In Salah 262r634,3D 4. Ss 63 50 54 onl RP 2525Ouallen -. . . . . . . . . . . . .Ft. Laperrlne 20 26 32 38 40 5e SP • 5- M 4.7 31 27 PnKidal 38 33 36 45 C. 67 62 F3 F0 57 A9 A3 33Niamey AS 49 56 63 64 65 F2 fF F7 58 54 OP osDaker 55 65 56 59 62 ff F7 F7 F7 67 F5 F3 F3Sidi Ifni 43 M, 4F 09 55 Pp C0 61 59 54 $7 A2 P 2Gabes 27 28 36 39 39 50 AS 57 54 43 14 32 27Yuma 22 20 31 30 1V 50 I 58 50 30 C 9 22 22
* . 4... *- -,--,*- ... ,'.- ,-- - '.. - --'..-- .
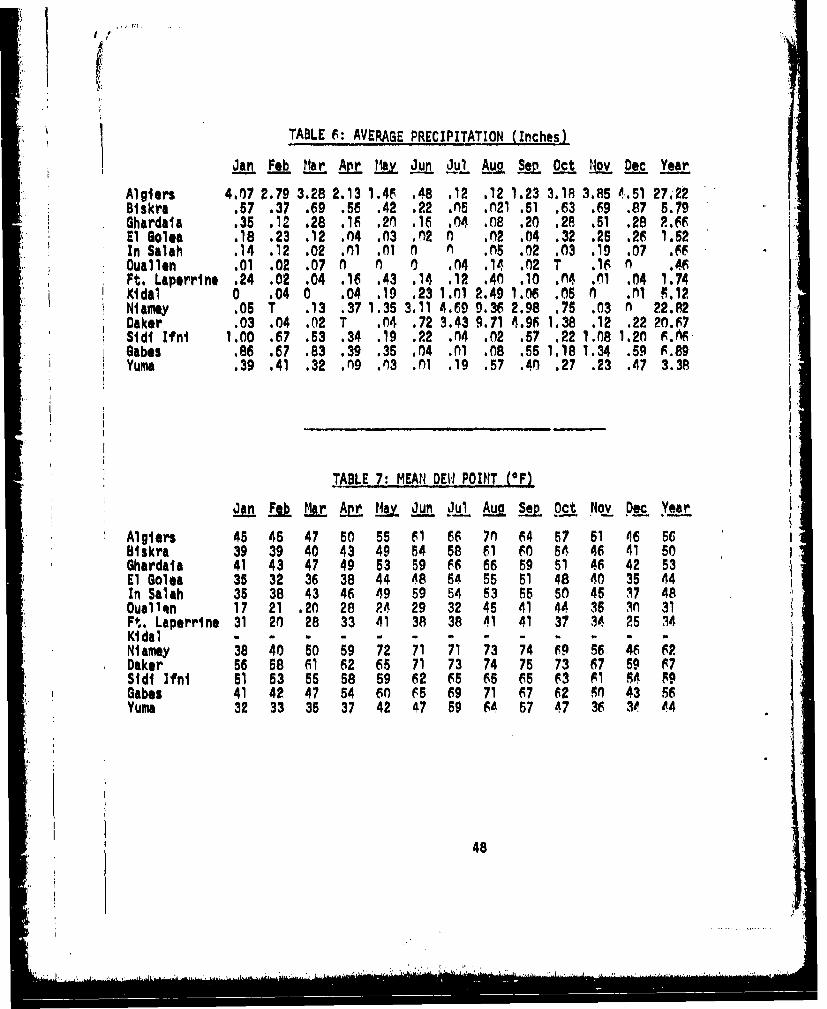
TABLE F: AVERAGE PRECIPITATION (Inches)
Jan Feb M Arp 1M Jun Jul Au S Ocpt Nov Dec Year
Algiers 4.07 2.79 3.28 2.13 1.40 .48 .12 .12 1.23 3.18 3.85 0-.51 27422Biskra .57 .37 .69 .56 .42 .22 .n5 .n21 .51 .63 .69 .87 5.79Ghardaia .35 .12 .28 .16 X20 .16 ,M4 .08 .20 .28 .51 .28 2.66El Golem .18 .23 .12 .04 .03 .n2 n .A2 .04 .32 .25 .26 1.52In Salah .14 .12 .02 .n1 01 0 n .05 .02 .03 .19 .07 .FFOuallen .01 .02 .07 0 0 0 .04 .14 .02 T .16 n .4sFt. Laperrtne .24 .02 .04 .16 .43 .14 .12 .40 .10 ,M4 .01 .04 1.74Kidal 0 .04 0 .04 .19 .23 1,01 2.49 1.06 .05 0 .Ml F,12Niamey .05 T .13 .37 1.35 3.11 4.69 9.36 2.98 .75 .03 M 22.82Daker .03 .04 .02 T .04 .72 3.43 9.71 4.96 1.38 .12 .22 20.67Sidi Ifni 1.00 .67 .53 .34 .19 .22 .04 .02 .57 .22 1.08 1.20 6.f6Gabes .86 .67 .83 .39 .36 .04 .n1 .08 .55 1.18 1.34 .59 9.89Yuma .39 .41 .32 .n9 .n3 .A1 .19 .57 .40 .27 .23 .47 3.38
TABLE 7: MEAN DEW POINT (*F)
Jan Feb Mar Mr M Juan Jul Au Sep Oct Nov Dec Year
Algiers 45 46 47 50 55 61 66 7n 64 57 51 46 56Biskra 3939 40 43 49 54 58 61 FO 54 46 41 50Ghardaia 41 43 47 49 53 59 66 66 59 51 46 42 53ElGolea 35 32 36 38 44 48 54 55 51 48 40 356 4In Salah 35 38 43 46 49 59 54 53 65 50 45 17 48Ouallqn 17 21 .20 28 24 29 32 45 41 44 36 in 31Ft. Laperrtne 31 20 28 33 41 38 38 41 41 37 34 25 34Kidal . . . . . ..- - - .Niamey 38 40 50 59 72 71 71 73 74 69 56 46 62Daker 56 58 61 62 65 71 73 74 75 73 67 59 67Sidi Ifni 51 53 55 58 59 62 65 65 65 63 1 54 9Gabes 41 42 47 54 60 F5 69 71 67 62 R0 43 56Yuma 32 33 35 37 42 47 59 64 67 47 36 30 44
48
I -. . . .
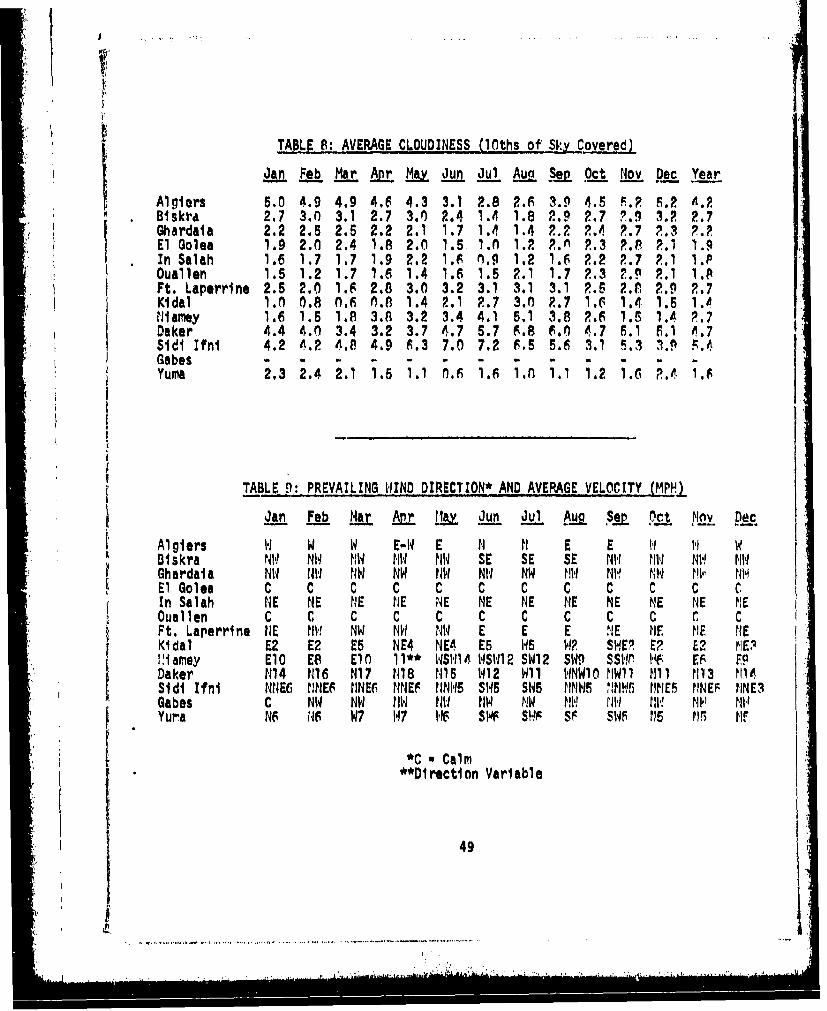
TABLE 8: AVERAGE CLOUDINESS 101ths of Sky Covered)
Jan Feb Mar &r May J Jul g Sau Oct Nov Dec Year
Algiers 5.0 4.9 4.9 4.6 4.3 3.1 2.8 2..6 3.9 4.5 F.? 5.2 A.2Biskra 2.7 3.0 3.1 2.7 3.0 2.4 1.4 1.8 2.9 2.7 7.9 3.2 2.7G Shardaia 2.2 2.5 2.5 2.2 2.1 1.7 1.4 1.4 2.2 ,.4 P.7 2.3 2.2El Golea 1.9 2.0 2.4 1.8 2.0 1.5 1.0 1.2 P.m 2.3 P.8 2.1 1.9In Salah 1.6 1.7 1.7 1.9 2.2 1.6 n.9 1.2 1.6 2.2 2.7 P.1 1.POuallen 1.5 1.2 1.7 1.6 1.4 1.6 1.5 2.1 1.7 2.3 2.9 2.1 1.8Ft. Laperrine 2.5 2.0 1.6 2.8 3.0 3.2 3.1 3.1 3.1 2.5 2.n 2.9 2.7Kidal 1.0 0.a 0.5 0.8 1.4 2.1 2.7 3.0 2.7 1.6 1.4 1.5 1.0Niamey 1.6 1.5 1.8 3.8 3.2 3.4 4.1 5.1 3.8 2.6 1.5 1.4 P.7Daker 4.4 4.0 3.4 3.2 3.7 4.7 5.7 6.8 6.0 4.7 5.1 F,1 4.7Sidi Ifni 4.2 4.2 4.8 4.9 6.3 7.0 7.2 F.5 5.6 3.1 5.3 n.. F.4Gabes ....- -. . . . . .Yuma 2.3 2.4 2.1 1.5 1.1 0,n( 1.6 1.A 1.1 1.2 1.6 P.4 1.6
TABLE 9: PREVAILING WIND DIRECTION* AND AVERAGE VELOCITY .MPHj
Jan feb Mar Arr fLa Jun Jul 1 Aju SMf Oct Mov De
t Algiers W W W E-W E N IM E E 11 H WDi skra NN N,. NW NW MI1 SE SE SE NW MW NW fMWGh ardai a N1W NW1,1 N14 NW NiW NW, NW HW NI-! NW NV NrWfEl Golea C C C C C C C C C C C CIn Salah NE NE NE NE NE NE NE NE NE NE NE NEOuallen C C C C C C C C C C C CFt. Laperrine NE NW NW NW NW E E E NE NE ME NEKidal E2 E2 E5 NE4 NE4 ES AS W? SWEI E? E2 N0E3IPtamey ElO E8 El0 l11* WS1,14I WSW,112 SW12 SW9 SSP ("6 ES F9Daker H114 1116 N17 H1l8 1115 W12 Wll WNWIO W1 1 Nil 1M13 NIA4Sidi Ifnni NNE6 NNES HlNE6 NNEF tINI-t5 SIW5 S145 NN1,15 NIM-15 ttlE5 NINEF INE3Gabes C NW NW 11W N11 NW NW M, 1i NI, ! MV V N11tYuma NS NI6 W7 1,17 WE S1* SHF• SP SWS M15 Mt
*C • Calm**Dirtection Variable
49
............ ,,....... , .
I .
II
A-4
South Central Asia
50
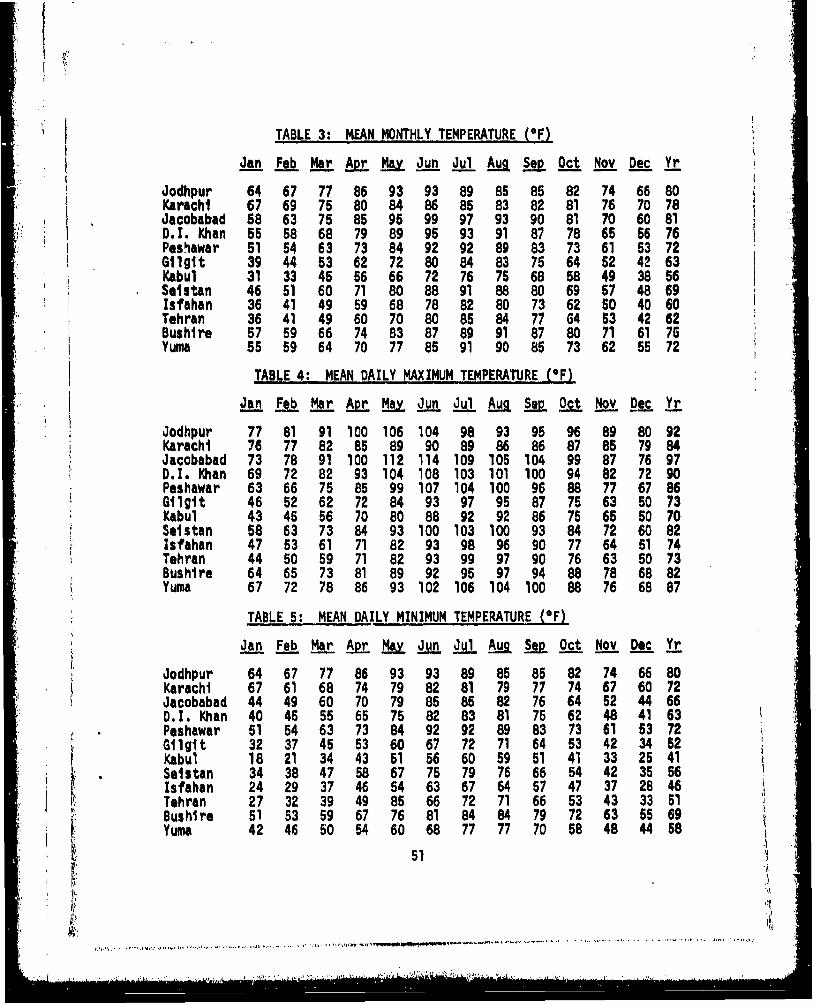
TABLE 3: MEAN MONTHLY TEMPERATURE (.F)
Jan Feb Mar &r Ma Jun Jul AU Sep Oct Nov Dec Yr
Jodhpur 64 67 77 86 93 93 89 85 85 82 74 66 80Karachi 67 69 75 80 84 86 85 83 82 81 76 70 78Jacobabad 58 63 75 85 95 99 97 93 90 81 70 60 81D.I. Khan 55 58 68 79 89 95 93 91 87 78 65 56 76Pes.hawar 51 54 63 73 84 92 92 89 83 73 61 53 72
Gilgit 39 44 53 62 72 80 84 83 75 64 52 42 63Kabul 31 33 45 56 66 72 76 75 68 58 49 38 56Setstan 46 51 60 71 80 88 91 88 80 69 57 48 69Isfahan 36 41 49 59 68 78 82 80 73 62 50 40 60Tehran 36 41 49 60 70 80 85 84 77 64 53 42 62Bushtre 57 59 66 74 83 87 89 91 87 80 71 61 75Yuma 55 59 64 70 77 85 91 90 85 73 62 55 72
TABLE 4: MEAN DAILY MAXIMUM TEMPERATURE (OF)
Jan Feb Mar Apr Ma Jun Jul Aua Sev Oct Nov Dec Yr
Jodhpur 77 81 91 100 106 104 98 93 95 96 89 80 92Karachi 76 77 82 85 89 90 89 86 86 87 85 7984Jacobabad 73 78 91 100 112 114 109 105 104 99 87 76 97D.I. Khan 69 72 82 93 104 108 103 101 100 94 82 72 90Peshawar 63 66 75 85 99 107 104 100 96 88 77 67 86Gilgit 46 52 62 72 84 93 97 95 87 75 63 50 73Kabul 43 45 56 70 80 88 92 92 86 75 65 50 70Selstan 58 63 73 84 93 100 103 100 93 84 72 60 82Isfahan 47 53 61 71 82 93 98 96 90 77 64 51 74Tehran 44 50 59 71 82 93 99 97 90 76 63 50 73Bushtre 64 65 73 81 89 92 95 97 94 88 78 68 82Yuma 67 72 78 86 93 102 106 104 100 88 76 68 87
TABLE 5: MEAN DAILY MINIMUM TEMPERATURE (*F)
Jan Feb Mar Apr M Jul Oct Nov Dec Yr
Jodhpur 64 67 77 86 93 93 89 85 85 82 74 66 80Karachi 67 61 68 74 79 82 81 79 77 74 67 60 72Jacobabad 44 49 60 70 79 85 85 82 76 64 52 44 66D.I. Khan 40 45 55 65 75 82 83 81 75 62 48 41 63
SPeshawar 51 54 63 73 84 92 92 89 83 73 61 53 72Gilgit 32 37 45 53 60 67 72 71 64 342 34 52Kabul 18 21 34 43 51 56 60 59 51 41 33 25 41Selstan 34 38 4758 67 757976 6654 42 3556Isfahan 24 29 37 46 54 63 67 64 57 47 37 28 46Tehran 27 32 39 49 85 66 72 71 66 53 43 33 51Bushire 51 53 59 67 76 81 84 84 79 72 63 5 69Yuma 42 46 50 54 60 68 7777 70 58 48 44 58
.51 '
I,,:
Ii ,.
'i.. I•b , ..-.. . . .;'
"'" ::.l L . '. ':" -. • . ' : , ::.,:'.')~i.I . . .'•;/:-"L ""• i"•li' " : '• : .. ":"•. .'.. . .. . . .'.. . . ."..'. .".. . .'."... .:......"-. ....... '".. .'. .•--: - • " • "
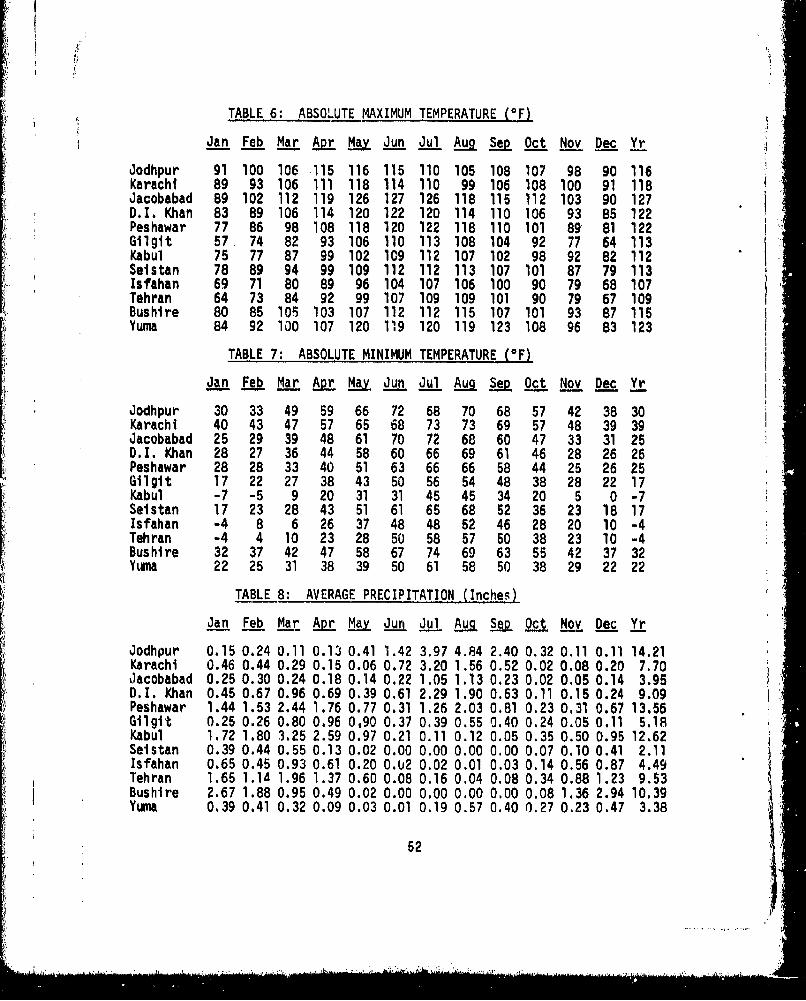
TABLE 6: ABSOLUTE MAXIMUM TEMPERATURE (OF)
Jan Feb Mar Apr May Jun Jul Aug Sep Oct Nov Dec Yr
Jodhpur 91 100 106 .115 116 115 110 105 108 107 98 90 116Karachi 89 93 106 111 118 114 110 99 106 108 100 91 118Jacobabad 89 102 112 119 126 127 126 118 115 112 103 90 127D.I. Khan 83 89 106 114 120 122 120 114 110 106 93 85 122Peshawar 77 86 98 108 118 120 122 118 110 101 89' 81 122Gilgit 57. 74 82 93 106 110 113 108 104 92 77 64 113Kabul 75 77 87 99 102 109 112 107 102 98 92 82 112Selstan 78 89 94 99 109 112 112 113 107 101 87 79 113Isfahan 69 71 80 89 96 104 107 106 100 90 79 68 107Tehran 64 73 84 92 99 107 109 109 101 90 79 67 109Bushire 80 85 105 103 107 112 112 115 107 101 93 87 115Yuma 84 92 100 107 120 119 120 119 123 108 96 83 123
TABLE 7: ABSOLUTE MINIMUM TEMPERATURE (*F)
Jan Feb Mar &r May Jun Jul Aug Sep Oct Nov Dec Yr
Jodhpur 30 33 49 59 66 72 68 70 68 57 42 38 30Karachi. 40 43 47 57 65 68 73 73 69 57 48 39 39Jacobabad 25 29 39 48 61 70 72 68 60 47 33 31 25D.I. Khan 28 27 36 44 58 60 66 69 61 46 28 26 26Peshawar 28 28 33 40 51 63 66 66 58 44 25 26 25Gilgit 17 22 27 38 43 50 56 54 48 38 28 22 17Kabul -7 -5 9 20 31 31 45 45 34 20 5 0 -7Selstan 17 23 28 43 51 61 65 68 52 36 23 18 17Isfahan -4 8 6 26 37 48 48 52 46 28 20 10 -4Tehran -4 4 10 23 28 50 58 57 50 38 23 10 -4Bushire 32 37 42 47 58 67 74 69 63 55 42 37 32Yuma 22 25 31 38 39 50 61 58 50 38 29 22 22
TABLE 8: AVERAGE PRECIPITATION (Inches)
Jan Feb Mar Apr May Jun Jul Aug Sep Oct Nov Dec Yr
Jodhpur 0.15 0.24 0.11 0.13 0.41 1.42 3.97 4.84 2.40 0.32 0.11 0.11 14.21Karachi 0.46 0.44 0.29 0.15 0.06 0.72 3.20 1.56 0.52 0.02 0.08 0.20 7.70Jacobabad 0.25 0.30 0.24 0.18 0.14 0.22 1.05 1.13 0.23 0.02 0.05 0.14 3.95D.I. Khan 0.45 0.67 0.96 0.69 0.39 0.61 2.29 1.90 0.63 0.11 0.15 0.24 9.09Peshawar 1.44 1.53 2.44 1.76 0.77 0.31 1.26 2.03 0.81 0.23 0.31 0.67 13.56Gilgit 0.25 0.26 0.80 0.96 0,90 0.37 0.39 0.55 0.40 0.24 0.05 0.11 5.18Kabul 1.72 1.80 3.25 2.59 0.97 0.21 0.11 0.12 0.05 0.35 0.50 0.95 12.62Selstan 0.39 0.44 0.55 0.13 0.02 0.00 0.00 0.00 0.00 0.07 0.10 0.41 2.11Isfahan 0.65 0.45 0.93 0.61 0.20 O.U2 0.02 0.01 0.03 0.14 0.56 0.87 4.49Tehran 1.65 1.14 1.96 1.37 0.60 0.08 0.16 0.04 0.08 0.34 0.88 1.23 9.53Bushire 2.67 1.88 0.95 0.49 0.02 0.00 0.00 0.00 0.00 0.08 1.36 2.94 10.39Yuma 0.39 0.41 0.32 0.09 0.03 0.01 0.19 0.57 0.40 0.27 0.23 0.47 3.38
52
• . ,'.
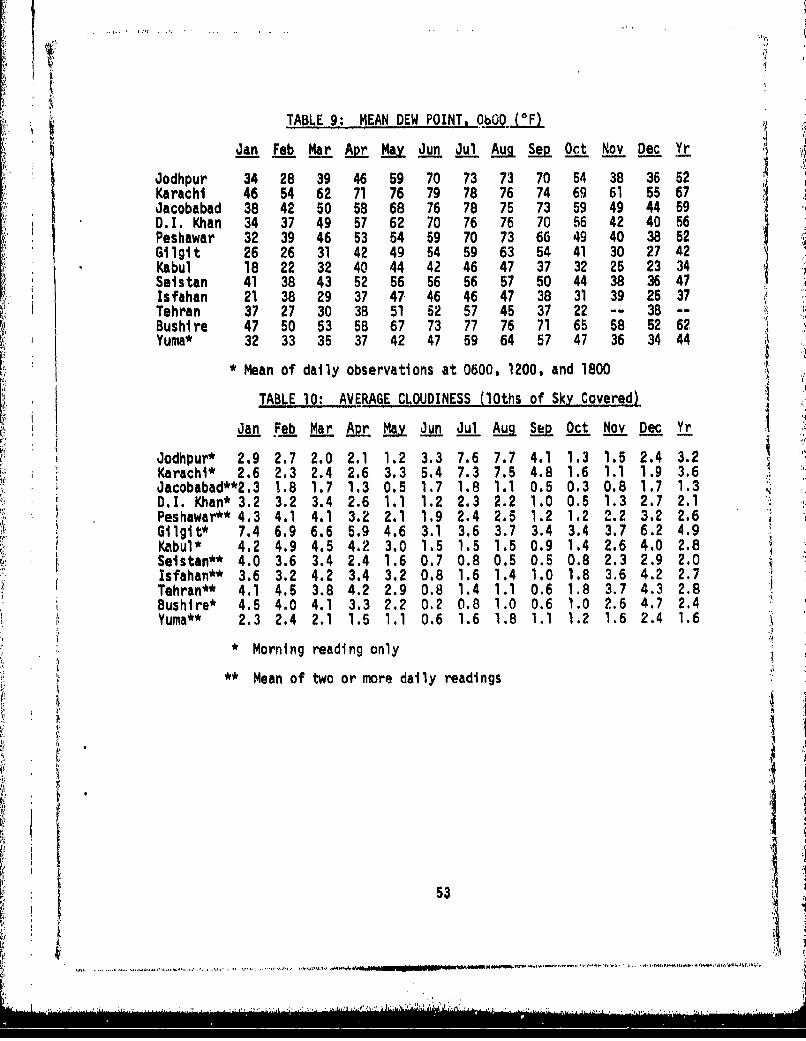
¶l
TABLE 9; MEAN DEW POINT, ObQ •F)_
Jan Feb Mar Apr Ma Jun Jul Auq Sep Oct Nov Dec Yr
Jodhpur 34 28 39 46 59 70 73 73 70 54 38 36 52Karachi 46 54 62 71 76 79 78 76 74 69 61 55 67Jacobabad 38 42 50 58 68 76 78 75 73 59 49 44 59
D.I. Khan 34 37 49 57 62 70 76 76 70 56 42 40 56Peshawar 32 39 46 53 54 59 70 73 66 49 40 38 52Gilgit 26 26 31 42 49 54 59 63 54 41 30 27 42Kabul 18 22 32 40 44 42 46 47 37 32 25 23 34Seistan 41 38 43 52 56 56 56 57 50 44 38 36 47Isfahan 21 38 29 37 47 46 46 47 38 31 39 25 37Tehran 37 27 30 3B 51 52 57 45 37 22 -- 38 --Bushlre 47 50 53 58 67 73 77 76 71 65 58 52 62Yuma* 32 33 35 37 42 47 59 64 57 47 36 34 44
* Mean of daily observations at 0600, 1200, and 1800
TABLE 10: AVERAGE CLOUDINESS (lOths of Sky Covered)Jan Feb Mar Ap Mav Jun Jul Sep Oct Nov Dec Yr
Jodhpur* 2.9 2.7 2.0 2.1 1.2 3.3 7.6 7.7 4.1 1.3 1.5 2.4 3.2Karachi* 2.6 2.3 2.4 2.6 3.3 5.4 7.3 7.5 4.8 1.6 1.1 1.9 3.6Jacobabad**2.3 1.8 1.7 1.3 0.5 1.7 1.8 1.1 0.5 0.3 0.8 1.7 1.3D.I. Khan* 3.2 3.2 3.4 2.6 1.1 1.2 2.3 2.2 1.0 0.5 1.3 2.7 2.1Peshawar** 4.3 4.1 4.1 3.2 2.1 1.9 2.4 2.5 1.2 1.2 2.2 3.2 2.6Gilgit* 7.4 6.9 6.6 5.9 4.6 3.1 3.6 3.7 3.4 3.4 3.7 6.2 4.9Kabul* 4.2 4.9 4.5 4.2 3.0 1.5 1.5 1.5 0.9 1.4 2.6 4.0 2.8Selstan** 4.0 3.6 3.4 2.4 1.6 0.7 0.8 0.5 0.5 0.8 2.3 2.9 2.0Isfahan** 3.6 3.2 4.2 3.4 3.2 0.8 1.6 1.4 1.0 1.8 3.6 4.2 2.7Tehran** 4.1 4.5 3.8 4.2 2.9 0.8 1.4 1.1 0.6 1.8 3.7 4.3 2.8Bushire* 4.5 4.0 4.1 3.3 2.2 0.2 0.8 1.0 0.6 1.0 2.6 4.7 2.4Yuma** 2.3 2.4 2.1 1.5 1.1 0.6 1.6 1.8 1.1 1.2 1.6 2.4 1.6
* Morning reading only
** Mean of two or more daily readings
I53
Ci J .~.,,.... . . '-- d f % .. m....p an"n "r ""- ~ *f.~LQIitIt
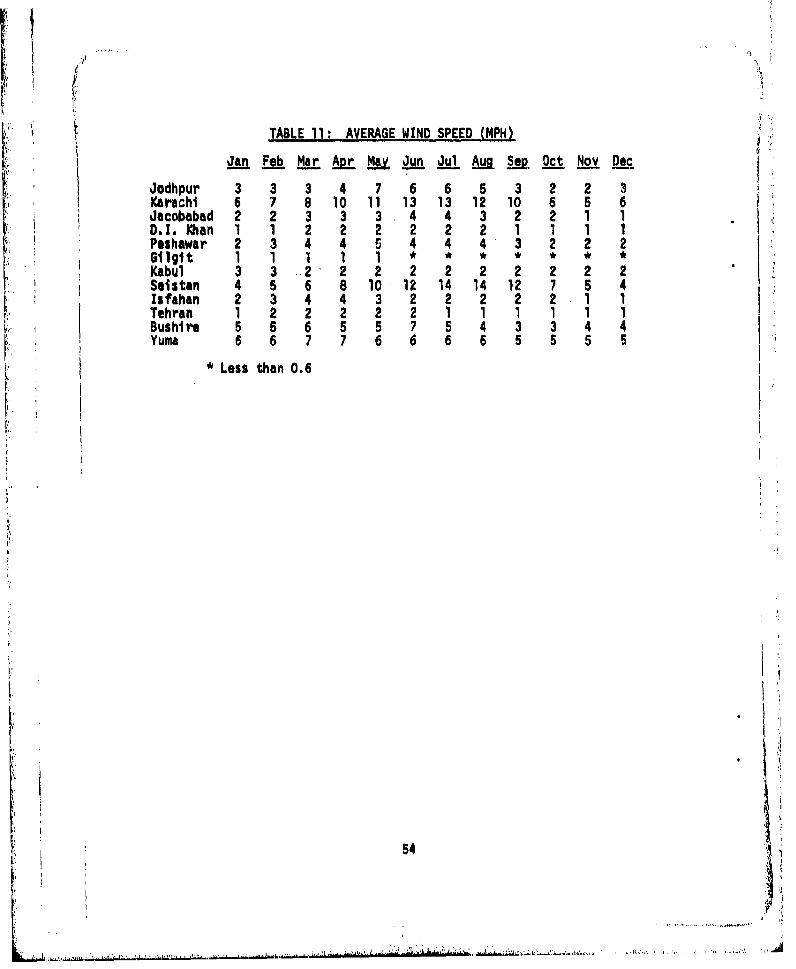
TABLE 11: AVERAGE WIND SPEED (MPH)
Jan Fab Ma.r Aptr MU Jun ,,u _An L Oct Nov Dec
Jodhpur 3 3 3 4 7 6 6 5 3 2 2 3Karachi 6 7 8 10 11 13 13 12 10 6 5 6Jacobabad 2 2 3 3 3,4 4 3 2 2 1 1D.I.Khan 1 1 2 2 2 2 2 2 1 1 1 1Peshawar. 2 3 4 4 5 4 4 4 3 2 2 2Gilgit 1 1 1 1 1
IKabul 3 3 -.2 2 2 2 2 2 2 2 2 2Saistan 4 5 6 8 10 12 14 14 12 7 6 4Isfahan 2 3 4 4 3 2 2 2 2 2 1 1
Tehran 1 2 222 2 11 111 1Yuma 6 6 7 7 6 6 6 6 5 5 5 5
* Less than 0.6
54
S• ""i ,," '• , " :. "- " ' •",I ~.4
Si ,: .•, l.;' ; -•" ,d " i.,i:: i".,• 'i "• ,It: ••1..,. ,•/;:• "I,••l •• •l' "• '" ! •-''* !'1••'V•l,":': ,.'..*.;';..!,1.,:... .. Xt,'.,• ,• '. ..-.j.s'..-'..'
A-5
Soviet Middle Asia
I~~~~ .d.q4.IWI4 .~ ~". . . ....-
I -I **
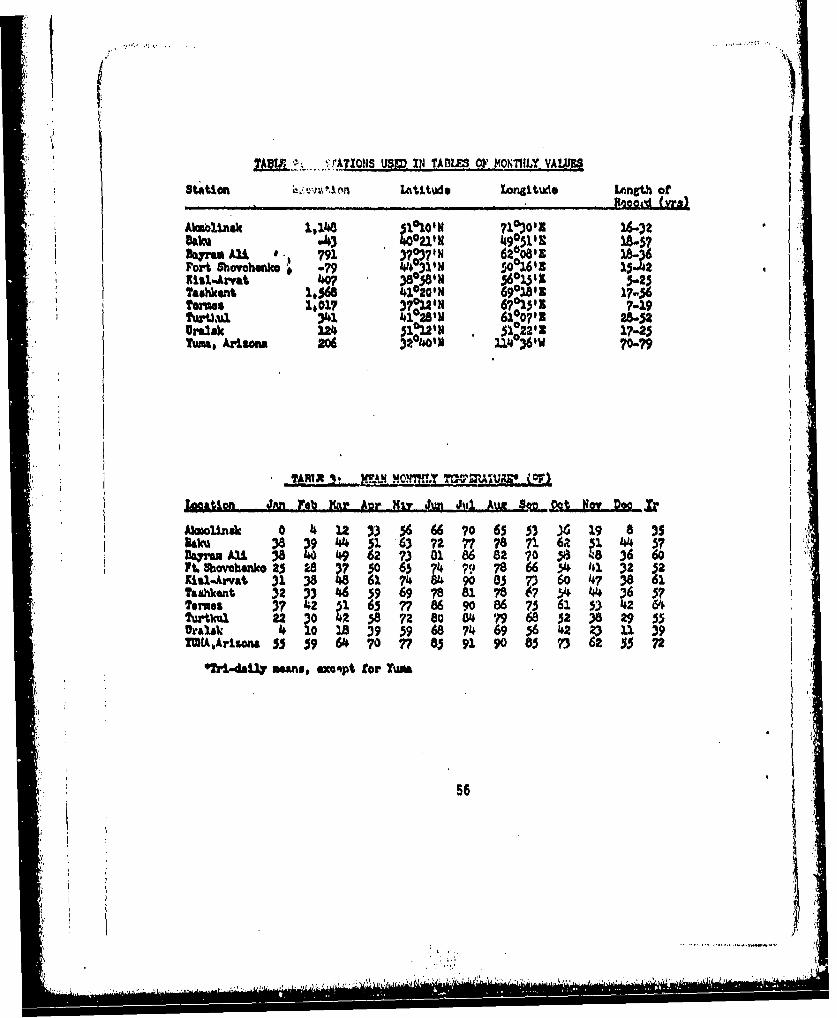
7AU~:~I A?0)SUSPM IN TABLES OF~ MO71,YV
St~ticn ~ .~41 Latitude Longit~ude L~nngU ofM'ead h'rs)
Akaboinal 1,1L18 SwN7103001163-~oau43 400211H *4905112 2-47
SaVramA24 a 791 3?0-37'N 6260819 18-36Fort Shwaovohut .79 414031' H 001642 15-42Kial..Arvat 4o07 3aO38'm 360)j 11 5.25Tashkent I,5so 410201 N 690180B 17..56Tomeos 1,017 3?12N 67013'5 7-19Tur)uxl )41 4'2281 W 6100711 2a-si
221sk 4 51*121N 51*220 17-21Yam.Aris 206P%04 25P6'W70-79
LoeAtSon .-An Yak Kar -Aow Hiv gun Jul AMC AM- t ov Dc
Aloaclnsk 0 4 U 356 66 7065 53 3198a35lau38391 44 6163 72 78 71 116 14 5?
L04962 73018682 70 a 60ItShovohimnko2328 3750 63 ?9 78 66 4 41 32532Kisl-Arvat 31 38 *48 61 ?14 8 go 05 73 60 47 3861Tagh"cant 32 Z 63~ 9 69 ?S81 ?S0 £644436 3?Tomeos 3742 41 65 ?86 go 86 7386153 42 &1
Tutl 22)042 58 7280 84 ?9685 38 29 55rals.a ~ 14 10 18 39 39 68 714 69 56 42 231n139
IMIA,Araou 53 59 6147077 8591 90 8573 6255j72
*ftS.daS.2 sans, .xoipt for Yu#*
56
... ...... .......... I.
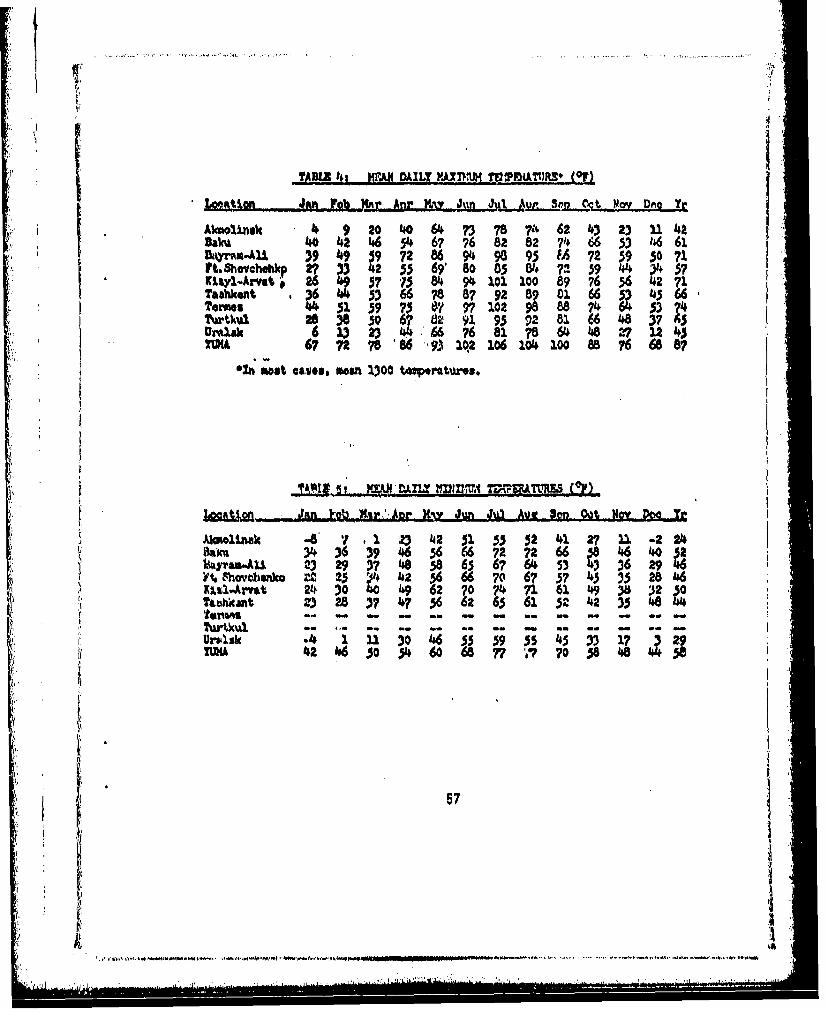
!AMRI 414 KAII DILY-FilI-MJ -TU!FWtTiI)RS (OF)
Baku 40 4246 54 677682 82 7466 5314 61UDMAyrU4 3949 $972 86 949895 M 72 5930 71f eh, $ h~ehke p 27 " 4 5 69 80 0 8# 7 9 4 ý
K~iyl-Arvat * 26 49 57 -75 84 94 101 1o0 89 76 56 42 71Tashken 3 6 414 53 66 78 87 92 89 0166R436Temes 4451599 1? 74
6 33 236 44 76 81 7864 48 72.24
*In m•eeeos "va isa 308ootrs
0Jan -&X 4J JW Ave IM OA Noy Dm .r
)J0@11A8sC -8, 1 23 42 51 55ý2 41 2?11 .221404n34 39 46 56 66 727266846 40 s
i~a~yia-Au 2129P 488 65 67 64~ 53 ý6 29 4A, Vnovobwkko ZC 13 j 42 -6 6 70 67 57 45 84
K~i~.ryt 2~O0 49 6A27047649 ~J5Tathkcint :3 28 ~747562 6561 52 J42 3j 484
Urvlsk .14 121 30 46 55 59 55 43 13 1? 2MWI 4246 505p460 65 '7.70 5 4B45
57
Mw.. . ... .. . . . .. ......... .
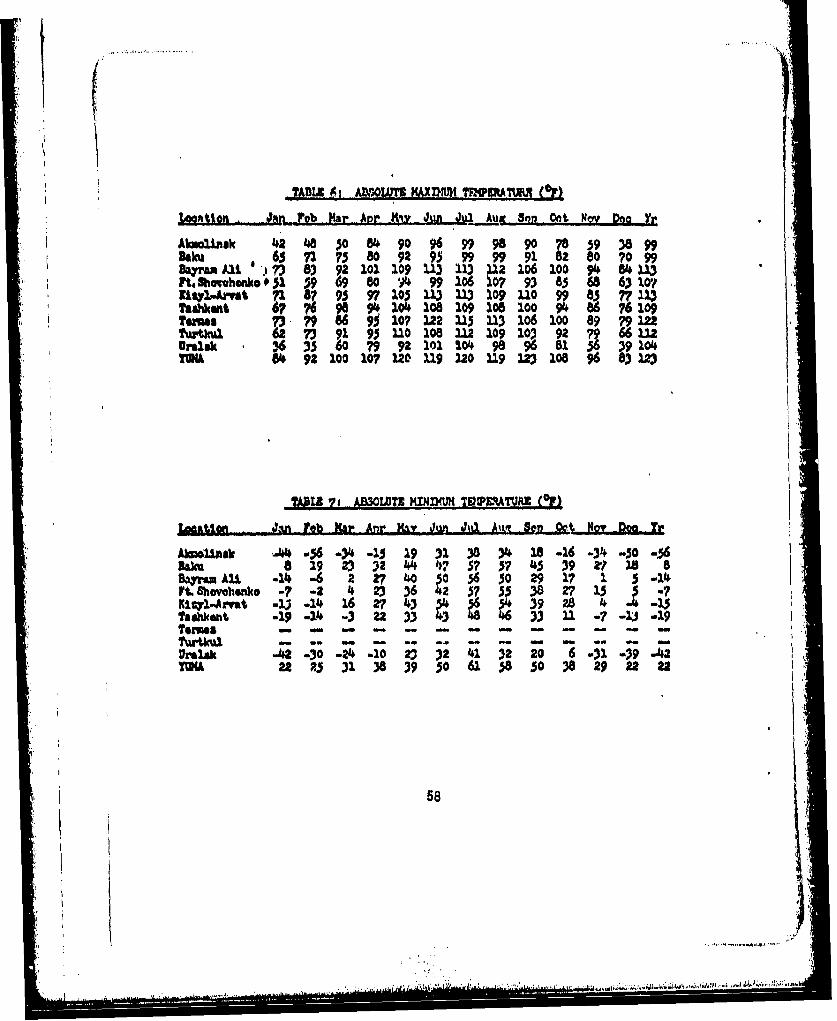
?ADZZ i ,AD4OU W.Iwrn TP~¶VM C
Loentioni JAn Fob hr AMr ftv Jun b,4 Aux Son Ont Noyv Da Ta.
Abmaimsk 42• •9 50 •4 90 96 999 90r59 383akku 6s 73. 75 80 92 9$ " "9 182 80 70 99
Ali 3 83 92 101 109 113 113 U 1L 100 94 84113Ft,8b@ohmnko 3.1 59 S9 80 Ig 10? 93 85 68 639 07K1ty1.Amyt n18959"7105 13311310109099"8571233Tafatms 67#9 9104 1081log105 100 91j 86 76109Itrems ? 96 9510? 122US 113 106 100 89 g912M?w'tkwl 273915109no108 U12 109203 92 ?96 112umiaks 36356?9 92 101 104 " 96 81 3639 10'
84 92 100 107 120 119220 119 W 108 06 83 W
ZAMI 71. &EWSO? KUMIft T UOL'TAVJ (!I)
Losle Jum [2kMrAn I Jun JUd A113'92 aet N~tor 2m..
Mmml11sk i56.344.-S 1931 38 34 18 -16 -34 -50-Balm 81923 )a44 4757 5?45359 q is8%"yrm Ali -14.6 2 27 400 56 50 29 1?2 1 -1I4Vt. sbwavheako -7 -2 4 23 36 42 57 55 38 2? 15 1 _-?91271-Aarvt .33.1u 416 27435r6d 439 28 4 15Taahknt .19 -14 -322 3341. 33121 -? -)j-19T~erm. -1 -1 - 2 3 - - - - -
Vral* 4.2 -30 -2 1-10 0 3)2 41 2 20 6.31 -3)9 -42M • 22P5 31 38 39 0 061 58 50 38•29 22 22
58
- ~ ... I...
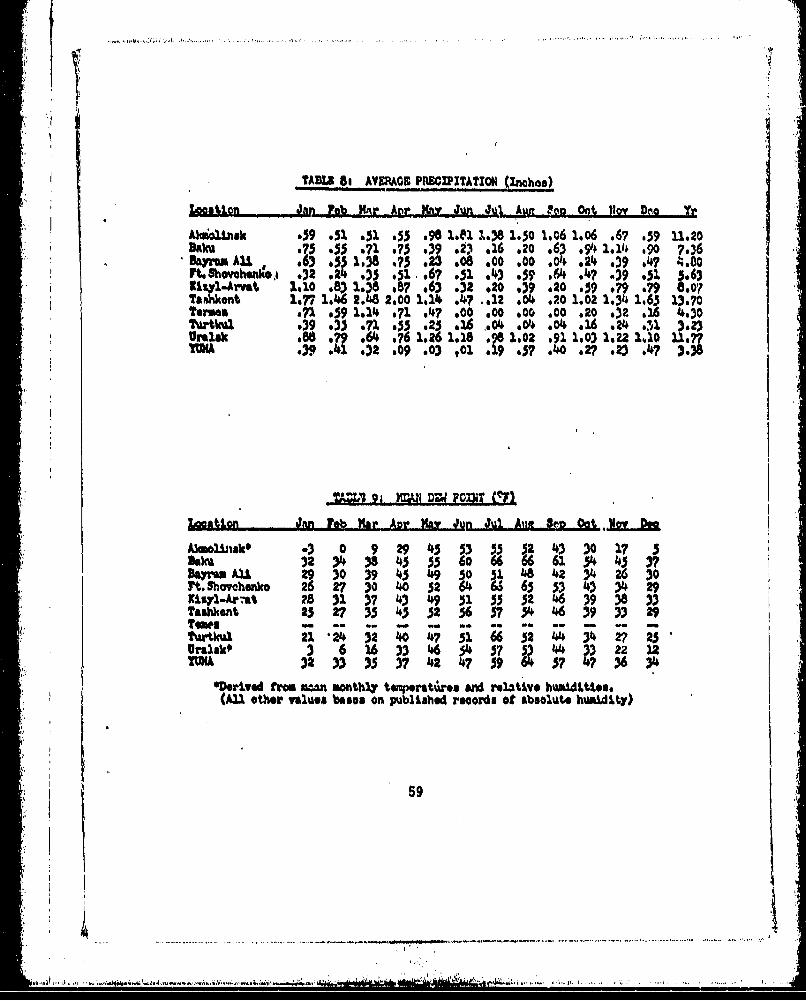
TAMA SM AVERAS PR•EMMUTATION (Incho.)
Location Jan Pob -Mat Aor ha Jun JuL Au ,0 Oct Paov D~o e xAlkoinUsk .59 .51 .51 .55 .98 laf1 1.38 1.50 1.06 1.06 .6? .39 11.20
75 .355 . 1 .75 .39 .2) .16 20 1.14 9 7o*3ldlyram AU , .63 0 S~ 18 o.23 .08 Jo0 .00 .24 .39 47? 4.8OPt. Shwochenlo,, .*32 24 .*3 .51 .67 .51 .*43 *39 . A? s39 .51 5163lit1-Awvat 1.10 8) 1.3 .M 63 2 .20 .52 279 .79 8.O'jTai~ont, 1,77 1,46 2.48 2.00 1,14 .A7 .12 . O .20 1.02 1.34 125 13.70Torms 7 59 1.14 71 47 00 000 .00 600 20 632 .16 4.30Tortl, .39 .3 7 .:71 5• 25 :].A 04 .04 o16 .24 .01 3.23fralsk see 71 .64 ?76 IM1. 118 .91.02 * 1 1.03 1.2.2 1410 1L.?
3.0 .32 .09 .03 ,o01 . .9 : 27 .23 47 3.38
9a IU D. POU2T (C~
Lo&ation Jan Ueb Kar Apr N. Jun Jult Al Sg Oct *.ho D.oe
Akmoliiisk$ -3 0 9 29 45 53 55 52 43 30 17 5DOW 32 343 43 35 60 66 66 61544 4
26s t 29 30 39 45 49 So 31 8 42 3 6 30?t.3havchankc, 262 30 40 32 64 66655343 31429Kisyl-Ar-st 28 31)3? 434951 55 52 4 39 38 " I ITashkent 25 27 35 52 56 57• 4 •46 39 29
Turtkul 2l124 324o04731i66524434 2? 25VralskO9 3 6 16 33 46 54 57 5) 44 13 22 32TWAK 32 "33 35 3 42 47 59 0 7 47 36 34
W, ~ved from wn aonthl' teqeratures ad rolat-ve huamditioa.(All other values bases on published records ot abaolute humidi.ty)
59
tI
~ .-- ---- . . . . . .~. . . - . . . . .
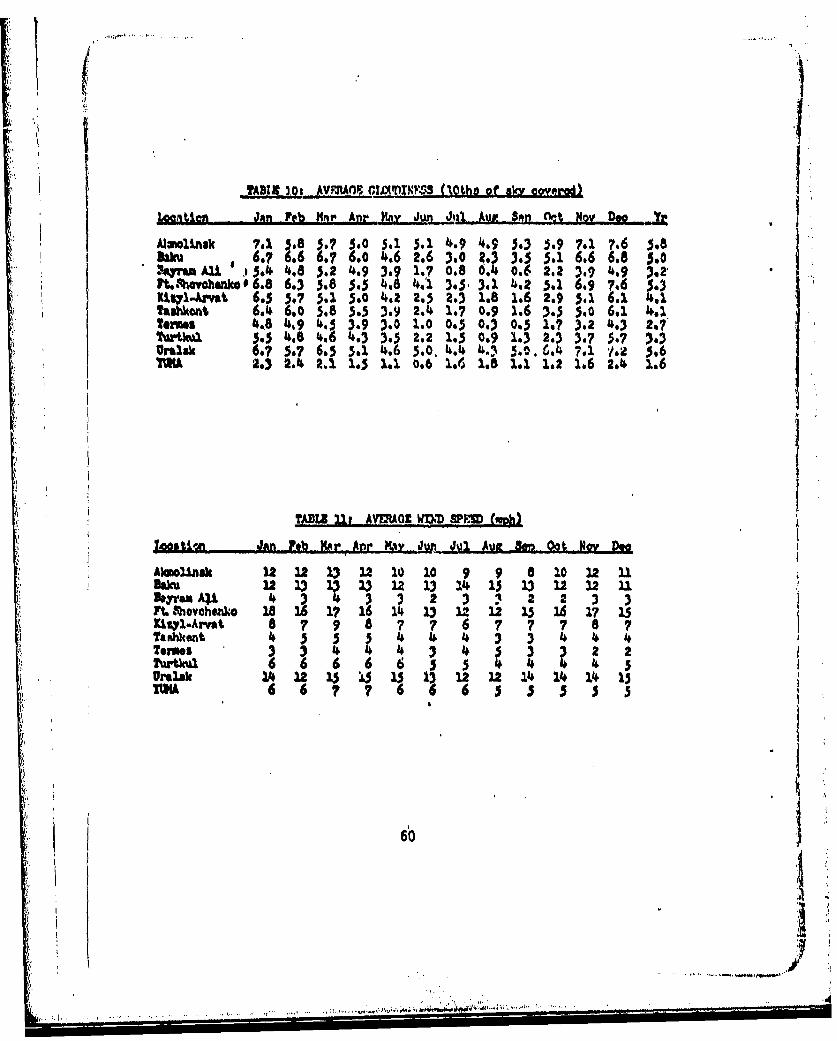
AB 120c AVFPRAnP. OW'DMIXF-S (10&ht of' a)i govered)F
eIM-Wen JAB lek )nr Ant' MAX.J .at.Jida -AvE - $40(let Noyv Dog Ti
ANmo11jsk 7158 .? .0 5.1 5.1 4.9 4i.9 5.3 3.p 7.1 ?.6 5.8Sam 1 6. 6. : 6.? 6.04.6 2.6 3:0 9:3 3.5 5.1 6.6 6.8 5.0Mt.$elovaheft 6.8 6.3 5.8 35.5 4.1 4.'l 3.5. 3.1 14.2 5.1 6976 5
bw*Qhnt 6.4 60 5.8 5.5 3.9 2.4 1.7 0.9 1.6 3.5 5.0 6.1 4.2foms4,8 4,9 4. 3.9 3.0 1.0 0.5 0.3 0.5 12? 3.2 4.3 2.7-
Tutkul~~ 65.5 4,8 4: 6' 4.3 . 2.2 1.5 0.9 1.3 2.3 3.7 59? 547rl~ . 5.7 6.5 5:1 4. 5.0. 4.14 4.3 5.o. 6 4 .1 1: 3.6
2.3 2.4 2.1 1.5 1.2, 0.6 1. d 1.8 1.1 1.2 1.6 2.4 1.6
?AEZZ2.1 AV1'tAOt MMh SPR CM~)
Alwollnsh 122193312 10 10 9 9 8 10122 21%am 122 13 313 12 131.4 1513 22 121U8.yran Ati 4 4 2 3 ? 2 2 3 3A. fhoychsalk 18 16 171614Z13 122.1215 16171 isKisy1'1Arvat 8?7 9 08 7 7 6 7 ?7? 87T&Aahent 4 5 4 14 4 3 3 4 4 4Toems 3 4 44 4 3 3 2 2Turtkiul 6 6 666 44 4 5Vrs2.ak 14 12153 4 15 13 121214 14 14 1
6b
ii
A-6
Chinese Inner Asia.
61
* : -
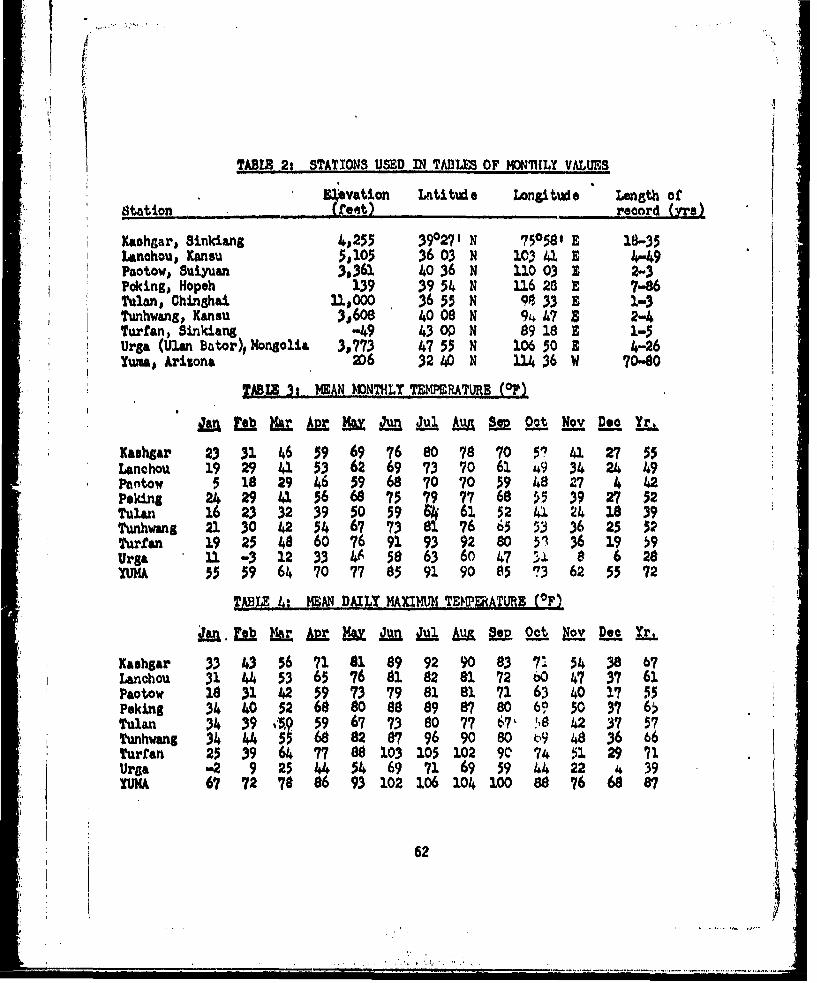
I|
TABLE 2: STATIONS USED IN TA13LES OF MONIIILY VALUES
mElvation Lititude Longitud e Length ofStation (feet) record (.na)
Waohaarl 8inkiang 4s255 390271 N ?50591 E 18-35Lanohou, Kmnsu 5,105 36 03 N 103 41 E -49Paotow, Suiyuan 3,361 40 36 N 110 03 E 2-3Poking, Hopeh 139 39 54 N 116 28 E 7-86Tulans Chinshai. 11,000 36 55 N 98 33 E 1-3Tunhwang, Kansu 3,608 40 08 N 94 47 3 2-4Turfan- Sinkiang "49 43 O0 N 89 18 E 1-5Urga (Ulan Bator)l Mongolia 3,773 47 55 N 106 50 3 4-26Yuma, Arizona 206 32 40 N 114 36 W 70-40
TABTZ 3t- H.UAN MONTH1LY TDM- RATURE (OF)
im &b c -t b &-L o c Nov Doo Yr
Kauhgar 23 31 46 59 69 76 80 78 70 P? 431 27 55Lanchou 1929 41 53 62 69 73 70 61 49 24 49Pantow 5 18 2946 59 68 70 70 59 4827 442Poking 24 29 414 56 68 75 79 77 68 ý5 39 27 52Tulmn 16 2332 39 so59 661 52 4 24 1839Tunhwang 21 30 42 54 67 73 2 76 $ 53 36 25 52Turan 19 25 48 60 76 91 93 92 80 5' 36 19 59Urga 1U -3 12 33 46 58 63 60 47 ýx 8 6 28YUMA 55 59 64 70 77 85 91 90 85 ?3 62 55 72
TABLE 4: MBAN DAILY MAXIM-M TEMPEATURE I!F)
AM &X Jun AL §t2L~De
Kaohgar 33 43 56 71 1 89 92 90 83 7 5438 6Lanchou 31 44 53 65 76 81 82 81 72 47 37 61Paotow 131 425973798181716340 1755Peking 34 40 52 68 80 88 987 80 69 50 37 6Tulan 34 39 4Q 59 67 73 80 77 67~' ''842 37 57Tunhwang 34 44 53 68 82 87 96 90 80 b9 48 36 66Turfan 25 39 64 77 88 103 105 102 90 74 3. 29 71Urg, -2 9 25 44 54 69 71 695 3944 22 4 39
UMA 67 72 78 86 93102 106104 10088 76 6887
62
i,4
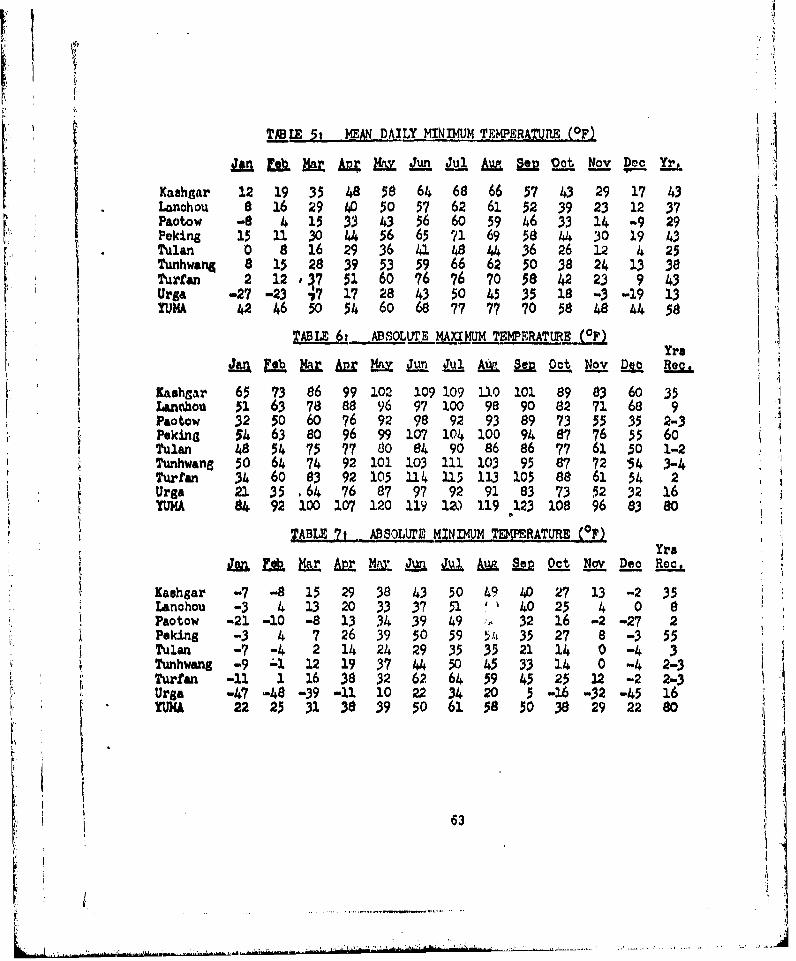
TAB LE 5 MEAN DAILX MINIMUM TEMPERATURE .(OF).
Kashgar 12 19 35 48 38 64 68 66 57 43 29 17 43Lanchou 8 16 29 40 50 57 62 61 52 39 23 12 37Paotow -8 5 3 43 56 60 59 46 33 14 . 29Peking 15 3. 30 44 56 63 7/1 69 58 44 30 19 43
TunhwanS 1 28 39 53 59 6 2 50 38 24 13
Tuan "22 12, 7 51 60 7 6 7058 4223 9 43Urg -27-23,71 2843 50 458 -3-19 13YUMA 421 46 50 54 60 68 77 77 70 58 48 44 58
Yra
JA PEb M= AU M Juru1_ Au M rtNov~ 2 Ro
Kaahgar 65 73 86 99 102 109 109 110 101 89 83 60 35Lanabou 51 63 78 88 96 97100 98 90 82 71 68 9Paotow 32 50 60 76 92 98 92• 93 89 73 55 35 2-3 4
Peking 54 63 80 96 99107104 100 94• 87 76 55 60 iTulan 48 54 75 77 80 84 90 86 86 77 61 50 1-2Tunhwang 50 64 74 92 101 103 I1 103 95 87 72 54 3-4Turfan 34 60 83 92 105 114 115 113 105 88 61 54 2Urga 21 35 .64 76 87 97 92 91 83 73 52 32 16UMA 92 100 107 120 119•120 119 123 108 96 83 80
TABLE 7t ABSOLUMf MINIMUM TDMRATURE (OF)Yra
*Kashgar -7 -815 29 38 435049 40 2713-2 35Lanohou -3 4 13 2033 3751 ' 40 25 4 0 9Paotow -21 -10 -813 343949 ~32 16-2 -27 2Peking -3 4 7 26 39 50 59 35 27 8-3 55
* *Tulan -7 -4 21424 29 3535 2114 0 -4 3Tunhwang 12 19 37 4450433 14 0 -4 2-3Trfan -11 1 16 38 32 62 64 45 2512 -2 2-3Urge -47 -48 -39-11 10 223420 5 -16 -32 -45 16
63
• ' , :..... •11

I
TABLE 8t AVERAGE PRECIPITATION (inches)
Ja &Eb &r M !X Jun Ju & AiM 2ot Nov Dec Yr.
Kashgar 0.6 0.1 0.5 0.2 0,3 0.2 0.4 0.3 0.1 0.1 0.2 0.3 3.2Lgnchou * 0.1 0.2 0.4 1.1 1.3 2.5 3.9 1.9 0.5 0.1 0.1 12.1Paotoww 0.1 0.1 0.9 0.7 3.1 2.8 1.0 1.6 0.1 0.1 0,0 10.6Peking 0.1 0.2 0,3 0.6 1.3 3.2 9.8 5.8 2.3 0.7 0.3 0.1 24.7Tulan * 0.1 0,3 0.4 0.2 0.5 0.3 1.2 1.0 0.1 0.1 t M2Tuihwang * 0.0 * 0.2 0,2 0.4 0.1 0.2 0.1 * 0.0 * 1.3Turfan 0.0 0.0 0.0 0.0 0.6 0.1 0 O.L 0.0 0.0 0,0 0.0 0,8Urga * *A 0.1 0.2 0.3 1.0 2.9 1.9 0.8 0.2 0.2 0.1 7.7YUMA 0.4 0.4 0.3 0.1 * * 0.2 0.6 0.4 0.3 0.2 0.5 3.4
* **40.05 inches
TABIS 2: MEAN DEW POINTl (OF)
• M Jul &Z & LA Nov Dee Yr
Kashgar -- -
Lanchou 9 15 21 29404854 5850 3823 14 37Paotow -2 9 10 26 32 50 57 60 44 28 13 -3 34Peking 1114 23 34 47 58 69 68 56 41 26 15 45Tulan 14 18 27 33 34 4•146 48 35 22 4 -2 30Tunhwang 16 20 27 31 40 47 53 53 4433 23 18 36Turfan -- 19 33 41 55 58 58 49 40 -- - -Irga* -15-8 5 203144 53 49 36 21 2-10 28YUMA 3233 35 3742 4753964 574736 3446
*Derivud from mean monthly temperatures and relative humidities(all other values based on published records of absolute humidity)
TABL8 I0: AVERAGE CLOUDINESS- (lOths of sky covered)
Is~ ~ ~ ~ J U & W L ul WU Le 20- Novx D-c M
Kashgar - -.-. .-.Lanohou 4.8 4.4 5.6 6.6 4.6 6.7 6.7 5.7 5.8 5.7 3.9 3.6 5.4Paoow ..... ..Peking 2.0 2.4 3.3 3.9 4*.0 4.6 5.4 4.7 3.8 2.4 2.3 1.8 3.4Tulan 3.7 4.9 4.8 5.1 5.9 5.4 6.2 4.3 4.8 3.4 3.7 3.1 4.6Tunhwang 4.5 5.4 6.0 5.8 5.9 5.3 6.1 4.8 3.7 2.8 3.0 4.9 4.9Turfan 3.6 3.6 3.9 5.2 5.0 4.6 4.0 3.7 2.2 3.0 2.2 2.9 3.'?Urgsa 2.4 2.2 2.9 4.5 4.8 5.0 5.3 4.7 3.6 3.1 3,0 2.8 3.7
UM 2.3 2.4 2.1 1.5 1.1 0.6 1.6 -1.8 1.1 1.2 1.6 2.4 1.6
664 '•
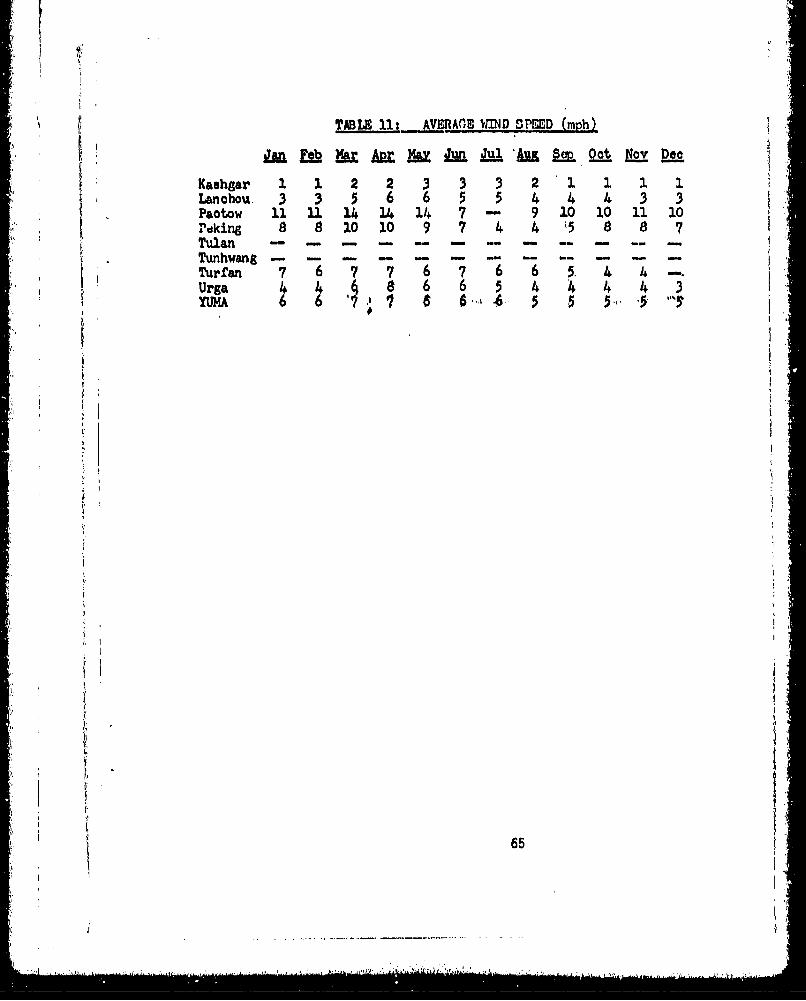
TABLE 11 AVERAOM WIND 0PIED (Lh)
~~J Seb 20-t • •' O_ Nov D..oe
V )auhgar 1 1 2 2 3 3 3 2 1 1 1 1Lanchou. 3 3 5 6 6 5 5 4 4 4 3 3Paotow 11 11 14 14 14 7 - 9 10 10 11 10"Peking 8 8 10 10 9 7 4 4 ý5 8 8 7rT.i2an - - - a - - - -- - -
Tunhwang - - - - - - -- -- -- - -- -Turfan 7 6 7 7 6 7 6 6 5. 4 4 -.
Urga 4 48 6 6 5 4 4 4 3YUMA 6 6 8 6~ *
65
F 65
.................................
A-7
East Central Africa
66
"iC
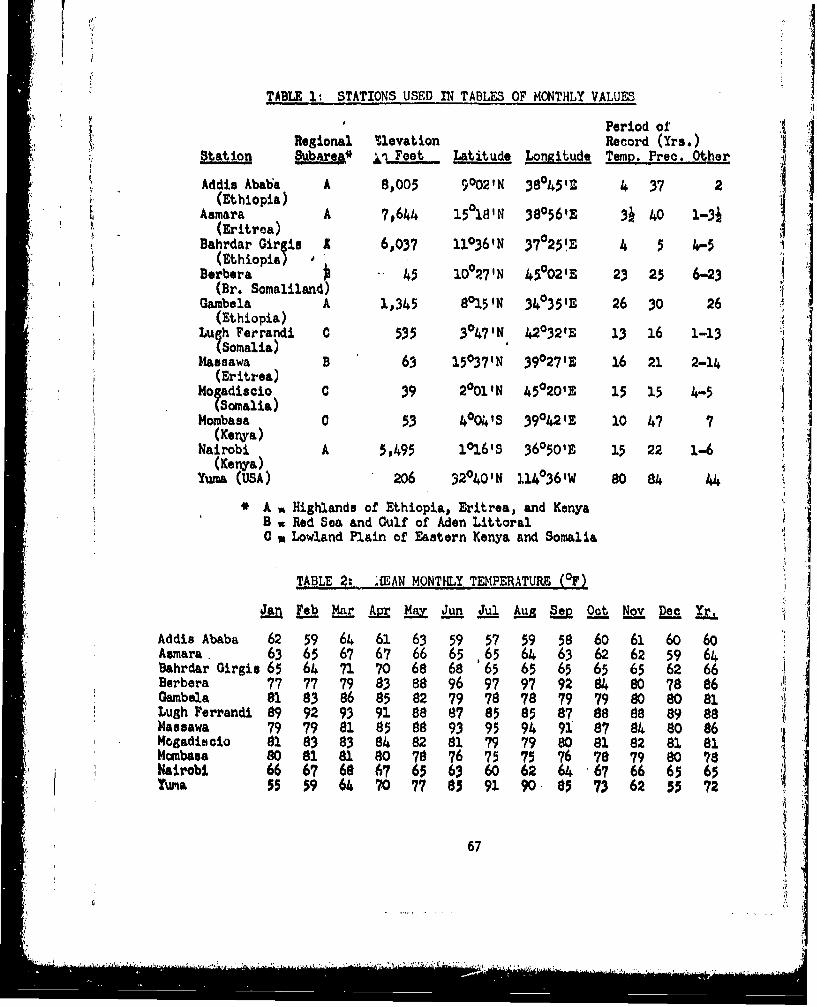
TABLE It STATIONS USED IN TABLES OF MONTHLY VALUES
* •Period ofRegional Ilevation Record (Yrs.)
,,tatio Subarea in Feet Latitude Longitude Temp. Prec. Other
Addis Ababa A 8,005 90 02'N 380 45'E 4 37 2•. (Ethiopia)Aesmara A 7,644 15 018'N 38056'E 3k 40 1-31
(Eritrea)Bahrdar Qir is X 6P037 11036'N 37025!E 4 5 4-5!I: I' (Ethiopia) lBerbera ,- 45 10°77'N 450O2'E 23 25 6-23
(Br. Somaliland)Gambola A 1,345 8015'N 340 35'E 26 30 26
(Ethiopia)Luh Ferrandi 0 535 3047'N 420321E 13 16 1-13
Som aia) B 63 15O37'N 390 27'E 16 21 2-14(Eritrea)( Ediscto C 39 20 01'N 45020'E 15 15 4-5il f (amalia)•
Mombasa 0 53 40041S 39042'E 10 47 7* (Kenya)Nairobi A 5o495 °16WS 36050'E 15 22 1-6
' (Kenya)Ywua. (USA) 206 32040'N 114036'W 80 84 44
* A a Highlands of Ethiopia, Eritrea, and KenyaB a Red Sea and Gulf of Aden Littoral0 a Lowland Plain of Eastern Kenya and Somalia
TABLE 2: .0AN MONTHLY TEMPERATURE (OF)
Feb Mar& May Jn Jul Aug Sev Oct Nov . ee
Addis Ababa 62 59 64 61 63 59 57 59 58 60 61 60 60
Asmara. 63 65 67 67 66 65 65 64 63 62 62 59 64Bahrdar Girgis 65 64 71 70 68 68 65 65 65 65 65 62 66Berbera 77 77 79 83 88 96 97 97 92 84 80 78 86Gambela 81 83 86 85 82 79 78 78 79 79 80 80 81Lugh Ferrandi 89 92 93 91 88 87 85 85 87 88 88 89 88-assawa 79 79 81 85 88 93 95 94 91 87 84 80 86Mogadiscio 81 83 83 84 82 81 79 79 80 81 82 81 81Mombasa 8089181 80 7876 757576 787980 78Nairobi 6667 68 67 65 63 6062 64 -67 66 65 65Tuma 5559 64 70 77 85 91 90 85 73 62 55 72
67
•. ..-
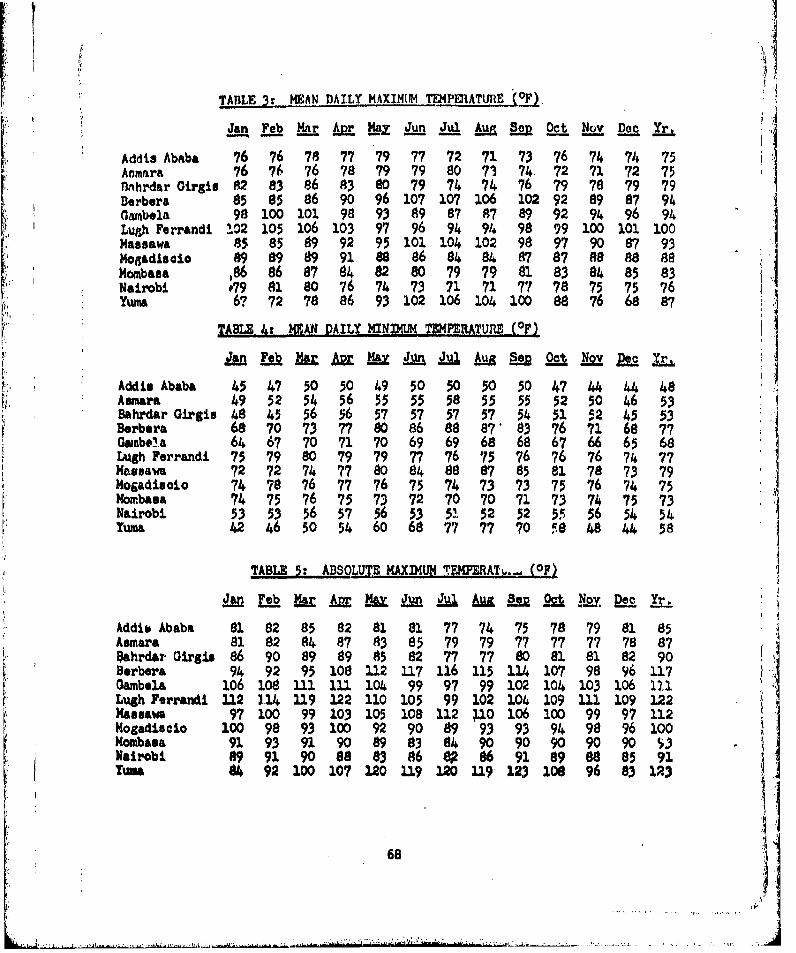
TABLE 3: HEAN DAILY MAXIMUM4 TE24PEATURE (OF).
&n Fab ~r~ &r Z Jun ul a 8 Oct Nov Doc Yr
Addis Ababa 76 76 78 77 79 77 72 71 73 76 74 74 75Anhmara 76 76 76 78 79 79 80 73 74. 72 71 72 75fl'hrdar Girgis A2 83 86 83 80 79 74 74 76 79 78 79 79Berbera 85 85 86 90 96 107 107 106 102 92 89 87 94Goalbela 98 100 101 98 93 89 87 87 89 92 94 96 94Lugh Ferrandi 102 105 106 103 97 96 94 94 98 99 100 101 100Massawa 85 85 169 92 95 101 104 102 98 97 90 87 93Mogaldtisio ag 89 89 91 89 86 84 84 87 87 AS AS 88Mombasa ,86 86 87 84 82 80 79 79 91 83 84 85 83Nairobi #79 81 80 76 74 73 71 71 77 78 75 75 76Yuma 6? 72 78 86 93 102 106 104 100 88 76 68 87 '
TABLE &t MEAN DAILY MINDMUM TEMPERATURE (OF)
Jan WF _M A2 &Z Jun L1 &&a Ste Oct. No Do Yr
Addis Ababa 45 47 50 50 49 50 50 50 50 47 44 44 48Asmara 49 52 54 56 55 55 58 55 55 52 50 46 53Bahrdar Girgis 48 45 56 56 57 57 57 57 54 51 52 45 53Berbera 68 70 73 77 80 86 88 87' 83 76 71 68 77Gambela 64 67 70 71 70 69 69 68 68 67 66 65 68Lugh Ferrandi 75 79 80 79 79 77 76 75 76 76 76 74 77Masawa 72 72 74 77 80 84 88 87 85 81 78 73 791Hogadi.oio 74 78 76 77 76 75 74 73 73 75 76 74 75Mombasa 74 75 76 75 73• 72 70 70 71 73 74 75 73Nairobi 53 53 56 57 56 53 51 52 52 55 56 54 54Yuma 42 46 50 54 60 68 77 77 70 99 48 44 58
TABLE 5: ABSOLUrE MAXIMUM TEKPERATL..- (OF)
jW De M _a M Jlý L kYy c Yr~
Addio Ababa 81 82 85 82 81 81 77 74 75 78 79 81 85Asmara 81 82 84 87 A3 85 79 79 77 77 77 78 87.Dahrdar Girgi 86 90 89 89 85 82 77 77 80 81 81 82 90Berbera 94 92 95 108 112 117 116 115 114 107 98 96 117Oambela 106 108 111 111 104 99 97 99 102 104 103 106 I2.lLugh Ferrandi 112 114 119 122 110 105 99 102 104 109 111 109 122
eassawa 97 100 99 103 105 108 112 4i0 106 100 99 97 112Mogadiscio 100 98 93 100 92 90 89 93 93 94 98 96 100Mombasa 91 939190898349090 90 9090 3Nai i89 91 90 88 83 86 e 86 91 898 85 91TN 4 92 100 107 2.20 119 120 ng123 18 96 83 12.3
68
Iv . .. .
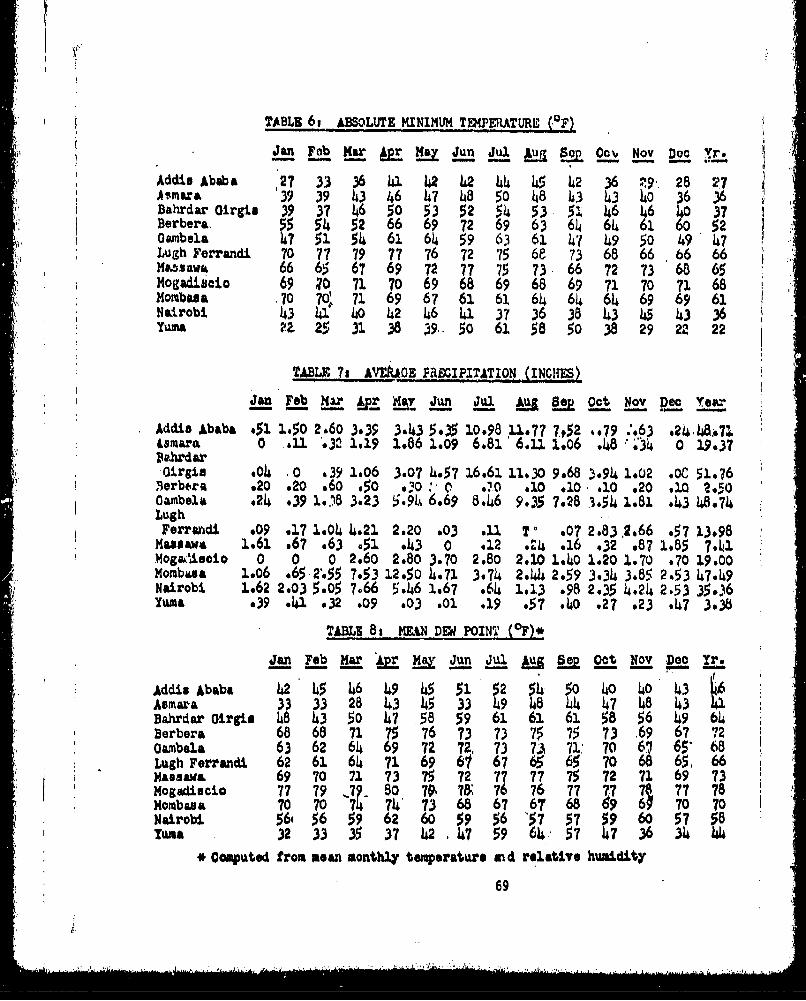
TABLE 6, ABSOLUTE MINIMUM T4PEATURE (.OF
___n Fo 0bM L A u u IOc, Nov Doe Xr.
Addis Aboba 127 33 364142 42144 ,5 42 36 ý9-28 .A¶'II1Z& 39 3943 46 47 48 50 h8 43 43 40 36:36Bahrdar Oirgia 39 37 46 50 53 52 54 53 5. 46 46 40 37Berbera, 55 54 52 66 69 72 69 63 64 64 61 60 52GaObela 47 51 54 61 64 59 63 61 474 9 50 49 47Lugh Ferrandi 70 77 79 77 76 72 75 68 73 68 66 66 66Hessava 66 65 67 69 72 77 75 73 66 72 73 68 65Mogadiscio 69 WD 71 70 69 68 69 68 69 71 70 71 68Mombasa .70 70'71 69 67 61 61 64•6 646 69Nairobi 43 40 42 46 4137 36 38 43454336
TABLE 7,# AVWA0E PRCIPITATIO" (INC~IT)
Jan Fab M3r MJn Jul &u Us Oct Nov Dec year
Addis Ababa .51 150 2,60 3.3- 3.43 5.35 10.98 41'.77 7,2 -. 79 .'.63 .248.4B1.oTamIara 0 0-1 .3* 1,19 1.86 1.09 6.81 6.11 1.06 .48 '.'64 0 19.37
Peb~rdarGirgia A . 0 %39 1.06 3.07 L.57 16.61 11.30 9.68 3.94 1.02 .OC 51.763erbEra .20 .20 .60 ,50 ,00 : C0 .O o10 .10 .10 .20 .10 240
Oambela ,24 ,39 1108 3.23 5.91. 6.69 8.46 9.35 7.-28 .1-54 1.81 .43 48.74LUgh,Ferrandi s09 .17 1.04 4.21 2,20 s03 ell To ,07 2,83,2.66 .57 13.98
Massawa 1.61 .67 .63 .•51 .43 0 .12 2.4 .16 .32 .87 1,85 7.Hog&'Iscio 0 0 0 2.60 2.80 3.70 2.80 2.10 1.4o 1.20 1.70 .70 19.00Mombasa 1.06 .65-27.55 7.53 12.50 4.71 3.74 2.*4 2.•59 3.34 3.85 2.53 47.49Nairobi 1.62 2.03 5.o5 7.66 5.46 1.67 .64 1.13 .98 2.35 4.24 2.53 35036Yuma e39 .41 .32 .09 .03 .01 .19 .57 .40 .27 .23 .-47 3.38
TABLE 8, MUN DE POINT (oF).
Jan Fab Mar &rM Jun Jul Lul Sep Loct Nov Doc Yr.
Addis Ababa 42 45 46 49 45 51 52 54 50 40 40 43Asmara 33 33 28 43 45 33 49 48 44 47 48 43Bahrdar Oirgi 48 43 50 47 .58 59 61 61 61 58 56 49 64Berbera 68 68 71 75 76 73 73 75 75• 73 .69 67 72aambela 63 62 64 69 72 72, 73 73 72V. 70 61 65' 68Lugh Forrandi 62 61 64 71 69 61 67 65 65 70 68 65, 66Mamsava. 69 70 71 73 75 72 77 77 75 72 71 69 73Hogadiboio 77 79' J. 80 70, 8 76 76 77 7.7 7• 77 78Mombasa 70 707 747368 67 6768 6 6 70 70Nairobi 561 56 59 6260 5956'57 5759 6057 58YuMA 32 33 35 37 42•.7 59 64. 57 47 363444
C Computed from mean monthly temperature m d relative humidity
69
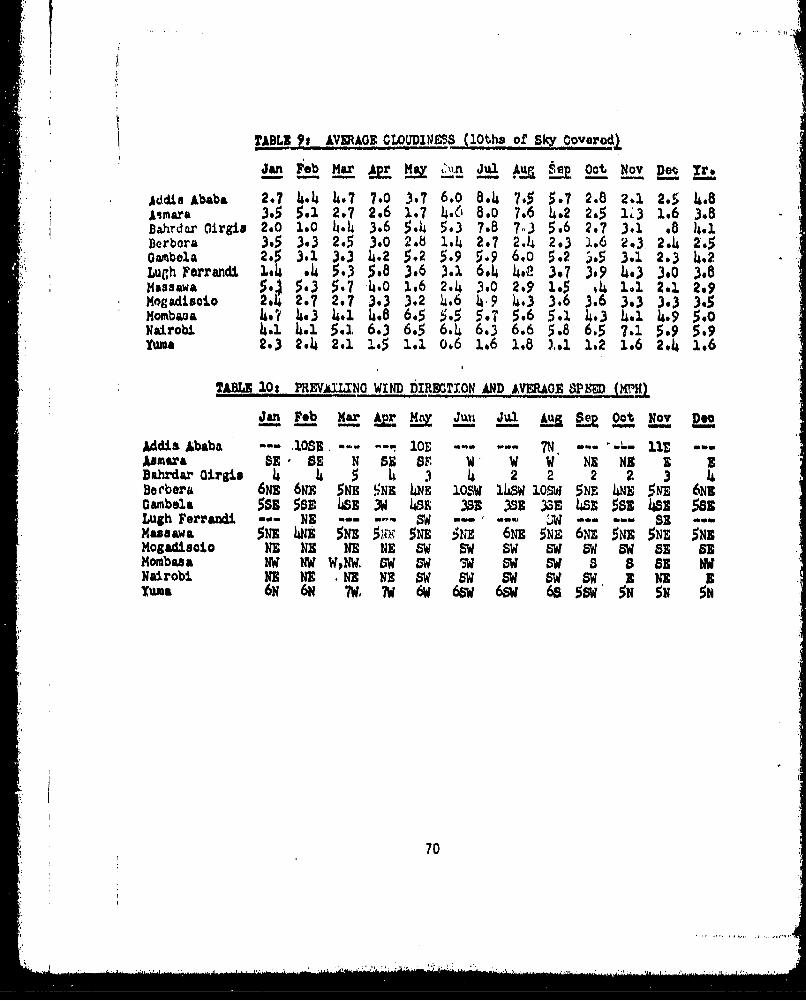
!TABLE 2# AVEAGE CLUDNESS (1Otlw of Sky Covorod.:
Jan F eb Mar~p &r ~ Jul ýX Ee2 Oct Nov Dot Ti'.
Add:a Ababa 2.7 4•.4 4.7 7.0 3.7 6.0 8.4 7,5 5.7 2.8 2.1 2.5 4.8Asmara 3.5 5.1 2.7 2.6 1.7 4.-6 8.0 7.6 4.2 2.5 103 1.6 3.8Dahrdar Oirgis 2o.0 1.0 4.4 3.6 5.4 5.3 7.8 7-K) 5.6 2.7 3.1 .8 4.1Derbora 3.5 3.3 2.-5 3.0 2.-8 1.• 2.7 2.4 2.3 1.6 2.3 2.4 2.5.. ,be.a 2.5 3.1 3.3 4&.2 5,2 5.9 5.9 6.0 5.2 .ý5 3.1 2.3 4.2Lugh Ferrandl 1.4 .4 5.3 5.8 3.6 3.1 6.4 4*. 3,7 M,9 4,3 N.0 3.8
5icw 5.. 5.3 5.7 14.0 1.6 2.14 M. 2.9 1.5 .4 1.1. 2.1 2.9Mogadiscio 2.4 2.7 2.7 3.3 3.2 4.6 4.9 4.3 3.6 3.6 3.3 3.3 3.4Mombaoa 4.7 4.3 4.1 4.8 6.5 5.5 5.7 5.6 5.1 4.3 4.1 4.9 5.0Nairobi 4.1 4.1 5.1 6.3 6.5 6.4 6.3 6.6 5.8 6.5 7.1 5.9 5.9Yuma 2.3 2.4 2.1 1.5 1.1 0.6 1.6 1.8 ).,1 1.2 1.6 2.4 1.6
TABLE 10: -PREVA=LNO WIND DIRETO N VRAG94 E SPiRD "H)Jan Fab Mar #2 IL Juni Jul Au Le Oct Nov Doc
Addis Ababa ... lOSE.-... - 1 0E 7N .. . . 7, --- "-- liE --Asmara BE BE N 81SF W W W NE WE E 3Bahrdar Oirgis 4 4 5 14 .3 4 2 2 2 2 3 14Ber'bera Us3 WN 5NE SN z IsNE 108ýW 114W 105WSi NF 4NE 5NE 6NzOanibela 5ss 53E 13 3WS ~ 4SE 383 381c 333 Ws8 583 ha8 583Lugh Ferrandi, --- NE --- n-~ SW - wwu J1 w " B man8
Mam aws, 5NE Wit 5nE 5a.,- 5NE 5ra 6Ns 5NE 6Nz 5Nz 5NE 5NZMogadiacia NE NEC NE NE SW SW SW SW SW SW BE 83Mombasa NW NW WONW. SW >W N3W Sw sw 8 8 BE NwNairobi NE NE NI NE bW SW SW SW SW 3 NE 3Yuma 6N 6N 7w 7w 6w 6sw 6s 6s 5sw 5N 5N 5H
70

A-8North America
71
'Ii
*.,. ~* .. . . .*. , **
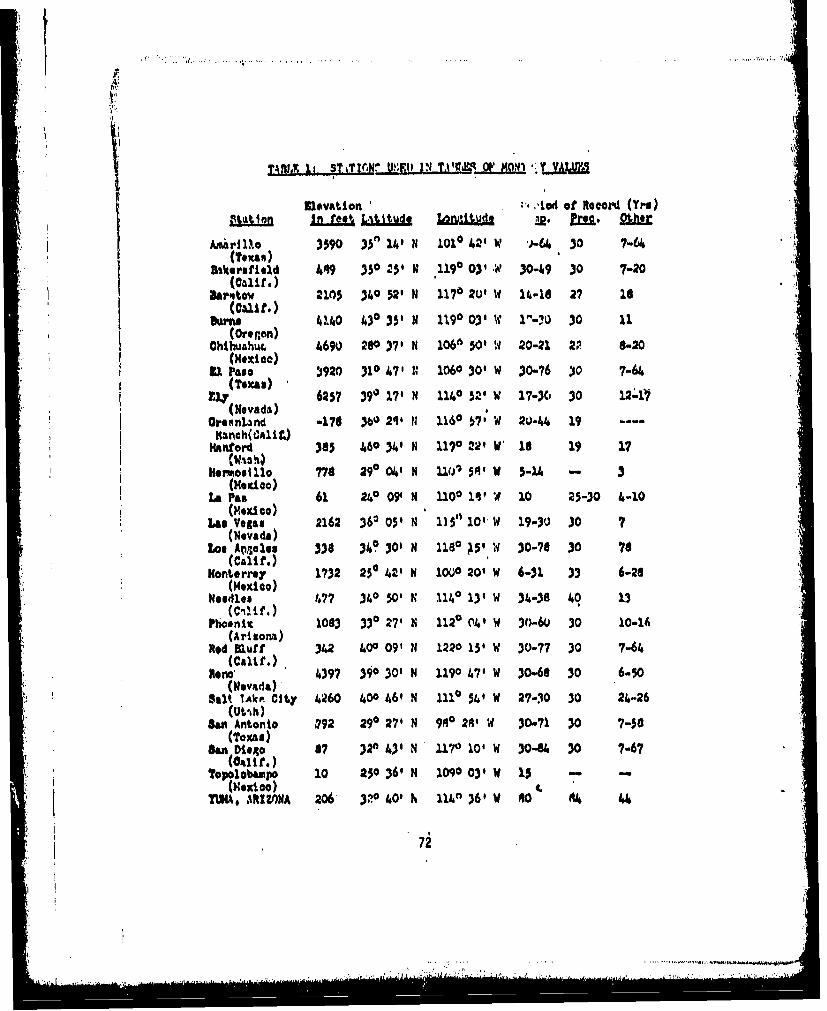
.loevation o' .d of Recorol (Yrs)91 it n in 1Dtool L-j&1±jU Lopltt&da 2. Eu.
An mri 1.o 3590 33" 14' 11 1010 42' W .)-64 30 7-64(Texas,)
Bikerstield 4" 330 25' N 1190 03' -W 30-49 30 7-202rftov 2105 3 52' N 1170 2U' I 14-10 2 18
, (cgiz'.)&AMre 414.0 430 35' N 1190 03' 11 1" -30 30 11
(Oron)ChlhuAhut. 4690 200 37' N 1066 503 W 20-21 2P 8-20
(Mexico)ILI Palo M920 310 47' N 1060 30' W 30-76 30 7-64
Ely 6237 390 17' N 1140 $2' W 17-30 30 12-11(Nevada)
Oreenland -176 3b0 21, N1 1160 W9h W 20-44 19Nanch(C~alit.)
KAvford 305 460 34' N 119 220' V 18 19 17
Hermosillo 770 29° 041 N ,1,0 5' 1W 5-1.4 - 3(Mexico)La Pas 61 240 091 N 1100 l1' W 10 25-30 4-10(MS~ico)
Las Vegas 2162 360 05' N 115" 10' W 19-30 30 7(Nevada)
1os Applsem 330 340 30' N 1180 A5' W 30-7? 30 78(Calif.)
Monterrey 1732 250 421 N 1000 20' W 6-31 33 6-28(MexiOo)
Needles 477 340 50' K 1140 13' W 34-38 40 1,3(c~~if.)Phoenix 1083 330 27- N 1120 04' W I 30-6U 30 10-16
(Arizona)Rod Muff 342 400 09' N 1220 15' W 30-77 30 7-64(Calif.)
hleno 4397 390 30' N 1190 47' W 30-68 30 6-50(Nevada)
Wat .AkA City 4260 400 461 N 1110 541 W 27-30 30 24-26(Uth)
Sau Antonto .792 290 27' N 9P1° 2;11 W 30-71 30 7-50
SiAS Diego 07 320 43' N 1170 10' W 3004U 30 7067
ToUplobampo 10 230 36' N 1090 03' W 15 --(Nextio)
TWNA, ARIZONA 206 3po 40' Nh 111" 36' w tO A4 44
721
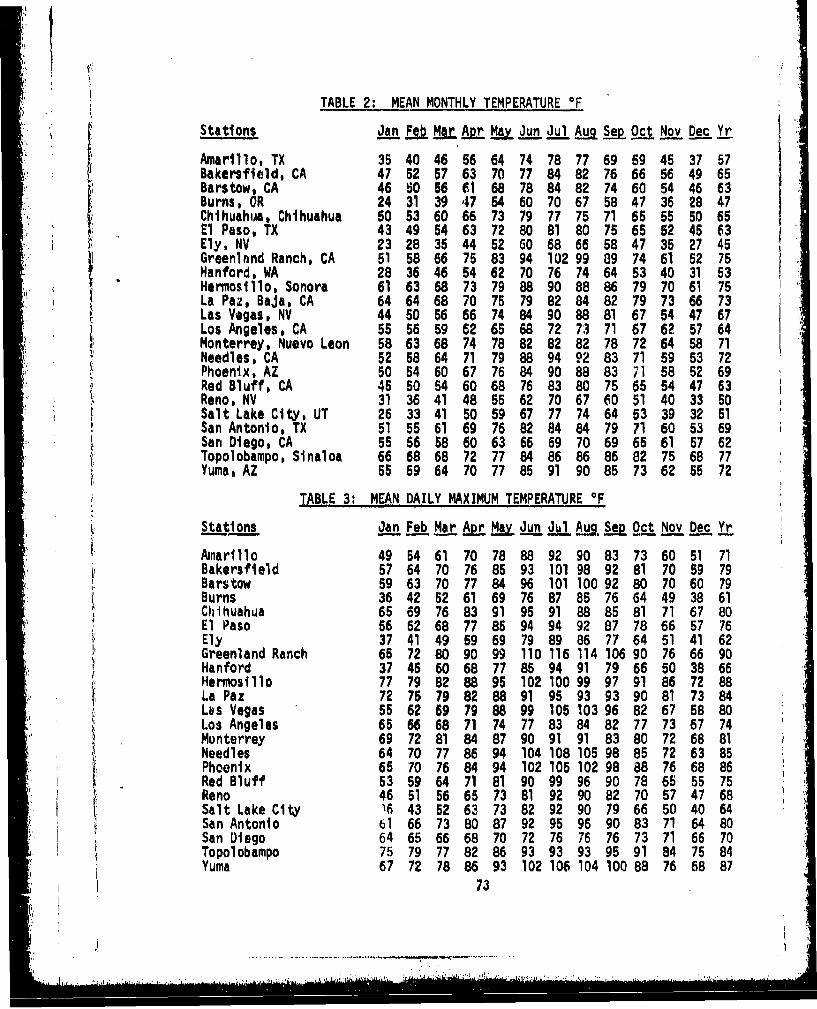
TABLE 2: MEAN MONTHLY TEMPERATURE *F
Stations Jan F Mar Apr may Jun Jul Aug Se Oct Nov Dec Yr
Amarillo, TX 35 40 46 56 64 74 78 77 69 59 45 37 57Bakersfield, CA 47 52 57 63 70 77 84 82 76 66 56 49 65Barstow, CA 46 80 56 61 68 78 84 82 74 60 54 46 63Burns, OR 24 31 39 47 54 60 70 67 58 47 36 28 47I Chihuahua, Chihuahua 50 53 60 66 73 79 77 75 71 65 55 50 65E1 Paso, TX 43 49 54 63 72 80 81 80 75 65 52 45 63Ely, NV 23 28 35 44 52 60 68 66 58 47 35 27 45Greenland Ranch, CA 51 58 66 75 83 94 102 99 89 74 61 52 75Hanford, WA 28 36 46 54 62 70 76 74 64 53 40 31 53Hermosillo, Sonora 61 6368 73 7988 90 88 86 79 70 61 75La Paz, BaJa, CA 64 64 68 70 75 79 82 84 82 79 73 66 73"Las Vegas, NV 44 50 56 66 74 84 90 88 81 67 54 47 67Los Angeles, CA 55 56 59 62 65 68 72 73 71 67 62 57 64Monterrey, Nuevo Leon 58 63 68 74 78 82 82 82 78 72 64 58 71Needles, CA 52 58 64 71 79 88 94 92 83 71 59 53 72Phoenix, AZ 50 54 60 67 76 84 90 88 83 71 58 52 69
• Red Bluff, CA 45 50 54 60 68 76 83 80 75 65 54 47 63Reno, NV 31 36 41 48 55 62 70 67 60 51 40 33 50Salt Lake City, UT 26 33 41 50 59 67 77 74 64 53 39 32 51San Antonio, TX 51 55 61 69 76 82 84 84 79 71 60 53 69San Diego, CA 55 56 58 60 63 66 69 70 69 65 61 57 62Topolobampo, Sinaloa 66 68 68 72 77 84 86 86 86 82 75 68 77Yuma, AZ 55 59 64 70 77 85 91 90 85 73 62 55 72
TABLE 3: MEAN DAILY MAXIMUM TEMPERATURE OF
Stations Jan Feb Mar Apr May Jun Jul AuS. §M Oct Nov Dec Yr
"Amarillo 49 54 61 70 78 88 92 90 83 73 60 51 71Bakersfield 57 64 70 76 85 93 101 98 92 81 70 59 79Barstow 59 63 70 77 84 96 101 100 92 80 70 60 79Burns 36 42 52 61 69 76 87 85 76 64 49 38 61Chihuahua 65 69 76 83 91 95 91 88 85 81 71 67 80El Paso 56 62 68 77 85 94 94 92 87 78 66 57 76Ely 37 41 49 59 69 79 89 86 77 64 51 41 62Greenland Ranch 65 72 80 90 99 110 116 114 106 90 76 66 90Hanford 37 45 60 68 77 85 94 91 79 66 50 38 66Hermosillo 77 79 82 88 95 102 100 99 97 91 86 72 88La Paz 72 75 7982 88 91 95 93 93 90 81 73 84Lbs Vegas 55 62 69 7988 99 105 103 96 82 67 58 80Los Angeles 65 66 68 7174 77 8384 82 77 73 67 74Monterrey 69 72 81 84 87 90 91 91 83 80 72 68 81Needles 64 70 77 86 94 104 108 105 98 85 72 63 85Phoenix 65 70 76 84 94 102 105 102 98 88 76 68 86Red Bluff 53 59 64 71 81 90 99 96 90 78 65 55 75"Reno 46 51 56 65 73 81 92 90 82 70 57 47 68Salt Lake City 16 43 52 63 73 82 92 90 79 66 50 40 64San Antonio 61 66 73 80 87 92 95 96 gO 83 71 64 80San Diego 64 65 66 68 70 72 76 76 76 73 71 66 70Topolobampo 75 79 77 82 86 93 93 93 95 91 84 75 84Yuma 67 72 78 86 93 102 106 104 100 88 76 68 87
73
.. .'. .. .
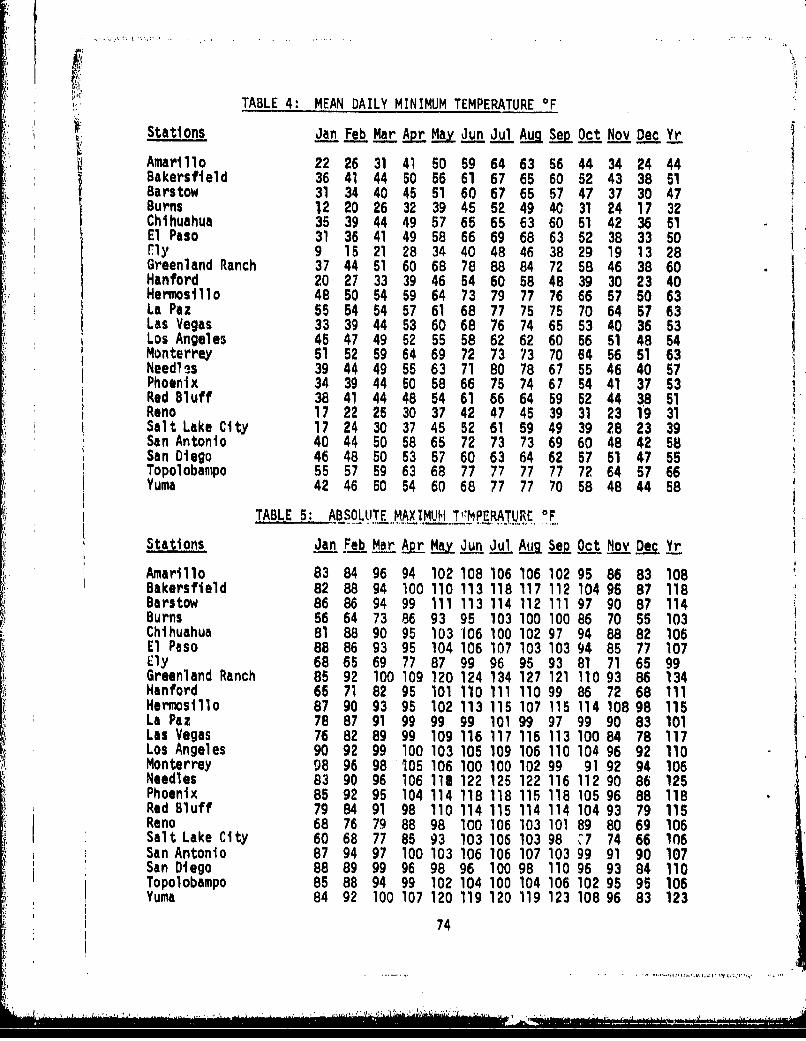
TABLE 4: MEAN DAILY MINIMUM TEMPERATURE OF
Stations Jan Feb Mar Apr May Jun Jul Aug Sep Oct Nov Dec Yr
Amarillo 22 26 31 41 50 59 64 63 56 44 34 24 44Bakersfield 36 41 44 50 56 61 67 65 60 52 43 38 51Barstow 31 34 40 45 51 60 67 65 57 47 37 30 47Burns 12 20 26 32 39 45 52 49 40 31 24 17 32Chihuahua 35 39 44 49 57 65 65 63 60 51 42 36 51El Paso 31 36 41 49 58 66 69 68 63 52 38 33 50Fly 9 15 21 28 34 40 48 46 38 29 19 13 28Greenland Ranch 37 44 51 60 68 78 88 84 72 58 46 38 60Hanford 20 27 33 39 46 54 60 58 48 39 30 23 40Hermosillo 48 50 54 59 64 73 79 77 76 66 57 50 63La Paz 55 54 54 57 61 68 77 75 75 70 64 57 63Las Vegas 33 39 44 53 60 68 76 74 65 53 40 36 53Los Angeles 45 47 49 52 55 58 62 62 60 56 51 48 54Monterrey 51 52 59 64 69 72 73 73 70 64 56 51 63Needlis 39 44 49 55 63 71 80 78 67 55 46 40 57Phoenix 34 39 44 50 58 66 75 74 67 54 41 37 53Red Bluff 38 41 44 48 54 61 66 64 59 52 44 38 51Reno 17 22 25 30 37 42 47 45 39 31 23 19 31Salt Lake City 17 24 30 37 45 52 61 59 49 39 28 23 39San Antonio 40 44 50 58 65 72 73 73 69 60 48 42 58San Diego 46 48 50 53 57 60 63 64 62 57 51 47 55Topolobampo 55 57 59 63 68 77 77 77 77 72 64 57 66Yuma 42 46 50 54 60 68 77 77 70 58 48 44 58
TABLE 5: ABSOLUTE MAXIMUM T7,'MPERA TUR.E, F
Stations Jan Feb Mar Apr May un Jul Aug § Oct Nov Dec Yr
Amarillo 83 84 96 94 102 108 106 106 102 95 86 83 108Bakersfield 82 88 94 100 110 113 118 117 112 104 96 87 118Barstow 86 86 94 99 111 113 114 112 111 97 90 87 114Burns 56 64 73 86 93 95 103 100 100 86 70 55 103Chihuahua 81 88 90 95 103 106 100 102 97 94 88 82 106El Paso 88 86 93 95 104 106 107 103 103 94 85 77 107Ely 68 65 69 77 87 99 96 95 93 81 71 65 99Greenland Ranch 85 92 100 109 120 124 134 127 121 110 93 86 134Hanford 65 71 82 95 101 110 111 110 99 86 72 68 111Hermosillo 87 90 93 95 102 113 115 107 115 114 108 98 115La Paz 78 87 91 99 99 99 101 99 97 99 90 83 101Las Vegas 76 82 89 99 109 116 117 116 113 100 84 78 117Los Angeles 90 92 99 100 103 105 109 106 110 104 96 92 110Monterrey 98 96 98 105 106 100 100 102 99 91 92 94 106Needles 83 90 96 106 118 122 125 122 116 112 90 86 125Phoenix 85 92 95 104 114 118 118 115 118 105 96 88 118Red Bluff 79 84 91 98 110 114 115 114 114 104 93 79 115Reno 68 76 79 88 98 100 106 103 101 89 80 69 106Salt Lake City 60 68 77 85 93 103 106 103 98 V'7 74 66 106San Antonio 87 94 97 100 103 106 106 107 103 99 91 90 107San Diego 88 89 99 96 98 96 100 98 110 96 93 84 110Topolobampo 85 88 94 99 102 104 100 104 106 102 95 95 106Yuma 84 92 100 107 120 119 120 119 123 108 96 83 123
74
J........................ ....--- ----

TABLE 6: ABSOLUTE MINIMUM TEMPERATURE OF
Station Jan Feb Mar Ar • Jun Jul• AuM Sep Oct Nov Dec Yr
Amarillo -11 -16 -3 13 26 38 51 48 32 15 4 -6 -16Bakersfield 14 20 21 30 34 38 46 44 30 31 22 13 13Barstow 12 16 21 30 34 40 50 48 39 27 14 12 12Burns -20 -16 -3 14 19 29 34 31 24 13 -17 -8 -20Chihuahua 17 14 21 25 25 52 55 51 43 32 22 11 1.1
i El Paso -6 5 14 26 36 46 56 52 41 26 11 -5 -6Ely -27 -25 -13 6 7 19 30 27 16 8 -9 -22 -27Greenland Ranch 15 21 30 35 42 49 62 65 41 32 24 19 15Hanford -23 -19 12 20 29 35 42 40 25 17 3 -27 -27Hermosillo 33 33 37 45 50 50 57 57 57 26 38 35 26La Paz 46 47 41 52 54 57 57 57 57 53 51 46 41Lam Vegas 8 17 19 31 38 48 56 54 43 32 15 14 8Los Angeles 28 28 31 36 40 46 49 49 44 40 34 30 28)Ionterrey 26 26 32 45 59 63 68 69 56 48 39 37 26Needles 21 23 28 33 39 46 60 60 40 36 25 23 21Phoenix 16 22 29 32 39 49 61 58 49 36 25 22 16Red Bluff 17 22 26 28 33 42 53 50 43 30 25 17 17Reno -19 -12 -3 13 16 25 35 32 21 13 5 -7 -19,Salt Lake City -22 -ZO 5 14 27 35 41 39 30 18 -14 -21 -30San Antonio 0 4 21 34 44 48 60 57 41 32 22 14 0San Diego 25 34 36 39 45 50 54 54 50 44 36 32 25Topolobampo 46 48 50 52 54 70 66 69 64 59 52 46 46Yuma 22 25 31 38 39 50 61 58 50 38 29 22 22
TABLE 7: MEAN MONTHLY PRECIPITATION (IN INCHES)
Station Jan Feb Mar Apr My Jun Jul AuM Sep Oct Nov Dec Yr
Amarillo 0.6 0.6 1.0 1.5 3.0 3.3 2.4 3.0 2.3 1.9 0.9 0.7 21.1Bakersfield 1.0 1.1 1.1 0.8 0.4 0.1 * * 0.1 0.4 0.4 1.0 6.4Barstow 0.2 0.2 0.2 0.4 0.2 0.5 0.8 0.6 0.6 0.2 0.1 0.1 4.1Burns 1.5 1.2 0.8 0.8 0.8 0.9 0.3 0.3 0.4 0.8 1.2 1.4 10.3Chihuahua 0.2 0.4 0.3 0.2 0,2 1.6 3,6 3.7 3.3 0.9 0.5 0.4 15.4El Paso 0.4 0.4 0.3 0.3 0.4 0.6 1.3 1.3 1.1 0.8 0.4 0.5 7.8Ely 0.9 0.9 1.3 1.2 1.2 0.5 0.6 0.9 0.7 0.8 0.7 0.9 10.5Greenland Ranch 0.1 * 0.1 0.1 0.2 0.1 0.3 0.3 0.2 * 0.1 * 1.5Hanford 0.9 0.6 0.2 0.4 0.4 0.4 0.1 0.2 0.3 0.5 1.0 0.8 5.9Hermosillo 0.1 0.6 0.Z 0.1 0,1 0.1 2.8 3.3 2.5 1.6 0.2 1.0 12.2La Paz 0.2 0.3 * * * * 0.3 1.6 2.9 0.5 0.6 1.0 7.5Las Vegas 0.5 0.6 0.4 0.2 0.2 0.1 0.5 0.5 0.3 0.3 0.2 0.6 4.4Los Angeles 2.4 3.4 2.4 1.2 0.3 0.1 T * 0,3 0.5 1.0 3.1 14.5Monterrey 0.6 0.7 0.8 1.3 1.3 3.0 2.3 2.4 5.2 3.0 1.5 0.8 22.8Needles 0.4 0.7 0.3 0.3 0.4 0.5 0.6 0.5 0.4 0.2 0.1 0.1 4.5Phoenix 0.6 0.8 0.7 0.4 0.2 0.1 0.7 1.0 1.0 0.4 0.5 1.0 7.2Red Bluff 3.7 3.5 2.6 1.8 1.1 0.5 * 0.1 0.3 1.5 2.3 4.2 21.6Reno 1.0 1.1 0.7 0.5 0.5 0.4 0.2 0.2 0.2 0.6 0.6 0.9 7.0Salt Lake City 1.2 1.2 1.7 1.8 1.6 0.9 0.6 1.0 0.7 1.3 1.4 1.3 14.7San Antonio 1.8 1.6 2.1 3.0 3.5 3.2 1.9 2.0 3.4 2.1 1.4 1.9 27.9San Diego 1.7 2.3 1.9 0.8 0.3 * * 0.1 0.2 0.6 0.8 2.6 10.9Topolobampo 0.2 0.3 0.2 * 0.1 0.2 1.6 7.5 2.2 2.9 0.3 2.2 14.0Yuma 0.4 0.4 0.3 0.1 * * 0.2 0.6 0.4 0.3 0.2 0.5 3.4
A Less than 0.05 inch. 75
.......... .................�........• ..--- •- •.- •, .. '..V
P . . . . . . . . . . . .. . . . . . . . . . . . . . . . . . . . . . . . . .. . . . . . . . . . . . .
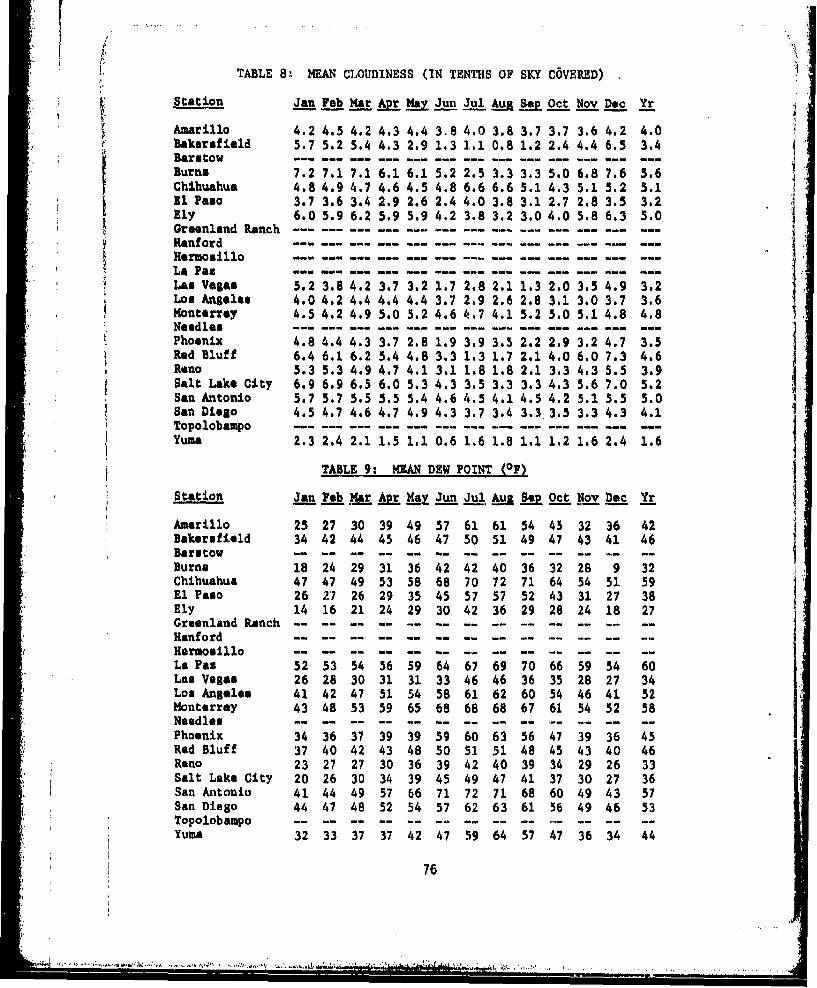
TABLE 8. MEAN CLOUDINESS (IN TENTHS OF SKY COVERED)
Station Jan Feb Mar &r Maj Jun Jul Aa SepEOct Nov Dec YrAAmarillo 4.2 4.5 4.2 4.3 4.4 3.8 4.0 3.8 3.7 3.7 3.6 4.2 4.0
Bakersfield 5.7 5.2 5.4 4.3 2.9 1.3 1.1 0.8 1.2 2.4 4.4 6.5 3.4Barstow 4Burns 7.2 7.1 7.1 6.1 6.1 5.2 2.5 3.3 3.3 5.0 6.8 7.6 5.6Chihuahua 4.8 4.9 4.7 4.6 4.5 4.8 6.6 6.6 5.1 4.3 5.1 5.2 5.1El Paso 3.7 3.6 3.4 2.9 2.6 2.4 4.0 3.8 3.1 2.7 2.8 3.5 3,2Ely 6.0 5.9 6.2 5.9 5.9 4.2 3.8 3.2 3.0 4.0 5.8 6.3 5.0Greenland Ranch----- --------------------------------------HanfordHermosilloLa PazLae Vegas 5.2 3.8 4.2 3.7 3.2 1.7 2.8 2.1 1.3 2.0 3.5 4.9 3.2Los Angeles 4.0 4.2 4.4 4.4 4.4 3.7 2.9 2.6 2.8 3.1 3.0 3.7 3.6Monterrey 4.5 4.2 4.9 5.0 5.2 4.6 4.7 4.1 5.2 5.0 5.1 4.8 4.8NeedlesPhoenix 4.8 4.4 4.3 3.7 2.8 1.9 3.9 3.5 2.2 2.9 3.2 4.7 3.5Red Bluff 6.4 6.1 6.2 5.4 4.8 3.3 1.3 1.7 2.1 4.0 6.0 7.3 4.6
Reno 5.3 5.3 4.9 4.7 4.1 3.1 1.8 1.8 2.1 3.3 4.3 5.5 3.9Salt Lake City 6.9 6.9 6.5 6.0 5.3 4.3 3.5 3.3 3.3 4.3 5.6 7.0 5.2San Antonio 5.7 5.7 5.5 5.5 5.4 4.6 4.5 4.1 4.5 4.2 5.1 5.5 5.0San Diego 4.5 4.7 4.6 4.7 4.9 4.3 3.7 3.4 3.33.5 3.3 4.3 4.1TopolobampoYuma 2.3 2.4 2.1 1.5 1.1 0.6 1.6 1.8 1.1 1,2 1.6 2.4 1.6
TABLE 9, MEAN DEW POINT (OF)Station Jan Feb Mar &r Ma• Jun JuluAUSeOct Nov Dec Yr
Amarillo 25 27 30 39 49 57 61 61 54 45 32 36 42Bakersfield 34 42 44 45 46 47 50 51 49 47 43 41 46Barstow --Burns 18 24 29 31 36 42 42 40 36 32 28 9 32Chihuahua 47 47 49 53 58 68 70 72 71 64 54 51 59El Paso 26 27 26 29 35 45 57 57 52 43 31 27 38Ely 14 16 21 24 29 30 42 36 29 28 24 18 27Greenland Ranch ----- ------ ------ ---- --- ------ --- --HanfordHermosilloLa Paz 52 53 54 56 59 64 67 69 70 66 59 54 60Las Vegas 26 28 30 31 31 33 46 46 36 35 28 27 34Los Angeles 41 42 47 51 54 58 61 62 60 54 46 41 52Monterrey 43 48 53 59 65 68 68 68 67 61 54 52 58Needles --Phoenix 34 36 37 39 39 59 60 63 56 47 39 36 45Red Bluff 37 40 42 43 48 50 51 51 48 45 43 40 46Reno 23 27 27 30 36 39 42 40 39 34 29 26 33Salt Lake City 20 26 30 34 39 45 49 47 41 37 30 27 36San Antonio 41 44 49 57 66 71 72 71 68 60 49 43 57San Diego 44 47 48 52 54 57 62 63 61 56 49 46 53Topolobampo --Yuma 32 33 37 37 42 47 59 64 57 47 36 34 44
76
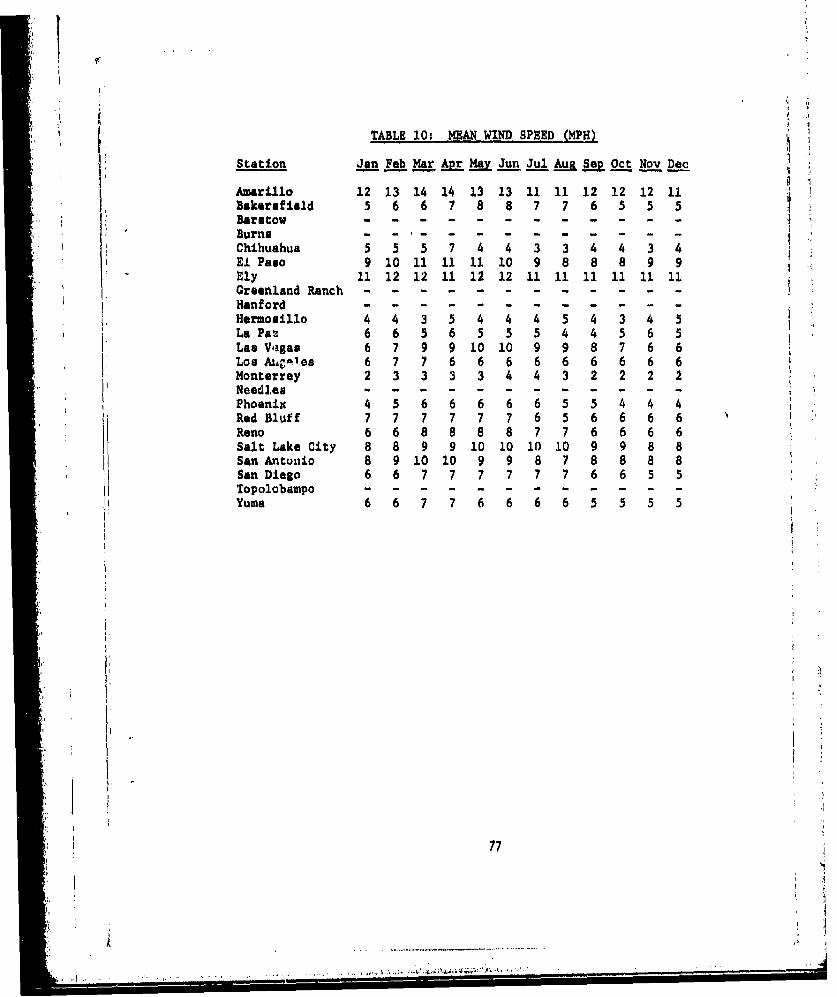
TABLE 10, MEAN WIND SPEED (MPH)
Station Jan Feb Mar A !2 Jun Jul Aul Sep Oct Nov Dec
Amarillo 12 13 14 14 13 13 11 11 12 12 12 11Bakersfield 5 6 6 7 8 8 7 7 6 5 5 5Barstow - . . . . . . . . . ..- -Burns . . .. . . . . . . . . ..aChihuahua 5 5 5 7 4 4 3 3 4 4 3 4
- El Paso 9 10 11 11 11 10 9 8 8 8 9 9Ely 11 12 12 11 12 12 11 11 11 11 11 11Greenland Ranch . . . . . . . . . . . .Hanford . . . . . . . . . . . .Hermosillo 4 4 3 5 4 4 4 5 4 3 4 5La Paz 6 6 5 6 5 5 5 4 4 5 6 5Las Vegas 6 7 9 9 10 10 9 9 8 7 6 6Los ,Acl.es 6 7 7 6 6 6 6 6 6 6 6 6_Monterrey 2 3 3 3 3 4 4 3 2 2 2 2SNeedles . . . . . . . . . . . .Phoenix 456666655444Red Bluff 7 7 7 7 7 7 6 5 6 6 6 6Reno 6 6 8 8 8 8 7 7 6 6 6 6Salt Lake City 8 8 9 9 10 10 10 10 9 9 8 8San Antunio 8 9 10 10 9 9 8 7 8 8 8 8San Diego 6 6 7 7 7 7 7 7 6 6 5 5Topolobampo . . . . . . . . . . . .Yuma 6 6 7 7 6 6 6 6 5 5 5 5
I.'
77
-4

* I -
Ii.
A-9
South America
I78
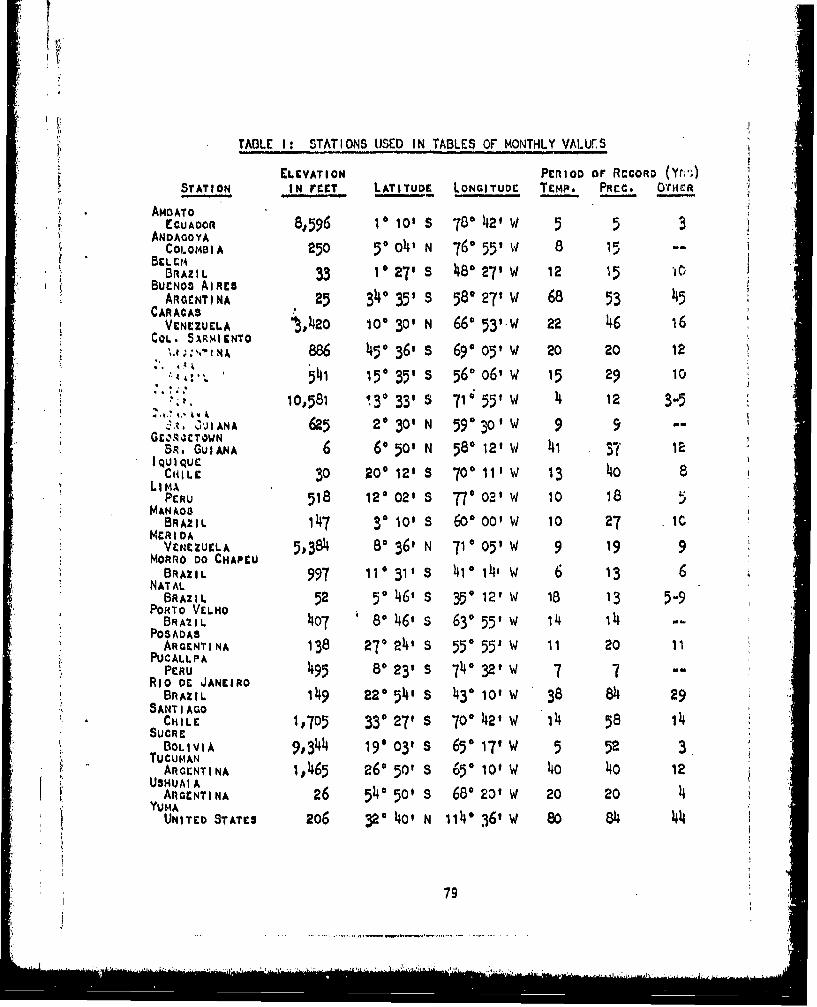
I
TABLE I: STATIONS USED IN TABLES OF MONTHLY VALur.s
TELEVATION PERIOD or R:CORD (Yr.'•)
STATION IN FEET LATITUDE LONGITUDE TECMP. PRCC. OTHi._:. . ANOATOECUAOR 8,596 1 ° 10' S 78° 42,' w 5 5 3
ANDAGOYACOLOMBIA 250 50 o4' N 760 55 1 w 8 15 --
BEL Cr4BRAZ IL 33 1* 27' S 48o 27' W 12 15 10
BUENOS AIRESARGENTINA 25 340 35f S 580 27' W 68 53 45
CARACASVENEZUELA J,420 10° 30' N 660 531"W 22 46 16
COL. SARMIINTO"u 886 450 36' S 69" 05' W 20 20 12
15• 15" 35' s 560 o6, W 15 29 10
"10,581 1.3° 33' S 71 55' W 4 12 3-5",. ŽJIANA 625 2'30' N 59 30 W 9 9 -
Gc%,ROcTOWNSR. GUIANA 6 650' N 58 12'1W 41 12
IQUIQUECHILE 30 20- 12' S 700 11' W 13 4o 8PERU 518 12° 02' S 77O 02' W 10 18 5
S~MANAOSBRAZIL 147 3° 10' S 600 00 'w 10 27 lc
MERI DA"VENEZUELA 5,384 80 361 N 710 05'1W 9 19 9
MORRO DO CHAPEU13BRAZIL 997 11° 31' S 41° 14t' w 6 13 6
NATALBRAZIL 52 50 6' 4 s 39 12, w 18 13 5-9
PORTO VELHOBRAII. 4o7 So 46' s 630 55' w 1 4 --
POSADASARGENTINA 138 27 24' S 55° 55J W 11 20 11
PUCALLtPA
,"
PERU 495 8° 23' S 740 32' W 7 7 --Rio oc JANEIROBRAZIL 149 220 54' s 43° 10' W 38 84 29
SANT I AGOCHILE 1,705 330 27' S 70" 42t' W 14 58 14
SUCREBOLIVIA 9,344 19 03' s 650 171 W 5 52 3
TUCUMANARGENTINA 10465 260 501 S 650 lot w 4o 4o 12
USHUAI AARGENTINA 26 54c 50' S 680 20' W 20 20 4
YUMAUNITED STATES 206 320 40' N 114° 3.6',W 80 84 44
79
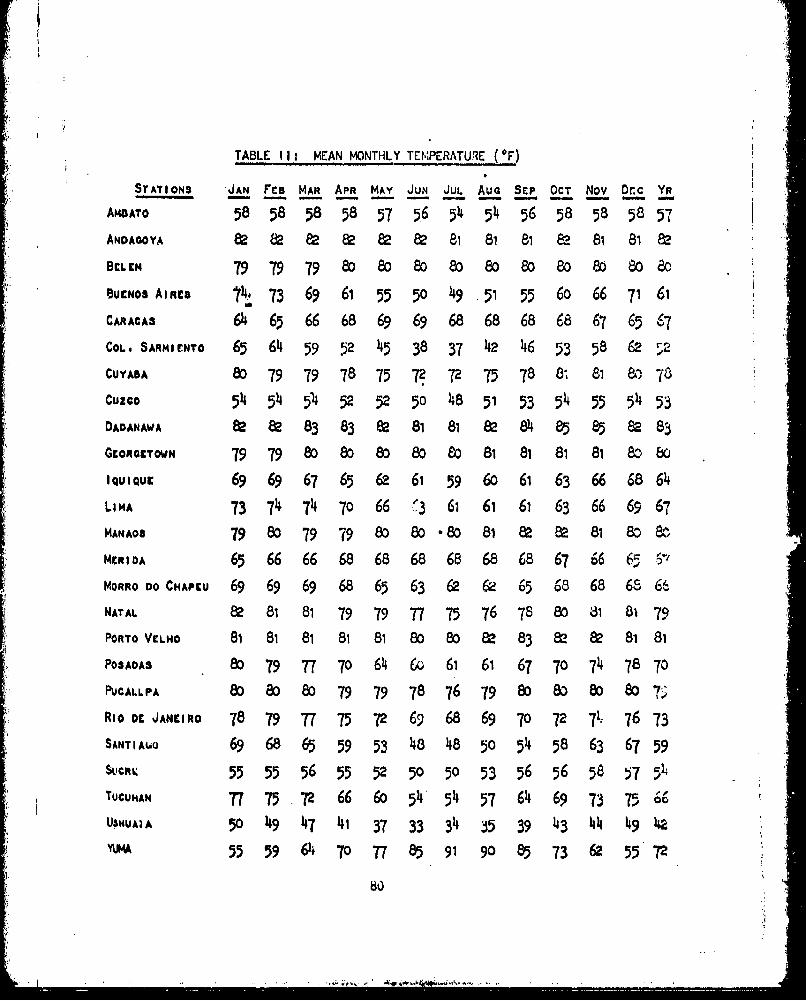
TABLE Il: MEAN MONTHLY TEMPERATUIE (OF)
STATIONS JAN FeB MAR APR MAY JUN JUL AuG SEP OCT Nov Dcc YR
AMOATO 585858 58 57 56 54 54 56 58 58 58 5",ANDAOOYA 82 82 82 82 82 2 81 81 81 e 81 8
BELEM 79 79 79 80 80 80 80 80 80 80 80 8c
BUENO3 AIRES CA 73 69 61 55 50 49 51 55 6o 66 71 61
CARACAS 64 65 66 68 69 69 68 68 68 68 67 65 67COL. SARMIrNTO 65 64 59 52 45 38 37 46 16 53 58 6 5*
CUYABA 80 79 79 78 7572 72 75 78 81 81 P, 78
Cuzco 5 4 54 5" 52 52 50 48 51 53 54 55 54 53
DADANAWA 8 8 83 83 82 81 1 8 84 e•5 •5 s83
GcopocETOWN 79 79 80 080 80 80 81 81 81 81 8o80
IQUIQUc 69 69 67 65 62 61 59 6O 61 63 66 68 64LIMA 73 7 "74 70 66 `3 61 61 61 63 66 69 67
MANAOS 79 80 79 79 80 80 80 1 82 2 81 8o 8t,
MRIOA 65 66 66 68 68 68 68 68 68 67 0 66 61; 5-1MORRO0OCHAPtu 69 69 69 68 65 63 62 6U 65 68 68 68 66
NATAL 8 81 81 79 79 77 75 76 78 80 81 81 79
PORTO VELHO 81 81 81 81 81 80 80 82 83 82 82 81 81
POSADAs 80 79 77 70 64 6o 61 61 67 70 74 78 70
PUCALLPA 80 80 80 79 79 78 76 79 80 80 80 807;
RIO DJANZIRO 78 79 77 75 72 69 68 69 70 72 7k- 76 73
SANTIAWo 69 68 65• 59 53 48 48 50 54 58 63 67 59
sumR• 55 55 56 55 52 50 50 53 56 56 58 ý7 54
TUCUNAN T7 75 72 66 6o 545 57 64 69 73 756USNUA;A 50 49 47 4i1 37 33 34 35 39 143 44 49 49-4
55 59 6 70 77 85 91 90 85 73 62 55 72
V8
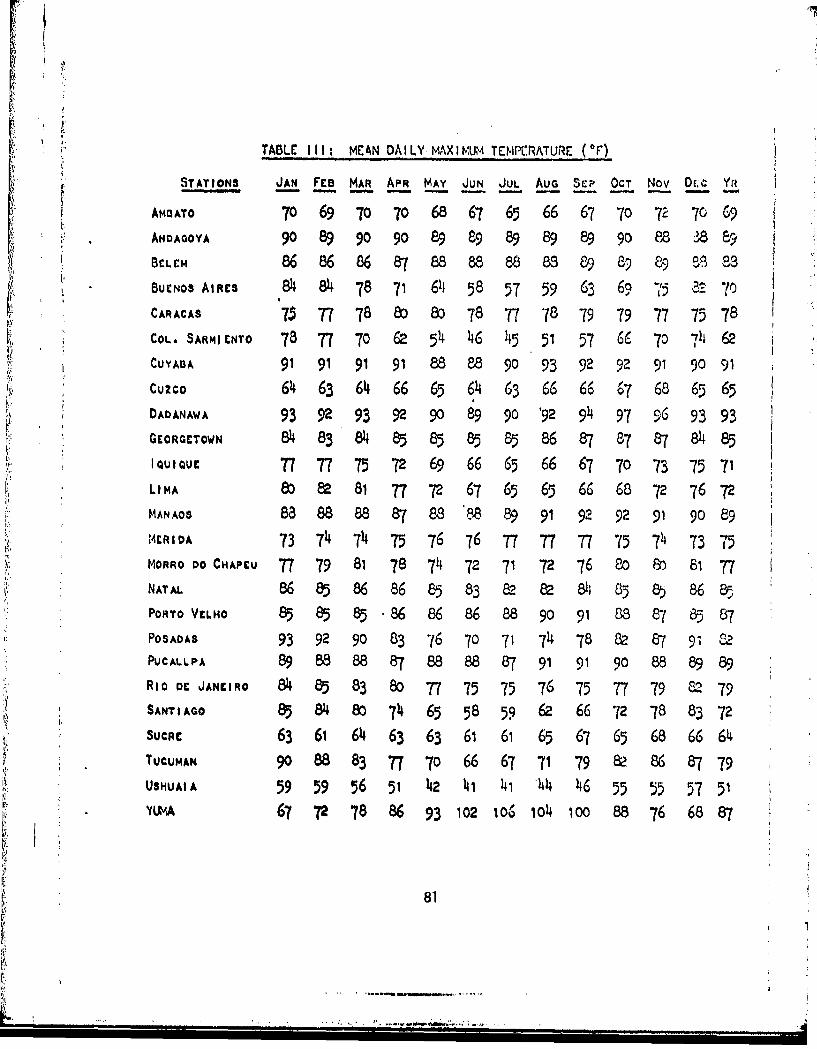
TABLE III: MEAN DAILY MAXIIMUM TEMPKRATURE (OF)
f. STATIONS JAN FEB MAR APR MAY JUN JUL AUG SEP OCT Nov DE;c Yrt
AmOATo 70 69 70 70 68 67 65 66 67 70 72 70 69ANAGOYA 9099090 89 89 898989 90 88 38 9BELEM 8686 86 87 88 88 88 8 89 89 89 8 E. a3
,BuNos AIRES .84 84 78 71 64 58 57 59 63 69 875 8 70CARACAS 7$ 77 78 80 80 78 77 78 79 79 77 75 78COL. SARMiCNTO 78 77 70 62 54 46 45 51 57 66 70 7,4 62
CUABA 91 91 91 91 88 88 90 9392 92 19091
cu2co 64 63 64 66 65 64 63 66 66 68 65 65DAOANAWA 93 92 93 92 90 89 90 '92 94 97 96 93 93
GEORGETOWN 838 4 8 5 85 85 85• 86 87 877 7 A 85
IQUIQUE 77 77 75 72 69 66 65 66 67 70 73 75 71LIMA 8: 8 81 77 72 67 65 65 66 68 72•76 72MAN AOS 83 88 88 87 88 '88 89 91 92 92 91 90 89
ER IDA 73 74 74• 75 76 76 777777 7 5 74 73 75MORRO DOCHAPEU 7779 87 72 71 72 76 80 0 81 77
NATAL 86 85 86 86 85 83 82 8 85 8685
POR'ToVCLHO 85 85 85 86 86 86 88 9o 91 s 87 85 87POSADAS 93 92 90 83 "16 70 71 74 78 82 87 9- C2
PUCALLPA 89 88 88 87 88 88 87 91 91 90 88 8989
RIO8DJANCIRO 8 85 83 80 77 75 75 76 75 77 79 8 79SANTIAGO 8 84 8 0 746 5 58 59 62 66 72 78 83 72
SUCRE 63616463 63 6 61 65 67• 65 68 66 64rTUCUMAN 90 88 83 T7 70 66 67 71 79 a? 86 87 79USHUAIA 59 59 56 51 42 41 41 44 46 55 55 57 51
YLIVA 67 72 78 86 93 102 Io0 w4lo4100 88 76 68 87
81
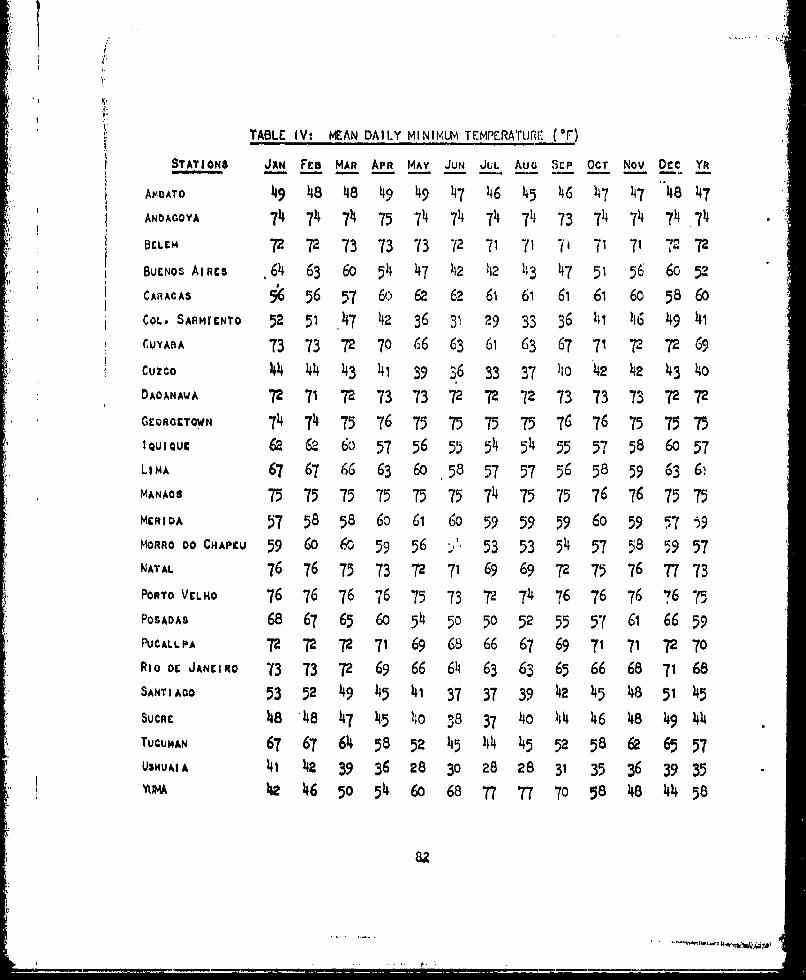
I
TABLE. IV: MEAN DAILY MINIMULM TEMP'RA'TlUr (°F
STATIONS JAN FtB MAR APR MAY JUN JUL AuG SCP OCT Nov Dcc YR
AP-13ATO 49 48 48 49 49 47 46 45 46 47 47 48 47ANDAGOYA 74 74~ 74 75 74+ 714 74+ 714 73 74~ 74 74 .74
BELEM 72 72 73 73 73 72 71 71 7 1 71 71 72 72
BUENOSAiReS .64 63 60 54 47 42 42 43 47 51 56 60 52CARACAS 5 56 57 6c 62 62 61 61 61 61 60 58 60COL- SARMf'NTO 52 51 .47 42 36 31 29 33 36 lio 146 49 41CUYASA 73 73 72 7o 66 63 61 63 67 71 72 72 69
CUZCO 44 4 341+393633 37 )10 42 4.2 43 4o
DADANAWA 72 7172737372 72 73 7373 72 72GEORGETOWN 74 74 75 76 75 75 75 75 76 76 75 75 75IQUIQU 62 Q 6o 57 56 55 54 514 55 57 58 60 57LIMA 67 67 66 63 60 58 57 57 56 58 59 63 6.MANA•S 75 75 75 75 75 75 7 7575 76 76 75 75
MERIDA 57 58 58 6o 61 6o 59 59 59 60 59 97 59MORRO DO CHAPEU 59 60 60 59 56 ','1 53 53 54 57 58 59 57NATAL 76 76 75 73 7 72 69 69 72 75 76 77 73
PORTo VELHO 76 76 76 76 75 73 T2 74 76 76 76 76 "9POSADAS 68 67 65 60 54 50 50 52 55 57 61 66 59PUCALLPA 72 72 72 71 69 68 66 67 69 71 71 72 70Rio o: JANEIRO "3 73 72 69 66 64 63 63 65 66 68 7 68
SANTIAGO 53 52 49 45 41 37 37 39 42 45 48 51 45SUCRE 48 148 47 -I5 110 3 8 37 4o 44 146 48 49 44TUCUMAN 666 582 4541445 52 586265T¢IN67 67 64 58 51, 45 hh 4 z 5 2 65 57u.HUAI A 41 42 39 36 28 30 28 28 31 35 36 39 35YIN 42 46 5 o5 4 60 68 77 77 7o 58 48 44 58
S. . ... ... C"• • • -W • •i , "
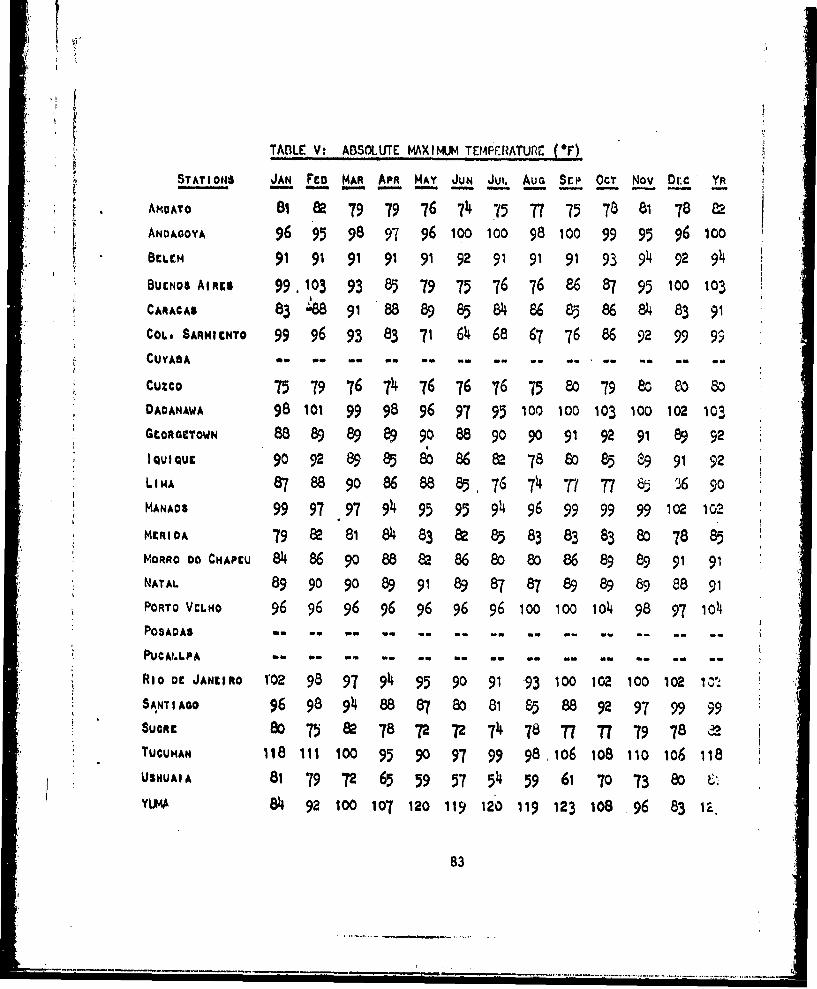
TAKLE V: ABSOLUTE MAXIMUM TEMPFRATU,•E (*F)
STATIONS JAN Fco MAR APR MAY JUN Jut. AUG Sc£ 13OCT Nov -Drc YR
A AHUATO 81 82 79 79 76 74 "15 T7 75 78 81 78 82
AN-AGOYA 96 95 98 97 96 0oo 1oo 98 100 99 95 96 100BELEM 91 9191 92 9 9 91 93 94 92 94
BuENOu Aincs 99,103 93 85 79 75 76 76 86 87 95 i0o 103CARACAS 83. 88 91 88 89 85 84 8685 86 84 83 91CoL. SARNIENTO 99 96 93 83 71 64 68 67 76 86 92 99 9
CUYABA e ".... .. .. .. .. .. .. ... . .
Cuzco 75 79 76 74 76 76 76 75 80 79 eo 8oDAOANAWA 98 101 99 98 96 97 95 100 100 103 100 102 103G EOCRCTOWN 88 89 89 89 90 88 90 90 1 91 989 9 2IQUIQUE 90 92 89 85 886 8 78 o & 85 89 9 2 9LI.MA 87 88 9o 86 88 85 76 74 -" 77 36 9oMANAOS 99 97 97 94 95 95 94 96 999 9 99 102 102
MrRI DA 79 8 81 84 83 2 85 8383 83 80 78 85MoRRo Do CHAU 84 86 90 88 82 868080 86 89 89 91 91NATA 89 90 90 89 91 89 87 87 89 89 89 88 91PORTO VCLHO 96 96 96 96 96 96 96 100 1OO i•4 98 97 104POSADAS -. .. .. .. .. .. .. .. .. .. .. .. ..
PUCAI.LPA - . .. . . a .. .. .. ..
RIo DC JANEIRO 102 98 97 94 95 90 91 93 100 102 100 102 100.
. SANTIAGO 96 98 94 88 87 8o 81889 97 99 99SUCRE 80 75 82 78 72 "7 7 8 77 77 79 78 22TucumAN 118 11i 1oo 95 90 97 99 98 1o6 108 110 106 118USHUAIA 81 79 72 65 59 57 54 59 61 70 73 8o •.
YUMA 84 92 100 107 120 119 120 119 123 108 96 83 1a.
83
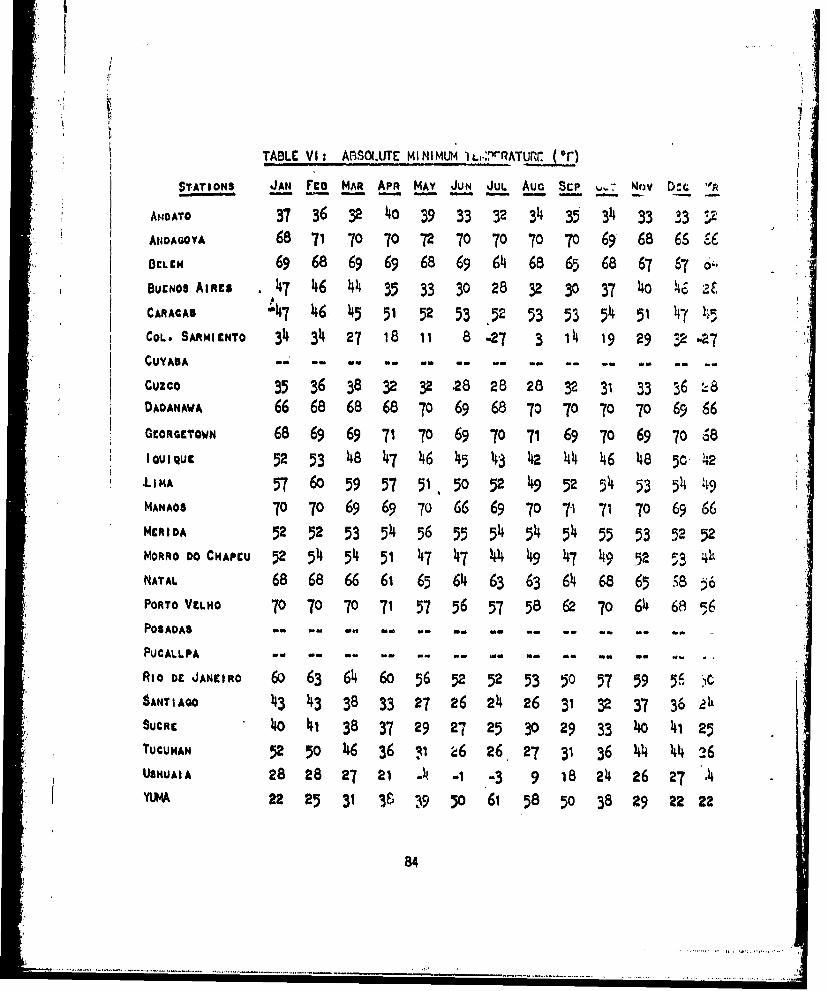
TABLE VI: A 3SMUATE MINIMUM )L.."RTr r_)STATIONS JAN Fcs MAR APR MAY JUN JUL" AU S $1: J, D= "-
AmOATO 37 36 32 40 39 33 32 34 35 34 33 33 !XANDAaOYA 68 71 70 70 72 70 7 70 70 69 68 66 86BELEM6 6968696968 69 6 68 65 68 67 6r( 7 o.BUENOS AItRs 4T7 46 44 35 33 30 28 32 30 37 4)0 • 6ZCARACAS -47 46 45 5 1 52 53 52 53 53 54 51 47 "-,COL. SARMICNTO 34 34 27 18 11 8 -27 3 14 19 29 32 -27
CUYADA -
Cuzco 35 36 38 32 32 28 28 28 32 31 33 36 ;- 6DAOANAWA 66 68 68 68 70 69 68 70 70 70 70 69 66GCORGETOWN 68 69 69 71 70 69 70 71 69 70 69 70 08St autQUc 52 53 48 47 46 45 43 42 4 46 48 50 42LimA 57 60 59 57 51 50 52 49 52 54 53 54•49MANAOS 70 70 69 69 70 66 69 70 71 71 70 69 66MENIDA 52 52 53 51 56 55 54 51 54 55 53 52 52
MORRO 00 CNAPCU 52 54) 541 51 4)7 47 441 4)9 4)7 4.0 52 53 4h~NATAL 6868 66 61 65 61 63 63 64 68 65 58 56PORTO VtLIO 70 70 70 71 57 56 57 58 6Q 70 64) 68 96
POSADAS .. ... am .. .. .. .. .. .. .. ..-----
PUCALLPA a a. . . a- a.... .. ..
Rio DE JANEIRO 6o 63 61 60 56 5 52 53 50 57 59 5 'A,SANTIA 43 43 3 33 27 26 24 26 31•32 37 36 2hSUCRE 4o 1 38 37 29 27 25 30 29 33 4o 1 25TUCUMAN 52 50 46 36 ,i ý6 26, 27 31 36 44 44 26usNuAl A 2828 27 21 -. -1 -3 9 18 24 26 27 .4
;I YUtMA 22 25 31 38 39 50 61 58 50 38 29 22 22
84
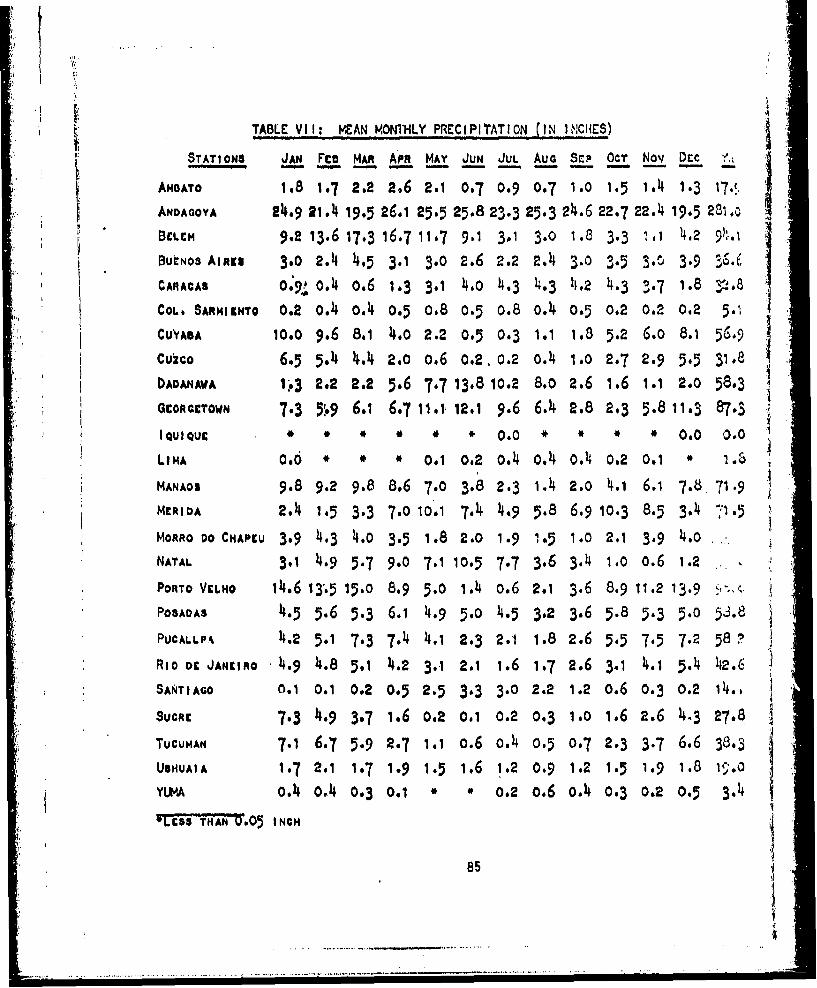
TABLE VII: MEAN MONTHLY PRECIPITATION (IN INcHES)
STATIONS JAN Fca MAR AmR MAY JUN JUL AUG Sep~ OCT Nov Drc
ANoATo 148 1.7 2.2 2.6 2.1 0.7 0.9 0.7 1.0 1.5 1.4 1.3 17.!ANDAGOYA 24.9 21.4 19.5 26.1 25.5 25.8 23.3 25.3 24.6 22.7 22.4 19.5 281.0
BELCM 9.2 13.6 17.3 16.7 11.7 9.1 3.1 3.0 1.8 3.3 1 .-1 -.2 9k.'iBUtNos AiRcs 3.0 2.4 4.5 3.1 3.0 2.6 2.2 2.4 3.o0-35 34C 3.9 3~1
CARACAS o.9:, o.4 o.6 1.3 3.1 4.o 4.3 4•.3 4.2 4.3 -.7 1.8 3`.8 ICOL. SARNIgNTO 0.2 0.4 o.4 0.5 0.8 o.5 0.8 o.4 0.5 0.2 0.2 0.2 5.4
CcuVADA 10.0 9.6 8.1 4.0 2.2 0.5 0.3 1.1 1.8 5.2 6.0 8.1 56.9CukCo 6.5 5.4 4.4 2.0 0.6 0.2. 0.2 o.4 1.0 2.7 2.9 5.5 31.8DADANAAW IP3 2.2 2-.2 5.6 7-7 13.8 10.-2 8.0 2.6 1.6 1.1 2.0 58.3GcoeeorowN 7.3 5..9 6, 6.7 11.1 12.1 9.6 6.4 2.8 2.3 5.8 11.3 87.5
IQUIQUE * * * 0 * 0.0 * * * * 0.0 0.0
MLtA 0.0 * o * 0.1 0.2 o.4 o.4 o.4 0.2 0.1 *
MANAOS 9.8 9.2 9.8 8.6 7.0 3.8 2.3 1.4 2.0 4.i 6.1 7.8, 71.9MRIDA 2.4 1.•5 3.3 7.0 10.1 7. 4.,9 5.8 6.9 10.3 8.5 3.4 ","1.55MoRRO DO CHAP9U 3.9 4,3 4.0 3.5 1.8 2.0 1.9 1.5 1.0 2.1 3.9 4.0NATAL 3.1 4.9 5.7 9.0 7.1 10.5 7.7 3.6 3.4 1.0 o.6 1.2
PORTO V.LNO 04.6 13.5 15.0 8.9 5.0 1.4 o.6 2.1 3.6 8.9 11.2 13.9 .. 1
POSADAS 4.5 5.6 5.3 6.1 4.9 5.0 45. 3.2 3.6 5.8 5.3 5.0 5,3.8PUCAL LPA 4.2 5.1 7.3 7.4 4.1 2.3 2.1 1.8 2.6 5.5 7.5 7.2 58 ?
RIO DC JANEIRO 4.9 4.8 5.1 4•.2 3.1 2.1 1.6 1.7 2.6 3.1 4.1 5.4 42./ 6SANTIAGO 0.1 0.1 0.2 0.5 2.5 3.3 3.0 2.2 1.2 0.6 0.3 0.2 Il., i
SUCRE 7.3 4.9 3.7 1.6 o.2 O.1 0.2 0.3 1.0 1.6 2.6 4.3 27.8 1
TUCUNAN 7.1 6.7 5.9 2-.7 1.1 o.6 o.4 o.5 0.7 2.3 3.7 6.6 38.3USHUAIA 1.7 2.1 1.7 1.9 1.5 1.6 1.2 0.9 1.2 1.5 1.9 1.8 1'.O "
YLUHA 0.4 o.4 0.3 0.1 * , 0.2 o.6 o.4 0.3 0.2 0.5 3.-4*LESS THANQ.05 INCH
85
..................... .. ~ ...

TABLE VIII: MEAN CLOUDINESS (IN TENTHS Or SKY COVRED.)
STATIONI JAN Fee MAR APR MAY JUN JUL AUG SCP OCT Nov De.c YR
ANDATO 7.6 7.5 7.9 7.9 7.9 7.5 8.1 7.9 7.7 7.-4 7.1 7.-L 7.7
ANOAGOYA e ... ... ... .. a . .-0 -... .c . .. e . .. e. .. . ....
BCLce4 6.5 7.14 7.4 7.1 6.1 5.1 4.4 •,.0 3.8 3.9 24.2 5-.3 6.6
BUENOS AIRm' 4.0 •.2 4-. -,0 5.1 5.8 5.0 14.8 4-7 5.3 14.5 4.1
CARACAS 5.f' -.9 5.8 7.2 7.9 8.,4 M.9 7.5 7.1 6.9 7.1 6.; :,.8
COL. SARMIENTo 6.2 6.0 6.14 6.2 6.2 6.2 6.1 5.8 6.2 6.1 6.8 6.4 Y-
CUYADA 7.3 7.1 7.1 5.6 .,4 4-.3. 3.6 3.5 14.8 6.o 6.6 7.- ý .
cuzco 6.4, 6.,4 6.2 5.2 4.4 3.8 3.4 3.14 -7. 5.3 5.14 6.8 5.-1D•AANAVA one am= won ....... a - . .a a- e. a W... ea. .....
GCORGETOWN 6.2 5.8 6.0 6.2 6.3 6.14 6.0 5-7 5-.3 5.6 5.8 6.3 P.o
lQUIQUC 4.8 3.6 3.6 4.o 5.7 7.9 8.5 8.-5 8.2 7.0 5.7 4•.3
LimA 5.9 5.6 4.8 -.7 6.2 8.2 8.9 9.1 8.6 7,9 6.5 6.0 t.i
MANACI 6.6 6.9 6.8 6.9 6.6 6.3 5.5 6.0 6.o 6.3 6.4. 6.7 6.4
MERIDA t. ae e.. mo .ae w ea. Maw. Maw. Me... "am .. ...
MoRRo oo CHAP, u 5.6 6.2 5.8 5.8 6.0 5.8 5.9 6.0 5.4 5.7 5.9 6.2 5.-9
NATAL 5.0.1 5.14 5..1 5.8 5.8 6.1 5.1 14.7 14.2 14. 14.14 5.0 5..
PORTO VELHO ace .. " .Maw a"..... e.a eec Mae ae e e....... f -a.
POoAAI 5.2 5.2 4.9 5.2 5.1 5.8 5.4 5.3 5.5 5.1 41.4 5.1 5•.2PUCALLPA "eN . .e. ww -.. -" a ... a. e.aw. . ae a. ---- ----. ---.
Rio PC JANEIRo 6.6 5.9 6.o 5.9 5.6 5.3 5.0 5.6 7.o 6.9 6.9 6.8 1.1
SANTIAGO 1.7 2.2 2.2 3.7 6.3 6.8 5.8 6.2 5.7 5.0 3.6 2.: 4...
SucRE 8.5 8.6 7.2 5.5 4.4 4. 1 4.O 3.3 5.2 7.2 7.7 8.o 6. 1
TUGUMAN 5"9 5.9 6.0 5.9 5.o0 4.4 4.o 3.0 2 4.o 5.3 5-4. 5.5 5.0
UGNUAIA 6.9 6.6 6.3 5.9 6.4 5.8 5.9 5.6 5.9 6.5 6.6 7.1 6.3
2- 2.3 2.14 2• 1 1.5 1.1 0.6 1.6 1.68 1.1 1.2 1.6 2.14 1.6
86
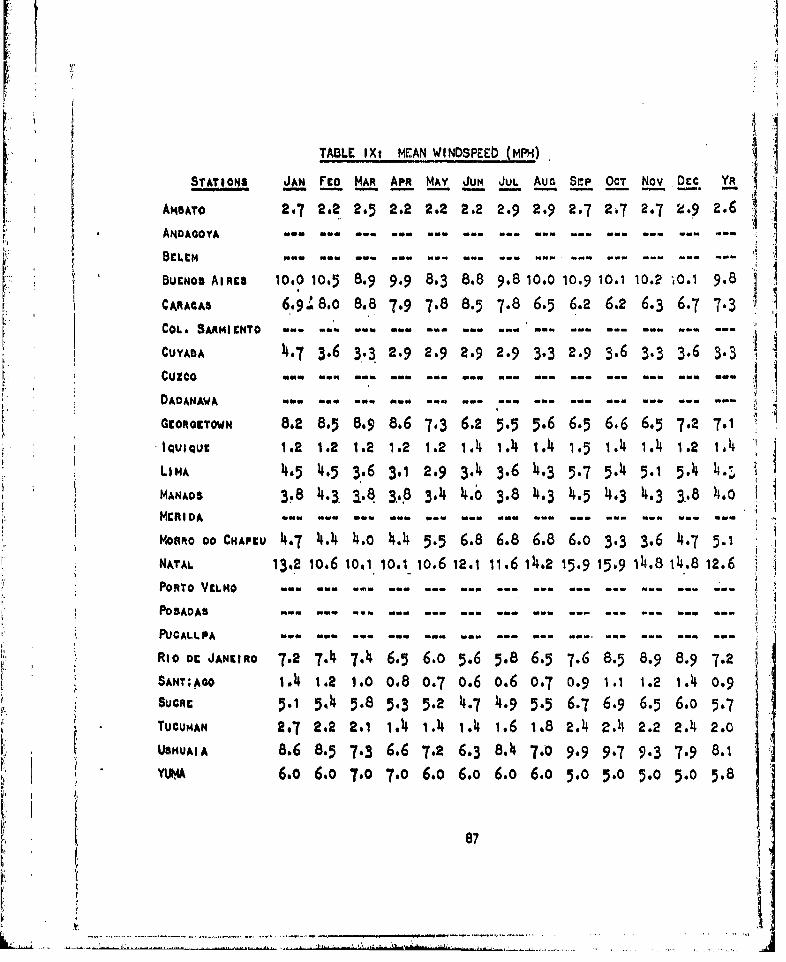
TABLE lX: MEAN WINDSPEEIb (MPHI)
STATIONS JAN Fea MAR APR MAY JUN JUL AuG Sep OCT Nov Dec YR
AMBATO 2 . 2.5 2.2 2.2 2.2 2.2. 272727 9 2.
BELEMOT mum ON. -a -. N. ft" NO............
BUENOs AIRES 10.0 10:5 8.9 9:9 8:3 8:8 9:8 10.0 10.9 10.1 10.2 -,0:i 9.8
CARACAS 6-'.9.8 8.8 797885786.5 6.2 6.2 6.3 677.3COL.. SARMI ENTO ... ... .m. ... .. .. .
CUYABA 4,7 3.6 3.3. 2.9 2.9 2.9 2.9 3.3 2.9 3.6 3.3 3.6 3.3
DADANAWA ""a "am O ANN "am m Nm..a-a ."e .e ..m . ... ... eNo-
GEORGETOWN 8,2 8.5 8.9 8.6 7.3 6.2 5.5 5.6 6.5 6.6 6.5 7.-2- 7.1
LiHmA 4.5 4.5 3.6 3.1 2.9 3.4 3.6 4.3 5.7 5.4 5.1 5.4 4.i.
MANAOS 3.8 24.3, a.4 3.P 3.4 4.6 3.8 24.3 4.5 4.3 4.3 3.8 4-0MEN I DA "mm a." ui a SS wOft "NO W. .- -------------------- --mu --e
MORRtO 00 CNAPtu 4.7 4i.4 4.o 4.4 5.5 6.8 6.8 6.8 6.o 3.3 3.6 24-7 5.1aNATAL 13.2 10.6 i0,l 10.1 io.6 12.1 11.6 14.2 15.9 15.9 124.8 14.8 12.6
PORTO VELNO m am"e m.0. me. a.m Win0 mum --- --- ---e--
POSADAS No- m0"No..... .. n. .m a- - -- --- --- m --
PUCALLPA mNo mum "to. -umft . mum "a" mew a m . . ...... .. .....
Rio DC JANEIRO 7.2 7.4 7.4 6-5 6.0 5.6 5.8 6-5 7.6 8.5 8.9 8.9 7.2SANT;AGQ 1.4 1 .2 1.0 0.8 0.7 0.6 0.6 0.7 0.9 1.-1 1.2 1-4 0.9SUCRE 5.1 514 5.8 5.3 5.2 4.7 41.9 5. 6.7 6.9 6.5 6.0 5.7TUCUMAN 2.7 2.2 2.1 1.4 1.4 1.4 1.6 1.8 2.4 2.4 2.2 2.4 2.0
USH4UAIA 8.6 8-5 7.3 6.6 7.2 6.3 8.41 7.-0 9.9 9.7 9.3 7.9 8.1YLK6.o 6.0 7.0 7.0 6.o 6.o 6.o 6.0 5.0 5.0 5.0 5.0 5.8
87
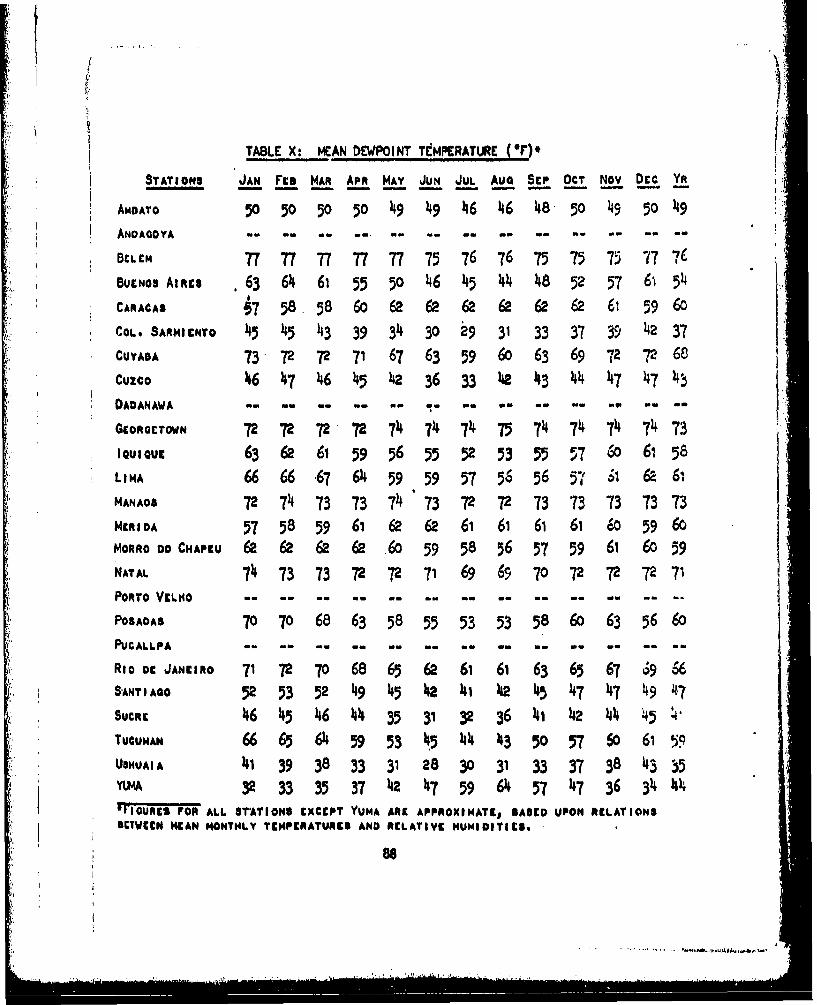
TABLE X: MEAN DEWPOINT T&PEPRATURE (of)*STATIONS JAN FIe MAR APR MAY JUN JUL Aua SEP OCT Nov Dec YA
AMoATO 5 50 50 50 49 49 46 46 48 5o 49 50 49ANDAGOYA -- ... .- - -.. -. -
BECLEM 7T 77 7777 T7 75 76 76 75 75 75 77 76BUENo AIWES 63 64 61 55 50 416 45 44 48 52 57 6' 54CARACAS i7 58.5860 62626262 62 6261 59 60
Co.. SARMIENTO 45 45 43 39 34 30 29 31 33 37 39 42 37CUYADA 73 72 72 71 67 63 59 60 63 69 71 2 68Cuzco 46 47• 46 45 42 36 33 42 434 44 7 47 •.DADANAWA 0. ma Ca
GEORGETOWN 72727T272 74 74 7475 7474 74 7473
iuoi636261 595655 52 53 5557 6061 58LIMA 66 66 67 64• 59 59 5 56 56 57 1 62 61MANAOS 72 74 73 73 74 73 72 T-2 73 73 73 73 73
MORRO 00CI4APEU 62 62 62 62 .60 59 58 56 57 59 61 60 59
POSADAS 70 70 68 63 58 55 3 53 58 •63 566
RIO DE JANEIRO 71 72 70 68 65 62 6 1 6 63 65 67 69 06SANTIAGO 52 5352 •9 45 42 111 42• 45 47 47• 49 47SUCRE 46 4546 4435 31 3236 41 42 44 45
TUCUMAN 66 65 645953ý5144 43 5057 6061 59USHUAIA 41 3938 33 312 8 3 31 33 37 38 43 35YUM O 32 33 35 37 42 47 59 64 57 4 7 36 34
FIGUREns"rOF ALL STATIONS EXCEPT YUMA ARE APPROXIMATE9 SASED UPON RELATIONSB[TWEEN 14CAN MONTHLY TEMPEIRATURCE AND RELATIVE HUMIDITICS.
as
A-1 0
Southerrn Africa
89
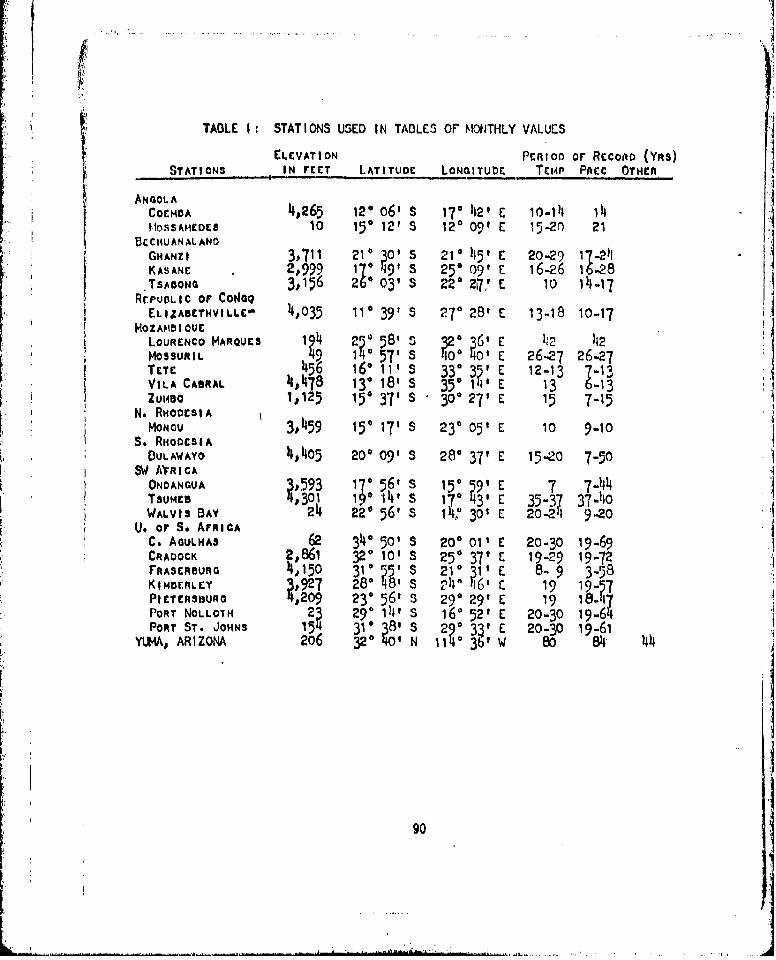
TABLE I: STATIONS USED IN TABLES OF MONTHLY VALUES
ELEVATION PERIOD or RECOAD (YRS)STATIONS IN FEET LATITUDE LONGITUbE TE,4P PnC OTHER
ANGOLA
COAMN A 4,265 120 o6' S 1710 12' E 10-111 11MOSSAHEDES 10 15- 12' S 120 09' E 15-20 21
BECHUANALAN3GHANZ 3,711 21': S 5 210 }45' E 20-29 1"-2)1KASANIE 2p9. 1Z" •9' S 25: 09' 16-26 T28TSADONG 316 03' S 22 217,' E 10 14-1"7
RPUDLIC or CoIOQELIZABETHVILLC10 4,035 110 391 S 27° 28' E 13-18 10-17
MOZABIOQUE' URENCO MARQUES 24 ' 58: S F2* l6 112 42
MOSSURIL ° 57 s O f E 26-27 26-27[.TECr 18 S 132-11 33: 12-13 Z-1VILA CABRAL 11)478 13: 18 S 35 1 E 13 -ZU14o 1,125 15° 370 s . 300 27' E 15 7-15
N. RHOOcSlAMoNRu 3,459 15' 17' S 230 05' E 10 9-10
S. RHODESIABULAWAYO 14,4105 20" 09' S 28- 37f E 15-2.0 7-50
SW AVRICATuna ~ 301 19 1S 17 35-37 37"-40WJALVIS DAY 24 220 56' s 140 30? E 20-211 9-20
U. or S. ArticAC. AOULHAS 62 3140 50' S 20° O01 E 20-30 19-69CRADOCK 2,861 320 10' S 25- 37 t : 19-29 19 --2FRASCROURO 4,1Y5o 3: 5' S 210 1 E 8- 9 3-58KIMBE.RLEY J,927 28 56' S 291 29 &, 19 195P1 CTERStURG 29 2:5,S 29 9 9 1-1PORT NOLLOTH 23 290 Of1 s 160 52' E 20-30 19-6)4PORT ST. JOHNS 154 31: 8 S 0 19-613 N 2. 3° 20-30 9 .
YUI4A, ARIZONA 206 N 11)40 36' w 84- 44
90

TABLE II: HEAN 1O(ITHLY TEMPERATURE OF.
STATIONS JAN Feb MAR APR MAY JUN JUL AUG ScP OCT Nov DEC YR.
ANGOLACOCM1A 71 70 70 68 6 6058 62 66 LO 70 70 6611OSSAMEDC3 72.75 76 741 72 68 62 641 65 ~870 76 64
BCCHUANAL ANDGHANZI 7887674167 605)155 60 6673 75 668K AS AN 7878757 J3 386 9117TSADONG 79 767 3 58 3152 1 97 55
RcPUBLIC OF CON•O,ELIZABETHVI LLC. 72 72 T2 68 66 62 •2 64 70 74 76 711 69
MOZAMBI QUELo•uRENco MARQUES 82 781 72 68 70 7- '6 78 80 82 76M03SURI L 814 8 3 767 72 73 ;6 78 82 8 4
VILA CADRAL 68 7871 72 868ZUMsO 81 79 74 69 68 72 80 8 7H
N. RHODESIA 7MONGU 7676 71473 67 62 6~4 7D74807876 72
So RHODESIAULAWAYO 72 71 69 68 62•58 58 62 67 71 711 73 67
SW AFRICAONDANGUA 78 7-79 6 1170 75•78 78 71TsuMEB J8 767170614660 06b 727877 1WALVIS BAY 870 77070 66 63 63 6 576
U. or S. ArnicaC~o SArRcAS 66 6866 64 62 62586o58 6n 6265 63CRADOCK 74 736964 56 49 5055606)16926FRASEROURO 72 72 68 58 50 15 3 6 52 50 61 6? 58KINBERL'cy 76 711 P8 62 55 50 50 541 60 66 70 74 63PIETERSOURG 20~ 63 7 2 52 62 68 7 06PORT NOLLOTH Z6165 6 62 60 62 6462 6 63PORT ST.JOANS 72727271 706766686 686970
MIA ARIZONA 55 596170 77 85 91908573 Q55
IA
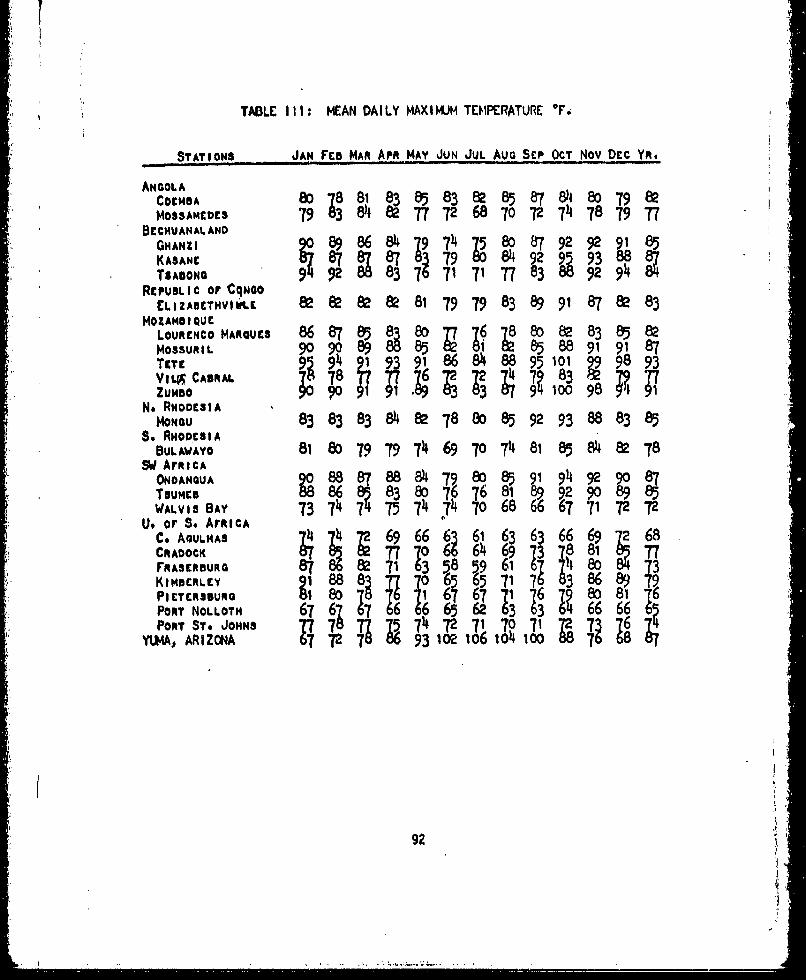
TABLE I I I: MEAN DAILY MAXI KUM TEMPERATURE *F.
STATIONS JAN Fcr, MAR APR MAY JUN JUL AUG SEP OCT Nov DEc YR.
ANGOLAcOM.A 80 8 81 838583 82 85 84 80 79 82MOSSAMEDES 79 r3 8)482 77 72 68 70 72 74 78 79 77
BECHUANAL.ANDGEHUANALNO8 86 84 ý9 7L580 8792 92 9818 85
KASANE 7 84929g 938 84TSADON8
REPUBLIC OF CqNOOLIZABETHTV.LE 82 & 81 79 79 83 89 91 87 8a 83
MOZAMI4IQUELOURENCO MARQUES 86 87 85 82 8o 678 80 82 83 85 82M0OSURIL 90 89 785 082 85 91 91 87
TTCuu~ 7g 9 1039
90r 9 949199 86 8488 95 101 29998 93VILq'CABRAL 7i87 77 277 79 83 827977ZUNDO 0 91 91. 8383 94100o98 1 91
N. RHODE31AMONGU 8383 83 8 82 78808592 93 88 8385
S. RHODESIABULAWAYO 81 80 7979 746970 7481 85 8)48278
SW AFRICAONDNQU g 888788 4 7 8 "r9194 9290 87
TNOAN:U_ 92 908 5WALVISBSAY 73 74 771 75 74 747068 6667 71 7272
Uor S. AFRICAC. AGULHAS 74 47 6 66 63 61 63 6366669 7268CRADOCK 7 517779 6 64 69 737881~ 7FRASCRBURG 87 8682 71 6 8 59 61 6 1 80 73
KIMBERLEY 188377065 65 71 76 83 86 -89 79POETER35URG 81 078 161 67 67 71 76 8o 81 6PORT NOLLOTH 6j 67 65 62 3 3 66 66PORT ST. JOHNS 71 707 62
YUWAO ARIZONA 893 102 166 80 1
92;• J I
Sg2 .__
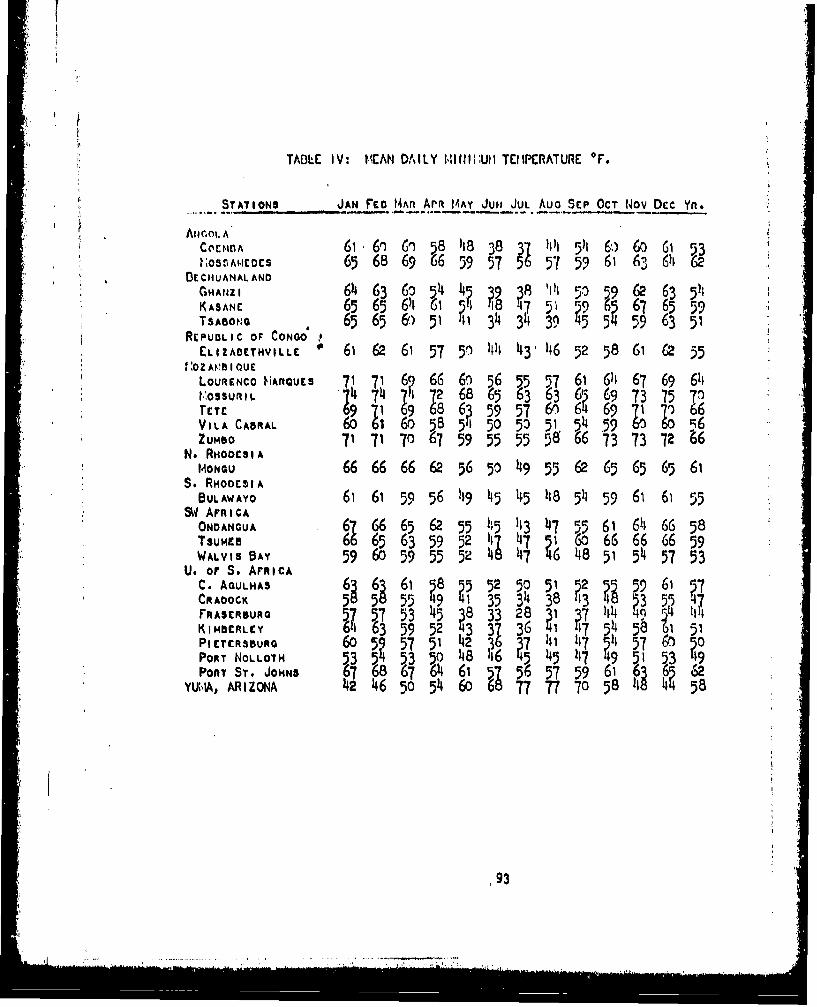
I TABILE IV: IrCAN DAILY M11IN;UIH TElIrCRATURE OF.
STATIONS JAN FED co n Arm 14AY JuH JUL AuG SEP OcT Nov Dcc Yn.
C*C-D 60 1 )6) 848 383 1115 6o 6o 6 1 5_3IiOSSIICDES 65 68 69 66 59 57 5 57 59 61 63 614 U6
DECIHUANALANDGHAUZ I 6A 63 6o 561 1453 87I535 26 1KASANC 6• 65 6A1 7 .57 5 g 67 65 59
56 65 6 ?1 51 J, 34 34 39 ý5 54 59 63 51SRuEPuDLIc OF CONGO ;
ELIZAOETHVILLE 61 62 61 57 51 )14 )43' 146 52 58 61 62 55:OZ AMIB I QUE
LouRENCO MiARQUES 71 71 6 66 6 566 55 57 61 6A1 67 69 6141:OSSUrtI L 74 714 72 68 6~63 63n6 699 73 75 70)Tcic 69 ji 698 63 5 57 6' 669 6 1 7 66VILA CABRAL 60 1 8'1~ r,58 54~ 50 50 51 514 59 i 6 5Zumao 71 71 70 759 55 55 5866 73 73 72 6
N. RHoODsIA|MONNU6 6666 6662 56 50 •49 55 62 65 65 65 61
,. RHODCSIABULAWAYO 61 61 59 56 149 45 45 48 551 59 61 61 55
"S4 ArnicAONDANGUA 6766 65 6255 " 5 143147 5561 61466 58Tsumms 66 65 63 59 52 111 17 ý 1 60 66 66 66 59WALVIS BAY 596 59 55 524 7 6 48 51 54 57 53
U. or S. AFRICAC. AGULAS 6 63 61ý 5 555 5 15 5 9 65 2
YU,,, R•ON59 • 50 pL Li 59 61 777o5CRAOK 5855 49 41 35 31438 43 118 3 55 47FRASERSUNG 57 57 53 145 38 33 28 31 r7114~ t4 III1KIMBERLEY 61 63 59 52 [13 37 6 1 1 514 58i 51PIETERSBURG 60~ 57 51 74 31 47 14 5 n?PORT NOLLOTH 5350 5 148 146 14 11 5PORT ST. JOHN$ 676867 6 146 5 56 57596 1636 6
YUMA, ARIZONA 142 146 50 4 6 8 77 77058 Ij~1 586
193
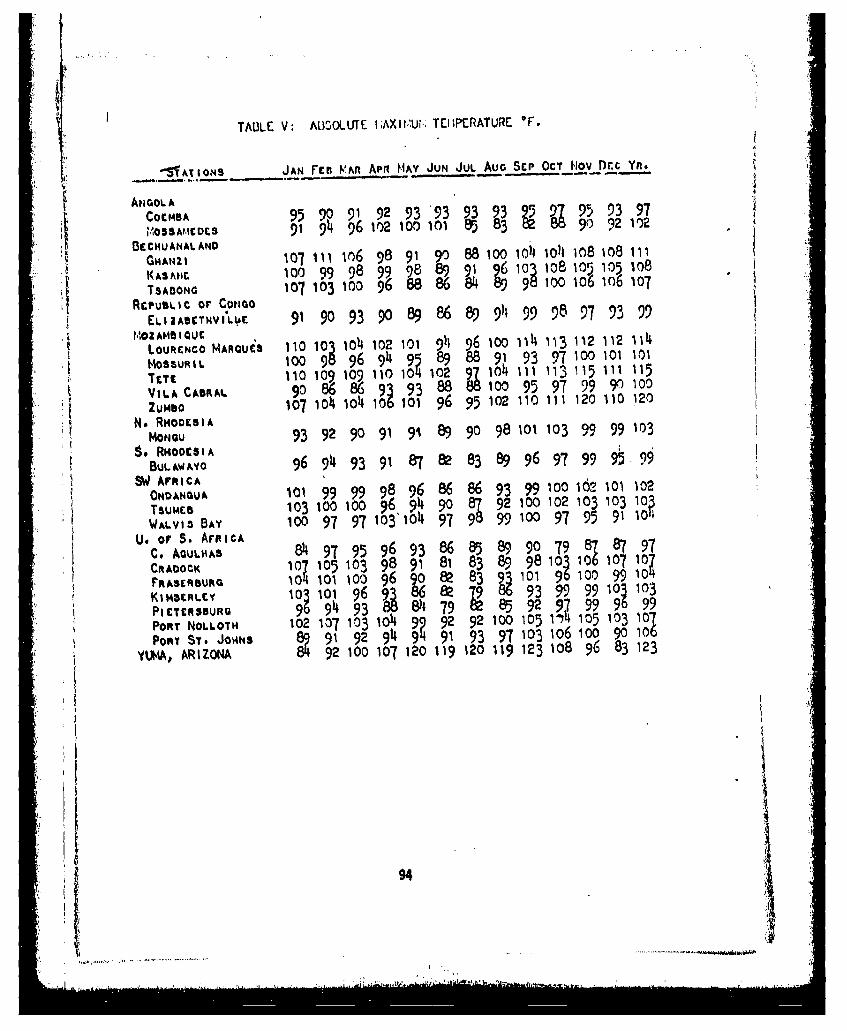
CO00B 95 91 98 93 893 91 96 906 93 107
Ei'45AMDSCTVL. 91 90 93 90 89 86 89 a), 99 9 o r47 93 99
LOURNCO MAQE11 10 3 11 u1 2 106 9 91 90 96 100 1041 410 108 112i11
KA53URI 100 g 98 9691 98 89 8891 9613 978 100 105 101
TSADONG90868310 69 100959799 90100 o6m6io
ZuuRsNO MAQi 107 101 1041 102 101 ý 96 9102 114 113 1120 110 120
MOSSUI 93o 92 96 9149 89 90 98013 99 990103 0
19ANA1001 99 9908 96 86 1 86 939g0 o~0 102TsIP, 103RA 1001 100 95 997 920120309 0
WALVm 8A 107 04 97 16796 9 10320 100 971 950 910 120
CAcuLA 931 92 95 91 91 6 8 89 90 781110 #9 99 903
BL&WAYOC 107 905 903 981 871 83 89 9810 97 99, 1070
OND103U 101 96 9 3896 86 786 93 99 9100 103 0 0
PoTS NOLLOT 102 1607 103 1096, 99g 92 92 100 105 M31 0 103 107
WALVI. tS 89Y 910 92 97 0 6 97 9193 9130100975 90106
C.MA ARZONAS 84 9270 107 920 118 89 120 119 1308 96 8312
1 9459 9 911ý9

TABLE VI: ABSOLUTE MINIIUH TEhMPERATURE OF.
STATIONS JAN FeB MAR APR MAY JUN JUL AuG Sep OCT Nov Dtc YR.
ANGOLA
AGL148 514 146 453 27 ~3COCMD ýO Pl 38113 52M033AMEDCO 57 58 514 53 51 30 ~17 4 2 44?
EBCCHUANALAND
GHANZI 145 1414 I1i 31 21 20 16 211 29 It 42 45 16K A3ANE 501437 3132 31 39 495It 2 31TSADONG 741121
RepueLic or CONGO 7 23EL2IABCTIMVILLC 50 54 46 4i 38 311 33 .33 37 115 51 54 33
MOZAMBIQUELOURENCOuARQUES 61 626• 52 46 4 7 46h2 53 52 59 15MossuftIL 6766 68 63 ý6 ý3 535 0 25 58?TETE 1454614852 45 46 14550 50VILA CABRAL 50 29 48 2 2 1490 P1 50 52 o 45
N. RHODESIAMONOU 61 6259 52142 323742 45 57 5256 32
BUL AWAYO 49 46 48 38 33 28 32 32 37 44 119 51 28S Arm tCA
ONOANQUA 14534ý 47 32 30 30 31 39 14 2 It4 3051 5WALVS BAY9 4 27 25 3m 37 9 2
WALY3 BY 4 145143 35 35 25 t3 32 43 45 25U. or S. ArniCA
C. AGULHAS 417 148 149 141 1)o 412 39 14o 10o 1 l1i 141 39CRADOCK 40 140 38 30 25 19 20 23 214 31 314 39 19FRASPRBURG 142 830 22201615 21 2333 5 15PI($ MDRLEY 4 143 40 30 23 22 20 21 25 31 36 T3 20PI(MCTRLIR 145h 14014 32627 21 21 28 2 839401 21PORT NOLLOTH 134 o ý
PORT ST. JOHN$S 45 25 24 64 3ýYUj ARIZONA 2225 31 38 39 505 38292222
95
4,
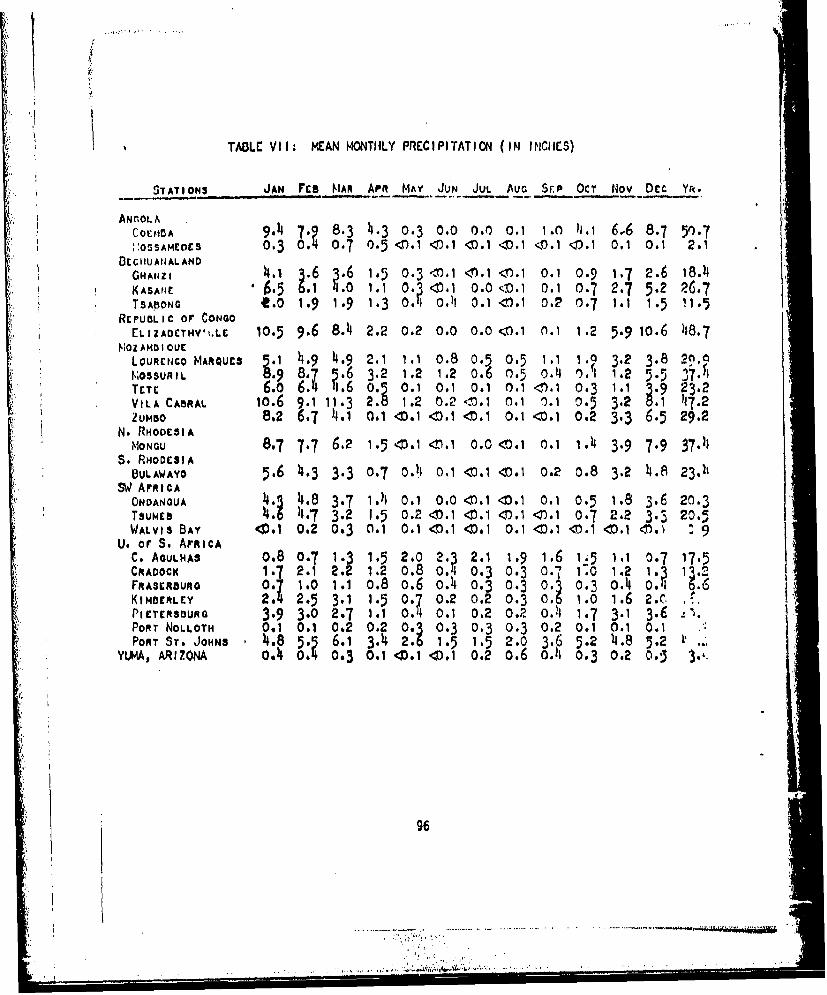
* TABLE V I: I MEAN MONTIhLY PRECIPITATION (I N INCHES)
STATIONS JAN Fro MAR APR MAY JUN JUL AUG Spr OCT Nov DcC YR.
CO•,,•A 9.h 7.: 8.3 h.3 0.3 0.0 o.o 0 .1 .o h. 1 6,6 8.7 50-.7:O,0SAMEDES 0.3 0 . 07 0.5 <).1 -.1 -0.1 - 1 - - .1 < 3I1.1 0.1 0.1 2.1
DECHIUANALLANDoHAIZ, 1 :6 15 0.3 -rI )1 <)I 0.1 0.9 1.7 2.6 18.4KASANG 5 1.9 0 1.1 0.• <0, 0.0 ;oX1 0.1 0.7 2-7 5•2 26.-7TSAbONc e,0 1,9 1,9 1,3 0, ,-)3 0.1 <)).1 0.2 0.7 1.1 1.5 11.5
REPUBLIC OF CONGOELIZAOCTHV'l.LE 10.5 9.6 8.4 2.2 0.2 0.0 0.0 <0.1 0.1 1.2 5.9 io.6 )18.7
t;OZ AM1I QUEL•oURCo MARQUE : 5 .9 4.9 2.1 1.1 0.8 0:5 0.5 1.1 1:. 3. 3 3-8 2.0.I'OSUIL 8 .7 3.2 1.2 1.2 .6o •.5 o. 4 .1 1.2 5.5 f.ThTETE 66.o ' .65 0.5 o 6.01 0 .1 0 .1 0 .1 < .1 0 .3 1.1 3 23.2VILA CABRAL 10.6 9.1 11:3 2.8 1.2 0.2 '-n.1 0. 1 '). 1 0.5 3.2 8.1 ?17.2UM1o0 8.2 6.7 111 0.1 40.1 <D.1 -0.1 0.1 <1.1 0.2 3.3 6.5 29.2
N. RHODESIAMONGU 8.7 7.7 6.2 1.5 <D.1 <0.1 0.0 < .1 0.1 1.4 3.9 7.9 37.-1
S, RHODESIABULAWAYO 5.6 11.3 3.3 0.7 0.11 0.1 <0.1 <0. 1 0.2 0.8 3.2 1.8 2 3 -1t
SW ArpRicAONDANoUA U. 14.8 3.7 1•A. 0 .1 0.0 'D.1 <D.1 0.1 0.5 1.8 3.6 20.3TsuMo i4. 117 3.2 1.5 0.2 01.1 0-1 <.). <).1 0.7 2.2 3.3 20.5WALVIS BAY -. 1 0.2 0.3 0.1 0.1 <1.1 01 .1 0.1 41 <0 .1 <0.1 0.1- 9
U. or S. AFRICAC. AGULHAS 0.8 0.7 1:3 1:5 2.0 N 2.1 1.9 1.6 1.5 1.1 0.7 17-5CRADOCK 1.7 2.1 2.2 1.2 0.8 0. 0 3 0- : 1.0 1.2 1 .rRAs•RouRG 0 1.0 1.1 o.8 0.6 o. 4 0.3 0.3 0. 0.3 o.•-4 o .KIM2RLEY 3. 1 1.5 07, 0.2 0.2 0:.30 1.0 1.6 .
PIETERSURG 3.9 3.0 2.7 1.1 0.4 0.1 0.2 0. o.2 4 1.7 3.-1 3.-6 .PORT NOLLOTH 0.1 0.1 0.2 0.2 0. 0.3 0.3 0.•3 0.2 0.1 0.1 0.•1PORT ST. JOHNS 4. 8 o: 6.1 3. 4 21. 15 1.5 2.0 .:. 5.2 4.8 5.2 ,
YUMA, ARIZONA 0.4 0 0.3 0.1 .01 41 0.2 0. 6014 0.3 0.2 0.-5 3'.
96
" .. ,.L i I ..... '" ' -•...........'...i........i...I...,..,..,.. .
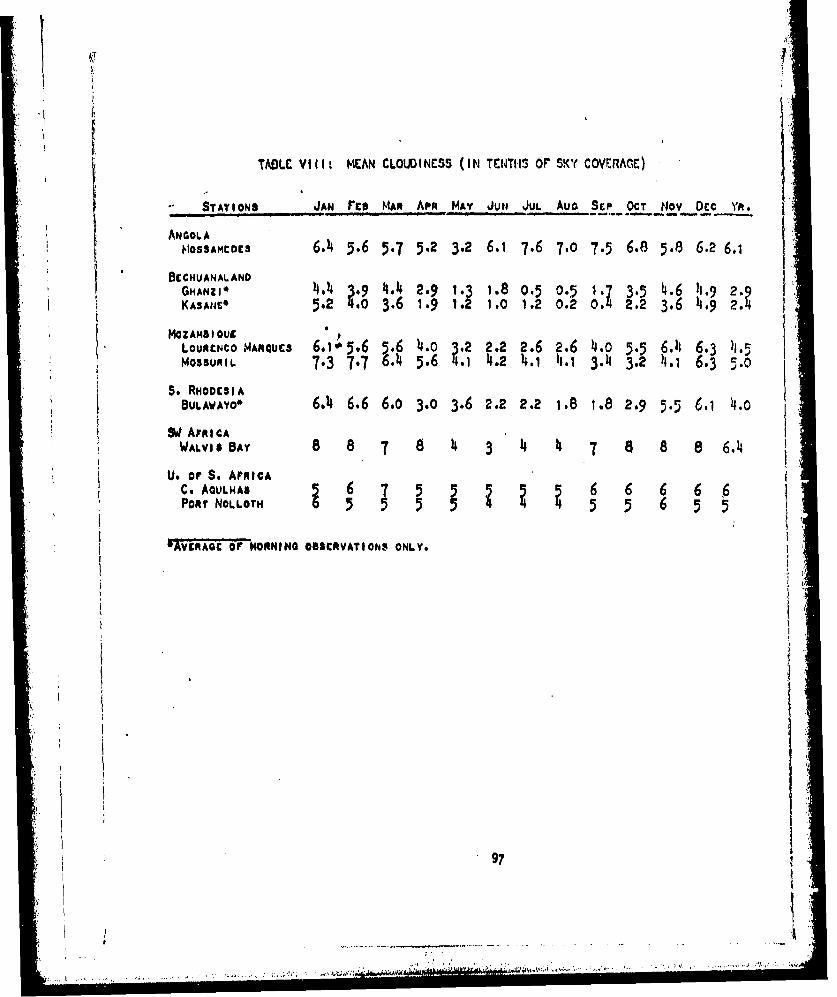
TAD3LC VIII: MEAN CLOUDOI NESS (I N TENTIH1 OF SKY COVERAgE)
" STATIONS JAN rEb MAR APR MAY Jute JUL Aua Scp OCT Noy Dec YR.
•. ~ANGOLAMosAN ,,o c 6.4 5.6 5.7 5.2 3.2 6.1 7.6 7.0 7.5 6.8 5.8 6.7 6.1
BECHUANALAND
KASAN52 3.6 1.9 1.2 1.0 1.2 0.2 3.6 0:2 ,.
MOZAMBI QUi"LoutENCO MARQUES 6.,-5.6 5.6 4.o 3.. 2.2 2.6 2.6 4.p 5.5 6.,4 6.3 )1.5MOSSUN L 7.3 7.7 5.6 4 .2 4.1 11-1 3.4 3.2 4.1 6L3 d.0
'. RHODCs1ABULAWAYO* 6.4 6.6 6.0 3.0 3.6 2.2 2.2 1.8 .8 2-.9 5•.5 6. 4.o
W Ari CAWALVIS BAY 8 8 7 8 4 3 4 7 8 8 8 6.64
U9 or S, AFRICAC. AOULHAA 6 5 5 5 56 6 6 6PoRt NOLLOTH 5 5 5 5 6 5
lvu oT ORNING OBSCRVATIONS ONLY.
97
-,I............ -,
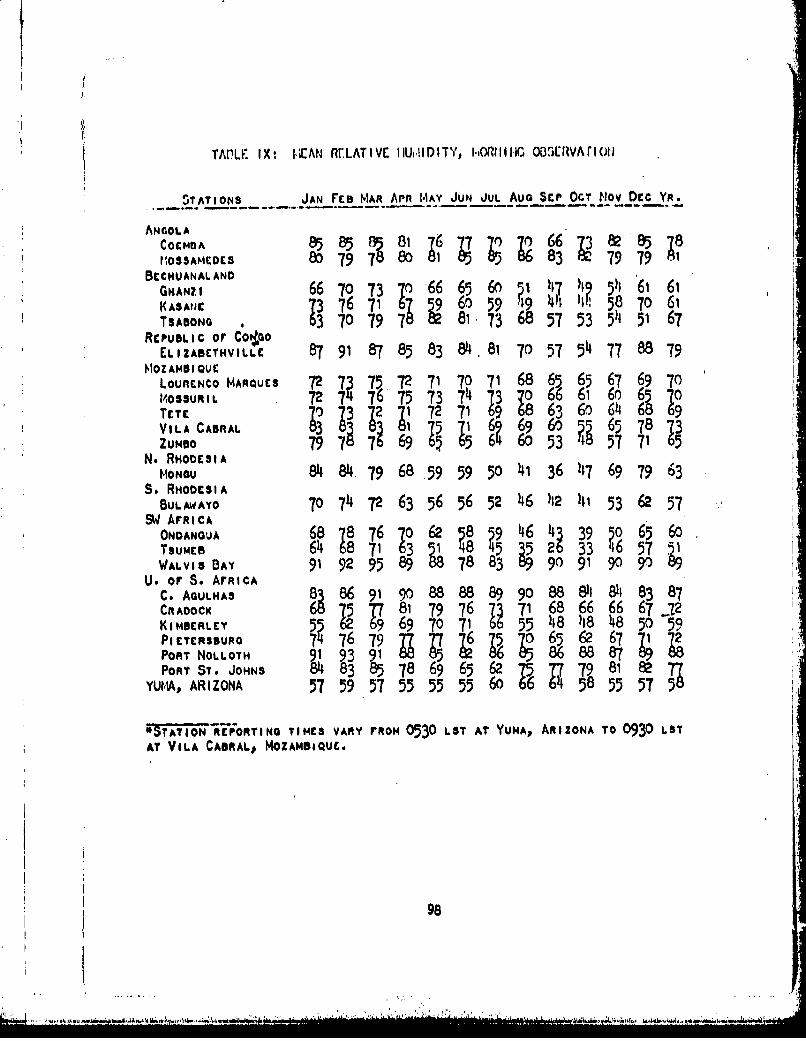
TAPLE IX. 14;EAN RELATIVE IIlUl.lDITY, I.,OWIIIGC ODiERVArlOti
STATIONS JAN rEcS MAR APn MAY JUN JUL AUG Sep OcT Nov DeC Yn.
ANGOLACOEMBA 85 8571818¶;6 g yu 36 82 85 8
* I 'O5AM1CDE 79 7880 81 858 683 79 79 31BECHUANAL AND
GHANZI 66 70 73 7 66 65 6o 47 ? 54 6 61
K ASA1E 3 7 71 L79 60 59 '9 44It 58 7o 61TIABONO 0 3 70 79 78 73 68 57 53 5)1 51 67
REPueLIc or Co#,oELIZABETHVILL. 87 91 87 85 83 84 81 70 57 54 77 88 79
MOZ AMBI QUE
LOUENCO MARQUES 72 7 75 872 971 70 1 68 65 65 67 69 701403SUMIL 72 7~ 76 75 7374 Z3 p1 66 6i 0 57
3r 70Z3 72 Z11 72 716 8 36 6 8 9VIA ABAL15j, 6oý69 l 65 78 73
VILAABA 79 71 71 69 5 5i 536 57 71 5~No RHODESIA
MONOU 84 8479 68 59 59 5o4136 17 6979 63S. RHODESIA
BULAWAYO 70 74 72 63 56 56 52 46 4I2 It' 53 62 579S AraIcA
ONDANOUA 68 78 76 70 62 58 59 46 43 39 50 65 60TSUMEB 64 6871 635 4l 8 5 3 26 33 16 57 -1WALVIS BAY 91 92 95 8988 78 83 90 91 90 9 8
U. or S. ArRiCAC. AGULHAS 8386 91 go088 888990o88 8lli 84 83 87CRACOCK 68 81 79 76 7371 68 66 66 67 72
KIMERLY 969 70 71 66 55 18 418 48 50 -5PIETERLEYR 5 76 9 6 ý5 ; 65 62 67 71 2PORT NOLLOTH 91 93 91 85 86PORT ST. JOHNS 848385786965 62 J5 F798
YUA, ARIZONA 57 59 57 55 55 55 60 6 58 55 5758
s "REAPMORTING TIMES VARY rROm 0530 LOT AT YUMA, ARIZONA TO 0930 LSTAT VILA CABRAL# MOZAMBIQUE.
98
IA- I
I' Australia
99
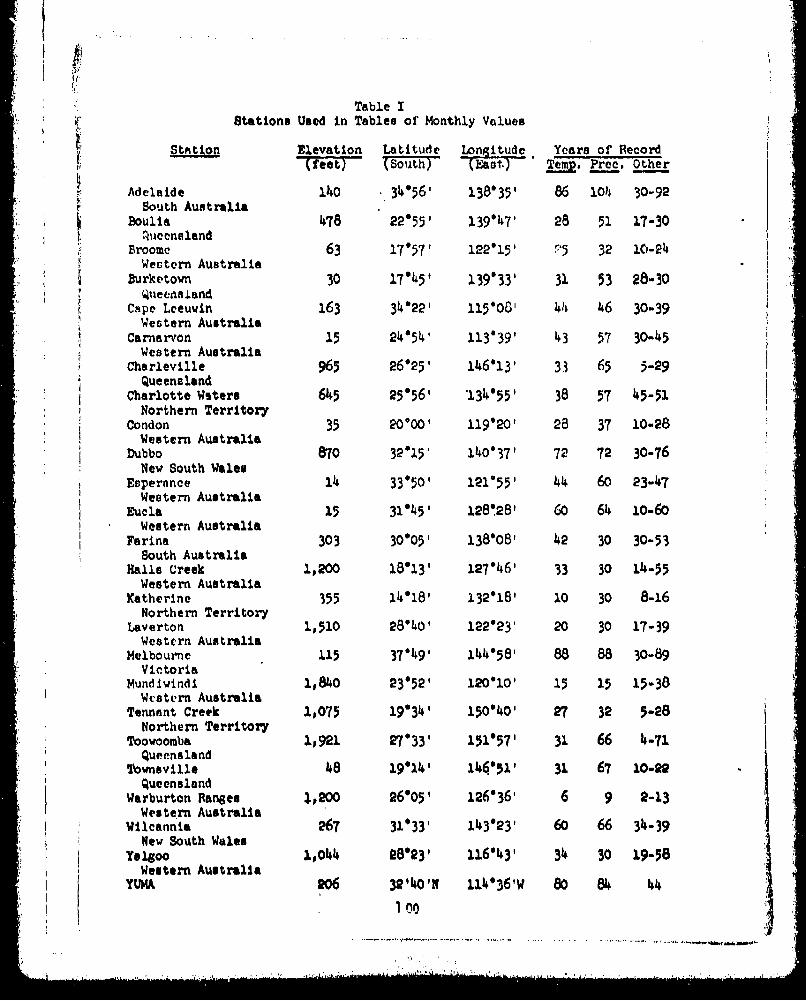
Table IStations Used In Tables of Monthly Values
* StAtio Elevation Latitude Longitlude Years of Record(feet) (South) " Tp, Prec. Other
Adelaide 14o 34056' 138*35' 86 ilOi 30-92South Australia •Boulia u78 22*55' 13947 28 51 17-30
QueenalandBroome 63 17"57' 122"15' ý5 32 10-24
Western AustraliaBurketown 30 1745' 139*33' 31 53 28-30
QueenniandCape Leeuwin 163 31422' 11503' 4I4 46 30-39
Western AustraliaCarnarvon 15 24"54' 113'39' 43 57 30-45
Western AustraliaCharleville 965 26"25' 146613' 33 65 5-29
QueenslandCharlotte Waters 645 25056, 134055' 38 57 45-51
Northern TerritoryCondon 35 20000' 119'20' 28 37 10-28
Western AustraliaDubbo 870 32"15 140o37' 72 72 30-76
New South WalesEsperance 14 33*50' 121'55' 44 60 23-47
Western AustraliaEuser t 15 3145' 128.28' 60 64 10-60
Western Australia
Farina 303 30"05' 138*08' 42 30 30-53South Australia
Halls Creek 1,200 18"13' 12746' 33 30 14-55Western Australia
Katherine 355 14i18' 132'18' 10 30 8-16Northern Territory
Laverton 1,510 28940' 122"23' 20 30 17-39Western Australia
Melbourne 115 37*49, 14458' 88 88 30-89Victoria
Mundlvindi 1,840 23"52' 120'10 15 15 15-38Western Australia
Tennant Creek 1,075 19"34' 15040' 27 32 5-28Northern Territory
Toowoomba 1,921 27"33' 151*57' 31 66 4-71Queensland
Townsville 48 19"14' 14651, 31 67 10-22Queensland
Warburton Ranges .,p200 26"05' 126"36 6 9 2-13Western Australia
* Wileannia 267 31033' 143*23' 60 66 34-39* New South Wales
Y81•oo 1,044 28"23' 11643' 34 30 19-58Western Australia
YUMAA 206 32'40'11 111436'W 80 84 44
"01 OS. .. .. "i"v • "... .... ... ... . .. ... ... . ... . .. ... . .. ..... ..... "' •,• •: -w ~ l• •a,, .
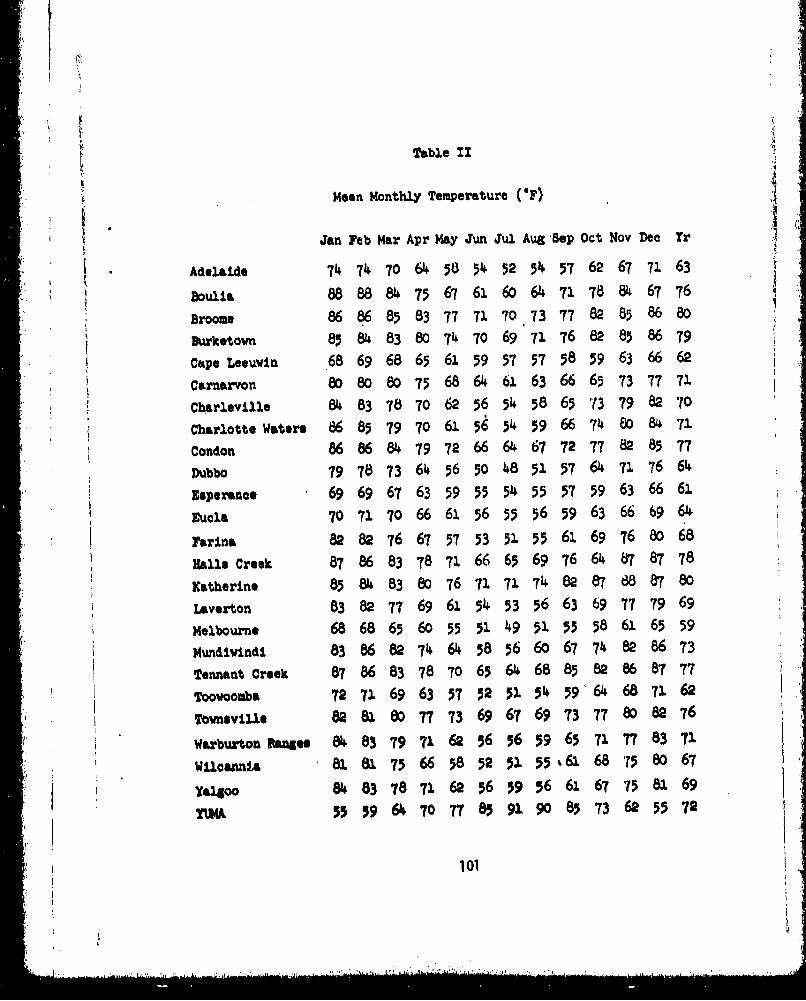
Table 11
Mean Monthly Temperature (OF)
Jan Feb Mar Apr May Jun Jul Aug Sep Oct Nov Dee Yr
Adelaide 74 74 7o 64 58 5 4 52 54 57 62 67 71 63
Boulia 88 88 84 75 67 61 60 64 71 78 84 67 76
Broome 86 86 85 83 77 71 70 73 77 82 85 86 80
Burketovw 85 84 83 80 74 70 69 71 76 82 85 86 79
Cape Leouvin 68 69 68 65 61 59 57 57 58 59 63 66 62
Carnarvon 80 80 80 75 68 64 61 63 66 65 73 77 71
Charleville 84 83 78 70 62 56 54 58 65 '13 79 82 70
Charlotte Waters 86 85 79 70 61 56 54 59 66 74 80 84 71
Condon 86 86 84 79 72 66 64 67 72 77 82 85 77
Dubbo 79 78 73 64 56 50 48 51 57 64 71 76 64
,aperance 69 69 67 63 59 55 54 55 57 59 63 66 61
ruola 70 71 70 66 61 56 55 56 59 63 66 69 64
Farina 82 82 76 67 57 53 51 55 61 69 76 80 68
Hall@ Creek 87 86 83 78 71 66 65 69 76 64 87 87 78
Katherine 85 84 83 80 76 71 71 74 82 87 68 87 80
Laverton 83 82 77 69 61 54 53 56 63 69 77 79 69
* Melbourne 68 68 65 60 55 514 9 51 55 58 61 65 59
M Iundlwindi 83 86 82 74 64 58 56 60 67 74 82 86 73
Tennant Creeok 87 86 83 78 70 65 64 68 85 82 86 87 77
Toovoomba 72 71 69 63 57 2 51 54 59'64 68 71 62
ThwnsviIle 82 81 80 77 73 69 67 69 73 77 80 82 76
Warburton R&a•e e 83 7 9 71 62 56 56 59 65 71 77 83 71
w.lWannia, 81 81 75 66 58 52 51 55 %61 68 75 80 67.Y4-1500~o 84 83 78 U1 62 56 59 56 61 67 75 81 69
YtVA 55 59 6 70 TO77 85 91 90 85 73 62 55 72
101
................. .... .•.............

fI
Table III
Mean DaLly Maximum Temperature (*F)
Jan Feb Mar Apr May Jun Jul Aug Sep Oct Nov Dec Yr
Adelaide 86 86 81 73 66 61 59 62 66 73 79 83 73
Boulia 101 100 96 88 80 73 73 78 86 93 98101 .89, Broome 92 92 93 93 88 82 82 85 89 91 93 93 89
Burketown 93 92 92 91 86 82 82 84• 89 93 95 95 90
Cape Leouwin 73 74 73 70 66 63 61 61 62 64 68 71 67
Carnarvon 86 88 88 88 78 73 71 73 75 78 81 85 80Charleville 97 96 91 84 76 69 .68 73 80 88 93 96 84Charlotte Waters 99 98 92 83 74 68 67 73 80 88 94 97 84Condon 95 9 94 91 8 78 77 81 86 91 94 94•88
Dubbo 93 91 86 77 68 61 60 64 71 79 86 91 77Eperane 7778 76 72 68 63 62 63 66 68 72 75 70
lucia 78 7878 75 71 66 65 67 70 73 75 77 73Farna 96 96 89 80 71 64 63 68 75 83 90 94 81
Halle Creek 98 97 95 9 85 81 81 86 93 98100 99 92Katherine 95 93 94 93 91 86 87 90 96 100 100 97 93Laverton 96 95 89 81 72 65 64 68 76 82 90 95 81Melbourne 78 78 75 68 62 57 565 9 63 67 71 75 67Mundlwindi 101 99 94 87 77 71 70 75 83 89 97100 87Tennant Creek 98 96 94•89 81 77 76 81 89 95 98 99 89
Toovoomba 82 81 78 74 67 62 61 65 71 76 00 82 73
Townsville &I 87 886 4 81 77 75 77 80683 85 87 82Warburton ee 9 95 90 83 75 69 69 73 80 85 90 96 84Wilcannia 95 95 88 79 70 63 62 67 74 82 89 94 80
Talgoo 98 97 91 84 73 66 6567 75 81 90 9682YUWA 67 72 78 86 931021o6104100 88 76 68 87
t
•:•: ' ... .i I '1' :' . ..1 • I• II I I I 1 •i'' '- "1 :1' I- :' " ' ' i... I .... • 1-1
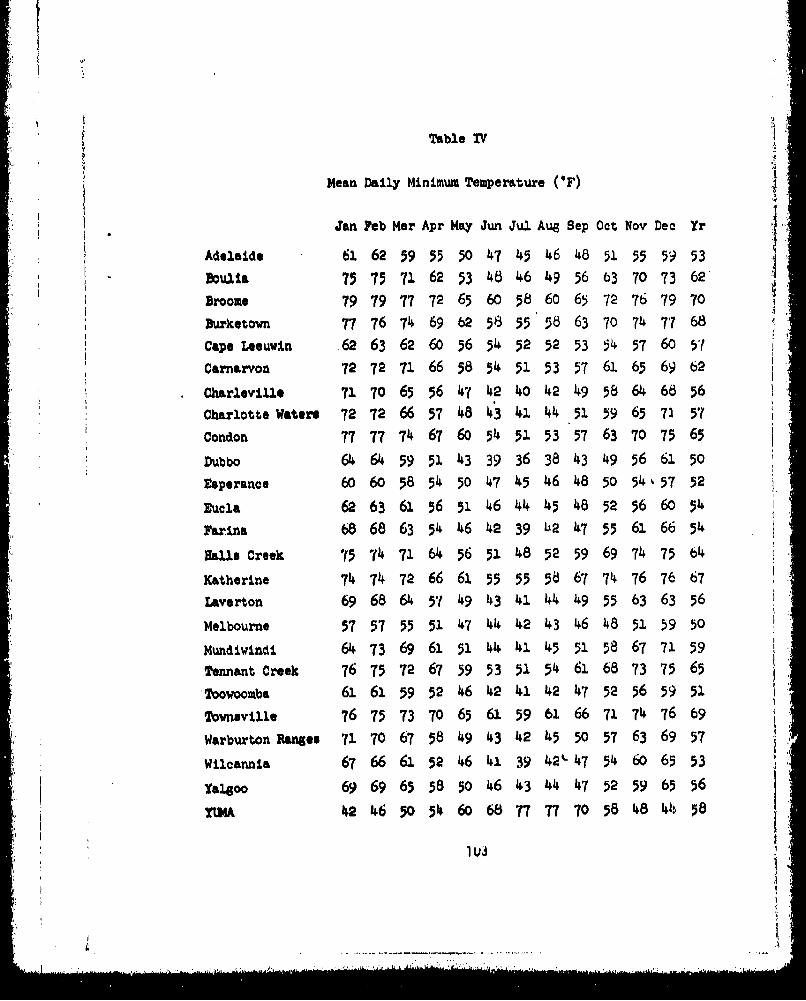
"Table IV
Mean Daily Minimum Temperature ('F)
Jan Feb Mar Apr May Jun Jul Aug Sep Oct Nov Dec Yr
Adelaide 61 62 59 55 504 7 45 46 48 51 55 59 53
,oullsa 75 75 71 62 534 6846 49 56 63 70 73 62
Broome 79 79 77 72 65 60 58 60 65 72 76 79 70
Burketovn 77 76 74 69 b2 58 5 58 63 707 74 7 683
"Cape Lesuvin .62 63 62 60 56 54 52 52 53 54 57 60o 51
Carnarvon 72 72 71 66 58 54 51 53 57 61 65 69 62
Charleville 71 70 65 56 47 42 40•42 49 58 64 68 56
Charlotte Water@ 72 72 66 57 48 43 41 44 51 59 65 71 57
Condon 77 77 74 67 60 54 51 535 7 63 70 75 65
Dubbo 64 64 59 51 43 39 36 384 3 49 56 61 50
Esperance 60 60 58 54 50 47 45 46 48 50 54, 57 52
rucla 62 63 61 56 51 46 44 45 468 52 56 60 54
Farina 68 68 63 54 46 42 39 42 47 55 61 66 54
Balls Creek 75 74 71 64 56 51 48 52 59 69 74 75 b,4
Katherine 74 74 72 66 61 55 55 58 67 74 76 76 67
Laverton 69 68 64 5V 49 43 41 44 49 55 63 63 56Melbourne 57 57 55 51 47 41 12 43 46 48 51 59 50
Mundivindi 64 73 69 61 51 44 41 45 51 58 67 71 59
,Tennant Creek 76 75 72 67 59 53 51 54 61 68 73 75 65
Toowoomba 61 61 59 52 46 42 41 42 47 52 56 59 51
Towneville 76 75 73 70 65 61 59 61 66 71 74 76 69
Warburton Ranges 71 70 67 58 49 43 42 45 50 57 63 69 57
Wilcannia 67 66 61 52 46 41 39 42'•-7 54 60 65 53
-algoo 69 69 65 58 50 46 43 44 47 52 59 65 56
Y 34A 42 46 50 54 60 68 77 77 70 58 48 4h. 58
;-.U-
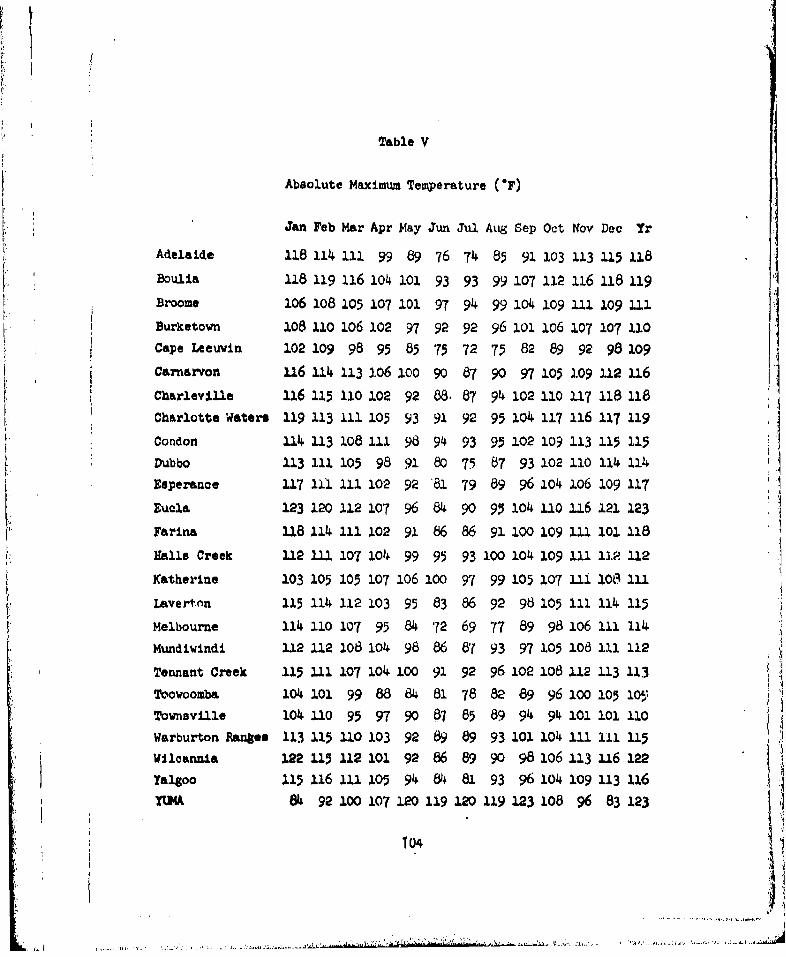
Table V
Absolute Maximum Temperature (OF)
Jan Feb Mar Apr May Jun Jul Aug Sep Oct Nov Dec Yr
Adelaide 118 114 111 99 89 76 74 85 91 103 113 115 118
Boulia 118 i19 116 104 101 93 93 99 107 112 116 118 1i9
Broome 106 108 105 107 101 97 94 99 104 109 Ill 109 111Burketown 108 110 106 102 97 92 92 96 102 106 107 107 110Cape Leeuvin 102 109 98 95 85 75 72 75 82 89 92 98 109
Carnarvon 116 114 113 106 100 90 87 90 97 105 1.09 112 116Charleville 116 115 i10 102 92 88. 87 91+ 102 110 117 118 118
Charlotte Waters 119 113 111 105 93 91 92 95 104 117 116 117 119Condon 114 113 108 Ill 98 94 93 93 102 109 113 115 115Dubbo 113 111 105 98 91 80 75 87 93 102 110 114 114
Esperance 117 111 111 102 92 '81 79 89 96 i04 106 109 117
Eucla 123 120 112 107 96 84g 909 104 110 116 121 123
Farina 118 114 111 102 91 86 86 91 100 109 I11 101 118
Halls Creek 112 111 107 104 99 95 93 100 104 109 111 112 112
Katherine 103 105 105 107 106 100 97 99 105 107 111 106 1l1
Laverton 115 114 112 103 95 83 86 92 98 105 111 114 115
Melbourne 114 1i0 107 95 84 72 69 77 89 98 106 il 114Mundiwlndi 112 112 108 104 98 86 8'? 93 97 105 108 111 112
Tennant Creek 115 111 107 104 100 91 92 96 102 108 112 113 113
Toowoomba 104 101 99 88 84 81 78 82 89 96 100 105 10i
Townsville 104 .10 95 97 90 87 85 89 94 94 101 101 110
Warburton Ranges 113 115 110 103 92 89 89 93 101 104 111 Ill 115Wileannia 122 115 112 101 92 86 89 90 98 106 113 116 122
Yalgoo 115 116 111 105 94 84 81 93 96 104 109 113 116
YKI4 84 92 100 107 120 119 120 119 123 108 96 83 123
IN4
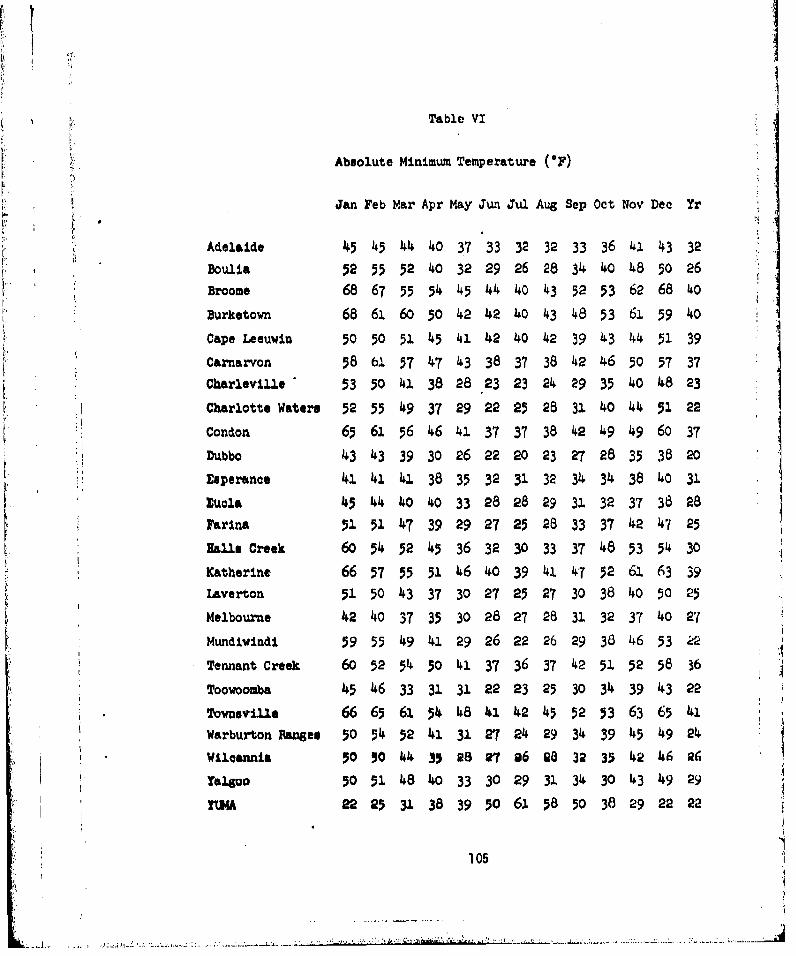
!ITable VI
Absolute Minimum Temperature (OF)
Jan Feb Mar Apr May Jun Jul Aug Sep Oct Nov Dec Yr
Adelaide 45 45 44 40 37 33 32 32 33 36 41 43 32
Boulas. 525552 40 32 29 26 28 34 40 48 50 26Broome 68 67 55 54 45 44 4o 43 52 53 62 68 40
Burketown 68 61 60 50 42 42 40 43 48 53 61 59 4o
Cape Leeuwin 5050 51 45 41 42 40 42 39 43 44 51 39
Carnarvon 58 bl 57 47 43 38 37 38 42 46 50 57 37
Charleville 53 50 41 38 28 23 23 24 29 35 40 48 23
Charlotte Waters 52 55 49 37 29 22 25 28 31 40 44 51 22
Condon 65 61 56 46 41 37 37 38 42 49 49 60 37
Dubbo 43 43 39 30 26 22 20 23 27 28 35 38 20Espences •41 41 41 38 35 32 31 32 34 34 38 40 31
Eucla 45 444• 40 33 28 28 29 31 32 37 38 28
Farina 51 51 47 39 29 27 25 28 33 37 42 47 25Halls Creek 60 54 52 45 36 32 30 33 37 48 53 54 30
Katherine 66 57 55 51 46 40 39 41 47 52 61 63 39Laverton 51 50 43 37 30 27 25 27 30 38 40 50 25
Melbourne 42 40 37 35 30 28 272 8 31 32 37 40 27
Mundivindi 59 554 9 41 29 26 22 26 29 38 46 53 42
Tennant Creek 60 52 5 5 50• 41 37 36 37 42 51 52 58 36
Toowoomba 45 46 33 31 31 22 23 25 30 34 39 43 22
Townsville 66 65 61 54 48 41 42 45 52 53 63 65 41
Warburton Fanges 50 54 52 41 31 27 24 29 34 39 45 49 24
Wileannia 50 0 44 3ý 28 v7 g6 98 32 35 42 46 Q6
yalgoo 50 514 8 40 33 30 29 31 34 30 43 49 29
TY4A 22 25 31 38 39 50 61 58 50 38 29 22 22
105
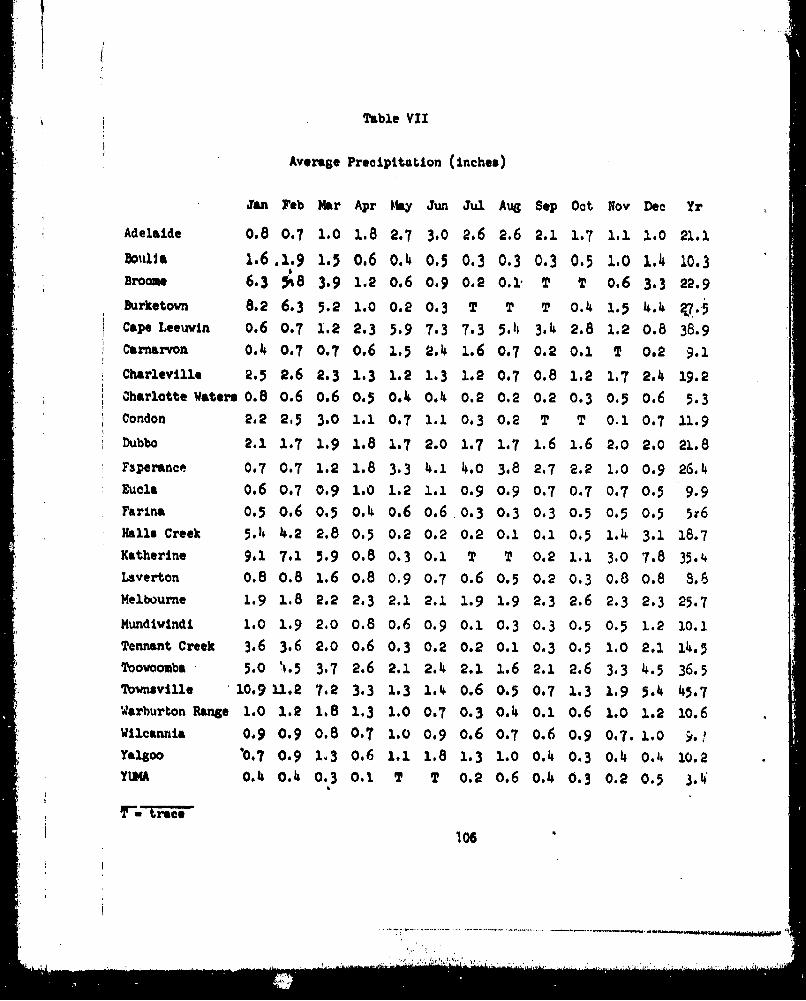
Table VII
Average Precipitation (inches)
Jan Feb Mar Apr May Jun Jul AuZ Sep Oct Nov Dec Yr
Adelaide 0.8 0.7 1.0 1.8 2.7 3.0 2.6 2.6 2.1 1.7 1.1 1.0 21.1
aoitlla 1.6 .1.9 1. 0.6 0.4 0.5 0.3 0.3 0.3 0.5 1.0 1.4 10.3Broome 6.3 ý8 3.9 1.2 0.6 0.9 0.2 0.1' T T 0.6 3.3 22.9
Burketown 8.2 6.3 5.2 1.0 0.2 0.3 T T T 0.4 1.5 4.4 T7•5Cape LeeuvIn 0.6 0.7 1.2 2.3 5.9 7.3 7.3 5.11 3.4 2.8 1.2 0.8 38.9CarnarVOn 0.4 0.7 0.7 0.6 1.5 2.4 1.6 0.7 0.2 0.1 T 0.2 9.1
Charleville 2.5 2.6 2.3 1.3 1.2 1.3 1.2 0.7 0.8 1.2 1.7 2.4 19.2Charlotte Wate*s 0.8 0.6 0.6 0.5 0.4 o.4 0.2 0.2 0.2 0.3 0.5 0.6 5.3Condon 2.2 2,5 3.0 1.1 0.7 1.1 0.3 0.2 T T 0.1 0.7 11.9Dubbo 2.1 1.7 1.9 1.8 1.7 2.0 1.7 1.7 1.6 1.6 2.0 2.0 21.8
Fsperance 0.7 0.7 1.2 1.8 3.3 4.1 4.0 3.8 2.7 2.2 1.0 0.9 26.4Eucla 0.6 0.7 0.9 1.0 1.2 1.1 0.9 0.9 0.7 0.7 0.7 0.5 9.9Farina 0.5 0.6 0.5 0.4 0.6 0.6 .0.3 0.3 0.3 0.5 0.5 0.5 5T6Hall@ Creek 5.4, 4.2 2.8 0.5 0.2 0.2 0.2 0.1 0.1 0.5 1.4 3.1 18.7Katherine 9.1 7.1 5.9 0.8 0.3 0.1 T T 0.2 1.1 3.0 7.8 35.4Laverton 0.8 0.8 1.6 0.8 0.9 0.7 0.6 0.5 0.2 0.3 0.8 0.8 8.6Melbourne 1.9 1.8 2.2 2.3 2.1 2.1 1.9 1.9 2.3 2.6 2.3 2.3 25.7
Mundivindi 1.0 1.9 2.0 0.8 0.6 0.9 0.1 0.3 0.3 0.5 0.5 1.2 10.1
Tennant Creek 3.6 3.6 2.0 0.6 0.3 0.2 0.2 0.1 0.3 0.5 1.0 2.1 14.5Toovoomba 5.0 '4.5 3.7 2.6 2.1 2.4 2.1 1.6 2.1 2.6 3.3 4.5 36.5Townsville 10.9 11.2 7.2 3.3 1.3 1.4 0.6 0.5 0.7 1.3 1.9 5.4 45.7Warburton Range 1.0 1.2 1.8 1.3 1.0 0.7 0.3 0.4 0.1 0.6 1.0 1.2 10.6Wilcannia 0.9 0.9 0.8 0.7 1.0 0.9 0.6 0.7 0.6 0.9 0.7. 1.0 '.'
Yalgoo 10.7 0.9 1.3 0.6 1.1 1.8 1.3 1.0 0.4 0.3 0.4 o.i 10.2YUMA 0.4 0.4 0.3 0.1 T T 0.2 0.6 0.4 0.3 0.2 0.5 3.k
"-truce
106
................................... ''---'
"[ • •[jf: • -'" d •.. .. • t• : •[ " " • ' '•XI:'I UE~t• i t •[ ')•. _j ," .,t,: m d : z, ,•.•:•'_ ['.[ '-•• ... .'.. . . . . . . . . .,.. . . . . . . . . . .,,.[';':
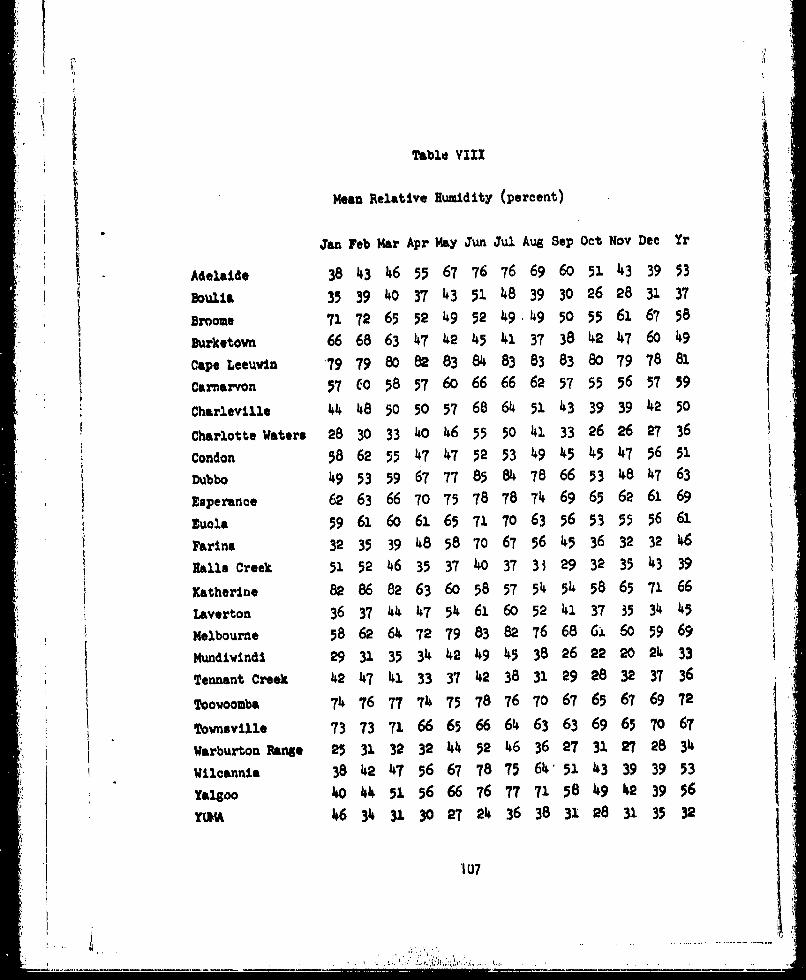
Table VIII
Mean Relative Humidity (percent)
-eadJan Feb Mar Apr May Jun Jul Aug Sep Oct Nov Dee Yr
Adelaide 38 43 46 55 67 76 76 69 60 51 43 39 53
""Boula 35 39 40 37 43 51 48 39 302 6 28 31 37 JBroomse 71 72 65 52•49 52 4949 50 55 61 67 58
Burketown 66 68 63 47 42 45 41 37 38 42 47 6o 149
Cape Leeuvin 79 79 80 82 83 8 83 83 83 80 79 78 81SCarnarvon 57 (0 58 57 6o 66 66 62 57 55 56 57 59
Charleville 44 48 50 50 57 68 614 51 43 39 39 42 50Charlotte Waters 28 30 33 40 46 55 50 41 33 26 26 27 36Condon 58 62 55 47 47 52 53 4.9 5 45 47 56 5 1
Dubbo, 89 53 59 67 77 85 84 78 66 53 48 4 7 63
Esperanb e 6 63 66 70 75 778 75 4 69 65 62 61 693
"Esuela 59 66 66 5 71 7 63 56 53 55 56 61
' Farina 32 35 394 8 58 70 67 564 5 36 32 32 46
galls Creek 51 524 6 35 374 0 37 3j 29 32 35 43 39
Katherine 82 86 82 63 60 58 57 54 54 58 65 71 66
Laverton 36 37 44 47 54 61 60 52 41 37 35 34•45
Melbourne 58 62 64 72 79 83 82 76 68 6i 6 0 59 69
Mundivindi 29 31 35 34 42 49 45 38 26 22 20 24 33
Tennant Creek 42 7 41 33 37 42 38 31 29 28 32 37 36
Toowoomba 71 76 77 74 75 78 76 70 67 65 67 69 72
Townsville 73 73 71 66 65 66 64 63 63 69 65 70 67
Warburton Range 25 31 32 32 44 52 46 36 27 31 27 28 34
Wilcannia 38 42 47 56 67 78 75 64, 51 43 39 39 53
Yalgoo 0 44 51 56 66 76 77 71 58 49 42 39 56
YUMA 46 314 31 30 27 2 36 38 31 28 31 35 32
I 07j
ai
S..... ;.--- ----,-- .... -, , •..- .-. -: ..
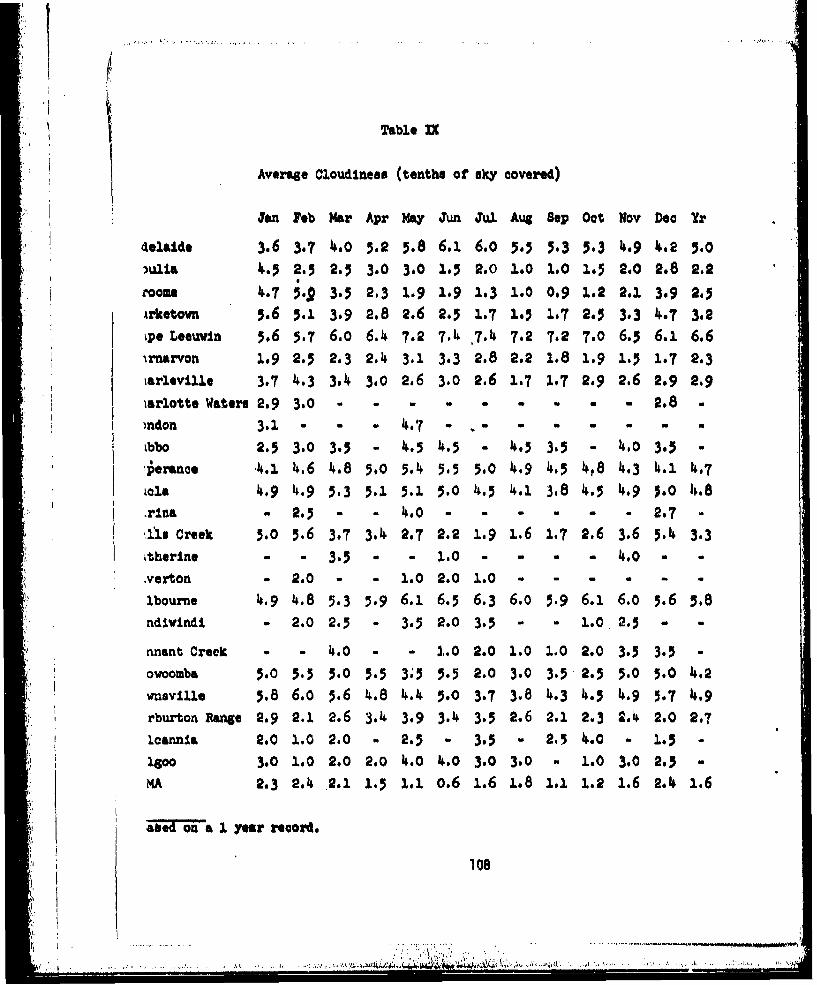
Table DC
Average Cloudiness (tenths of eky covered)
Jen Feb Mar Apr May Jun JU Aug Sep Oct Nov Dec Yr
.elai4s 3.6 3.7 4,.0 5.2 5.8 6.1 6.0 5.5 5.3 5.3 4.9 4.2 5.0.u1±a 4.5 2.5 2.5 3.0 3.0 1.5 2.0 1.0 1.0 1.5 2.0 2.8 2.2
room 4.7 i.9 3.5 2.3 1.9 1.9 1.3 1.0 0.9 1.2 2.1 3.9 9.3
Arket•wn 5.6 5.1 3.9 2.8 2.6 2.5 1.7 1.5 1.7 2.$ 3.3 4.7 3.2Ipe Leeuvln 5.6 5.7 6.0 6.14 7.2 7.4 7.-4 7.2 7.2 7.0 6.5 6.1 6.6irnarvon 1.9 2.5 2.3 2.4 3.1 3.3 2.8 2.2 1.8 1.9 1.5 1.7 2,3iarleville 3.7 4.3 3.4 3.0 2.6 3.0 2.6 1.7 1.7 2.9 2.6 2.9 2.9
iarlotte Waters 2.9 3.0 - -. . . . . . 2.8 .* I rndon 3.1 - - - 4.7 - -. . . . . . .S tbbo 2.5 3.0 3.5 - 4.s.5 -•. 3.5 - 4-0 3.5 -
jeranae .4.1 4.6 4.8 5.0 5.4 5.5 5.0 4.9 4.5 4,8 4-.3 -. -.7* oa 4.9 4.9 5.3 5.1 5.1 5.0 4.5 4.1 3.8 4.5 4.9 ;.0 4.8
r-lna 2.5 - - 40 - - - - - - 2.7 -
,ii Creek 5.0 5.6 3.7 3.4 2.7 2.2 1.9 1.6 1.7 2.6 3.6 5.4 3.3-itherine - - 3.5 - 1.0 O . . . . 4.0 - -
verton - 2.0 - - 1.0 2.0 1.0 - - -.
lbourne 4.9 4.8 5-.3 5.9 6.1 6.5 6.3 6.0 5.9 6.1 6.0 5.6 5.8ndivlndl - 2.0 2.5 - 3.5 2.0 3.5 - - 1.0 2.5 - -
anant Creek - 4.0 - - L.0 2.0 1.0 1.0 2.0 3.5 3.5 -
owoomba 5.0 5.5 5.0 5.5 345 5.5 2.0 3.0 3.5 2.5 5.0 5.0 4.2
wneville 5.8 6.0 ý.6 14.8 4.4 5.0 3.7 3.8 4.3 4•. 4.9 5.7 4.9rburton Range 2.9 2.1 2.6 3.4 3.9 3.4 3.-5 2.6 2.1 2.3 2.4 2.0 2.7.. annia 2.0 1.0 2.0 - 2.5 - 3.5 - 2.5 4.0 - 1.5 -
1500 3.0 1.0 2.0 2.0 4.0 4.0 3.0 3.0 - 1.0 3.0 2.5 -
MA 2.3 2.4 2.1 1.5 1.1 0.6 1.6 1.8 1.1 1.2 1.6 2.4 1.6
it• on 1 year record,
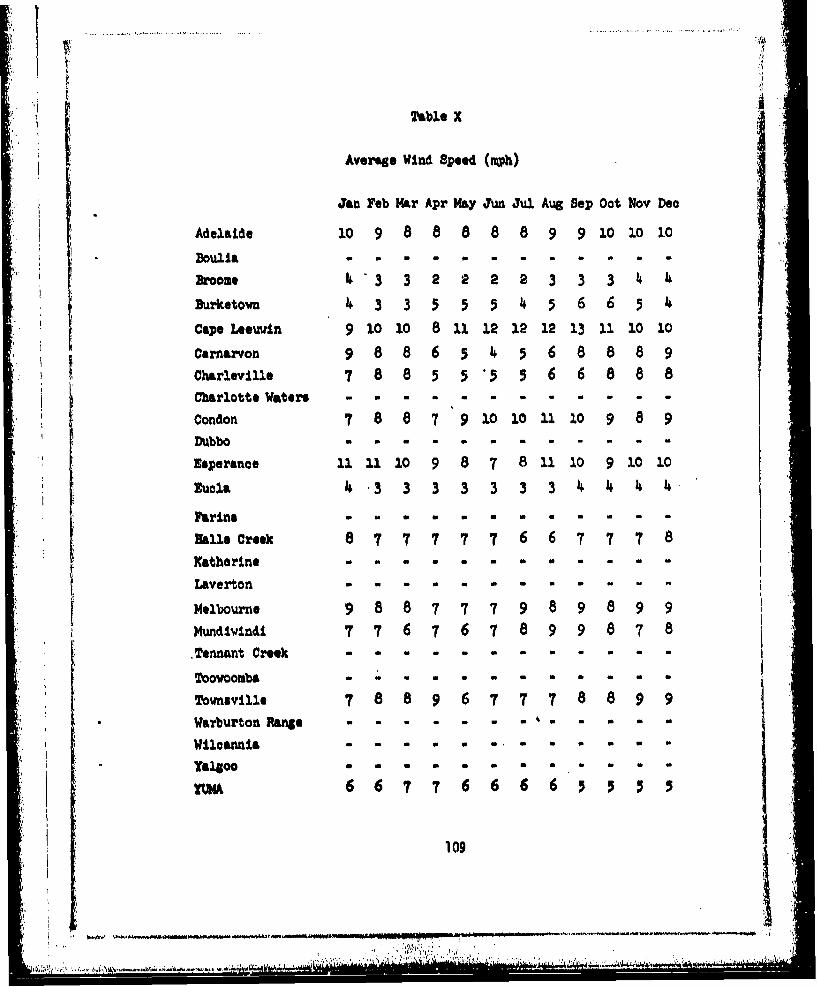
Table X
Average Wind Speed (mph)
Jan Feb Mar Apr May Jun Jul Aug Sep Oct Nov Deo
Adelaide lo09 8 8 88 89 910 01.0l
Boulia - -
Broome 14•3 3 2 2 2 2 3 3 3 4 4
Burketov 4 3 3 55 5 4 5 6 6 5 4Cape Leeuvin 9 10 10 8 11 12 12 12 13 11 10 10
Carnarvon 9 8 8 6 4 6 8 8 8 9
Charleville 7 8 8 5 5 '5 5 6 6 8 8 8
Charlotte Waterts . . . . . . . . . .
Condon 7 88 7 9 1010 1110 98 9
Dubbo . . . . . . .
Esperance 11 11 10 9 8 7 8 1110 91010
Farina
Balls Creekc 8 77 77 76 67 77 8
Katharine
Laverton*
Melbourne 9 8 8 7 7 7 9 8 9 8 9 9Mundivindi 77 6 767 8 99 8 78TennantCeek aro
Toowoomba
Townsville 7889 677 78 89 9
WarburtonRaze a a
Wilcannl- a .
Talgoo
109
..........
.. 1
ANNEX B
YPG Climatological Calendar
I and Climate, Summary
110
........... ......
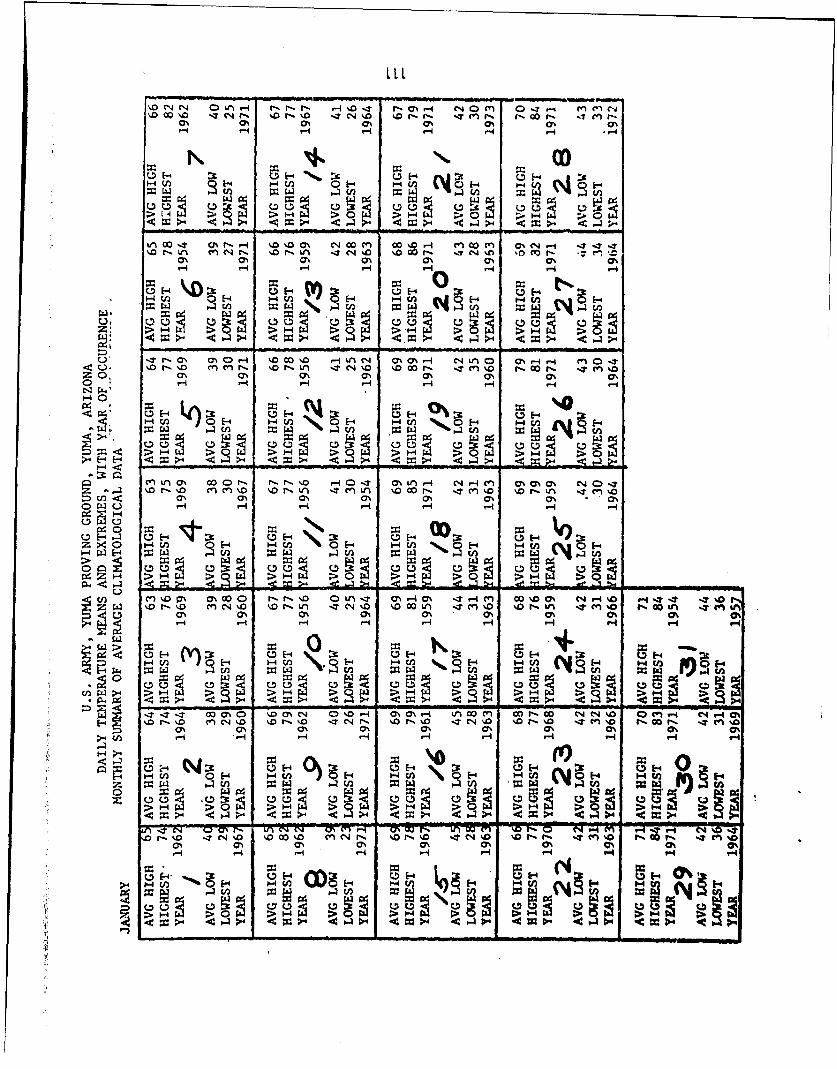
ON ON a% a%0 0 % 0%-4-4 - 4- 4-
ifE- :x -.- J-400 c'41c, :X u H cýit v u'j~ E-4-:
0 H m 0% H L 0 0% 0-40
-4 -4 -4- - 4 M 4I.
V) 0 J l fE- - %0- C4 0 HO 0 - nlc hC jt4 - O-T -
aO % m% 47% ON0% 0% 0%
o- r-4 r- yt.4 4
u E4 ý j f :-3c 01 __ ___ h U)_ _-4_V)
-4 <
% 0 ON 0% (7% ON 0% a% a %
U E4 : E-4 E-4-
V)~- 0 -4
C- u u .<%0%0 0% H% >%0 % %
-4 E--- 4 -4 -4 -44 -.4 -404 -4g-
od 0
H " 0 % H% u E 0% EWD 0% E% %4-4 * -4 EHWE-4 6 -4 -4 -4.-4-4)-4
(nC'( jNC vI A J %r- -(0% u 0% uu 0% 0 92 U6 0%0%0%
C4 -44 -4 -4 -4 -4 -4 2- >
P14 <~ .4Q.
u is_ _ _ _ _ _ _ _ _ _ _ _
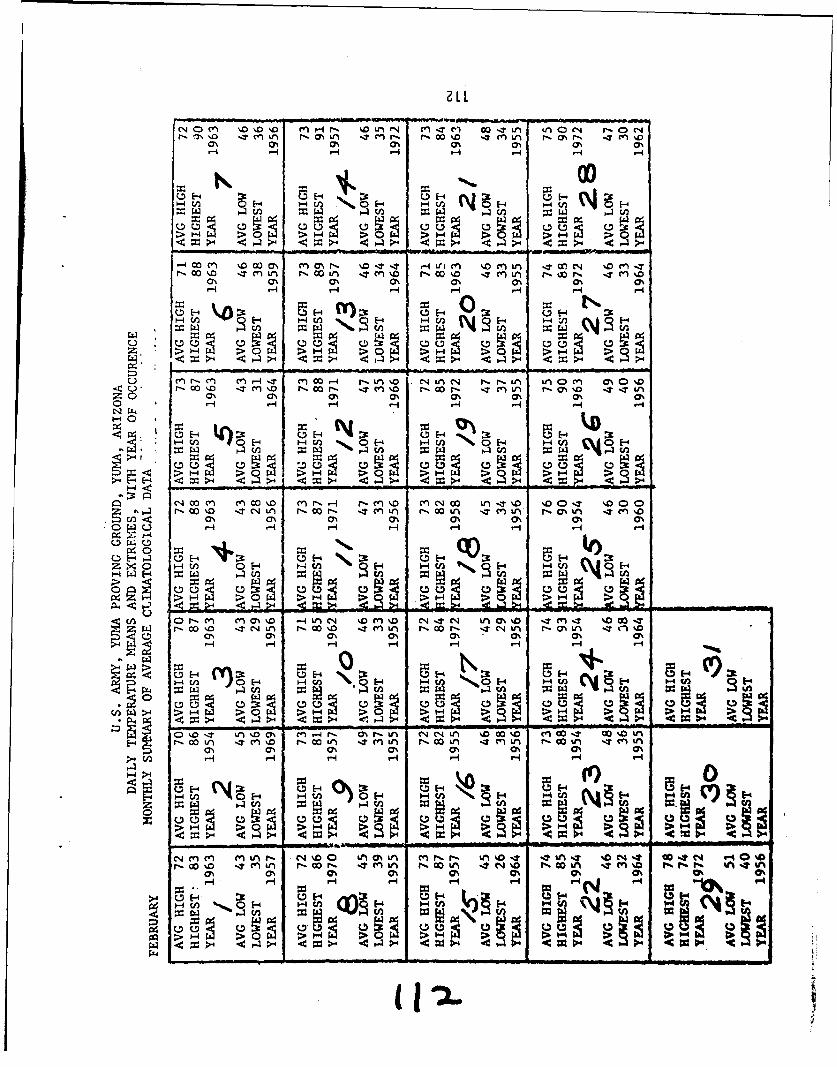
t- C7% 0o-Tf n r"cýL % 0% 00 D ý l % 1, 0M%D-4- - 4-4 -4 ý
U % E-40 0% F4 fqg:E 0%
-4 -4 >-4 -14 4 ->4 - 4
aO % G% 0% a% % 0% a% Cr%o r-I r-4 '-i r-4N I
-4< n ) 1 -
M -4 C) m - T M0 1-4 -4 -nN 4 -4 -4 -4r r) L )cn m0%
0% 00 0% ~k4 C 0% 0% 0%-4 -4V-
0%i 0%0 %0 %014U -4 E- 4 :3t U 4 E-4 Dt
A 1. (n W0 nwc
u a0 z CD 0 2 0Eg2 u0. >4 -4 >~>-
m% 7% ON a% 0% m% 0% 0% %0
H 0 peJ1- ~ - ) - n-
E-4_ _ (n =__ _ _ _ _ _ _
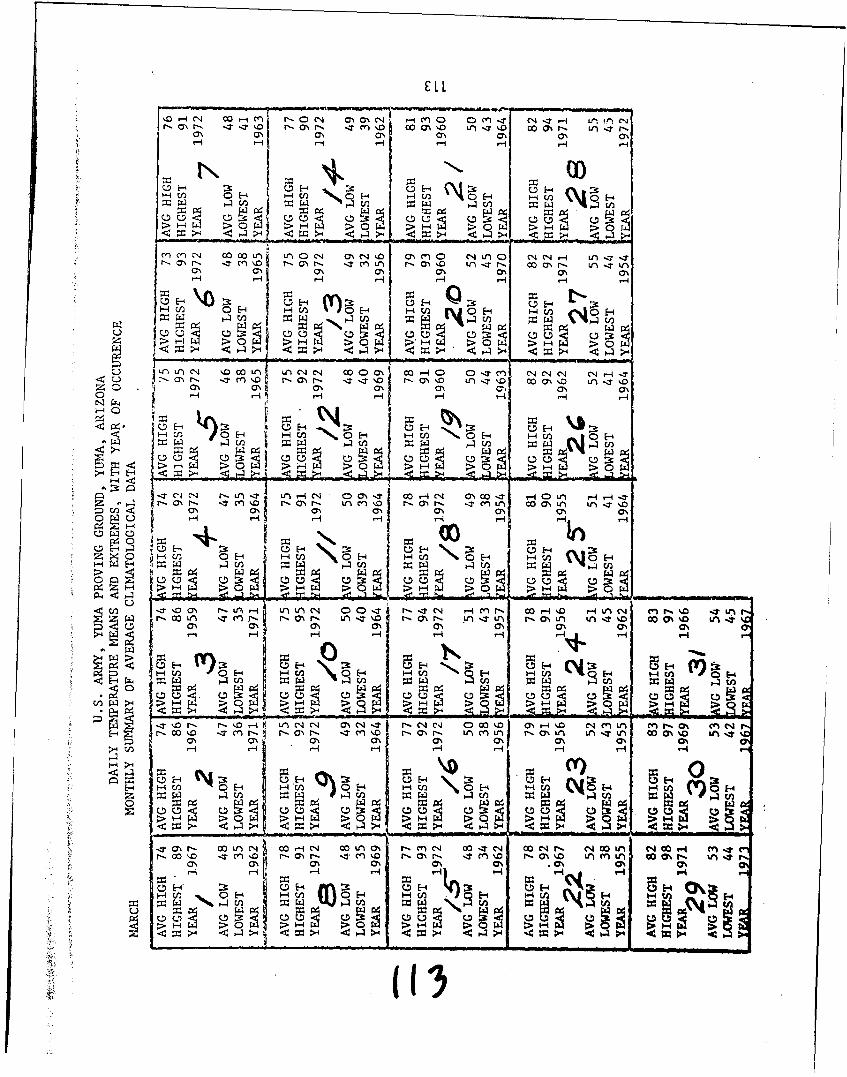
ELL
a% a% a' a'ý a% ON a%H~~- HýHHq
uN. u F)coC~ 0 (N 0E-
r, ~a% i-. -:Icn D r-a'mr-" -Z tn L r- a% % Ln -T r- 0 a r- Ln 'T-.7Ia\ 1 a a% a\ Cha'a
u HI \0ý3 H 3 H Hj H H- H_
1. j ( 4 C 42 n (HOtU u u
H H H H4 H H
C-) Un a' C -4.D 0Lr f krLf NC14 000o- 00 r-4 0 0 I~T m NC C1 HrC14 Ch ~a' CA a% aa' m a\ Ca'
H H- H~ -I H -4 H H-
0 ;> fl
M' a% a\ ON
zx0 H V (= ,1H n- H(nHW C H
P14 IT ý4 -8O
E- u H E-4W.<a' a' a' 1 a', 0. a' .' :3 pHT H H W a H H '-
;Z w w w AC) C4S 4
cu -! UE9U
U) > 1- 0 >((>5
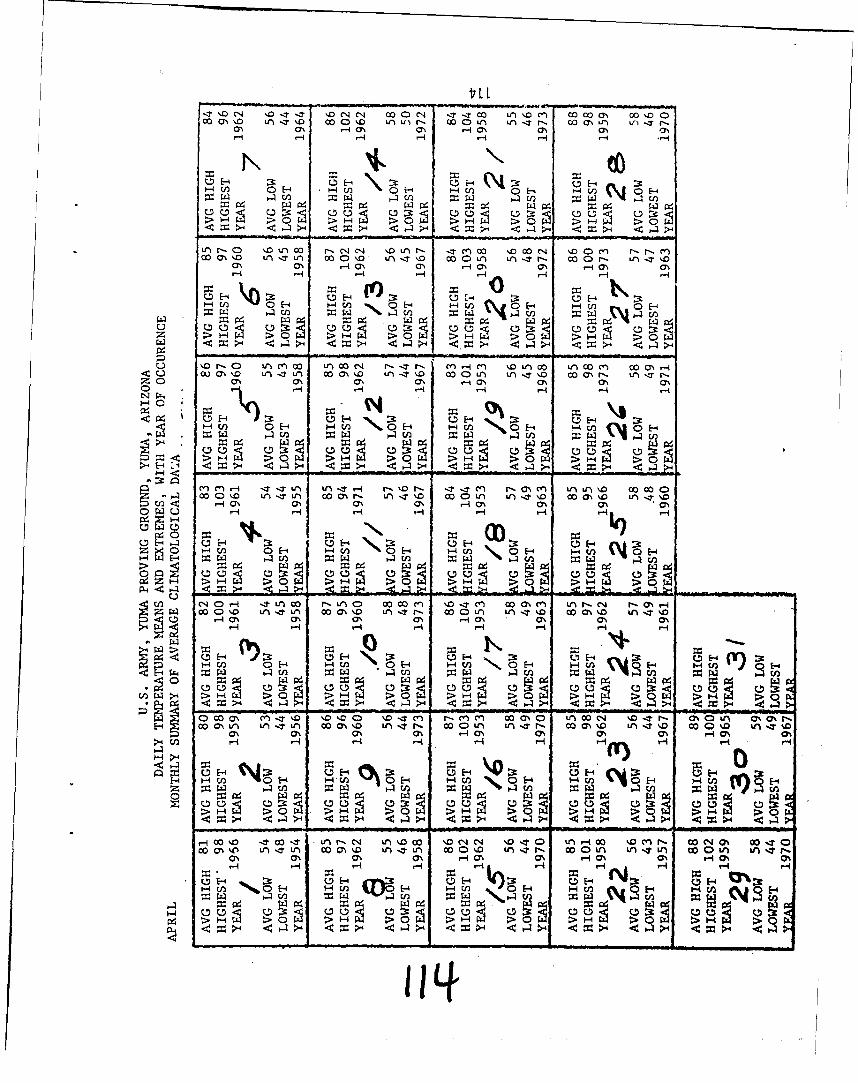
a%- %C% -4 a% ONONa
0'L'. n 0 ' E-1' 0 ' E0'Hw~ .- 4 C4 -PH
o o :. uV U m => > > > 0 >OH >\O 0~
0O0 ' ON%0'.t n 0 0 % . 0.t I'D' 0'.Ln L t - 0 0' 0-'.-Z%O~~ ~ -L m- - .4H
ý1 r -4 :: -'O
>4 > H ý->
- 4 K4 0'. 0'. -4c =0 04'<.4 9ý
OPL c 0 0 Ho C14- H ý -Z* -4 Hn H1 n0 0 om
N. q -
1-4c On 0c' ENi W 0H oH H :3 :O) oH&
0. r
H. H >- 0~ 0-
MH 4-4(1 TItLn L) OHt r-i2-.,O -4(1r r \ n L ) \.D 0 0H 0
0'. 0'. C)ý n- ) 0 %P nI0'. ) r 0'. HIT \0' 0 0m .0 V '. IT' -.0
2 z uu. ug1-9>> )
H)cOOr- -:rLnw P L4-C'4 Ot'D 0 M ý 'T C'4C 00'~ 0% ~ H '.V)r. OCN -4 'O. ~ t
U ' 0E- 0,:3 0' HE '. 0' HO'4 : '. HO
Hm H HA Hý 0H H6 H HU H§
H ~ ~ ~ '~t 2-W~ ' 1914
>4 4 > >4 ý4IlL0I>.
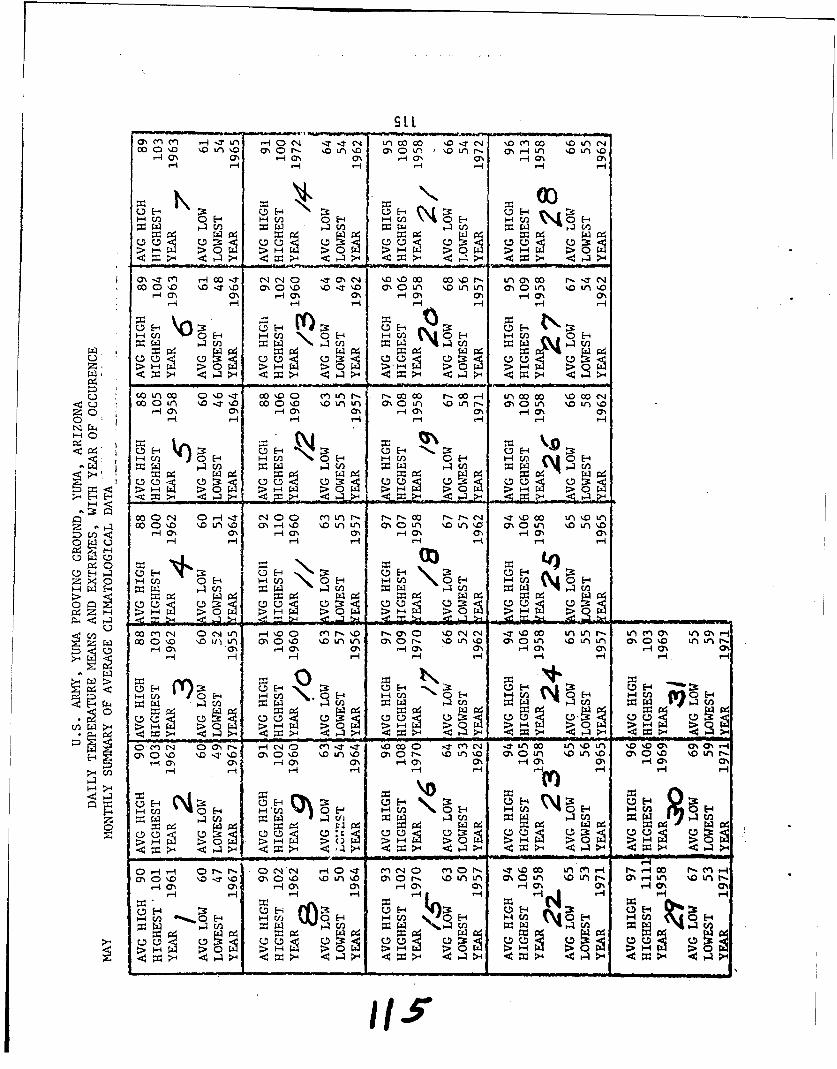
StTL
Ha0 a' ,--a' 0' Ha '
c Q -.4 ý4C < u 0'4f >ý~i a'ou %D3 >4
r-HC\ % -a \ O 0\ HC\a m' .- iON 0\
H V)\0 H ýAU H H E- H H n H H-
1-4 > <
Ha 0' H- \a% ra' 0\ Ha' m' Ha' 0'4 Ha m
0 H Hc-4 N.W H~ H)0E4 HcW 14rn w 04 Ww P4W pa P4
__ __ _ __ __ __ P4__ _ u~~n mmm±Z e~.m.~~ m1 ~~ ou U ý U m D
co'\ \-?0 I' . 'O\D ýr4 D % OLf)wl 0%C a' r- .0 Lr) %a 0 VO t D %Lfir-.o 0 H OHa' a\ HO' a% aa' 0\ Ha' 01H%
H -, - H H H- -- ) 0 14 14E - H H.- 3 Hn Hý_4 ~ ~ ~ ~ ~ ~ H -4E4 w l lw ý W1 4U
>CJ w%.O HV4 P4 JO w ~ Pl.H OH40 4P0 .4 :3: < u u u u
04 U U m
F-4 > 1ý j F-
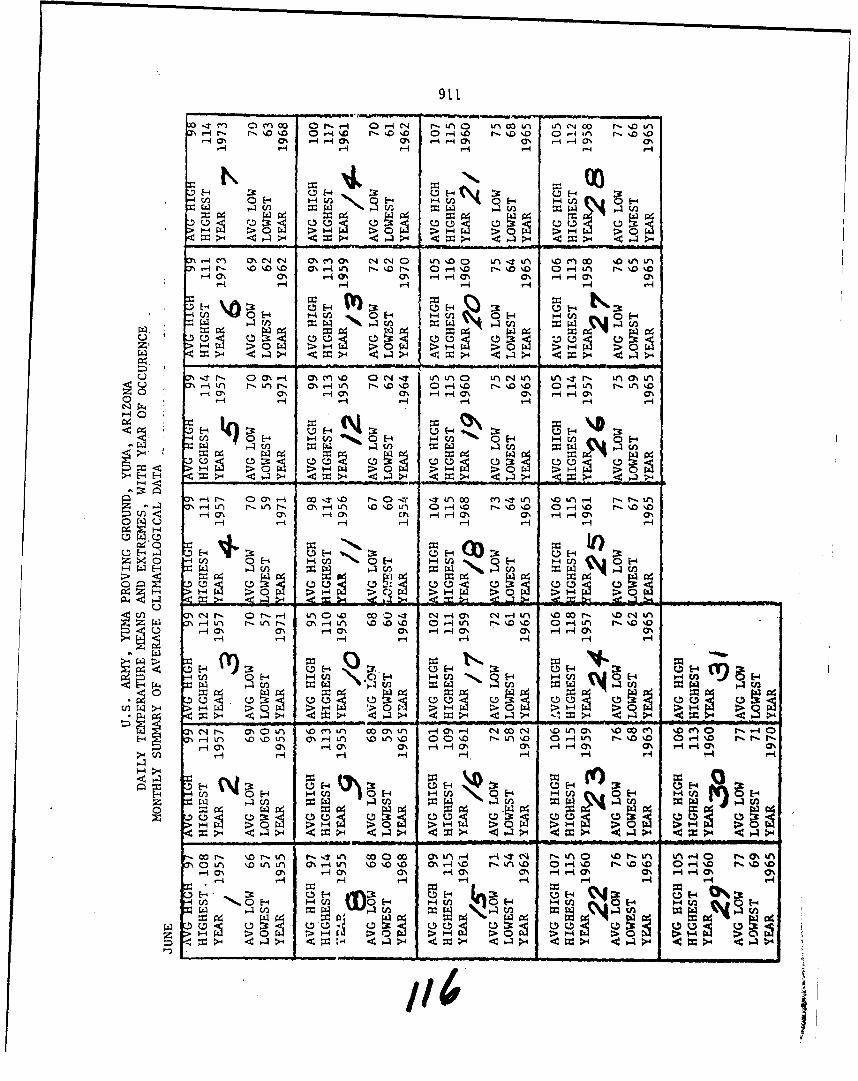
00' m 0m 0rý -i a -4c' r-Irin n 0L Lu uC14 co r- ID Li
T-i 40 r % - 0% P4-1 m0% .ý 0D 40 r4% r 0%DD 0 ,-140i rý %Dr-4 ON as- 4 m4 -4 a% a% -4
H ý4 -i r-
-4 ~ ~ > PC -44 -4-4-4-
i -t0 1.10,1 s11% 0% %D r" a -4 ý0 r %0%0 r-0 14t% % %0r-4 -4 m -4 -4% Cy -4 -4 O % -4 ON4O
-4r4 < r.
H% \0 CJ% E-440 :3 .- ,-0%4 rn 0- E-4 .4 -4 n-
04 >4 >
0%.N h -4L a \ O\O r-4U r -%0 ON O. -4 C a%%O
0u E-4U -40 ' t4 0%%
-4 4 - -4S4 4 -I
F-4
Ch 14 Lt') 0%U - ILr) 0 %OD tl\ 00'.0 r-.uNO 0 0 1-4 1 r-o Or4' Dti
G\ -4 ,-4 aI ON4 r-4 r1--4H ONC
F-4H1-U
u- u
0L V) LIL 0%vE-4 %Do E F- 0%\ 0 E-4~. 0vn~ V0 O40 .%%F-4 -44 P-4 -4W
> P4 w P:3 OE.4 u 2
u~ OO. u u- T~ u1 - = I-)' 4 :N
II4 if>4 ý
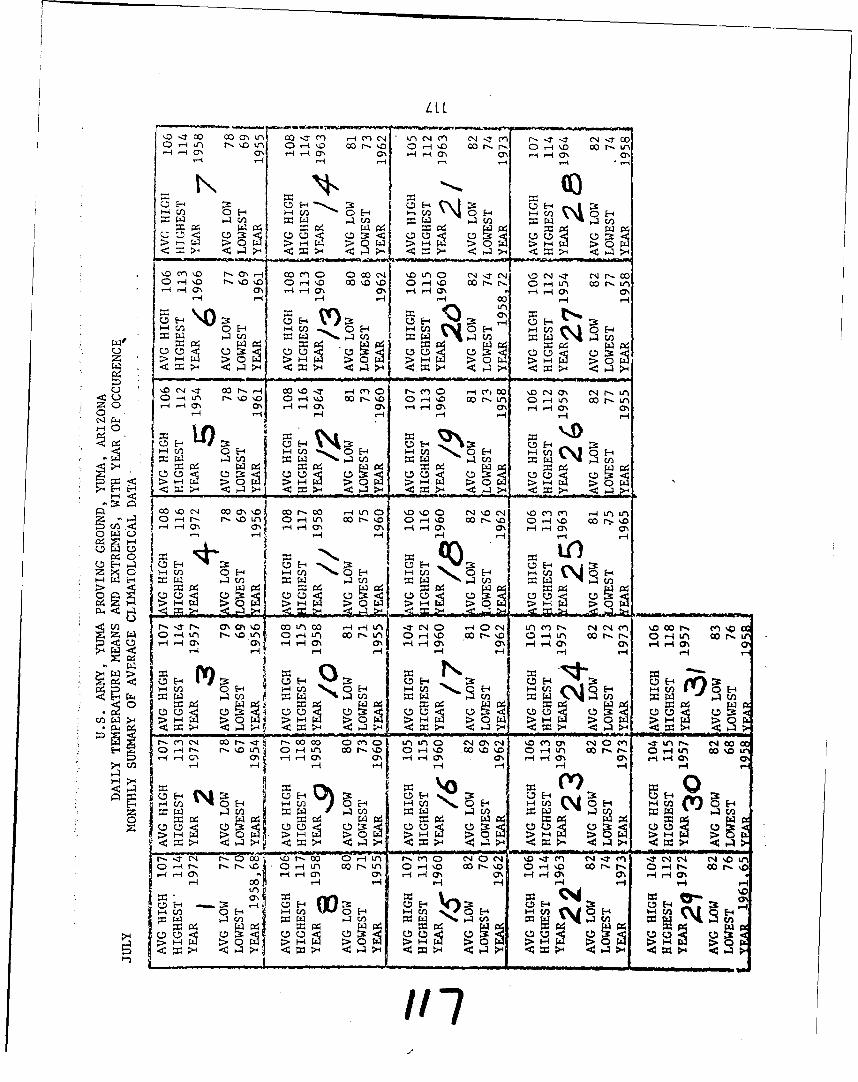
'~D 00 00a'sLfn 00 ITM 1 I Un N c C14.t- j-. CN -TCO0
CC -4H~ 'a' r-Ha ON c r-ýa% a
0 Hf to E-
uc/ OHc u -QOH O:U; C) >>> 0 >
ýo 0, -i com 000 ýn n C4 I-N Z 14r> 00
\Da a'- Hýa' a' H1a1 00% 0 0 - 1 0 ,r -4 OI cor U')C\ r- Hi M r- H Hh
o - C4- t E-4 1, En.~ r-c~0 Hc ~ .~' 'r-rWA V 4U I-r =*~o~ wH i' O '%O 'r.4 r Hn .31 IV",
a' 0' >HO 0' HH '0' H 0'HO U >
-- LOH rLA ý o~ C) % 0r- \o 0 -\. o 00 ~r-. 0Hn C)-4Ln 00f-O
E- H 0 H - H H E-4
HH-4 a-4 HH41'H 0 0' H 0
a\I OH 1- -4f OH OH- C
E-4V 4 ~ UH 0 F O4 0 z41- ( EEn ~ ~ ~ w OVHý / wN 2(> H y =/ W' u N O HO
aH G\~ 1H - T-HIM O 4 - O N~) r-4~ OH HNC\ t4rO
0 o P4 00
8-4 >.A 44- 4
r-C)C4 O) --rI r 0 0 0M0 Lr nC * " 74m -knr 4(Oo
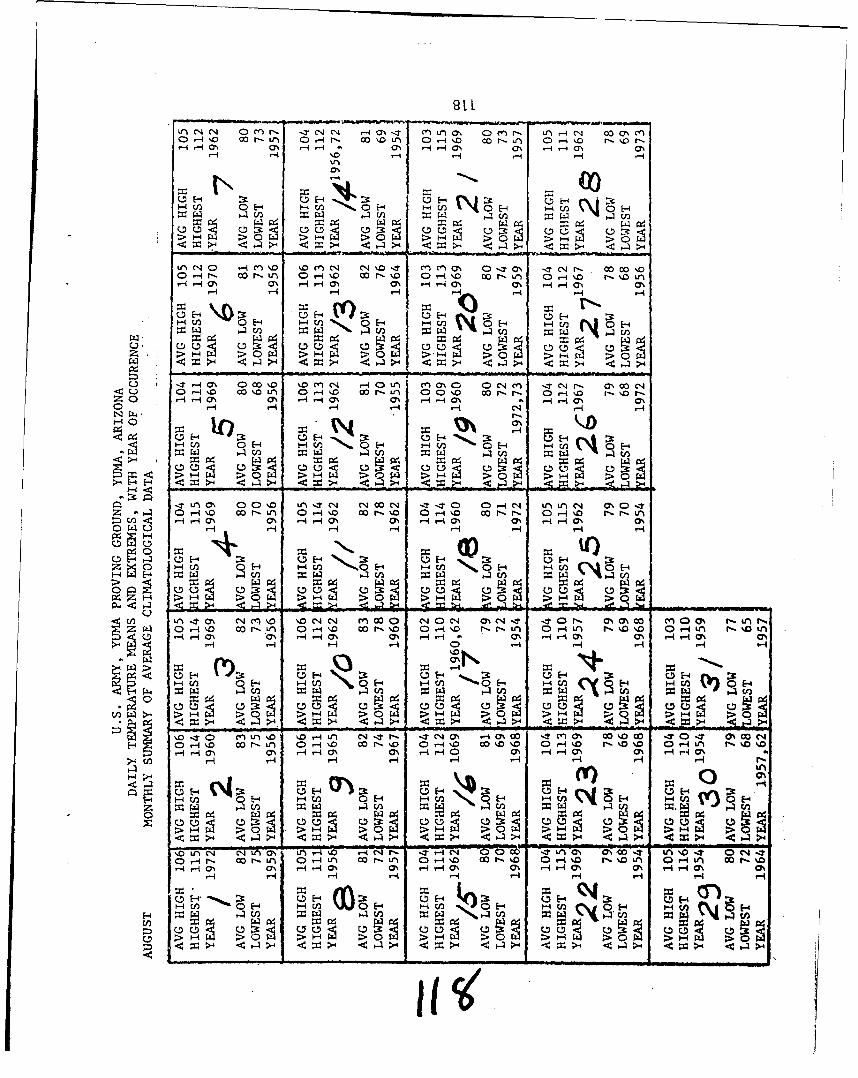
Ln NCN c OCr'.-7NC 1- H01% -1 ( %ii a 0 CV)r L d~CN. 00 % c0 1-4% C00r- Lrn 0H -4r c~o 10 n O1-4 co P- '00 .or
I- -N0* 14 -4 0% 1-41-4ON 0% 4 4ONC
U E- '0: u H :t
(Hn \ w . F- -- O c -OH = 0 n H
aH % % 1-4 HHas0 ý -% CN 14 ON a%
:3 E-4 D
H m -4'4 -4E i
C-) U1-4 ON '00iD -.0 m N r-4~C -ncnCF C O-C14 LAfn 0%00C1z 0 Oy7%' cot-L Or-4 m cor-' O,-t' 1-4 ON -- O r-4'. m -r-7%0:c2 r-4HO 0%i r--40 H-0 % H %
wH c w rL nZ~~~O 2-4u OH4 2-c >.O ý ~-4ci \O
Oa =, 00< O:*4<
-. T % c\ICI'.0 ItC' C14 OD -TOC 0C-4 t U)L - Cr-. 0%% IT0 -Lr.o~ OHi %. 0r--.Ln OH-10 co r--%0 0H' r'(.oL OHL *tO' PL 0 %0 r- -
HO - % ON 1-4-4 01% HH4 r a 0% H4 .- i0% ON H 0%0H4 H H
u Ii CP u. E-. H 1ý-4 0 H 0 OH1 W 0H E-
H > 0 m
n--T0 a% iA' '0H CO 0 N~ -30 O H0%-IT -.1?c 0% co m~ -:0-. 0 % coC-w O0H1'% co t-.L V) 0H' 0 0t-0 rNO H% 1 D Ln' 0H' %a-%0 0H-1Ln N r'%n
u0 ON a%0 0%i r-IH ON Hm f-4 - m
j H- H H. H- )& H H n Hý 'p(n ML C)E- wA)-0~ u
LA Hl% D L C-4 t-T - I N 1 mc -3r LA as 00%0 00 - 0 aA 0-? 0 04 -1O r-1 110 0r-L OHLA 011D o r- L%0 0 1%00 0 o-%r) OH'.0- ý r-%.~0 %0 0 -O Lf cor-%0 %
wH0 0% HH-4 'n HH0% 0 % E-4% 0%4 HH0 EH Hw
Hm 44
>ýZ : lFI6
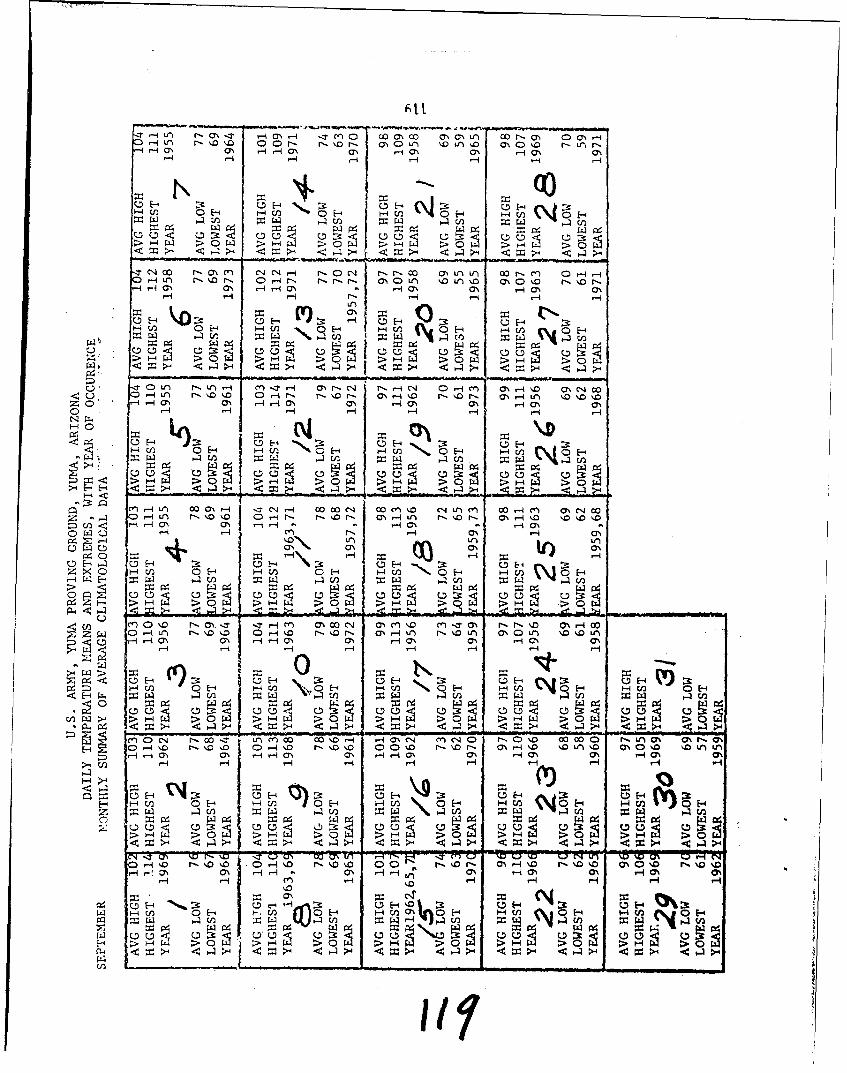
'- n ý. ý C)O 0O' r - rC'1 7%0 I r \OO\ O 'Lf) 1.0O mC o r LH-iON O\ rH - HOC, -I a\ m' ,-4 a\
HH -4 H H 1-- H-
con
u E- Ng0-CI E H V)C>H
> >H0 0 ~ t-4 2 0n: m 0 n' H> 0O < H H<
-- 1 0 r \M C4 -H Or 0 O L f 0r l -
E-4 " o H 14 En E
0,~ HHO\ HH Lil HO' M HO'4C\r C "ý \1 D C 4C
00
H H 4 HNH H H -4,
u U=
HH0 0 H0-4 0' HH0 > 0' HO > 0'
0 w 0"4 ON ~ H- 'L '0 . U cN i . .00
'.0 0 r -'.0r-q V0'
H- H4 H- H H H H.W~~ ~ ~ E- ' 4'. 0
>H~04 P400H
0 u 1½u
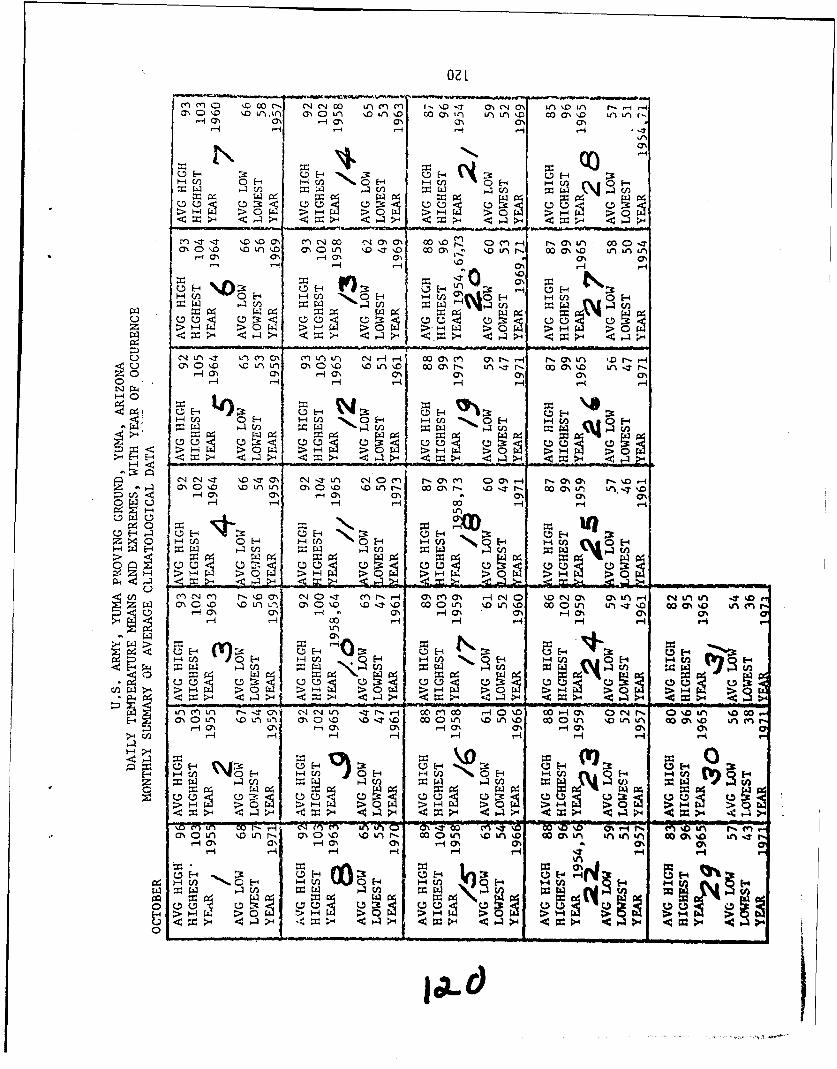
021
A- 1- -4 4 .-
Otn 0
'-4-P 4 -4 -4 '-
> 0 u 3o'
Zm IT0 10 'oO C-4 00 4ONO 0' 0 %Dm 4 r NW 00 C) -TOr-4 aN -4 m ~ m4 a%4 a%
4-4U~ %OH 4-4Ur 4
>ON
-~C , 4
Cý l I Lfn MVLr m-~ CY) U')LO) *C4 cC)iC 1- 0O .n4%rI-4O ~ c04 ONr- O01r 'OD) 0' Not NO wl I) .0 No N.0 if N 0 C% r- t 'T 0 rý'. 00 Oa% %z LrLt V0'% -7 r
C q a 01 -1 a% 0\ ON,0 ON C\40 ON 0
'-) -%_ E4 ýj E % o k- ý4 U)>-4
>> 0' ý-40 0' ! -40 0' 0".'-4 -4 -4 -44 -4 1-4 -
rHU) -1 -.H -4 'JOLn
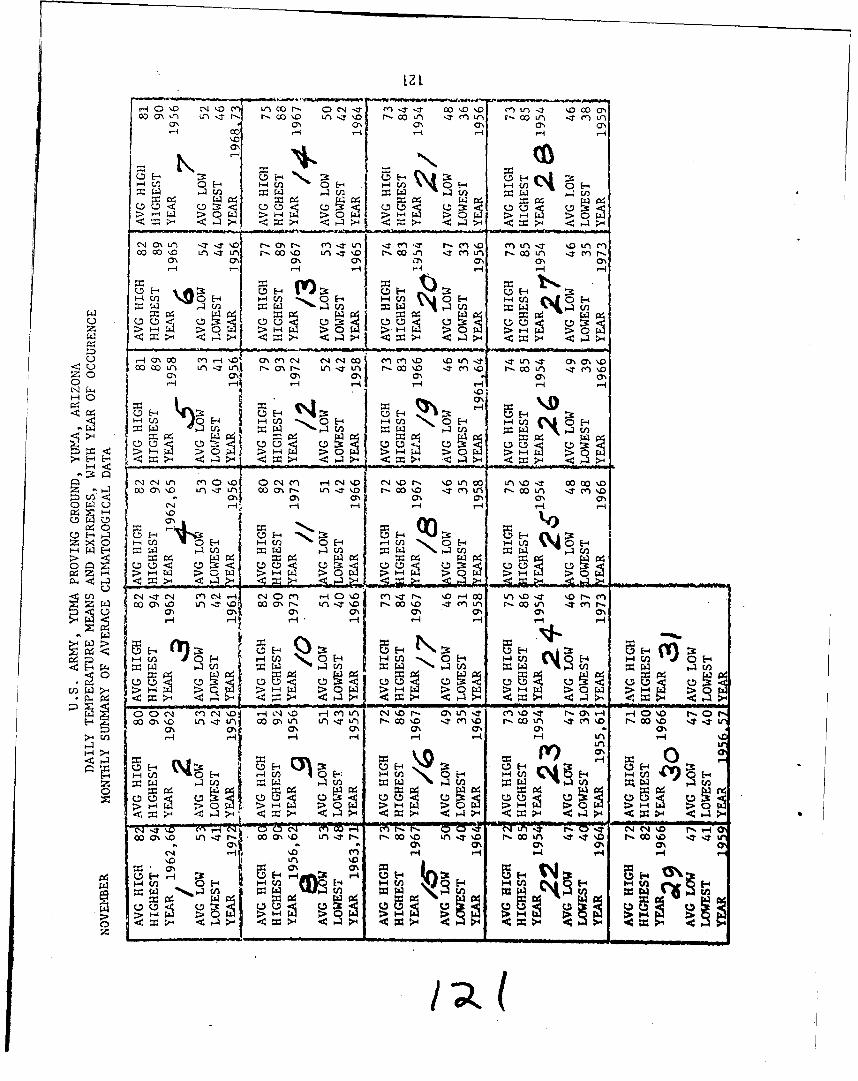
ON~ C(N NONa
ý--o
DE- -. u-" :3
FD4 uV) LU4-c 9
I *~ >4 ~ - >4 >-f 4
O H 0 E- [- E-
>4 < 4 4 < >4> 4;.
01 0' 0% a\ M0a'O0 -1-1- r-4I
H- 0 U E-ýg :3 NE-4 'AJ4
E-4 ý- 4 E n O E- -4~f V) 0 4 E-4
u~- P< Q)UU
0% w% 0 % w > 0 % 0% > 0
C O N , 'O N ON
H H 4 L H H) H- H- 1 rE
0R 0 0ý4 0 >
-- C14 cn N -4 0 cn - C) % H C~r r%- OO-.4 00 Ln% .T % rO. cn IN0 r-UN aN aM0% NmO
CN H :3 E
ýA OHH W nP 11
0 ELI t- P4~ =U6U3 U HUSU§ 6 . U
n _ _ _ _ _ _ _ _ _ _ _ >__ __
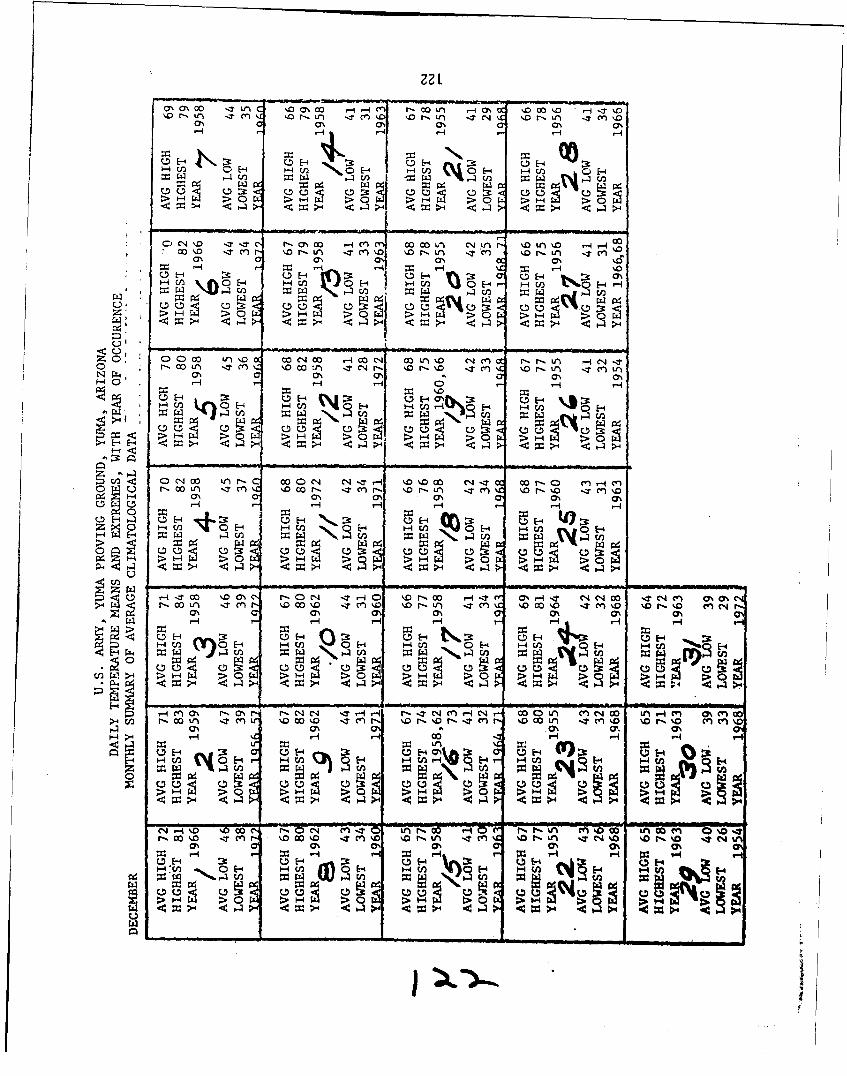
- ~ - - - -4 -4
0 E- n '>*,0p0 E- 14
43 .
H U ~f0H -IU I7OU E-~~'- E-4~~~~O-
H-4 U) E-4 F-4 0n '-I -4 H H qWH C4E q O'.Eax~~0- P4j w0 -~fI O
H 0w >>0> > > 1-4
U2< ~ ~ ~ ~ ~ > >~ <~r =~C. C'-H %.> '- c-O C--
N r1 0O -taO
Zý -4Ci rnH -4 (A~ fr-4U 1-4 W 0 E-4
>' 00 1-4' % '-1 p-4 ;P-4 HC v-
0 04~ 00' V r- c 00 r. C14 N-1,r-l %0%00 c,)C4 T o OU r C Cn 14~ C A-4l %
C' + . 0 E- r. '. H ~ t- -CO & '- I-4 En C0 E-4 ~ A C ..
4 PN
*4: ~ ~ ~ ~ ~ i 0i4d 4:4ý4I2 : 4~b' '
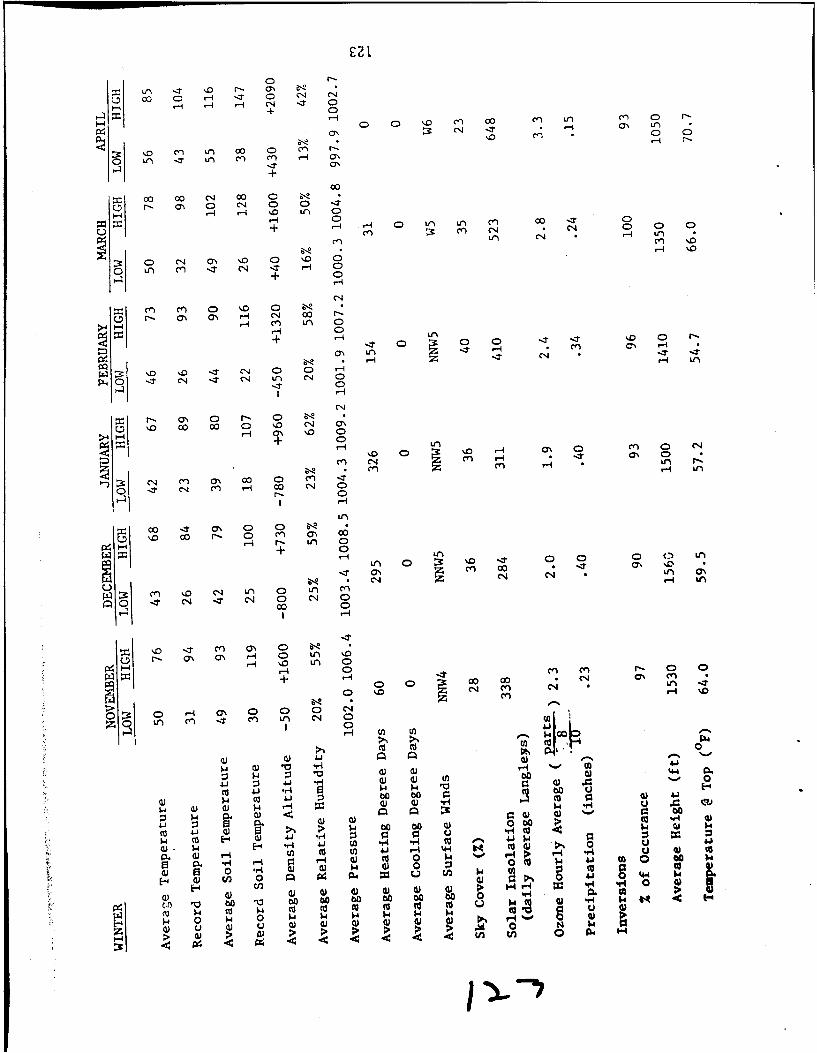
u 0 0 -4 -7 0 C14 4
+ 0
a' ~C-4 -ýT
0l U') 00L~ C C) C
+
00 r- C,4 00 C'
Hr 0
0 ('4) U') 000 0: C. *-
+ -i CV) -14
CJ C? CH 0
+ C
(y) 0n c . C
H4 Clf Lf) 0H- 0 L+ rH .
00
0. '0 -o C' 0 C4 Ha
>4 HI-LI
zr- C14 o r- 00 C-
co --Tc c
%D0 00 0 m~ 0 c0
H 14 r- nH LIA
~ ~ ~ ' co C~ -0~C -LA4 C H C '
0 . C14 r- 00 a
00 0
0'. 0 0A) U
1.0 * :j '
r-4I a%
C'41 0 D
'.0 -0 tf) a' 0
H 4-b 1 0~
H 0 o b m '~ 0 0 01
:3 0 w' a)m r 04
00 Q) 0 o ;
H Cl) 0 - c
r-4~ 0 b
0) 0. U04
H) CA* a) H r4 4 0
W0 a) i 10 12:Q W4ýN t
:2c0
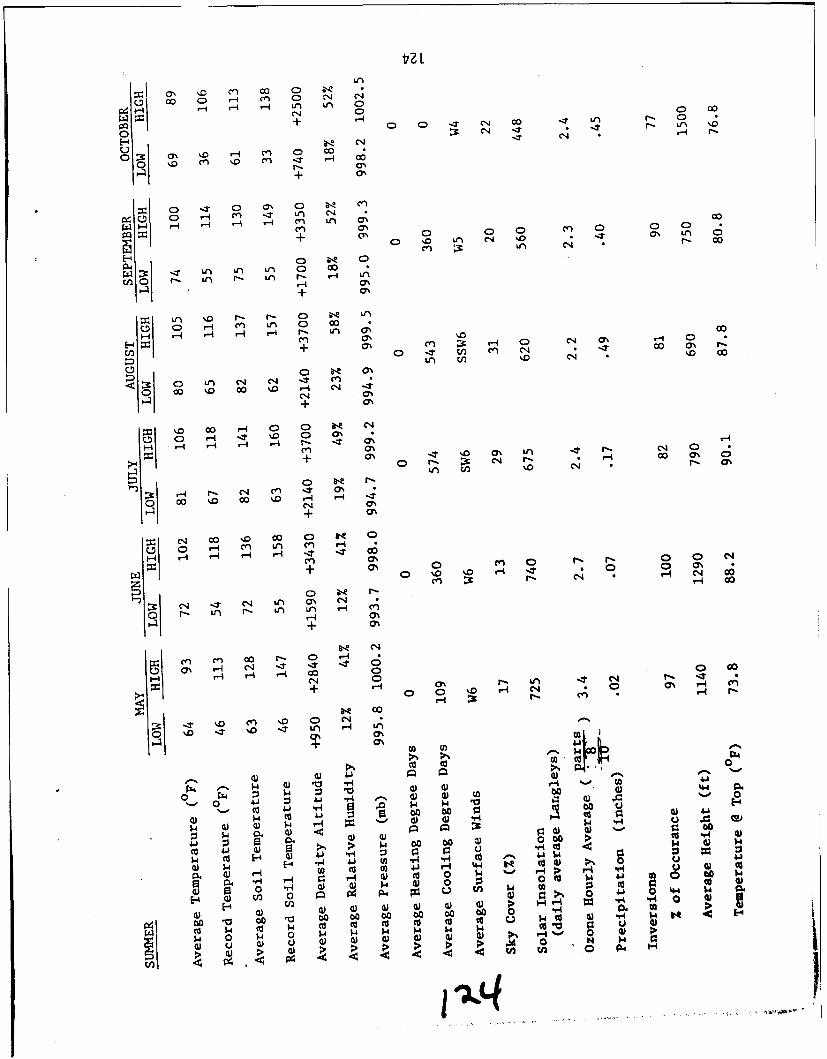
-Z Ln
0 r-4 co CD c
+ -4%
0 0% Ln C ý
+ 0 D'L
M ý3 -t 0 % 00
C0 I'M C
+n 0- '0 U '4'0 ~ % U
cno -s U r- Ul r- .-4 U
+ 0
U, ' r-I r-i r- Ln
0% '0 :3:o-+
00 ON- ~ 4 0 -
UT (n '0 %' 0 00
CD L0 N -1 %
<:3 0 U, C4~ -t4
0 C '0 C 0 -4 0J -
a% ý14 00 0 N
r-4r -t 000 co
+0 %D -t ' % ,0 r -
o- r- -n r- * o6%
, ~ r-I C'4 r -T 0%C-
+ %0C4%q Q
:3 C1 u 4 tn -C C
+- 0 v r - o N
cn r-
00I * -I c-
a% r-4 y-4
-- T -4 60-4 0\
0 0%
00
0' 0 0 0)
a) co
o4 0 '0 * % 4 (u-o H
co uI r-
to0'0 0 ('I
0'0
o 41 0 0V to
1.444-j1- 4
~~P u 0u- 4 1. aJ4E-4 0) U) 0 V4 V4 0 o
U)CU CU0)C. P-4C aGo 10 (3 CO o bo 00 60 60 cc j- 4
0) 4) > i %n 064-~ ~
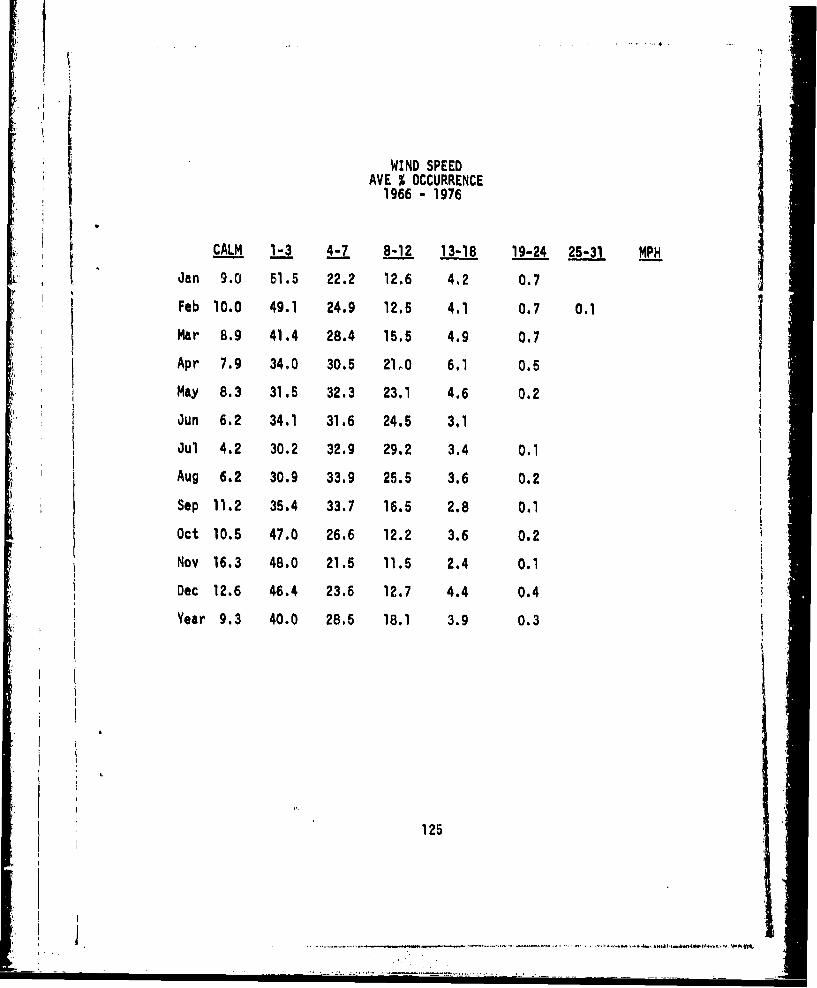
WIND SPEEDAVE % OCCURRENCE
1966 - 1976
CALM 1-3 4-7 8-12 13-18 19-24 25-31 MPH
,Jan 9.0 51.5 22.2 12.6 4,2 0.7
Feb 10.0 49.1 24.9 12.5 4.1 0.7 0.1
Mar 8.9 41.4 28.4 15.5 4.9 0.7
Apr 7.9 34.0 30.5 21L0 6.1 0.5
May 8,3 31.5 32.3 23.1 4.6 0.2
*Jun 6.2 34.1 31.6 24.5 3.1
Jul 4.2 30.2 32.9 29.2 3.4 0.1
Aug 6.2 30.9 33.9 25.5 3.6 0.2
Sep 11.2 35.4 33.7 16.5 2.8 0.1
Oct 10.5 47.0 26.6 12.2 3.6 0.2
Nov 16.3 48.0 21.5 11.5 2.4 0.1
Dec 12.6 46.4 23.6 12.7 4.4 0.4
Year 9.3 40.0 28.5 18.1 3.9 0.3
125
J .. ,____ _ •
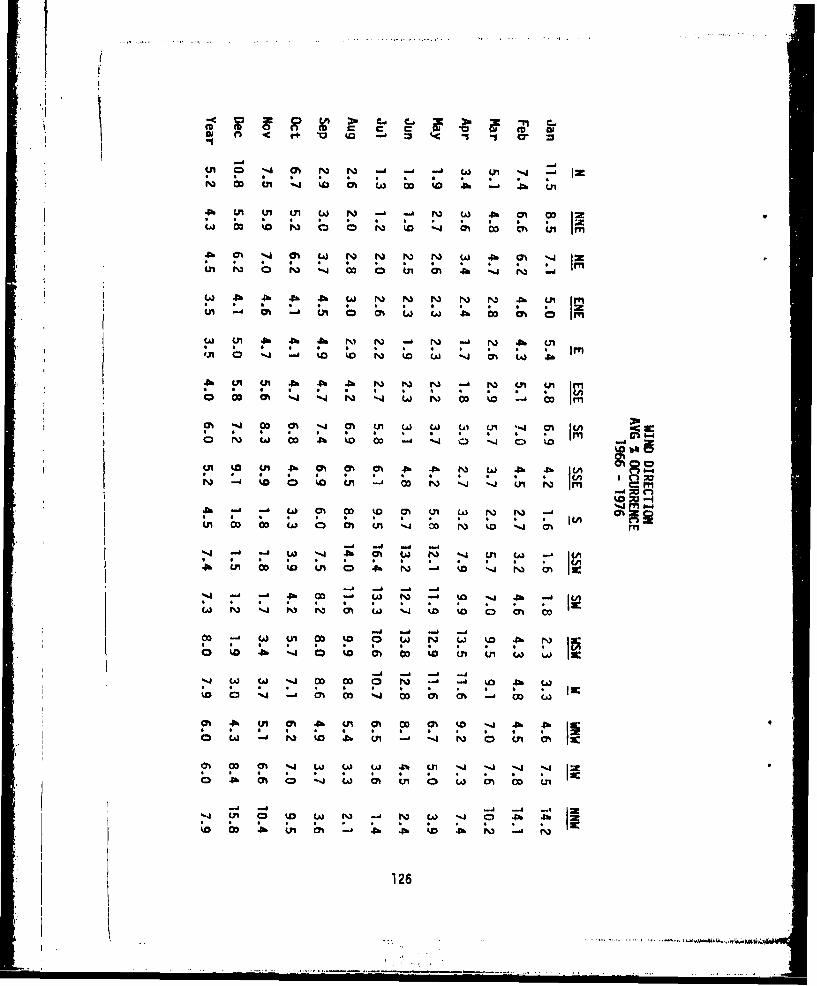
cI Ml (o co to -. i(
01 ~~7 71 :J 0 N - ' -j() U IZN % CA wA 03 to .01 -lb . L
. ~ ~ ~ ~ ~ 0 Li 7 T A) N -4~C IZ
01 m 0 r% -4 M3 0 07 0M . %
WA -lb 4b -b 44 W N N N N 44 Lv
(A 1 b .%a N N) *- h cn .b
01 0 %J *~ o to N t C 0 J01 6A rb
CA %A Mo M1 ýJ 0M £1 WA W (A) t" qa 0A IC i;1 0 * a 6 'p 0 * 0
0o N %A) 0M 00 to3 03 0 4 -J 0
h w~ tl 00 to Lm -n Co N NJ~ . 31 IF'1
.0. -' to LA) 01 Co t 0 T () N
-0 -A 0 W 0 W W ,n W W W W
LII~ ~ 10 4U La 1 LI JýN t J INC
Wa -j -ob ap
!A ! a In *4 'Q '- tl JQD ith Mo CD -4I 0 MD tN " ý - 0
-4A%J ~ ~ ~ 0 dh r%)I C L) N - t I -
* 0 126

CLMATOLOGICAL 3IOI•AY
QUAZZUaZUI Latitudei 33" 40" .667Longt:tuds: 114" 14" .233Elevati£on -(FT)%: 890
leans for Period 1941-1970 ('42-'59 MSu8ing)
ktrame for Period 1931-1972 ('42-'59 Missing)
Part I - Temperature
Nmnth Temperature (*F) Meanmeans Ib tremes Degree
Dal Monthly Rmcord Record Days**-a m..._..in Hiahest Year Lowest Year -
Jan 65.0 36.8 50.9 87 1971 15 1971k 438Feb 71.3 42.0 56.7 88 1972* 18 1933 248Mat 77.4 46.9 62.2 100 1934 24 1971 131Apr 65.2 53.4 69.3 111 1936 33 1933 35May 94.5 63.0 78.8 115 1934 40 1967 4Jun 103.0 71.9 87.5 120 1936 50 1933 0Jul 108.6 81.0 94.8 124 1934 62 1939* 0Aug 106.1 79.7 92.9 124 1933 53 1970 0Sep 100.4 70.3 85.4 116 1937* 45 1934 0Oat 90.4 58.3 74.4 108 1930* 30 1935 0Nov 75.4 46.2 60.8 94 1937* 20 1931 152Dec 64.4 36.3 50.4 84 1933 19 1934 447
Jul JanTear 86.8 57.2 72.0 124 1934* 15 1971* 1462
* lecord equaled In earlier years.**Uase for degree day data is 65 degrees Fahrenheit.
Intl I Page 1 #f 2
127

CI•FATOLOGICAL SMU3ARY (Con't)
Part 11 -Precipltation Totals (Inches)
EstimatedMeban Rltaltive
Snow. gleoat, Ia1 BtyGreatest maKINIO 0600________Doi I Mean MOMsh& Year M . !K!L
Jan 0.51 0.65, 1941 0.0 1.8 1937 47 29Fab 0,35 1.10 1931 0.0 0.0 39 24Mar 0.40 1.06 1941 0.0 0.0 34 17Apr 0.19 1.15 1931 0.0 0.0 32 17May 0.00 0.11 1935 0.0 0.0 22 13Jun 0.01 1.40 1938 0.0 0.0 21 9Jul 0.43 0.80 1937 0.0 0.0 31 16
Aug 0.74 2.00 1941 0.0 0.0 39 21Sep 0.46 3.00 1939 0.0 0.0 34 20Oct 0.30 1.75 1932 0.0 0.0 34 21Nov 0.46 1.30 1969 0.0 0.0 33 24Dec 0.52 1.28 1938 0.0 3.0 1932 .43 34
Sep DecYear 4.37 3.00 1939 0.0 3.0 1932 34 20
Part rII - Statistical Sunuary (Days)
* Tou~gratureMaximum minluma
Precipitation 900& 32& 32" & OMout.._h .10 Inches or Moer Above Below Below Below
Jan 2 0 0 11 0Feb 2 0 0 3 0mar 2 1 0 1 0Apr 1 12 0 0 0May 0 22 0 0 0Jun +4 28 0 0 0Jul 2 31 0 0 0Aug 2 31 0 0 0Sep 1 29 0 0 0Oct 1 20 0 0 0Nov 1 1 0 1 0Dec 1 0 0 10 0
Year 15 175 0 26 0
+Less than one half.
Incl I Page 2 of 2 128

'.]1
ANNEX C
LIST OF REFERENCES
129
REFERENCES
1. Department of the Army, Field Manual FM 31-25, Desert Operations,Headquarters, Department of the Army, February 1972.
2. Analogs of Yuma Climate I-XI, US Army Natick Laboratories, Natick,Massachusetts, 1958-60.
3. Kolb, C. R.; Dornbusch, w.k. gr.; 1. Analogs of Yuma Terrain inthe Middle East Desert; 2, Analogs of Yuma Terrain in the NorthwestAfrican Desert; 3. Analogs of Yuma Terrain in the Northeast AfricanDesertz 4. Analogs of Yuma Terrain in the Central Asian Desert; USArmy Engineer Waterways Experiment Station, Vicksburg, Mississippi.
4. Llewelyn, W., A Contribution to the Philosophy of Climatic DesignLimits for Army Materiel: Extreme Hot Desert Conditions, TechnicalReport ETL-TR-72-5, US Army Topographic Laboratory, Fort Belvoir,Virginia, June 1972.
5. Ibid
6. Meteorological Summary Yuma Proving Ground, Atmospheric SciencesLaboratory Meteorological Team Yuma Proving Ground.
7. Environmental Protection Branch, Research and Development Division,Office of the Quartermaster General, Report No. 200, Handbook of YumaEnvironment, Washington, February 1953.
8. Barnett, F. H. Jr. , Surface Materials and Terrain Feature of YumaProving Ground, Part I Summary Description, US Army Engineer TopographicLaboratories, Fort Belvoir, Virginia, May 1975.
9. Lowe, Charles H., Arizona's Natural Environment, University of ArizonaPress. Tucson, 1964.
10. US Army Yuma Proving Ground Installation Environmental Impact Assessment.
11. Ibid
12. Bond, H. J.; Sleight, R. B.; Human Factors in the Design of DesertEquipment; Applied Psychology Corporation, Washington, D.C. 1954.
13. Revesman, Stanley L., Report on Preliminary Observations of HumanEngineering Problems Under Desert Conditions, HEL Technical Memorandum 11,November 1954, Aberdeen Proving Ground, Maryland.14. Snyder, W. L., Desert Testing Military Vehicles, Yuma Proving Ground,
Technical Memorandum AD-13-68, December 1968.
130
!~~ ..i" ..' ..ii ...... ...... '.ii.i...- -
tI
REFERENCES (cont)
15. Resnick, M.- Riedinger, V. T.; Munitions Testing at Proving Groundsin Desert, Arctic and Tropical Environments, Technical Memorandum, 1607,Picatinny Arsenal, Dover, New Jersey, September 1965.
16. Engelhardt, Robert E., Characteristics of the Dust Environment Inthe Vicinity of Military Activities, Southwest Research Institute, SanAntonio, Texas, Department of Automotive Research, 1968.
17. TECOM Test Operations Procedure 1-1-007, Desert Maintenance Consider-ations, August 1973.
131
ANNEX D
Bibliography of Desert Reports
132
BIBLIOGRAPHY
Desert Environment
Environmental Protection Branch, Research and Development Division,Office of the Quartermaster General, Report No. 200, Handbook ofYuma Environment, Washington, February 1953.
Rezin, John., The Octurrence of the World's Deserts, TechnicalMemorandum RO-2-67, Revision 1, Yuma Proving Ground, October 1967.,
Brooks, W. E., Discussion of Desert Terrain, Yuma Proving Ground,TecIV.,ical Memorandum RO-I-67, May 1967.
Brown, G. W. Jr., Desert Biology, Volume I, Academic Press, NewYork, 1974.
Ohman, H. L.; Pratt, R. L.; Yuma Winter Microclimate, TechnicalReport 66-7-ES, US Army Natick Laboratories, Natick, Mass.., June 1966.
Dodd, A. V.; McPhilImy, H. S.; Yuma Summer Microclimate, US Quarter-master Research and Engineering Center, Environmental ProtectionResearch Division, Technical Report EP-120, November 1959.
Bennet, Ivan., Yuma Test Station, AZ: Hourly and Daily InsulationRecord, 1951-62, Earth Sciences Division, Technical Report ES-15, USArmy Natick Laboratories, Natick Mass.
Barnett, F. H. Jr., Surface Materials and Terrain Feature of YumaProving Ground, Part I Summary Description, US Army EngineerTopographic Laboratories, Fort Belvoir, VA., May 1975..
Millett, J. A.; Barnett, F. H.; Surface Materials and TerrainFeatures of Yuma Proving Ground, Earth Sciences Laboratory,Technical Report 71-56-ES, US Army Natick Laboratories, June 1975.
Rezin, J.. B., Determination of Yuma Proving Ground Mobility TestAreas and a Procedure for the Comparison of World's Deserts, YumaProving Ground 0054, October 1970.
Environmental Protection Research Division, Technical Report EP-35,The Daytime Influence of Irrigation Upon Desert Humidities, Head-quarters Quartermaster Research and Development Command, Natick,Mass., May 1956.
133
Desert Environment (continued)
McGinnies, Willam G., Deserts of the World, University of ArizonaPress, 1968.
Cloudsley, J. L., Biology of Deserts; Institute of Biology; 1952.
Lowe, Charles H., Arizona's Natural Environment, University ofArizona Press, Tucson, 1964.
Appleby, J. Fred; Ohmstede, W. D.; Vertical Temperature Gradientsin the First 200 Feet of the Atmosphere of the Arizona Desert, USArmy Electonics Research and Development Activity, Fort Huachuca,Arizona, No. 1, January 1963.
Llewelyn, W., Climatological Conditions Favoring Occurrence of HiahTemperatures at Yuma Proving Ground, Arizona, AD 648 016.
Analogs of Yuma Climate I-XI, US Army Natick Laboratories, Natick,Mass., 1958-60.
Ohman, H. L., World Areas With Higher Temperatures than the YumaProving Ground, Army Engineer Topographic Laboratories, Fort Belvoir,Va., August 1974.
Terrain Study of the Yuma Test Station Atrea, Arizona, PurdueUniversity, March 1955.
Kolb, C. R.; Dornbusch, W. K. Jr.; 1. Analogs of Yuma Terrain inthe Middle East Desert; 2. Analogs of Yuma Terrain in the NorthwestAfrican Desert; 3. Analogs of Yuma Terrain in the Northeast AfricanDesert; 4. Analogs of Yuma Terrain in the Central Asian Desert; USArmy Engineer Waterways Experiment Station, Vicksburg, Miss.
Ashburn, E. Y.; Weldon, R. G.; Spectral Diffuse Reflectance ofDesert Surfaces, Michelson Laboratory, U.S. Naval Ordnance TestNation, China Lake, Cal, 1956.
Desert Effects
Department of the Army, Field Manual FM 31-25, Desert Operations,Headquarters, Dept. of Army, February 1972.
AMCP 706-115, Engineering Design Handbook, Environmental SeriesPart One, Basic Environmental Concepts, July 1974.
Brooks, W. E., Handbook of Desert Environmental Testing, Chapter 9,The Influence of Terrain on Desert Environmental Testing, YumaProving Ground, Technical Memorandum MI-9-68, April 1968.
134
... • • . - '. .., -... -• .;,,, ,- • ' • ... _ ._ • • -- * ,•ff ,,, • .' ' .'
Desert Effects (ccntinued)
Holder, Dale Sp 5., Criteria for Storage Exposure in Desert Environ-mental Testing, Handbook of Desert Environmental Testing, Chapter8, Yuma Proving Ground, Technical Memorandum, MI-168.
Environmental Protection Branch, Research and Development Center,Headquarters Quartermaster Research and Development Comnand, Techni-cal Report EP-27. Occurrence of High Temperatures in StandingBoxcars, February 1956.
Dantowitz, A.; Htrschberger, G.; Pravidlo, D.; Analysis of Aero-nautical Equipment Environmental Failure, Technical Report AFFDL-TR-71-32, May 1971.
Revesman, S. L.; Schulze, F. W.; Measurement of Temperatures inVarious Ordnance Equipment Under the Desert Environment, HEL,Technical Memorandum 14, February 1956.
Clements, T.; Mann, J. F. Jr.; Stone, R.; Eyman, J. L.; A Study ofWindborne Sand and Dust in Desert Areas, Te~chnical Report ES-8, USArmy Natick Laboratories, August 1963.
Randall, B. R., Crew-Compartment Temperatures: The Effects of aSolar-heat Reflecting Paint, HEL, Technical Note 4-66, July 1966.
Llewelyn, W., A Contribution to the Philosophy of Climatic DesignLimits for Army Materiel: Extreme Hot-Dosert Conditions, TechnicalReport ETL-TR-72-5, US Army Topographic Laboratory, Fort Belvoir,Va., June 1972.Sisserwine, N.; Comp, A.; Climatic Extremes for Military Equipment,Environmental Protection Branch, Report No. 146, Quartermaster
General Research and Development Laboratories, November 1951.
Environmental Criteria Branch, Geographic Sciences Laboratory;Environmental Effects of Materiel; US Army Engineer TopographicLaboratories, Fort Belvoir, Va., April 1974.
Rodgers, S. J., Evaluation of the Dust Cloud Generated by Heli-copter Rotor Downwash, USAAVLABS Technical Report 67-81, March1968.
Snyder, W., Desert Environmental Testing, Briefing to NationalSecurity Industrial Association (NSIA), Yuma Proving Ground,December 1976.
Toppe, Alfred., Desert Warfare-German Experience in WWII, MS#P-129.
135
*)!
Desert Effects (continued)
Desert Convoy--Report of Environmental Operation, US Army Trans-portation Board; Fort Eustis, Va., February 1962.
Desert Training Center and C-AMA, Study No. 15, Historical Section,Army Ground Forces, 1946.
Sandler, M. H., "Development of an Olive Drab Solar Heat Reflectingand Lowi Visibility Enamel, Final Report, CCL Report No. 188, USArmy Coating and Chemical Laboratory, Aberdeen, Md., October 1965.
Devine, A. T.; Wegman, R. F.; Durability of Adhesive Bonded Glass-Resin Composites, Picatinny Arsenal Technical Report 4323, Dover,N. J., May 1972.
Hafer, Carl A., Definition of the Dust Environment for Purposas ofGas Turbine Ingestion--ETC, Southwest Research Institute, SanAntonio Texas, October 1960 (AD 472676).
Smeltzer, Charles E., Mechanisms of Sand and Dust Erosion in GasTurbine Engines, Solar, San Diego, Ca., Aug 1970 (AD 876584).
Kuletz, Edward; Schaffer, Howard; Survey and Study on Sand andDust, Naval Weapons Center, China Lake, Ca., August 1971.
Schafer, Howard., Damp Storage Temperatures of Fuel Air Explosive(FAE) Weapons, Naval Weapons Center, China Lake, Ca., May 1971.
Summary of Desert Tests--Summer 1955 Conducted by Corps of Engineers;Army Engineer Research and Developments Laboratories, Fort Belvoir,Va., August 1956.
Shamburger, J. H., Project OTTER (Overland Train Terrain Evaluation
Research) Technical Report No. TR-3.,588.
Engelhardt, Robert E., Characteristics of the Dust Environment Inthe Vicinity of Military Activities, Southwest Research Institute,San Antonio, Texas, Dept. of Automotive Research, 1968.
Bunch, M. Howard., A Study and Comparison of Temperate, Arctic, andDesert Tests of Mechanical Time Fuses, AMC R&D Directorate, Re-search Division, 15 November 1963.
Terry, F. L. C., Erosion of Aircraft Windscreens by Sand and DustParticles in High Speed Low Altitude Flight, Royal Aircraft Establish-ment, Technical Note No. Mech. Eng. 342, October 1961.
136
Desert Effects (continued)
YPG Report 294--Final Letter Report-Product Improvement Test ofLanding Vehicle, Tracked Assalut, Amphibian, Personnel Carrier,LVTP7 (Modified), October 1976.
All Environment Air Vehicle Operations, Army Combat DevelopmentCommand Aviation Agency, Fort Rucker, Al., October 1963.
Resnick, M.; Riedinger, V. T.; Munitions , Testing at ProvingGrounds in Desert, Arctic and Tropical Environments, TechvticalMemorandum 1607, Picatinny Arsenal, Dover, N.J., September 1965.
Neptune, M. D., A Study of Microbial Contaminants in Desert Environ-ments Affecting Materiel Use, Final Report, YPG Report No. 0136.
YPG Report No. 8020, Engineering and Service Test of Tank Collaps-ible, Self-Supporting, 1250 BBL Capacity.
Technical Report EP-118, Southwest Asia, Environment and ItsRelationship to Military Activities, Quartermaster Research &Engineering Center, Environmental Protection Research Division,Natick, Mass., July 1959.
Functional Performance Branch, Environmental Protection ResearchDivision, Technical Report EP-146, The Influence of Thermal-Pro-tective Ensemble on Physiological Stress in a Desert Environment,February 1961.
Revesman, S. L., Report on Preliminary Observation of Human Engi-neering Problems under Desert Conditions, HEL, Technical Memorandum11, November 1954.
Jellnck, R. E ; Hodge, D. C,; Visual Efficiency Under DesertConditions, HEL, Technical Memorandum 20, 1056.
Environmental Protection Research Division, Technical Report EP-44,Some Physiological Responses of Men Wearing Body Armor in theDesert, Quartermaster Research and Development Center, March 1957.Bond, H. J.; Sleight, R.. B.; Human Factors in the Design of DesertEquipment, Applied Psychology Corporation, December 1954.
Army Transportation Research Command, Fort Eustis, Va., US ArmyPanel on Environmental Research, Quarterly Meeting (25th) TCREC-61-125, October 196.
137
.... ... . ---.----..... ...... .-
I i
Human Factors (continued)
Conference on the Principles of Environmental Stress on Soldiers,Climatology and Environmental Protection, Research and DevelopmentBranch, Military Planning Division, Office of the QuartermasterI; General, August 1944.
Test Procedures
Part One, Basic Environmental Concepts, July 1974.
Snyder, W. L., Desert Testing Military Vehicles, Yuma Pro•vingGround, Technical Memorandum AD-13-68, December 1968.
I TECOM Test Operations Procedure 2.-4-001, Desert Environmental Testof Wheeled and Tracked Vehicles, May 1969.
TECOM Test Operatiotns Procedure 1-1-007, Desert Maintenance Con-[! siderations, August 1973.
TECOM Test Operations Procedure 1-1-006, Desert EnvironmentalConsiderations, August 1972.
TECOM Test Operations Procedure 4-4-001, Desert Environmental Testof Ammunition and Explosives, July 1970.
TECOM Test Operations Procedure 5-4-001, Desert Environmental Testof Missile and Rocket Systems, October 1968.
TECOM Test Operations Procedure 6-4-001, Desert (Field) Environ-mental Test of Communication. Surveillance, and Avion"c ElectronicEquipment, November 1969.
138
* -- -- •.= --.- . . .
APPENDIX E
DISTRIBUTION LIST
Best Available Copy
139
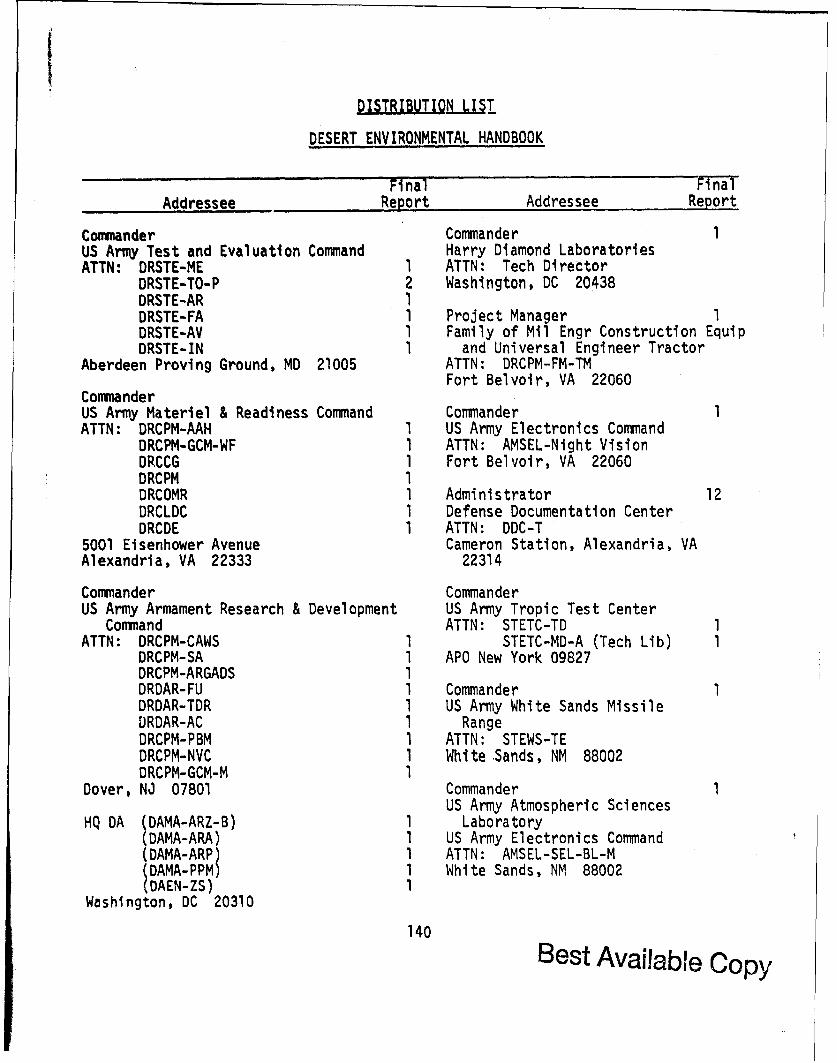
DISTRIBUTION LIS!
DESERT ENVIRONMENTAL HANDBOOK
Final FinalAddressee Report Addressee Report
Commander CommanderUS Army Test and Evaluation Command Harry Diamond LaboratoriesATTN: DRSTE-ME 1 ATTN: Tech Director
DRSTE-TO-P 2 Washington, DC 20438DRSTE-AR 1DRSTE-FA 1 Project ManagerDRSTE-AV 1 Family of Mil Engr Construction EquipDRSTE-IN 1 and Universal Engineer Tractor
Aberdeen Proving Ground, MD 21005 ATTN: DRCPM-FM-TMFort Belvoir, VA 22060
CommanderUS Army Materiel & Readiness Command CommanderATTN: DRCPM-AAH I US Army Electronics Command
DRCPM-GCM-WF 1 ATTN: AMSEL-Night VisionDRCCG I Fort Belvoir, VA 22060DRCPM 1DRCOMR 1 Administrator 12DRCLDC 1 Defense Documentation CenterDRCDE I ATTN: DDC-T
5001 Eisenhower Avenue Cameron Station, Alexandria, VAAlexandria, VA 22333 22314
Commander CommanderUS Army Armament Research & Development US Army Tropic Test Center
Command ATTN: STETC-TD IATTN: DRCPM-CAWS I STETC-MD-A (Tech Lib) 1
DRCPM-SA 1 APO New York 09827DRCPM-ARGADS 1DRDAR-FU 1 CommanderDRDAR-TDR 1 US Army White Sands MissileURDAR-AC I RangeDRCPM-PBM 1 ATTN: STEWS-TEDRCPM-NVC I White .Sands, NM 88002DRCPM-GCM-M 1
Dover, NJ 07801 CommanderUS Army Atmospheric Sciences
HQ DA (DAMA-ARZ-B) 1 Laboratory(DAMA-ARA) 1 US Army Electronics Command(DAMA-ARP) 1 ATTN: AMSEL-SEL-BL-M(DAMA- PPM) White Sands, NM 88002
DAEN-ZS) 1Washington, DC 20310
140 Best Available Copy
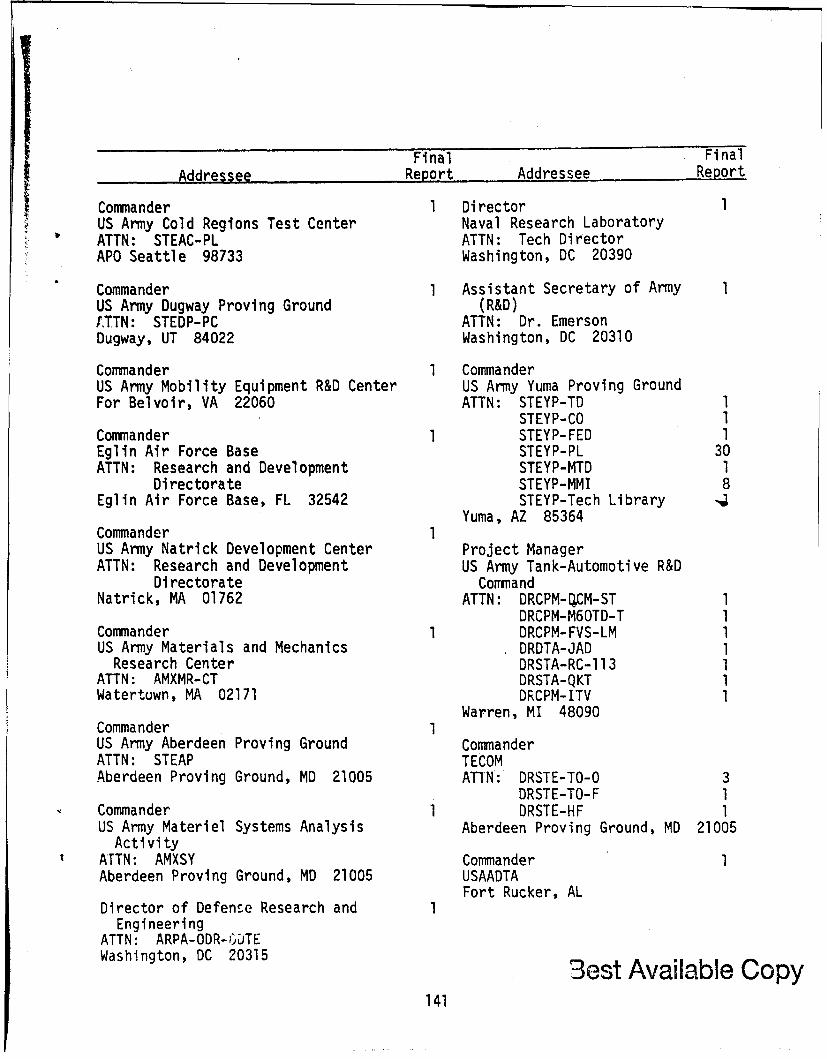
Final FinalAddressee Report Addressee Report
Commander 1 Director 1US Army Cold Regions Test Center Naval Research LaboratoryATTN: STEAC-PL ATTN: Tech DirectorAPO Seattle 98733 Washington, DC 20390
Commander 1 Assistant Secretary of Army IUS Army Dugway Proving Ground (R&D)fTTN: STEDP-PC ATTN: Dr. EmersonDugway, UT 84022 Washington, DC 20310
Commander 1 CommanderUS Army Mobility Equipment R&D Center US Army Yuma Proving GroundFor Belvoir, VA 22060 ATTN: STEYP-TD 1
STEYP-CO 1Commander STEYP-FED 1Eglin Air Force Base STEYP-PL 30ATTN: Research and Development STEYP-MTD 1
Directorate STEYP-MMI 8Eglin Air Force Base, FL 32542 STEYP-Tech Library -,
Yuma, AZ 85364Commander1US Army Natrick Development Center Project ManagerATTN: Research and Development US Army Tank-Automotive R&D
Directorate CommandNatrick, MA 01762 ATTN: DRCPM-IEM-ST 1
DRCPM-M6OTD-T 1Commander DRCPM-FVS-LM 1US Army Materials and Mechanics DRDTA-JAD 1
Research Center DRSTA-RC-113 1ATTN: AMXMR-CT DRSTA-QKT 1Watertuwn, MA 02171 DRCPM-ITV 1
Warren, MI 48090CommanderUS Army Aberdeen Proving Ground CommanderATTN: STEAP TECOMAberdeen Proving Ground, MD 21005 ATTN: DRSTE-TO-O 3
DRSTE-TO-F 1Commander 1 DRSTE-HF 1US Army Materiel Systems Analysis Aberdeen Proving Ground, MD 21005
ActivityATTN: AMXSY Commander I
Aberdeen Proving Ground, MD 21005 USAADTAFort Rucker, AL
Director of Defense Research and 1Engineering
ATTN: ARPA-ODR-;')DTEWashington, DC 20315 3est Available Copy
141


![CIS medical medical ï279-0012 3-70 A4-l TEL : 047-374-3100 ... · made Japan . CISE QR2— CISEläs 145mm 42 mm 35 25 CISE (01 • 99)/ YL CISE [mm] Y (CISE) 26.6 CISE 30 43.8 18.0](https://static.fdocuments.us/doc/165x107/5f4696d3563f08072f1ba13d/cis-medical-medical-279-0012-3-70-a4-l-tel-047-374-3100-made-japan-cise.jpg)