X FINAL FN123096 JohnKemnets Microsoft Monitor and …...
41
Monitor And Manage Your Cloud Environment With Azure Monitor And Splunk John Kemnetz | Program Manager, Microsoft Azure Date | Washington, DC
Transcript of X FINAL FN123096 JohnKemnets Microsoft Monitor and …...

Monitor And Manage Your Cloud Environment With Azure Monitor And SplunkJohn Kemnetz | Program Manager, Microsoft Azure
Date | Washington, DC
During the course of this presentation, we may make forward-looking statements regarding future events or the expected performance of the company. We caution you that such statements reflect our current expectations and estimates based on factors currently known to us and that actual events or results could differ materially. For important factors that may cause actual results to differ from those contained in our forward-looking statements, please review our filings with the SEC.
The forward-looking statements made in this presentation are being made as of the time and date of its live presentation. If reviewed after its live presentation, this presentation may not contain current or accurate information. We do not assume any obligation to update any forward looking statements we may make. In addition, any information about our roadmap outlines our general product direction and is subject to change at any time without notice. It is for informational purposes only and shall not be incorporated into any contract or other commitment. Splunk undertakes no obligation either to develop the features or functionality described or to include any such feature or functionality in a future release.
Splunk, Splunk>, Listen to Your Data, The Engine for Machine Data, Splunk Cloud, Splunk Light and SPL are trademarks and registered trademarks of Splunk Inc. in the United States and other countries. All other brand names, product names, or trademarks belong to their respective owners. © 2017 Splunk Inc. All rights reserved.
Forward-Looking Statements
THIS SLIDE IS REQUIRED FOR ALL 3 PARTY PRESENTATIONS.

Session Objectives
▶ Understand Azure’s monitoring strategy, and how it embraces 3rd party tools like Splunk
▶ Learn how, as an existing Splunk customer, you can effectively manage your Azure environment with Splunk
▶ Learn how you can seamlessly move from on-premises or another cloud to Azure without needing to retrain your monitoring experts

Key Monitoring Concepts In Azure

Monitoring Data On AzureThree key types to know about

▶ Control/management logs –resource manager CRUD operations
▶ Data plane logs – events raised as part of using an Azure resource
▶ Processed events – analyzed events or alerts that have been processed on your behalf
Types Of Log Data
Storage Account
Azure Resource Manager APIs
Storage APIs
Create storage account
Delete storage account
List keys for storage account
Read metadata about storage account
Get blobWrite file Delete table rowWrite blob
Data planeControl plane
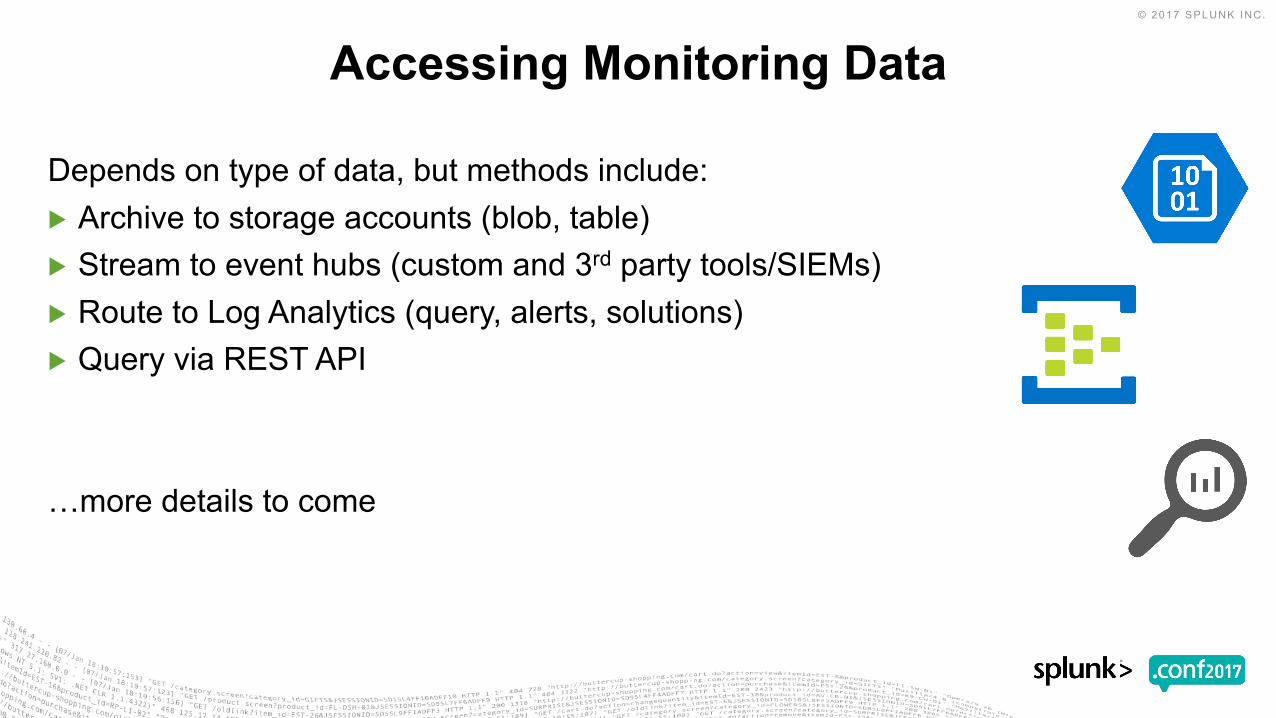
Depends on type of data, but methods include:▶ Archive to storage accounts (blob, table)▶ Stream to event hubs (custom and 3rd party tools/SIEMs)▶ Route to Log Analytics (query, alerts, solutions)▶ Query via REST API
…more details to come
Accessing Monitoring Data

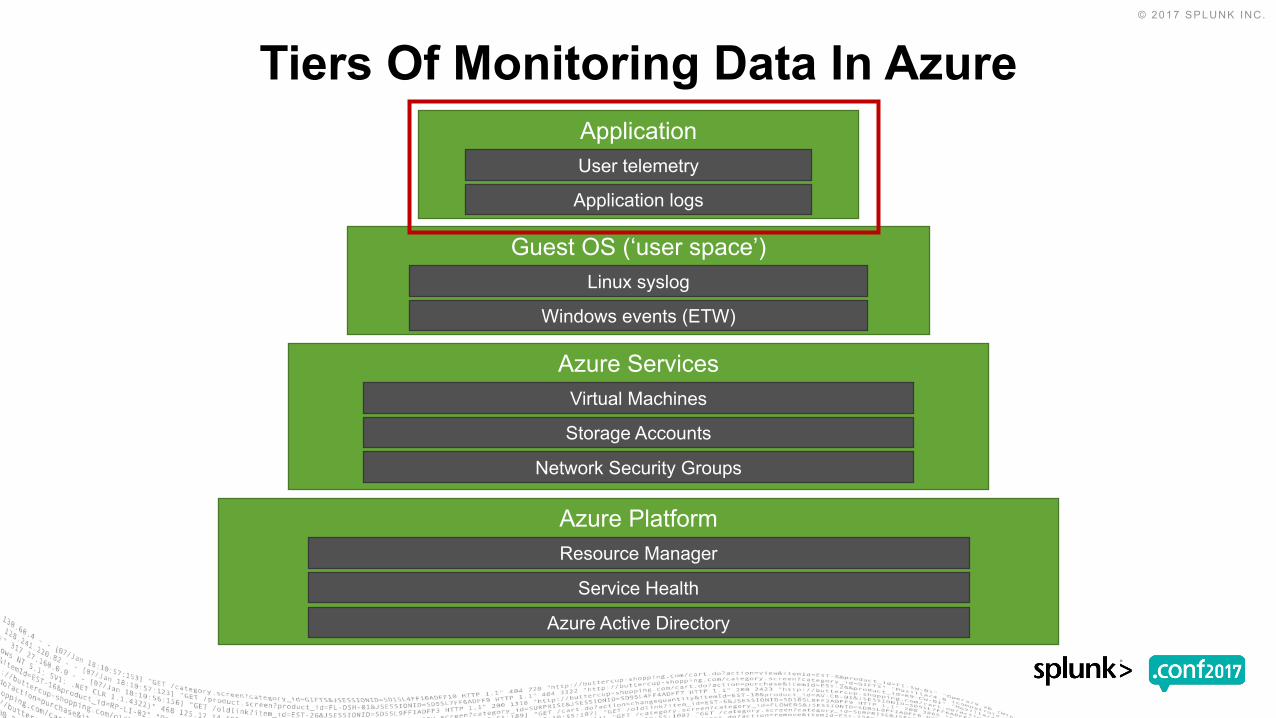
Tiers Of Monitoring Data In Azure
Azure Platform
Azure Active Directory
Resource Manager
Service Health
Azure Services
Network Security Groups
Virtual Machines
Storage Accounts
Guest OS (‘user space’)Linux syslog
Windows events (ETW)
ApplicationUser telemetry
Application logs

Tools Involved In Monitoring Azure

▶ Azure Monitor – platform-level service for routing of logs▶ Log Analytics – log search, alerting, and analysis (solutions) on top of data
from Azure Monitor▶ Application Insights – application-level logging and analysis▶ Network Watcher – network performance monitoring▶ Storage Analytics – collect logs and metrics for storage accounts
Azure Services Involved In Consuming Log Data

Interaction Of Monitoring Tools On Azure
▶ Built-in pipeline for all monitoring data coming out of Azure resources▶ Out-of-the-box logs and metrics▶ Alerts to get notified and take automated action▶ Deep integration with Azure’s advanced monitoring and analytics offerings▶ 3rd Party integrations
Azure MonitorAzure’s platform monitoring service

Azure Monitor And 3rd Party Tools
Azure Monitor Diagnostic Settings
Azure resourcesLogic apps
Network security groups
Key vaults
Storage account
Azure, On-premises, other clouds
Event Hub
…etc.
Azure subscriptionsResource manager
Service health
Autoscale engine
…etc.
Log Analytics
SplunkAzure (AD) tenants
Azure Active Directory
Intune

▶ Consumes metrics, activity log, and diagnostic logs▶ Open source▶ Easy to set up and configure▶ Utilizes event hubs▶ Extra security by storing keys in an Azure Key Vault
Azure Monitor Add-On For Splunk

Configuring Splunk Add-On
2.
1. 3.

Working With Monitoring Data In Azure

Tiers Of Monitoring Data In Azure
Azure Platform
Azure Active Directory
Resource Manager
Service Health
Azure Services
Network Security Groups
Virtual Machines
Storage Accounts
Guest OS (‘user space’)Linux syslog
Windows events (ETW)
ApplicationUser telemetry
Application logs

▶ Tenant level: Azure Active Directory• Audit logs• Sign in activities
▶ Subscription level: Azure Activity Log• Categories: Administrative, Service Health, Alerts, Autoscale, Recommendation, (Security,
and Policy)
▶ Subscription level: Azure Security Center• Potential threats based on log correlation, including integrated threat intelligence, behavioral
analytics, and anomaly detection
Azure Platform-Level Logs

▶ Administrative• “Audit” trail of all control plane operations in your subscription – who, what, where and when• API calls to ARM: PUT, UPDATE, DELETE, Action
• Time, caller (who), claims (JWT authentication token), operation details (action that was performed), resource impacted, [sometimes] HTTP request/response body, HTTP status code
▶ Service Health• Azure platform outage and maintenance notifications including impacted services, impacted
regions, RCA, incident information• Five classes: Incident, Maintenance, Action required, assisted recovery, information, security
▶ Alert• User-configured alert activations on metric alerts, Activity Log alerts, Application Insights alerts
Azure Activity Log – Key Categories

DemoAccessing the Azure Activity Log

Activity Log

▶ Security monitoring:• Role assignments• List keys
▶ Performance or health monitoring• Deleting protected resources• Identifying Service Health issues
▶ Change tracking
Azure Activity LogBest Practices for Monitoring
DemoAzure Activity Log in Splunk

▶ Identify malicious sign in attempts – eg. many sign in failures from a specific IP address
▶ Alert if there a certain number of account provisioning errors
Azure Active Directory Sign-InsBest Practices for Monitoring

DemoAzure Active Directory Logs in Splunk

Tiers Of Monitoring Data In Azure
Azure Platform
Azure Active Directory
Resource Manager
Service Health
Azure Services
Network Security Groups
Virtual Machines
Storage Accounts
Guest OS (‘user space’)Linux syslog
Windows events (ETW)
ApplicationUser telemetry
Application logs
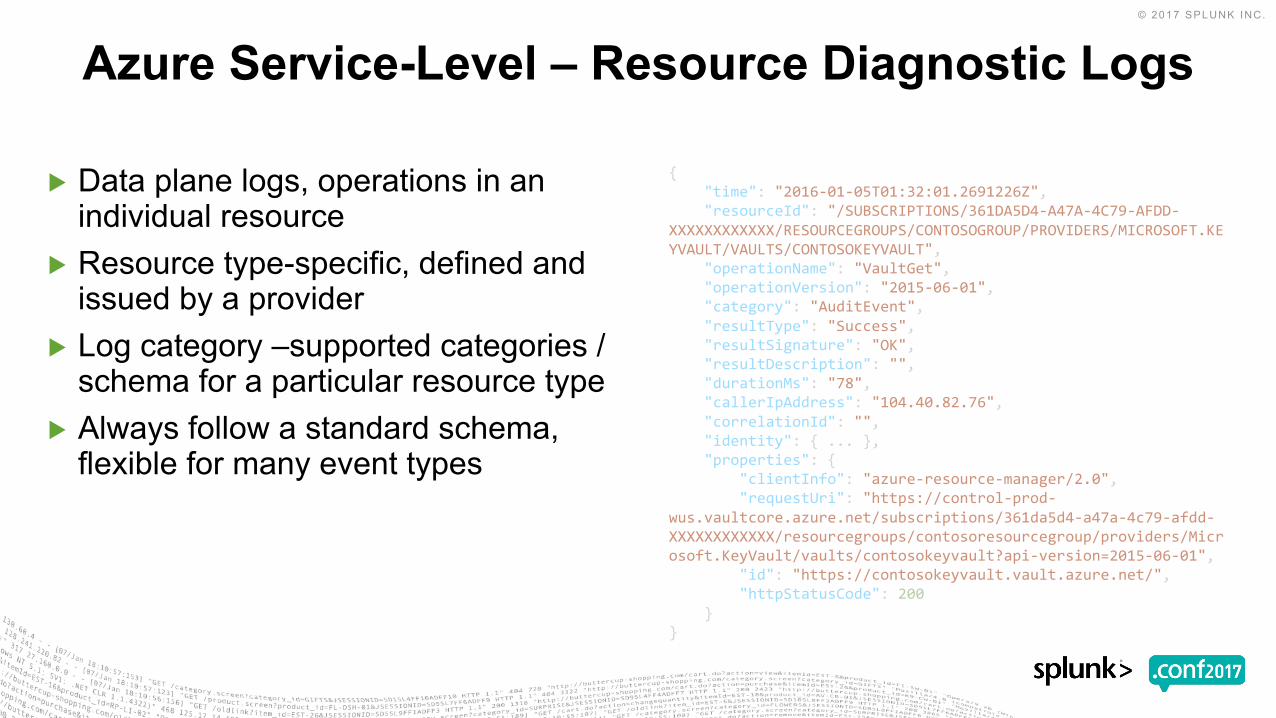
▶ Data plane logs, operations in an individual resource
▶ Resource type-specific, defined and issued by a provider
▶ Log category –supported categories / schema for a particular resource type
▶ Always follow a standard schema, flexible for many event types
Azure Service-Level – Resource Diagnostic Logs
{"time": "2016-01-05T01:32:01.2691226Z","resourceId": "/SUBSCRIPTIONS/361DA5D4-A47A-4C79-AFDD-
XXXXXXXXXXXX/RESOURCEGROUPS/CONTOSOGROUP/PROVIDERS/MICROSOFT.KEYVAULT/VAULTS/CONTOSOKEYVAULT",
"operationName": "VaultGet","operationVersion": "2015-06-01","category": "AuditEvent","resultType": "Success","resultSignature": "OK","resultDescription": "","durationMs": "78","callerIpAddress": "104.40.82.76","correlationId": "","identity": { ... },"properties": {
"clientInfo": "azure-resource-manager/2.0","requestUri": "https://control-prod-
wus.vaultcore.azure.net/subscriptions/361da5d4-a47a-4c79-afdd-XXXXXXXXXXXX/resourcegroups/contosoresourcegroup/providers/Microsoft.KeyVault/vaults/contosokeyvault?api-version=2015-06-01",
"id": "https://contosokeyvault.vault.azure.net/","httpStatusCode": 200
}}

▶ API Management▶ Application Gateways▶ Azure Automation▶ Azure Batch▶ Customer Insights▶ Content Delivery Network▶ Data Lake Analytics▶ Data Lake Store▶ Event Hubs▶ Key Vault▶ Load Balancer▶ Logic Apps▶ Network Security Groups
▶ Recovery Services▶ Search▶ Server Management▶ Service Bus▶ Stream Analytics▶ Coming Soon:▶ SQL Databases – query store and diagnostics▶ Cosmos DB▶ IoT Hubs▶ Traffic Manager▶ Scheduler▶ DB for PostgreSQL▶ DB for MySQL
List Of Supported Resource Types


DemoAccessing the Azure Resource Diagnostic Logs

▶ Security monitoring:• Audit data – Application Gateway, Automation, Batch, Data Lake Analytics, Data Lake Store,
Event Hub, Key Vault, Service Bus, Stream Analytics
▶ Performance or health monitoring• Operational data – eg. Logic Apps• Health alerts – eg. Load Balancer
Azure Resource Diagnostic LogsBest Practices for Monitoring

DemoAzure Resource Diagnostic Logs in Splunk

Tiers Of Monitoring Data In Azure
Azure Platform
Azure Active Directory
Resource Manager
Service Health
Azure Services
Network Security Groups
Virtual Machines
Storage Accounts
Guest OS (‘user space’)Linux syslog
Windows events (ETW)
ApplicationUser telemetry
Application logs
▶ Linux Azure Diagnostic extension (LAD) – Azure agent for collecting guest-level logs from Linux• Uses fluentd and other OSS monitoring tools• Open sourced on github
▶ Can collect Linux syslog (per facility and severity), arbitrary OMI queries, any file-based log, anything with a fluentd input plugin
▶ Windows Azure Diagnostic extension (WAD) – Azure agent for collecting guest-level logs from Windows• Can collect application logs, Windows event logs, .NET event source, IIS logs, manifest-based
ETW, crash dumps, custom error logs, infrastructure logs
Azure Guest OS Logging

Guest OS Logs And Metrics
Tiers Of Monitoring Data In Azure
Azure Platform
Azure Active Directory
Resource Manager
Service Health
Azure Services
Network Security Groups
Virtual Machines
Storage Accounts
Guest OS (‘user space’)Linux syslog
Windows events (ETW)
ApplicationUser telemetry
Application logs

▶ SDKs for most popular languages, platforms, and frameworks (C#, Java, node.js, PHP, Python, Ruby, Docker, OSX, etc.)
▶ REST API▶ Supported SDKs ‘instrument’ code to capture HTTP requests/responses,
other details▶ TrackEvent() method for any other event
Application Insights

DemoUsing Application Insights

▶Azure Active Directory reporting: https://docs.microsoft.com/en-us/azure/active-directory/active-directory-reporting-azure-portal
▶Activity log: https://docs.microsoft.com/en-us/azure/monitoring-and-diagnostics/monitoring-overview-activity-logs
▶Diagnostic logs: https://docs.microsoft.com/en-us/azure/monitoring-and-diagnostics/monitoring-overview-of-diagnostic-logs (see ‘Supported services and schema’)
▶Network Watcher: https://docs.microsoft.com/en-us/azure/network-watcher/network-watcher-monitoring-overview
▶Storage Analytics: https://docs.microsoft.com/en-us/rest/api/storageservices/storage-analytics
Recommended Reading

© 2017 SPLUNK INC.
1. Azure’s monitoring strategy includes a range of built-in tools and embraces integration with 3rd party tools like Splunk too
2. The Azure Monitor Add-On for Splunk helps you to effectively manage your Azure environment with Splunk
3. Azure makes available all the monitoring data you need to seamlessly move from on-premises or another cloud to Azure without needing to reinvent the wheel
Key Takeaways

© 2017 SPLUNK INC.
Don't forget to rate this session in the .conf2017 mobile app
Thank You