Www.engageNY.org Teacher Effectiveness Research Network Team Institute January 2012 Amy McIntosh and...
32
www.engageNY.org Teacher Effectiveness Research Network Team Institute January 2012 Amy McIntosh and Kate Gerson Senior Fellows, Regents Research Fund All Materials from research studies described here are reprinted with permission of authors
-
Upload
perry-plass -
Category
Documents
-
view
218 -
download
2
Transcript of Www.engageNY.org Teacher Effectiveness Research Network Team Institute January 2012 Amy McIntosh and...

www.engageNY.orgwww.engageNY.org
Teacher Effectiveness ResearchNetwork Team Institute
January 2012
Amy McIntosh and Kate Gerson
Senior Fellows, Regents Research FundAll Materials from research studies described here are reprinted with permission of authors

www.engageNY.orgwww.engageNY.org 2
Why Are We Here in Utica?
• Because teacher effectiveness matters
www.engageNY.orgwww.engageNY.org
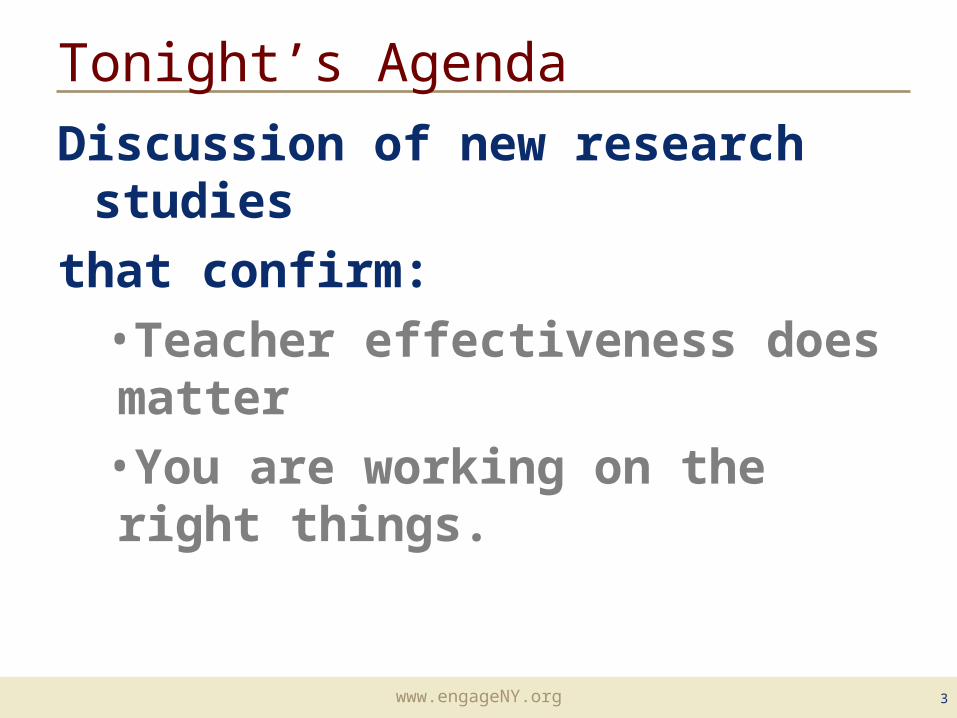
Tonight’s Agenda
Discussion of new research studies
that confirm:•Teacher effectiveness does matter•You are working on the right things.
3

www.engageNY.orgwww.engageNY.org
Study Number 1: The Long-Term Impact of Teachers
Any Questions?
4
www.engageNY.orgwww.engageNY.org
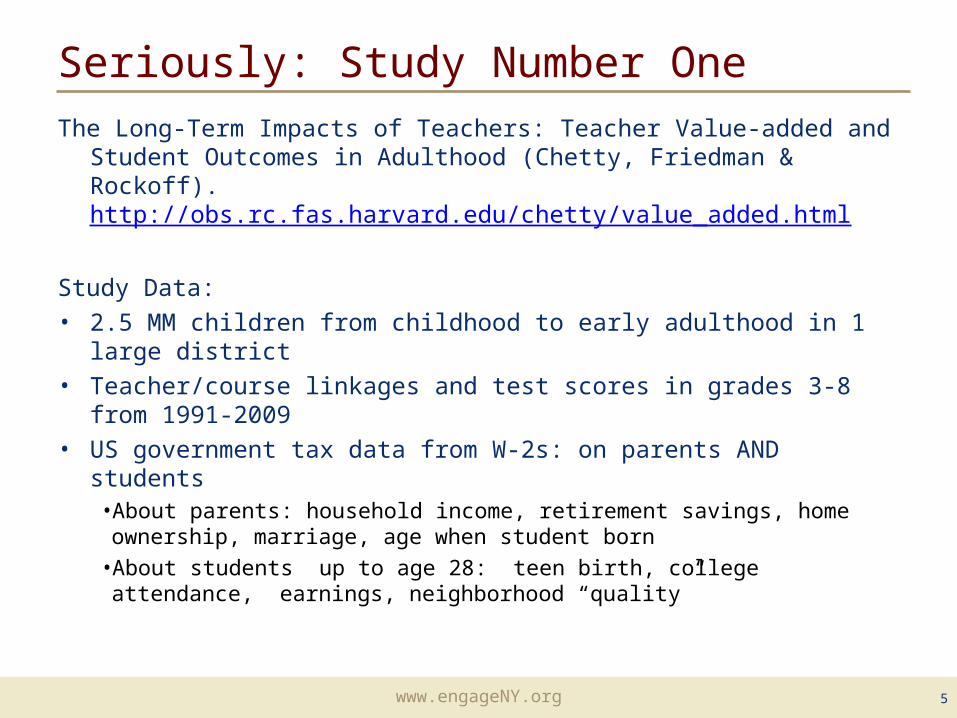
Seriously: Study Number OneThe Long-Term Impacts of Teachers: Teacher Value-added and
Student Outcomes in Adulthood (Chetty, Friedman & Rockoff). http://obs.rc.fas.harvard.edu/chetty/value_added.html
Study Data:• 2.5 MM children from childhood to early adulthood in 1 large
district• Teacher/course linkages and test scores in grades 3-8 from
1991-2009• US government tax data from W-2s: on parents AND students
• About parents: household income, retirement savings, home ownership, marriage, age when student born
• About students up to age 28: teen birth, college attendance, earnings, neighborhood “quality”
5

www.engageNY.orgwww.engageNY.org
Key Finding: Teacher effectiveness mattersHaving a higher value-added teacher for even one year in grades 4-8, has substantial positive long-term impacts on a student’s life outcomes including:
–Likelihood of attending college (UP 1.25%)–Likelihood of teen pregnancy (DOWN 1.25%)–Salary earned in lifetime (UP $25K per avg.
student)–Neighborhood (More college grads live there)–Retirement savings (UP)
6

www.engageNY.orgwww.engageNY.org
Key Finding: Student Future Earnings
7

www.engageNY.orgwww.engageNY.org
What is “teacher value added”
8
A statistical measure of the
growth of a teacher’s students
that takes into account the differences in students across classrooms that school systems can measure but teachers can’t control.
Value-added is:
Growth compared to the average growth of similar students

www.engageNY.orgwww.engageNY.org
Teacher Value-added is NOT: Test scores alone
9
Avg. Student Achievement (2015)
Teacher A Teacher B
2015
2015
680
670
5th
grade math
Illustrative Scale Scores
Achievement scores say
more about students
than teachers.
Achievement scores say
more about students
than teachers.
www.engageNY.orgwww.engageNY.org
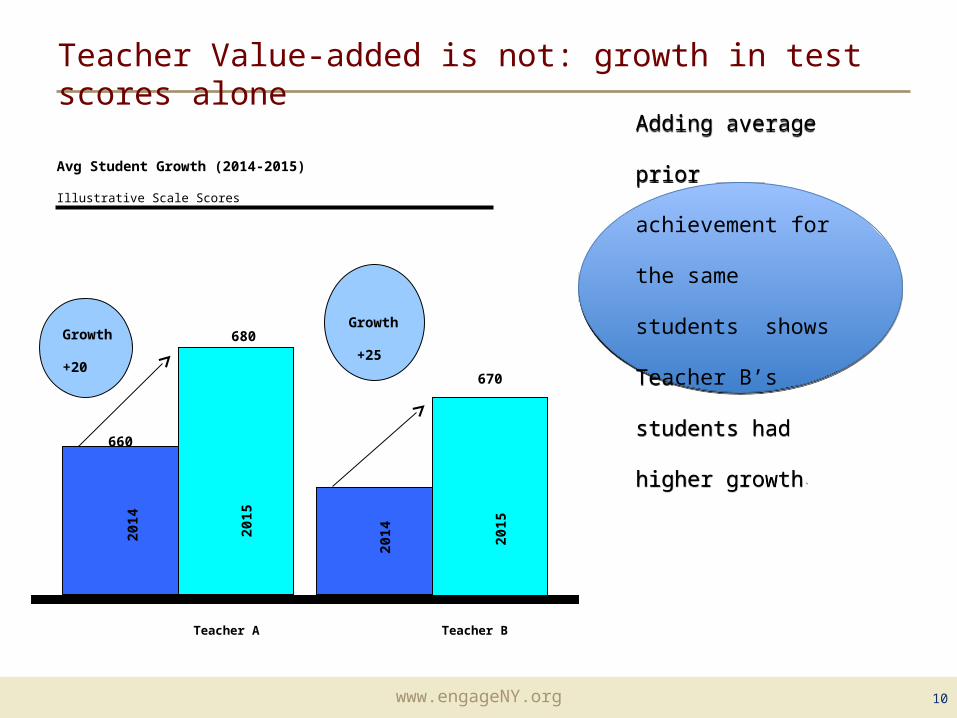
Teacher Value-added is not: growth in test scores alone
10
Avg Student Growth (2014-2015)
2015
680
670
645
Growth
+25
Growth
+20
660
Teacher A Teacher B
2014
2014 20
15
Illustrative Scale Scores
2015
Adding average prior
achievement for the
same students shows
Teacher B’s students
had higher growth.
Adding average prior
achievement for the
same students shows
Teacher B’s students
had higher growth.

www.engageNY.orgwww.engageNY.org
Teacher Value-added is: Growth compared to similar students
11
Avg Student Growth vs. Similar Students (2014-2015)
680
670
645
Value-
Added
+15 Above
Average
660
Teacher A Teacher B
2014
2014
2015
Illustrative Scale Scores
2015
2015
Avg
fo
r
sim
ilar
stu
den
ts
2015
Avg
fo
r
sim
ilar
stu
den
ts
665670
Value-
Added
AVERAGE
Growth
+25
Growth
+20
2014
Comparing growth to the
average growth of “similar”
students gives teacher A the
higher “value-added” result.
Comparing growth to the
average growth of “similar”
students gives teacher A the
higher “value-added” result.

www.engageNY.orgwww.engageNY.org
Myth-busting
REALITY:• Some researchers say this. Others say it is
the best way we have to identify the stronger and weaker teachers.
• THIS study adds new evidence to support that value-added measures DO measure real differences in the effect different teachers have on student learning.
12
MYTH: Lots of big research people say value-
added isn’t reliable. You can’t really prove the
teacher caused the change in scores
MYTH: Lots of big research people say value-
added isn’t reliable. You can’t really prove the
teacher caused the change in scores

www.engageNY.orgwww.engageNY.org
What do you think would happen:
A high value-added teacher (top 5%) arrives in a new school to teach fourth grade:
What happens to the new teacher’s kids’ fourth grade test scores?
13

www.engageNY.orgwww.engageNY.org
The scores go up.
14

www.engageNY.orgwww.engageNY.org
But what about?
• Maybe the “high value-added teacher’s” kids were all from high income families? Your model doesn’t measure that.•The researchers thought of that, got the data and it doesn’t change the fact that having a high value-added teacher matters.
• Maybe “high value-added teachers” are always assigned to the higher achieving kids.•They thought of that, got the data, and it doesn’t change the fact that (guess what)…...
• Maybe it’s just true for the top 5% of teachers. We can’t all be superstars.•They thought of that (and guess what?)
15

www.engageNY.orgwww.engageNY.org
What this study doesn’t answer
• Once teachers’ evaluation results depend on value-added, will their behavior change?• Will they teach to the test?
• Will they cheat?
• Will they focus on data driven instruction, Common Core Standards and teacher practices that research says support student learning.
• What are the specific policy actions to take in a school district?• How can you keep high value-added teachers in their schools?
• What professional development helps people get better?
• What about teachers who aren’t getting any better after 3 or 4 years?
16

www.engageNY.orgwww.engageNY.org
Study Number Two: Measures of Effective Teaching
17http://www.metproject.org

www.engageNY.orgwww.engageNY.org
Study Number Two: Measures of Effective Teaching
Unique project in many ways: in the variety of indicators tested,
5 instruments for classroom observations
Student surveys (Tripod Survey)
Value-added on state tests in its scale,
3,000 teachers
22,500 observation scores (7,500 lesson videos x 3 scores)
900 + trained observers
44,500 students completing surveys and supplemental assessments
• and in the variety of student outcomes studied.
Gains on state math and ELA tests
Gains on supplemental tests (BAM & SAT9 OE)
Student-reported outcomes (effort and enjoyment in class)
18

www.engageNY.orgwww.engageNY.org 19
Three Criteria:Predictive power: Which measure could most accurately identify teachers likely to
have large gains when working with another group of students?
Reliability: Which measures were most stable from section to section or year to
year for a given teacher?
Potential for Diagnostic Insight: Which have the potential to help a teacher see
areas of practice needing improvement
What measures relate best to student outcomes?Dynamic Trio

www.engageNY.orgwww.engageNY.org
Measures have different strengths …and weaknesses
20
Dynamic Trio
Measure Predictive power ReliabilityPotential for
Diagnostic Insight
Value-added
Student survey
Observation

www.engageNY.orgwww.engageNY.org
Key Finding: Use multiple measures• All the observation rubrics are positively associated with
student achievement gains• Using multiple observations per teacher is VERY important (and
ideally multiple observers)• The student feedback survey tested is ALSO positively
associated with student achievement gains• Combining observation measures, student feedback and value-
added growth results on state tests was more reliable and a better predictor of a teacher’s value-added on State tests with a different cohort of students than:
»Any Measure alone»Graduate degrees»Years of teaching experience
•Combining “measures” is also a strong predictor of student performance on other kinds of student tests.
21

Framework for Teaching (Danielson)
22
Four Steps
Uns
atisf
acto
ry
Yes/no Questions, posed in rapid succession, teacher asks all questions, same few students participate.
Basic
Some questions ask for student explanations, uneven attempts to engage all students.
Profi
cien
t
Most questions ask for explanation, discussion develops/teacher steps aside, all students participate.
Adva
nced
All questions high quality, students initiate some questions, students engage other students.
www.engageNY.orgwww.engageNY.org
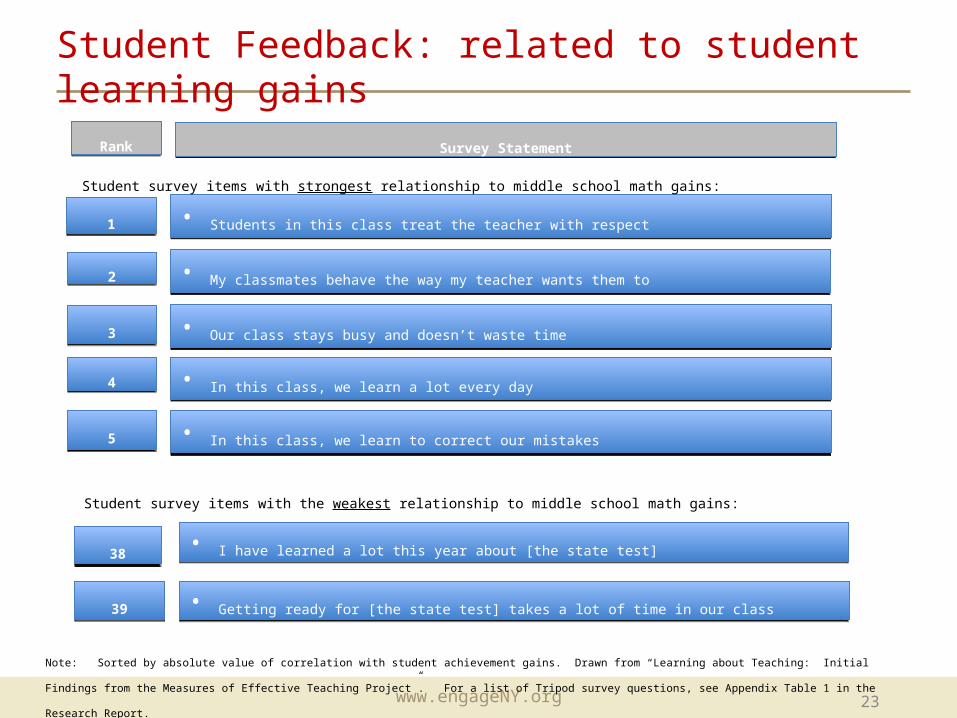
Student Feedback: related to student learning gains
23
Survey StatementSurvey StatementRankRank
11
22
33
44
55
• Students in this class treat the teacher with respect• Students in this class treat the teacher with respect
• My classmates behave the way my teacher wants them to• My classmates behave the way my teacher wants them to
• Our class stays busy and doesn’t waste time• Our class stays busy and doesn’t waste time
• In this class, we learn a lot every day• In this class, we learn a lot every day
• In this class, we learn to correct our mistakes• In this class, we learn to correct our mistakes
Student survey items with strongest relationship to middle school math gains:
3838 • I have learned a lot this year about [the state test]• I have learned a lot this year about [the state test]
3939 • Getting ready for [the state test] takes a lot of time in our class• Getting ready for [the state test] takes a lot of time in our class
Student survey items with the weakest relationship to middle school math gains:
Note: Sorted by absolute value of correlation with student achievement gains. Drawn from “Learning about Teaching: Initial Findings from the Measures of Effective Teaching
Project”. For a list of Tripod survey questions, see Appendix Table 1 in the Research Report.

www.engageNY.orgwww.engageNY.org 24
Combining Observations with other measures improved predictive power
Dynamic Trio

www.engageNY.orgwww.engageNY.org
Compared to MA Degrees and Years of Experience, the Combined Measure Identifies Larger Differences
25
Compared to What?

www.engageNY.orgwww.engageNY.org 26
Four Steps

www.engageNY.orgwww.engageNY.org
Activity: Guidance to Practioners (page 2/3)
1. Choose an observation instrument that sets clear expectations.
2. Require observers to demonstrate accuracy before they rate teacher practice.
3. When high-stakes decisions are being made, multiple observations are necessary.
4. Track system-level reliability by double-scoring some teachers with impartial observers.
5. Combine observations with student achievement gains and student feedback.
6. Regularly verify that teachers with stronger observation scores also have stronger student achievement gains on average.
27

www.engageNY.orgwww.engageNY.org
Districts with evaluation work in processThe following Districts have been funded by the Gates foundation
in connection with the METS project to implement teacher and leader effectiveness initiatives including new evaluation systems. Their public web sites tell more about how they are doing this. (Two others, Pittsburgh and Dallas, don’t have extensive information on their public sites.)
Denver Public Schools LEAP: http://leap.dpsk12.org/
Hillsborough County, Florida Empowering Effective Teachers:http://www.sdhc.k12.fl.us/eet/v1/
Memphis , Tennessee Teacher Effectiveness Initiative:http://www.mcstei.com/
28

www.engageNY.orgwww.engageNY.org
How would you answer these common misconceptions?
• New York’s evaluation system is based mostly on State test scores and that’s not good.
• A principal knows a good teacher when s/he sees one; we don’t need to include value-added results too.
• I’ve been doing teacher observations for years. I don’t need to go to your training.
• Teacher Value-added information is unreliable and shouldn’t be a part of teacher evaluation.
• By putting test scores into teacher evaluation, everyone will do even more to “teach to the test” and if that doesn’t work, they’ll cheat.
29

www.engageNY.orgwww.engageNY.org
How would you answer these common misconceptions?
• New York’s evaluation system is based mostly on State test scores and that’s not good.
•NY uses multiple measures as research advises. 60% involves measures of educator practice. 20-25% involves GROWTH on state assessments or comparable measures. And the remaining points will be a locally-selected measure of student growth or achievement.
• A principal knows a good teacher when s/he sees one; we don’t need to include value-added results too.
•Recent METS study shows that combining observation results and teacher value-added is more predictive and reliable than either measure alone.
• I’ve been doing teacher observations for years. I don’t need to go to your training.
•The MET study shows that regularly recalibrating observers against benchmarks of accurate observation ratings is critical to ensuring a valid and reliable evaluation system. Even the best observers can “drift” over time. And the best can help others stay in sync. In addition, NYS training will help everyone identify evidence that the new Common core standards are being implemented well in classrooms.
30

www.engageNY.orgwww.engageNY.org
How would you answer these common misconceptions?
• Teacher Value-added information is unreliable and shouldn’t be a part of teacher evaluation.
•Many researchers have shown that teacher value-added is the best predictor we have of the future learning growth of a teacher’s students. Two new research studies, Chetty/Friedman/Rockoff and the Measures of Effective Teaching Study add new evidence in support of this argument.
• By putting test scores into teacher evaluation, everyone will do even more to “teach to the test” and if that doesn’t work, they’ll cheat.
•No one has been able to research yet the predictiveness and reliability of teacher value-added measures when they are used in high stakes environments since such evaluation systems are just beginning across the country. Some teachers may try to game the system. Others may strive to develop the skills research says align with higher value-added results. However, the power of these measures argues for including them as part of a multiple measures system.
31

www.engageNY.orgwww.engageNY.org
Thank You.