Finding Common Ground in the Measurement of Perverse Subsidies Workshop on Environmentally Harmful...
10
WWW.EARTHTRACK.NET Finding Common Ground in the Measurement of Perverse Subsidies Workshop on Environmentally Harmful Subsidies OECD Paris, France November 7-8 2002 Doug Koplow Earth Track, Inc. 2067 Massachusetts Avenue, 4th Floor Cambridge, MA 02140 (617) 661-4700 [email protected]
-
Upload
noah-conley -
Category
Documents
-
view
215 -
download
2
Transcript of Finding Common Ground in the Measurement of Perverse Subsidies Workshop on Environmentally Harmful...
WWW.EARTHTRACK.NET
Finding Common Ground in the Measurement of Perverse Subsidies
Workshop on Environmentally Harmful Subsidies
OECDParis, France
November 7-8 2002Doug KoplowEarth Track, Inc.2067 Massachusetts Avenue, 4th FloorCambridge, MA 02140(617) [email protected]

WWW.EARTHTRACK.NET
Finding a Common Definition
• Common building blocks can be used to support multiple subsidy metrics.– Although different parties may use information for
different ends, common building block approach makes international tracking feasible.
• Definitional problems have both technical and political attributes. Technical conflicts sometimes overplayed due to political drivers.
• Subsidy tracking can proceed even with remaining areas of definitional disagreement.

WWW.EARTHTRACK.NET
Transparent, though not identical, building blocks needed
• Estimates of US Subsidies to Fossil Fuels range from $200 million to $1.7 trillion per year (Koplow/Dernbach, 2001)– Range renders data useless for policy decisions, unless can
understand drivers of variance, make value decisions.– Building block approach - with intervention-specific data as the
basic building block - makes integration and interpretation possible.
• Variance due to definition, valuation techniques, and politics.– Inclusion of wide range of externalities drives highest estimates.– Exclusion of many programs of direct benefit to fossil fuels
drives lowest estimates.– Uncertainty regarding measurement of specific interventions
often not that large.
WWW.EARTHTRACK.NET
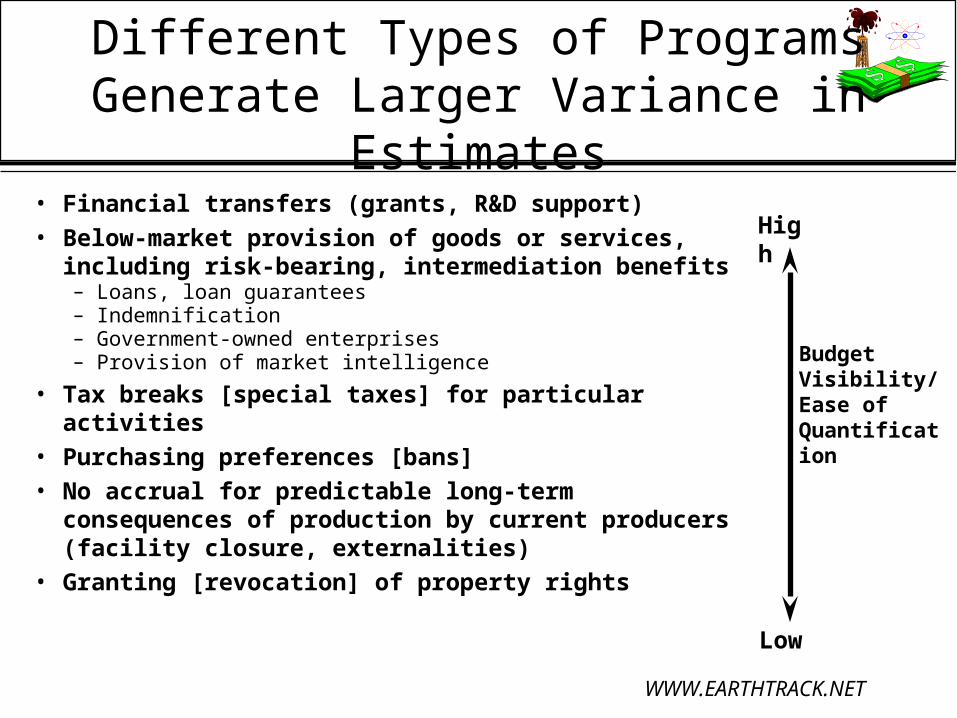
Different Types of Programs Generate Larger Variance in
Estimates• Financial transfers (grants, R&D support)• Below-market provision of goods or services,
including risk-bearing, intermediation benefits– Loans, loan guarantees– Indemnification– Government-owned enterprises– Provision of market intelligence
• Tax breaks [special taxes] for particular activities
• Purchasing preferences [bans]• No accrual for predictable long-term
consequences of production by current producers (facility closure, externalities)
• Granting [revocation] of property rights
High
Low
BudgetVisibility/Ease ofQuantification
WWW.EARTHTRACK.NET
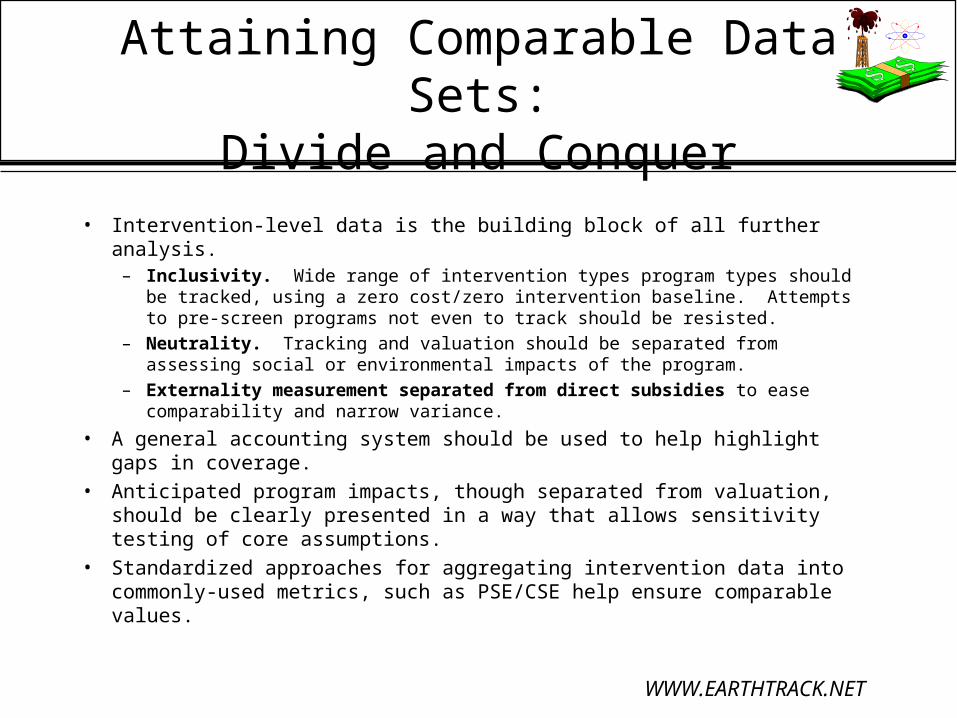
Attaining Comparable Data Sets:Divide and Conquer
• Intervention-level data is the building block of all further analysis.– Inclusivity. Wide range of intervention types program types should be
tracked, using a zero cost/zero intervention baseline. Attempts to pre-screen programs not even to track should be resisted.
– Neutrality. Tracking and valuation should be separated from assessing social or environmental impacts of the program.
– Externality measurement separated from direct subsidies to ease comparability and narrow variance.
• A general accounting system should be used to help highlight gaps in coverage.
• Anticipated program impacts, though separated from valuation, should be clearly presented in a way that allows sensitivity testing of core assumptions.
• Standardized approaches for aggregating intervention data into commonly-used metrics, such as PSE/CSE help ensure comparable values.
WWW.EARTHTRACK.NET
Improving Data Resolution
• Data quality, even at level of specific programs, often limited.• Different levels of government often additive; sub-national data
spotty.• Allocation of shared subsidies to recipient sectors: capital; key inputs;
R&D; etc. often not done at all.• All of these weaknesses need to be clearly presented; improved over
time.• Presenting cascading details: from aggregate metrics down to
intervention-specific information on programs, ensures true data transparency.
• Ability to create different views leverages value of baseline data set:– With/without externalities.– Sorted by fiscal magnitude, environmental impact, etc.– Linkage to end-products (e.g., energy, water flow-through to agricultural
sector).

WWW.EARTHTRACK.NET
Comparing Regulatory and Fiscal Oversight in the US
Core Element Use in Regulatory Process Use in Fiscal Process
1) Public Availability ofBasic Information
Text of all final regulations is collected inCode of Federal Regulations
-Some but not all subsidies identified in annualfederal budget
2) Public Justification
Public Notice of Proposal -Publish proposal with explanation inFederal Register
No advance notice required.
Required Justification -Agency must explain basis and purpose ofproposal-Agency must analyze costs and effects,and consider regulatory alternatives
-Early analysis of proposals contains onlybudgetary impact; often proprietary with nopublic access.-No information on other impacts.
Public Comment Process -Public comments solicited on proposedrulemaking-Agency must respond to significantcomments
-No public comment process prior to passage.
Final Result Publish final rule in Federal Register withchanges and explanation
-Cost impacts are in Budget (including AnalyticalPerspectives chapters)-Descriptive definitions, but little evaluation ofbroader impacts.
3) Analysis ofEnvironmental Effects
-Environmental impact statement, includingconsideration of alternatives.
-Public notice and comment.
No review or comment.
Source: Koplow/Dernbach (2001)
•Existing checks and balances often institute stringent controls over regulatory activities, lax controls over fiscal activities.•Demonstrates need for improved transparency, accountability.
WWW.EARTHTRACK.NET
Moving Forward
• Macro level: continued refinement of aggregate metrics, estimation techniques, evaluation of filtering routines for environmental impact.
• Micro level: creation of library of intervention-level data.– Information on government support programs highly
fragmented; complex to value.– Strong political interests protect existing subsidy
regimes/institute new ones; sometimes even block data collection.

WWW.EARTHTRACK.NET
Rules of Thumb for DecidingWhether an Intervention is a
Subsidy
• Would this industry/company have to pay more, or bear greater risks, if not for the government program?
• Are uncompensated risks being shifted to the general population or to future generations?
• Would a private-sector cost accounting system treat this as a real cost (e.g., holding costs of oil inventory in strategic petroleum stockpiles)?
• Would a different procurement/production decision likely be made if not for this program?
WWW.EARTHTRACK.NET
Earth Track: Building Policy-Level Detail on Interventions
Web site dedicated to transparency of government interventions in energy markets: www.earthtrack.net.
Consolidate and standardize information on government interventions in energy markets from hundreds of sources and data providers in countries around the world.
Provide an unbiased source of information on these policies outside of the pressures and politics of international organizations.
Present information on subsidies and complicated financial, accounting, and regulatory policies in a manner accessible to non-technical audiences.
Present a holistic picture of the impact of government policies by energy type, type of policy, or geographic region.
Accelerate the process of developing new information by facilitating improved integration of workplans and work sponsors.
Quantify the value of existing subsidies and taxes whenever possible to allow evaluation of time trends, patterns across fuels and regions, and to serve as inputs to macro-economic models.