Www.cru.uea.ac.uk Extremes in climate models Jean Palutikof Climatic Research Unit University of...
40
www.cru.uea.ac.uk Extremes in climate models Jean Palutikof Climatic Research Unit University of East Anglia Norwich, UK Workshop on Development of Scenarios of Climate Variability and Extremes Victoria, BC
-
Upload
charlene-brown -
Category
Documents
-
view
216 -
download
1
Transcript of Www.cru.uea.ac.uk Extremes in climate models Jean Palutikof Climatic Research Unit University of...

www.cru.uea.ac.uk
Extremes in climate models
Jean PalutikofClimatic Research Unit
University of East AngliaNorwich, UK
Workshop on Development of Scenarios of Climate Variability
and ExtremesVictoria, BC

www.cru.uea.ac.uk
1. Temperature extremesReferences: B.B. Brabson, D. H. Lister, J. P. Palutikof, P. D. Jones: Rapid rise of extreme temperatures in the 21st century. Submitted to Geophysical Research Letters
Brabson, B.B. and Palutikof, J.P., 2002: The Evolution of Extreme Temperatures in the Central England Temperature Record. Geophysical Research Letters, 29 (24), 10.1029/2002GL015964.

www.cru.uea.ac.uk
For observed Central England temperatures

www.cru.uea.ac.uk
GPD (peak-over-threshold)
• Three parameters: scale
shape
selected threshold
CDF:
• Three classes defined by the value of > 0 Long-tailed case
= 0 Exponential tail
< 0 Short-tailed case, finite
endpoint
• Return-period temperature:
1
11)(
xxF
FTT 11

www.cru.uea.ac.uk
GPD analysis of observed historical daily CET
• Analyses carried out on January/February warm and cold tails, and July/August hot and cool tails
• POT thresholds selected at each time step to include 5% values; separation distance of 4 days to ensure independence
• Based on 20-year overlapping periods, and looking at– the mean, , of all values, – 1SD above and below the mean
– the 10-year return period temperature, T10

www.cru.uea.ac.uk
1800 1900 2000-10
-5
0
5
10
Year
Tem
pera
ture
(°C
)
Jan/Feb
a
+0.18 ±0.23
+0.24 ±0.08
+0.36 ±0.05
+0.49 ±0.08
+1.05 ±0.47
1800 1900 2000
10
15
20
25
30
Year
July/Aug
bWarm T10
Mean + 1 S.D.MeanMean - 1 S.D.
Cool T10
+0.67 ±0.26
+0.19 ±0.05
+0.15 ±0.03
+0.11 ±0.05
+0.56 ±0.17
Tem
pera
ture
(°C
)

www.cru.uea.ac.uk
1900 1950 20000
0.1
0.2
0.3F
ract
ion
Winter Fractions by Type
Anticyclonic
Easterly
Southerly
Westerlya
1900 1950 20000
2
4
6
Avg
. T
emp.
(°C
)
Winter Temperature by Type
Anticyclonic
Easterly
Southerly
Westerly
b
1900 1950 20000
0.1
0.2
0.3
0.4
Fra
ctio
n
Winter Extreme Fractions
Anticyclonic
Easterly
Westerly
Southerly
c
1900 1950 20001.5
2
2.5
3
3.5
S.D
. (°
C)
Winter Temperature S.D.
Anticyclonic
Easterly
d

www.cru.uea.ac.uk
For future modelled Central England temperatures
www.cru.uea.ac.uk
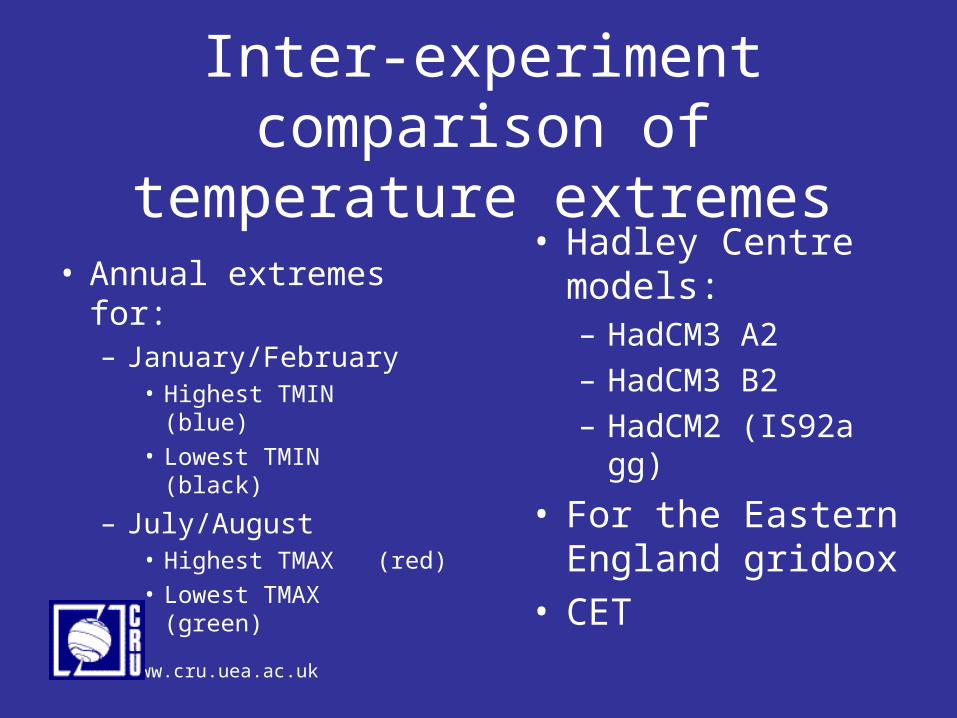
Inter-experiment comparison of temperature extremes
• Annual extremes for:– January/February
• Highest TMIN (blue)• Lowest TMIN (black)
– July/August• Highest TMAX (red)• Lowest TMAX (green)
• Hadley Centre models:– HadCM3 A2– HadCM3 B2– HadCM2 (IS92a gg)
• For the Eastern England gridbox
• CET

www.cru.uea.ac.uk
Annual maxima/minima for SE England

www.cru.uea.ac.uk
• Three parameters: position
scale
shape
CDF:
• Three classes defined by the value of > 0 Long-tailed case
Fréchet
= 0 Exponential tailGumbel
< 0 Short-tailed case, finite end,
Weibull• Return-period temperature:
GEV distribution (annual maxima)
1
1exp)(x
xF
KT FT )ln(1

www.cru.uea.ac.uk
GEV analysis of modelled future daily ‘CET’
• For winter TMIN and summer TMAX• The Eastern England grid boxes• The HadCM3 A2 experiment• Based on 20-year overlapping periods, showing:
• T10 (warm tail) (warm tail)• the mean, smoothed with a 25-term filter (cold tail)• T10 (cold tail)

www.cru.uea.ac.uk
www.cru.uea.ac.uk
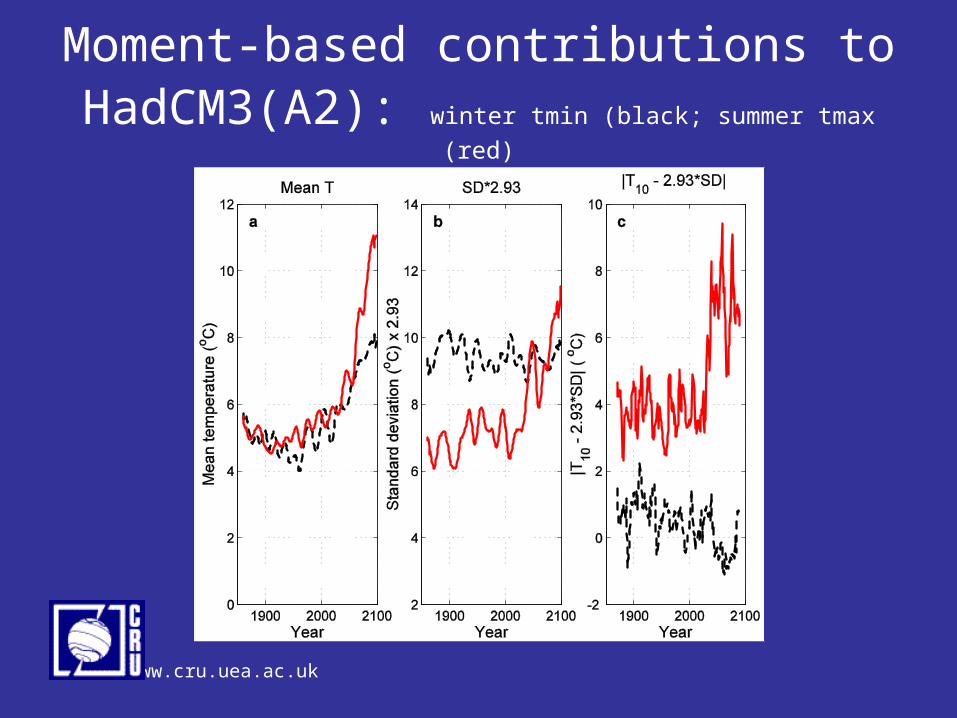
Moment-based contributions to HadCM3(A2): winter tmin (black; summer tmax (red)

www.cru.uea.ac.uk
Number of spells (Eastern England grid box)
www.cru.uea.ac.uk
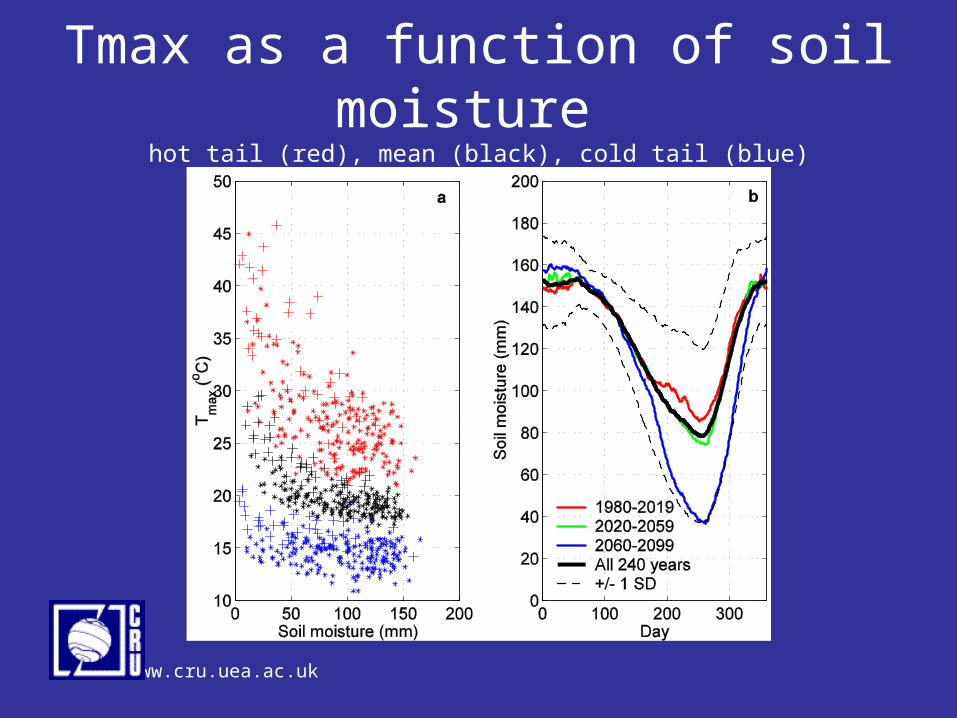
Tmax as a function of soil moisture hot tail (red), mean (black), cold tail (blue)

www.cru.uea.ac.uk
Summary
• The GCMs predict a rapid rise in temperature over southern England
• Summer hot extremes rise much faster than the corresponding mean
• Soil moisture in HadCM3 provides the link between slowly rising means and rapidly rising extremes

www.cru.uea.ac.uk
2. High wind speeds and windstorm
C. Hanson et al., Proc. ‘Wind Effects on Trees, Karlsruhe, 2003
Hanson, C.E., and Palutikof, J.P., 2004: Variations in a UK cyclone climatology constructed from a group of nested climate models. Submitted to Geophysical Research Letters.

www.cru.uea.ac.uk
North Atlantic: Intensity Changes
A B
C D
Central Pressure (hPa)
Deepening Rate (hPa/12hr)

www.cru.uea.ac.uk
North Atlantic: Spatial Changes

www.cru.uea.ac.uk
UK Region: Intensity Changes
Central Pressure (hPa)
<940
<950
<960
<970
<980
<990
<1000
<1010
<1020
<1030
<1040
>1040
Nu
mb
er
of
De
pre
ss
ion
Ce
ntr
es
1000
800
600
400
200
0
1961-90
HadRM3
A2a 2070-99
B2a 2070-99
1961-90
HadAM3H
A2a 2070-99
B2a 2070-99

www.cru.uea.ac.uk
UK Region: Temporal Changes
HadRM3H baseline period (1961-90)
HadRM3H A2a experiment (2070-99)
HadRM3H B2a experiment (2070-99)
HadAM3H baseline period (1961-90)HadAM3H A2a experiment (2070-99)HadAM3H B2a experiment (2070-99)
≤1000hPa ≤970hPa

www.cru.uea.ac.uk
Summary
• Analysis of North Atlantic and UK cyclone activity in HadAM3H and HadRM3H has revealed no significant change in activity – frequency or intensity.
• HadAM3H indicates an increase in weaker events over south-east England.
• Potential for change in seasonality of the more intense events (HadRM3H).
• In general, the results are inconclusive.

www.cru.uea.ac.uk
A different approach allows identification of storm tracks
Work by the University of Koeln for the MICE project

www.cru.uea.ac.uk
HADCM3: Identification of Cyclones for the European SectorTrack density Winter (=ONDJFM)
A2a – CON_aCON_a Extreme cyclones > 99th percentile
Unit: Systems / Grid Unit / Winter
Contour interval 0.1 Contour interval 0.1
MICE – Work Progress of Partner 4 (UKOELN): U. Ulbrich, G. Leckebusch
MICE Project Meeting, Athens, 25.6.2003 - 27.6.2003
www.cru.uea.ac.uk
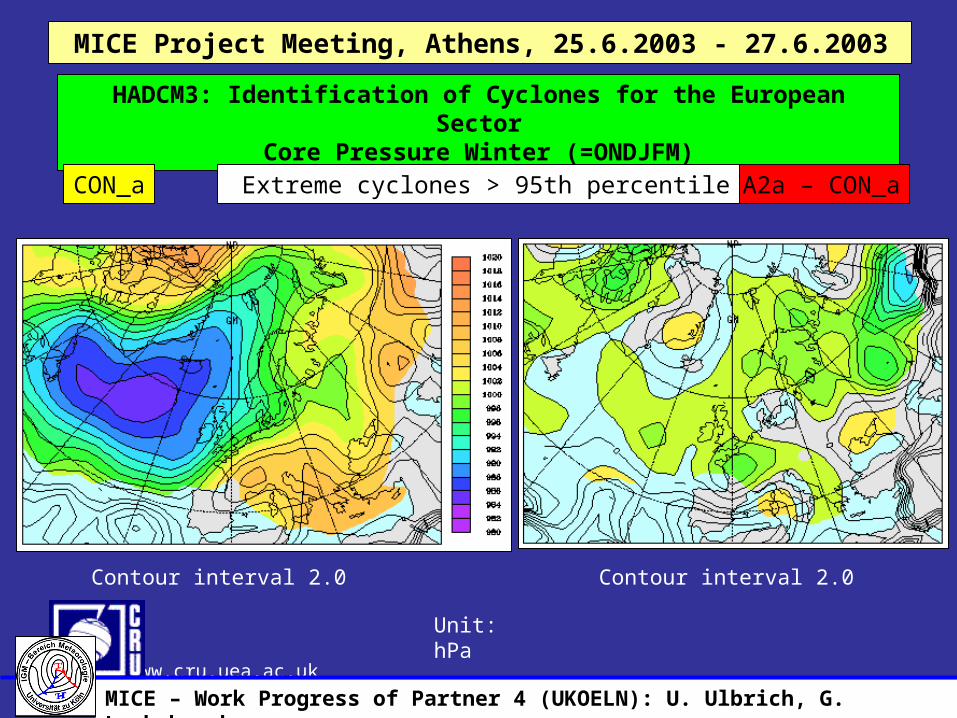
HADCM3: Identification of Cyclones for the European SectorCore Pressure Winter (=ONDJFM)
A2a – CON_aCON_a Extreme cyclones > 95th percentile
Unit: hPa
Contour interval 2.0 Contour interval 2.0
MICE – Work Progress of Partner 4 (UKOELN): U. Ulbrich, G. Leckebusch
MICE Project Meeting, Athens, 25.6.2003 - 27.6.2003

www.cru.uea.ac.uk
HadRM3: A2a-CON, Climate SignalWmax, 95 PercentilCON_a
Hr3_v.shp4.75 - 8.388.38 - 10.2510.25 - 12.512.5 - 16.6216.62 - 21.38
Countrys_gcl.shp
A2a – CON_a
Hr3_v.shp-1.5 - -0.5-0.5 - -0.26-0.26 - -0.24-0.24 - -0.06-0.06 - 0.060.06 - 0.120.12 - 0.130.13 - 0.250.25 - 0.380.38 - 1.63
Countrys_gcl.shp
MICE Project Meeting, Athens, 25.6.2003 - 27.6.2003
MICE – Work Progress of Partner 4 (UKOELN): U. Ulbrich, G. Leckebusch

www.cru.uea.ac.uk
HADCM3: Identification of Cyclones for the European Sector
Summary:
all systems: track density reduction, especially northern Europe (above the Norwegian Sea, Scandinavia)
extreme (> 95th or > 99th percentile) systems:track density reduction: Northern Europetrack density increase: South of 60N, Western Europedeepening of extreme cyclones
Scenarios A2 and B2 differ mainly with regard to extreme systems
A2: Increase of extreme systems in western central Europe
MICE – Work Progress of Partner 4 (UKOELN): U. Ulbrich, G. Leckebusch
MICE Project Meeting, Athens, 25.6.2003 - 27.6.2003
www.cru.uea.ac.uk
3. Rainfall extremes
Some results from the EU-funded MICE and PRUDENCE projects
Modelling the impacts of climate extremes
Prediction of Regional scenarios and Uncertainties for Defining EuropeaN
Climate change risks and Effects

www.cru.uea.ac.uk
How much can we believe what the models tell us?
A comparison for an RCM gridbox with many rain gauges

www.cru.uea.ac.uk
Southern England – 24 rain gauges in the central gridbox
HERTFORDSHIRE
51.2
51.4
51.6
51.8
52
52.2
52.4
-1.5 -1 -0.5 0 0.5 1
Longitude
Lat
itu
de

www.cru.uea.ac.uk
Number of wet and dry days
Wet days
0
30
60
90
0 0.1 0.5 0.8
Cutoff (mm)
Pe
rce
nt
fin
al n
um
be
r a
ll d
ay
s
Model 24 station 12 station 1 station
Dry days
0
10
20
30
40
50
60
70
0 0.1 0.5 0.8
Cutoff (mm)
Pe
rce
nt
fin
al n
um
be
r a
ll d
ay
s
Model 24 station 12 station 1 station

www.cru.uea.ac.uk
Number of days with high rainfall
Days with rainfall >10mm
1
1.5
2
2.5
3
3.5
4
0 5 10 15 20 25
Number of stations
Per
cen
t o
f al
l d
ays
Days with rainfall >20mm
0
0.2
0.4
0.6
0.8
0 5 10 15 20 25
Number of stations
Pe
rce
nt
all
da
ys
Days with rainfall >25mm
0
0.1
0.2
0.3
0.4
0 5 10 15 20 25
Number of stations
Per
cen
t al
l d
ays

www.cru.uea.ac.uk
What do the models tell us?

www.cru.uea.ac.uk
Precipitation indices: maximum length of dry spell per year (2070-99 minus 1961-90)
A2a scenario
A2a
B2a
A2a:– Longer by 15-30
days in centre and south east
– 10 days shorter over northern Europe
B2a:– Smaller changes than
A2a– wetter Eastern Med.
10oW 0o 10oE 20oE 30oE 40oE 30oN
35oN
40oN
45oN
50oN
-10
0
10
20
30
10oW 0o 10oE 20oE 30oE 40oE 30oN
35oN
40oN
45oN
50oN
-10
0
10
20
30

www.cru.uea.ac.uk
Precipitation indices: start of drought(2070-99 minus 1961-90)
A2a scenario
A2a
B2a
A2a:– 5-10 days earlier
in future– No change over
much of northern Europe
B2a:– 3-5 days earlier
in future
10oW 0o 10oE 20oE 30oE 40oE 30oN
35oN
40oN
45oN
50oN
-15
-10
-5
0
5
10
15
10oW 0o 10oE 20oE 30oE 40oE 30oN
35oN
40oN
45oN
50oN
-15
-10
-5
0
5
10
15

www.cru.uea.ac.uk
Precipitation indices: end of drought(2070-99 minus 1961-90)
A2a scenario
A2a:– Generally no
change or slightly earlier end in future
– later over centre and south east
B2a:– Very similar to
A2a
10oW 0o 10oE 20oE 30oE 40oE 30oN
35oN
40oN
45oN
50oN
-10
0
10
20
30
10oW 0o 10oE 20oE 30oE 40oE 30oN
35oN
40oN
45oN
50oN
-10
0
10
20
30

www.cru.uea.ac.uk
Precipitation indices: max. 5-day running total(2070-99 minus 1961-90)
A2a scenario
A2a:– Lower by 10-20 mm
in future, particularly in west
– Wetter in centre and Adriatic
B2a:– Smaller changes
than A2a– Clearly wetter in Italy
10oW 0o 10oE 20oE 30oE 40oE 30oN
35oN
40oN
45oN
50oN
-40
-20
0
20
40
10oW 0o 10oE 20oE 30oE 40oE 30oN
35oN
40oN
45oN
50oN
-40
-20
0
20
40

www.cru.uea.ac.uk
Precipitation indices: summary
• Summer Mediterranean droughts likely to start earlier under A2a, particularly in south east Mediterranean
• Summer droughts in northern Europe likely to be slightly shorter under A2a
• Western and eastern Mediterranean drier in winter under A2a, Adriatic and central Italy wetter
• Under B2a all A2a changes reduced, Italy wetter

www.cru.uea.ac.uk
What can climate models tell us about extremes?
• Used appropriately, model data can be applied without intervening statistical downscaling to explore extremes, thus avoiding such issues as
• preservation of relationships in spatial and temporal fields• and whether or not all contributing forcing factors have been
taken into account
• Processing with techniques such as:• Extreme value analysis• Storm tracking algorithms
can yield valuable information