Www.bls.gov Propensity Score Models for Nonresponse and Measurement Error John Dixon U.S. Bureau of...
16
www.bls.gov Propensity Score Models for Nonresponse and Measurement Error John Dixon U.S. Bureau of Labor Statistics June 20, 2011 The opinions expressed are those of the author, not the BLS
-
Upload
steven-jacobson -
Category
Documents
-
view
217 -
download
1
Transcript of Www.bls.gov Propensity Score Models for Nonresponse and Measurement Error John Dixon U.S. Bureau of...

www.bls.gov
Propensity Score Models for Nonresponse and Measurement Error
John DixonU.S. Bureau of Labor Statistics
June 20, 2011
The opinions expressed are those of the author, not the BLS
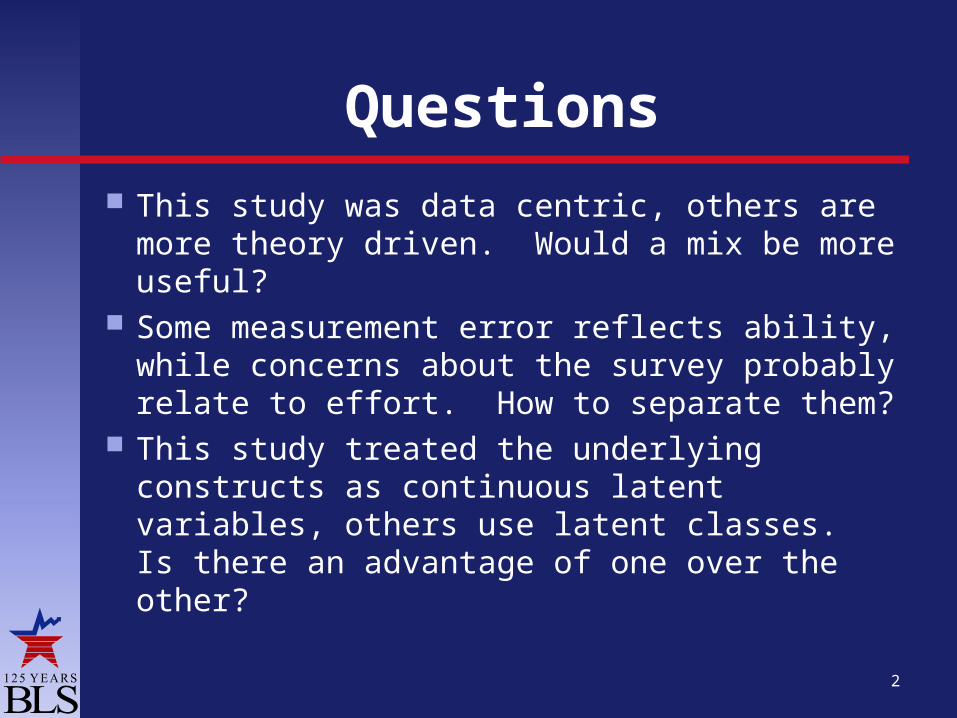
Questions
This study was data centric, others are more theory driven. Would a mix be more useful?
Some measurement error reflects ability, while concerns about the survey probably relate to effort. How to separate them?
This study treated the underlying constructs as continuous latent variables, others use latent classes. Is there an advantage of one over the other?
2

Nonresponse Bias and Measurement Error
Nonresponse bias and measurement error both refer to difficult to measure errors in surveys. Nonresponse bias refers to unmeasured persons, and measurement error refers to an unmeasured construct (which is mis-measured by the survey).
Contact history has the potential to describe the concerns of potential respondents as well as contactability. Those concerns have been found to relate to nonresponse, but little relationship to measurement error.
3
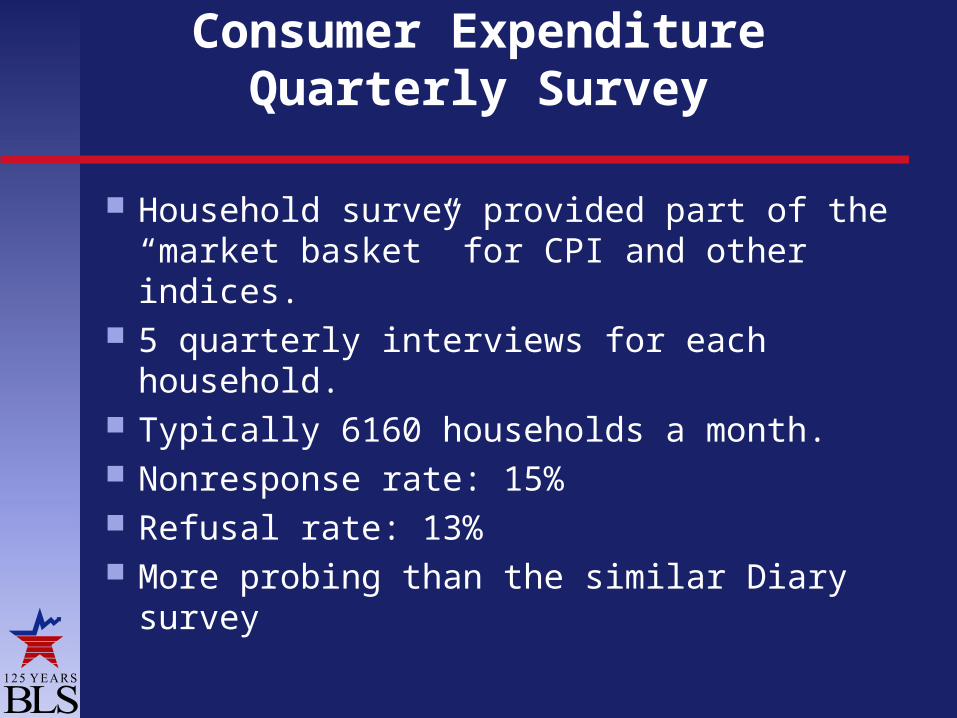
Consumer Expenditure Quarterly Survey
Household survey provided part of the “market basket” for CPI and other indices.
5 quarterly interviews for each household. Typically 6160 households a month. Nonresponse rate: 15% Refusal rate: 13% More probing than the similar Diary
survey

Contact History Instrument (CHI) Data

Mean Rates of CHI concerns
0
0.05
0.1
0.15
0.2
0.25
busy
sc
hedule
notin
t
tim
e
priv
acy
volu
ntar
to
omany
quest
ion
m
ember
iss
ues
quit
nosh
ow
antig
ov
hungu
p
sa
meinf
to
oper
s
to
olong
nota
pp
hosti
le
oth
hh
sa
mefr
Mea
n C
once
rns_
__

7
Predicting Nonresponse Logistic model Coefficients
-2-1.5
-1-0.5
00.5
11.5
22.5
3
Bivariate Models
HUNGUP NOTAPP TOOLONG SCHEDULE PRIVACY TIME HOSTILE NOTINT MEMBER QUESTION SAMEFR BUSY OTHHH SAMEINF VOLUNTAR NOSHOW ANTIGOV TOOPERS ISSUES TOOMANY QUIT

8
Predicting Nonresponse Logistic Model Coefficients
-2
-1.5
-1
-0.5
0
0.5
1
1.5
2
Multiple Predictors
HUNGUP NOTAPP TOOLONG SCHEDULE PRIVACY TIME HOSTILE NOTINT MEMBER QUESTION SAMEFR BUSY OTHHH SAMEINF VOLUNTAR NOSHOW ANTIGOV TOOPERS ISSUES TOOMANY QUIT

Factor Pattern for Contact History Concerns
-0.6
-0.4
-0.2
0
0.2
0.4
0.6
0.8
1
Hostile Time Busy Privacy
Hostile
NotInt
Hangup
Samefr
Time
SameInf
TooPers
TooMany
TooLong
Quit
Busy
NoShow
Schedule
Privacy
AntiGov
Question
NotApp
OthHH

Factor Pattern for Measurement Error
0
0.1
0.2
0.3
0.4
0.5
0.6
0.7
0.8
0.9
1
Process Personal Economic
Telephone
InfoBook
Education
Marital
Sex
BirthYear
Military
Age
Income
Salary
Supplem
GrossPay
Occupat
HoursWrk
Records

Noncontact and Refusal Correlated with Measurement Error Indicators
Variable Economic Personal Process No Records
Noncontact 0.08294 -0.00909 0.05472 0.11020
Ntiming 0.09642 0.00656 0.06171 0.03250
Nbarrier -0.00364 -0.04230 -0.00216 0.16663
Refusal 0.21429 0.05939 0.16930 -0.04461
rhostile 0.19808 0.03860 0.13678 -0.06559
rtime 0.13350 0.06655 0.12342 -0.09529
rbusy 0.18245 0.04086 0.13556 0.15390
rprivacy 0.10792 0.04955 0.08554 -0.02740
11
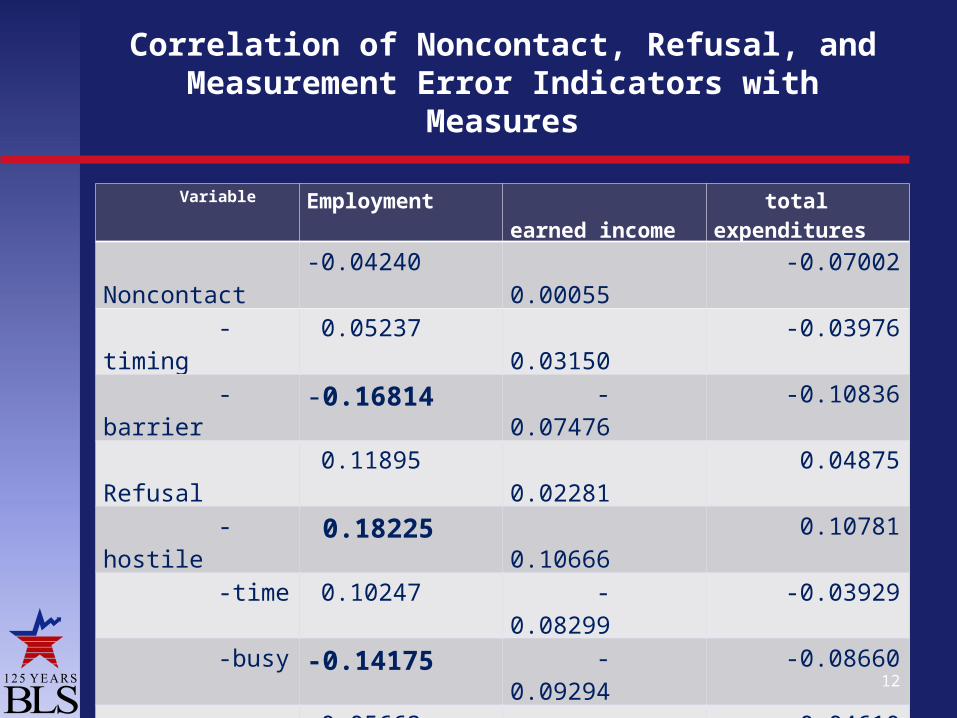
Correlation of Noncontact, Refusal, and Measurement Error Indicators with
Measures
Variable Employment earned income total expenditures
Noncontact -0.04240 0.00055 -0.07002
-timing 0.05237 0.03150 -0.03976
-barrier -0.16814 -0.07476 -0.10836
Refusal 0.11895 0.02281 0.04875
-hostile 0.18225 0.10666 0.10781
-time 0.10247 -0.08299 -0.03929
-busy -0.14175 -0.09294 -0.08660
-privacy 0.05663 0.01477 0.04610
Economic 0.04696 0.06151 0.10524 Personal 0.03225 0.06224 0.08880 Process -0.01586 -0.03572 -0.01208
No Records -0.33462 -0.12235 -0.17956 12

Summary
The CHI data was useful in modeling the relationship between concerns expressed by respondents and refusal/noncontact.
The CHI data showed factor patterns which could describe broad areas of concern. They related well in predicting nonresponse.
The measurement error indices weren’t strongly related to concerns, or to bias, except the use of records.

Limitations and Future Research
The CHI data is limited in that it only reflects the concerns expressed by respondents. Some of the most common concerns may mask the real reasons, for example, “busy” may hide concerns about privacy, which weren’t expressed to the interviewer.
More variables are needed for the measurement error models. Timing variables for sections, comparison of estimates between interviews, particularly when the respondent changes within the household, and edit indicators from other sections.
Replicating the models with another survey may help make the model more general.
Put all the pieces into a structural equation model.

Questions
This study was data centric, others are more theory driven. Would a mix be more useful?
Some measurement error reflects ability, while concerns about the survey probably relate to effort. How to separate them?
This study treated the underlying constructs as continuous latent variables, others use latent classes. Is there an advantage of one over the other?
15

Contact Information
www.bls.gov
Propensity Score Models for Nonresponse and
Measurement ErrorJohn Dixon