
WWF Building Nature's Safety Net Report 2011 -...
113
This is the published version: Taylor, Martin, Sattler, Paul, Fitzsimons, James, Curnow, Chris, Beaver, Daniel, Gibson, Lydia and Llewellyn, Gilly 2011, Building nature’s safety net 2011 : the state of protected areas for Australia’s ecosystems and wildlife., WWF‐Australia, Sydney, N.S.W. Available from Deakin Research Online: http://hdl.handle.net/10536/DRO/DU:30037002 Reproduced with the kind permission of the copyright owner. Copyright : 2011, WWF‐Australia
-
Upload
nguyentruc -
Category
Documents
-
view
214 -
download
0
Transcript of WWF Building Nature's Safety Net Report 2011 -...

This is the published version: Taylor,Martin,Sattler,Paul,Fitzsimons,James,Curnow,Chris,Beaver,Daniel,Gibson,LydiaandLlewellyn,Gilly2011,Buildingnature’ssafetynet2011:thestateofprotectedareasforAustralia’secosystemsandwildlife.,WWF‐Australia,Sydney,N.S.W.
Available from Deakin Research Online: http://hdl.handle.net/10536/DRO/DU:30037002Reproducedwiththekindpermissionofthecopyrightowner.Copyright:2011,WWF‐Australia
Building Nature’s Safety Net 2011The state of protected areas for Australia’s ecosystems and wildlife
ISBN: 978-1-921031-43-4
Authors: Martin Taylor, Paul Sattler, Chris Curnow, James Fitzsimons, Daniel Beaver, Lydia Gibson, Gilly Llewellyn.
Publisher: WWF-Australia
wwf.org.au
GPO Box 528 Sydney NSW 2001 Tel: +61 (0)2 9281 5515
First published March 2011 by WWF-Australia. Any reproduction in full or part of this publication must mention the title and credit the above mentioned publisher as the copyright owner.
This report should be cited as: Taylor, M F J, Sattler, P S, Fitzsimons, J, Curnow, C, Beaver, D, Gibson, L and G Llewellyn. 2011. Building Nature’s Safety Net 2011. The state of protected areas for Australia’s ecosystems and wildlife. WWF-Australia, Sydney.
Cover image: The remote and biologically rich Buccaneer Archipelago on the Kimberley coast of northwest Australia, still lacking any significant land and sea protection. © WWF-Paul Gamblin.

Acknowledgements The authors gratefully acknowledge the cooperation of Parks Australia, as well as the generous cooperation of the state and territory conservation agencies. Dr Stuart Blanch provided valuable information and commentary.
Map sources and caveatsMaps are reproduced in accordance with the terms of non-commercial licenses for the use of underlying Australian government data. Any errors of interpretation or in map production are WWF’s alone.
About the authors
Martin Taylor is WWF-Australia’s Protected Areas Policy Manager and has published important analyses of the effectiveness of the Endangered Species Act in the United States, threats to international whale habitats, and the effectiveness of conservation actions in Australia including protected areas for threatened species. He has served on the Scientific Committee of the International Whaling Commission and as an NGO observer at CITES. He is a member of the IUCN World Commission on Protected Areas.
Paul Sattler OAM was the principal architect in doubling Queensland’s National Park estate in the early 1990s, and pioneered the development of a biologically representative park network across the State. Paul initiated and guided the comprehensive description of Queensland’s bioregional ecosystems and assessment of their status, providing an essential planning tool for conservation and natural resource management. He was principal author of the National Land and Water Resources Audit’s terrestrial biodiversity assessment of Australia, which was the first detailed national assessment of biodiversity at a range of scales. Paul has been awarded an OAM for his services to biodiversity conservation.
James Fitzsimons is an Honorary Research Fellow with the School of Life and Environmental Sciences, Deakin University, and is the Director of Conservation for The Nature Conservancy’s Australia Program. He was formerly a senior project officer with the Victorian Department of Sustainability and Environment and the Victorian Environmental Assessment Council, working in the fields of protected area establishment and policy. He has published over 30 publications on protected area policy in Australia.
Chris Curnow is WWF-Australia’s Program Manager, Southwest Australia. He has spent more than 20 years engaging private land managers in conservation and socio-economic outcomes. Since 2003, he has championed private land manager stewardship in southwest Australia — our only internationally recognised biodiversity hotspot — towards a network complementary to the National Reserve System. He has more than five years experience advising NGOs and governments on environmental and development projects in Latin America.
Daniel Beaver is a consultant conservation geographer with WWF-Australia. Daniel’s area of expertise is systematic conservation planning where, since 2007, he has been working towards the development of a world-class network of marine protected areas to safeguard the marine life of Australia and the Southern Ocean. Previously, as a conservation geographer for the North East Forest Alliance, Daniel played a key role in the development of the National Parks Estate for northeast New South Wales.
Lydia Gibson is WWF-Australia’s Marine Flagships Program Manager. Lydia has a Master of Marine Mammal Science, has worked on WWF’s campaign to protect the Coral Sea and create the world’s largest marine protected area, and is involved in research, policy, and advocacy regarding marine species such as marine turtles, inshore dolphins, and dugongs.
Ghislaine Llewellyn is WWF-Australia’s Conservation Programs Manager. She has an undergraduate degree in Natural Sciences from Cambridge University and a PhD in Earth Sciences from Harvard University. In the policy arena, she spent several years leading WWF’s international and Asia Pacific marine protected area work, and helped launch large-scale multi-country conservation efforts in East Africa, South East Asia, and Melanesia.

2WWF Building Nature’s Safety Net 2011 page
WWF Building Nature’s Safety Net 2011
FOREWORD FROM PENELOPE
FIGGIS AO
It is a critical time for conservation, and WWF’s detailed analysis of Australia’s key biodiversity tool —protected areas — has come at the right time.The overall picture for Australia’s wonderful, ancient, and unique plants and wildlife remains stark. They face a range of threats — especially land conversion and loss of habitat, too frequent and severe fires,
and weed and feral animal invasions. Almost all current threatening processes will be exacerbated by climate change, which, in turn, is predicted to bring additional pressures including coral bleaching, salt water intrusion into freshwater systems, severe droughts, floods, and storm events.
However, Australia has real strength to face these formidable challenges. The National Reserve System and Marine Planning System have a strong policy and science base for building Australia’s core systems of protected areas. Australia has a consensus strategy for the National Reserve System. Marine bioregional planning is moving ahead and is expected to deliver a new system of Commonwealth marine reserves by 2012. We also have park management agencies and other land and marine management agencies, which, while often under-resourced, are professional and committed to effective management. Australian governments have been innovative in supporting the crucial, voluntary Indigenous Protected Areas, and also in strongly supporting the emergence of a complementary private land conservation sector.
WWF’s key directions are being universally embraced. The Australian government has just committed to a new strategic plan under the Convention on Biological Diversity that aims, at both the global and national level, to achieve protected area status, by 2020, in
“at least 17 per cent of terrestrial and inland water[s], and 10 per cent of coastal and marine areas[. Areas] of particular importance for biodiversity and ecosystem services are conserved through effectively and equitably managed, ecologically representative and well connected systems of protected areas and other effective area-based conservation measures, [which can be] integrated into the wider landscape and seascapes.”
This goal embraces many of the key elements needed for future success. Firstly, we must continue to build our protected area systems on land and in the marine environment. Secondly, we must augment and support these systems with other forms of conservation and sustainable management to inspire greater land and seascape initiatives. These two priorities should be the guiding principles used when important decisions are being made about the future of the Caring for Our Country program, the premier Australian government investment in nature conservation.
WWF’s new Building Nature’s Safety Net report vehemently supports these goals. The report makes a strong case for much greater investment in expanding protected areas as a fundamental conservation necessity, guaranteeing the success of land- or seascape-scale conservation.
© D
elw
yn
DU
PU
IS.

3WWF Building Nature’s Safety Net 2011 page
WWF Building Nature’s Safety Net 2011
This report presents, for the first time, some of the success stories to come out of the historic 2008 commitment by the Australian government (i.e. increasing the National Reserve System budget from 2 per cent of the then Natural Heritage Trust budget to 10 per cent earmarked for the Caring for Our Country program). This report also illustrates how cost effective this program has been. On average, the cost to purchase a wildlife habitat and ensure its enduring protection is $47 per hectare.
The Indigenous Protected Areas program has, likewise, delivered impressive and cost-effective gains, with Traditional Owners voluntarily devoting an additional three million hectares of their lands to conservation since 2008.
In this report, we see the first comprehensive picture of the gaps that remain in conserving Australian ecosystems and threatened species. It is also the first time the ecosystem analysis extends to Australia’s marine environment.
The real issue is the scale of the investment compared with the scale of risk and potential loss. While, as a nation, we seldom question spending billions on national defence, we continue to begrudge comparatively small budgets for our ‘natural defence’, despite the immense potential losses of healthy ecosystems. WWF estimates that $240 million a year will be needed to acquire new protected areas to reach the 2020 international target. While several times larger than current investment levels, it still represents less than 0.1 per cent of the national budget.
The return on this investment would be enormous, but cannot easily be put into dollar amounts. Protected areas provide sanctuary for our wonderful animals and plants and protect our most beautiful and valued land and seascapes. These are surely their most important tasks. They also protect genetic resources for pharmaceuticals and agriculture; they ensure agriculture has beneficial species, such as pollinators; they soak up carbon and lock it away; they help control floods, protect coastlines and improve water quality; all while attracting over $20 billion a year in spending by overseas tourists.
Our National Reserve System is a great national achievement — a remarkable collaboration from all levels of government, from non-government organisations, Traditional Owners, and individual landholders committed to conservation. It deserves the highest priority attention to ensure Australia’s unique wildlife and wild places, and all their benefits, have a future.
Penelope Figgis AO Vice-Chair Oceania, IUCN World Commission on Protected Areas Director, Australian Committee of the IUCN.

CONTENTS ExECuTIvE SuMMARy 8
Terrestrial National Reserve System 8
National Representative System of Marine Protected Areas 11
RECOMMENDATIONS 12
ABOuT ThIS REPORT 15
TERRESTRIAL NATIONAL RESERvE SySTEM 16
Introduction 16
– A minimum standard for the national reserve system 18
– What are highly protected areas? 18
Changes in total area 20
– Growth in area 2000–2008 22
– Required growth for 2020 CBD target 22
– National Reserve System Program additions since 2008 23
Ecosystem gap analysis 23
– Results and discussion 24
– Comparisons with 2008 Terrestial Biodiversity Assessment 25
Threatened species gap analysis 27
National Reserve System bioregional priorities based on gaps 29
Financing streams 36
– National Reserve System Program 36
– Indigenous Protected Areas Program 38
– Private land protected areas 39
– Regional Natural Resource Management organisations 44
– Whole of landscape conservation 48
– National Wildlife Corridors Plan 48
– National standards for use of IUCN categories 50
Management effectiveness 51
– Do protected areas work? 51
– Investments in management 51
– Standard of management 53
Conclusion and recommendations 53

NATIONAL REPRESENTATIvE SySTEM OF MARINE PROTECTED AREAS 57
Introduction 57
– A minimum standard for the marine reserve system 58
Total areas protected 59
Benthic ecosystems gap analysis 60
Threatened species gaps 61
Policy changes needed 63
Financing needed 63
Standard of management 65
Importance of terrestrial protected areas for marine protected areas 65
Conclusion and recommendations 65
PRIORITy AREAS FOR PROTECTION 69
Southwest Australia biodiversity hotspot 69
Great Barrier Reef 70
The Rangelands 71
JuRISDICTIONAL PROFILES 73
Queensland: priority state for reserve system growth 73
Australian Capital Territory 76
New South Wales 76
Northern Territory 78
South Australia 80
Tasmania 81
Victoria 82
Western Australia 83
ENDNOTES 86
APPENDIx 100

FIGuRE 1 20All marine and terrestrial protected areas by IUCN protected area management category (as of 2008 for terrestrial, and as of 2009 for marine). External territories are omitted.
FIGuRE 2 26Percentages by area of attainment of the minimum standard of 15 per cent of original total area of proxy ecosystems in highly protected areas (IUCN Category I–II), other protected areas (IUCN Category III–VI), and completely unprotected (i.e. gap). These statistics are divided into jurisdictions, broad vegetation types, and WWF priority regions. Right hand graph shows total areas (ha) of gaps for highly protected areas. Note: Existing IUCN Category III–VI areas could be used to fill these gaps to the total area if they could be shown to be highly protected in practice.
FIGuRE 3 27 Breakdown of the 15 per cent minimum standard for terrestrial proxy ecosystems into area already protected, highly (IUCN Category I–II) or otherwise, and gap areas broken into those still with original vegetation, and those previously cleared but considered recoverable. See endnote 42.
FIGuRE 4 28 Proportions of 1449 nationally threatened species with 30 per cent or more of their distribution included in highly protected areas; less than 30 per cent in highly protected areas but with 30 per cent or more in all protected areas; less than 30 per cent protected in any protected area; and those with no representation in highly protected areas. Jurisdictions appear in descending order of proportions meeting the standard. Numbers of species appear in brackets. *ACT was included in NSW figures for this analysis.
FIGuRE 5 34 New priorities for bioregions based on indicative combined gap for ecosystems and EPBCA species. See Table 3.
FIGuRE 6 35 Bioregional rank priorities for expansion of the National Reserve System from the 2002 Terrestrial Biodiversity Assessment. See Table 3 for more detail.
FIGuRE 7 45Annual Australian government investments up to 2007/8 and subsequent commitments to three programs significant to the development of the National Reserve System.
FIGuRE 8 62 Map of major marine regions used in the analysis in Fig. 9. Note: These are not the same as the Australian government marine planning units. Heard and McDonald Islands not shown.
FIGuRE 9 62 Percentages by area of attainment of the minimum standard of 30 per cent of benthic ecosystems in marine sanctuaries (IUCN Category I–II), other zones of marine parks (nominally IUCN Category III–VI), and completely unprotected (i.e. gap) as of 2009. These statistics are divided into marine regions shown in Fig. 8. Right hand graph shows total areas (ha) of gaps for marine sanctuaries.
FIGuRES

TABLES AND BOxESTABLE 1 21Total areas of terrestrial protected areas as of 2008 by jurisdiction, percentage of jurisdiction area in IUCN management categories, and percentage of protected areas in three governance categories.
TABLE 2 23Areas of all terrestrial protected areas and highly protected areas in 2000, 2006, and 2008, and inferred growth rate per decade by jurisdiction.
TABLE 3 30 Priorities based on combined proxy ecosystem and EPBCA species gaps compared with the 2002 Assessment rank, for all IBRA 6.1 bioregions, as well as areas and proportions protected in 2004, 2006, and 2008, and areas of ecosystems and species meeting minimum standards.
TABLE 4 40 Major Australian government investment in terrestrial protected areas, and leveraged investments for the National Reserve System program purchase grants stream.
TABLE 5 41 Investments from the Australian government Caring for Our Country program toward private land covenanted protected areas, apart from the NRS program, by jurisdiction.
TABLE 6 46Jurisdictional investments in expansion of terrestrial protected areas 2007–2009.
TABLE 7 47 Jurisdictional investments in management of protected areas on land 2007–2009 compared with baseline 2004–2005.
TABLE 8 48Jurisdictional investments in management of private land protected areas in 2007–2009.
TABLE 9 59 Combined areas of marine parks and sanctuaries in 2009, by jurisdiction, ordered from lowest to highest.
TABLE 10 64 Jurisdictional investments in management or threat abatement on marine protected areas 2007–2009.
BOx 1 19 Mining in private protected areas.
BOx 2 38 Bowra Sanctuary, a significant recent National Reserve System Program purchase.
BOx 3 43 Bringing covenants in the Western Australian wheatbelt into the NRS.
BOx 4 49 Carbon Farming Initiative.

8WWF Building Nature’s Safety Net 2011 page
Executive Summary
ExECuTIvE SuMMARy
TERRESTRIAL NATIONAL RESERvE SySTEM
© Q
Ue
en
Sla
nD
go
ve
rn
me
nt D
ePa
rtm
en
t of th
e e
nv
Iro
nm
en
t an
D r
eS
oU
rc
e m
an
ag
em
en
t.
Protected areas are critical to conserving biodiversity. New evidence shows that, of alternate conservation measures, only strictly protected areas and land clearing laws correlate with stabilized threatened species trends in Australia.
The northern hairy-nosed wombat (Lasiorhinus krefftii), the world’s largest burrowing herbivore, is endangered due to habitat destruction and competition with livestock and rabbits. The last remaining (approximately 150) animals survive in Epping Forest National Park in the high priority Brigalow Belt North bioregion. A second, translocated colony was started in 2009 in the Richard Underwood Nature Refuge, Brigalow Belt South.
Protected areas are also critical to economic and social wellbeing, delivering ecosystem services that cannot be reliably valued in dollar terms. One benefit that is understood in dollar terms is nature-based tourism, which attracts approximately $20 billion annually in foreign exchange to Australia.
New National Reserve System (NRS) targets have been adopted by the Australian government to protect ecosystem and species diversity by 2030, and to expand the system, including Indigenous Protected Areas, from 13 to 16.25 per cent of Australia by 2013.
Australia has also adopted the Convention on Biological Diversity (CBD) Strategy 2011–2020, which has a target of bringing at least 17 per cent of terrestrial and inland waters into effectively and equitably managed, ecologically representative and well connected systems of protected areas by 2020.

9WWF Building Nature’s Safety Net 2011 page
Executive Summary
Governments have yet to commit to minimum standards for adequate inclusion of ecosystem or species diversity in terrestrial protected areas. Scientifically credible interim standards are needed until more species- or ecosystem-specific guidelines become available.
In this report, we adopt an interim minimum standard of 15 per cent of each regional ecosystem and 30 per cent of distributions for threatened species in highly protected areas, with some modifications for small or very large areas. In our analysis, we estimate ecosystem and species protection gaps, which are areas needing to move from the current reserve system to one which meets the minimum standard of protection for ecosystems and species.
As of 2008, the cumulative shortfall, or gap, from an interim 15 per cent standard for including proxy ecosystems in highly protected areas was 70 million hectares, or 9 per cent of Australia’s land area. As of 2006, 14 per cent of 1449 species, listed as threatened under national legislation, had no portion of their distribution in a protected area; 52 per cent had some portion protected, while only 28 per cent met a minimum standard of 30 per cent of their distribution highly protected.
Seventeen top priority bioregions with the largest gaps for ecosystems and threatened species are identified, mostly in arid to semi-arid rangelands and inland waters. Ten of these bioregions have remained top priority since the 2002 Terrestrial Biodiversity Assessment, underlining the importance of focusing investment in these areas.
Nonetheless, significant gaps for protection of both ecosystem and species diversity occur in every bioregion.
Queensland was the state with the largest gap for inclusion of poorly protected ecosystems, and remains the top priority state for strategic growth of Australia’s NRS.
Tasmania ranked highly for protection of ecosystems, but had the largest relative gap for the protection of distributions of nationally threatened species.
The Australian government funding commitment to the NRS, including Indigenous Protected Areas, increased 4.5 times over the five-year period beginning 2008, which was relative to the preceding five years. The government committed $180 million to the NRS program and $50 million to the Indigenous Protected Areas (IPA) program.
The NRS program has delivered excellent value for money, costing the Australian government, on average, about $47 per hectare purchased, and bringing 1.25 million hectares under protection from mid-2008 to mid-2010. Moreover, every acquisition dollar from the NRS program leverages, on average, $4.55 in state or territory government contributions to acquisition and in-perpetuity management. The IPA program is even more cost effective, costing less than $5 per hectare added.
The NRS and IPA programs are, arguably, the Australian government’s biggest conservation success stories.
The NRS funding levels remain low, however, at about 10 per cent of the overall Australian government’s Caring for Our Country program budget, which represents a small portion of the total federal budget. We estimate a sevenfold increase in the budget is required to fill the gaps identified in this report.
NATuRE-BASED TOuRISM ATTRACTS $20 BILLION
ANNuALLy

10WWF Building Nature’s Safety Net 2011 page
Whole-of-landscape planning is essential for effective protection of biodiversity. This requires delineation of high conservation-value areas prioritized for inclusion in the NRS, as well as buffer and linkage areas surrounding the backbone of the present and future reserve system. They are the focal areas for complementary natural resource management (NRM) investments, farm management agreements, and land-use planning and regulations.
Private land protected areas, secured by covenants, continue to be promoted by many agencies, programs, and investment streams with very little coordination, transparency, or nationally consistent standards.
The rapid growth of nominally IUCN Category III–VI protected areas remains a concern in the absence of an objective, transparent national system for confirming the compatibility of extractive uses with the primary conservation purpose.
All protected areas on land and sea should be subject to a nationally consistent system for assigning IUCN management categories, for confirming the compatibility of uses with the primary conservation purpose, and for auditing management effectiveness.
Aerial photo of Epping Forest National Park, the last natural refuge of the northern hairy-nosed wombat, showing surrounding landscape cleared for livestock pasture right up to boundary.
© Q
Ue
en
Sla
nD
go
ve
rn
me
nt D
ePa
rtm
en
t of th
e e
nv
Iro
nm
en
t an
D r
eS
oU
rc
e m
an
ag
em
en
t.
Executive Summary
11WWF Building Nature’s Safety Net 2011 page
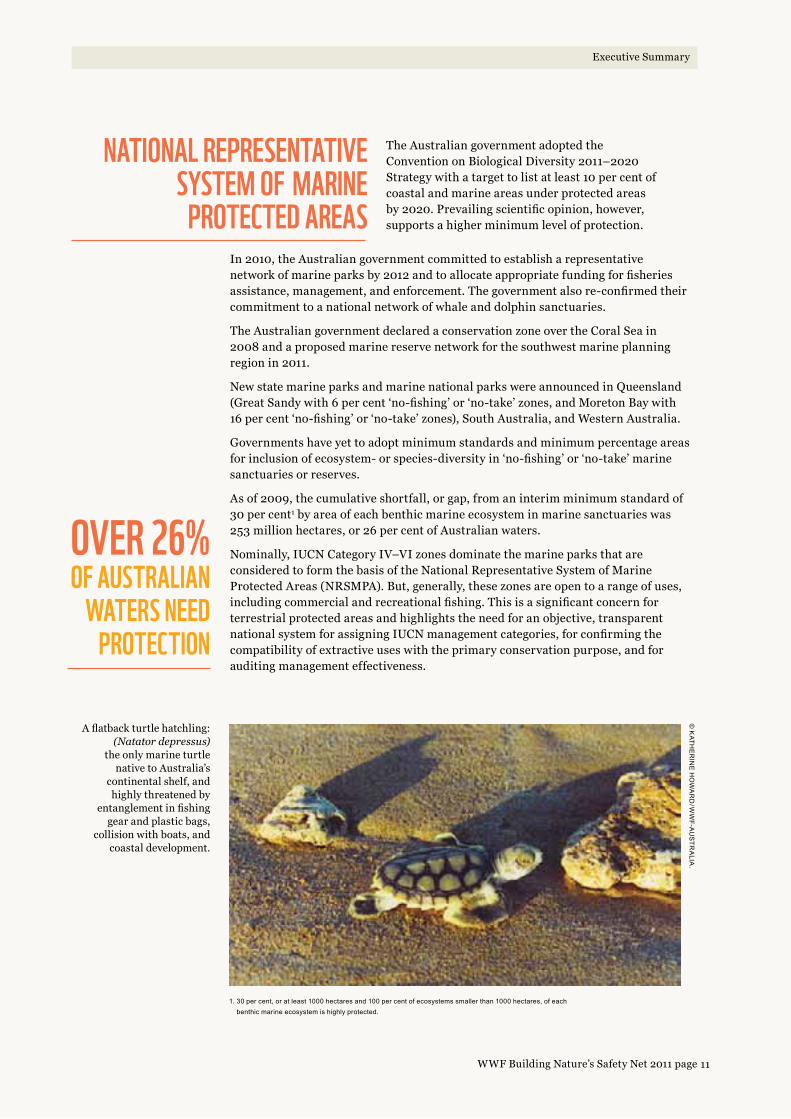
A flatback turtle hatchling: (Natator depressus)
the only marine turtle native to Australia’s
continental shelf, and highly threatened by
entanglement in fishing gear and plastic bags,
collision with boats, and coastal development.
© K
athe
rIn
e h
ow
ar
D/w
wf-a
US
tra
lIa.
1. 30 per cent, or at least 1000 hectares and 100 per cent of ecosystems smaller than 1000 hectares, of each benthic marine ecosystem is highly protected.
NATIONAL REPRESENTATIvE SySTEM OF MARINE
PROTECTED AREAS
OvER 26%OF AuSTRALIAN
WATERS NEED PROTECTION
Executive Summary
The Australian government adopted the Convention on Biological Diversity 2011–2020 Strategy with a target to list at least 10 per cent of coastal and marine areas under protected areas by 2020. Prevailing scientific opinion, however, supports a higher minimum level of protection.
In 2010, the Australian government committed to establish a representative network of marine parks by 2012 and to allocate appropriate funding for fisheries assistance, management, and enforcement. The government also re-confirmed their commitment to a national network of whale and dolphin sanctuaries.
The Australian government declared a conservation zone over the Coral Sea in 2008 and a proposed marine reserve network for the southwest marine planning region in 2011.
New state marine parks and marine national parks were announced in Queensland (Great Sandy with 6 per cent ‘no-fishing’ or ‘no-take’ zones, and Moreton Bay with 16 per cent ‘no-fishing’ or ‘no-take’ zones), South Australia, and Western Australia.
Governments have yet to adopt minimum standards and minimum percentage areas for inclusion of ecosystem- or species-diversity in ‘no-fishing’ or ‘no-take’ marine sanctuaries or reserves.
As of 2009, the cumulative shortfall, or gap, from an interim minimum standard of 30 per cent1 by area of each benthic marine ecosystem in marine sanctuaries was 253 million hectares, or 26 per cent of Australian waters.
Nominally, IUCN Category IV–VI zones dominate the marine parks that are considered to form the basis of the National Representative System of Marine Protected Areas (NRSMPA). But, generally, these zones are open to a range of uses, including commercial and recreational fishing. This is a significant concern for terrestrial protected areas and highlights the need for an objective, transparent national system for assigning IUCN management categories, for confirming the compatibility of extractive uses with the primary conservation purpose, and for auditing management effectiveness.

RECOMMENDATIONSRecommendation 1: The Australian government should increase the National Reserve System purchase grants program commitment to $240 million per annum for the decade 2011–2020, allowing grants for up to 75 per cent of total cost of acquisition of new highly protected areas.
54
Recommendation 2: The Australian government should further boost the level of funding for the Indigenous Protected Areas program and offer longer-term contracts for protected area management.
54
Recommendation 3: Australian governments should establish a nationally consistent and transparent process and set of standards for IUCN categorization, management effectiveness auditing, and compatibility of uses assessments for all protected areas.
54
Recommendation 4: In line with scientific guidance, all jurisdictions should commit to bringing at least 30 per cent of each marine ecosystem and threatened species distribution and 100 per cent of critical habitats for threatened species into marine sanctuaries by 2020. Jurisdictions should develop budgets appropriate to the need for ongoing management and implement a displaced activities policy.
66
Photo: whistling Kite, fogg Dam, northern territory.

© S
tUa
rt B
lan
ch
/ww
f-aU
Str
alIa
.
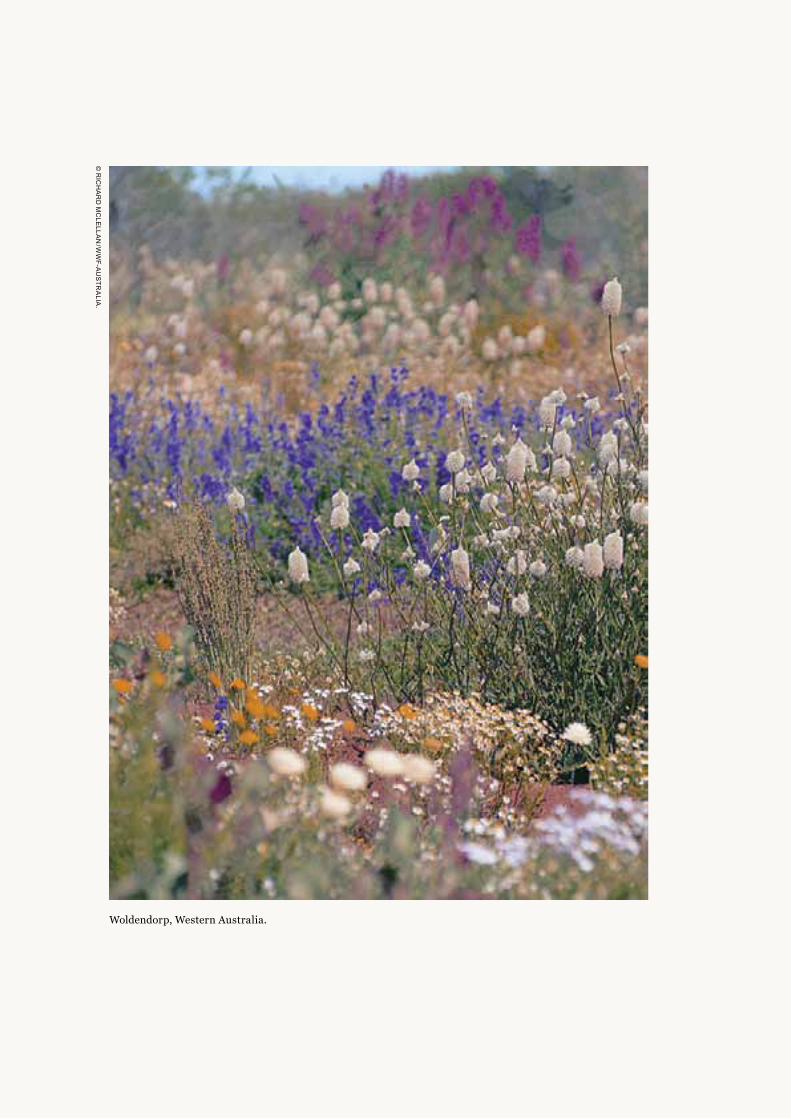
Woldendorp, Western Australia.
© r
Ich
ar
D m
cle
llan
/ww
f-aU
Str
alIa
.

ABOuT ThIS REPORT
Building Nature’s Safety Net is an independent audit of protected area establishment and funding. The reports are based on questionnaires and requests for data sent
to all jurisdictions as well as published data on protected areas — in particular the Australian government’s Collaborative Australian Protected Areas Database’s most recent release for 2008. This report is the third in a series with the two previous reports published in 2006 and 2008.1
This report details major conservation initiatives that have occurred since the last report, in which data was current to 2006, and highlights emerging issues.
A major enhancement on previous reports is the inclusion of ecosystem and threatened species gap analyses, and the reporting on Australia’s protected area systems on both land and sea.
We define a minimum standard for an adequate, representative, and comprehensive reserve system by sampling ecosystem and species level diversity.
Using the latest protected area and national species and ecosystem spatial data, we quantify the gaps: those areas needing to move from the current reserve system to one which meets the minimum standard.
We also use data provided by various parks agencies, from responses to a questionnaire (Appendix) or as published by the agencies, to detail financial investments in protected areas, and estimate the investment levels needed to fill the documented gaps.
We also identify critical policy changes needed to more effectively fill the identified gaps.
16WWF Building Nature’s Safety Net 2011 page
Terrestrial National Reserve System
There are a number of compelling reasons why protected areas are essential, not just for biodiversity, but, to our economy and way of life. People enjoy enormous economic and social benefits from protected areas, including:2
TERRESTRIAL NATIONAL RESERvE
SySTEMINTRODuCTION
— Climate control — Protected areas store 47 billion tonnes of carbon worldwide and are actively soaking up more from the air
— Disaster mitigation — Protected mangroves, reefs, forests, and floodplains buffer human communities against storms, flood, mudslides, and tsunamis
— Clean water — A third of the world’s largest cities obtain a significant portion of their clean drinking water from protected areas
— Food security — Protected areas harbour wild plant and animal genetic resources worth many billions of dollars every year to pharmaceutical and agricultural industries
— Poverty reduction — Protected areas prevent over-exploitation of wild-harvested plants and animals, especially fish stocks that poor communities depend on. They also provide cash revenue from tourism, valued at hundreds of billions of dollars worldwide. In Thailand and Costa Rica, researchers measured a net positive impact of protected areas on alleviation of poverty3
— Cultural heritage — Protected areas also protect many natural or semi-natural religious and cultural sites of great importance to human communities
— Tourism revenue — Nature-based tourism brings in $19.5 billion a year in foreign exchange, which is nearly 7 per cent of our total exports. Most of this comes from visits to national parks and other public-access protected areas.4 World Heritage listing is a premium attraction for tourists.5 The Great Barrier Reef alone attracts more than $6 billion a year in tourist-spending and supports 63,000 jobs.6 In Queensland, the priority state identified in this report, development of a comprehensive parks system could add another $400–$600 million a year in tourism revenue to the State economy.7
The principal role for protected areas is saving biodiversity from extinction. The first National Strategy for the Conservation of Australia’s Biodiversity, in 1996,8 recognised that the establishment of a comprehensive, adequate, and representative (CAR) system of protected areas was essential for effective conservation of Australia’s biodiversity, along with complementary reforms of land management, production, and development practices in the wider landscape.
The National Reserve System (NRS) was established in 1992, and was designed to bring together Australia’s state-, territory-, and Commonwealth-run national parks and reserves, private protected areas, and Indigenous protected areas into a dedicated, single system to conserve Australia’s unique biodiversity.9
Crucial to this pioneering system was the development of an agreement between the Australian, state, and territory governments to cooperate on strategic growth of the NRS. The Australian government established the National Reserve System Program to provide incentives including funds for land acquisition.
17WWF Building Nature’s Safety Net 2011 page
Terrestrial National Reserve System
WWF-Australia played an important role in the development of these commitments, launching a national protected areas campaign. WWF produced strategies for, and report cards on, the performance of governments’ development of the NRS.
In 2006 and 2008, WWF embarked on a renewed campaign to reinvigorate the commitment of governments to the NRS, through the Building Nature’s Safety Net reports.10
The commitment to a comprehensive, representative, and adequate NRS has continued. It was most recently reaffirmed in the release of Australia’s Strategy for the National Reserve System 2009–2030.11
Through adoption of the Strategy at the Natural Resource Management Ministerial Council meeting in May 2009, Australian, state, and territory governments committed to the following targets, to bring into protected areas:
— examples of at least 80 per cent of all regional ecosystems in each bioregion by 2015 (comprehensiveness)
— examples of at least 80 per cent of all regional ecosystems in each subregion by 2025 (representativeness)
— core areas for the long-term survival of threatened species by 2030
— critical areas for climate change resilience, such as refugia by 2030.
There are as yet no national minimum standards set for ‘adequacy’ in terms of the area, quality, or configuration of a sample or ‘example’ of an ecosystem or species habitat; standards that, if protected, would ensure long term persistence, low risk of extinction, and maintenance of normal ecological processes. Also, the scale and definition of a regional ecosystem varies between jurisdictions. Queensland follows a robust approach to delineating regional ecosystems as the intersection of bioregions, land zones, and vegetation types.12
To complicate matters, governments have also adopted various targets for total area protected.
In 2008, the Australian government adopted a Caring for Our Country program, with the aim of adding 25 million hectares. By 2013, the total area of the NRS, including Indigenous Protected Areas, would increase to 125 million hectares, from a baseline of 13 per cent growing to 16.25 per cent of Australia.
In 2010, The Australian government adopted the Convention on Biological Diversity (CBD) Strategy for 2011–2020, which included a new target to bring at least 17 per cent of terrestrial and inland waters under an ecologically representative system of protected areas by 2020.
If the Caring for Our Country target is achieved, and is strategically oriented to fill the gaps for priority ecosystems and species, it is likely Australia will also meet the 2020 CBD target.
In 2010, the Australian government released Australia’s Biodiversity Conservation Strategy, with ten interim targets — including that, by 2015, it would “achieve a national increase of 600,000 square kilometres of native habitat managed primarily for biodiversity conservation across terrestrial, aquatic, and marine environments.”13
This target needs to be more clearly separated into terrestrial and marine components. The terrestrial component should complement existing protected area targets under the NRS strategy, Caring for Our Country, and CBD targets discussed above. The marine component should apply to marine conservation areas outside of marine sanctuaries, which should have their own explicit target.
47 BILLION TONNES OF
CARBON STORED IN
PROTECTED AREAS
18WWF Building Nature’s Safety Net 2011 page
A MINIMuM STANDARD FOR ThE NATIONAL RESERvE SySTEM
Terrestrial National Reserve System
In the absence of nationally agreed criteria for ‘adequacy’ of the NRS, this report will use interim targets, based on the Nationally Agreed Criteria for the Establishment of a Comprehensive, Adequate and Representative Reserve System for Forests in Australia (the JANIS criteria),14 as follows.
– Terrestrial ecosystem diversity — On land, 15 per cent by area of the original total area of each regional ecosystem in highly protected areas. If 15 per cent of the original total area is less than 1000 hectares, a minimum of 1000 hectares should be highly protected. If the original total area is less than 1000 hectares, all of the original total area should be highly protected.
– Terrestrial species diversity — 30 per cent by area of threatened species current distributions and 100 per cent by area of their critical habitats in highly protected areas. If 30 per cent of the current distribution is less than 1000 hectares, a minimum of 1000 hectares should be highly protected. If the current distribution is less than 1000 hectares, all of the current distribution should be highly protected. Finally, if 30 per cent of the current distribution is larger than 10 million hectares, the highly protected area should be, at most, 10 million hectares.15
These standards are not permanent, but interim minimum standards, until actual ecological data is available to identify specific requirements for ensuring long-term preservation of particular ecosystems, communities, or species.
Importantly, the standards do not include other important aspects of ‘adequacy’, such as connectivity, configuration, habitat quality, or complementary management of surrounding land.
The threatened species’ 30 per cent standard proposed here is based on the current ‘known’ or ‘likely to occur’ distribution, not the original distribution. For some threatened species and ecosystems, such as those that have suffered a major contraction in distribution, 30 per cent of current distribution may not be an adequate level for long-term recovery. For this reason the standard also includes 100 per cent of critical habitats,16 where ‘critical habitats’ are defined as those critical to the recovery and long-term preservation of a species. The NRS strategy aims to include critical habitats in the NRS by 2030, although further clarification of the term ‘critical habitat’ is needed.17
What are highly protected areas?
To analyse gaps with regard to the proposed ‘adequacy’ standard above, we must distinguish ‘highly protected’ areas from those not highly protected.
In previous Building Nature’s Safety Net reports,18 we included IUCN Categories III and IV as highly protected areas; however, a review of the categories by the IUCN19 prompted us to re-examine their application in Australia. We found there are also nominally IUCN Category III or IV areas that, as applied in some parts of Australia, can allow grazing of livestock for commercial purposes in some instances. These include heritage agreements in South Australia (nominally IUCN Category III),20 conservation parks in Queensland (nominally IUCN Category III)21 and natural features reserves in Victoria (nominally IUCN Category IV).22
19WWF Building Nature’s Safety Net 2011 page
Apart from some (hopefully temporary) aberrations involving mining and livestock grazing,23 IUCN Categories I and II protected areas can be accurately referred to as highly protected because they are largely closed to all major extractive uses of natural resources in Australia.
Recognizing the ambiguity of the term, for the purposes of gap analysis that follows, we will define ‘highly protected’ as IUCN Categories I and II areas.
Box 1: Mining in private protected areas.
The Steve Irwin Wildlife Reserve is a pastoral lease purchased with assistance from the Australian government for addition to the National Reserve System as a private protected area in 2007, in tribute to the late wildlife champion, Steve Irwin. A bauxite exploration permit was issued by the Queensland Mines Department over a significant portion of the property. This was opposed in court and via a major international campaign by Australia Zoo.
The Bimblebox Nature Refuge in central Queensland was purchased with assistance from the Australian government in 2000 to become a private protected area (IUCN Category IV). It was subsequently gazetted by the Queensland government as a class VI Nature Refuge under state legislation. The Queensland government issued exploration permits for a coal mine.
Although these examples are based in Queensland, the issues can apply Australia-wide and extend beyond mining to other uses, in particularly farming livestock. These examples suggest the need for a type of protected area on private land with the same level of security as a National Park in addition to the existing types of private protected areas.
In 2000, the World Conservation Congress resolved that mining should not take place in IUCN Category I–IV protected areas. After initial opposition, the International Council of Mining and Metals, in 2003, adopted a new position to not mine World Heritage areas and is now exploring ‘no go’ criteria with IUCN.24
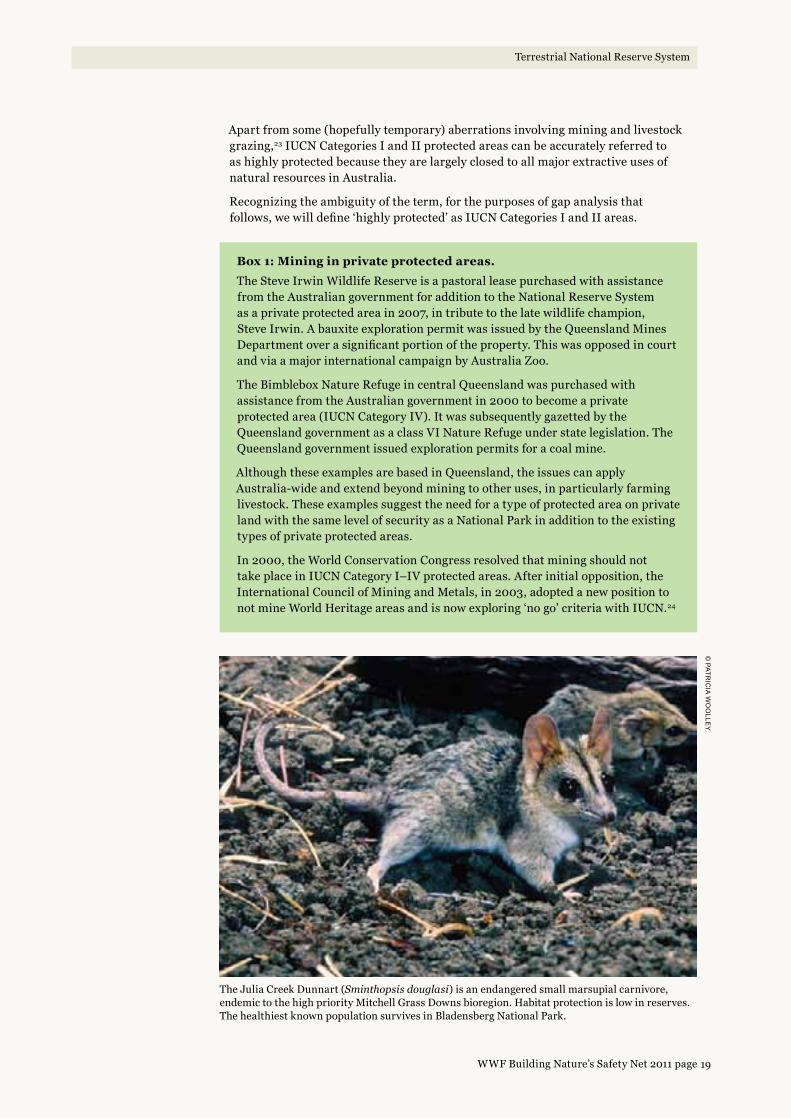
The Julia Creek Dunnart (Sminthopsis douglasi) is an endangered small marsupial carnivore, endemic to the high priority Mitchell Grass Downs bioregion. Habitat protection is low in reserves. The healthiest known population survives in Bladensberg National Park.
Terrestrial National Reserve System
© Patr
IcIa
wo
olle
y.
20WWF Building Nature’s Safety Net 2011 page
ChANGES IN TOTAL AREA
Protected Areas 2008-9IUCN management category
I-II
III-IV
V-VI
PROTECTED AREAS 2008–9: IuCN
MANAGEMENT CATEGORy
KEy I–II
III–IV
V–VI
Terrestrial National Reserve System
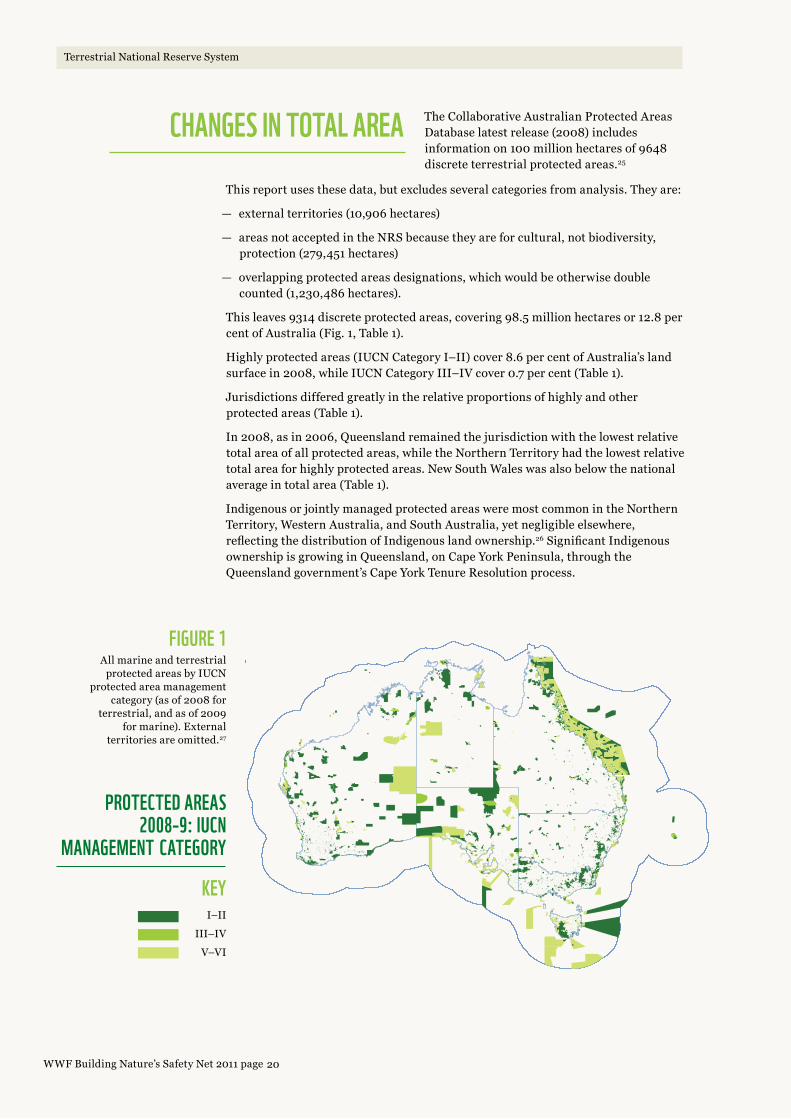
The Collaborative Australian Protected Areas Database latest release (2008) includes information on 100 million hectares of 9648 discrete terrestrial protected areas.25
This report uses these data, but excludes several categories from analysis. They are:
— external territories (10,906 hectares)
— areas not accepted in the NRS because they are for cultural, not biodiversity, protection (279,451 hectares)
— overlapping protected areas designations, which would be otherwise double counted (1,230,486 hectares).
This leaves 9314 discrete protected areas, covering 98.5 million hectares or 12.8 per cent of Australia (Fig. 1, Table 1).
Highly protected areas (IUCN Category I–II) cover 8.6 per cent of Australia’s land surface in 2008, while IUCN Category III–IV cover 0.7 per cent (Table 1).
Jurisdictions differed greatly in the relative proportions of highly and other protected areas (Table 1).
In 2008, as in 2006, Queensland remained the jurisdiction with the lowest relative total area of all protected areas, while the Northern Territory had the lowest relative total area for highly protected areas. New South Wales was also below the national average in total area (Table 1).
Indigenous or jointly managed protected areas were most common in the Northern Territory, Western Australia, and South Australia, yet negligible elsewhere, reflecting the distribution of Indigenous land ownership.26 Significant Indigenous ownership is growing in Queensland, on Cape York Peninsula, through the Queensland government’s Cape York Tenure Resolution process.
FIGuRE 1All marine and terrestrial
protected areas by IUCN protected area management
category (as of 2008 for terrestrial, and as of 2009
for marine). External territories are omitted.27

21WWF Building Nature’s Safety Net 2011 page
Table 1. Total areas of terrestrial protected areas as of 2008 by jurisdiction, percentage of jurisdiction area in IUCN management category, and percentage of protected areas in three governance categories.1
IUCN Management category
IUCN Governance category
Jurisdiction Area (ha) ALL I–II III–IV V–VI Government Indigenous/ Joint
Other non-government
ACT 238,813 54.2% 54.2% – – 54.2% 0.0% 0.0%
Tas 6,840,133 41.0% 24.1% 3.8% 13.1% 40.0% 0.3% 0.7%
SA 98,422,137 26.1% 16.7% 3.7% 5.7% 18.3% 6.4% 1.4%
Vic 22,754,364 17.1% 15.5% 0.7% 0.9% 17.0% 0.0% 0.1%
WA 252,700,808 14.5% 9.0% 0.3% 5.2% 9.4% 4.8% 0.3%
NT2 134,778,762 9.0% 4.7% 0.3% 4.0% 1.4% 7.1% 0.5%
NSW2 80,121,268 8.7% 8.2% 0.4% 0.1% 6.3% 2.3% 0.1%
Qld 172,973,671 6.0% 4.9% 0.1% 1.0% 5.0% 0.2% 0.8%
National average
768,826,956 12.8% 8.6% 0.7% 3.5% 8.3% 3.9% 0.5%
1 Australian government Department of Sustainability, Environment, Water, Population and Communities (2010) Collaborative Australian Protected Areas Database (CAPAD 2008–external), Commonwealth of Australia, Canberra, ACT.
Jurisdictions ordered from highest to lowest. Dark green cells are above, and light green below, the national average.
2 Protected areas under Commonwealth management: Kakadu and Uluru National Parks are included in the NT figures, while Booderee National Park is included in NSW figures. Protected areas in Australia’s external territories are not included. Jurisdictions are ordered from highest to lowest total area of protected areas.
© B
US
h h
er
Itag
e a
US
tra
lIa.
Red-finned blue-eye (Scaturiginichthys vermeilipinnis) is endemic to a handful of artesian springs on Edgbaston Reserve in central Queensland, threatened by invasive exotic fish (Gambusia holbrooki), diversion of spring water for agriculture and direct impacts by livestock and feral animals. The springs were acquired and fully protected by Bush Heritage Australia in September 2008 with funding from the Australian government’s NRS program. By protecting these springs, and managing threats like Gambusia and feral pigs, this Bush Heritage reserve is also conserving nationally threatened spring communities.
Terrestrial National Reserve System

22WWF Building Nature’s Safety Net 2011 page
The night parrot (Pezoporus occidentalis) is a ground-dwelling, seed-eating species endemic to the arid interior of Australia. It is endangered by livestock production, feral cats, and foxes. The night parrot is very rare and elusive. Less than four per cent of its distribution is protected according to the threatened species gap analysis in this report.29 © William Thomas Cooper watercolour.
Growth in area 2000–2008
Between 2000 and 2008, Australian protected areas grew by nearly 5 per cent of national land area; however, less than half of this growth was in highly protected areas (IUCN Category I–II) (Table 2).
Most jurisdictions, except the Northern Territory and Western Australia, grew at a rate below the national average. South Australian highly protected areas showed the most rapid increase over the decade.
Western Australia showed the greatest increase for all protected areas and second for highly protected areas.
All protected areas in the Northern Territory grew at above-average rates, but had the lowest rate of growth of highly protected areas.
Queensland’s highly protected areas grew at half the national rate in terms of percentage area increase per decade.
Over the last decade, New South Wales showed the lowest growth rate for all protected areas, but slightly exceeded Queensland and the Northern Territory for highly protected areas (Table 2). New South Wales has, however, made considerable investment in securing strategic acquisitions in high priority rangeland bioregions.
Required growth for 2020 CBD target
For Australia to reach the 17 per cent 2020 target under the Convention on Biological Diversity28 per decade growth rate of terrestrial protected areas must be maintained at 5 per cent, assuming that growth is achieved in an ecologically representative way. Growth rates must be considerably higher in those jurisdictions, Queensland in particular, where there is currently a relatively low total area and many unrepresented ecosystems. This means there must be even stronger biodiversity focus guiding the allocation of protected area funding.
The Booroolong frog (Litoria booroolongensis) is endemic to the open woodlands of inland NSW and Victoria. It is endangered by land clearing, direct damage of streams by livestock, and invasive weeds and fish. Only 17 per cent of its habitat was located in highly protected areas in 2006.30
© D
ave
hU
nte
r/n
Sw
De
Par
tme
nt o
f en
vIr
on
me
nt, c
lImate
ch
an
ge
an
D w
ater
.
Terrestrial National Reserve System

23WWF Building Nature’s Safety Net 2011 page
Table 2. Areas of all terrestrial protected areas and highly protected areas in 2000, 2006, and 2008, and inferred growth rate per decade by jurisdiction.1
Growth rate (% per decade)
2000 2006 2008
Jurisdiction All IUCN I–II All IUCN I–II All IUCN I–II All IUCN I–II
WA 9.7% 2.9% 6.7% 6.6% 13.3% 8.8% 14.5% 9.0%
NT 5.2% 0.1% 4.8% 4.6% 5.9% 4.8% 9.0% 4.7%
Tas 4.7% 2.3% 37.2% 22.3% 39.8% 23.1% 41.0% 24.1%
Vic 2.6% 1.8% 15.0% 14.1% 16.8% 15.0% 17.1% 15.5%
Qld 2.3% 1.3% 4.1% 3.9% 5.6% 4.7% 6.0% 4.9%
SA 2.1% 7.0% 24.4% 11.1% 25.5% 11.9% 26.1% 16.7%
ACT 1.8% 1.7% 52.8% 52.8% 54.0% 54.0% 54.2% 54.2%
NSW 1.8% 1.3% 7.3% 7.2% 8.4% 7.3% 8.7% 8.2%
National average
5.2% 2.4% 8.7% 6.7% 11.6% 7.7% 12.8% 8.6%
1 By jurisdiction ordered from highest to lowest relative to the national average for overall growth. Light green cells are below, and dark green cells above, the national average.
National Reserve System program additions since 2008
There has been a major increase in the total area of the NRS since 2008. A funding boost resulted in the addition of 4.2 million hectares under protection, an area equivalent to nearly 70 per cent of Tasmania. This area is dominated by new Indigenous Protected Areas. A more complete picture of this recent growth will not be available until the next Collaborative Australian Protected Area Database (CAPAD) is released.
ECOSySTEM GAP ANALySIS
Terrestrial National Reserve System
To independently assess the total area to which the NRS comprehensively, adequately, and representatively includes ecosystem diversity, we created a national scale proxy for regional ecosystems.
This was achieved through the intersection of Major Vegetation Subgroups (MVSG) of the National Vegetation Information System (NVIS v4) and subregions of the Interim Bioregionalisation of Australia (IBRA v6.1).31
In this report, we refer to these proxies for regional ecosystems as simply ‘proxy ecosystems’.
To quantify the gaps, where the NRS fell short of the 15 per cent interim adequacy standard defined above, we intersected the spatial data for proxy ecosystems with spatial data for the National Reserve System as of 2008.
For comparison with comprehensiveness and representativeness measures, reported in the 2008 Terrestrial Biodiversity Assessment, we used a less restrictive definition of ‘an example’32 as an area of at least 1000 hectares combined across all protected areas (or 100 per cent if the original total area was less than 1000 hectares).
Methods are detailed in endnote 33.
24WWF Building Nature’s Safety Net 2011 page
Results and discussion
A gap area of approximately 70 million hectares is considered to be in need of a high level protection on land to reach the minimum 15 per cent standard for each proxy ecosystem (Fig. 2).
Existing protected areas in IUCN Category III–VI protected areas could contribute to meeting the standard and thereby reduce this gap if there were a process to determine that they are conferring a high level of protection in practice.
Australia is nearly halfway toward representation of proxy ecosystem diversity to a 15 per cent target (Figures 2 and 3). Of the total area needed to meet the standard for each proxy ecosystem, 36 per cent is already in highly protected areas and a further 11 per cent in other protected areas, which, upon further analysis, could count towards the target. Some 51 per cent of the area required to meet the target is largely intact or remnant proxy ecosystems. To meet the minimum standard, an additional 2 per cent of previously cleared proxy ecosystems would also need to be protected and recovered to remnant status. This process could be financed by carbon offsets, if available, or from other restoration-oriented funding streams (Fig. 3).
Under-represented broad vegetation types on land are primarily rangelands, inland wetlands, and to a lesser extent, the forests (Fig. 2).
In the past, creation of new protected areas in pastoral regions has tended to arouse little interest from governments, compared with protecting icons or scenic attractions. Their creation has often been met with local opposition despite resulting growth in the local tourism industry. 34
The two global priority areas for WWF, South West Australia Ecoregion (SWAE) and the Great Barrier Reef catchments (GBR), showed large and significant gaps for protection of ecosystems (Fig. 2).
The Australian Capital Territory and Tasmania recorded the lowest gap areas of all the jurisdictions, relative to total state area. This result was to be expected as these two jurisdictions have the greatest percentage areas protected (Table 1).
Queensland recorded the lowest percentage area protected (Table 1) and the lowest attainment of the 15 per cent target among the states and territories (20 per cent highly protected, 23 per cent for all protected areas) (Fig. 2). The gap area of 20 million hectares required to meet the standard is, coincidentally, the same as the total area of all protected areas the Queensland government has committed to achieve by 2020. 35 Therefore, the Queensland government’s target is insufficient to fill the large gap. Nonetheless, the Queensland government’s 2008 commitment remains an important milestone toward a CAR reserve system. Queensland has mapped regional ecosystems for 79 per cent of the State’s area (current to 2005). 36 The proxy ecosystem maps developed for our report cover the entire state. This prompted a comparison between our gap analysis, based on proxy ecosystems, and a gap analysis based on the State’s own regional ecosystem mapping.
Using data tables provided by the Queensland government, 37 we separately estimated that the total attainment of the 15 per cent standard in 2005 was 19.3 per cent of the area of Queensland’s regional ecosystems. This was very close to the 23 per cent found in our proxy ecosystem gap analysis for 2008 (Fig. 2), including all categories of protected areas. This level of broad agreement between two estimates derived from different ecosystem data sets validates our proxy ecosystem analysis for Queensland.
quEENSLAND RECORDED ThE LOWEST PERCENTAGE
OF AREA PROTECTED
Terrestrial National Reserve System

25WWF Building Nature’s Safety Net 2011 page
New South Wales and the Northern Territory were also below the national average for attainment of the 15 per cent standard (Fig. 2, Table 1).
The Tasmanian government reported that, of 50 native forest communities, 35 (70 per cent) have at least 15 per cent of their estimated pre-European total area protected in government reserves. 38 This roughly matches the 65 per cent by area of proxy ecosystems protected to the 15 per cent target in this analysis, in highly protected areas (Fig. 2).
The Western Australian government published a detailed CAR analysis in 2009, which lists a total of 815 vegetation associations in the state reserve system. 39 This figure is comparable to the 680 delineated in our analysis for Western Australia. Using data tables provided by the WA government, we estimated the total attainment of the 15 per cent standard in 2009 was 46.6 per cent by area in nominally highly protected areas (in this case, IUCN Category I–IV). This is close to the estimate of 45 per cent attainment of the standard for proxy ecosystems in IUCN Category I–II reserves in 2008 (Fig. 2). This level of broad agreement between two estimates derived from different ecosystem data sets validates our proxy ecosystem analysis for Western Australia.
Comparisons with 2008 Terrestrial Biodiversity Assessment
The 2008 Biodiversity Assessment identified a gap area of 27 million hectares, whereas our analysis identified it as 70 million hectares. 40 We are unable to account for this large discrepancy because the methods used to estimate gap areas in the Biodiversity Assessment were not transparent.
The Biodiversity Assessment also concluded that the greatest gaps are located in the rangelands.
In Table 3, we provide estimates of the proportion of proxy ecosystems — with at least 1000 hectares in a protected area of some kind — for each Australian bioregion. Only five of the 85 bioregions attained a minimum standard, where there were ‘examples’ of least 1000 hectares for at least 80 per cent of proxy ecosystems in the National Reserve System. By comparison, 11 bioregions were reported to have met the target, with examples of at least 80 per cent of proxy ecosystems, in the Biodiversity Assessment.
The differences in results are likely due to methodological differences. The Biodiversity Assessment does not give a definition of an ‘example’, so it is likely that the examples were smaller in area than those in our analysis. Furthermore, state and territory ecosystem or vegetation mapping used in the Assessment was on a different scale from that used in our analysis.
Only 20 of the 403 subregions attained a minimum standard, where there were ‘examples’ of 1000 hectares for at least 80 per cent of proxy ecosystems. By comparison, 52 subregions were reported to have met the Biodiversity Assessment’s target in the 2008, which illustrates further the differences in methodology from our analysis.
Swamp stringybark (Eucalyptus conglomerata)
is an endangered tree endemic to coastal wetlands
of southeast Queensland. It is endangered by urban
development, and clearing for agriculture, drainage,
and road construction. Only 1100 individuals remain, and
less than 20 per cent of its distribution is protected.52
© Q
Ue
en
Sla
nD
mU
Se
Um
, Br
Uc
e c
ow
ell.
Terrestrial National Reserve System

26WWF Building Nature’s Safety Net 2011 page
ACT
Tas
Vic
WA
SA
NSW
NT
Qld
rainforest
forests
woodlands
wetlands
grass/shrublands
GBR catchments
SW Australia
Australia
Proportion of target area Gap (million ha)
0% 20% 40% 60% 80% 100% 0 10 20 30 40 50 60 70
99%
65%
58%
45%
42%
35%
34%
20%
75%
47%
43%
34%
33%
32%
71%
36%
0.001
0.33
1.42
18.06
9.62
4.45
16.03
20.12
0.19
8.32
1.44
33.08
27.00
4.33
1.61
Jurisdictions
70.03
Terrestrial National Reserve System
KEy
Attainment strict PAs
Attainment other PAs
Gap all PAs (%)
FIGuRE 2Percentages by area of attainment
of the minimum standard of 15 per cent of original total area
of proxy ecosystems in highly protected areas (Category IUCN
I–II), other protected areas (IUCN Category III–VI), and
completely unprotected (i.e. gap). These statistics are divided into
jurisdictions, broad vegetation types, and WWF priority regions.
Right hand graph shows total areas (ha) of gaps for highly
protected areas. Note: Existing IUCN Category III–VI areas could
be used to fill these gaps to the total area if they could be shown
to be highly protected in practice.

27WWF Building Nature’s Safety Net 2011 page
ThREATENED SPECIES GAP ANALySIS
Terrestrial National Reserve System
FIGuRE 3Breakdown of the 15 per
cent minimum standard for terrestrial proxy ecosystems into area already protected,
highly (IUCN Category I–II) or otherwise , and gap areas
broken into those still with original vegetation, and those previously cleared
but considered recoverable. See endnote 42.
GAP: ORIGINAL vEGETATION (51%)
GAP: CLEARED AND RECOvERABLE (2%)
ALREADy PROTECTED hIGhLy PAS (36%)
ALREADy PROTECTED OThER PAS (11%)
In this report, we identify species gaps using the Australian government’s compilation of distributional data for 1,447 species listed as threatened under the Environment Protection and Biodiversity Conservation Act 1999 (EPBCA species).43
We considered a species protected to a minimum standard if 30 per cent of its distribution is located within highly protected areas, with modifications for small and large areas detailed above.
Most EPBCA species were found to have some part of their distribution captured in the reserve system; however, only 28 per cent were found to be included in highly protected areas to the minimum standard of at least 30 per cent of their ‘known’ or ‘likely to occur’ distributions (Fig. 4). An analysis by Watson et al. (2011) found similar results from the same data.44
By comparison, a recent Australian government assessment found that 23 per cent of a total of 13,463 not exclusively threatened species were considered ‘well-represented’ in the NRS, meaning that more than 45 per cent of point location records fell inside the NRS; while 65 per cent were considered ‘adequately represented’, meaning that between 10 and 45 per cent of point location records fell in the NRS.45 Using such statistics as indicators of performance in species diversity protection is problematic: 10 to 45 per cent is a low proportion for adequate representation of threatened species; and, the assessment did not distinguish threatened species from non-threatened species.46
Queensland’s and New South Wales’ highly protected areas included a greater proportion of EPBCA species habitats than that of proxy ecosystems (Figures 2 and 4). In a separate report, the Queensland government states 25.3 per cent of non-EPBCA state-threatened species have below 10 per cent of their habitats protected compared with 42 per cent of EPBCA species found in our analysis. The Queensland government also reported that 19.7 per cent of state-threatened species have less than 5 per cent of distribution protected, compared with 32 per cent of EPBCA species in our analysis. The Queensland government’s report further states that 9 per cent of state threatened species have over 95 per cent of their critical habitats in the reserve system. These discrepancies are likely to stem from the use of point records, rather than the modelled distributions used here, and also because the states reported on their own threatened species, whereas we are reporting on EPBCA species.47

28WWF Building Nature’s Safety Net 2011 page
The Northern Territory reported that 30 per cent of their listed animal species, and 34.3 per cent of 35 of their listed plant species, have negligible populations inside protected areas. This result is consistent with the 33 per cent of EPBCA species with no habitat in highly protected areas found in our analysis.48
Tasmania showed high levels of ecosystem inclusion and the second most extensive reserve system of all jurisdictions (Fig. 2, Table 1), but displayed a low level of inclusion of EPBCA species (Fig. 4). Most EPBCA species are found in the poorly protected regions, such as Tasmanian midlands. The 2008 Biodiversity Assessment reports that from 2002 to 2007, nine state threatened species of plants, and nine threatened species of animals, moved to a more endangered status due to genuine population decline in Tasmania.49
Victoria reported that 93 per cent of native plant and 86 per cent of native animal species had been recorded in parks.50 Our analysis shows that only 30 per cent of EPBCA species in Victoria meet the standard for protection (Fig. 4).
NSW* (336)
WA(375)
VIC (134)
Australia (1449)
QLD(345)
NT (58)
SA (96)
TAS (105)
Proportion of nationally threatened species
0% 10% 20% 30% 40% 50% 60% 70% 80% 90% 100%
26%
22%
12%
30%
28%
28%
34%
30%
33%
10%
19%
5%
14%
18%
11%
14%
On or over target for highly protected areas Below for highly PAs, but on or over for all PAs Below target for highly PAs None in highly PAs
Terrestrial National Reserve System
FIGuRE 4 Proportions of 1449 nationally
threatened species with 30 per cent or more of their distribution included
in highly protected areas; less than 30 per cent in highly protected areas
but with 30 per cent or more in all protected areas; less than 30 per cent
protected in any protected area; and those with no representation in highly protected areas. Jurisdictions appear
in descending order of proportions meeting the standard. Numbers of
species appear in brackets. * ACT was included in NSW figures for
this analysis.
KEy
On or over target for highly PAs Below for highly PAs, but on or over for all PAs
Below target for highly PAs
None in highly PAs

29WWF Building Nature’s Safety Net 2011 page
© D
eP
t of e
nv
Iro
nm
en
t an
D c
on
Se
rvatIo
n.
© K
athe
rIn
e h
ow
ar
D/w
wf-a
US
tra
lIa.
Silky Eremophila (Eremophila nivea) is an endangered plant species
endemic to south-western Western Australia. There
are only six populations remaining in narrow road
reserves in a largely cleared landscape. Less than one per
cent of its known/predicted distribution is found in a
protected area. 51
Carnaby’s black-cockatoo chick (Calyptorhynchus
latirostris), pictured here with WWF-Australia
President Dr Denis Saunders, is endangered by clearance
of banksia heathlands for urban development and
agriculture in the Southwest Australia Global Biodiversity Hotspot. In 2006, only 11 per
cent of its distribution was highly protected.53
NATIONAL RESERvE SySTEM BIOREGIONAL PRIORITIES
BASED ON GAPS
Terrestrial National Reserve System
Over the past three decades, the ecosystem approach to NRS design has been a very successful strategy in building a CAR reserve system for Australia. However, NRS growth guided solely by the inclusion of ecosystems does not account for other biodiversity values, such as threatened species and habitats, which is required under the NRS strategy. Conversely, NRS prioritisation based solely on species, or criteria such as
connectivity, can lead to sub-optimal allocation of effort. Using only EPBCA species as a guide, Tasmania would be considered the top priority state requiring effort, despite it having the second most extensive reserve system of all jurisdictions.
We re-evaluated bioregional priorities using an index that combined ecosystem and EPBCA gaps, expressed as a percentage of the bioregion area. We stress that our findings are an indicator of priority only, not an accurate estimate of the total gap. This is because we were unable to completely remove double-counting of areas with overlapping gaps (Table 3, Fig. 5). There were some surprises, such as the Tiwi-Coburg bioregion being identified as a top priority. Nonetheless, this approach compares well with the earlier bioregional prioritisation in the 2002 Terrestrial Biodiversity Assessment, which was based on bioregional comprehensiveness, ecosystem representation, and threat (Fig. 6).
Many of the same bioregions remain top priorities, including Brigalow Belt North (BBN), Mitchell Grass Downs (MGD), and much of western New South Wales and the Northern Territory.
The arid and semi-arid rangelands and woodlands, and inland wetlands remain the top priority gap bioregions for both ecosystems and threatened species.
The reprioritization suggested here (Fig. 5) should be regarded as a coarse-scale guide only for comparison among bioregions. It should not be substituted for more comprehensive finer-scaled analysis using dynamic optimisation tools like Marxan, which can simultaneously accounts for ecosystem and species diversity, other targeted biodiversity, ecological ‘assets’, and cost of protection.54 The use of such tools, and their predecessors, has made Australia a leader in reserve design since the 1980s. 55 The re-zoning of the Great Barrier Reef marine park followed such a systematic approach. 56
The systematic conservation planning work currently being led by WWF-Australia in the southwest Australia biodiversity hotspot is the latest example of Australia’s leadership in this domain.57

30WWF Building Nature’s Safety Net 2011 page
Tab
le 3
. P
rior
itie
s ba
sed
on c
ombi
ned
prox
y ec
osys
tem
and
EPB
CA
spe
cies
gap
s co
mpa
red
wit
h th
e 20
02 A
sses
smen
t ran
k, fo
r al
l IB
RA
6.1
bio
regi
ons,
as
wel
l as
area
s an
d pr
opor
tion
s pr
otec
ted
in 2
00
4, 2
00
6, a
nd 2
00
8, a
nd a
reas
of e
cosy
stem
s an
d sp
ecie
s m
eeti
ng m
inim
um s
tand
ards
. For
bio
regi
on c
odes
see
http
://w
ww
.env
iron
men
t.go
v.au
/par
ks/n
rs/s
cien
ce/c
apad
/20
04/
ibra
code
.htm
l.
Bio
-re
gio
nJu
ris-
dic
tio
nP
rio
rity
ra
nk
200
81
Pri
ori
ty
ran
k 20
02
2
Are
a (m
illi
on
h
a)
All
PA
s 20
08
(m
illi
on
h
a)
All
PA
s 20
04
(%
)
All
PA
s 20
06
(%
)
All
PA
s 20
08
(%
)
% o
f al
l P
A i
n
IUC
N
I–II
No.
pro
xy
eco
syst
ems
Co
mp
re-
hen
sive
nes
s3G
ap
(m h
a)N
o.
EP
BC
sp
p.4
Mee
tin
g 30
% s
td
(%)
Avg
. gap
(h
a)4
TIW
NT
15
1.01
0.20
520
.3%
20.3
%20
.3%
100.
0%14
36%
0.11
80.
00%
34,8
04
CP
NSW
11
7.38
50.
178
2.4%
2.4%
2.0%
100.
0%72
19%
0.89
10.
00%
485,
102
PIL
WA
13
17.8
211.
512
8.5%
8.5%
6.3%
98.8
%65
29%
1.33
30.
00%
1,14
1,64
9
FIN
NT
11
7.38
0.0
030.
0%0.
0%0.
0%0.
0%48
2%1.
124
0.0
0%7,
353
CR
WA
11
10.1
184.
984
49.3
%49
.3%
49.3
%0.
0%30
50%
1.52
20.
00%
15,6
78
TAN
NT
11
25.9
974.
437
17.1
%1.
4%1.
6%0.
0%29
38%
3.90
10.
00%
25,8
73
CA
NT
11
3.46
20.
003
0.1%
0.1%
0.0%
0.0%
176%
0.52
0
AR
CN
T1
23.
332
0.84
125
.2%
25.7
%3.
3%0.
0%41
39%
0.50
110
0%
STU
NT
11
9.85
80.
069
0.7%
0.2%
0.2%
29.5
%26
27%
1.46
0
BR
TN
T1
17.
380.
019
0.3%
0.3%
0.3%
99.5
%31
6%1.
09
10.
00%
1,0
00
MG
DQ
ld1
133
.532
0.40
51.
2%1.
2%1.
2%91
.5%
151
17%
4.69
90.
00%
22,6
52
DL
WA
11
8.36
20.
086
1.0%
1.0%
1.0%
100.
0%40
13%
1.17
30.
00%
3,83
1
EIU
Qld
12
11.7
190.
491
4.2%
3.8%
3.0%
70.8
%77
30%
1.56
140.
00%
22,0
22
BB
NQ
ld1
113
.613
0.27
22.
0%2.
0%1.
6%68
.4%
212
22%
1.83
234.
30%
6,83
8
GU
PQ
ld1
222
.058
0.56
52.
6%2.
5%2.
5%96
.4%
111
18%
2.78
10.
00%
230,
497
DA
BN
T1
22.
092
0.05
22.
5%2.
5%2.
5%54
.3%
956
%0.
280
1 N
.B. T
he in
dica
tor
was
cal
cula
ted
as t
he to
tal e
cosy
stem
gap
sho
rt o
f the
15%
eco
syst
em s
tand
ard
for
all p
rote
cted
are
as, a
dded
to t
he a
vera
ge g
ap fo
r sp
ecie
s ti
mes
the
squ
are
root
of t
he
num
ber
of E
PBC
spe
cies
. Sim
ply
addi
ng u
p al
l the
spe
cies
gap
s do
es n
ot a
llow
for
the
fact
tha
t man
y sp
ecie
s di
stri
buti
ons
over
lap.
A s
quar
e ro
ot c
alcu
lati
on w
as fo
und
to la
rgel
y, b
ut n
ot
enti
rely
, acc
ount
for
such
dou
ble-
coun
ting
. Col
ours
indi
cate
ran
king
from
hig
hest
(1, p
urpl
e) to
low
est (
5, g
reen
) ra
nked
, ord
erin
g ba
sed
on t
he in
dex
and
divi
ding
into
fiv
e eq
ual g
roup
s of
17
bio
regi
ons.
See
Fig
ure
5.
2 C
urre
nt r
eser
ve p
rior
ity
in t
he tb
lIB
RA
tab
le o
f the
Aus
tral
ian
Gov
ernm
ent’s
20
02 T
erre
stri
al B
iodi
vers
ity
Ass
essm
ent d
atab
ase.
See
Fig
6.
3 N
.B. T
his
is n
ot t
he p
ropo
rtio
n of
pro
xy e
cosy
stem
s m
eeti
ng t
he 1
5% s
tand
ard,
but
the
pro
port
ions
mee
ting
a lo
wer
sta
ndar
d of
at l
east
10
00h
a in
clud
ed in
pro
tect
ed a
reas
of a
ny k
ind,
or
100%
if t
he to
tal e
cosy
stem
are
a w
as le
ss t
han
this
. Tho
se b
iore
gion
s m
eeti
ng t
he 8
0% c
ompr
ehen
sive
ness
tar
get a
re h
ighl
ight
ed in
gre
en.
4 O
nly
coun
ting
EPB
CA
-lis
ted
spec
ies
that
hav
e 50
% o
r m
ore
of t
heir
dis
trib
utio
n in
the
par
ticu
lar
bior
egio
n. A
vera
ge g
ap is
the
geo
met
ric
aver
age
of t
he a
reas
of t
he g
aps
fall
ing
shor
t of t
he
stan
dard
of 3
0% o
f the
dis
trib
utio
n in
a p
rote
cted
are
a of
any
kin
d.
Terrestrial National Reserve System

31WWF Building Nature’s Safety Net 2011 page
MII
Qld
12
6.66
40.
194
2.9%
2.8%
2.8%
89.8
%39
18%
0.89
0
GAW
SA2
412
.364
1.59
912
.9%
12.9
%12
.9%
75.6
%91
49%
1.57
90.
00%
25,8
38
DE
UQ
ld2
36.
885
0.21
23.
1%3.
0%2.
8%78
.8%
9622
%0.
914
0.0
0%64
1
CH
CSA
23
30.6
192.
198
7.2%
7.2%
6.9%
42.0
%18
941
%3.
838
12.5
0%73
,967
DM
RN
T2
25.
805
0.11
62.
0%2.
0%2.
0%98
.4%
254%
0.76
0
BH
CSA
21
5.68
20.
152
2.7%
2.7%
1.4%
95.5
%40
38%
0.74
0
ML
Qld
22
25.1
670.
773.
1%2.
8%2.
6%94
.8%
234
28%
3.20
40.
00%
24,0
65
GSD
WA
22
39.5
253.
296
8.3%
4.2%
4.3%
28.0
%58
40%
5.01
0
RIV
Vic
22
9.71
30.
328
3.4%
2.7%
2.2%
57.7
%12
237
%0.
9710
0.0
0%80
,077
LSD
WA
22
11.0
90.
514
4.6%
4.6%
4.6%
100.
0%20
25%
1.38
0
DR
PN
SW2
110
.699
0.18
91.
8%1.
8%1.
6%86
.0%
145
16%
1.31
0
BE
LTa
s2
40.
657
0.10
115
.4%
15.2
%14
.6%
20.0
%22
45%
0.0
86
16.7
0%40
9
NA
NN
SW2
12.
70.
078
2.9%
2.8%
1.9%
97.1
%33
30%
0.32
825
.00%
621
TN
MTa
s2
10.
415
0.02
25.
2%4.
2%3.
5%3.
7%20
15%
0.05
70.
00%
914
STP
SA2
313
.42
0.96
57.
2%7.
2%7.
3%74
.3%
6442
%1.
562
50.0
0%1,
188
BB
SQ
ld2
227
.225
1.24
44.
6%4.
5%3.
2%82
.7%
363
23%
2.88
5320
.80%
3,80
0
OV
PW
A2
312
.541
1.47
11.7
%7.
1%7.
1%60
.4%
5133
%1.
281
100%
FL
BSA
22
7.12
60.
399
5.6%
5.6%
4.6%
72.3
%10
228
%0.
7122
45.5
0%24
1
CM
CQ
ld3
31.
463
0.16
311
.1%
10.5
%9.
7%94
.8%
9135
%0.
1411
72.7
0%11
MU
RW
A3
228
.121
2.05
77.
3%6.
7%1.
1%85
.0%
3569
%2.
480
KIN
Tas
35
0.42
50.
075
17.7
%17
.6%
16.4
%26
.4%
2245
%0.
04
1127
.30%
171
MA
CN
T3
33.
929
0.55
914
.2%
14.0
%13
.7%
61.8
%23
57%
0.33
1241
.70%
273
HA
MW
A3
41.
088
0.15
914
.6%
14.6
%14
.6%
100.
0%7
86%
0.0
90
VV
PV
ic3
12.
440.
045
1.9%
1.4%
1.4%
75.3
%27
26%
0.14
140.
00%
11,7
09
Bio
-re
gio
nJu
ris-
dic
tio
nP
rio
rity
ra
nk
200
81
Pri
ori
ty
ran
k 20
02
2
Are
a (m
illi
on
h
a)
All
PA
s 20
08
(m
illi
on
h
a)
All
PA
s 20
04
(%
)
All
PA
s 20
06
(%
)
All
PA
s 20
08
(%
)
% o
f al
l P
A i
n
IUC
N
I–II
No.
pro
xy
eco
syst
ems
Co
mp
re-
hen
sive
nes
s3G
ap
(m h
a)N
o.
EP
BC
sp
p.4
Mee
tin
g 30
% s
td
(%)
Avg
. gap
(h
a)4
Terrestrial National Reserve System
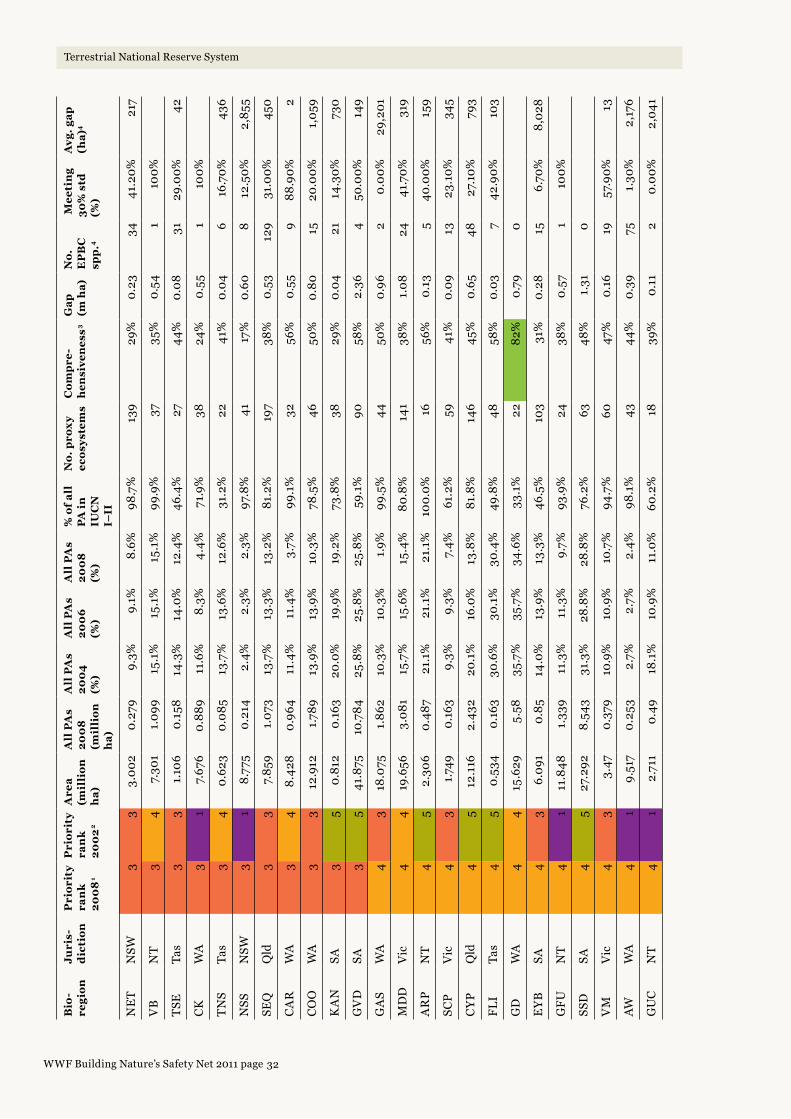
32WWF Building Nature’s Safety Net 2011 page
NE
TN
SW3
33.
002
0.27
99.
3%9.
1%8.
6%98
.7%
139
29%
0.23
3441
.20%
217
VB
NT
34
7.30
11.
099
15.1
%15
.1%
15.1
%99
.9%
3735
%0.
541
100%
TSE
Tas
33
1.10
60.
158
14.3
%14
.0%
12.4
%46
.4%
2744
%0.
08
3129
.00%
42
CK
WA
31
7.67
60.
889
11.6
%8.
3%4.
4%71
.9%
3824
%0.
551
100%
TN
STa
s3
40.
623
0.0
8513
.7%
13.6
%12
.6%
31.2
%22
41%
0.0
46
16.7
0%43
6
NSS
NSW
31
8.77
50.
214
2.4%
2.3%
2.3%
97.8
%41
17%
0.60
812
.50%
2,85
5
SEQ
Qld
33
7.85
91.
073
13.7
%13
.3%
13.2
%81
.2%
197
38%
0.53
129
31.0
0%45
0
CA
RW
A3
48.
428
0.96
411
.4%
11.4
%3.
7%99
.1%
3256
%0.
559
88.9
0%2
CO
OW
A3
312
.912
1.78
913
.9%
13.9
%10
.3%
78.5
%46
50%
0.80
1520
.00%
1,05
9
KA
NSA
35
0.81
20.
163
20.0
%19
.9%
19.2
%73
.8%
3829
%0.
04
2114
.30%
730
GV
DSA
35
41.8
7510
.784
25.8
%25
.8%
25.8
%59
.1%
9058
%2.
364
50.0
0%14
9
GA
SW
A4
318
.075
1.86
210
.3%
10.3
%1.
9%99
.5%
4450
%0.
962
0.0
0%29
,201
MD
DV
ic4
419
.656
3.0
8115
.7%
15.6
%15
.4%
80.8
%14
138
%1.
08
2441
.70%
319
AR
PN
T4
52.
306
0.48
721
.1%
21.1
%21
.1%
100.
0%16
56%
0.13
540
.00%
159
SCP
Vic
43
1.74
90.
163
9.3%
9.3%
7.4%
61.2
%59
41%
0.0
913
23.1
0%34
5
CY
PQ
ld4
512
.116
2.43
220
.1%
16.0
%13
.8%
81.8
%14
645
%0.
6548
27.1
0%79
3
FL
ITa
s4
50.
534
0.16
330
.6%
30.1
%30
.4%
49.8
%48
58%
0.03
742
.90%
103
GD
WA
44
15.6
295.
5835
.7%
35.7
%34
.6%
33.1
%22
82%
0.79
0
EY
BSA
43
6.0
910.
8514
.0%
13.9
%13
.3%
46.5
%10
331
%0.
2815
6.70
%8,
028
GF
UN
T4
111
.848
1.33
911
.3%
11.3
%9.
7%93
.9%
2438
%0.
571
100%
SSD
SA4
527
.292
8.54
331
.3%
28.8
%28
.8%
76.2
%63
48%
1.31
0
VM
Vic
43
3.47
0.37
910
.9%
10.9
%10
.7%
94.7
%60
47%
0.16
1957
.90%
13
AWW
A4
19.
517
0.25
32.
7%2.
7%2.
4%98
.1%
4344
%0.
3975
1.30
%2,
176
GU
CN
T4
12.
711
0.49
18.1
%10
.9%
11.0
%60
.2%
1839
%0.
112
0.0
0%2,
041
Bio
-re
gio
nJu
ris-
dic
tio
nP
rio
rity
ra
nk
200
81
Pri
ori
ty
ran
k 20
02
2
Are
a (m
illi
on
h
a)
All
PA
s 20
08
(m
illi
on
h
a)
All
PA
s 20
04
(%
)
All
PA
s 20
06
(%
)
All
PA
s 20
08
(%
)
% o
f al
l P
A i
n
IUC
N
I–II
No.
pro
xy
eco
syst
ems
Co
mp
re-
hen
sive
nes
s3G
ap
(m h
a)N
o.
EP
BC
sp
p.4
Mee
tin
g 30
% s
td
(%)
Avg
. gap
(h
a)4
Terrestrial National Reserve System

33WWF Building Nature’s Safety Net 2011 page
NC
PSA
43
2.45
80.
231
9.4%
9.1%
9.0%
54.4
%71
41%
0.0
99
44.4
0%77
SWA
WA
44
1.52
60.
1610
.5%
10.4
%10
.2%
99.7
%31
42%
0.0
635
5.70
%52
4
NN
CN
SW4
53.
996
0.97
924
.5%
23.7
%22
.6%
99.5
%19
546
%0.
1434
61.8
0%26
SBN
SW4
53.
811.
458
38.3
%37
.2%
37.0
%99
.4%
206
38%
0.13
108
42.6
0%37
SEH
Vic
44
8.0
951.
485
18.3
%18
.1%
17.5
%96
.7%
207
41%
0.27
4932
.70%
160
NK
WA
54
8.40
71.
249
14.9
%14
.9%
14.5
%97
.2%
1753
%0.
234
25.0
0%3,
161
WT
Qld
55
1.99
90.
9949
.5%
48.7
%47
.2%
79.0
%12
040
%0.
0571
81.7
0%2
YAL
WA
54
5.0
871.
456
28.6
%23
.9%
9.8%
85.0
%36
58%
0.11
988
.90%
2
NU
LSA
55
19.7
236.
234
31.6
%31
.6%
31.6
%86
.8%
3956
%0.
421
100%
JFW
A5
24.
509
0.62
813
.9%
14.1
%5.
1%98
.1%
2962
%0.
08
4926
.50%
133
TC
HTa
s5
50.
768
0.43
256
.2%
56.1
%55
.8%
50.9
%24
67%
0.01
911
.10%
1,18
5
TSR
Tas
55
0.78
20.
324
41.4
%41
.4%
40.8
%91
.4%
2548
%0.
017
42.9
0%9
SEC
Vic
55
2.55
50.
881
34.5
%34
.2%
33.8
%98
.7%
8634
%0.
0229
44.8
0%19
GS
WA
54
3.14
0.56
618
.0%
17.5
%15
.2%
99.9
%33
58%
0.02
5742
.10%
80
MA
LW
A5
57.
398
1.33
218
.0%
18.0
%17
.9%
99.9
%33
55%
0.05
2334
.80%
293
DA
CN
T5
52.
842
0.82
929
.2%
29.2
%29
.2%
96.3
%12
83%
0.01
475
.00%
7
TW
ETa
s5
51.
564
1.32
484
.7%
84.7
%82
.1%
61.2
%22
59%
0.01
710
0%
ESP
WA
55
2.91
80.
837
28.7
%28
.7%
28.6
%99
.5%
2966
%0.
0158
62.1
0%20
WA
RW
A5
50.
844
0.39
546
.7%
46.5
%31
.3%
99.8
%14
79%
0.0
014
50.0
0%11
PC
KN
T5
52.
852
1.21
442
.6%
42.6
%42
.6%
99.0
%11
82%
0.0
04
25.0
0%56
2
AA
Vic
55
1.21
50.
774
63.7
%63
.6%
63.7
%98
.6%
2990
%0.
00
1687
.50%
Nat
iona
l76
8.73
497
.92
12.7
%11
.6%
10.5
%67
.0%
5655
36%
70.0
313
2034
.80%
Bio
-re
gio
nJu
ris-
dic
tio
nP
rio
rity
ra
nk
200
81
Pri
ori
ty
ran
k 20
02
2
Are
a (m
illi
on
h
a)
All
PA
s 20
08
(m
illi
on
h
a)
All
PA
s 20
04
(%
)
All
PA
s 20
06
(%
)
All
PA
s 20
08
(%
)
% o
f al
l P
A i
n
IUC
N
I–II
No.
pro
xy
eco
syst
ems
Co
mp
re-
hen
sive
nes
s3G
ap
(m h
a)N
o.
EP
BC
sp
p.4
Mee
tin
g 30
% s
td
(%)
Avg
. gap
(h
a)4
Terrestrial National Reserve System

34WWF Building Nature’s Safety Net 2011 page
GVD ML
GSD
CHC
MGD
BBSSSD
TAN
MUR
PIL
NUL
GD
GUP
GAS
STP
EIU
RIV
BBN
AW
CR
DL
MDD
COOCP
LSD
OVP
NK
GAW
CYP
DRP
GFU
CK
VBSTU
MII
NSS
FIN
SEH
JF
FLB
CAR
MAL
BRT
SEQ
DEU
SB
BHC
YAL
EYB
DMR
CA
GS
NNC
MAC
ESP
NET
SECVMNCP
VVP
NAN
PCK
ARCDAC
WT
GUC
ARP
DAB
TWE
SWA
TSE
AA
CMC
HAM
TSR
TCH
SCP
BEL
WAR
TNS
TIW
FLI
KAN
TNM
KIN
2008 bioregional priority ranksBased on combined ecosystem and species gaps
1 (High)
2
(L )
Terrestrial National Reserve System
FIGuRE 5New priorities for
bioregions based on indicative combined gap
for ecosystems and EPBCA species. See Table 3 for detailed index values.58
2008 BIOREGIONAL PRIORITy RANKS:
BASED ON ECOSySTEM
AND SPECIES GAPS
KEy 1 (high)
2
3
4
5 (low)
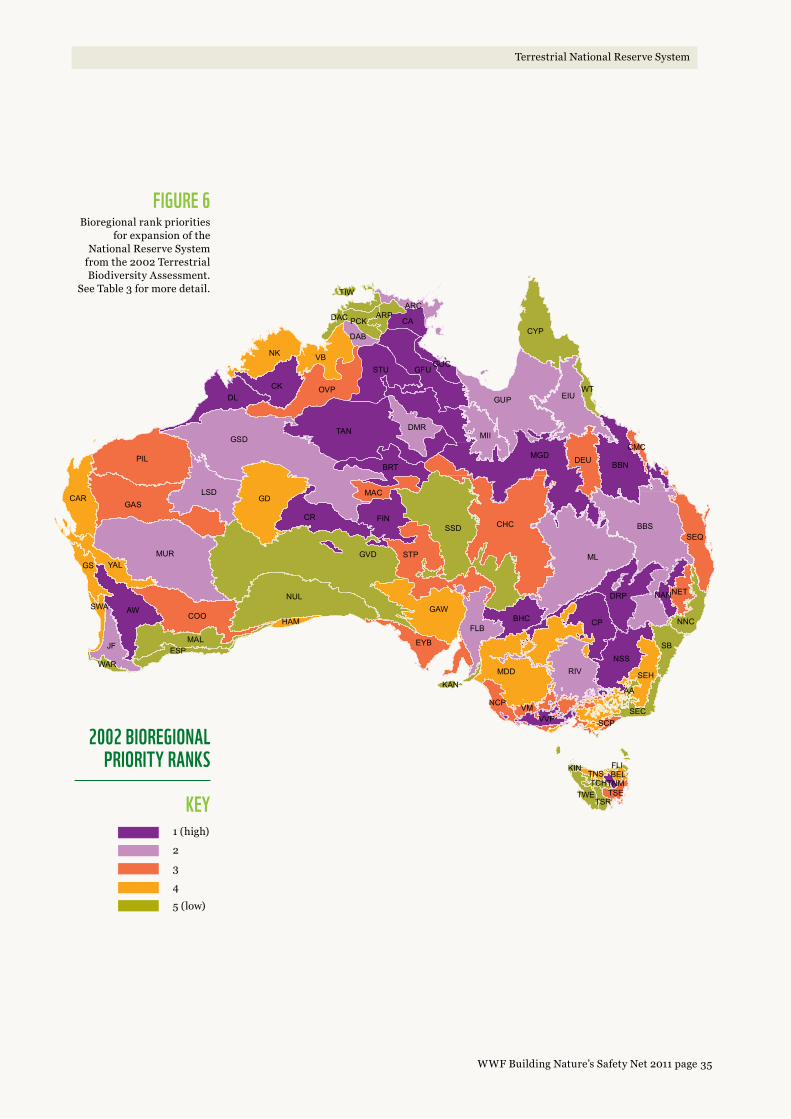
35WWF Building Nature’s Safety Net 2011 page
GVD ML
GSD
CHC
MGD
BBSSSD
TAN
MUR
PIL
NUL
GD
GUP
GAS
STP
EIU
RIV
BBN
AW
CR
DL
MDD
COOCP
LSD
OVP
NK
GAW
CYP
DRP
GFU
CK
VBSTU
MII
NSS
FIN
SEH
JF
FLB
CAR
MAL
BRT
SEQ
DEU
SB
BHC
YAL
EYB
DMR
CA
GS
NNC
MAC
ESP
NET
SECVMNCP
VVP
NAN
PCK
ARCDAC
WT
GUC
ARP
DAB
TWE
SWA
TSE
AA
CMC
HAM
TSR
TCH
SCP
BEL
WAR
TNS
TIW
FLI
KAN
TNM
KIN
2002 bioregional priority ranks1 (High)
2
(L )
Terrestrial National Reserve System
FIGuRE 6Bioregional rank priorities
for expansion of the National Reserve System
from the 2002 Terrestrial Biodiversity Assessment.
See Table 3 for more detail.
2002 BIOREGIONAL PRIORITy RANKS
KEy 1 (high)
2
3
4
5 (low)

36WWF Building Nature’s Safety Net 2011 page
FINANCING STREAMS
Terrestrial National Reserve System
To obtain a comprehensive picture of investments in protected areas, we sent questionnaires (Appendix) to state and
territory agencies, as well as to other non-government and local government partners who might also make investments.
Our sources included Annual Reports from government agencies, and information made available from Australian Senate Estimates hearings.
National Reserve System Program
In 2008, the Australian government committed $180 million to the NRS program budget for 2008–2013, which is a fivefold increase compared with the previous five-year period. In addition, $50 million was committed to Indigenous Protected Areas, and $90 million to employ Indigenous rangers under the Working on Country program, many of whom work on Indigenous Protected Areas (Fig. 7).59
This commitment was a welcome response to the recommendation of the 2008 Building Nature’s Safety Net report, which recommended an increase in funding to at least $250 million over five years, if Australia was to make sufficient progress toward its long-stated goal of long-term recovery and preservation of Australia’s biodiversity. However, as we will detail below, this level of funding is insufficient to fill the gaps found in this analysis.
The NRS program funds a number of streams, including the Protected Areas on Private Land conservation covenanting programs, which are now extended to every state, and fosters liaison with local government protected area programs and with agricultural and natural resource management bodies. The main investment stream, however, is in land purchase grants.
The delivery of this new funding started slowly in 2008, due to the administrative reorganisation attending the new Caring for Our Country program.60
By June 2010, 44 new properties had been purchased, covering nearly 1.3 million hectares — an area larger than metropolitan Sydney (Table 4).
NRS purchase grants have been very cost effective for the Australian government, averaging less than $47 per hectare added during the two years from July 2008 to June 2010 (Table 4).
This applies to only Australian government-funded additions and does not include additions made by states, territories, and private and Indigenous partners without Australian government assistance. The jurisdictions have their own investment streams in acquisition (Table 6) and in management (Table 7), as well as assistance to private land protected areas (Table 8).
Every NRS program dollar invested is estimated to leverage, on average, $4.55 in contributions by state and territory government partners as co-payments for acquisition and capitalised in-perpetuity management (Tables 4–7).

37WWF Building Nature’s Safety Net 2011 page
Based on the information available on ‘per hectare’ investment levels, we estimate the amount of federal NRS program funds needed to fill the 70 million hectare proxy ecosystem gap can be filled in a number of ways. We assume:
— 60 per cent of the gap (42 million hectares) would be filled by purchases with the NRS program paying up to 75 per cent of the purchase price. This would require approximately $2.4 billion over 10 years 61
— the remainder of the gap would be filled by re-assessing existing protected areas in IUCN Categories III–VI to confirm that they are highly protected, and by using private and Indigenous protected area approaches that do not require purchase
— the threatened species gaps would be filled simultaneously by selecting areas for inclusion in protected areas, where ecosystem and species gaps overlap.
A 75 per cent contribution to acquisitions, compared with the current 66 per cent by Australian government, is justified by the four-to-five times greater contribution by partners in terms of acquisition, establishment costs, and in-perpetuity management (Table 4). Grants of more than two-for-one are not unprecedented. The Steve Irwin Wildlife Reserve was purchased with a 100 per cent Australian government grant in 2007. 62
The total cost of the NRS purchase program, including purchase and in-perpetuity capitalized management by the NRS partners, was estimated to average $260 per hectare (adding lines 2–4 in Table 4) where, on average, $47 comes from the Australian government.
The Australian government has a strong interest in expanding the NRS as the most important and most enduring legacy in the landscape. The NRS program should be the principal biodiversity conservation stream in the environment budget.
© m
fIDle
r.
Gouldian Finches (Erythrura gouldiae).
Terrestrial National Reserve System
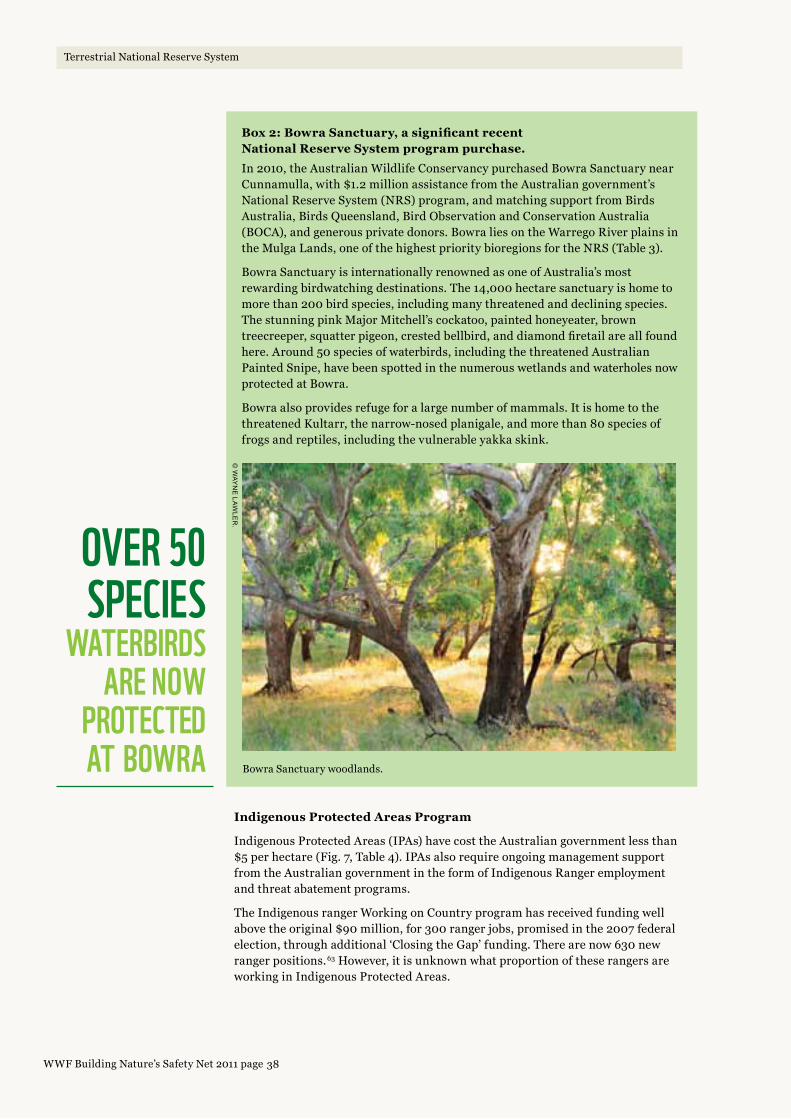
38WWF Building Nature’s Safety Net 2011 page
Box 2: Bowra Sanctuary, a significant recent National Reserve System program purchase.
In 2010, the Australian Wildlife Conservancy purchased Bowra Sanctuary near Cunnamulla, with $1.2 million assistance from the Australian government’s National Reserve System (NRS) program, and matching support from Birds Australia, Birds Queensland, Bird Observation and Conservation Australia (BOCA), and generous private donors. Bowra lies on the Warrego River plains in the Mulga Lands, one of the highest priority bioregions for the NRS (Table 3).
Bowra Sanctuary is internationally renowned as one of Australia’s most rewarding birdwatching destinations. The 14,000 hectare sanctuary is home to more than 200 bird species, including many threatened and declining species. The stunning pink Major Mitchell’s cockatoo, painted honeyeater, brown treecreeper, squatter pigeon, crested bellbird, and diamond firetail are all found here. Around 50 species of waterbirds, including the threatened Australian Painted Snipe, have been spotted in the numerous wetlands and waterholes now protected at Bowra.
Bowra also provides refuge for a large number of mammals. It is home to the threatened Kultarr, the narrow-nosed planigale, and more than 80 species of frogs and reptiles, including the vulnerable yakka skink.
© w
ayn
e la
wle
r.
Indigenous Protected Areas Program
Indigenous Protected Areas (IPAs) have cost the Australian government less than $5 per hectare (Fig. 7, Table 4). IPAs also require ongoing management support from the Australian government in the form of Indigenous Ranger employment and threat abatement programs.
The Indigenous ranger Working on Country program has received funding well above the original $90 million, for 300 ranger jobs, promised in the 2007 federal election, through additional ‘Closing the Gap’ funding. There are now 630 new ranger positions.63 However, it is unknown what proportion of these rangers are working in Indigenous Protected Areas.
OvER 50 SPECIES
WATERBIRDS ARE NOW
PROTECTED AT BOWRA
Terrestrial National Reserve System
Bowra Sanctuary woodlands.
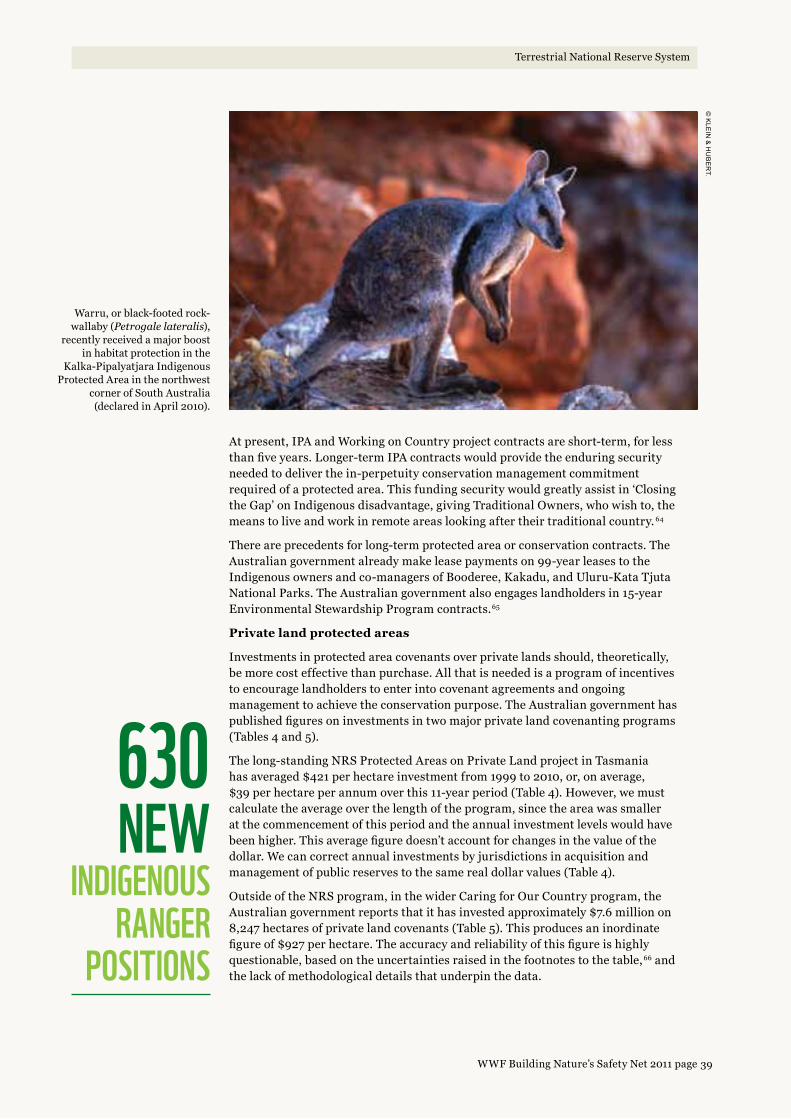
39WWF Building Nature’s Safety Net 2011 page
© K
leIn
& h
UB
er
t.
Warru, or black-footed rock-wallaby (Petrogale lateralis),
recently received a major boost in habitat protection in the
Kalka-Pipalyatjara Indigenous Protected Area in the northwest
corner of South Australia (declared in April 2010).
630 NEW
INDIGENOuS RANGER
POSITIONS
At present, IPA and Working on Country project contracts are short-term, for less than five years. Longer-term IPA contracts would provide the enduring security needed to deliver the in-perpetuity conservation management commitment required of a protected area. This funding security would greatly assist in ‘Closing the Gap’ on Indigenous disadvantage, giving Traditional Owners, who wish to, the means to live and work in remote areas looking after their traditional country. 64
There are precedents for long-term protected area or conservation contracts. The Australian government already make lease payments on 99-year leases to the Indigenous owners and co-managers of Booderee, Kakadu, and Uluru-Kata Tjuta National Parks. The Australian government also engages landholders in 15-year Environmental Stewardship Program contracts.65
Private land protected areas
Investments in protected area covenants over private lands should, theoretically, be more cost effective than purchase. All that is needed is a program of incentives to encourage landholders to enter into covenant agreements and ongoing management to achieve the conservation purpose. The Australian government has published figures on investments in two major private land covenanting programs (Tables 4 and 5).
The long-standing NRS Protected Areas on Private Land project in Tasmania has averaged $421 per hectare investment from 1999 to 2010, or, on average, $39 per hectare per annum over this 11-year period (Table 4). However, we must calculate the average over the length of the program, since the area was smaller at the commencement of this period and the annual investment levels would have been higher. This average figure doesn’t account for changes in the value of the dollar. We can correct annual investments by jurisdictions in acquisition and management of public reserves to the same real dollar values (Table 4).
Outside of the NRS program, in the wider Caring for Our Country program, the Australian government reports that it has invested approximately $7.6 million on 8,247 hectares of private land covenants (Table 5). This produces an inordinate figure of $927 per hectare. The accuracy and reliability of this figure is highly questionable, based on the uncertainties raised in the footnotes to the table,66 and the lack of methodological details that underpin the data.
Terrestrial National Reserve System

40WWF Building Nature’s Safety Net 2011 page
Table 4. Major Australian government investment in terrestrial protected areas, and leveraged investments for the National Reserve System program purchase grants stream.
Program $ invested Area added (ha)
$/ha average
1. Combined NRS program acquisitions or IPA additions (CFOC July 2008–June 2010)
$74,069,025 4,250,025 $17.43
2. NRS program acquisition grants (CFOC July 2008–June 2010)
$60,185,008 1,285,960 $46.80
3. Leveraged contributions by partners: acquisitions (CFOC 2008–2010)
$35,250,500 As above $27.41
4. Leveraged contributions by partners: capitalised management in perpetuity
$238,479,215 As above $185.45
5. Indigenous Protected Area Program (CFOC 2008–2010) $13,884,017 2,964,065 $4.68
6. Covenants: NRS program, PAPL (Tasmania only 1999–2010)
$2,636,723 6,263 $421.00
7. Covenants: non-NRSP CFOC programs (see table 5, exclude NT, 2008–2010)
$7,645,826 8,247 $927.10
1 Data courtesy Parks Australia Annual Reports. Note: covenanting components for NRS protected areas on private land sub program not included since no reliable dollar and hectare figures are available nation-wide.
2 Not including $11.36m in water buyback contribution by the Australian government for the purchase of Toorale Station in 2008. Average spend per ha was $31.44 in 2009–10. Data courtesy Parks Australia Annual Reports and Senate Estimates Hansard 21/10/2008.
3 Only includes co-contributions for successful NRS program grant applications. Also not including additional investments by other partners that do not involve co-funding by Australia government. Partners are primarily state governments, receiving 67% of all CFOC grants issued, with minor contributions of local government (13%), Indigenous (15%) and NGO partners (5%). Data courtesy Parks Australia Annual Reports.
4 $10.96/ha is the total annual management funding of all parks agencies (excluding ACT) divided by the total area managed from July 2007–June 2009 according to annual reports and responses to surveys in Table 7. Quantum shown is the endowment needed to generate this annuity in perpetuity for a nominal interest rate of 5.91% the Reserve Bank average target where Endowment=Annuity/Interest rate. Analysis assumes management costs for other non-government partners are of the same order.
5 Of a total $50m commitment for period 2008–2013.
6 Protected Areas on Private Land in Tasmania. Breakdown into pre- and post-CFOC not provided. Data courtesy Parks Australia Annual Reports.
7 See Table 5. Excludes NT where figures were incomplete.
Terrestrial National Reserve System

41WWF Building Nature’s Safety Net 2011 page
Terrestrial National Reserve System
Table 5. Investments from the Australian government Caring for Our Country program toward private land covenanted protected areas, apart from the NRS program, by jurisdiction.1
State/Territory Amount of non-NRS, non-IPA Caring for our Country funding spent
on covenanting ($)2
Area under covenants using non-NRS, non-IPA
Caring for our Country funds (ha)
Proportion of this area considered part
of NRS (ha)
ACT 0 0 n/a
New South Wales $169,000 50 To be determined
Northern Territory3 $319,335 To be determined To be determined
Queensland 0 0 n/a
South Australia 0 0 n/a
Tasmania $117,000 347 300 (86%)
Victoria4 $5,840,326 6,440 3260 (61%)
Western Australia5 $649,500 750 To be determined
National project6 $870,000 660 To be determined
Total $7,965,161 8,247
1 Source: Answer to Question on Notice 9, Senate Standing Committee on Environment, Communications and the Arts; Legislation Committee, Environment, Water, Heritage and the Arts portfolio, Additional Estimates, February 2010: webpage http://www.aph.gov.au/Senate/committee/eca_ctte/estimates/add_0910/ewha/program_1-1.pdf accessed 7 April 2011.
2 “May compare funding across different years in different jurisdictions”. For source, see footnote 1.
3 “The Northern Territory project design did not establish a target area (ha) for anticipated covenants – sites needing protection will be identified, followed by the area of land to be covered by a covenant.” For source, see footnote 1.
4 “Victorian figures include Caring for our Country funding provided to regional NRM organisations for developing management plans for new acquisitions, and funding approved for regional NRM organisations to provide to the Trust for Nature to seek new covenants on behalf of regional NRM organisations in Victoria.” For source, see footnote 1.
5 “Western Australia figures are for a three year Caring for our Country project; the funding details provided above are only approximate and relate to establishing at least 250ha of new covenants, plus improving management of existing covenants on approximately 500ha of private land. The three year funding breakdown for this component is approximated as follows:
• Yr 1 2009–10: $129,900;
• Yr 2 2010–11: $324,750
• Yr 3 2011–12: $194,850”
For source, see footnote 1.
6 “National project figures are for a Caring for our Country project which operates in NSW, Victoria and Tasmania.” For source, see footnote 1.
42WWF Building Nature’s Safety Net 2011 page
Therefore, we caution against direct comparisons of these figures with other per-hectare figures presented in Table 4.
Based on the figures provided by the Australian government, it may seem that covenants are more expensive than simply buying land for a national park. This may be the case, on average; however, it does not seem so when comparing covenanting by the existing landholder with the option of purchase and in-perpetuity management by a state agency or conservancy of the exact same property.
Although we welcome this early attempt at introducing some financial accountability into the Caring for Our Country covenant programs, important details are lacking with which to better interpret the data. For example, it is not clear whether the figures provided by the Australian government include stewardship payments of up to 15 years. If they did, this could mean that investment in covenants was only $62 per hectare per annum if all of the funds were directed to 15-year stewardship contracts, and if the total figures were reliable and accurate.
Also, other items appear to be included in Table 5 that should not be there. The figure for Victoria includes Caring for our Country funding provided to regional NRM organisations for developing management plans for new acquisitions. Funding related to acquisitions should not be included in reports on covenant expenditure.
In addition to Australian government funding, state, territory, and local governments and non-government agencies, such as the Trust for Nature organisations and regional NRM and catchment management bodies, all have their own investments into private land protected areas under covenants. We attempted to obtain information via questionnaire from all of the bodies known to be involved in private land protected areas, but the response rate was too low to justify reporting the results here. At most, we are able to provide such information as was provided by state and territory agencies in Table 8.
New South Wales government investments in the management of private protected areas were quite high, indeed much higher on a per-hectare basis than the government’s investments in managing its own estate (Tables 7 and 8). Investments by the Queensland government were highly variable — likely resulting from different Nature Refuges being awarded the competitive NatureAssist grants in any given year. Investments by the South Australian government were the lowest of those that responded (Table 8).
There are other government contributions to private land protected areas that are largely hidden and unaccounted for. Some jurisdictions offer tax and land rates rebates for conservation covenants. Some landholders with covenants67 may also qualify for income tax and capital gains tax relief from the Australian government; however, this is not reliably beneficial and may, in some cases, produce a net loss after paying for the valuation.68
This discussion highlights a need for greater financial accountability and transparency around the respective levels of public and private investment into private protected areas, and the need for much closer administrative coordination of acquisition, covenanting, and other conservation programs through integrated bioregional planning. In most agencies, these programs are run independently of one another.
The fundamental principle that should apply in all cases, with all protected area decisions of any type, is whether or not the decision made offers the best biodiversity return on investment relative to other available options.
Terrestrial National Reserve System

43WWF Building Nature’s Safety Net 2011 page
Box 3: Bringing covenants in the Western Australian wheatbelt into the NRS.
The Southwest Australia biodiversity hotspot is a critical place for private protected area investment. The area is highly cleared and fragmented. Recent analysis shows high degrees of irreplaceable habitats in the intensive agricultural zone.69 Threatened remnant vegetation persists as tens of thousands of fragments on mostly cleared wheat-/sheep-producing properties. Wholesale purchase for creation of new reserves is expensive and impractical compared with the alternative of negotiating protected area covenants over high value areas.
A key opportunity is presented by the more than 2000 thirty-year Agreements to Reserve (ATR) created under the State government’s Remnant Vegetation Protection Scheme during the 1990s (see map, below).
Many of these agreements, which also involved provision of stock exclusion fencing, are due to expire within the next 10–12 years. Much of this remnant vegetation is high priority for protection in the National Reserve System (NRS)
Gimlet (Eucalyptus salubris).
© m
IcK
Dav
IS/w
wf-a
US
tra
lIa.
Terrestrial National Reserve System
and only requires a revision of the management plan and negotiation of a new perpetual conservation agreement meeting NRS standards in collaboration with conservation covenant service providers. This process has been tested and shown to be legally feasible.
Since 2000, WWF has been working with a mixture of federal environment funding toward greater inclusion of private land manager participation in the NRS. WWF and Wheatbelt NRM, with NRS program funding, is negotiating new covenants and upgrading ATRs over high priority ecosystems and habitats to bring them into the NRS.
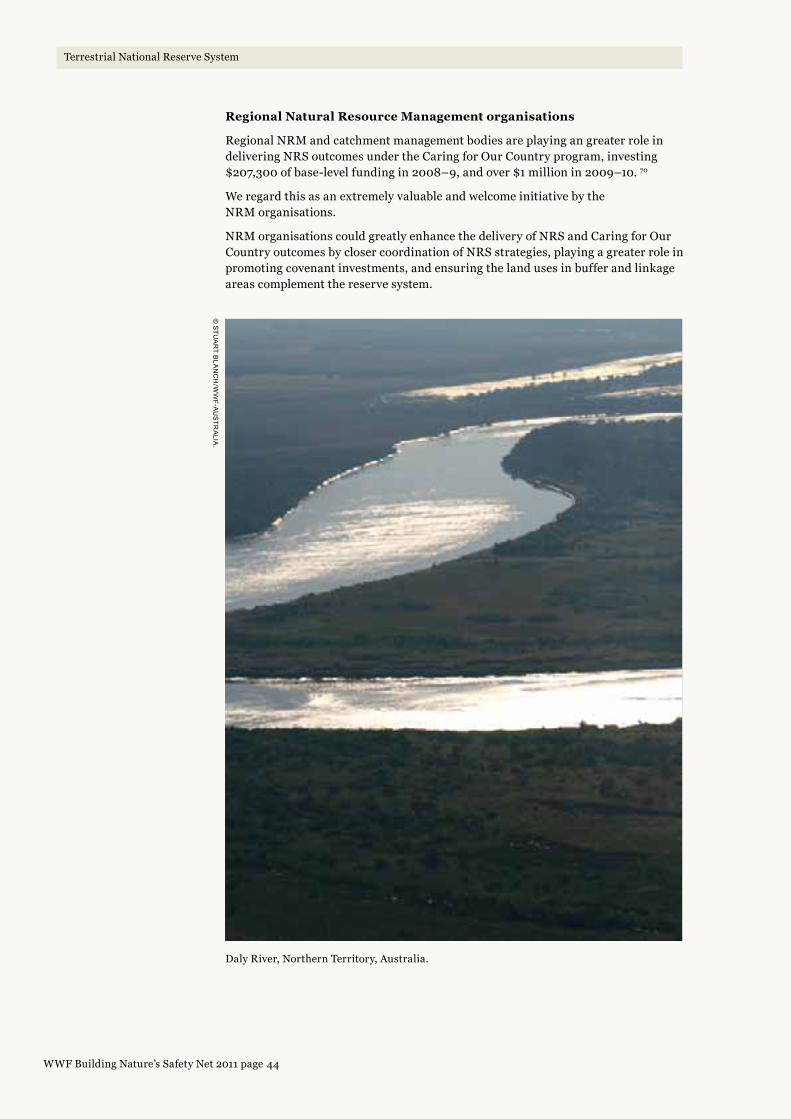
44WWF Building Nature’s Safety Net 2011 page
WWF Building Nature’s Safety Net 2011
44WWF Building Nature’s Safety Net 2011 page
Regional Natural Resource Management organisations
Regional NRM and catchment management bodies are playing an greater role in delivering NRS outcomes under the Caring for Our Country program, investing $207,300 of base-level funding in 2008–9, and over $1 million in 2009–10. 70
We regard this as an extremely valuable and welcome initiative by the NRM organisations.
NRM organisations could greatly enhance the delivery of NRS and Caring for Our Country outcomes by closer coordination of NRS strategies, playing a greater role in promoting covenant investments, and ensuring the land uses in buffer and linkage areas complement the reserve system.
Terrestrial National Reserve System
Daly River, Northern Territory, Australia.
© S
tUa
rt B
lan
ch
/ww
f-aU
Str
alIa
.

45WWF Building Nature’s Safety Net 2011 page
$0
$10
$20
$30
$40
$50
$60
$70
$80
2003/4 2004/5 2005/6 2006/7 2007/8 2008/9 2009/10 2010/11 2011/12 2002/13
National Reserve System Program
Indigenous Protected Area Program
Working on Country(Indigenous Ranger funding)
Act
ua
l or
pro
mis
ed a
nn
ua
l in
vest
men
t ($
mil
lion
)
12 3
1
3
2
Senate Inquiry into National Parks recommends funding increase.
Australian government doubles spending on protected areas and IPAs and commits $47m to new Working on Country Program.
Australian government commits: $180m over five years for NRS program, $50m over five years for the IPA program and $90m over five years for Working on Country.
Terrestrial National Reserve System
FIGuRE 7Annual Australian
government investments up to 2007/8 and subsequent
commitments to three programs significant to the
development of the National Reserve System.
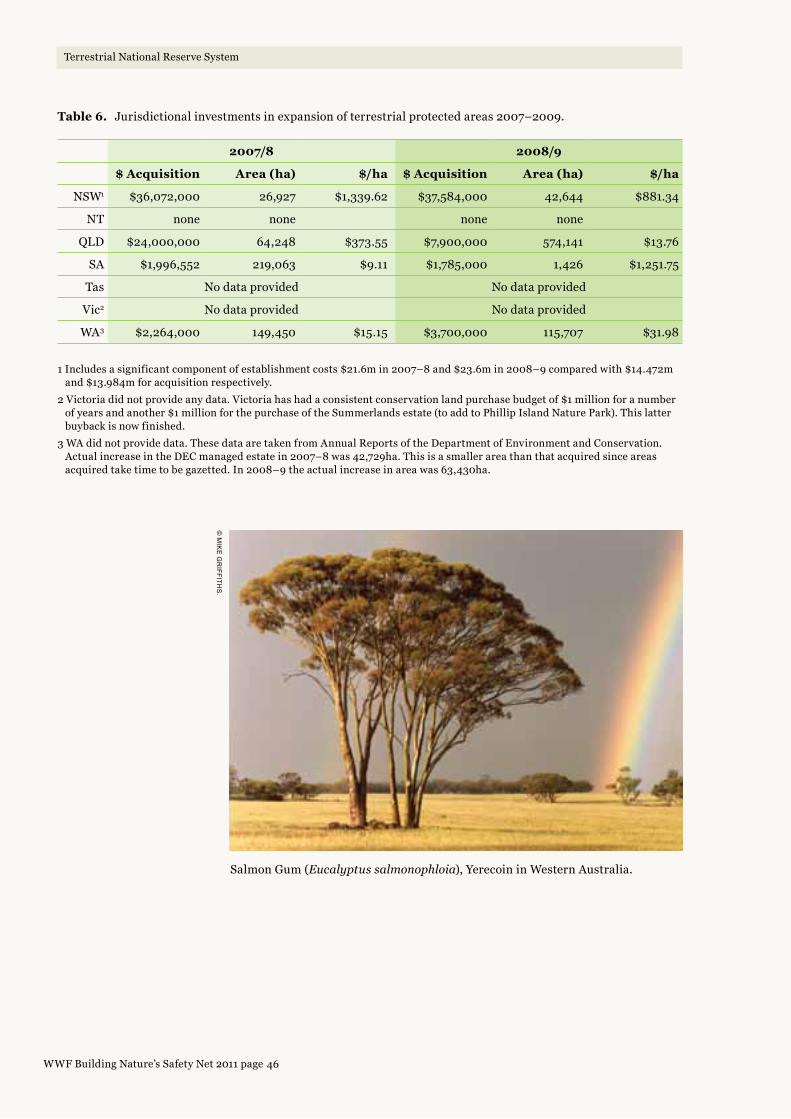
46WWF Building Nature’s Safety Net 2011 page
Terrestrial National Reserve System
Table 6. Jurisdictional investments in expansion of terrestrial protected areas 2007–2009.
2007/8 2008/9
$ Acquisition Area (ha) $/ha $ Acquisition Area (ha) $/ha
NSW1 $36,072,000 26,927 $1,339.62 $37,584,000 42,644 $881.34
NT none none none none
QLD $24,000,000 64,248 $373.55 $7,900,000 574,141 $13.76
SA $1,996,552 219,063 $9.11 $1,785,000 1,426 $1,251.75
Tas No data provided No data provided
Vic2 No data provided No data provided
WA3 $2,264,000 149,450 $15.15 $3,700,000 115,707 $31.98
1 Includes a significant component of establishment costs $21.6m in 2007–8 and $23.6m in 2008–9 compared with $14.472m and $13.984m for acquisition respectively.
2 Victoria did not provide any data. Victoria has had a consistent conservation land purchase budget of $1 million for a number of years and another $1 million for the purchase of the Summerlands estate (to add to Phillip Island Nature Park). This latter buyback is now finished.
3 WA did not provide data. These data are taken from Annual Reports of the Department of Environment and Conservation. Actual increase in the DEC managed estate in 2007–8 was 42,729ha. This is a smaller area than that acquired since areas acquired take time to be gazetted. In 2008–9 the actual increase in area was 63,430ha.
© m
IKe
gr
IffIthS
.
Salmon Gum (Eucalyptus salmonophloia), Yerecoin in Western Australia.

47WWF Building Nature’s Safety Net 2011 page
Terrestrial National Reserve System
Tab
le 7
. Ju
risd
icti
onal
inve
stm
ents
in m
anag
emen
t of p
rote
cted
are
as o
n la
nd 2
00
7–20
09
com
pare
d w
ith
base
line
20
04–
2005
.
200
4–51
200
7–8
200
8–
9
$(2
00
9)
Man
agem
ent2
Are
a (h
a)$/
ha
$(2
00
9)
Man
agem
ent3
Are
a (h
a)$/
ha
$ M
anag
emen
tA
rea
(ha)
$/h
a
Vic
4$1
56,6
06,
700
3,45
5,01
0$4
5.33
$173
,284
,740
3,95
1,0
00
$43.
86$1
86,0
67,0
00
3,96
9,0
00
$46.
88
NSW
$213
,570
,00
05,
900,
441
$36.
20$2
31,0
22,8
606,
722,
00
0$3
4.37
$239
,770
,00
06,
765,
00
0$3
5.44
C’w
lth 5
$66,
630,
450
2,13
1,30
0$3
1.26
$63,
291,
00
02,
130,
774
$29.
70$6
1,18
0,0
00
2,13
0,77
4$2
8.71
Tas 6
$34,
306,
800
1,72
4,35
9$1
9.90
$45,
274,
740
2,50
0,0
00
$18.
11$4
5,0
63,0
00
2,50
0,0
00
$18.
03
QL
D$8
1,36
0,0
00
7,13
3,27
1$1
1.41
$93,
840,
00
08,
580,
00
0$1
0.94
$95,
00
0,0
00
9,29
7,0
00
$10.
22
NT
$32,
781,
300
4,40
5,71
4$7
.44
$28,
038,
780
4,47
2,95
4$6
.27
$28,
282,
00
04,
472,
954
$6.3
2
WA
7$1
18,7
63,0
00
17,0
56,4
89$6
.96
$73,
297,
200
23,4
25,3
65$3
.13
$74,
089
,00
027
,371
,881
$2.7
1
SA 8
$79,
100,
00
013
,754
,159
$5.7
5$5
4,20
1,78
020
,932
,191
$2.5
9$5
1,34
5,0
00
20,9
33,0
88$2
.45
Nat
iona
l av
erag
e$7
16,4
87,8
00
53,4
29,4
42$1
3.41
$698
,960
,10
070
,583
,510
$9.9
0$7
19,6
16,0
00
75,3
08,
923
$9.5
6
1 Sa
ttle
r, P
S a
nd T
aylo
r, M
F J
. 20
08.
Bui
ldin
g N
atur
e’s
Safe
ty N
et 2
008
. Pro
gres
s on
the
Dir
ecti
ons
for
the
Nat
iona
l Res
erve
Sys
tem
. WW
F-A
ustr
alia
Rep
ort,
WW
F-A
ustr
alia
, Syd
ney.
2 U
sing
Res
erve
Ban
k of
fici
al in
flat
ion
rate
s, $
1 in
20
05
was
wor
th $
1.13
in 2
00
9.
3 U
sing
Res
erve
Ban
k of
fici
al in
flat
ion
rate
s, $
1 in
20
08
was
wor
th $
1.02
in 2
00
9.
4 Ju
risd
icti
ons
are
orde
red
from
hig
hest
to lo
wes
t inv
estm
ent l
evel
s pe
r he
ctar
e. T
hose
col
oure
d da
rk g
reen
are
abo
ve, a
nd t
hose
col
oure
d lig
ht g
reen
bel
ow t
he n
atio
nal a
vera
ge.
V
icto
ria
retu
rned
no
resp
onse
to o
ur s
urve
y. F
igur
es t
aken
from
Par
ks V
icto
ria
and
DSE
Ann
ual R
epor
ts in
clud
ing
200
4–5
figu
res
whi
ch d
iffe
r fr
om t
hose
in S
attl
er a
nd T
aylo
r (2
00
8).
Tota
l ope
rati
ons
budg
et s
how
n an
d fi
gure
s sh
own
incl
ude
man
agem
ent o
f pro
duct
ion
fore
sts
not j
ust p
rote
cted
are
as.
5 D
irec
tor
of N
atio
nal P
arks
Ann
ual R
epor
ts.
6 N
o re
spon
se to
sur
vey.
Fig
ures
tak
en fr
om O
utpu
t:2.
01 P
arks
and
Wild
life
Man
agem
ent i
nclu
ding
mar
ine
man
agem
ent f
rom
Dep
artm
ent o
f Env
iron
men
t, P
arks
, Her
itag
e an
d th
e A
rts
Ann
ual R
epor
ts.
7 N
o re
spon
se to
sur
vey.
Fig
ures
tak
en fr
om D
epar
tmen
t of E
nvir
onm
ent a
nd C
onse
rvat
ion
Ann
ual R
epor
ts.
8 SA
did
res
pond
to d
ata
requ
est b
ut f
igur
es p
rovi
ded
wer
e in
com
plet
e. A
ll th
ree
repo
rtin
g ca
tego
ries
of p
ublic
land
ste
war
dshi
p, f
ire
and
visi
tor
man
agem
ent f
rom
Ann
ual R
epor
ts o
f th
e D
epar
tmen
t of E
nvir
onm
ent a
nd H
erit
age
are
show
n co
mbi
ned
here
.

48WWF Building Nature’s Safety Net 2011 page
Table 8. Jurisdictional investments in management of private land protected areas in 2007–2009.
2007–8 2008–9
$ invested 1 Area (ha) 2 $/ha $ invested Area (ha) $/ha
NSW $121,920,000 534,626 $228.05 $102,362,000 541,104 $189.17
NT none none
Qld $234,000 2,480 $94.35 $1,873,000 114,404 $16.37
SA $734,000 102,887 $7.13 $571,340 100,728 $5.67
Tas No data provided No data provided
Vic No data provided No data provided
WA No data provided No data provided
1 “Questionnaire 1.1(C) Total assistance ($1000s) provided by the government for management of, or threat abatement on non-government protected areas including private land covenants” Uncorrected figures are shown, not corrected to 2009 dollars.For source, see Appendix.
2 “Questionnaire 1.1(D) Total area (ha) of non-government protected areas where these management investments were applied (NB. This is the total area of all non-government protected areas in which government incentives or grants were invested, not the combined footprint of the management projects themselves)” For source, see Appendix.
WhOLE OF LANDSCAPE CONSERvATION
$10 MILLION TOWARDS
ThE WILDLIFE CORRIDORS
PLAN
Terrestrial National Reserve System
At present, conservation investment allocations are made by many organisations, agencies, departments and sections. While these diverse groups are broadly working towards the principles of developing a comprehensive,
adequate and representative reserve system, within the context of a functioning landscape, differing sets of internal criteria influence the selection of new additions to the NRS. Increased coordination of all of these stakeholders is essential to optimise investments and lead to more efficient and coordinated conservation outcomes. Optimal allocation of alternative conservation options, based on biodiversity benefit for cost, for whole landscapes, is feasible provided data are adequate. 73
A major issue for future reserve design is climate change. Protected area designs that include likely future distributions of species under climate change have been performed elsewhere, but have yet to happen in Australia on a national scale.74 We see this as a high priority.
The current approach of defining national, state, or regional systems of wildlife corridors should be based on rigorous analysis of this kind.
National Wildlife Corridors Plan
The Australian government recently committed $10 million towards development of a national Wildlife Corridors plan.75 A national plan across all 56 natural resource management regions will be developed to identify corridors linking national parks and reserves. This would allow migration of native animal and plant species in response to climate change, while also retaining or enhancing natural carbon stores in native ecosystems.

49WWF Building Nature’s Safety Net 2011 page
Terrestrial National Reserve System
We welcome the Wildlife Corridors commitment although we caution against over-emphasis on connectivity as the most critical, adaptive response to climate change. In some cases, connectivity may not be achievable even by fully intact natural ecosystems. For example, mountaintop endemics may be little-served by linkages to other mountaintops if the linkages pass through inhospitable lowland areas. Measures such as identifying and protecting refugia may be more critical for building ecological resilience.76
The proposal has potential to define priority areas for delivering incentives — such as by regional Natural Resource Management project grants, stewardship payments, or incentives for retention/recovery of natural ecosystems via the Carbon Farming Initiative (Box 4) — to landholders who retain natural vegetation.
These initiatives complement, by buffering and linking, the NRS; however, they do not address the need for strategic growth of the NRS as the top national conservation priority.
Moreover, it is crucial for all the initiatives to be developed using sound information about actual species’ needs in a changing climate.
Box 4: Carbon Farming Initiative.
In 2010, the Australian government proposed a Carbon Farming Initiative, to develop a standard for voluntary biocarbon offsets in the rural landscape, covering a wide range of activities including reforestation and fire, soil, and livestock management.71
This new initiative should give prominence to retention and recovery of native vegetation to restore landscape connectivity, provided that it does not delay the much-needed transition to a renewable energy economy and does meet rigorous carbon accounting rules.
In some parts of Australia, particularly in Queensland, substantial natural regrowth potential exists for many vegetation types, offering a cost-effective alternative to plantings. The Queensland government’s Carbon Accumulation Through Ecosystem Recovery (CATER) project will inform landholders and offset purchasers of the stocks carbon present in native vegetation. Such a project has the advantage of greatly reducing verification costs of offsets and allowing biodiversity conservation co-benefits to be assessed. 72
We estimate that 2 per cent of the 70 million hectare gap for proxy ecosystem protection described below would require revegetation or recovery of previously cleared ecosystems (Fig. 3).
Protection of intact systems is the highest priority and likely to have the lowest cost. Carbon farming payments could provide a means to offset the higher cost of recovery of such ecosystems provided other key criteria can be satisfied.
More typically, however, carbon farming projects could complement core National Reserve System areas, by protecting valuable buffer and linkage habitats of lower value.
CARBON FARMING ShOuLD GIvE PROMINENCE
TO RECOvERy OF NATIvE
vEGETATION

50WWF Building Nature’s Safety Net 2011 page
NATIONAL STANDARDS FOR uSE OF IuCN CATEGORIES
hIGhLy PROTECTED
AREAS CONTRIBuTE
SIGNIFICANTLy TO ThE RECOvERy
OF ThREATENED SPECIES
Terrestrial National Reserve System
The critical importance of the NRS as the backbone of the national effort to recover threatened species and communities is demonstrated by recent analysis showing high correlation between overlap with highly
protected areas and stabilisation of trends of threatened species. 77
Three major policy gaps undermine confidence in the extent to which protected areas are genuinely protected. They are:
— lack of transparency and consistency in applying IUCN management categories
— lack of a process to confirm that protected areas open to extractive uses and nominated as protected areas meet IUCN protected area definitions and guidelines
— lack of adoption by governments of nationally consistent standards and processes for auditing management effectiveness.
Nominally protected areas on land and sea may, at present, be broadly open to extractive uses. Often on a commercial scale, these include mining, oil and gas developments, fishing, logging, and livestock production. Even private protected areas purchased with Australian government assistance are at risk of mining (Box 1).
A protected area, under the IUCN guidelines, must be dedicated specifically to conservation. This means conservation must be recognised as the primary land or sea use, as “many protected areas will have other values of equal importance, at least to some stakeholders (e.g. spiritual values), but that in the event of conflicting interpretations, nature conservation must take precedence.” 78
Under IUCN Category guidelines any extractive uses permitted in a category VI protected area must:
— actually further or advance the primary conservation purpose
— leave the area in a largely natural condition (with the exact proportion to be decided by national governments)
— be low-level and non-industrial. 79
In the absence of a resolution of these major policy gaps, we have taken a cautious approach and only refer to areas as highly protected as those that were likely to be entirely free of extractive natural resource uses.
We stress, however, that this does not mean we rule out other IUCN Categories as, by their nature, insufficiently protected to count toward minimum standards.
An objective, transparent process for assigning IUCN Categories is needed. This would confirm compatibility of extractive uses and enable auditing of management effectiveness.
Such a process should be developed and implemented as a high priority. If this process existed, many of the protected areas in IUCN Category III–VI might legitimately be regarded as highly protected, significantly reducing the gaps estimated in the foregoing analyses.

51WWF Building Nature’s Safety Net 2011 page
Terrestrial National Reserve System
MANAGEMENT EFFECTIvENESS
Do protected areas work?
Recently, there has been much criticism of protected areas as the chief tool for arresting biodiversity loss. Protected area gap analyses are often negatively presented as protected areas being “in the wrong places”. 80
Increasing investment emphasis has been placed on ‘tenure-blind’ conservation, natural resource management, or stewardship contracts that do not change the primary land use from extractive use to conservation (only the way existing extractive land-uses are conducted). Although there was a recent boost in funding, the Australian government currently devotes only approximately 10 per cent of its total conservation budget to expansion of protected areas.
These criticisms have been aired in a vacuum of empirical evidence about which conservation approaches are most effective in arresting biodiversity loss.
In a recent analysis for 841 nationally threatened terrestrial species in Australia, it was found that species with greater distributional overlap of highly protected areas had proportionately more populations that were increasing or stabilizing. This correlation was robust to geographic range size, data quality differences, and total area of protection. Measures other than highly protected areas, such as IUCN Categories V and VI protected areas and numbers of recovery actions and natural resource conservation actions, showed no significant positive associations with stabilizing or increasing trends in this study.81 A similar result was found for birds in South African protected areas. 82
Empirical evidence suggests that highly protected areas contribute significantly to the stabilization or recovery of threatened species, but it provides little support for other conservation approaches at a national scale. Other conservation approaches may, in time — or in local case studies — be shown to have significant benefits if data are collected appropriately.
Investments in management
Very significant differences exist among jurisdictions regarding the level of investment in management on a per-unit-area basis. Whether the differing levels of investment translate into differences in management effectiveness remains unclear (Table 7).

52WWF Building Nature’s Safety Net 2011 page
State and territory parks agencies, on average, spend 4.5 times more on acquisitions, management, and operations per hectare than the Commonwealth invests in expansion of the reserve system (see capitalized management budgets in Table 1). However, state and territory park management budgets have generally declined in real dollars spent per hectare (Table 7). In Western Australia and South Australia spending per hectare has declined sharply since 2004–5, with the total budgets significantly lowering in real terms and the area to be managed significantly increasing (Table 7).
In general, we expect such downturns in spending per hectare to have negative impacts on management effectiveness.
Nevertheless, dollars per hectare must be treated with caution as an indicator of effectiveness. Financial needs for management can be highly variable depending on the values, threats, size, and location of particular protected areas. In particular, visitor pressure is a major cost driver. Improved efficiency of operations from consolidating protected area boundaries and improving management of buffer and linkage areas should, in theory, reduce per hectare management costs. Subsequently, a decrease in dollars per hectare could indicate more effective management results depending on what underpins the decline.
© JU
lIan
mU
rP
hy/w
wf-a
US
tra
lIa
Fire – a natural part of the Australian landscape, but one that will need more intensive management under climate change.
Terrestrial National Reserve System

53WWF Building Nature’s Safety Net 2011 page
Standard of management
A recent global analysis of management effectiveness included results from State of the Parks reports from Victoria and New South Wales. The analysis found that better nature conservation outcomes were significantly associated with better law enforcement, better research and monitoring, political/civil society support, achievement of work plans, and higher manager skill levels. These are the elements to which greater attention is required to ensure protected areas achieve their conservation purpose. 83
In the questionnaire (Appendix), jurisdictions were asked to self-assess the standard of protected areas management in both marine and terrestrial bioregions. Only Queensland and New South Wales governments responded, and both suggested they had made a significant improvement in standard of management relative to the 2002 Biodiversity Assessment. The Queensland government’s reported improvement differs so dramatically from that reported earlier, that there is some doubt that the same assessment basis was used.
In summary, the data are unreliable, incomplete, and inconsistent. No clear picture of improvement in management standards could be formed. The responses to questionnaires were poor. There is an urgent need for a standardised management effectiveness reporting framework for all protected areas, with an emphasis on conservation outcomes measures.
ThE NRS PROGRAM
AuSTRALIAN GOvERNMENT’S CONSERvATION
SuCCESS STORy
Terrestrial National Reserve System
CONCLuSION AND RECOMMENDATIONS
Recent commitments of additional funding to the NRS and Indigenous Protected Area programs have been very welcome and extremely cost effective.
The decision to invest more in highly protected areas was validated by the joint WWF and University of
Queensland analysis showing that, of alternate conservation options, only highly protected areas have delivered on threatened species recovery.
The NRS is arguably the Australian government’s biggest conservation success story and the easiest for the public to understand and appreciate.
Nonetheless, the large scale of the identified gap (70 million hectares) clearly shows that the levels of investment are still much too low — by about seven times. At least $2.4 billion needs to be invested, by the Australian government, over this decade to arrive at minimum standards for ecosystem protection, and meet Australia’s obligations under the Convention on Biological Diversity.
The gap could be reduced considerably by adopting a more rigorous national process for assigning IUCN Categories, for confirming compatibility of uses and auditing management effectiveness. Many protected areas not yet regarded as highly protected on the basis of their IUCN management may be identified as such by following such a process.
Other key contributions could come through longer-term contracts for Indigenous Protected Areas and from a more rigorous and nationally coordinated approach to investments in protected areas on private land — with the potential for significantly enhanced delivery through regional natural resource management and catchment management bodies.

RECOMMENDATIONSRecommendation 1: The Australian government should increase the National Reserve System purchase grants program commitment to $240 million per annum for the decade 2011–2020, allowing grants for up to 75 per cent of total cost of acquisition of new highly protected areas.
Recommendation 2: The Australian government should further boost the level of funding for the Indigenous Protected Areas program and offer longer-term contracts for protected area management.
Recommendation 3: Australian governments should establish a nationally consistent and transparent process and set of standards for IUCN categorization, management effectiveness auditing, and compatibility of uses assessments for all protected areas.
Photo: Daly river wetlands, northern territory.

© JU
lIan
mU
rP
hy
/ww
f-aU
Str
alIa
.

Snubfin dolphins (Orcaella heinsohni).
© D
eB
thIe
le / w
wf-a
US
tra
lIa.
NATIONAL REPRESENTATIvE
SySTEM OF MARINE PROTECTED AREAS
INTRODuCTION
Australia has an enormous marine jurisdiction of 963 million hectares, larger than its land area. Australia’s marine environment is highly diverse and biologically rich, spanning from tropical to Antarctic waters, with globally recognised places of
high biodiversity value, such as Ningaloo Reef on the west coast and the Great Barrier Reef on the east coast.The UNEP Blue Carbon report revealed a massive and previously unexpected potential for salt marshes and coastal environments to become carbon sinks, which strengthens the argument for protecting coastlines for both biodiversity and ecological services. 84
There is evidence for multiple benefits of ‘no-fishing’ or ‘no-take’ marine reserves and sanctuaries for marine ecosystem resilience as well as the health of exploited stocks of fish. A recent review of literature for the Great Barrier Reef found “major, rapid benefits of ‘no-fishing’ or ‘no-take’ areas for targeted fish and sharks, in both reef and non-reef habitats, with potential benefits for fisheries as well as biodiversity conservation.” 85
The Australian government has agreed to the CBD Strategy 2011–2020, in which the target is to reserve at least 10 per cent of coastal and marine areas (96.3 million hectares) within ecologically representative protected areas by 2020. However, we find two major issues with this target.
Firstly, recent scientific consensus suggests that at least 30 per cent of each marine ecosystem should be highly protected in ‘no-fishing’ or ‘no-take’ sanctuaries. 86, 87, 89
Secondly, Australian governments interpret marine protected areas to include areas open to commercial or recreational fishing. In the absence of a clear and rigorous process for assignment of IUCN Categories, assessments of the compatibility of uses and management effectiveness, we regard only IUCN Categories I and II as highly protected (see Recommendation 3).
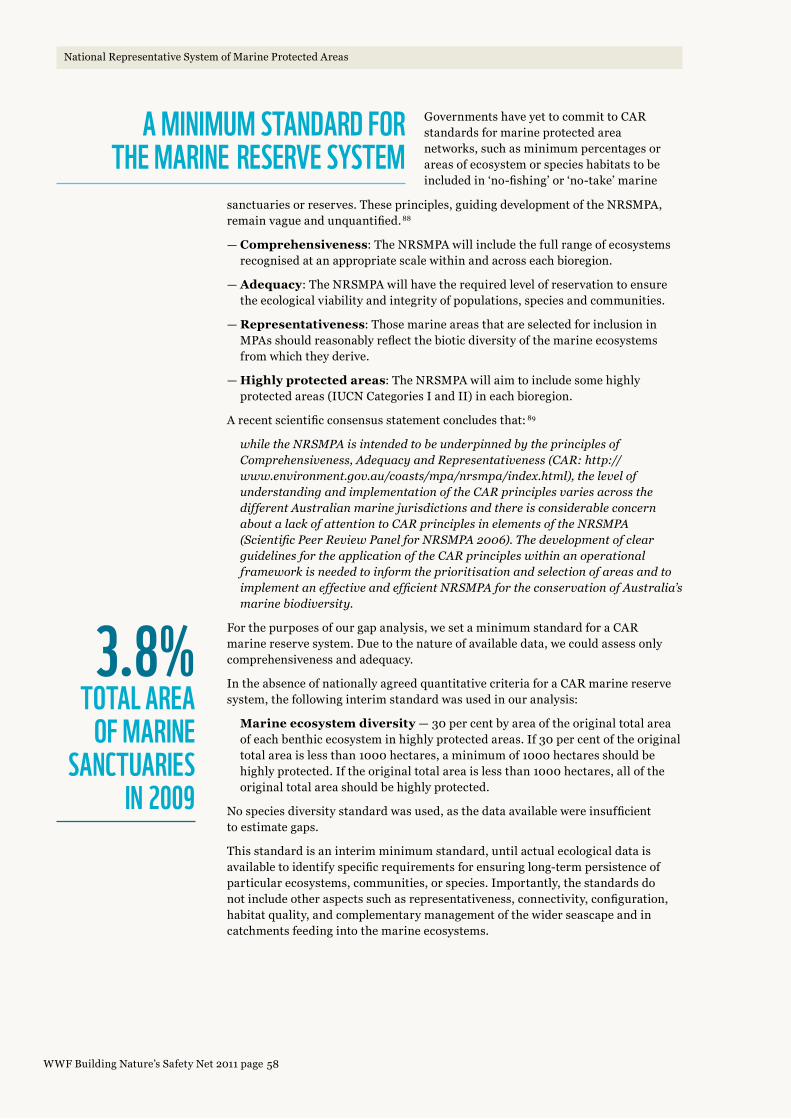
58WWF Building Nature’s Safety Net 2011 page
National Representative System of Marine Protected Areas
A MINIMuM STANDARD FOR ThE MARINE RESERvE SySTEM
3.8%TOTAL AREA
OF MARINE SANCTuARIES
IN 2009
Governments have yet to commit to CAR standards for marine protected area networks, such as minimum percentages or areas of ecosystem or species habitats to be included in ‘no-fishing’ or ‘no-take’ marine
sanctuaries or reserves. These principles, guiding development of the NRSMPA, remain vague and unquantified. 88
— Comprehensiveness: The NRSMPA will include the full range of ecosystems recognised at an appropriate scale within and across each bioregion.
— Adequacy: The NRSMPA will have the required level of reservation to ensure the ecological viability and integrity of populations, species and communities.
— Representativeness: Those marine areas that are selected for inclusion in MPAs should reasonably reflect the biotic diversity of the marine ecosystems from which they derive.
— Highly protected areas: The NRSMPA will aim to include some highly protected areas (IUCN Categories I and II) in each bioregion.
A recent scientific consensus statement concludes that: 89
while the NRSMPA is intended to be underpinned by the principles of Comprehensiveness, Adequacy and Representativeness (CAR: http://www.environment.gov.au/coasts/mpa/nrsmpa/index.html), the level of understanding and implementation of the CAR principles varies across the different Australian marine jurisdictions and there is considerable concern about a lack of attention to CAR principles in elements of the NRSMPA (Scientific Peer Review Panel for NRSMPA 2006). The development of clear guidelines for the application of the CAR principles within an operational framework is needed to inform the prioritisation and selection of areas and to implement an effective and efficient NRSMPA for the conservation of Australia’s marine biodiversity.
For the purposes of our gap analysis, we set a minimum standard for a CAR marine reserve system. Due to the nature of available data, we could assess only comprehensiveness and adequacy.
In the absence of nationally agreed quantitative criteria for a CAR marine reserve system, the following interim standard was used in our analysis:
Marine ecosystem diversity — 30 per cent by area of the original total area of each benthic ecosystem in highly protected areas. If 30 per cent of the original total area is less than 1000 hectares, a minimum of 1000 hectares should be highly protected. If the original total area is less than 1000 hectares, all of the original total area should be highly protected.
No species diversity standard was used, as the data available were insufficient to estimate gaps.
This standard is an interim minimum standard, until actual ecological data is available to identify specific requirements for ensuring long-term persistence of particular ecosystems, communities, or species. Importantly, the standards do not include other aspects such as representativeness, connectivity, configuration, habitat quality, and complementary management of the wider seascape and in catchments feeding into the marine ecosystems.

59WWF Building Nature’s Safety Net 2011 page
National Representative System of Marine Protected Areas
TOTAL AREAS PROTECTED
Table 9. Combined areas of marine parks and sanctuaries in 2009, by jurisdiction, ordered from lowest to highest.
Jurisdiction Area (million ha)
All marine parks
(million ha)
All marine parks (%) 1
Sanctuaries (IUCN I–II)
Other Marine Park zones
GBRMPA 2 34.7 34.7 100.0% 33.2% 66.8%
NSW 0.9 0.3 38.5% 7.3% 31.2%
TAS 2.2 0.1 5.9% 4.9% 1.1%
VIC 1.0 0.2 16.0% 4.3% 11.7%
Commonwealth 3 895.6 49.8 5.6% 2.7% 2.9%
QLD 4.2 0.9 22.6% 2.4% 20.2%
WA 11.6 1.5 13.3% 2.4% 10.9%
SA 6.0 2.7 45.2% 1.3% 43.9%
NT 7.2 0.3 3.7% 0.1% 3.5%
All jurisdictions 963.4 90.5 9.4% 3.8% 5.6%
1 For most jurisdictions ‘marine parks’ is taken to mean a large section of jurisdictional waters subject to a zoning process for regulation of uses. However, the use of the term is inconsistent. For example, in some jurisdictions, such as Victoria, marine parks are synonymous with marine national parks or sanctuaries. Dark blue cells depict jurisdictions above, and light blue cells those below, the national average of total area for sanctuaries.
2 Great Barrier Reef Marine Park Authority.
3 Calculation of these figures is the sum of all marine areas — including coastal waters, territorial sea, and EEZ — less the state and GBRMP waters. Geoscience Australia. 2006. Australian Marine Boundaries 6th Edition. Commonwealth of Australia.
WWF has compiled a spatial database for marine protected areas from 2009 onwards, using Australian government and jurisdictional spatial data. For some
marine parks, no spatial data was provided by jurisdictions and published maps were digitized. IUCN management categories were as assigned by the Australian government, state agencies, or the Great Barrier Reef Marine Park Authority. This map is shown together with the CAPAD 2008 data for terrestrial protected areas90 in Figure 1.
The overall total area of marine sanctuaries (IUCN Category I or II) was 3.8 per cent in 2009, less than half of that on land (8.5 per cent in 2008) (Table 9).
The Great Barrier Reef had the highest total area of marine sanctuaries (Table 9). Total areas for marine sanctuaries in New South Wales, Tasmania and Victoria were all above the national average.
Although Queensland, Western Australia, and South Australia ranked well above the national average for marine park areas in 2009, they ranked well below for highly protected marine sanctuaries (Table 9). Both Western Australia and South Australia are only part-way through a marine parks planning process, so these rankings can be expected to change.
The relatively extensive nature of marine parks, compared with sanctuaries, underlines our earlier point on the importance of validating the application of IUCN Categories and the quality of protection afforded by IUCN Category III–VI (Recommendation 3).

60WWF Building Nature’s Safety Net 2011 page
BENThIC ECOSySTEMS GAP ANALySIS
© m
ar
K S
Pe
nc
er
/ww
f-aU
Str
alIa
.
White patch nautilus (Nautilus stenomphalus).
National Representative System of Marine Protected Areas
In this report, we use a benthic ecosystems spatial data layer previously developed by WWF based on physical and oceanographic characteristics as a proxy ecosystems dataset for measurement of gaps in assessing
attainment of the 30 per cent standard. This layer maps 5268 benthic ecosystems covering the entire Australian Exclusive Economic Zone, with individual ecosystems ranging from 12 to 20 million hectares in size. 90
We quantified gaps as shortfalls from the 30 per cent standard outlined above, and did not consider other important features of adequacy, such as context and connectivity.
We estimate that a total gap area of 253 million hectares of ocean needs to be protected in marine sanctuaries to attain the 30 per cent minimum standard for each marine benthic ecosystem (Figures 8 and 9). To put it in context, this gap area is roughly equivalent to the land area of Western Australia.
Marine ecosystem gaps were highly and unevenly distributed, with four major regions having no ecosystems included at all in highly protected areas (Fig. 9).

61WWF Building Nature’s Safety Net 2011 page
ThREATENED SPECIES GAPS
Snubfin dolphin (Orcaella heinsohni).
© g
UID
o Pa
rr
a /w
wf-a
US
tra
lIa.
OvER 50% OF ThE WORLD’S
WhALES, DOLPhINS AND PORPOISES ARE
FOuND hERE
National Representative System of Marine Protected Areas
We were unable to acquire sufficient data on marine threatened species to effectively analyse the gaps. WWF has produced indicative maps of critical habitats
for 19 selected species of the largest marine mammals, turtles, and sharks,91 but these data only accounted for points of initial species location, and were too imprecise to enable a comprehensive gap analysis.
The Australian, state, and territory governments have, on several occasions, committed to creation of a national network of whale and dolphin sanctuaries. The present Australian government committed to finalising the network in this term of government. 92 More than half of the world’s 86 known species of whales, dolphins, and porpoises are found in Australian waters. Healthy whale and dolphin populations are vital for functioning of marine food chains and provide a significant tourism resource. Although whaling is no longer a threat to whales and dolphins in Australian waters, there are numerous ongoing threats. These include those from bycatch and entanglement in fishing gear, coastal development, offshore petroleum development and seismic exploration, shipping traffic, marine debris, and climate-change-induced shifts in abundances and distributions of prey.
Many of these threats could be significantly abated by declaration of marine sanctuaries over critical habitats for whales and dolphins under the proposed national network. This would also protect many other species and ecosystems with which whales and dolphins associate.

62WWF Building Nature’s Safety Net 2011 page
FIGuRE 9Percentages by area of attainment
of the minimum standard of 30 per cent of benthic ecosystems in
marine sanctuaries (IUCN Category I–II), other zones of marine parks
(nominally IUCN Category III–VI), and completely unprotected (i.e. gap) as of 2009. These statistics are divided into marine regions
shown in Fig. 8. Right hand graph shows total areas (ha) of gaps for
marine sanctuaries. 30%
0% 10% 20% 30% 40% 50% 60% 70% 80% 90% 100%
5.7
8.5
30.2
34.7
252.9
8.8
40.5
46.0
5.8
11.5
26.7
34.3
0 50 100 150 200 250 300
North-east inner
Heard & McDonald Islands
North-east outer
South-west outer
National total
North-west inner
East central
North-west outer
South-east inner
South-west inner
South-west outer
North
Proportion of target area Gap (million ha)
38% 30%
32%
18% 6%
19%
5%
12%
7%
2%
9%
3%
KEy
In sanctuaries (%)
In other zones of marine parks (%)
Outside marine parks (%)
National Representative System of Marine Protected Areas
FIGuRE 8 Map of major marine regions used in the analysis in Fig. 9. Note: These are not the same
as the Australian government marine planning units.
Heard and McDonald Islands not shown.94
NORTh-EAST OuTERNORThERNNORTh-WEST INNER
EAST CENTRAL
SOuTh-EAST OuTERSOuTh-EAST INNER
SOuTh-WEST INNER
SOuTh-WEST OuTER
NORTh-WEST OuTER
NORTh-EAST INNER

63WWF Building Nature’s Safety Net 2011 page
POLICy ChANGES NEEDED
National Representative System of Marine Protected Areas
The low levels of benthic ecosystem representation in marine sanctuaries results, in part, from the incomplete nature of marine bioregional planning processes to establish new marine parks and marine sanctuaries.
Clearly, this process needs to be advanced as a matter of urgency.
The south-west, north-west, north and east bioregional marine planning processes are currently underway and are expected to be completed in 2011–2012.
In 2009–2010, the Australian government announced a Coral Sea Conservation Zone as an extension of the marine bioregional planning process. The government also released a list of Areas for Further Assessment in the East Region and a draft marine reserve design for the South-west Marine Region. 94 In 2010, the Australian government also recommitted to developing a national network of whale and dolphin sanctuaries. 95
Although terrestrial reserve system planning has pursued comprehensiveness, adequacy and representativeness (CAR) criteria over a much longer period, the opportunity for major rapid increases in marine sanctuaries is greater. This is because the seas remain entirely under government ownership and management, with only overlapping Native Title interests and mining or petroleum exploration permits in some areas. Accordingly, it is feasible to significantly increase marine protection through rezoning as was achieved, in 2004, with the rezoning of the Great Barrier Reef Marine Park from 5 per cent to 33 per cent in marine sanctuaries.96
State governments also need to progress in their commitments to establish adequate and representative systems of marine sanctuaries.
We caution, however, that simply creating large multi-use marine parks without high protection zones will not fulfil the criteria of a CAR marine protected area network. As mentioned above many multi-use marine parks may be broadly open to extractive uses, principally recreational and commercial fishing, outside of sanctuary zones. For this reason, and unlike the terrestrial analysis, we only count IUCN Categories I and II sanctuaries toward the minimum standard for marine ecosystems. We also indicate the high potential for rezoning of marine parks to fill current gaps for ecosystem protection (moving from light green to dark green in Fig. 9).
FINANCING NEEDED At the 2010 election the Australian government also committed to:
“provide an appropriate program budget to support the marine bioregional planning program nationally, including:
— Assistance for displaced activities — a Federal policy to provide fair and reasonable assistance to those industries affected by greater marine protection will be released within the first three months of the next term of government.
— Funding for management, enforcement and education — the necessary resources for the effective management of marine protected areas and shore based community programs.” 97
There was no announcement, at the time of writing this report, as to what funding would be considered appropriate, or to what total area fishing operations affected by closures should be offered assistance to alleviate genuine hardship (or ‘displaced effort’).

64WWF Building Nature’s Safety Net 2011 page
Although there have been past rounds of fisheries adjustment packages such as Securing our Fishing Future, 98 fishing operations are excluded from the exit grants and exceptional circumstances funding available to primary producers on land. These programs should be opened to fishing operations.
Jurisdictional investments in expansion and management of marine protected areas have been at a generally lower, more uneven level than those on land (compare Tables 6, 7, and 10).
Table 10. Jurisdictional investments in management, or threat abatement, on marine protected areas 2007–2009.
2007–8 2008–9
Investment (2009$) 1
Area(ha) $/ha Investment (2009$)
Area(ha) $/ha
Commonwealth $4,600,200 49,844,075 $0.09 $4,550,000 49,844,075 $0.09
NSW $5,406,000 347,000 $15.27 $5,900,000 347,000 $17.00
NT $233,580 223,661 $1.02 $243,000 223,661 $1.09
Qld $25,500,000 7,206,486 $3.47 $27,000,000 7,206,486 $3.75
SA $84,660 168,319 $0.49 $83,000 168,319 $0.49
Tas No data provided No data provided
Vic No data provided No data provided
WA No data provided No data provided
1 Using Reserve Bank official inflation rates, $1 in 2008 was worth $1.02 in 2009.
Management spending is low for Commonwealth marine reserves at only $0.09 per hectare. It is greatest in New South Wales marine parks, where it is comparable to some terrestrial protected area management budgets (compare Tables 7 and 10). Management spending rose slightly in real terms in New South Wales, Queensland, and the Northern Territory from 2008 to 2009, in contrast to a pervasive pattern of decline in real dollar spending per hectare for terrestrial reserves (compare Tables 7 and 10).
In addition to ongoing management investments, the jurisdictions also have significant investment in planning processes and funding provisions for marine parks establishment.
Queensland spent $13 million in 2008–9 to expand, from 0.5 to 16 per cent, the highly protected zones of the Moreton Bay Marine Park by 52,000 hectares.
South Australia spent $6.95 million over the period 2007–2009 to develop a system of 2.6 million hectares of state marine parks. However, the proportion of sanctuary or highly protected areas has not yet been decided. 99
As part of the Kimberley Wilderness Parks initiative, the Western Australian government announced an initial investment of $12.7 million for terrestrial and marine initiatives. Four new marine parks were announced — Camden Sound, North Kimberley, Roebuck Bay, and Eighty Mile Beach — of which only draft zoning for Camden Sound had been released in early 2011.
National Representative System of Marine Protected Areas

65WWF Building Nature’s Safety Net 2011 page
Standard of management
Little information on marine protected area effectiveness or standard of management is available.
Apart from the Great Barrier Reef Marine Park, not all Commonwealth marine reserves have management plans. They do, however, have detailed, frequent assessment and reporting on management issues through the annual Director of National Parks reports.
A recent audit of the management of marine protected area estate in Victoria found a lack of accountability for management and effectiveness measures funding. 100
Importance of terrestrial protected areas for marine protected areas
A major difficulty for management of some marine reserves is the harm caused by pollutants from degradation and land uses in the catchments that flow into the marine reserves. This threat is made all the more difficult to manage because pollution regulation may fall outside the jurisdiction of the reserve management agency. Nowhere is this impact more dramatic than on the Great Barrier Reef, which has been severely impacted by water pollution from land-based agriculture (as explained in Priority areas for protection below).
Green Sea Turtle (Chelonia mydas).
© JU
rg
en
fre
Un
D/w
wf-a
US
tra
lIa.
National Representative System of Marine Protected Areas
CONCLuSION AND RECOMMENDATIONS
A large gap remains to be filled before the NRSMPA can be considered at minimum standard for protecting our vast and complex marine biodiversity, even at the ecosystem level. If we extend our analysis to consider species diversity in marine protected
areas, the gap may increase beyond that estimated in this report.
Compared with terrestrial reserves, however, the investment levels required to fill the gap are relatively small — and the potential for major and rapid increases in levels of protection very high — considering that the marine environment is entirely under government ownership and control.

RECOMMENDATIONSRecommendation 4: In line with scientific guidance, all jurisdictions should commit to bringing at least 30 per cent of each marine ecosystem and threatened species distribution and 100 per cent of critical habitats for threatened species into marine sanctuaries by 2020. Jurisdictions should develop budgets appropriate to the need for ongoing management and implement a displaced activities policy.
Photo: the great Barrier reef.

© v
Iew
fInD
er
/ww
f-aU
Str
alIa
.
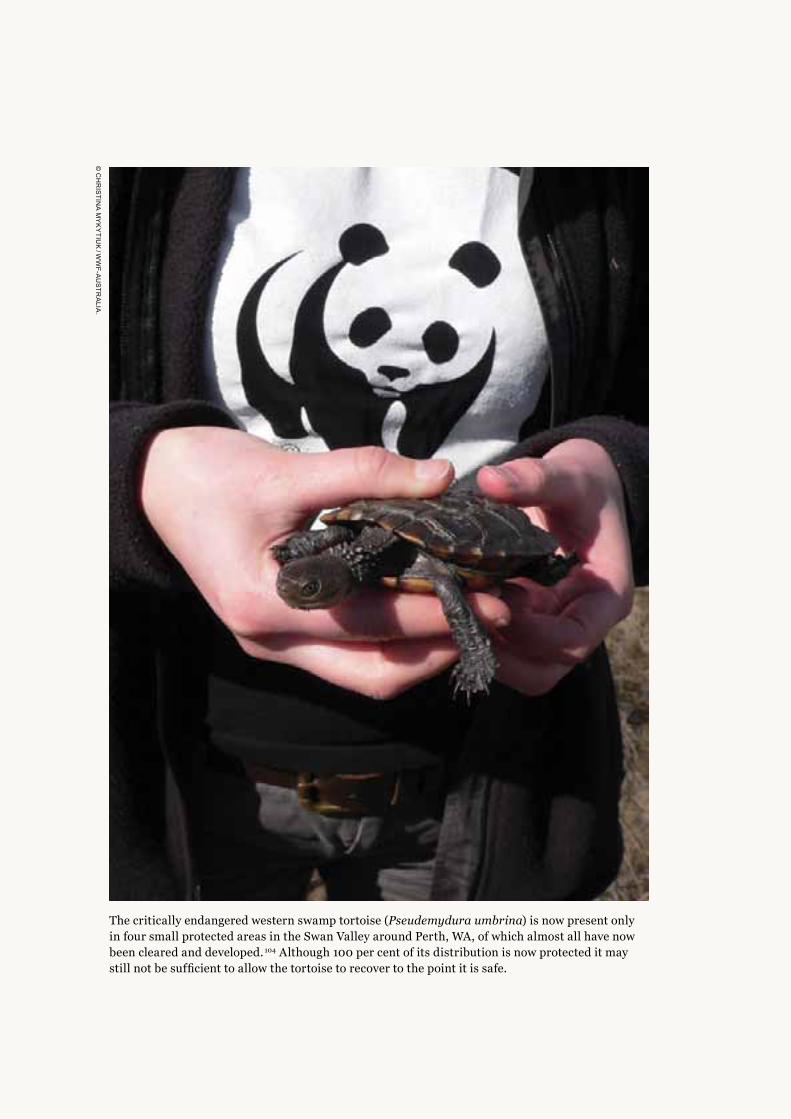
© c
hr
IStIn
a m
yK
ytIU
K / w
wf-a
US
tra
lIa.
The critically endangered western swamp tortoise (Pseudemydura umbrina) is now present only in four small protected areas in the Swan Valley around Perth, WA, of which almost all have now been cleared and developed. 104 Although 100 per cent of its distribution is now protected it may still not be sufficient to allow the tortoise to recover to the point it is safe.
Southwest Australia is one of the oldest and most diverse landscapes on the planet. The soils are geologically ancient and nutrient-deficient, resulting in a flora adapted to these harsh conditions. There are an estimated 6,759 plant
PRIORITy AREAS FOR PROTECTION
SOuThWEST AuSTRALIA BIODIvERSITy hOTSPOT
species and more than a further 1000 more unnamed. Two-thirds of plant species are endemic. This treasure trove of unique species could suffer range contractions of as much as 89 per cent under climate change. Much of the natural environment in southwest Australia has been modified, primarily for agriculture and urban development. As a result, resilience to climate change is considered low.101
Throughout this ecoregion, large gaps remain just to reach the minimum standards proposed in this report. This is even before we consider other key components of adequacy, especially connectivity. In order to meet the standard of 15 per cent of each ecosystem protected, the sampling gap is 1.6 million hectares (Fig. 2).
In particular, the Avon Wheatbelt is identified as a high priority bioregion for further growth of protected areas with a large number of threatened species (75), particularly endemic plants, in need of protection and an average gap area of over 2000 hectares for each species (Table 3). We note that the bioregional prioritisation in Table 3 is a coarse-scaled guide only, to be followed in the absence of more detailed analysis.
A new systematic conservation planning process — led by WWF, funded by the Australian government, and in partnership with the Western Australian government and key stakeholders — is identifying large areas with high levels of endemism and rarity representing priorities for inclusion in the NRS. 102
WWF also has an on-ground NRS program-funded project to bring private lands with important biodiversity values in the Avon Wheatbelt into the NRS through the upgrading of existing covenants and the negotiating of new ones (Box 3). 103
The large area of landscape modification — through clearing, cropping, and salinization — poses particular challenges. The Carbon Farming Initiative presents a new opportunity to promote landscape restoration (Box 4).

70WWF Building Nature’s Safety Net 2011 page
Priority Areas for Protection
GREAT BARRIER REEF
Plume of sediment leaving the mouth of the Burdekin River, and flowing into the Great Barrier Reef lagoon, during the January 2011 floods.
© n
or
ma
n K
Ur
Ing
/ na
Sa
ea
rth
oB
Se
rvato
ry.
In 2004, the Great Barrier Reef Marine Park was rezoned from 5 to 33 per cent in marine sanctuaries or national parks (or green zones).
Despite this, two of the major challenges that remain for protection of the Great Barrier Reef are:105
1. Reducing the levels and impact of global warming and ocean acidification
2. Reducing sediment, pesticide, and nutrient pollution from the catchments.
Timely global action on climate change will be critical to the future of the Great Barrier Reef.106 The Australian government’s carbon pricing commitment should be seen as a decision about the future of the Reef.107 Protected areas play a critical role in capturing biological carbon in living and dead tissues. Therefore, protection of the Reef and marine and coastal environments helps slow global warming.

71WWF Building Nature’s Safety Net 2011 page
Priority Areas for Protection
The recent Great Barrier Reef Outlook Report shows that the most critical threat that undermines the resilience of the Reef to climate change is pollution, primarily from cane farming and beef production, in the catchments. This is currently being tackled by the Reef Rescue collaboration between the Australian and Queensland governments and non-government farming and conservation sectors. 108
The Great Barrier Reef catchments are a high priority for expansion of protected areas, with only 32 per cent by area of ecosystems protected to the 15 per cent target (Fig. 2). Compared with forests and national parks, areas under livestock production contribute three times more sediment pollution, and account for 95 per cent of all erosion and 85 per cent of sediment pollution in the Burdekin River —the largest catchment flowing into the Great Barrier Reef. 109
Meeting the 15 per cent target in the reef catchments for highly protected areas would have a significant side-benefit in reducing pollution harming the Great Barrier Reef.
Despite the extensive increase in marine sanctuaries over the Great Barrier Reef in 2004, there are still gaps in protection of benthic ecosystems, climate refugia, blue corridors, and other critical habitats for threatened marine species (Fig. 9). 110
ThE MOST CRITICAL ThREAT ThAT uNDERMINES
ThE RESILIENCE OF ThE REEF TO
CLIMATE ChANGE: POLLuTION
ThE RANGELANDS High priority, poorly reserved bioregions (Table 3, Fig. 2) tend to be those where the dominant land-use is range livestock production on native pasture. In the rangelands, some clearing may have taken place, but
there has not yet been large-scale conversion to exotic pastures or crops, industrial or urban development.
Livestock production on native pastures dominates 56 per cent of Australia’s landscapes. 111 Because of this pervasiveness, even small biodiversity impacts (per unit area) are compounded. Livestock production is the dominant driver of deforestation and soil erosion. 112 Suppression of top predators to protect stock is thought to have been a major driver of extinctions of “critical weight-range” mammals, primarily in the grazing lands of Australia.113
Many parts of the grazing lands are already economically marginal and now face increased aridity and climatic variability under climate change.114
Globally, and in Australia, WWF is spearheading a transformation in beef production practices to move what is traditionally a high environmental impact business onto a more sustainable trajectory. 115
However, movement to more sustainable practices may be constrained in many areas, and land prices are typically low, presenting an ideal case for conversion to a conservation and eco-tourism use.
Expansion of nature reserves in the rangelands would help to broaden the rural and Indigenous economic base beyond prevailing dependence on pastoralism or mining, with new opportunities in eco-tourism, conservation ranger jobs, and carbon pollution abatement. 116

Spotted Tail Quoll (Dasyurus maculatus).
© fe
Dy
me
rc
ay.

JuRISDICTIONAL PROFILES
quEENSLAND: PRIORITy STATE FOR RESERvE SySTEM GROWTh
Highlights
• In 2007, agreement was struck to systematically assess term pastoral leases on state land (covering more than half the State’s land area) for potential conversion to national parks where appropriate, and to award lease extensions to lessees who volunteer for a nature refuge over their leased land.
• For the 2008 Centennial of National Parks, the Queensland Premier Anna Bligh promised to expand National
Parks by 50 per cent to 12.9 million hectares, and other protected areas to 7.1 million hectares for a total target of 20 million hectares by 2020, which would cover 11.6 per cent of the State’s land area.117
• In 2009, Queensland also adopted the targets of the NRS 2009–2030 Strategy.
• In 2010, Queensland announced new funding for national park acquisitions of $56 million over four years, derived in part from a new levy on industrial land-fill waste. In addition, $28 million was announced for koala habitat protection and $8.4 million for NatureAssist, the nature refuges support program for protected areas on private land.
• In 2010, a new plan was announced to turn 80 per cent of North Stradbroke Island into national park by 2027. 118
• The transfer of state forests to national park estate has progressed with 82 per cent of the areas of Wet Tropics forest transfers now gazetted as protected areas, and 90 per cent of southeast Queensland forest reserves transferred to protected area status. 119
• In 2010, the Queensland government also released a new consultation draft of the state Biodiversity Strategy and the historic Protected Areas for the Future discussion paper, which treats systematic development of a CAR reserve system as the premier conservation action of the Strategy. 120
• In 2009–10, new regulations restricted the clearing of regrowing native vegetation along watercourses as well as the farming and pastoral practices in Great Barrier Reef catchments.

74WWF Building Nature’s Safety Net 2011 page
Jurisdictional Profiles
Binya National Park
In 2009, the 13,710-hectare Binya National Park was purchased with Australian government NRS Program grant support.
Binya National Park sits in the previously unreserved Warrego Plains subregion of the Mulga Lands bioregion. It protects eight regional ecosystems which had low representation in protected areas and one regional ecosystem which had no previous representation.
Binya contains extensive riparian habitats and plant biodiversity.
Moreton Bay Marine National Park expansion
In 2009, the 346,354-hectare Moreton Bay Marine Park zoning plan was amended to increase ‘no-fishing’ or ‘no-take’ green zones (Marine National Parks) from 0.5 to 16 per cent — a very significant increase in protection. It was underpinned by a commercial fishing licence surrender program which cost $15.1 million. Moreton Bay contains the most southerly population of dugongs on the east coast. 121
Emus on Binya National Park.
Dugong (Dugong dugon).
© Q
Ue
en
Sla
nD
go
ve
rn
me
nt D
ePa
rtm
en
t of
en
vIr
on
me
nt a
nD
re
So
Ur
ce
ma
na
ge
me
nt
© a
nD
re
y n
eK
ra
So
v/w
wf-c
an
on
.

75WWF Building Nature’s Safety Net 2011 page
Jurisdictional Profiles
Issues
Queensland remains the highest priority for expansion of the NRS throughout Australia, with a high number of high priority bioregions where the total area of reserves is poor (Table 3) and the largest proxy ecosystem gaps occur (Fig. 2).
Major areas for further attention include
— Alignment to NRS priorities — The Queensland government has, in the past, emphasised new national parks on Cape York Peninsula and in southeast Queensland bioregions, while growth in the national priority bioregions has been relatively slow. The Queensland Biodiversity Strategy and the associated Protected Areas for the Future plan present an historic opportunity to realign state government priorities to national priorities — primarily the inland and Gulf of Carpentaria grazing lands and savannas, reef catchments, and wetlands (Fig. 2). WWF’s earlier analyses Treasures for Humanity and 20 million hectares by 2020 remain largely applicable. 122 However, every bioregion has substantial gaps for protection of threatened ecosystems and species, and work is still required in every bioregion.
— Leasehold land — The reform of state leasehold land management through the Delbessie Agreement has enormous potential for low-cost expansion of protected areas in priority areas over the long-term. The systematic, scientific identification of leases to be prioritised for eventual conversion to national parks, or for negotiation of a nature refuge agreement in the generally poorly reserved rangeland bioregions, is a high priority.
— Reform nature refuge legislation — Nature refuges are not necessarily closed to broad scale extractive uses in Queensland (particularly mining, see Box 1) and livestock production. In cases where the biodiversity values are highly irreplaceable, properties should be prioritised for acquisition into the national parks system. Or a provision should be made in legislation for a new type of private protected area closed to extractive uses, in addition to the existing lower security type of nature refuges.
— Moreton Bay Rescue — Moreton Bay scored a B-minus in the 2009 Healthy Waterways Report Card with five of the southern catchments flowing into the Bay given a failing grade for water quality.123 As for the Great Barrier Reef, the effectiveness of the recent expansion of marine sanctuaries in Moreton Bay will be undercut unless controls are placed to reduce pollution flowing into the Bay. 124 ‘Go slow’ zones for dugongs and turtles in southern bay also need to be expanded.
— Gulf of Carpentaria marine parks — With the east coast now having an extensive marine parks network, Queensland must now consider appropriate protection mechanisms and management arrangements for the waters of the Gulf of Carpentaria. Border to border marine parks is a longstanding commitment of the Queensland government and a target in the draft Biodiversity Strategy. 125 The recent recognition of Native Title rights over Gulf waters highlights the need to be pro-active in engaging Traditional Owners in the marine protected area planning process, including the consideration of saltwater Indigenous Protected Areas (Northern region in Figures 8 and 9). 126
MORETON BAy CONTAINS ThE
MOST SOuThERLy POPuLATION OF DuGONGS ON AuSTRALIA’S
EAST COAST
76WWF Building Nature’s Safety Net 2011 page
AuSTRALIAN CAPITAL TERRITORy
NEW SOuTh WALES
Jurisdictional Profiles
The Australian Capital Territory has a reserve system which can be regarded as very close to adequate, with the chief remaining priority being the protection of Yellow Box-Red Gum grassy woodlands.
Highlights
New South Wales outranks all other jurisdictions with the highest attainment of the 30 per cent standard for EPBCA species (Fig. 3).
Over the past decade, the New South Wales government has consistently focussed on acquiring properties in the high priority western New South Wales bioregions and is the second biggest spender (of all the jurisdictions) on parks acquisition and management.
Darling Riverine Plains
New South Wales has secured major additions in the high priority bioregion, the Darling Riverine Plains (see Table 3). Five new reserves and significant additions to two existing parks have been acquired.
This included the 90,000-hectare Toorale Station, which included major contributions from the NRS program and the National Water Initiative for purchase of water rights (Table 4). Toorale now protects extensive floodplains along the Darling River and connects to Gundabooka National Park. This major acquisition overlaps three poorly protected bioregions: the Darling Riverine Plains, Cobar Peneplain and the Mulga Lands. These advances in the New South Wales section of the Darling Riverine Plain bioregion are also significant in light of lost opportunities due to agricultural development in the Queensland portion of the bioregion.
River Red Gum Forests
In March 2010, the New South Wales government announced that 107,210 hectares of River Red Gum forests would be protected in 69,413 hectares of new national parks, 16,308 hectares of regional parks, and 21,489 hectares of Indigenous Protected Areas. Up to $80 million was announced for spending on adjustment for rural communities potentially affected by the decision. 127 This followed the declaration of a reserve network in the Red Gum Forests of Victoria a year earlier (see below).
Yanga National Park
The acquisition of Yanga station, in 2007, nearly doubled the protected area of the poorly reserved Riverina Bioregion from 0.85 to 1.9 per cent and brought the associated protected area complex to 67,000 hectares of national park, state conservation area, and nature reserve. Yanga has 150 kilometres of Murrumbidgee River frontage and protects many threatened ecosystems including Red Gum forests and Black Box-Nitre Goosefoot swamps. Yanga protects critical habitats for the Australasian Bittern, the Fishing Bat, the Southern Bell Frog and many waterbirds. Yanga is an important roosting site for the Great Egret.

77WWF Building Nature’s Safety Net 2011 page
Batemans’ Bay and Port Stephens Marine Parks
These new marine parks were declared to conserve a large diversity of near shore habitats: coastal lakes and estuaries, mangroves, sandy and rocky intertidal habitats, kelp beds, coralline algae, and sponge gardens. These parks provide an important link in the developing national whale and dolphin sanctuary network. 128
Issues
New South Wales will need to continue the concerted and focussed effort of the past to fill significant remaining gaps. Attainment of the proxy ecosystem standard is third lowest after Queensland.
Flooded red gum forest, Yanga National Park.
Great egret (Ardea alba) in Yanga National Park.
© Pa
Ul c
hIlD
S/n
Sw
offIc
e o
f en
vIr
on
me
nt a
nD
he
rIta
ge
.©
Joh
n tU
rB
Ill/nS
w o
ffIce
of e
nv
Iro
nm
en
t an
D h
er
Itag
e.
Jurisdictional Profiles

78WWF Building Nature’s Safety Net 2011 page
Bateman’s Bay Marine Park.
© g
eo
ff Ke
lly / n
Sw
offIc
e o
f en
vIr
on
me
nt a
nD
he
rIta
ge
.
NORThERN TERRITORy
Jurisdictional Profiles
Highlights
There has been significant expansion of the Indigenous Protected Area (IPA) estate in
the Northern Territory including in 2009 the Wardekken (1,394,951 hectares) and adjoining Djelk (673,200 hectares) IPAs, which together protect a significant portion of the ecologically intact Arnhem Land.
In 2009, the Northern Territory government unveiled a proposal to focus effort into linking existing protected areas — stretching from Arnhem Land to Uluru-Kata Tjuta National Park running down the western side of the Territory — with the South Australian Nature Links program to form a Trans-Australia Ecolink. 129 The Territory Eco-link project does encompass some of the high priority bioregions (Central Arnhem, Daly Basin, Burt Plain, Finke) but misses others, such as Sturt Plateau and Davenport Murchison bioregions (Fig. 2, Table 3).
The current level of investment proposed for the project of $1.8 million is well below that needed for reserve expansion in the Northern Territory and instead relies on a mix of low cost conservation options, including conservation covenants, IPAs, and land purchase.
In 2007, one of the largest IPAs was declared in the northern Tanami, providing a major building block in the Northern Territory Eco-link project.
79WWF Building Nature’s Safety Net 2011 page
Issues
The Northern Territory had the second lowest proportion of land area under protected areas after Queensland, and had eight of the top 17 priority bioregions for the NRS in 2008 (Table 3).
Mammal population declines
Recent evidence of dramatic declines in the population of small- to medium-sized mammals in Northern Territory parks, including the Commonwealth-managed Kakadu National Park, is of concern and demonstrates the critical importance of this ongoing ground research.130 Inappropriate fire regimes, grazing by non-native herbivores and feral cats are considered to be the chief causes of this decline, revealing the need for management practices and strategies to be informed by local research on parks.
Parks tourism revenues exceed parks investment
In the latest survey commissioned by Northern Territory Tourism, 78 per cent of holiday visitors arriving in Darwin said that they “prefer to holiday where [they] can see nature or be in a natural setting”. 131 Tourists, whose primary reason for visiting the Northern Territory was to visit parks and nature reserves, spent approximately $866 million in 2009–10 — generating about $87 million of GST, which would eventually flow back to the Northern Territory government. 132
By comparison, the Territory has had no parks acquisition budget since at least 2003 and a modest management budget of $28.3 million in 2008–9. 133 The income the Territory government receives from GST on park tourists’ spending is well above what it spends on expanding and maintaining its chief tourism asset — the parks system.
This high priority jurisdiction urgently needs a capital budget to take advantage of the expanded NRS grants program.
Kimberley to Cape corridor
The Territory Eco-link concept is oriented north–south and traverses biomes with very different plant and animal communities. There may, however, be significant biodiversity benefits in connecting protected areas east to west across the entire savanna biome. A Kimberley to Cape corridor has been suggested as another cross-jurisdictional national-scale green corridor that should be developed for its benefits in buffering the impacts of climate change on the rich northern savanna biota. 134
Marine Parks Plans
The northern marine region has the largest gap of all the regions (Figures 8 and 9). Action on marine parks appears to be stalled, making it unlikely that longstanding commitments to a CAR network of marine reserves will be met by 2012. MPA guidelines have yet to be approved and only one small marine park proposal is progressing. 135 There are significant opportunities for working with Indigenous communities on potential ‘saltwater’ IPAs, particularly where they adjoin terrestrial IPAs.
ThE NORThERN MARINE
REGION hAS ThE LARGEST
GAP OF ALL ThE REGIONS
Jurisdictional Profiles

80WWF Building Nature’s Safety Net 2011 page
SOuTh AuSTRALIA
Jurisdictional Profiles
Southern Brown Bandicoot (Isoodon obesulus).
© n
atalIe
ho
llan
D.
Highlights
South Australia is one of the top-ranking states for growth of the NRS, showing the highest
growth rate among the jurisdictions of overall total area of highly protected areas over the past decade (Table 2).
The government is drafting a protected area strategy to guide the future growth of the reserve system.
The outstanding acquisition in South Australia (for the period 2006–2008) that best advanced NRS priorities was Burra Creek Conservation Park. This new park sampled a previously poorly reserved bioregion, the Flinders Lofty Block, and previously unreserved ecosystems and habitat for the nationally threatened pygmy blue-tongue lizard. The new protected area also secures valuable riparian corridor linkages to the wider landscape.
Issues
Despite strong recent growth, and an extensive protected area system, South Australia has surprisingly below-average attainment of ecosystem and threatened species targets for highly protected areas on land (Figures 2 and 4).
South Australia ranked above the national average for all marine protected area types, but ranked well below for highly marine protected areas (Table 9). Although a state system of marine parks has been planned, no commitment has been made to what proportion of state waters will be in ‘no-fishing’ or ‘no-take’ sanctuaries. A scientifically credible commitment to at least 30 per cent of state marine ecosystems in sanctuaries is needed.
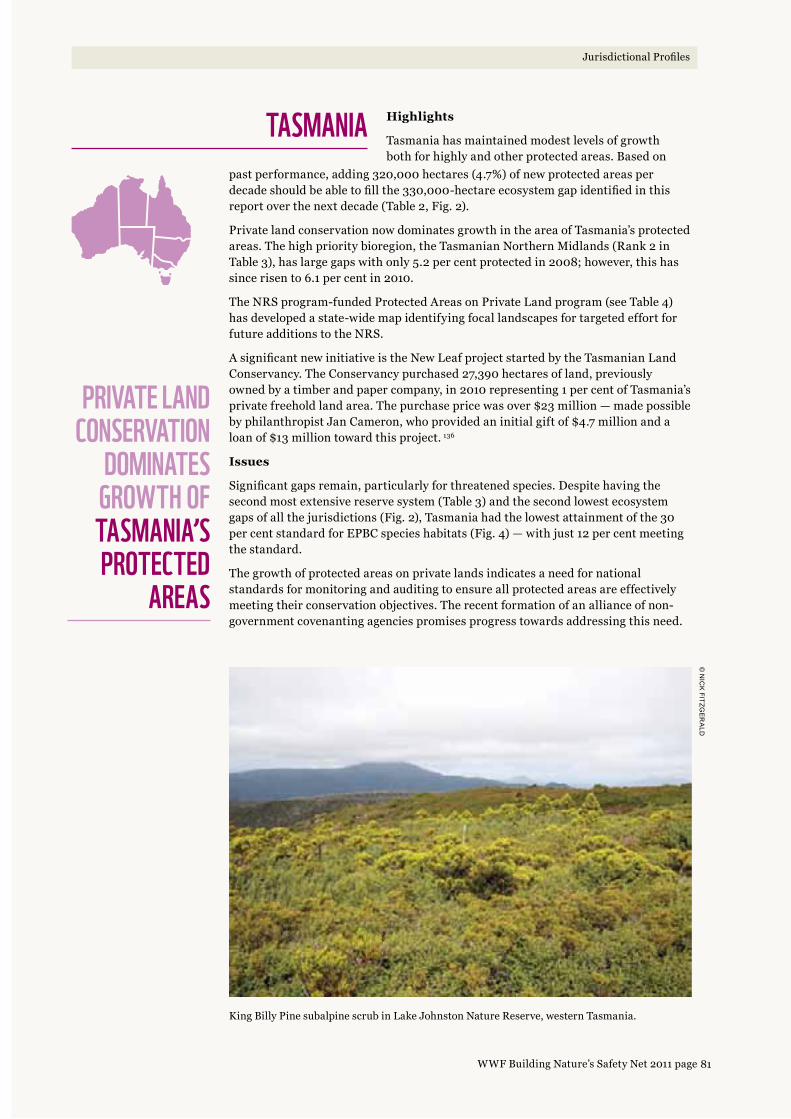
81WWF Building Nature’s Safety Net 2011 page
TASMANIA
King Billy Pine subalpine scrub in Lake Johnston Nature Reserve, western Tasmania.
© n
IcK
fItzge
ra
lD
PRIvATE LAND CONSERvATION
DOMINATES GROWTh OF TASMANIA’S PROTECTED
AREAS
Jurisdictional Profiles
Highlights
Tasmania has maintained modest levels of growth both for highly and other protected areas. Based on
past performance, adding 320,000 hectares (4.7%) of new protected areas per decade should be able to fill the 330,000-hectare ecosystem gap identified in this report over the next decade (Table 2, Fig. 2).
Private land conservation now dominates growth in the area of Tasmania’s protected areas. The high priority bioregion, the Tasmanian Northern Midlands (Rank 2 in Table 3), has large gaps with only 5.2 per cent protected in 2008; however, this has since risen to 6.1 per cent in 2010.
The NRS program-funded Protected Areas on Private Land program (see Table 4) has developed a state-wide map identifying focal landscapes for targeted effort for future additions to the NRS.
A significant new initiative is the New Leaf project started by the Tasmanian Land Conservancy. The Conservancy purchased 27,390 hectares of land, previously owned by a timber and paper company, in 2010 representing 1 per cent of Tasmania’s private freehold land area. The purchase price was over $23 million — made possible by philanthropist Jan Cameron, who provided an initial gift of $4.7 million and a loan of $13 million toward this project. 136
Issues
Significant gaps remain, particularly for threatened species. Despite having the second most extensive reserve system (Table 3) and the second lowest ecosystem gaps of all the jurisdictions (Fig. 2), Tasmania had the lowest attainment of the 30 per cent standard for EPBC species habitats (Fig. 4) — with just 12 per cent meeting the standard.
The growth of protected areas on private lands indicates a need for national standards for monitoring and auditing to ensure all protected areas are effectively meeting their conservation objectives. The recent formation of an alliance of non-government covenanting agencies promises progress towards addressing this need.

82WWF Building Nature’s Safety Net 2011 page
vICTORIA
Jurisdictional Profiles
Highlights
Victoria is the highest spender per hectare on protected area management among the
jurisdictions (Tables 4 and 7). No data were provided on recent acquisition investments, though it is likely to remain significantly less than in some other states based on past information (Table 3). 137 Attainment of proxy ecosystem representation standard is modest (58 per cent in Fig. 2), while attainment of the species diversity standard is close to national average (30 per cent in Fig. 6).
The influential work of the long-running Victorian Environmental Assessment Council continued with the Victorian government accepting most of its 2008 recommendations to establish a comprehensive reserve network in the River Red Gum forests and woodlands along the Murray River and its tributaries. Four new national parks were established in 2009, and important additions were made to several others, placing approximately 160,000 hectares in conservation reserves along Victoria’s Murray River corridor 138 and Northern Plains. Four under-represented subregions benefited (Murray Fans, Victorian Riverina, Robinvale Plains, Murray Scroll Belt).
Also in 2009, the Victorian government added a further 45,000 hectares of old-growth forest in East Gippsland to the parks estate, including linking Snowy River National Park with Errinundra National Park and protecting the controversial Goolengook forest. 139
Another important recent addition was the gazettal of the 18,510 hectares Cobboboonee National Park in 2008. The new national park protects habitats for a range of threatened species and including the Powerful Owl, Spot-tailed Quoll, Long-nosed Potoroo, Common Bent-wing Bat (southern sub-species), Masked Owl, Swamp Antechinus, and Swamp Skink. 140 The new park also includes under-represented ecosystems in the high priority Victorian Volcanic Plain bioregion.
Issues
Significant gaps remain at sea and on land, and filling them will require a creative approach in light of the total area of freehold land, legacy of extensive land clearing, and the high cost of land (Figures 4 and 9).
Victoria has two moderate to high priority terrestrial bioregions: Victorian Volcanic Plains (VVP) and the Riverina (Table 3). The high level of modification of the VVP puts constraints on filling gaps with intact vegetation and restoration of lost ecosystems, yet should be encouraged. The recently completed Melbourne Strategic Assessment, completed under the EPBC Act, has proposed the reservation of some 15,000 hectares of grasslands and grassy woodlands in the VVP, as an offset for clearing grasslands as Melbourne’s growth area boundary expands.141
The Victorian government has dismayed scientists and conservationists by recently deciding to open Alpine National Park to “scientific grazing” by livestock, despite abundant evidence from earlier inquiries showing that livestock grazing is an inappropriate and damaging activity and provides no benefits in terms of bushfire mitigation. Livestock were recently ordered off the Park by federal Environment Minister Tony Burke — overruling the state by using his powers under the Commonwealth Environmental Protection and Biodiversity Conservation Act. 142
83WWF Building Nature’s Safety Net 2011 page
WESTERN AuSTRALIA
WESTERN AuSTRALIA
hAS ShOWN ThE MOST
IMPROvEMENT OF ALL ThE
JuRISDICTIONS
Jurisdictional Profiles
Highlights
Western Australia has shown the most improvement of all the jurisdictions. Protected areas are above national
average on land (Table 1), and the State shows the fastest growth in overall total area as a percentage of area for both highly protected areas and other protected areas on land (Table 2). Proxy ecosystem attainment is above national average (Fig. 2) and EPBCA species attainment second highest after New South Wales (Fig. 4). Western Australia now has only three bioregions in the top 17 priority terrestrial bioregions, down from four in 2002 (Table 3).
Although spending levels have been modest, the Western Australian government has been taking advantage of the Australian government’s funding program to grow its reserve system. In 2007 and 2008, the Western Australian government made major acquisitions with NRS program funding: Dalgaranga and Noongal, Kadathinni, Nerren Nerren, Point Melbourne, and Thundelarra Station all totalling 435,000 hectares. A number of new reserves have since been added with NRS program funding. 143
A new marine park is proposed in Camden Sound, as part of a major initiative for protection of sea and land in the remote and spectacular Kimberley region of Western Australia. 144
Issues
Significant gaps remain to be filled on land with at least 18 million hectares for proxy ecosystems alone (not including threatened species) (Fig. 2). This is the second largest absolute gap after Queensland and is to be expected, considering Western Australia is the largest jurisdiction.
The global biodiversity hotspot of South-west Australia continues to be the top priority for strategic growth of the protected area system within the State. There are large ecosystem protection gaps, a legacy of fragmentation and habitat loss due to development and ongoing serious threats of climate change, loss and degradation of native vegetation, altered fire regimes, invasive pests and weeds, and salinization.145
The overall total area of marine protection is low for sanctuaries (Table 9), with low attainment of the marine ecosystem target in the two bioregions mostly in state waters — Northwest Inner and Southwest Inner (Figures 8 and 9). The proposed Camden Sound Marine Park could be a major step forward if it is based on a wider science-driven analysis, focused on achieving a CAR marine reserve system and protection for critical dolphin and dugong habitat, and by reserving more than the 13 per cent currently proposed in ‘no-fishing’ or ‘no-take’ sanctuaries. Similar science-based zoning will be required for other proposed Kimberley marine protected areas.
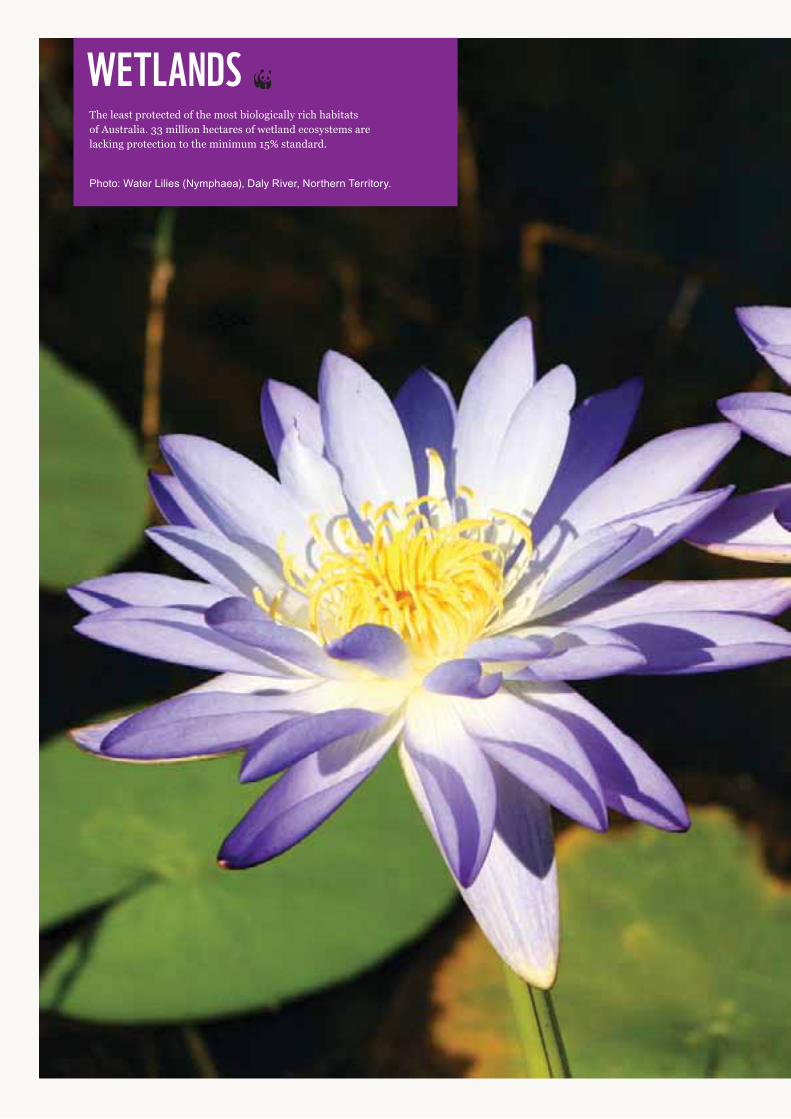
WETLANDSThe least protected of the most biologically rich habitats of Australia. 33 million hectares of wetland ecosystems are lacking protection to the minimum 15% standard.
Photo: water lilies (nymphaea), Daly river, northern territory.

© S
tUa
rt B
lan
ch
.

86WWF Building Nature’s Safety Net 2011 page
Endnotes
ENDNOTES1 Sattler, P S and Glanznig, A. 2006. Building Nature’s Safety Net: A review of
Australia’s terrestrial protected area system 1991–2004. WWF-Australia Report, WWF-Australia, Sydney.
Sattler, P S and Taylor, M F J. 2008. Building Nature’s Safety Net 2008. Progress on the directions for the National Reserve System. WWF-Australia Report, WWF-Australia, Sydney.
2 Stolton, S and Dudley, N. (eds). 2010. Arguments for protected areas: multiple benefits for conservation and use. Earthscan, London, UK.
3 Andam, K S, et al. 2010. Protected areas reduced poverty in Costa Rica and Thailand. PNAS. 6pp. doi:10.1073/pnas.0914177107
4 International visitor consumption of nature-based tourism was $19.5 billion in 2009 according to: Tourism Research Australia. 2010. Snapshots 2009: Nature tourism in Australia. Australian Government, Canberra. Webpage http://www.ret.gov.au/tourism/tra/snapshots/nature/Pages/default.aspx accessed 1 Mar 2011.
This represents approximately 6.9 per cent of total exports of goods and services, which was $283.8 billion in 2008–9 according to the Australian government official trade statistics in: Department of Foreign Affairs and Trade. 2010. Australia’s trade by state and territory 2008–09. Australian government, Canberra. Portable Document Format file http://www.dfat.gov.au/publications/stats-pubs/downloads/australia-trade-by-state-and-territory-2008-09.pdf accessed 1 Mar 2011.
5 Buckley, R. 2002. World heritage icon value: contribution of world heritage branding to nature tourism. Australian Heritage Commission, Canberra. Portable Document Format file http://www.environment.gov.au/heritage/ahc/publications/commission/books/pubs/iconvalue.pdf accessed March 2011.
6 Great Barrier Reef Marine Park Authority. 2008. Submission to the House Standing Committee on Climate Change, Water, Environment and the Arts: Inquiry into climate change and environmental impacts on coastal communities. Australian government, Canberra. Portable Document Format file http://www.aph.gov.au/house/committee/ccwea/coastalzone/subs/sub081.pdf accessed 15 April 2011.
7 Taylor, M F J, Adams, V M, Segan, D B, and R L Pressey. 2009. 20 million hectares by 2020: protected areas, green infrastructure and green jobs for Queensland. A WWF-Telstra Building Nature’s Safety Net Report, WWF-Australia, Sydney.
8 Department of the Environment, Sport and Territories. 1996. National strategy for the conservation of Australia’s biological diversity. Australian government, Canberra.
9 Sattler and Glanznig, 2006, cited above.
10 Habel, S G. 1992. A protected area strategy for the conservation of biological diversity. WWF-Australia, Sydney.
WWF-Australia. 1994. WWF annual protected areas report card for 1994. WWF-Australia, Sydney.
WWF-Australia. 1995a. A national protected areas strategy and action plan for the conservation of biological diversity. WWF-Australia, Sydney.
WWF-Australia. 1995b. WWF annual protected areas report card for 1995. WWF-Australia, Sydney.

87WWF Building Nature’s Safety Net 2011 page
WWF Building Nature’s Safety Net 2011
87WWF Building Nature’s Safety Net 2011 page
Endnotes
11 Natural Resource Management Ministerial Council. 2009. Australia’s strategy for the national reserve system 2009–2030. Australian government, Canberra.
12 Sattler, P and Williams, R. (eds). 1999. The conservation status of Queensland’s bioregional ecosystems. Queensland government Environmental Protection Agency, Brisbane.
13 Department of Sustainability, Environment, Water, Population and Communities. 2011. Australia’s biodiversity conservation strategy. Australian government, Canberra.
Species and area targets in this strategy are:
“4. By 2015, achieve a national increase of 600,000 square kilometres of native habitat managed primarily for biodiversity conservation across terrestrial, aquatic and marine environments.
5. By 2015, 1,000 square kilometres of fragmented landscapes and aquatic systems are being restored to improve ecological connectivity.
6. By 2015, four collaborative continental-scale linkages are established and managed to improve ecological connectivity.
7. By 2015, reduce by at least 10% the impacts of invasive species on threatened species and ecological communities in terrestrial, aquatic and marine environments.”
14 Joint ANZECC / MCFFA National Forest Policy Statement Implementation Sub-committee (JANIS). 1997. Nationally agreed criteria for the establishment of a comprehensive, adequate and representative reserve system for forests in Australia. Australian government, Canberra. Portable Document Format file http://www.daff.gov.au/__data/assets/pdf_file/0011/49493/nat_nac.pdf accessed 15 April 2011.
These are the so-called “JANIS” criteria.
Note that we used simplified criteria rather than all the JANIS criteria. 15 per cent of pre-1750 total area of each ecosystem in each bioregion is the baseline JANIS criterion. JANIS also requires reservation of 60 per cent of vulnerable forest ecosystems and 100 per cent of current distribution for rare or endangered ecosystems and old-growth forests. However, since the definition of a vulnerable forest is 30 per cent remaining, this equates to 18 per cent of pre-clearing total area, which is close to 15 per cent. Since the definition of a rare ecosystem is one with an area of 1000 hectares or less, we have captured that in our rule to protect 100 per cent of ecosystems less than 1000 hectares. Since an endangered forest is one reduced to 10 per cent of its former range, our rule of reserving 15 per cent of pre-clearing total area is actually more ambitious than JANIS because it implies that the ecosystem has to be actively restored or allowed to recover to at least 15 per cent of pre-clearing total area if it has been cleared.
15 The upper limit on sampling very wide-ranging threatened species is necessary since range maps are not the same as habitat maps. Gaps for very large species would dominate the gap analysis unless caps were put on large range species. Among the EPBCA species in the analysis, the Australian Painted Snipe had an enormous nominal range covering roughly half the area of Australia. Clearly, only the wetlands within that range are actual habitats for the snipe. In the absence of better mapping, the cap was the only method available to us to reduce biases in over-estimation of actual distributions and, therefore, over-estimation of gaps.
88WWF Building Nature’s Safety Net 2011 page
16 Watson, J E M, et al. 2011. The capacity of Australia’s protected area system to represent threatened species. Conservation Biology 25: 324–332.
17 Natural Resource Management Ministerial Council, 2009, cited above.
The Australian government Environment Protection and Biodiversity Conservation Act 1999 requires that habitats critical to the survival of the listed threatened species be identified in a recovery plan. In addition, the Australian government is not required to but may elect to identify and list habitat critical to the survival of a listed threatened species or ecological community, where survival means long term persistence. For a threatened species or community to “survive” implies that it has to recover to the point it is no longer threatened. This is the more precise definition used under the US Endangered Species Act, where critical habitat is defined as that needed by the species to recover to the point it can be delisted and explicitly includes both areas currently occupied and areas of suitable habitat it will need to re-occupy in the process of recovering viable range and population size. See: US Fish and Wildlife Service. 2011. Endangered species program: Listing and critical habitat, critical habitat, frequently asked questions. Department of the Interior, United States government, Washington DC, USA. Webpage http://www.fws.gov/endangered/what-we-do/critical-habitats-faq.html accessed 15 April 2011.
18 Sattler and Glanznig, 2006, cited above.
Sattler and Taylor, 2008, cited above.
19 Dudley, N. (ed). 2008. Guidelines for applying protected area management categories. IUCN, Gland, Switzerland, 86pp.
20 Australian government. 2010a. SA multiple ecological communities project — Heritage agreements. Australian government, Canberra. Webpage http://www.nrm.gov.au/publications/factsheets/mec-sa-heritage-agree-factsheet.html accessed 1 Mar 2011.
21 Department of Environment and Resource Management. 2003. Grazing on QPWS estate. Queensland government, Brisbane. Webpage http://derm.qld.gov.au/parks_and_forests/managing_parks_and_forests/commercial_activities/grazing_on_qpws_estate.html accessed 1 Mar 2011.
22 Parks Victoria. 2003. Conservation reserves management strategy. Victorian Government, Melbourne. Portable Document Format file http://www.parkweb.vic.gov.au/resources07/07_1015.pdf accessed 1 Mar 2011.
23 Ultimately, governments can and have passed special legislation to excise mining leases out of national park boundaries. Such de-gazettals have shown alarming recent growth countering the growth of the global protected area estate. See: Mascia, M B, and Pailler, S. 2010. Protected area downgrading, downsizing, and degazettement (PADDD) and its conservation implications. Conservation Letters 00: 1–12.
The Victorian Alpine National Park, closed to livestock in 2005, was re-opened for “scientific” livestock grazing, despite a vast body of scientific evidence showing it is not compatible with a national park designation. See:
Fyfe, M. 2011. Top scientists urge halt to alpine grazing trial. The Age, Fairfax Press, Melbourne, 30 Jan 2011.
24 International Council on Mining and Metals. 2003. Mining and protected areas. Position Statement Sept 2003. Portable Document Format file http://www.icmm.com/document/43 accessed 1 Mar 2011.
25 Department of Sustainability, Environment, Water, Population and Communities. 2010. Collaborative Australian Protected Areas Database — CAPAD 2008–external. Spatial database, 10 Aug 2010 release, Australian government, Canberra.
Endnotes
89WWF Building Nature’s Safety Net 2011 page
26 Altman, J C, Buchanan, G J and L Larsen. 2007. The environmental significance of the indigenous estate: natural resource management as economic development in remote Australia. CAEPR discussion paper No. 286/2007. Australian National University, Canberra.
27 Terrestrial source was Department of Sustainability, Environment, Water, Population and Communities (2010), cited above.
Sources for marine protected areas are found in: Beaver, D and Llewellyn, G. 2009. Designing a comprehensive, adequate and representative (car) network of marine protected areas for Australia’s Commonwealth waters: progress report — February 2009. WWF-Australia, Sydney.
28 Conference of the Parties to the Convention on Biological Diversity. 2010. Decision X/2 Strategic plan for biodiversity 2011–2020. Webpage http://www.cbd.int/decision/cop/?id=12268 accessed 1 Mar 2011.
“Target 11: By 2020, at least 17 per cent of terrestrial and inland water, and 10 per cent of coastal and marine areas, especially areas of particular importance for biodiversity and ecosystem services, are conserved through effectively and equitably managed, ecologically representative and well connected systems of protected areas and other effective area-based conservation measures, and integrated into the wider landscape and seascapes.”
29 Department of Environment and Resource Management. 2011. Night parrot. Queensland government, Brisbane. Webpage http://www.derm.qld.gov.au/wildlife-ecosystems/wildlife/az_of_animals/night_parrot.html accessed 1 Mar 2011.
McDougall, A, et al. 2009. Another piece in an Australian ornithological puzzle — a second night parrot is found dead in Queensland. The Emu 109, 198–203.
30 Department of Environment and Climate Change. 2005. Booroolong frog — Profile. Threatened species: Species, populations and ecological communities in NSW. NSW government, Sydney. Webpage http://threatenedspecies.environment.nsw.gov.au/tsprofile/profile.aspx?id=10484 accessed 1 Mar 2011.
31 We recognise that Vegetation Subgroups (MVSG) are a coarse classification of ecosystem diversity unsuitable for property level planning. However, MVSG are the only data available for national scale analysis.
32 Department of Sustainability, Environment, Water, Population and Communities (2011), cited above.
33 Creating a map of proxy ecosystems
To independently assess the total area to which the reserve system samples regional ecosystems, we created a national scale proxy for regional ecosystems.
The only nationally consistent data with which to do this are the spatial distributions of 64 Major Vegetation Subgroups (MVSGs) produced by: Department of the Environment, Heritage, Water and the Arts, 2010. National Vegetation Information System version 3.1. Australian government, Canberra. Spatial data http://www.environment.gov.au/erin/nvis/mvg/index.html#nvis31 accessed 1 May 2010.
Present day and inferred 1750 distributions of vegetation subgroups are provided in NVIS. The present-day vegetation layer contains many data gaps. The 1750 distribution was used to backfill these data gaps and to backfill vegetation flagged as regrowth or cleared areas in the present-day layer,
Endnotes

90WWF Building Nature’s Safety Net 2011 page
taking into account the current land use, as indicated by: Bureau of Rural Sciences, 2010. Australian Land Use 2001–2. Australian government, Canberra. Spatial data http://adl.brs.gov.au/mapserv/landuse/index.cfm?fa=app.loaddata&tab=loaddata accessed 1 May 2010.
If present day land use was conservation or minimal use, the data gap was filled with remnant vegetation of the 1750 inferred major vegetation subgroup. If current day land use was production from natural environments or regrowth in the present day layer, the data gap was filled with recoverable regrowth vegetation of the 1750 inferred major vegetation subgroup.
Finally, if current land use was agriculture of other more intensive uses, cleared or unknown type in the present day land use, the gap was filled as non-recoverable vegetation of the 1750 inferred major vegetation subgroup.
In this way the entire Australian land surface could be assigned to 64 discrete vegetation classes and flagged as either remnant, recoverable or non-recoverable. These vegetation data were then intersected with the 403 distinct sub-bioregions mapped under: Department of Sustainability, Environment, Water, Population and Communities. 2004. Interim biogeographic regionalisation for Australia (IBRA), version 6.1 (Sub-regions). Australian government, Canberra.
The result was a map covering Australia for 5,914 proxy ecosystems sorted into remnant, recoverable or non-recoverable.
Quantifying gaps
Ecosystems of less than 10 hectares were discarded as likely to comprise slivers or artefacts.
To assess gaps, the spatial data for these proxy ecosystems was intersected spatially with the National Reserve System spatial data from CAPAD 2008 in Department of Sustainability, Environment, Water, Population and Communities (2010), cited above.
The minimum standard was 15 per cent of the original total area within highly protected areas (IUCN I–II), with thresholds for small ecosystem areas as follows. If the original total area of the ecosystem was below 1000 hectares, the target was set to 100 per cent; and if 15 per cent of the ecosystem was below 1000 hectares, the target was set to a minimum 1000 hectares.
34 Anon. 2010. Bourke residents gutted by Toorale sale. Sydney Morning Herald, Fairfax Press, Sydney, 11 Sept 2010.
35 Bligh, A. 2008. Witches Falls’ 100th Birthday; National park area increase commitment. Transcript of speech 28 March 2008 by The Hon. Anna Bligh MP, Premier of Queensland, Queensland government, Brisbane.
36 Accad, A, et al. 2008. Remnant vegetation in Queensland. Analysis of remnant vegetation 1997-1999-2000-2001-2003-2005, including regional ecosystem information. Queensland government Environmental Protection Agency, Brisbane.
37 ibid.
38 Report Indicator 8 in: Planning Commission. 2009. State of the environment Tasmania 2009. Tasmanian government, Hobart. Webpage http://soer.justice.tas.gov.au/2009/nat/4/issue/46/index.php accessed 1 Mar 2011.
39 Department of Environment and Conservation. 2009. CAR reserve analysis. Government of Western Australia, Perth.
40 Department of Sustainability, Environment, Water, Population and Communities (2011), cited above, p223.
Endnotes

91WWF Building Nature’s Safety Net 2011 page
41 ibid. The 2008 Assessment reported low levels of attainment of the Comprehensiveness and Representativeness targets adopted in the NRS 2020 Strategy:
• Eleven (13 per cent) of the 85 bioregions reportedly had attained the Comprehensiveness target to “Include examples of at least 80 per cent of the number of regional ecosystems in each IBRA region” by 2015.
• 52 (also 15 per cent) of the 403 sub-bioregions reportedly had attained the Representativeness target to “Include examples of at least 80 per cent of the number of regional ecosystems in each IBRA subregion” by 2030.
The minimum size for an “example” of ecosystems, to count toward these targets, was not specified.
42 Only a small number of proxy ecosystems (27) were found to be lost and unrecoverable, falling within areas that have been cleared and are under highly modified land uses such as cropping, mining, and urban development. However, in total area they exceeded 42 million hectares, equivalent to over half the area of NSW.
43 As described in: Watson, J E M, et al. 2011. The capacity of Australia’s protected area system to represent threatened species. Conservation Biology 25: 324–332.
44 Watson, et al. (2011), cited above, used the same data as used here but with a higher minimum standard for protection of species distributions as follows: If the distribution was 100,000 hectares then 100 per cent should be protected. If 10 percent of the distribution was less than 100,000 hectares, then 100,000 hectares should be protected. If distribution was 1,000,000 hectares or greater, then 10 per cent should be protected.
They found that 12.6 per cent of EPBCA species had no protection at all, compared with 14 per cent lacking highly protected status in this analysis. Only 19.6 per cent met the higher standard in their study, compared with 28 per cent highly protected in this analysis. Their study also found that EPBCA species are significantly over-represented in the actual NRS compared with random reserve systems of the same total area, suggesting either that new reserves have been placed preferentially in threatened species habitats or that populations have been lost as habitat is lost or degraded outside of the reserve system.
45 Australian Biological Resources Study. 2010. Focusing on the landscape: Biodiversity in Australia’s national reserve system. Australian government, Canberra.
46 Other issues include:
• There was no comparison with random reserve systems of the same areal coverage
• Point survey data for many species are likely to be biased to the reserve system simply because it is more publicly accessible, but also because species populations are likely to have been reduced or lost outside of it
• There is likely to be a bias in the types of species or taxa groups surveyed (e.g. greater survey effort for birds)
• Point collection data are a weak indicator of actual or potential distributions of species, in the absence of habitat modelling, and this is known to strongly affect reliability of reserve selection methods
• Threatened species were not reported separately from more common, widespread species
• For effective enduring protection, the reserve system must take account for any shifts in habitats due to climate change.
Endnotes

92WWF Building Nature’s Safety Net 2011 page
47 Letter to WWF from the Queensland government Department of Environment and Resource Management, dated 3 September 2010.
48 Letter to WWF from The Northern Territory Parks Service, dated 3 June 2010.
49 Tables 4.8 and 4.9 in 2008 Terrestrial biodiversity assessment cited above. In contrast Tasmania reports that the numbers of state threatened species in decline went from 50 to zero in recent years in:- Department of Primary Industries, Parks, Water and Environment (DPIPWE). 2010. Annual report 2009-10. Tasmanian government, Hobart, p37.
50 Parks Victoria. 2008. State of parks 2007. Victorian Government, Melbourne, p52.
51 Department of Conservation and Land Management. 2011. Silky Eremophila. Western Australian Government, Perth. Portable Document Format file http://www.dec.wa.gov.au/pdf/plants_animals/threatened_species/tec/posters/9silkerm.pdf accessed 1 Mar 2011.
52 Australian government. 2008. Approved conservation advice for Eucalyptus conglomerata (Swamp Stringybark). Australian government, Canberra. Portable Document Format file http://www.environment.gov.au/biodiversity/threatened/species/pubs/3160-conservation-advice.pdf accessed 1 Mar 2011.
53 WWF-Australia. 2011. Carnaby’s Black Cockatoo fact sheet. WWF-Australia, Sydney. Webpage http://wwf.org.au/publications/carnabys-black-cockatoo-fact-sheet/ accessed 1 Mar 2011.
54 Ball, I R, Possingham, H P and M Watts. 2009. Marxan and relatives: software for spatial conservation prioritisation. In: Moilanen, A, Wilson, K A and H P Possingham. (eds), Spatial conservation prioritisation: quantitative methods and computational tools. Oxford University Press, Oxford, UK, pp185–195.
55 Margules, C R and Pressey, R L. 2000. Systematic conservation planning. Nature 405: 243–253.
Possingham, H P, Ball, I R and S Andelman. 2000. Mathematical methods for identifying representative reserve networks. In: Ferson, S and Burgman, M. (eds), Quantitative Methods for Conservation Biology, Springer, New York, pp 291–305.
56 Fernandes, L, et al. 2005. Establishing representative no-take areas in the Great Barrier Reef: large-scale implementation of theory on marine protected areas. Conservation Biology 19: 1733–1744.
57 WWF-Australia 2011. Southwest ecoregion initiative. WWF-Australia, Sydney. Website http://www.swaecoregion.org/ accessed 28 May 2011.
58 For bioregional spatial boundaries we used: Department of Sustainability, Environment, Water, Population and Communities (2004), cited above. Spatial database, last revised December 2004. Reproduced under non-commercial license to WWF-Australia.
59 Garrett, P. 2008. Australia’s national reserve system — conserving our country for future generations. Media Release 2 June 2008, Minister for the Environment, Heritage and the Arts, Australian government, Canberra.
Australian Labor Party, 2007. Federal Labor to create up to 300 rangers as part of indigenous economic development strategy. Media release 5 October 2007.
60 Australian government. 2010b. Caring for our country 2008–2009 report card: national reserve system. Australian government, Canberra. Webpage http://www.nrm.gov.au/me/report-cards/2008-09/npa/nrs.html accessed 1 Mar 2011.
61 We assumed government pays 75 per cent of an average purchase price of $75 per hectare (Lines 2 and 3 of Table 4). Over 42 million hectares, this averages approximately $2.4 billion in 2009 dollars or $240 million annually over a decade.
Endnotes

93WWF Building Nature’s Safety Net 2011 page
62 Turnbull, M, 2007. Wildlife sanctuary in honour of Steve Irwin. Media release 22 July 2007, Minister for the Environment and Water Resources, Australian government, Canberra.
63 Garrett, P. 2010. A healthy environment: election 2010. Australian Labor Party, Canberra.
64 Prof Jon Altmann (ANU) quoted in Anon. 2007. Government urged to create park ranger jobs for aborigines. ABC News, 14 Sept 2007.
65 Australian government. 2011. Caring for our country environmental stewardship program. Australian government, Canberra. Webpage, http://www.nrm.gov.au/business-plan/10-11/priorities/biodiversity/esp/index.html accessed 1 Mar 2011.
66 Such ambiguities include:
• The answer before the table is ambiguous (i.e. “spending and total covenant area in each state and territory....”)
• The Victorian expenditure, the major part of the total amount spent on covenants “includes CFOC funding provided to NRM organisations for developing management plans for new acquisitions” . It is not clear what this has to do with covenants
• The Victorian example also includes funding approved for NRM agencies etc, but does not indicate whether it had actually been spent on delivery, nor how much of this total figure it comprised
• Question 2 is ambiguous and the answers also ambiguous. For example, if a CFOC bid for regional fox control in a catchment included work on a number of pre-existing conservation covenants (as per definition in Question 1), this would presumable count towards the area and dollars
• There is no definition of the qualifying factors in assessing which covenants were and were not considered to be part of the NRS.
67 Queensland, for example, offers land tax rebates for freehold Nature Refuges for which land taxes are payable. Some local governments also have their own covenanting programs, which may involve rate rebates. See: Coggan, A and Whitten, S M. 2008. Best practice mechanism design: Concepts and case studies for biodiversity. Final Report for the Australian government Department of Environment, Water, Heritage and the Arts, CSIRO Sustainable Ecosystems, Canberra.
68 The Nature Conservancy. 2008. Submission by The Nature Conservancy, Australia, to the Review Process for “Australia’s Future Tax System”. Portable Document Format file http://taxreview.treasury.gov.au/content/submissions/pre_14_november_2008/the_nature_conservancy.pdf accessed 7 April 2011.
69 Watson, J E M, et al. 2011. The capacity of Australia’s protected area system to represent threatened species. Conservation Biology 25: 324–332.
70 Australian government. 2010c. Caring for our country business plan 2010–11. Australian government, Canberra.
71 Department of Climate Change and Energy Efficiency. 2010. Design of the carbon farming initiative: consultation paper. Australian government, Canberra.
72 Fensham, R J and Guymer, G P. 2008. Carbon accumulation through ecosystem recovery. Environmental Science & Policy 12: 367-372.
73 Watts, M E, et al. 2009. Marxan with zones: software for optimal conservation based land- and sea-use zoning. Environmental Modelling & Software. doi:10.1016/j.envsoft.2009.06.005
Endnotes

94WWF Building Nature’s Safety Net 2011 page
74 Araújo, M B, et al. 2004. Would climate change drive species out of reserves? An assessment of existing reserve-selection methods. Global Change Biology 10: 1618–1626.
Pyke, C R and Fischer, D T. 2005. Selection of bioclimatically representative biological reserve systems under climate change. Biological Conservation 121: 429–441.
Hannah, L, et al. 2007. Protected area needs in a changing climate. Frontiers in Ecology and the Environment 5: 131–138.
Pressey, R L, et al. 2007. Conservation planning in a changing world. Trends in Ecology & Evolution 22: 583–592.
75 Garrett (2010), cited above.
Burke, T. 2011. National wildlife corridors plan advisory group. Media release 12 April 2011, Minister for Sustainability, Environment, Water, Population and Communities, Australian government, Canberra.
76 Sattler, P. 2007. Directions for the NRS in the context of climate change. In: Taylor, M F J and Figgis, P. (eds), Protected areas: Buffering nature against climate change. Proceedings of a WWF and IUCN World Commission on protected areas symposium, 18–19 June 2007, Canberra. WWF-Australia, Sydney, pp117–127.
77 Taylor, M F J, et al. 2011. What works for threatened species recovery? An empirical evaluation for Australia. Biodiversity and Conservation 20: 767–777.
78 Stolton and Dudley (2010), cited above.
79 Dudley (2008), cited above.
80 Readfern, G. 2011. Are our national parks barking up the wrong tree? ABC Environment News, 28 Jan 2011. Webpage http://www.abc.net.au/environment/articles/2011/01/28//3124205.htm accessed 1 May 2011.
Connor, S. 2004. World’s wildlife parks are in the wrong places for 800 endangered animal species. The Independent, UK, 8 Apr 2004. Webpage http://www.independent.co.uk/environment/worlds-wildlife-parks-are-in-the-wrong-places-for-800-endangered-animal-species-559301.html accessed 1 May 2011.
See also overview and recommendations (pp 1–13) in: Taylor, M F J and Figgis, P. (eds). 2007. Protected areas: buffering nature against climate change. Proceedings of a WWF and IUCN World Commission on protected areas symposium, 18-19 June 2007, Canberra. WWF-Australia, Sydney.
81 Taylor, et al. (2011) cited above.
82 Greve, M, et al. 2011. The ecological effectiveness of protected areas: a case study for South African birds. Animal Conservation. doi: 10.1111/j.1469-1795.2010.00429.x
83 Leverington, F, et al. 2011. A global analysis of protected area management effectiveness. Environmental Management. doi: 10.1007/s00267-010-9564-5
84 Nellemann, C, et al. (eds). 2009. Blue carbon: the role of healthy oceans in binding carbon. GRID-Arendal/United Nations Environment Programme. Portable Format Document file http://www.grida.no/publications/rr/blue-carbon/ accessed 1 Mar 2011.
85 McCook, L J, et al. 2010. Adaptive management of the Great Barrier Reef: A globally significant demonstration of the benefits of networks of marine reserves. PNAS 107:18278-18285.
86 ibid.
87 The Ecology Centre. 2005. Scientific principles for design of marine protected areas in Australia: a guidance statement. The University of Queensland, Brisbane. Webpage http://www.uq.edu.au/ecology/index.html?page=102441&pid=108450 accessed 1 Mar 2011.
Endnotes

95WWF Building Nature’s Safety Net 2011 page
88 ANZECC Task Force on Marine Protected Areas. 1998. Guidelines for Establishing the National Representative System of Marine Protected Areas. Australian government, Canberra.
89 The Ecology Centre. 2009. Systematic conservation planning: A network of marine sanctuaries. The University of Queensland, Brisbane.
90 Beaver and Llewellyn (2009), cited above.
91 Gibson, L E and Wellbelove, A P. 2010. Protecting critical marine habitats: The key to conserving our threatened marine species. Humane Society International and WWF-Australia, Sydney.
92 Garrett (2010), cited above.
93 Based on provincial bioregions spatial data from: Department of Sustainability, Environment, Water, Population and Communities. 2006. A Guide to the integrated marine and coastal regionalisation of Australia (IMCRA) version 4.0. Australian government, Canberra. Webpage http://www.environment.gov.au/coasts/mbp/imcra/index.html accessed June 2010.
94 Department of Sustainability, Environment, Water, Population and Communities. 2006. East Marine Region. Australian government, Canberra. Webpage http://www.environment.gov.au/coasts/mbp/imcra/index.html accessed 1 March 2011.
95 Successive Australian governments committed to a national network of whale and dolphin sanctuaries in 2004, 2007, and 2010.
96 Great Barrier Reef Marine Park Authority. 2003. Representative areas program zoning plan 2003. Australian government, Canberra. Webpage, http://kurrawa.gbrmpa.gov.au/corp_site/management/zoning/rap/rap/index.html accessed 1 March 2011.
97 Garrett (2010), cited above.
98 Department of Agriculture, Fisheries and Forestry. 2010. Securing our fishing future. Australian government, Canberra. Webpage http://www.daff.gov.au/fisheries/domestic/fishingfuture accessed 1 Mar 2011.
99 Department of Environment and Natural Resources. 2010. Marine parks. South Australian government, Adelaide. Webpage http://www.environment.sa.gov.au/Conservation/Coastal_Marine/Marine_Parks accessed 1 Mar 2011.
100 Auditor-General. 2011. Environmental management of marine protected areas. Victorian government, Melbourne.
101 Mittermeier, R A, et al. 1998. Biodiversity hotspots and major tropical wilderness areas: approaches to setting conservation priorities. Conservation Biology 12: 516–520.
Olson, D M and Dinerstein, E. 1998. The Global 200: A representation approach to conserving the earth’s most biologically valuable ecoregions. Conservation Biology 12: 502–515.
Myers, N, et al. 2000. Biodiversity hotspots for conservation priorities. Nature 403: 853–858.
Malcolm, et al. 2006. Global warming and extinctions of endemic species from biodiversity hotspots. Conservation Biology 20: 538–548.
102 WWF-Australia. 2011. Southwest ecoregion initiative: conservation planning project. WWF-Australia, Sydney. Webpage http://www.swaecoregion.org/conservation-planning-project accessed 28 May 2011.
Endnotes

96WWF Building Nature’s Safety Net 2011 page
103 WWF-Australia. 2011. Woodland watch. WWF-Australia, Sydney. Webpage http://wwf.org.au/ourwork/land/woodlandwatch/ accessed 1 Mar 2010.
104 Environmental Protection Authority. 2010. Revised draft environmental protection (Western Swamp Tortoise habitat) policy 2010. Western Australia government, Perth. Webpage http://www.epa.wa.gov.au/announcements/Pages/wst-epp.aspx?pageID=7&url=announcements accessed 1 May 2011.
105 Great Barrier Reef Marine Park Authority. 2009. Great Barrier Reef outlook report 2009. Australian government, Canberra. Webpage http://www.gbrmpa.gov.au/corp_site/about_us/great_barrier_reef_outlook_report accessed 1 Mar 2010.
106 ibid.
107 Gillard, J. 2011. Climate change framework announced. Media release 24 Feb 2011, Prime Minister, Australian government, Canberra.
108 Great Barrier Reef Marine Park Authority (2009), cited above.
The Banksia Environmental Foundation. 2010. Project Catalyst. Webpage http://www.banksiafdn.com/index.php?option=com_content&view=article&id=178:project-catalyst&catid=53:ancillary&Itemid=79 accessed 1 Mar 2011.
Queensland government’s Great Barrier Reef Protection Amendment Act 2009.
Wooldridge, S A. 2009. Water quality and coral bleaching thresholds: Formalising the linkage for the inshore reefs of the Great Barrier Reef, Australia. Marine Pollution Bulletin 58: 745–751.
109 Prosser, I. P. et al. 2002. Regional patterns of erosion and sediment transport in the Burdekin River catchment. CSIRO Land and Water Technical Report 5/02, Feb 2002, CSIRO Land and Water, Canberra.
110 Gibson and Wellbelove (2010), cited above.
111 Spatial data from: Bureau of Agricultural and Resource Economics and Sciences. 2010. Land use of Australia, Version 3 — 2001/2002. Australian government, Canberra. Database http://adl.brs.gov.au/mapserv/landuse/index.cfm?fa=app.loaddata&tab=loaddata accessed 1 May 2010.
112 Williams, J E and Price, R J. 2010. Impacts of red meat production on biodiversity in Australia: a review and comparison with alternative protein production industries. Animal Production Science 50: 723–747.
113 Johnson, C N, Isaac, J L and D O Fisher. 2007. Rarity of a top predator triggers continent-wide collapse of mammal prey: Dingoes and marsupials in Australia. Proceedings of the Royal Society B 274: 341–346.
114 Australian Bureau of Statistics. 2010. Yearbook of Australia, 2009–10. Australian government, Canberra. Webpage http://www.abs.gov.au/ausstats/[email protected]/39433889d406eeb9ca2570610019e9a5/756B638E3405C430CA25773700169CB8 accessed 1 Mar 2010, shows broadacre farms ran at a loss since 2005, where capital appreciation as the only offset.
115 World Wildlife Fund. 2010. Global conference on sustainable beef. World Wildlife Fund, Washington DC, USA. Website http://www.sustainablelivestock.org/ accessed 1 May 2011.
116 Holmes, J. 2009. The multifunctional transition in Australia’s tropical savannas: the emergence of consumption, protection and indigenous values. Geographical Research 629: 265–280.
117 Bligh (2008), cited above.
Endnotes

97WWF Building Nature’s Safety Net 2011 page
118 Department of Environment and Resource Management. 2010a. North Stradbroke Island strategy. Queensland government, Brisbane. Webpage http://www.derm.qld.gov.au/stradbroke/ accessed 1 Mar 2011.
119 Department of Environment and Resource Management. 2010b. Protected area gazettals update. Queensland government, Brisbane. Webpage http://derm.qld.gov.au/parks_and_forests/managing_parks_and_forests/forest_transfer_processes_in_queensland/south_east_queensland_forests_agreement_seqfa/protected_area_gazettals_update.html accessed 1 Mar 2011.
120 Department of Environment and Resource Management. 2010. Building nature’s resilience: A draft biodiversity strategy for Queensland. Queensland government, Brisbane.
121 Bligh, A and McNamara, A. 2008. Moreton Bay protected for the future. Media Release 19 October 2008, Premier and Minister for Sustainability, Climate Change and Innovation, Queensland government, Brisbane.
122 Sattler, P. 2003. Treasures for humanity. A gift to the people of Queensland to celebrate its national park centenary 2008. WWF-Australia, Sydney.
Taylor, M F J, et al. 2009. 20 million hectares by 2020: protected areas, green infrastructure and green jobs for Queensland. A WWF-Telstra Building Nature’s Safety Net Report. WWF-Australia, Sydney.
123 Healthy Waterways partnership. 2010. Healthy waterways: Moreton Bay catchments report card. Healthy Waterways partnership, Brisbane. Webpage http://www.healthywaterways.org/EcosystemHealthMonitoringProgram/2010ReportCardResults/CatchmentResults/MoretonBayCatchments.aspx accessed 1 Mar 2011.
124 Queensland government. 2011. Reefwise farming. Queensland government, Brisbane. Website http://www.reefwisefarming.qld.gov.au/ accessed 1 Mar 2011.
125 Department of Environment and Resource Management (2010c), cited above.
126 Lardil claim over Wellesley Islands sea country and Blue Mud Bay Native title determinations. The Blue Mud Bay decision was challenged and upheld on appeal.
National Native Title Tribunal. 2005. Traditional rights recognised for the land and sea in Arnhem Land. Australian government, Canberra. Webpage http://www.nntt.gov.au/news-and-communications/media-releases/pages/traditional_rights_recognised_for_the_la.aspx accessed 1 March 2011.
National Native Title Tribunal. 2004. Native title found to exist over sea areas in Gulf of Carpentaria. Australian government, Canberra. Webpage http://www.nntt.gov.au/news-and-communications/media-releases/pages/native_title_found_to_exist_over_sea_are.aspx accessed 1 Mar 2011.
127 Sartor, F. 2010. NSW government approves key NRC recommendations. Media Release 2 Mar 2010, Minister for Climate Change and the Environment, NSW government, Sydney.
128 Garrett (2010), cited above.
129 Department of Natural Resources, Environment, The Arts and Sport. 2011. Territory Eco-link. Northern Territory government, Palmerston. Webpage http://www.nt.gov.au/nreta/parks/ecolink/ accessed 15 April 2011.
130 Fitzsimons, J, et al. 2010. Into oblivion? The Disappearing Native Mammals of Northern Australia. The Nature Conservancy, Melbourne.
Endnotes

98WWF Building Nature’s Safety Net 2011 page
Endnotes
131 Roy Morgan Research. 2010. Regional profile report — June 2010 — Darwin. Northern Territory government, Palmerston. PowerPoint presentation http://www.tourismnt.com.au/Portals/3/docs/research/Darwin%20Regional%20Report%20June%202010.ppt accessed 1 Mar 2011.
132 Tourism NT. 2010. Snapshots: Quicks stats. Report period: Year ending June 2010. Northern Territory government, Palmerston. Portable Document Format file http://www.tourismnt.com.au/Portals/3/docs/research/Quick_Stats_YE%20Jun%2010_v2.pdf accessed 1 Mar 2011.
Domestic tourists spent $1.25 billion in 2009–10, and international visitors spent $0.4 billion, representing a decline most likely due to the Global Financial Crisis.
According to NT Tourism statistics provided to WWF, 79 per cent of international visitors in 2008 put visiting parks as a primary reason for their visit and 44 per cent of interstate visits.
Therefore $866 million ($1.25 billion x 0.44 + $0.4 billion x 0.79) was spent by visitors whose primary purpose was visiting a nature reserve or park.
Parks tourists spending is $866 million, therefore, the 10 per cent GST would be $87 million.
133 Table 7 in Sattler and Taylor (2008), cited above.
134 Blanch, S. 2007. Northern Australia’s tropical savannas and rivers: Building climate resilience into globally significant assets. In: Taylor, M, and Figgis, P. (eds). 2007. Protected Areas: Buffering Nature Against Climate Change. Proceedings of a WWF and IUCN World Commission on Protected Areas Symposium, 18–19 June 2007, Canberra. WWF Australia, Sydney.
135 Department of Natural Resources, Environment, The Arts and Sport. 2010. Conservation planning: Developing a NT marine protected areas strategy. Northern Territory government, Palmerston. Webpage http://www.nt.gov.au/nreta/wildlife/marine/planning.html accessed 1 Mar 2011.
136 Goldrick, C. 2010. Tasmania’s veiled beauty. Australian Geographic, 29 June 2010.
137 Sattler and Taylor (2008), cited above. Table 7 shows an annual acquisitions budget of $2 million from 2003/4 to 2006/7.
138 Jennings, G. 2009. Certainty for Victoria’s River Red Gum forests. Media release 11 March 2009, Minister for Environment and Climate Change, Victorian government, Melbourne.
139 Department of Sustainability and Environment. 2010. Protecting East Gippsland old-growth and iconic forests. Victorian government, Melbourne. Portable Document Format file http://www.dse.vic.gov.au/CA256F310024B628/0/A41496EA92AE504ECA25767A0014A58E/$File/East+Gippsland+Photo+Gallery.pdf accessed 19 Apr 2011.
140 Gavin Jennings, G. 2008. Protection for Cobboboonee Forest enshrined in law. Media release 12 Sept 2008, Minister for the Environment, Climate Change and Innovation, Victorian Government, Melbourne.
141 Department of Sustainability and Environment. 2011. Delivering Melbourne’s newest sustainable communities — The Melbourne strategic assessment. Victorian government, Melbourne. Portable Document Format file http://www.dse.vic.gov.au/DSE/nrenlwm.nsf/fid/6F95F3AECAD2D4D7CA2577B500830DDC accessed 19 Apr 2011.

99WWF Building Nature’s Safety Net 2011 page
Endnotes
142 Burke, T. 2011. Statement from the Environment Minister regarding cattle grazing. Media release 12 April 2011, Minister for Sustainability, Environment, Water, Population and Communities, Australian government, Canberra.
143 Department of Environment and Conservation. 2008. Annual report 2007–8. Government of Western Australia, Perth.
Department of Environment and Conservation. 2009. Annual report 2008–9. Government of Western Australia, Perth.
Department of Environment and Conservation. 2010. Annual report 2009–10. Government of Western Australia, Perth.
144 Department of Environment and Conservation. 2010. Proposed Camden Sound marine park. Government of Western Australia, Perth. Webpage http://www.dec.wa.gov.au/content/view/5665/1623/ accessed 1 Mar 2011.
Department of Environment and Conservation (2008, 2009, and 2010), cited above.
145 WWF-Australia. 2011. Southwest Ecoregion Initiative: Conservation planning project. WWF-Australia, Sydney. Webpage http://www.swaecoregion.org/conservation-planning-project accessed 28 May 2011.

100WWF Building Nature’s Safety Net 2011 page
Appendix
APPENDIx: BuILDING NATuRE’S SAFETy NET 2011 SAMPLE PROTECTED AREAS SuRvEyQueensland Survey
Respondent(s)
What is your email? (NOTE: to be held in confidence)
Which department and division/section/branch do you represent?
SECT 1. TERRESTRIAL PROTECTED AREAS MANAGEMENT INvESTMENTS AND STANDARDS1.1: INVESTMENTS IN MANAGEMENT OF TERRESTRIAL PROTECTED AREAS
Please tabulate total contribution by the state government to management of both government and non-government terrestrial protected areas in each of the financial years 2007-8 and 2008-9.
IMPORTANT NOTE: Protected area for the purpose of this survey, means a specific area of land or sea dedicated to the protection and maintenance of biological diversity, and of natural and associated cultural resources, secured for at least 99 years through legal or other effective means. This definition is drawn from both the IUCN definition and the National Reserve System inclusion criteria.
2007-8 2008-9
A) Total investments ($1000s) in management of, or threat abatement on government terrestrial protected areas
B) Total area (ha) of all government terrestrial protected areas (ha)
C)Total assistance ($1000s) provided by the government for management of, or threat abatement on non-government protected areas including private land covenants
D) Total area (ha) of non-government protected areas where these management investments were applied (NOTE: this is the total area of all non-government protected areas in which government incentives or grants were invested, NOT the combined footprint of the management projects themselves)

101WWF Building Nature’s Safety Net 2011 page
Appendix
1.2: STANDARD OF MANAGEMENT OF TERRESTRIAL PROTECTED AREAS – OVERALL RANK
For each terrestrial IBRA bioregion, the 2002 Terrestrial Biodiversity Assessment (“TBA”) reported Standard of Management on a simple four level rank scale.
These ranks and the associated comments are shown after the bioregion names in the table below. Please reevaluate that rank for 2008 in the table below. NOTE: A choice is required for each bioregion.
The four Standard of Management levels are:
– VERY GOOD: High proportion of reserves in bioregion have management plans, ecological monitoring programs in place and key biodiversity issues are being addressed
– GOOD: All major biodiversity issues effectively managed across high proportion of reserves in bioregion
– FAIR: Biodiversity values and or management issues are poorly identified and resource degradation is occurring though still retrievable in significant portion of reserves in the bioregion
– POOR: Threatening processes are not managed and leading to permanent resource degradation in significant portion of reserves in the bioregion.
Bioregion VERY GOOD
GOOD FAIR POOR NO DATA
BBN - Brigalow Belt North (2002 RANK- FAIR, COMMENT- none)
BBS - Brigalow Belt South (FAIR, no comment)
CHC - Channel Country (FAIR, no comment)
CMC - Central Mackay Coast (GOOD, no comment)
CYP - Cape York Peninsula (POOR, no comment)
DEU - Desert Uplands (FAIR, no comment)
DRP - Darling Riverine Plains (POOR, no comment)
EIU - Einasleigh Uplands (FAIR, no comment)
GUP - Gulf Plains (FAIR, no comment)
MGD - Mitchell Grass Downs (FAIR, no comment)
MII - Mount Isa Inlier (FAIR, no comment)
ML - Mulga Lands (FAIR, no comment)
NAN - Nandewar (FAIR, no comment)
NET - New England Tableland (POOR, Fragmentation, off reserve impacts)
NNC - NSW North Coast (FAIR, no comment)
SEQ - South Eastern Queensland (FAIR, no comment)
WT - Wet Tropics (POOR, no comment)

102WWF Building Nature’s Safety Net 2011 page
Appendix
1.3: STANDARD OF RESERVE MANAGEMENT – SPECIFIC THREATS
For each terrestrial IBRA bioregion, please indicate which of the following threats require significantly more effort to manage effectively.
Bio-region
Visitor impacts
Neighbour impacts
Exotic animals
Live-stock
Weeds Inapprop. fire
Altered hydrology
Fragment-ation
Climate change
Other (see 1.4)
BBN
BBS
CHC
CMC
CYP
DEU
DRP
EIU
GUP
MGD
MII
ML
NAN
NET
NNC
SEQ
WT
1.4: STANDARD OF TERRESTRIAL PROTECTED AREA MANAGEMENT – COMMENTS
Please provide any additional information on: – other threats requiring significantly more effort to manage effectively – any other comments to explain the new rank for standard of management in Q 1.2.

103WWF Building Nature’s Safety Net 2011 page
Appendix
Bioregion Comments
BBN
BBS
CHC
CMC
CYP
DEU
DRP
EIU
GUP
MGD
MII
ML
NAN
NET
NNC
SEQ
WT
SECT 2. MARINE PROTECTED AREAS MANAGEMENT INvESTMENTS AND STANDARDS
2.1: INVESTMENTS IN MANAGEMENT OF MARINE PROTECTED AREAS
Please tabulate total contribution by the state government to management of marine protected areas in each of the financial years 2007-8 and 2008-9.
2007–8 2008–9
A) Total investments ($1000s) in management of or threat abatement in marine protected areas
B) Total area (ha) of all marine protected areas

104WWF Building Nature’s Safety Net 2011 page
Appendix
2.2: STANDARD OF MARINE PROTECTED AREA MANAGEMENT – OVERALL RANK
Please tabulate for each marine IMCRA4 meso-scale bioregion the overall rank standard of management in 2008. The four levels are:
– VERY GOOD: High proportion of reserves in bioregion have management plans, ecological monitoring programs in place and key biodiversity issues are being addressed
– GOOD: All major biodiversity issues effectively managed across high proportion of reserves in bioregion
– FAIR: Biodiversity values and or management issues are poorly identified and resource degradation is occurring though still retrievable in significant portion of reserves in the bioregion
– POOR: Threatening processes are not managed and leading to permanent resource degradation in significant portion of reserves in the bioregion.
Bioregion VERY GOOD
GOOD FAIR POOR NO DATA
Central Reef
East Cape York
Karumba-Nassau
Lucinda-Mackay Coast
Mackay-Capricorn
Pompey-Swains
Ribbons
Shoalwater Coast
Torres Strait
Tweed-Moreton
Wellesley
West Cape York
Wet Tropic Coast

105WWF Building Nature’s Safety Net 2011 page
Appendix
2.3: STANDARD OF MARINE PROTECTED AREA MANAGEMENT – SPECIFIC THREATS
For each IMCRA4 bioregion, please also indicate which of the specific threats require significantly more effort to manage effectively.
Bioregion Visitors Boating Non-comm-ercial take
Comm-ercial
take
Sediment inflow
Other pollution
Exotic species
Climate change
Other (see 2.4)
Central Reef
East Cape York
Karumba-Nassau
Lucinda-Mackay Coast
Mackay-Capricorn
Pompey-Swains
Ribbons
Shoalwater Coast
Torres Strait
Tweed-Moreton
Wellesley
West Cape York
Wet Tropic Coast

106WWF Building Nature’s Safety Net 2011 page
Appendix
2.4: STANDARD OF MARINE PROTECTED AREA MANAGEMENT – COMMENTS
Please provide any additional information on: – other threats requiring significantly more effort to manage effectively – any other comments to explain the rank for standard of management in Q 2.2.
Bioregion Comments
Central Reef
East Cape York
Karumba-Nassau
Lucinda-Mackay Coast
Mackay-Capricorn
Pompey-Swains
Ribbons
Shoalwater Coast
Torres Strait
Tweed-Moreton
Wellesley
West Cape York
Wet Tropic Coast
SECT 3. TERRESTRIAL PROTECTED AREAS ACquISITION AND PLANNING 3.1: CRITICAL HABITATS INCLUDED IN RESERVES
The terrestrial NRS Strategy 2009-2030 has a new target for threatened/priority species:
Include critical habitats and core areas important for the long-term survival of rare, migratory, threatened or other priority species and ecological communities, including those listed under Commonwealth, state or territory legislation in each IBRA bioregion (All jurisdictions by 2030)
What numbers and proportions of animals and plant species listed as threatened under state law, but EXCLUDING those species listed under the Commonwealth Environmental Protection and Biodiversity Conservation Act (EPBCA, for which we have done a separate analysis), have zero or negligible areas of critical habitats inside a terrestrial Queensland protected area?
NOTE: Critical habitat is taken to mean any areas critical to the long-term persistence of the species, and without protection of which the species will remain endangered or vulnerable to extinction.

107WWF Building Nature’s Safety Net 2011 page
Appendix
Number of species on state threatened species list EXCLUDING species also on the national EPBCA list
Percent of these species with zero/ negligible critical habitat in protected areas
animal species
plant species
3.2: INVESTMENTS IN TERRESTRIAL RESERVE ACQUISITIONS
Please tabulate total expenditures in each of the financial years 2007-8 and 2008-9 on acquisition and management establishment of all NEW state government terrestrial protected areas, whether for purchases of title or other rights, infrastructure or other establishment costs other than for ongoing management.
2007-8 2008-9
Total investment ($1000s) in acquisition
Total investment ($1000s) in management establishment
Total area (ha) added to the protected area estate
3.3: TOP RESERVE NOMINATION
Please nominate a new Queensland protected area that was added to the National Reserve System in the period 2006–2008 which best exemplifies NRS priorities, and a description of how it best exemplifies NRS priorities.

108WWF Building Nature’s Safety Net 2011 page
Appendix
SECT 4. MARINE PROTECTED AREAS PLANNING AND ESTABLIShMENT4.1: INVESTMENTS IN MARINE PROTECTED AREA ESTABLISHMENT
Please tabulate total expenditures in each of the financial years 2007-8 and 2008-9 on establishment of all NEW state government marine protected areas, whether for retirement of rights, infrastructure or other establishment costs other than for ongoing management; as well as the areas added to the marine protected area system.
2007-8 2008-9
Total investment ($1000s) in MPA establishment
Total area (ha) added to the marine protected area estate
4.2: TOP MPA NOMINATION
Please nominate a new marine protected area that was added to the National Representative System of Marine Protected Areas (NRSMPA) in the period 2006-2008 which best exemplifies NRSMPA priorities, and a description of how it best exemplifies NRSMPA priorities.


Building Nature’s Safety Net 2011
WWF.ORG.Au• BuILDING NATuRE’S SAFETy NET REPORT 2011
GREAT BARRIER REEFWWF has helped secure new highly protected
areas that help recovery of fish populations and which build the resilience of the reef system.
EARTh hOuREarth Hour was co-founded by WWF-Australia and has evolved into one of the most recognised campaigns in history.
NINGALOOWWF has played a pivotal
role in securing sanctuaries within Ningaloo waters.
ANTARCTICA & ThE SOuThERN OCEAN
WWF continues to promote sustainable fisheries and to protect seabirds from
fishing and pest animals.
LANDCLEARINGWWF has campaigned alongside farmers, industry, Indigenous communities and local and state governments to help see broadscale clearing of remnant bushland in Queensland significantly reduced.
SOuThWEST AuSTRALIA ECOREGIONWWF helped to ensure that some 5,000 hectares of globally important, privately-owned bushland in WA’s wheatbelt is protected.
Why we are here
wwf.org.au
To stop the degradation of the planet’s natural environment andto build a future in which humans live in harmony with nature.
©1986 Panda symbol WWF ® WWF is a registered trademark
WWF-Australia National Office
Level 13, 235 Jones Street,Ultimo NSW 2007GPO Box 528 Sydney NSW 2001
Tel: 61 2 9281 5515Freecall: 1800 032 551Fax: 61 2 9281 1060Email: [email protected]


![[Fitzsimons] Nonconscious Influences on Consumer C](https://static.fdocuments.us/doc/165x107/54615686af79593a708b59b0/fitzsimons-nonconscious-influences-on-consumer-c.jpg)

