WWE Q4 AND FULL YEAR 2016 RESULTS FEBRUARY 9,...
17
WWE Q4 AND FULL YEAR 2016 RESULTS – FEBRUARY 9, 2017
Transcript of WWE Q4 AND FULL YEAR 2016 RESULTS FEBRUARY 9,...

W W E Q 4 A N D F U L L Y E A R 2 0 1 6 R E S U LT S – F E B R U A R Y 9 , 2 0 1 7

This presentation contains forward-looking statements pursuant to the safe harbor provisions of the Securities Litigation Reform Act of 1995, which are subject to
various risks and uncertainties. These risks and uncertainties include, without limitation, risks relating to: WWE Network (including the risk that we are unable to
attract, retain and renew subscribers); major distribution agreements; our need to continue to develop creative and entertaining programs and events; the
possibility of a decline in the popularity of our brand of sports entertainment; the continued importance of key performers and the services of Vincent K. McMahon;
possible adverse changes in the regulatory atmosphere and related private sector initiatives; the highly competitive, rapidly changing and increasingly fragmented
nature of the markets in which we operate and greater financial resources or marketplace presence of many of our competitors; uncertainties associated with
international markets; our difficulty or inability to promote and conduct our live events and/or other businesses if we do not comply with applicable regulations; our
dependence on our intellectual property rights, our need to protect those rights, and the risks of our infringement of others’ intellectual property rights; the
complexity of our rights agreements across distribution mechanisms and geographical areas; potential substantial liability in the event of accidents or injuries
occurring during our physically demanding events including, without limitation, claims relating to CTE; large public events as well as travel to and from such events;
our feature film business; our expansion into new or complementary businesses and/or strategic investments; our computer systems and online operations; privacy
norms and regulations; a possible decline in general economic conditions and disruption in financial markets; our accounts receivable; our indebtedness; litigation;
our potential failure to meet market expectations for our financial performance, which could adversely affect our stock; Vincent K. McMahon exercises control over
our affairs, and his interests may conflict with the holders of our Class A common stock; a substantial number of shares are eligible for sale by the McMahons and
the sale, or the perception of possible sales, of those shares could lower our stock price; and the relatively small public “float” of our Class A common stock. In
addition, our dividend is dependent on a number of factors, including, among other things, our liquidity and historical and projected cash flow, strategic plan
(including alternative uses of capital), our financial results and condition, contractual and legal restrictions on the payment of dividends (including under our
revolving credit facility), general economic and competitive conditions and such other factors as our Board of Directors may consider relevant. Forward-looking
statements made by the Company speak only as of the date made and are subject to change without any obligation on the part of the Company to update or revise
them. Undue reliance should not be placed on these statements. For more information about risks and uncertainties associated with the Company’s business,
please refer to the “Management’s Discussion and Analysis of Financial Condition and Results of Operations” and “Risk Factors” sections of the Company’s SEC
filings, including, but not limited to, our annual report on Form 10-K and quarterly reports on Form 10-Q.
This presentation contains non-GAAP financial information, including OIBDA. We define OIBDA as operating income before depreciation and amortization,
excluding feature film and television production amortization and related impairments. OIBDA is a non-GAAP financial measure and may be different than similarly-
titled non-GAAP financial measures used by other companies. A limitation of OIBDA is that it excludes depreciation and amortization, which represents the periodic
charge for certain fixed assets and intangible assets used in generating revenues for the Company's business. OIBDA should not be regarded as an alternative to
operating income or net income as an indicator of operating performance, or to the statement of cash flows as a measure of liquidity, nor should it be considered in
isolation or as a substitute for financial measures prepared in accordance with GAAP. We believe that operating income is the most directly comparable GAAP
financial measure to OIBDA. Reconciliations of OIBDA to operating income can be found in the Company’s earnings release dated February 9, 2017.
Forward-Looking Statements
2

2016 – Highlights of Another Record Breaking Year
Revenue of $729M - highest in WWE history with record performance across multiple businesssegments; International revenue +11% to a record $189M
To super-serve WWE Network subscribers with live, in-ring content began producing newseries 205 Live and held UK Championship Tournament
WWE Network subscribers watched 294M hours of content (up 15% from 2015), representingan average of 194 hours per household (more than every cable network)
WWE Network average total subscribers grew to more than 1.5M in 2016, +25% from 2015
WWE content consumed on social and digital platforms increased 56% year-over-year to morethan 15.1B+ video views; Social media engagements increased 45% in 2016 to 1.1B+
WrestleMania achieved record breaking attendance, ticket sales and viewership – with101,000 fans in attendance and WWE Network reaching 1.8M total subscribers (April 4, 2016)
Strengthened the global reach of our television programs, completing distribution deals inChina, Germany, Australia and Spain
Focused on achieving 2017 financial objectives and driving long-term growth
3

In 2016, continued to focus on optimizing the value of WWE content, developing digital andtechnology platforms, and expanding our global presence
Financial results demonstrate successful ongoing transformation of WWE business model. Every day,WWE becomes more digital, global and direct-to-consumer
Achieved record revenue from majority of business segments; Increase driven by the growth of WWENetwork and higher Television rights fees
WWE Financial Highlights 2016($ in millions)
4
$658.8
2015
+11%
2016
$729.2 $55.7
$38.8
+44%
20162015
$80.1
$68.7
+17%
20162015
Revenue Operating Income Adjusted OIBDA1
1 A definition of Adjusted OIBDA and a reconciliation to Operating Income can be found in the Company’s Q4 and full year 2016 earnings materials and in the appendix to this presentation
Driving subscriber engagement, added 300+ hours of original content and 2,500+ hours of archival content toNetwork; 7,000+ hour library at year-end (4x size at Feb 2014 launch)
In 2016, Network subscribers watched a total of 294M hours of content, representing an average of 194 hoursper household which placed WWE Network among the top cable and broadcast networks
WWE Network has been the 5th largest SVOD network in the US and has 2nd highest Net Promoter Scoreamong major U.S. OTT services behind only Netflix1
WWE Network average paid subscribers increased by 24% to more than 1.4M and average total subscribersincreased by 25% to approximately 1.5M
WWE Operational Highlights 2016
5
Average Paid Subscribers (000s)
1,418
1,139
2015
+24%
2016
103122
140154
179194
206223
CBS ABC Univision TelemundoFox
News
FOX HBONBC
Viewing Hours Per Household FY 2016
WWE Network HH
Avg: 194 hours
1 Source: Parks Associates
WWE Operational Highlights 2016 (Continued)
Produced new original content for television, such asTotal Bellas, transitioned SmackDown to a live formaton USA Network
NBCU (in partnership with WWE) secured 50 newblue chip advertisers over past 2 years; Snickers willagain serve as presenting sponsor of WrestleMania(April 2, 2017)
WWE content consumed on social and digitalplatforms increased 56% to 15B+ video views; Socialmedia engagements increased 45% to 1.1B+
Continued to enhance talent development; ~40% ofrecruits from outside U.S., increasing ability to createcontent for global markets; 80%+ of active rosterSuperstars came from developmental system
WWE had second highest selling action figureproperty in the U.S. (behind only Star Wars)1
6
1 Source: NPD Retail Group

2016 Q4: Financial Highlights ($ in millions)
Revenue, Operating Income and Adjusted OIBDA growth driven by increased monetization of
content
32.9
38.6
125.0106.6
27.8
24.01.80.9
194.9
2.41.1166.2
+17%
Consumer Products Live EventsCorporate & Other WWE Studios Media
Revenue Adjusted OIBDA1
7
(55.1) (49.0)
48.1 38.6
9.7 7.9
(1.5)
7.3
13.9
(1.1)
6.2
(0.2)
-45.5-44.9
51.241.0
9.7
-0.2
7.97.3
11.16.2
20.5
-1.1
+85%
Operating Income
Q4 2015 Q4 2015Q4 2015 Q4 2016Q4 2016Q4 2016

2016 Q4: Media Division ($ in millions)
55.668.6
43.7
40.8
7.6
106.64.2
8.5
125.0+17%
2.6
TelevisionHome Entertainment Digital Media Network
Revenue Adjusted OIBDA1
8
21.0
30.6
15.0
13.7
+25% 48.1
1.91.9
0.6
38.6
2.0
23.3
31.9
15.5
15.0
51.2+25%
1.91.9
41.0
2.1 0.6
Operating Income
Q4 2015 Q4 2015Q4 2015 Q4 2016Q4 2016Q4 2016

2016 Q4: Live Events($ in millions)
Revenue Adjusted OIBDA1
9
38.6
32.9
+17%
Q4 2015 Q4 2016
6.2
7.3
Q4 2015
-15%
Q4 2016
6.2
7.3 -15%
Q4 2015 Q4 2016
Operating Income

2016 Q4: Consumer Products($ in millions)
Revenue Adjusted OIBDA
10
9.6 10.1
10.012.8
4.4
4.9
+16%
Q4 2016
27.8
Q4 2015
24.0
4.5 4.6
1.5
3.0
1.9
2.1
+23%
Q4 2016
9.7
Q4 2015
7.9
4.5 4.6
1.5
3.0
1.9
2.1
+23%
Q4 2016
9.7
Q4 2015
7.9
Operating Income
WWEShopVenue Merchandise Licensing
Capital Structure ($ in millions)
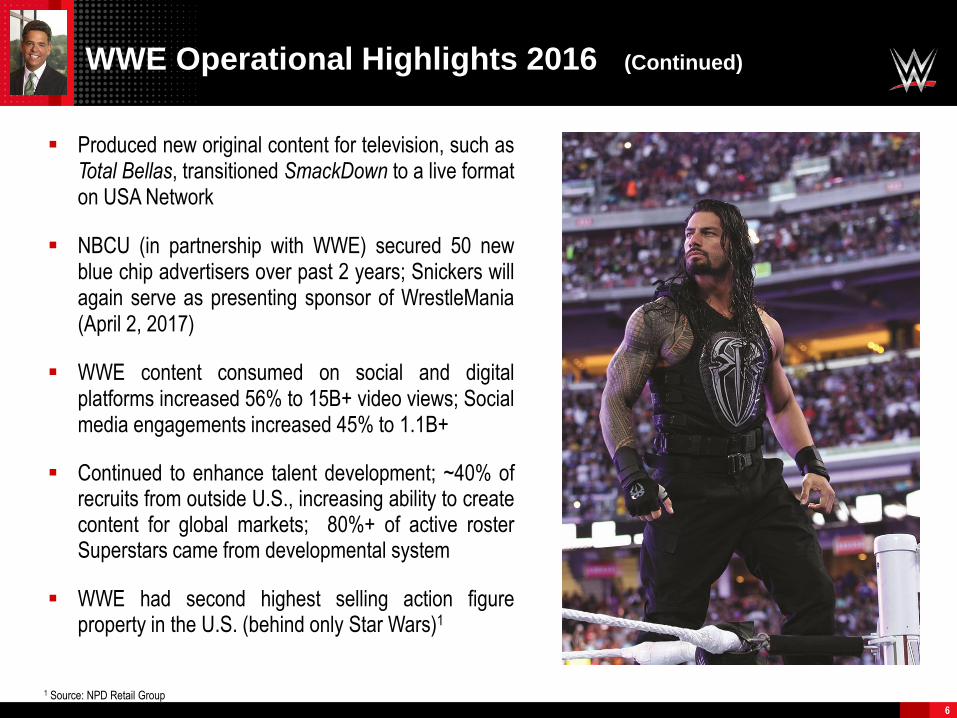
As of Dec. 31, 2016, WWE held ~$267M in cash and short-term investments reflecting financing proceeds1
WWE generated Free Cash Flow of $27M in 2016 as the impact of improved operating performance was offset by $10M rise in capex, including $5M paid as part of consideration for building/ property purchase
WWE issued $215M in convertible note financing to support the execution of its long-term growth strategy and for general corporate purposes
11
Cash & ST Investments Free Cash Flow
$267.1
$102.4
20162015
$26.7$29.5
2015 2016
-$2.8
$164.7
(1) In December 2016, the Company issued $200 million of convertible note financing, which was subsequently increased in January 2017 to $215 million through the exercise of an
over-allotment option. After consideration of all transaction fees and hedging costs, the net proceeds raised by this financing were approximately $193 million.

Q1 2017 Business Outlook
12
Project Q1 2017 Operating income of $16 to $20
million and Adjusted OIBDA1 of approximately
$23 to $27 million
Project Q1 2017 average paid subscribers to
WWE Network of 1.48 million (+/- 2%),
representing 15% increase from Q1 2016 and 5%
sequential increase from Q4 2016
Q1 2017 subscriber guidance is based on
performance in January. WWE Network had 1.5M
ending paid subscribers as of January 31, 2017
including 1.1M ending paid U.S. subs (+15% year-
over-year) and 0.4M ending paid international
subs (+27% year-over-year) …see page 13
1 A definition of Adjusted OIBDA and a reconciliation to Operating Income can be found in the Company’s Q4 and full year 2016 earnings materials and in the appendix to this presentation

1.271.50
0.19
0.18
+15%
January 31, 2017
1.68
January 31, 2016
1.46
WWE Network Ending Subscribers(January 31, 2017 vs. January 31, 2016)
13
WWE Free Video on Demand1
(in billions)
Social Media Followers2
(average, in millions)
0.961.11
0.31
0.39
+18%
January 31, 2017
1.50
January 31, 2016
1.27
Total Subscribers – Free & Paid (000s) Total Paid Subscribers – US & Int’l (000s)
International Paid Domestic PaidPaidFree
Subscriber data shown represents month-end levels (NOT averages) as of January 31, 2016 and January 31, 2017
+15%
+27%

Continuing digital and direct-to-consumertransformation
Project 2017 Operating income of $70M andAdjusted OIBDA1 record of $100M (+25% y/y)
Anticipate WWE Network subscriber growth andcontractual escalation of TV rights fees will be keydrivers of revenue and profit growth
Expect level of WWE Network subscribers willcontinue to increase, albeit at a lower rate, on ayear-over-year basis than in 2016
Plan to continue to invest in key areas to optimizelong-term performance while driving strongbottom line performance
Historically, WWE capex has averaged ~5% ofrevenue, peaking at 7%. In 2017, capex projectedto be at upper end of this range
2017 Full Year Outlook
1 The definition of Adjusted OIBDA and a Reconciliation of 2017 Operating Income to Adjusted OIBDA can be found in the Supplemental Information in the Company’s earnings
release dated October 27, 2016 located on the Company’s website at ir.corporate.wwe.com.2 The Company’s business model and expected results will continue to be subject to significant execution risks, including those risks outlined in the Company’s Form 10-K filing with
the SEC. See additional notes on page 14 of this presentation
14

A P P E N D I X

Reconciliation of Non-GAAP Measures
16
Reconciliation of Operating income to Adjusted OIBDA(1)
1. Q1 2017 and 2017 Adjusted OIBDA figures represent company guidance for the first quarter ending 3/31/17 and full year ending 12/31/17, respectively. Source: WWE Q4 2016 Earnings 02/09/2017
(www.ir.corporate.wwe.com)
2. Represents a $7.1 million non-cash loss on abandonment charge to write off the value of costs related to a media center expansion project previously delayed but later determined to be non-viable
$mm 2015 2016 Q1 2017 2017
Operating income $38.8 $55.7 $16.0 - $20.0 $70.0
Depreciation & amortization 22.8 24.4 7.0 30.0
OIBDA as reported $61.6 $80.1 $23.0 - $27.0 $100.0
Adjustments 7.1(2) - - -
Adjusted OIBDA $68.7 $80.1 $23.0 - $27.0 $100.0
Notes: Non-GAAP Measures
The definition of Adjusted OIBDA, the Reconciliation of Q4 2016, full year 2016 and Q1 2017 Operating Income to Adjusted OIBDA
can be found in the Company’s Q4 and full year 2016 earnings materials release dated February 9, 2017.
Beginning January 2016, the Company started allocating certain shared expenses between its Network and Television
segments. Management believes this allocation more accurately reflects the operations of these segments. For the fourth quarter
2016, the implementation of this allocation methodology reduced Network segment OIBDA by $3.8 million and increased Television
segment OIBDA by a corresponding $3.8 million. For the full year 2016, the implementation of this allocation methodology reduced
Network segment OIBDA by $15.4 million and increased Television segment OIBDA by a corresponding $15.4 million. The
allocation methodology had no impact on the Company’s consolidated financial statements.
The Company defines OIBDA as operating income before depreciation and amortization, excluding feature film and television
production amortization and related impairments. OIBDA is a non-GAAP financial measure and may be different than similarly-titled
non-GAAP financial measures used by other companies. A limitation of OIBDA is that it excludes depreciation and amortization,
which represents the periodic charge for certain fixed assets and intangible assets used in generating revenues for the Company's
business. OIBDA should not be regarded as an alternative to operating income or net income as an indicator of operating
performance, or to the statement of cash flows as a measure of liquidity, nor should it be considered in isolation or as a substitute for
financial measures prepared in accordance with GAAP. We believe that operating income is the most directly comparable GAAP
financial measure to OIBDA.
Adjusted OIBDA, Adjusted Operating income, Adjusted Net income and Adjusted Earnings per share exclude certain material items,
which otherwise would impact the comparability of results between periods. These should not be considered as an alternative to net
income, cash flows from operations or any other indicator of WWE's performance or liquidity, determined in accordance with U.S.
GAAP.
The Company defines Free Cash Flow as net cash provided by operating activities less cash used for capital expenditures. Although
it is not a recognized measure of liquidity under U.S. GAAP, Free Cash Flow provides useful information regarding the amount of
cash our continuing business is generating after capital expenditures, available for reinvesting in the business, debt service, and
payment of dividends
17