
Wu Jiajin UXID2014 Researching User’ Experience
78
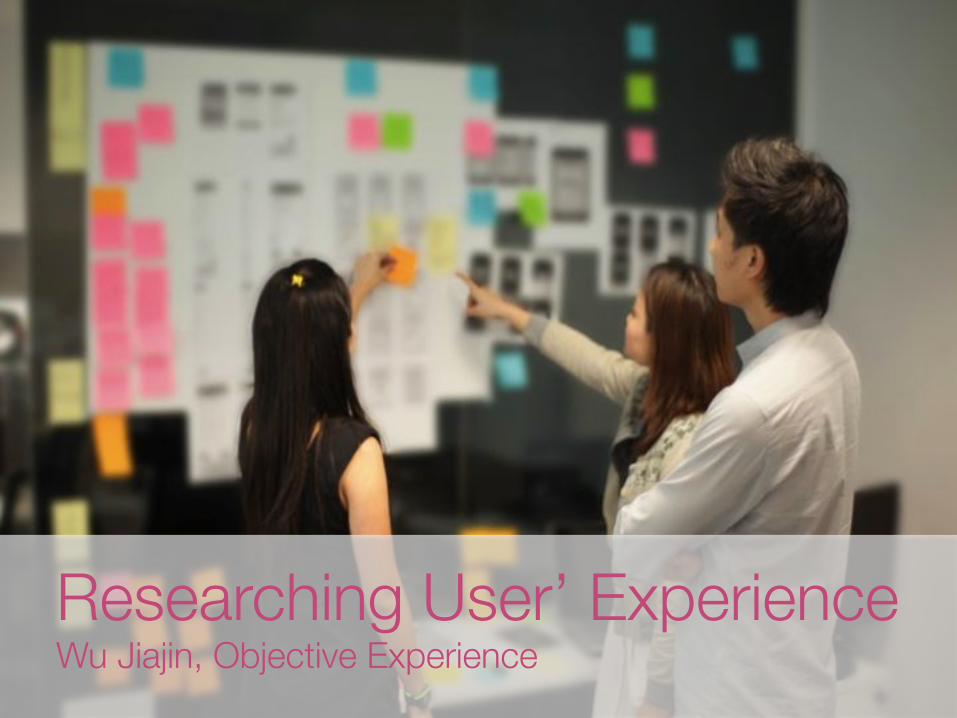
Presented to: Presented by: Date: Researching User’ Experience Wu Jiajin, Objective Experience
-
Upload
ux-indonesia -
Category
Design
-
view
246 -
download
4
Transcript of Wu Jiajin UXID2014 Researching User’ Experience
Presented(to:(
Presented(by:(
Date:(Researching User’ Experience!Wu Jiajin, Objective Experience
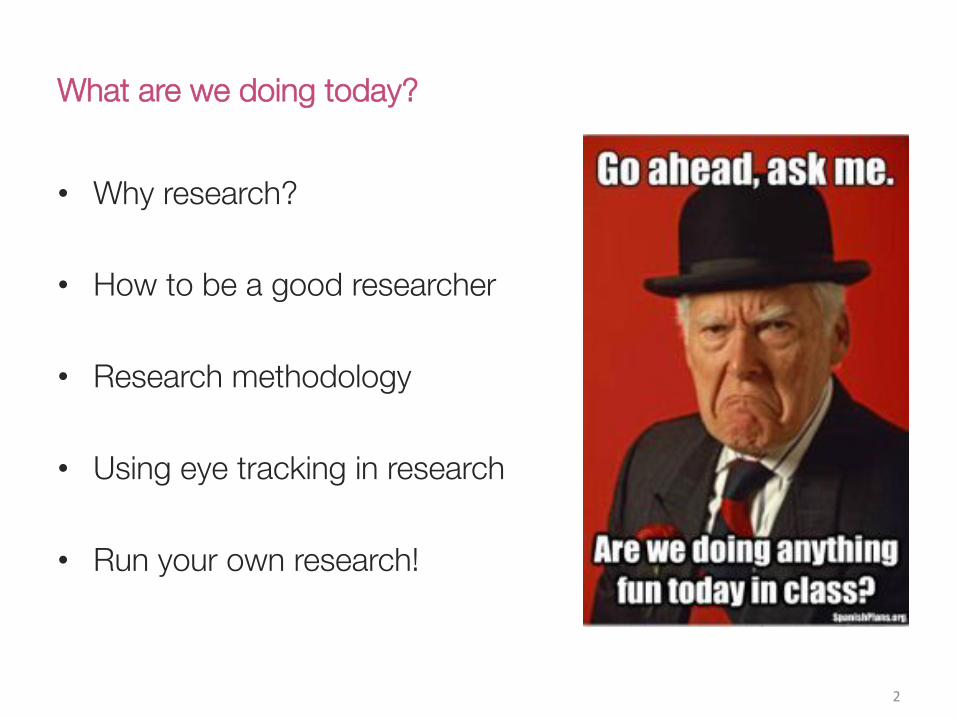
What are we doing today?
• Why research?
• How to be a good researcher
• Research methodology
• Using eye tracking in research
• Run your own research!
2(
Introductions
3(
Get to know each other
Find 5 things that all of you have in common, nothing to do with work. Nothing to do with body parts (we all have arms or eyes) or clothing (we all wear shoes, etc)
Assign 1 person to take notes so you can share with the room when done
You have 5 mins
4(
Share your experience
• Have you conducted a research before?
• Have you setup recruitment criteria?
• Have you written your own interview script?
• Have you written a research report?
• Have you translated research findings to designs?
5(
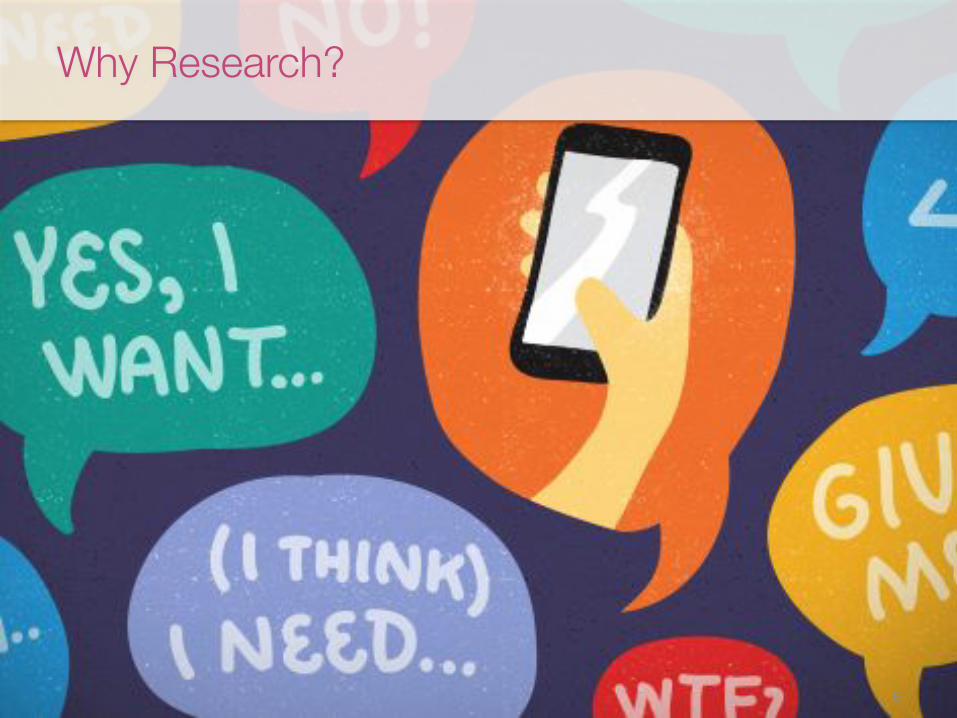
Why Research?
6(

Define your opportunity
7(

Gain clarity on the direction forward 8(
Catch major issues early and fix these !before product release
9(
Maintain long lasting survival 10(

How to be a good researcher?
11(

12(

Make the participant feel comfortable
13(
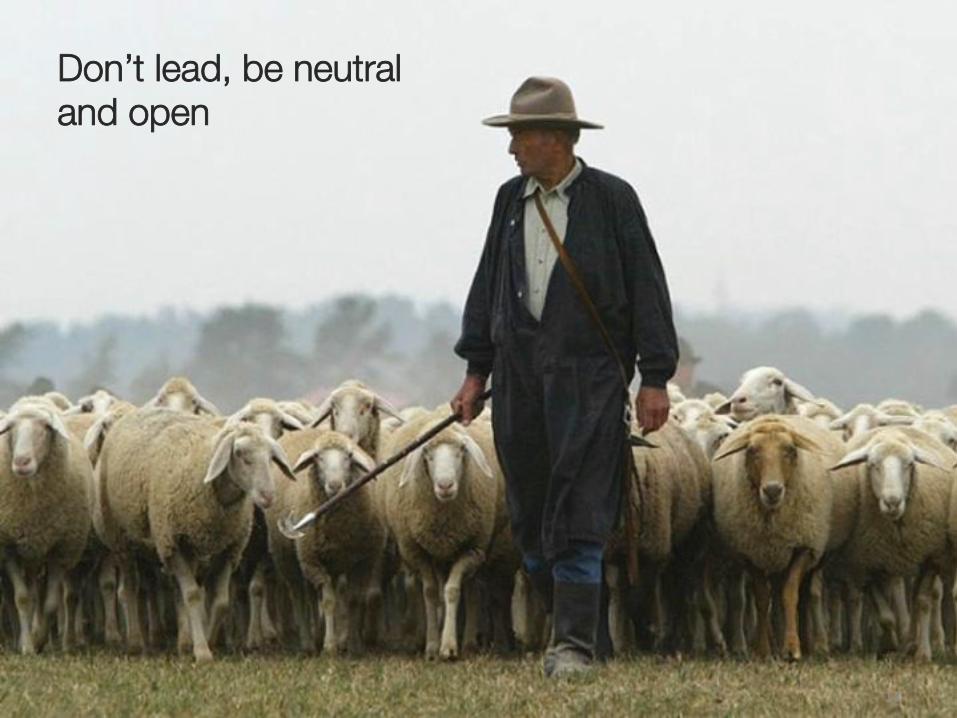
Don’t lead, be neutral !and open
14(
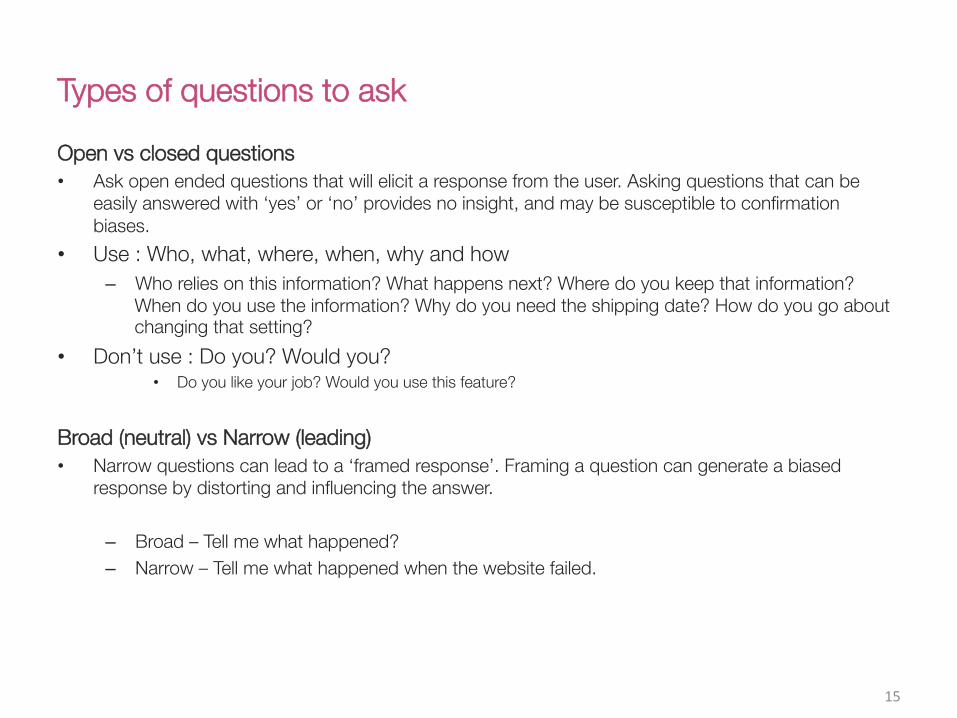
Types of questions to ask
Open vs closed questions • Ask open ended questions that will elicit a response from the user. Asking questions that can be
easily answered with ‘yes’ or ‘no’ provides no insight, and may be susceptible to confirmation biases.
• Use : Who, what, where, when, why and how – Who relies on this information? What happens next? Where do you keep that information?
When do you use the information? Why do you need the shipping date? How do you go about changing that setting?
• Don’t use : Do you? Would you? • Do you like your job? Would you use this feature?
Broad (neutral) vs Narrow (leading) • Narrow questions can lead to a ‘framed response’. Framing a question can generate a biased
response by distorting and influencing the answer.
– Broad – Tell me what happened? – Narrow – Tell me what happened when the website failed.
15(

Be aware, observe and feel
16(

Why, Why, Why, Why, Why
17(

Why, Why, Why, Why, Why
• Why does it take so long to serve a customer? – Because we are so busy! There’s always a queue of people waiting to be served at lunchtime
• Why is there always a queue of people at lunchtime? – It is the busiest time of the day and we don’t have enough staff to serve everyone.
• Why don’t we have enough staff to cope with busy periods? – We don’t have enough room to accommodate more staff, ther would just get in the way.
• Why is there not enough room for more staff? – The service area is too cluttered, as the equipment we use is very large and bulky.
• Why is there so much equipment around? – We purchases our equipment in bulk to save money. This usually results in cheap but bulky
stuff, that we need to navigate around
18(

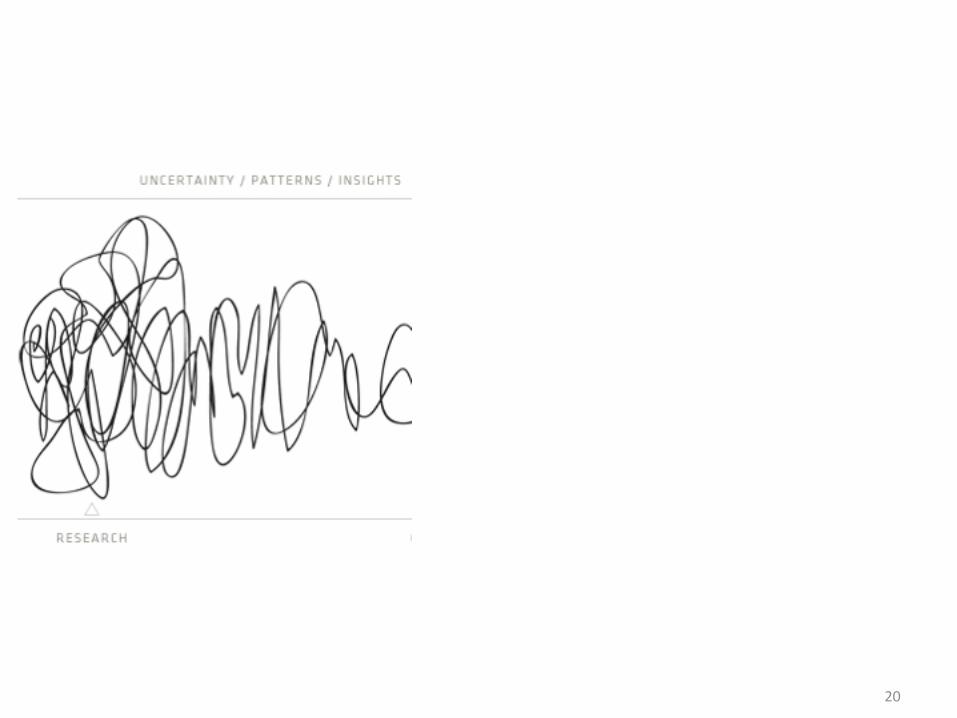
Be uncomfortable with uncertainty
19(
20(
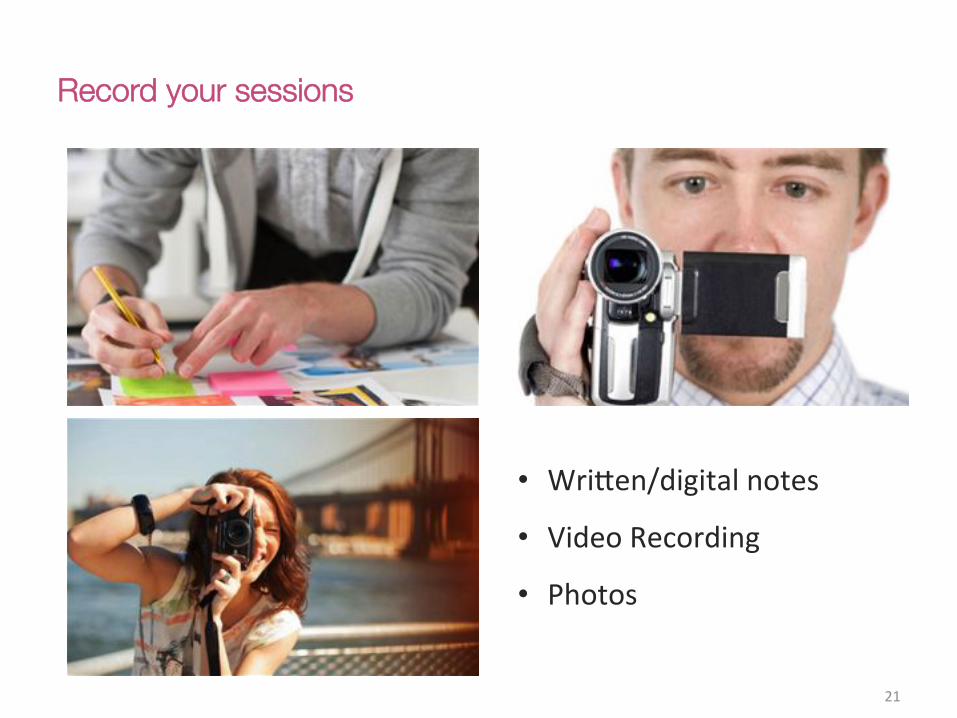
Record your sessions
21(
• Wri;en/digital(notes(
• Video(Recording((
• Photos(
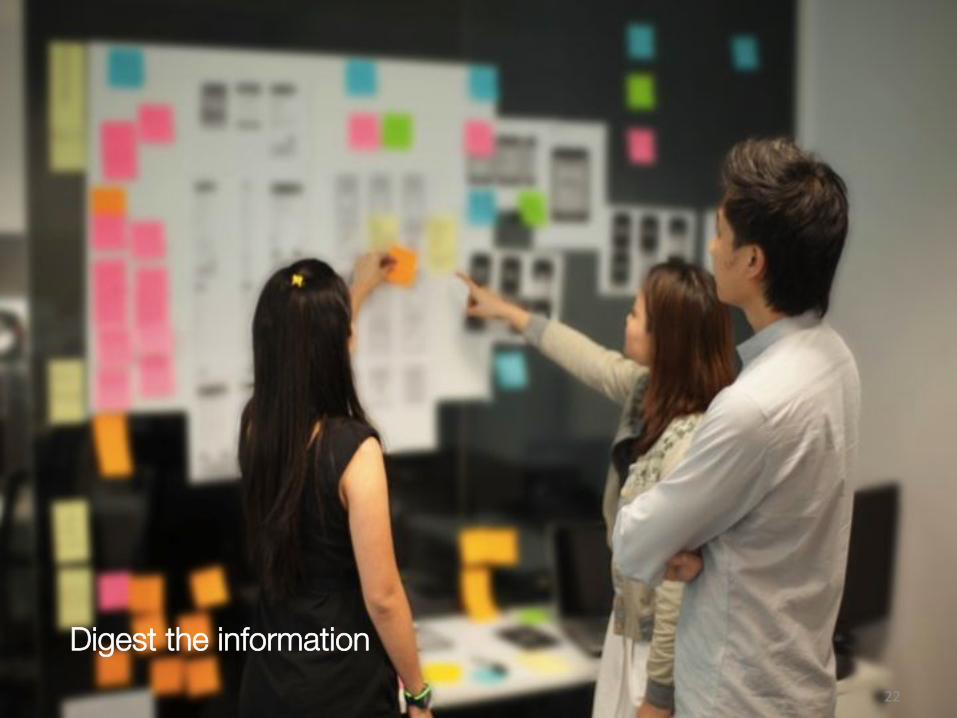
Digest the information 22(

Saturate and group
23(
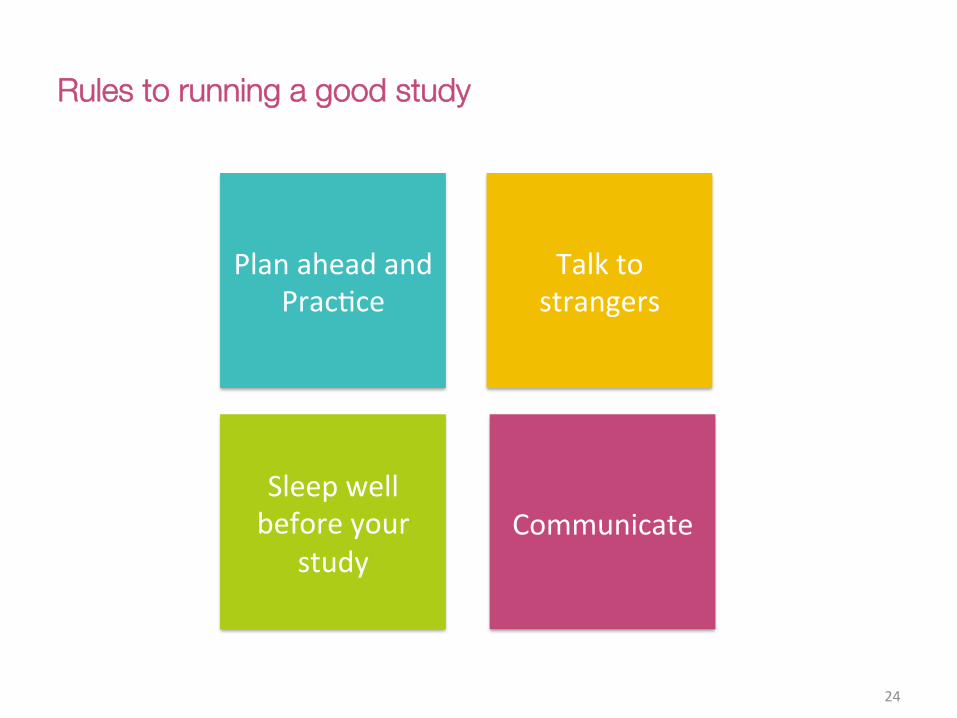
Rules to running a good study
24(
Plan(ahead(and(PracCce(
Sleep(well(before(your(
study(
Talk(to(strangers(
Communicate((

user research methodologies
25(

Quantitative vs Qualitative research
Quantitative - Analysis of NUMERICAL data
• Numbers (quantifiable, percentages) • Ask enough questions from enough
people to statically estimate the general viewpoints of a large population
• Closed / forced choice (i.e. yes/no response)
• Response bias (i.e. tendency for participants to respond in a way they think researcher will favour)
• E.g: Online surveys, eye tracking statistics
Qualitative – Analysis of WORDS • Words gathered from an interview • Gathering reactions and opinions • More in-depth understanding • Requires less participants • Open-ended (i.e. tell me more about…) • Findings cannot be generalised (i.e. they
are not a representative of the general public)
• E.g: design ethnography, focus groups
26(
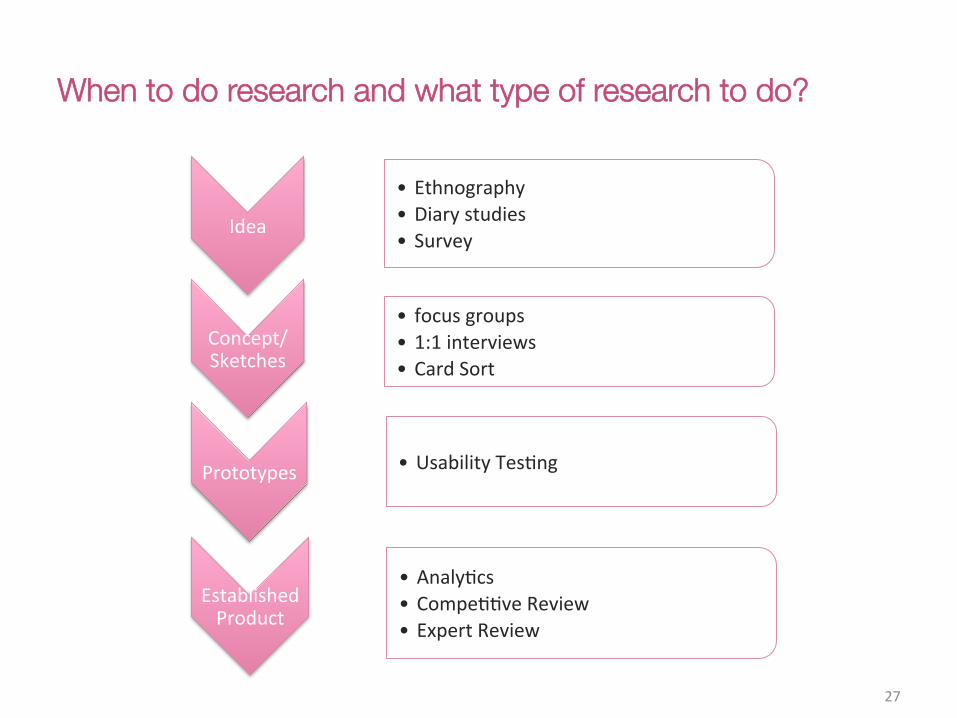
When to do research and what type of research to do?
27(
Idea(
• Ethnography((• Diary(studies(• Survey(
Concept/Sketches(
• focus(groups(• 1:1(interviews(• Card(Sort(
Prototypes( • Usability(TesCng((
Established(Product(
• AnalyCcs(• CompeCCve(Review(• Expert(Review(
design ethnography
28(

29(
Ethnography (from Greek ἔθνος ethnos "folk, people, nation" and γράφω grapho "I write") is the systematic study of people and cultures. It is designed to explore cultural phenomena where the researcher observes society from the point of view of the subject of the study.
What is design ethnography?
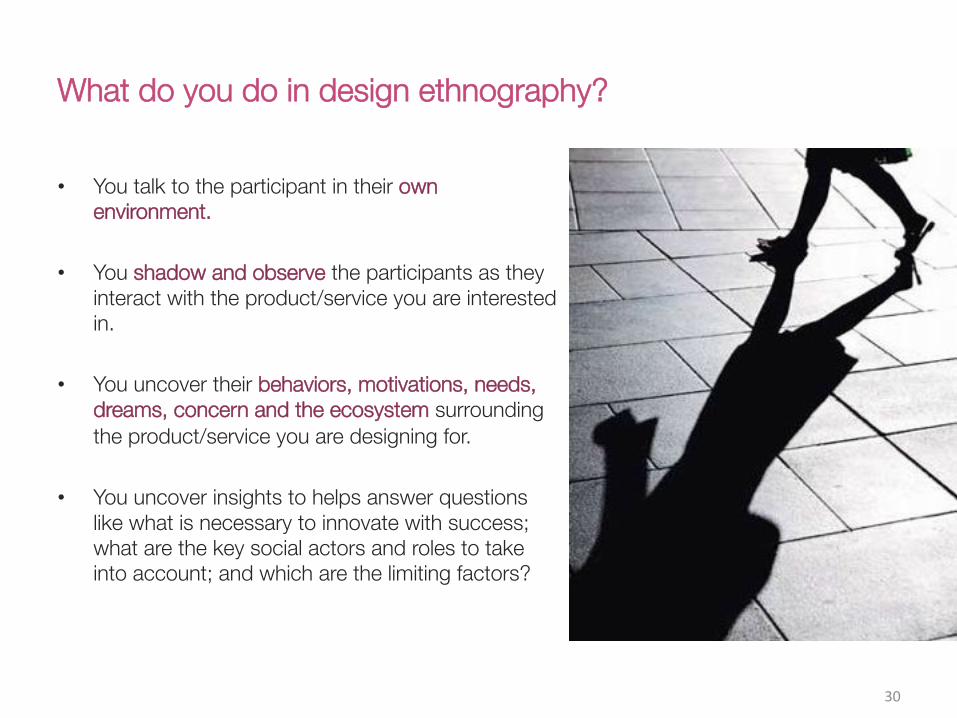
What do you do in design ethnography?
• You talk to the participant in their own environment.
• You shadow and observe the participants as they interact with the product/service you are interested in.
• You uncover their behaviors, motivations, needs, dreams, concern and the ecosystem surrounding the product/service you are designing for.
• You uncover insights to helps answer questions
like what is necessary to innovate with success; what are the key social actors and roles to take into account; and which are the limiting factors?
30(
Design ethnography deliverables
• Sessions typically last at least 90minutes.
• Qualitative research to be conducted with 10 to 20 participants.
• Deliverables : – Rich insights into the user’s ecosystem – Unmet needs and opportunity space for innovation, new products – Experience Framework
• Personas and use case scenarios • Design principles • Customer workflow
31(

Diary studies
32(
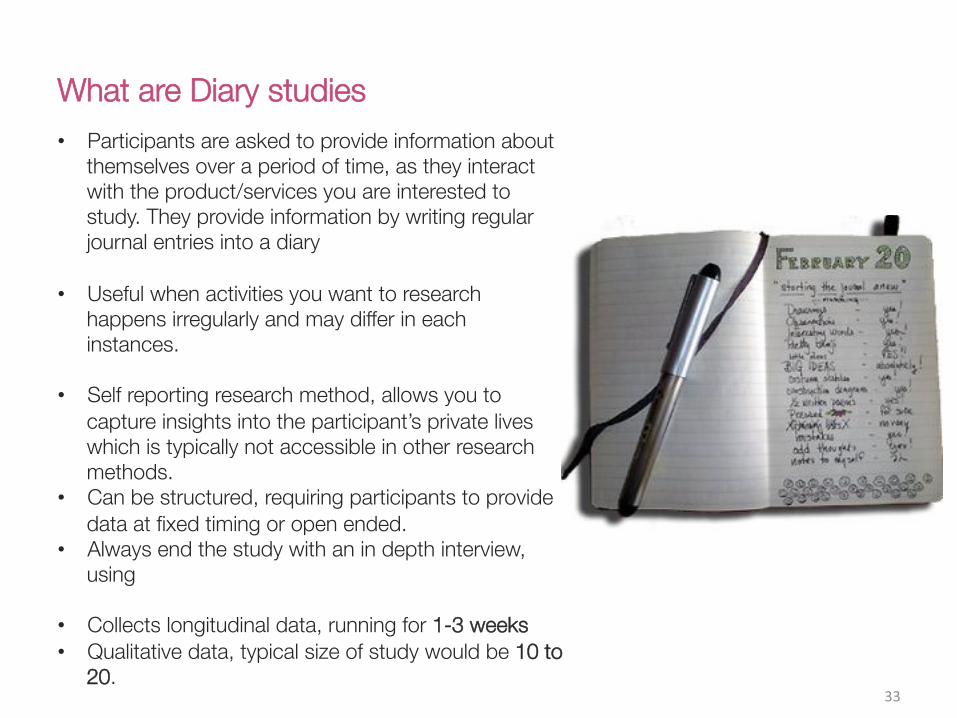
What are Diary studies
33(
• Participants are asked to provide information about themselves over a period of time, as they interact with the product/services you are interested to study. They provide information by writing regular journal entries into a diary
• Useful when activities you want to research happens irregularly and may differ in each instances.
• Self reporting research method, allows you to capture insights into the participant’s private lives which is typically not accessible in other research methods.
• Can be structured, requiring participants to provide data at fixed timing or open ended.
• Always end the study with an in depth interview, using
• Collects longitudinal data, running for 1-3 weeks • Qualitative data, typical size of study would be 10 to
20.
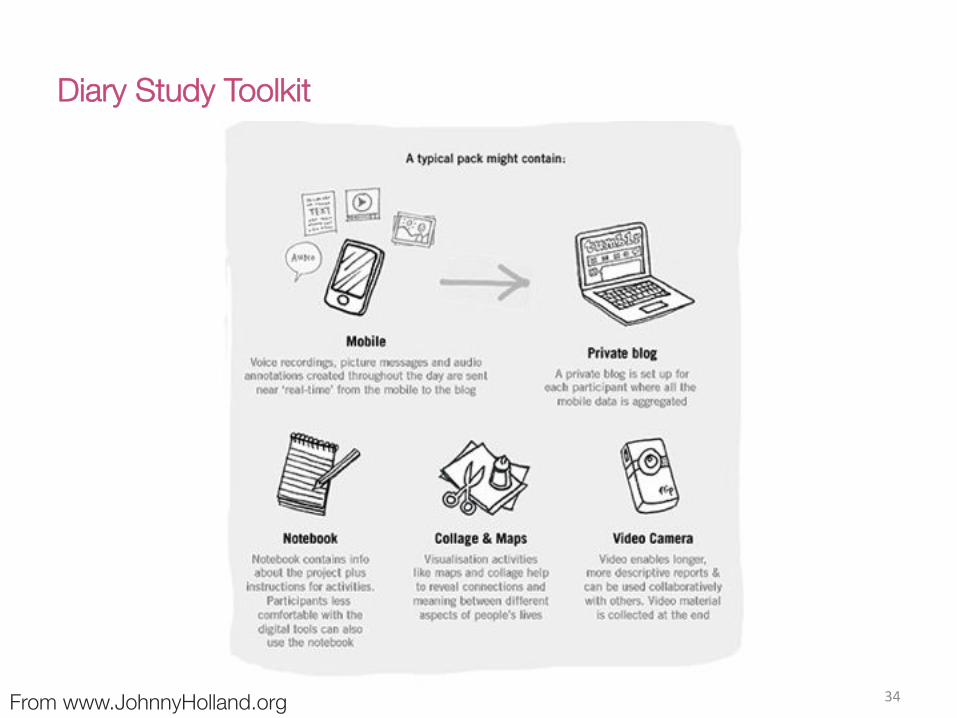
Diary Study Toolkit
34(From www.JohnnyHolland.org
What are love letter/breakup letters?
35(
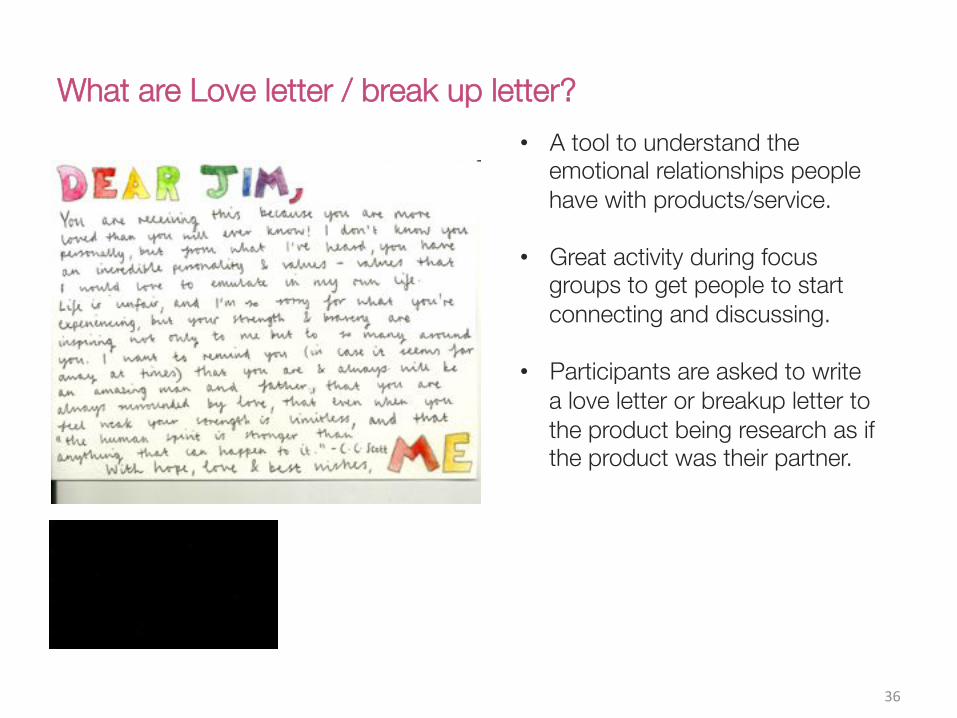
What are Love letter / break up letter?
36(
• A tool to understand the emotional relationships people have with products/service.
• Great activity during focus groups to get people to start connecting and discussing.
• Participants are asked to write a love letter or breakup letter to the product being research as if the product was their partner.
Activity : write your love/break-up letter to your transportation system (public or private)
37(

Time for a tea break
38(

surveys
39(
What is a survey?
• Uncover user problems, needs, goals and ideas for improvement
• Usually delivered through an online tool to extend to larger numbers across wider geographic locations
• Approximately 2 – 3 week turnaround • Participants required can vary from 50 – 200 ppl
depending on budget and analysis requirements
• Deliverable – Report summarising the data and synthesising the results. Insights are gathered from the data to provide detailed recommendations for the research objectives.
40(
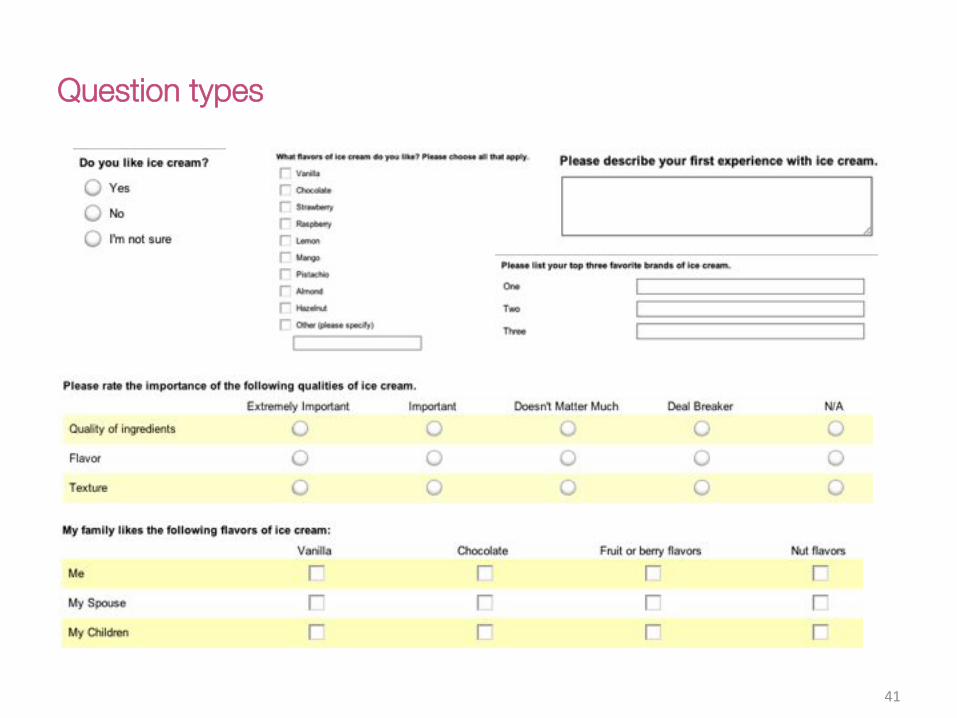
Question types
41(
focus groups
42(

What is a focus group?
43(
• Group session with a trained moderator that can provide a rich source of insight
• Interactive sessions filled with activities and discussion • Can cover things such as:
• Identification and prioritisation of key features and functionalities
• Exploration of possible design concepts • Co-creation, where participants contribute ideas to
create products/services
• Approximately 2 hours per group (the amount of sessions to be held vary depending on user types, business requirements and budget
• Participants required – 6 – 8 people per group, carefully selected to represent your target/key audience groups
• Deliverable – Report summarising the data and synthesising the results. Detailed insights about the behaviour of your key users are gathered from the representative participants

Dyad/Triad Focus group
44(

cardsorting
45(

What is cardsorting?
46(
• IA or Information Architecture refers to the structure of the content presented
• Great design needs to be complemented by findable and logical information structures
• Detailed mapping of how content should fit and naming of labels and buttons are considered to ensure it makes sense to the user
• IA testing can be done online of face-to-face using a card sorting activity
• Card sorts usually take approx 10 mins to complete online, or can be incorporated into a focus group session.
• Participants required (also can be done with stakeholders)
• Deliverable – IA findings are incorporated in the detailed wireframes as part of justification of the design.
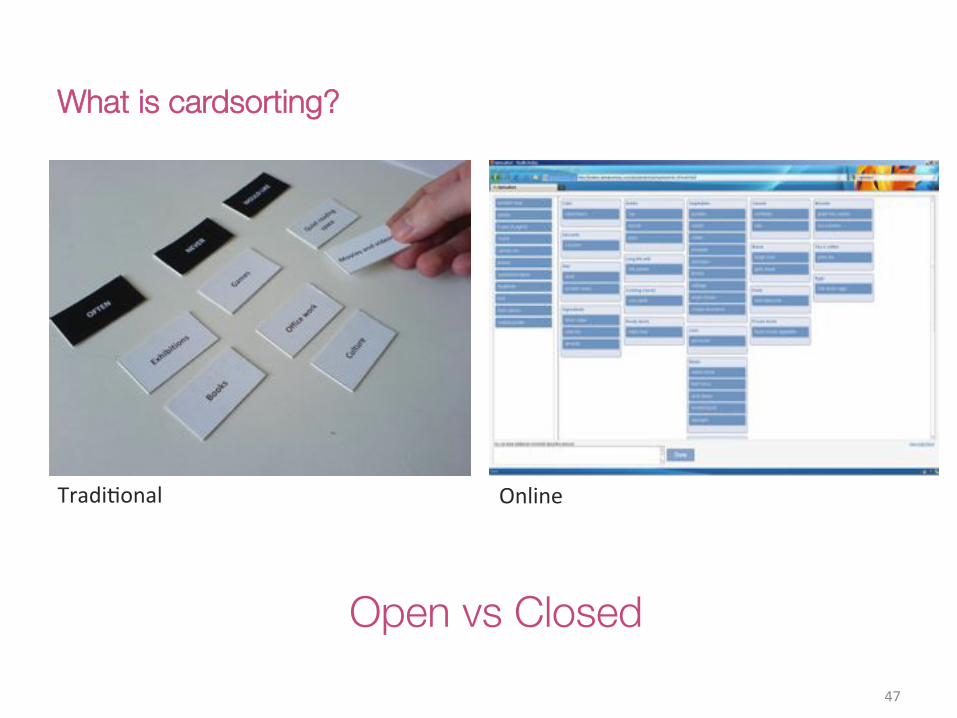
What is cardsorting?
47(
TradiConal( Online(
Open vs Closed

usability testing
48(
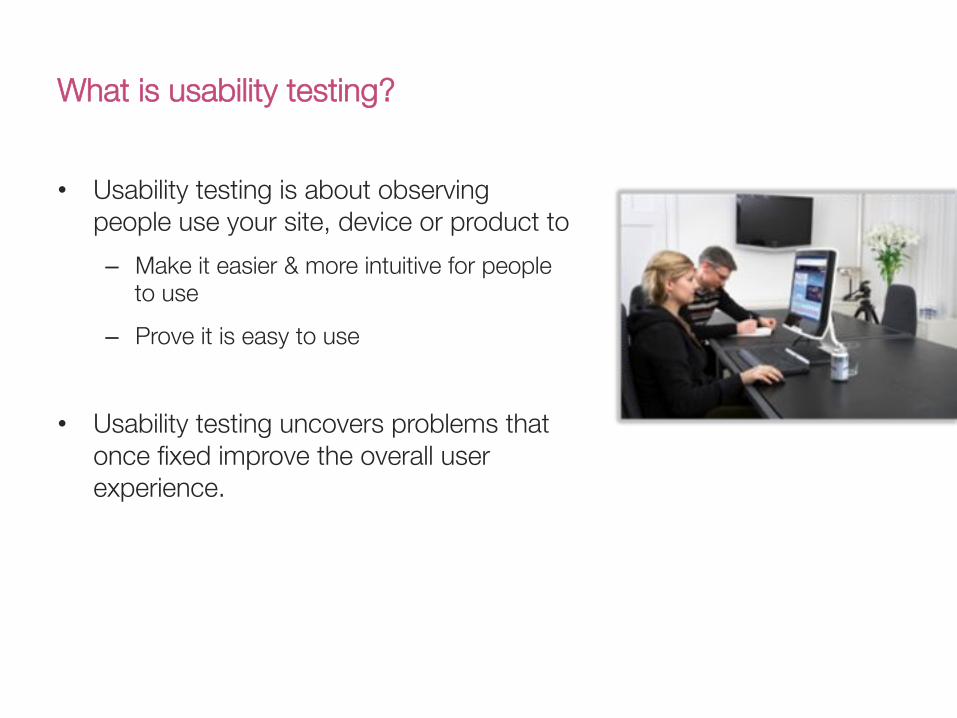
What is usability testing?
• Usability testing is about observing people use your site, device or product to – Make it easier & more intuitive for people
to use – Prove it is easy to use
• Usability testing uncovers problems that once fixed improve the overall user experience.
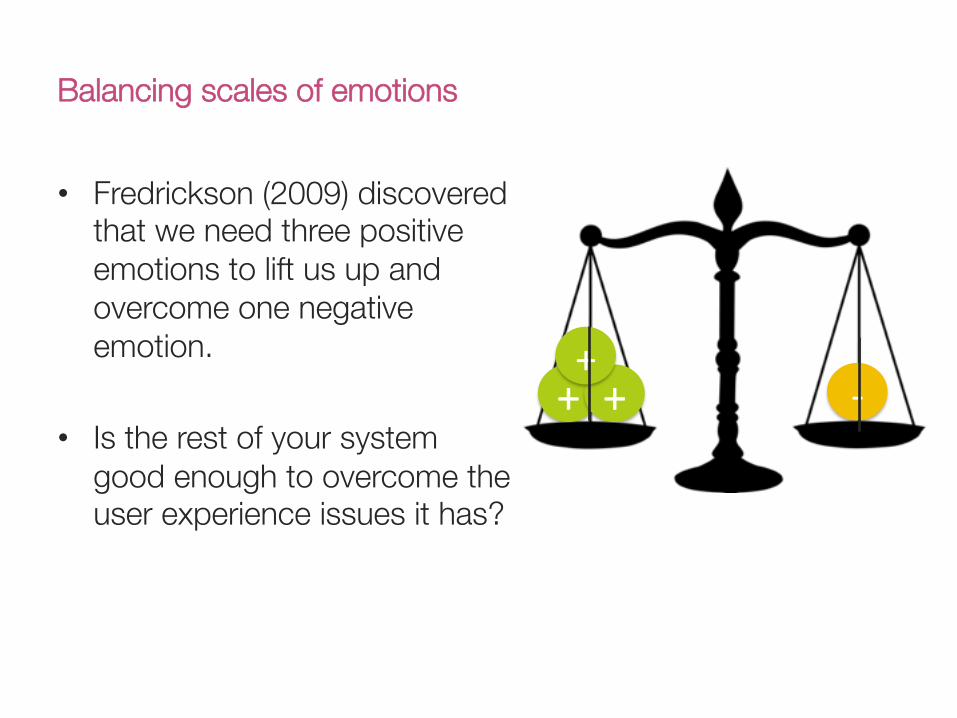
Balancing scales of emotions
• Fredrickson (2009) discovered that we need three positive emotions to lift us up and overcome one negative emotion.
• Is the rest of your system good enough to overcome the user experience issues it has?
+( +(+(
V(
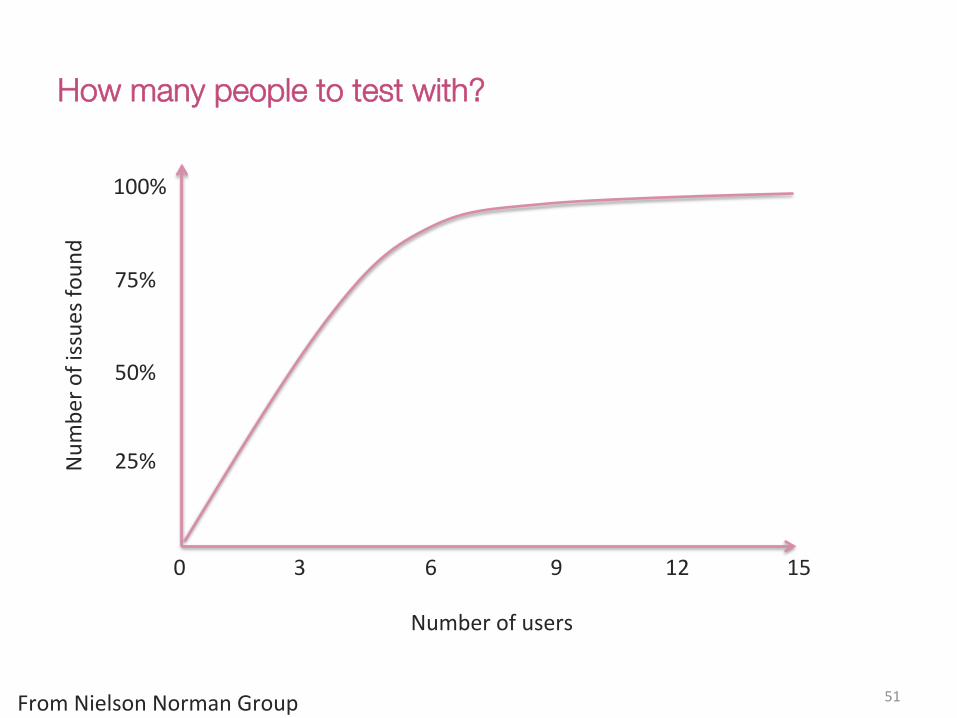
How many people to test with?
51(
100%(
75%(
50%(
25%(
0((((((((((((((((((((3((((((((((((((((((((((6(((((((((((((((((((((9(((((((((((((((((((12((((((((((((((((((15(((((((((((((((((((
Number(of(users(
Num
ber(of(issues(fo
und(
From(Nielson(Norman(Group(
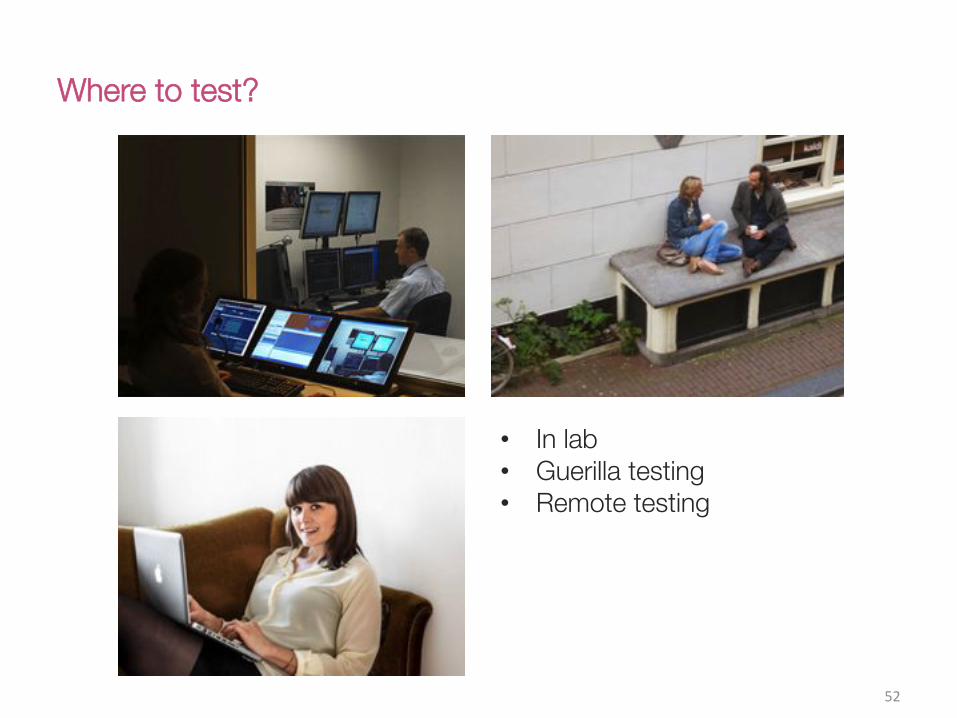
Where to test?
52(
• In lab • Guerilla testing • Remote testing

When to use what approach?
53(
$(is(not(an(issue(
Lots(of(Cme(
Formal(
Remote((
Guerilla(
No(Time(
Lack(of(funds(
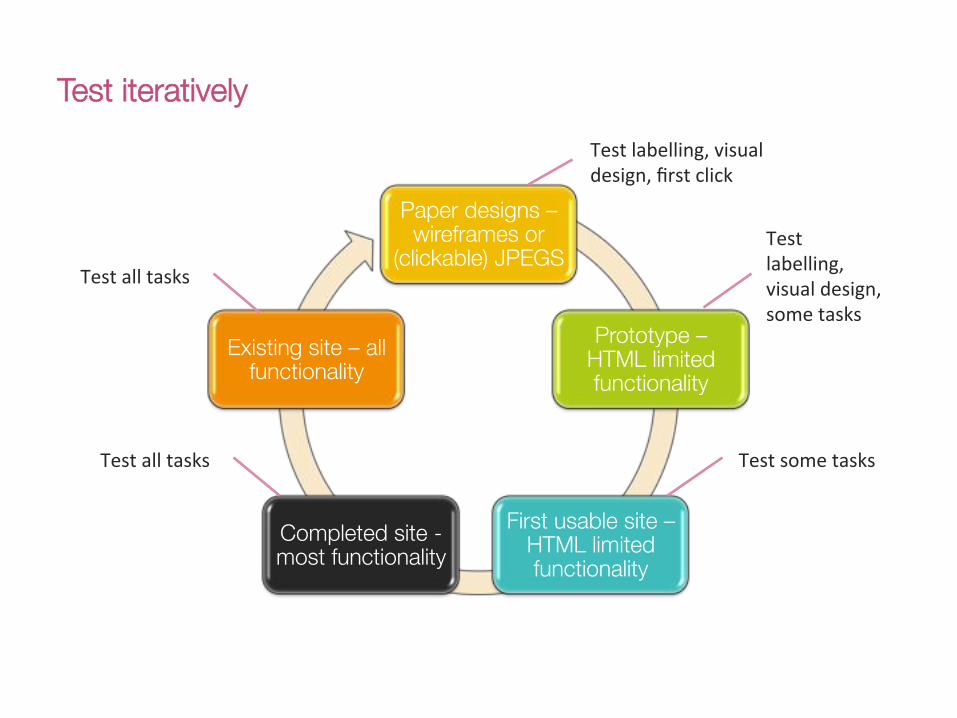
Test iteratively
Paper designs – wireframes or
(clickable) JPEGS
Prototype – HTML limited functionality
First usable site – HTML limited functionality
Completed site - most functionality
Existing site – all functionality
Test(labelling,(visual(design,(some(tasks(
Test(some(tasks(
Test(labelling,(visual(design,(first(click(
Test(all(tasks(
Test(all(tasks(

Agile testing
55(
Prep Test Report
Prep Test Report
Day(1( Day(2( Day(3(
Redesign,(update(
prototype(
Redesign,(update(prototype(
Day(1( Day(2( Day(3(
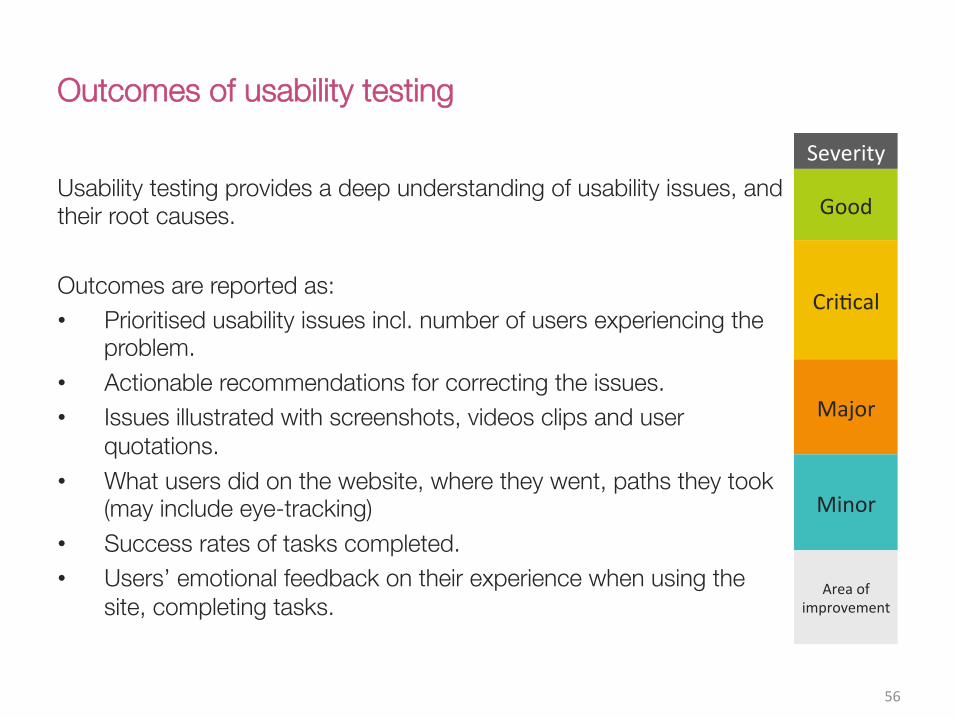
Outcomes of usability testing
Usability testing provides a deep understanding of usability issues, and their root causes. Outcomes are reported as: • Prioritised usability issues incl. number of users experiencing the
problem. • Actionable recommendations for correcting the issues. • Issues illustrated with screenshots, videos clips and user
quotations. • What users did on the website, where they went, paths they took
(may include eye-tracking) • Success rates of tasks completed. • Users’ emotional feedback on their experience when using the
site, completing tasks.
56(
Severity!
Good(
CriCcal(
Major(
Minor(
Area(of(improvement!
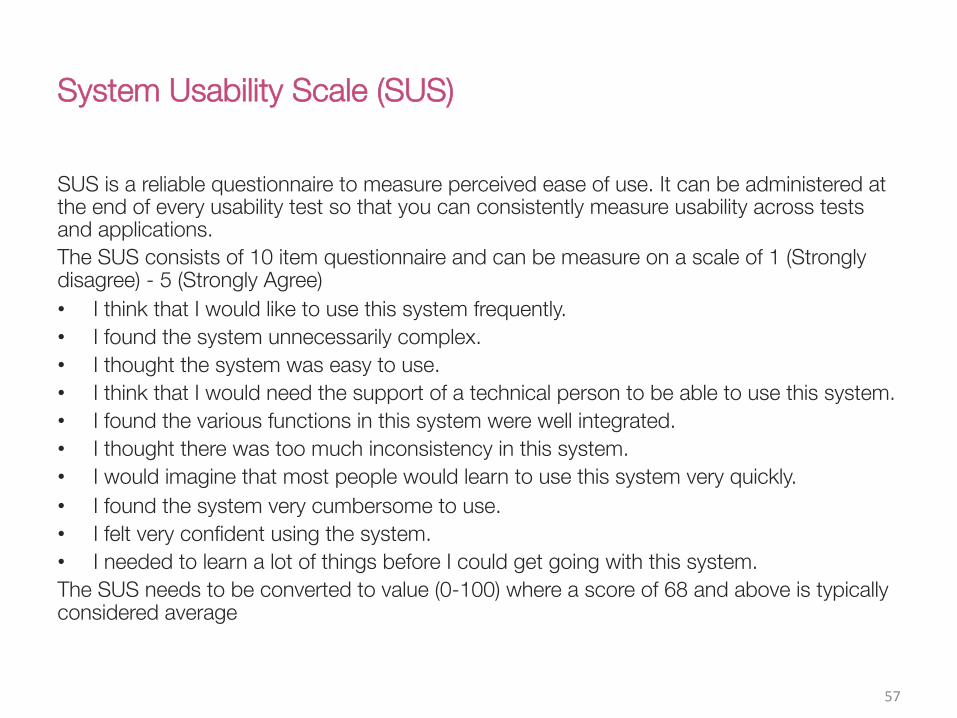
System Usability Scale (SUS)
SUS is a reliable questionnaire to measure perceived ease of use. It can be administered at the end of every usability test so that you can consistently measure usability across tests and applications. The SUS consists of 10 item questionnaire and can be measure on a scale of 1 (Strongly disagree) - 5 (Strongly Agree) • I think that I would like to use this system frequently. • I found the system unnecessarily complex. • I thought the system was easy to use. • I think that I would need the support of a technical person to be able to use this system. • I found the various functions in this system were well integrated. • I thought there was too much inconsistency in this system. • I would imagine that most people would learn to use this system very quickly. • I found the system very cumbersome to use. • I felt very confident using the system. • I needed to learn a lot of things before I could get going with this system. The SUS needs to be converted to value (0-100) where a score of 68 and above is typically considered average
57(
competitor review
58(
What is a competitor review
• Learn from the designs of your strongest competitors.
• Evaluate competitors designs against a common benchmark (usually tasks, scenarios, usability heuristics). – Design – Function – Features – Content and structure
• Approximately 2 – 3 day turnaround • No participants required • Deliverable – Report identifying all the strengths and
weaknesses of the competitors designs, with recommendations for opportunities to improve and strengthen your digital platforms.
59(

expert review
60(

What is an expert review?
• A website is reviewed based on standard usability heuristics through the lens of the user.
• Evaluate a user interface’s experience against research, design best practices and lessons learned in the field. – Navigation – Trust – Persuasion – Design – Calls to action – Forms
• Approximately 2 – 3 day turnaround • No participants required • Deliverable – Report identifying all the issues with an indication of their severity and a
corresponding recommendation that is actionable in the short or long term
61(

Usability principles in practice
• Heuristic – A set of usability principles – Rules of thumb – Guide correct behaviour
• These heuristics have been widely adopted and adapted by the software industry: 1. Visibility of system status 2. Match between system and the real world 3. User control and freedom 4. Consistency and standards 5. Error prevention 6. Recognition rather than recall 7. Flexibility and efficiency of use 8. Aesthetic and minimalist design 9. Help users recognize, diagnose, and recover from errors 10. Help and documentation
References: Nielsen, J., and Molich, R. (1990). Heuristic evaluation of user interfaces, Proc. ACM CHI'90 Conf. (Seattle, WA, 1-5 April), 249-256 Nielsen, J http://www.useit.com/papers/heuristic/heuristic_list.html

4 types of users
• Browser !Someone who has just arrived at the website and needs help to better understand what he should be looking for.
• Evaluator!
Someone who wants help to make a choice. • Transactor!
Someone who wants to transact and needs help and guidance to lead him through the website.
• Customer!
Someone who has completed a transaction and is looking for a reason to return to the website to transact again.
63(
Using eye tracking in research
64(

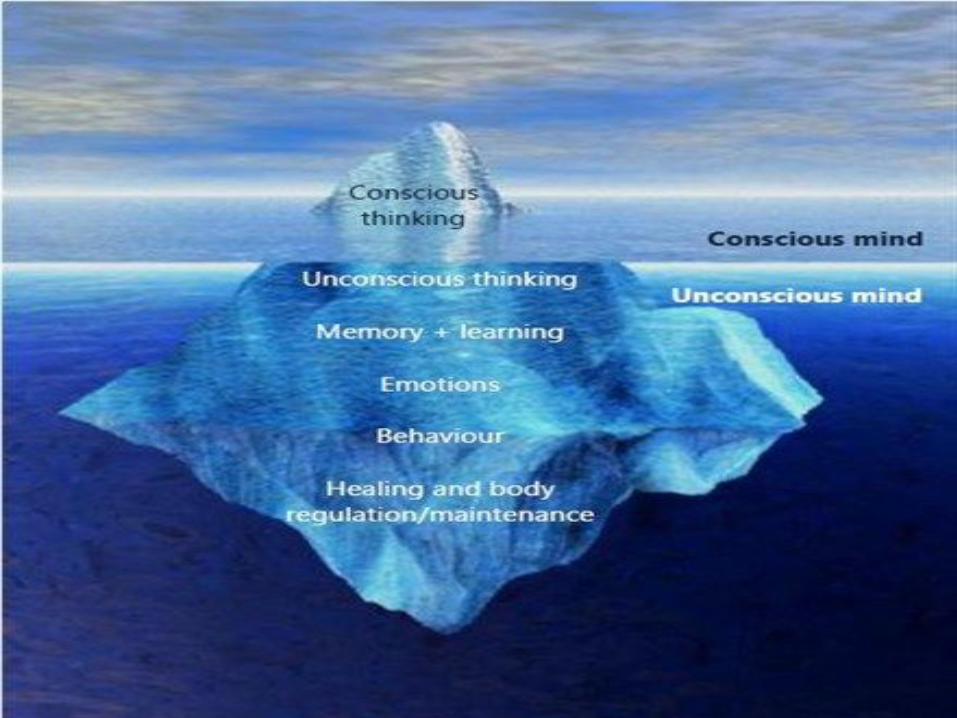
What is Eye Tracking?
Eye Tracking is a neuromarketing tool which provides valuable insights into how people view and interpret visual stimuli.

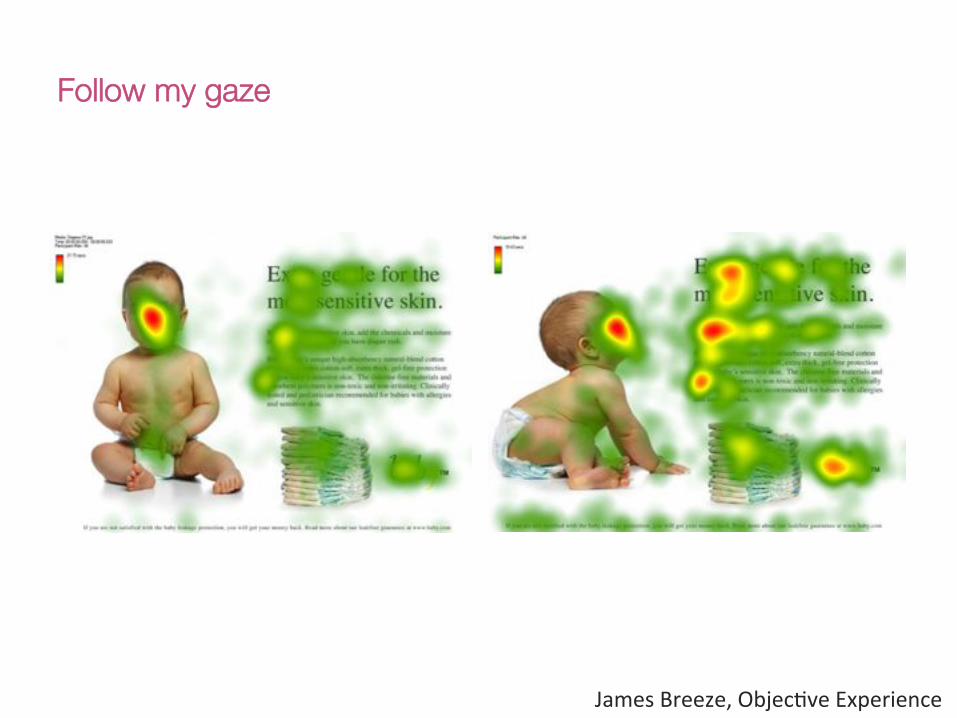
Follow my gaze
James(Breeze,(ObjecCve(Experience(
Game!tes(ng!

Offline!and!TVC!
Digital(
Business(systems(
Real(world(
POS/Packaging(
Print(
TV(and(video(
Call(centres(
CRM(
ERP(Shopping(
Driving(
Retail(banking(
Web(
Kiosk(
Mobile/Tablet(
Eye Tracking the Customer Journey
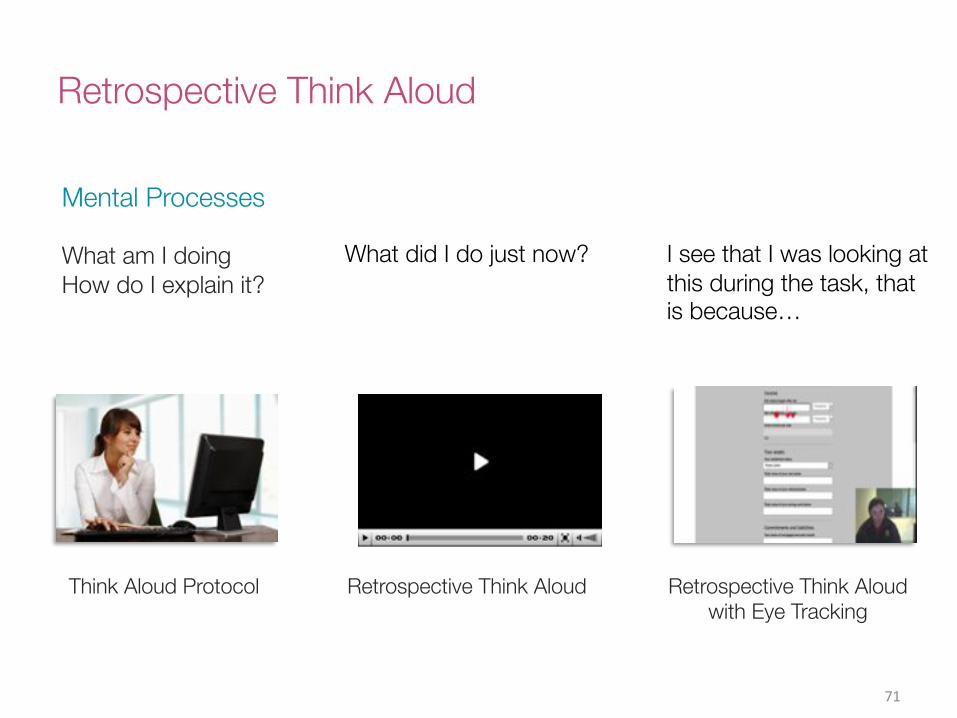
Retrospective Think Aloud
71(
Think Aloud Protocol
Mental Processes What am I doing How do I explain it?
Retrospective Think Aloud
What did I do just now?
Retrospective Think Aloud with Eye Tracking
I see that I was looking at this during the task, that is because…

eye tracking analysis
72(
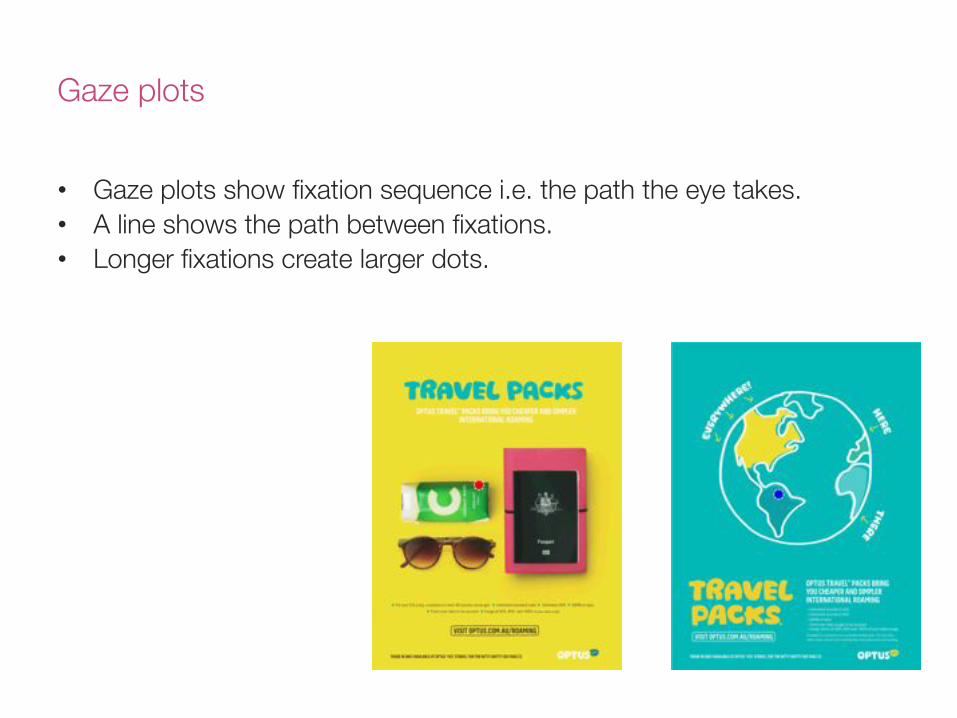
• Gaze plots show fixation sequence i.e. the path the eye takes. • A line shows the path between fixations. • Longer fixations create larger dots.
Gaze plots

Heat maps
• Determine what gets attention and what ‘does not’ get attention • Show where the gaze lingered • Compare multiple designs
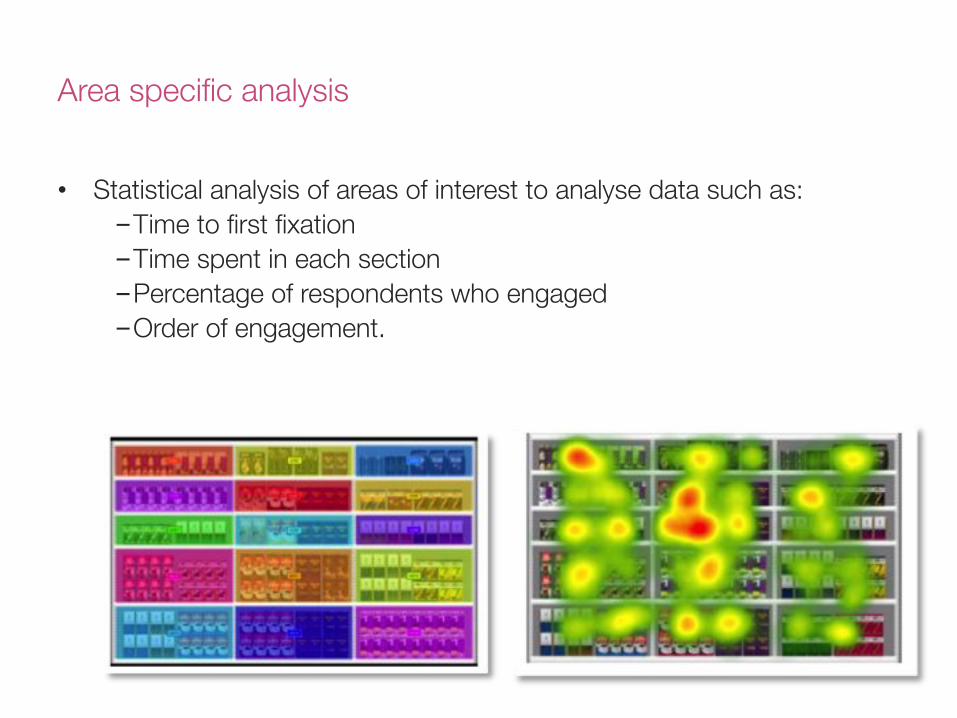
Area specific analysis
• Statistical analysis of areas of interest to analyse data such as: – Time to first fixation – Time spent in each section – Percentage of respondents who engaged – Order of engagement.

demo
76(

77(