WTO’s Doha Development Agenda and South Asian Agriculture
23
WTO’s Doha Development Agenda and South Asian Agriculture Kym Anderson Development Research Group, World Bank SASAR seminar, World Bank, Washington DC, 8 June 2006
description
WTO’s Doha Development Agenda and South Asian Agriculture. Kym Anderson Development Research Group, World Bank SASAR seminar, World Bank, Washington DC, 8 June 2006. The issue. - PowerPoint PPT Presentation
Transcript of WTO’s Doha Development Agenda and South Asian Agriculture

WTO’s Doha Development Agenda and South Asian Agriculture
Kym AndersonDevelopment Research Group, World Bank
SASAR seminar, World Bank, Washington DC, 8 June 2006

The issue
India (with the G20) has been offensive on agric subsidy cuts in the DDA, but has been defensive on agric market access… presumably because the government fears
tariff cuts would add to rural poverty and erode its rural political base
The US would bear the brunt of adjustment to cuts to domestic ag subsidies, the EU to cuts in ag export subsidies, so in exchange both want more market access in DCs (ag and non-ag)

Multilateral DDA offers opportunity for easier trade reform than if unilateral
Access to foreign goods & services markets increases at same time, making adjustment to own-reform easierEasier to sell the reform message domestically if other countries are adjusting at same time:
‘shared pain for mutual gain’
The key question
If the DDA were to conclude this year (a big IF), and agric and other reform commitments were to be phased in over the next decade, how would South Asian economies, and especially their agricultural sectors, be affected?
Answer depends on the region’s …
net trade position of various industriesthe region is close to 100% self-sufficient in agric and food products
current levels of actual own-protection and DDA commitments to change them
the region’s ag and food tariffs are well above the DC and global averages, but has few ag subsidies
assumptions in global models used to address the question
We use two global modelsGTAP model, based on 2001 baselineWB’s recursive Linkage model (with slightly higher elasticities), whose baseline is projected to 2015Both use the GTAP protection database of 2001 (which includes all key preferential tariffs), revised to 2005 to account for:
China’s accession to WTOEU expansion to 25 members, andend of Uruguay Round implementation (including phase-out of textile and clothing quotas)
Results are necessarily lower-bound estimates because they ignore:
Dynamic growth effects of reformPro-competitive effects of reformImpact of increase in product varietyGains from (most) services trade and investment reformThe risk that, without Doha, agricultural protectionism could riseComplementary domestic reforms
Why this issue also matters for the rest of the world
Because both models suggest almost 2/3rds of cost of current agric and trade policies to the world, and to developing countries, are due to agricultural policies
as agric. applied (bound) tariffs now average nearly 5 (10) times manufacturing tariffs globally
Because the majority of world’s poor depend directly or indirectly on ag for their livelihoodAnd because most of the costs of agric policies are due to tariffs, not subsidies
with the notable exception of cotton
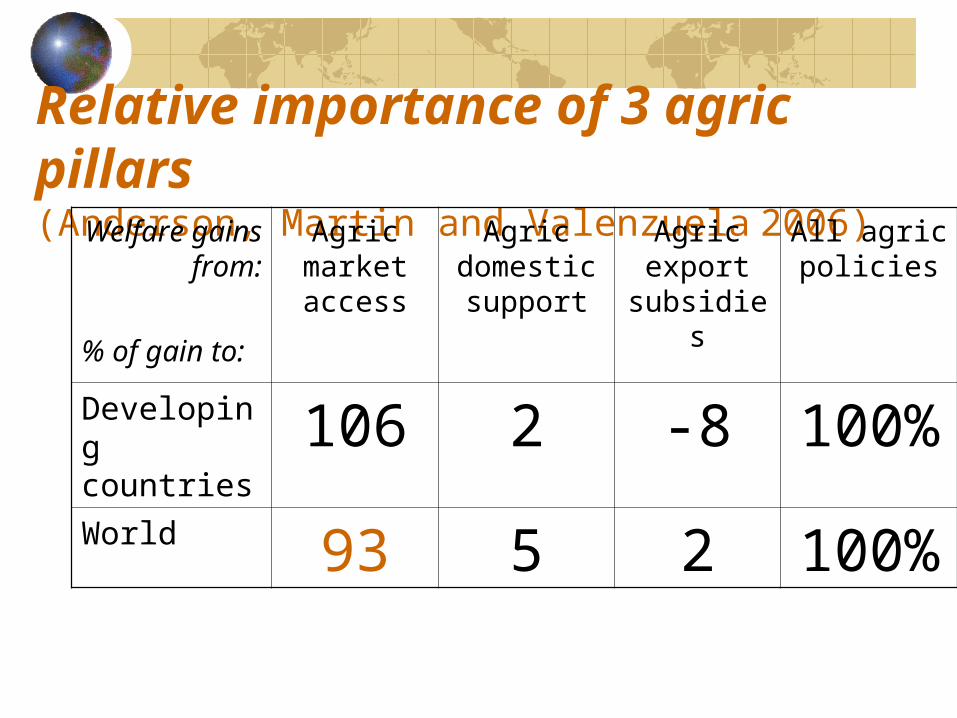
Relative importance of 3 agric pillars(Anderson, Martin and Valenzuela 2006)
Welfare gains from:
% of gain to:
Agric market access
Agric domestic support
Agric export
subsidies
All agric policies
Developing countries 106 2 -8 100
%World 93 5 2 100
%
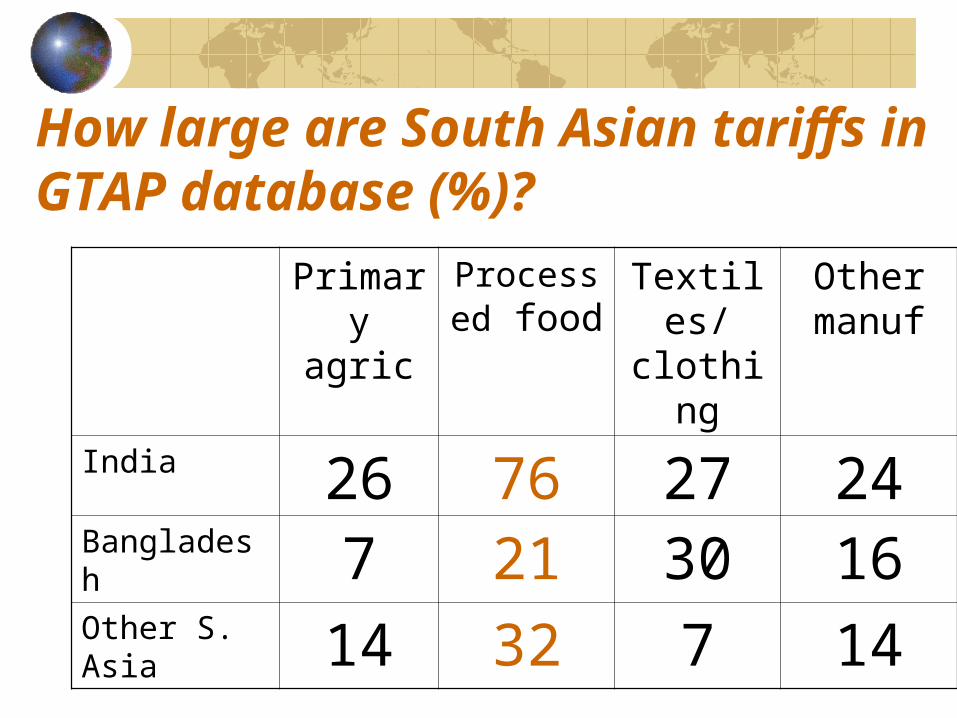
How large are South Asian tariffs in GTAP database (%)?
Primary agric
Processed food
Textiles/
clothing
Other manuf
India 26 76 27 24Bangladesh 7 21 30 16Other S. Asia 14 32 7 14
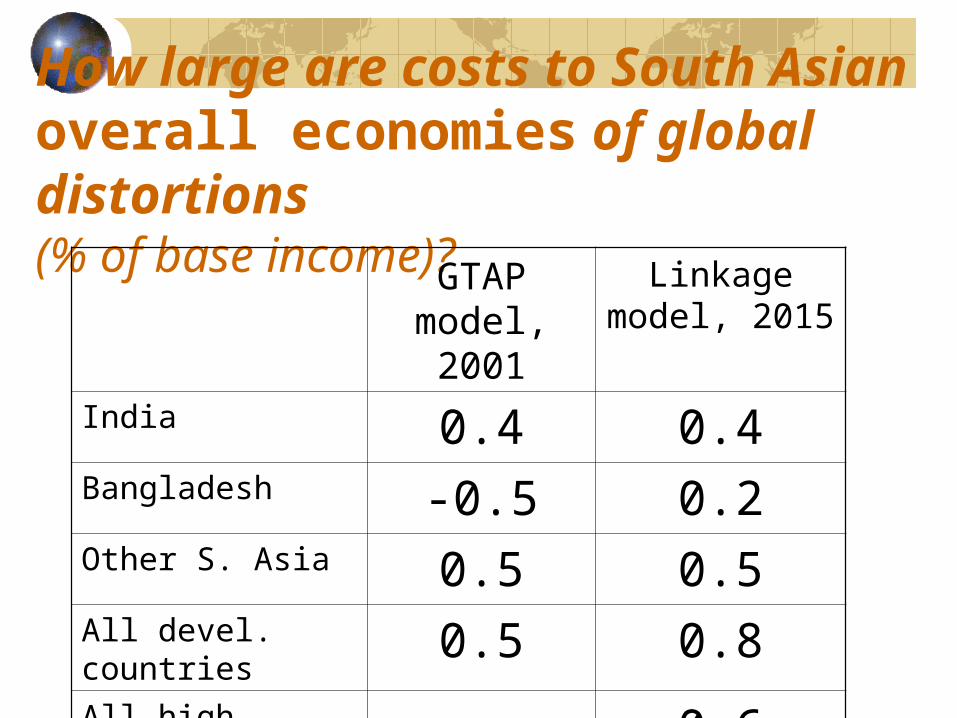
How large are costs to South Asian overall economies of global distortions (% of base income)?
GTAP model, 2001
Linkage model, 2015
India 0.4 0.4Bangladesh -0.5 0.2Other S. Asia 0.5 0.5All devel. countries 0.5 0.8All high-income 0.6
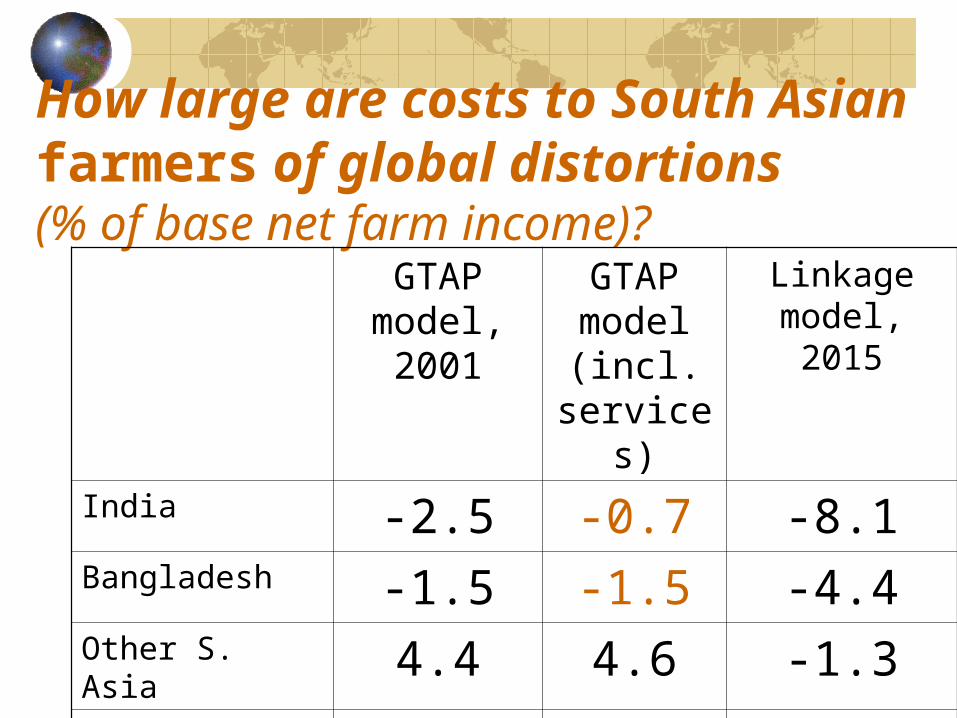
How large are costs to South Asian farmers of global distortions (% of base net farm income)?
GTAP model, 2001
GTAP model (incl.
services)
Linkage model, 2015
India -2.5 -0.7 -8.1Bangladesh -1.5 -1.5 -4.4Other S. Asia 4.4 4.6 -1.3All devel. countries 5.0 5.7 2.9
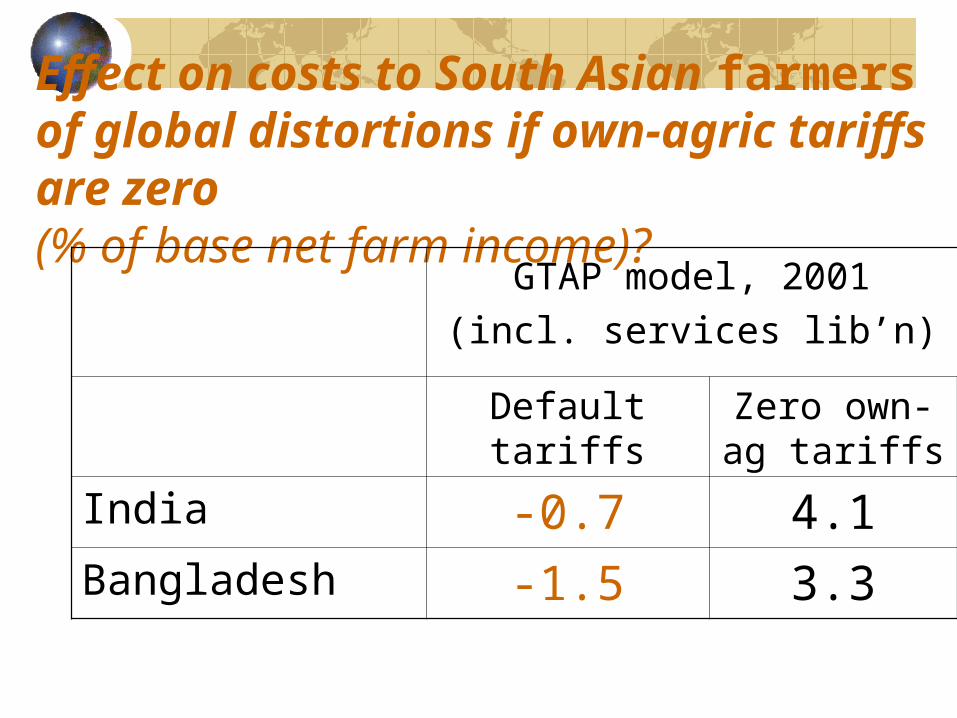
Effect on costs to South Asian farmers of global distortions if own-agric tariffs are zero(% of base net farm income)?
GTAP model, 2001(incl. services lib’n)
Default tariffs Zero own-ag tariffs
India -0.7 4.1Bangladesh -1.5 3.3

Change in agric VA due to lib’n (%)Own lib’n
Other DCs’ lib
HIClib’n
Total global
libIndia -4.1 -0.5 3.8 -0.7Bangladesh
-2.7 -1.4 2.6 -1.5
Brazil 1.6 1.9 39 43
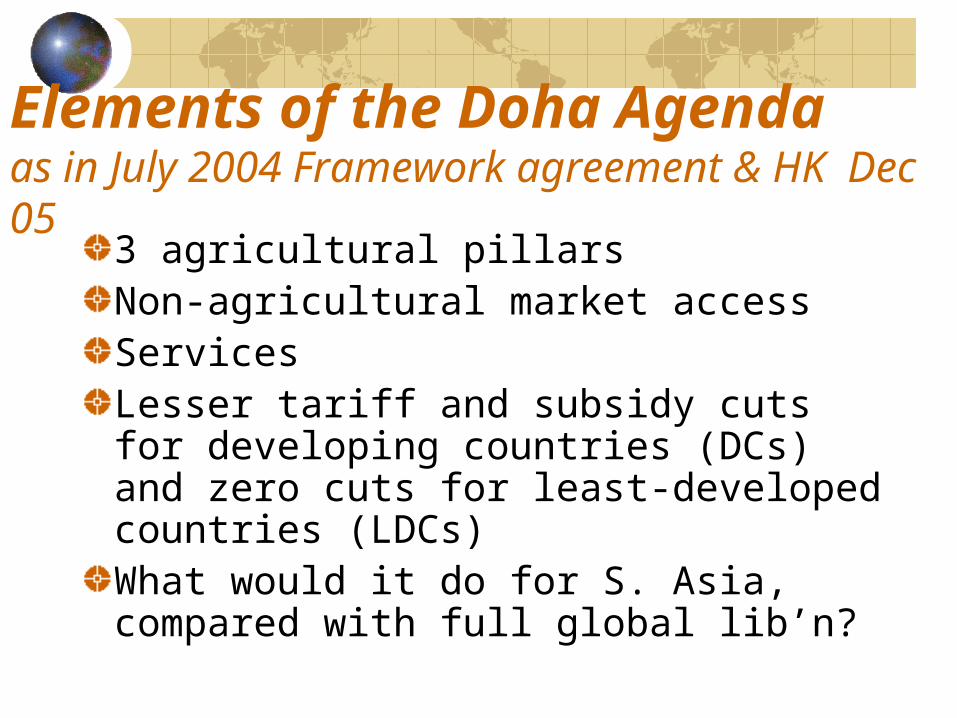
Elements of the Doha Agenda as in July 2004 Framework agreement & HK Dec 05
3 agricultural pillarsNon-agricultural market accessServicesLesser tariff and subsidy cuts for developing countries (DCs) and zero cuts for least-developed countries (LDCs)What would it do for S. Asia, compared with full global lib’n?

Key agricultural elements of the Doha Agenda to watch
Reduction in tariff and subsidy ‘binding overhang’Treatment of ‘sensitive’ and ‘special’ products (SSPs)Tariff cap, and whether it applies to SSPsExtent of Special and Differential Treatment (SDT) invoked by developing and least-developed countries in terms of their willingness to reform
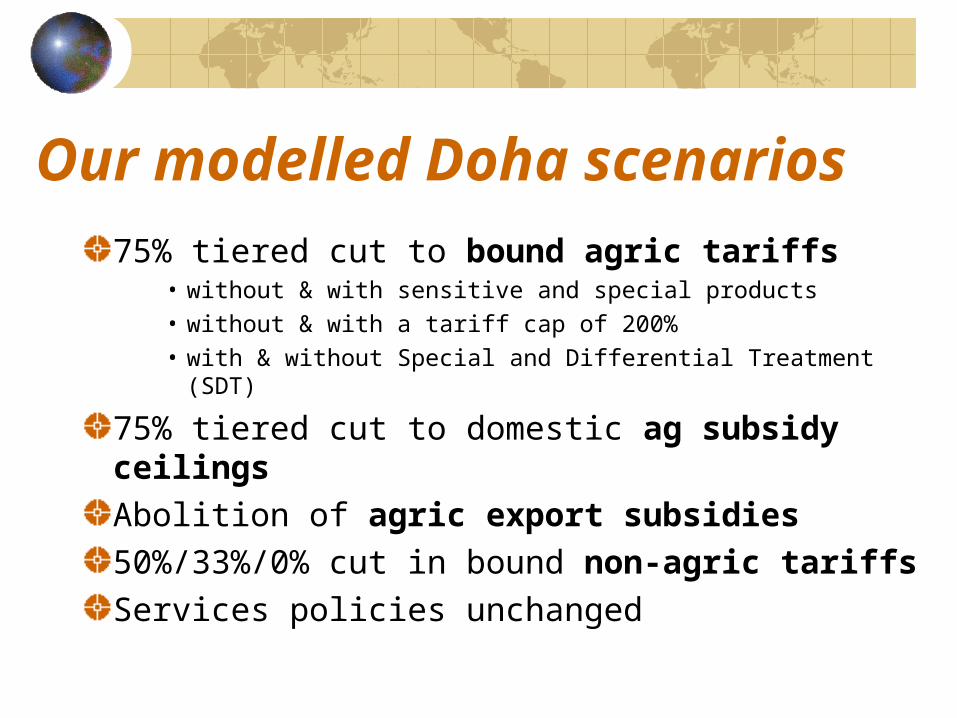
Our modelled Doha scenarios75% tiered cut to bound agric tariffs
• without & with sensitive and special products• without & with a tariff cap of 200%• with & without Special and Differential Treatment (SDT)
75% tiered cut to domestic ag subsidy ceilingsAbolition of agric export subsidies50%/33%/0% cut in bound non-agric tariffsServices policies unchanged
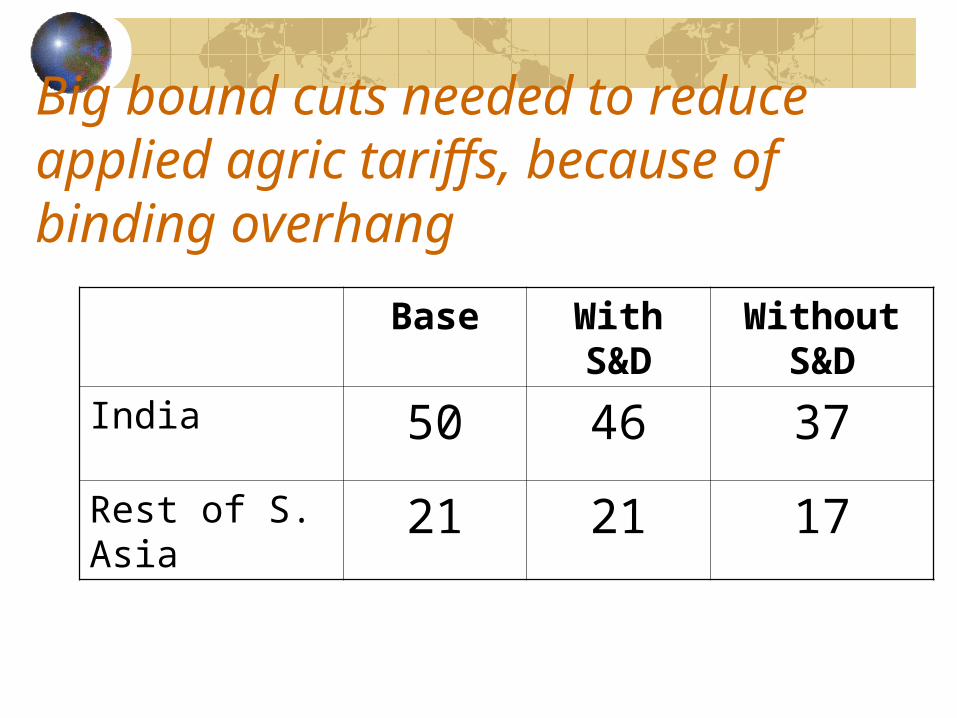
Big bound cuts needed to reduce applied agric tariffs, because of binding overhang
Base With S&D
Without S&D
India 50 46 37Rest of S. Asia
21 21 17
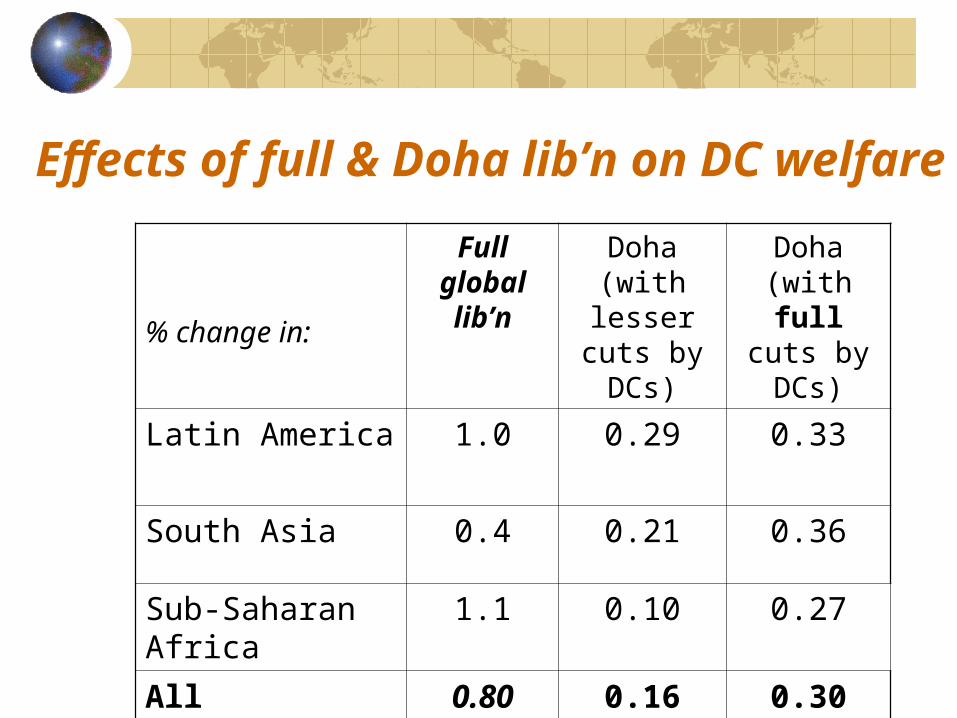
Effects of full & Doha lib’n on DC welfare
% change in:
Full global lib’n
Doha (with lesser
cuts by DCs)
Doha (with full cuts by DCs)
Latin America 1.0 0.29 0.33South Asia 0.4 0.21 0.36Sub-Saharan Africa
1.1 0.10 0.27
All developing countries
0.80 0.16 0.30

Effects of full & Doha lib’n on ag incomes (%)
% change in:
Full global lib’n
Doha (with lesser
cuts by DCs)
India -8.1 02.
Rest of S. Asia -1.3 1.8All S. Asia -6.8 0.5
All DCs 2.9 2.0
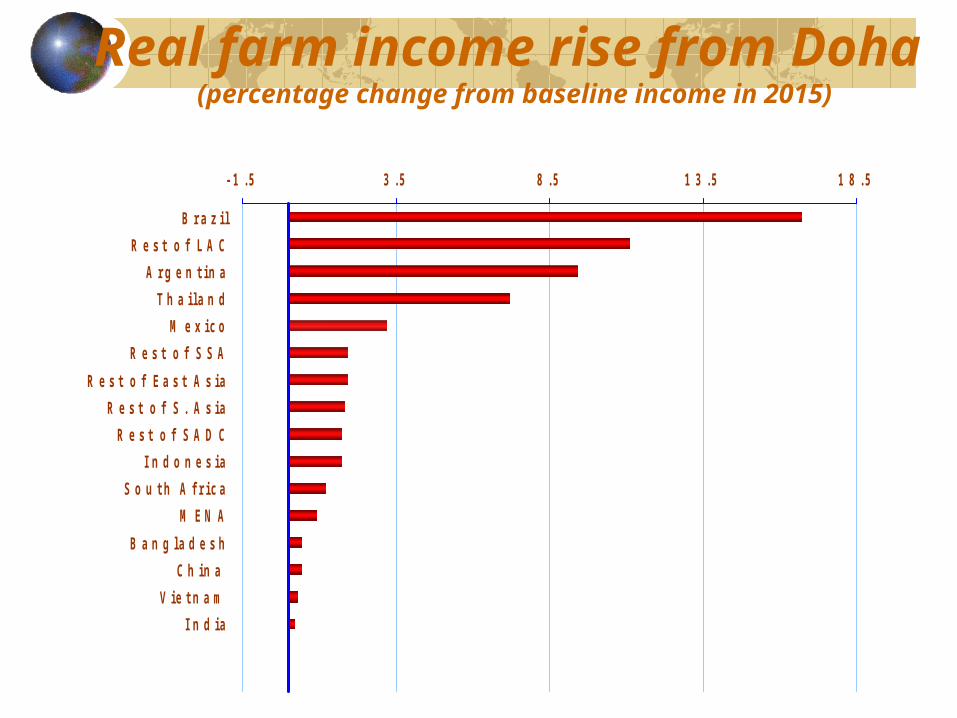
Real farm income rise from Doha (percentage change from baseline income in 2015)
- 1 .5 3 .5 8 .5 1 3 .5 1 8 .5
B r a z i lR e s t o f L A C
A r g e n t i n aT h a i l a n d
M e x i c oR e s t o f S S A
R e s t o f E a s t A s i aR e s t o f S . A s i a
R e s t o f S A D CI n d o n e s ia
S o u t h A f r i c aM E N A
B a n g l a d e s hC h i n a
V i e t n a mI n d i a
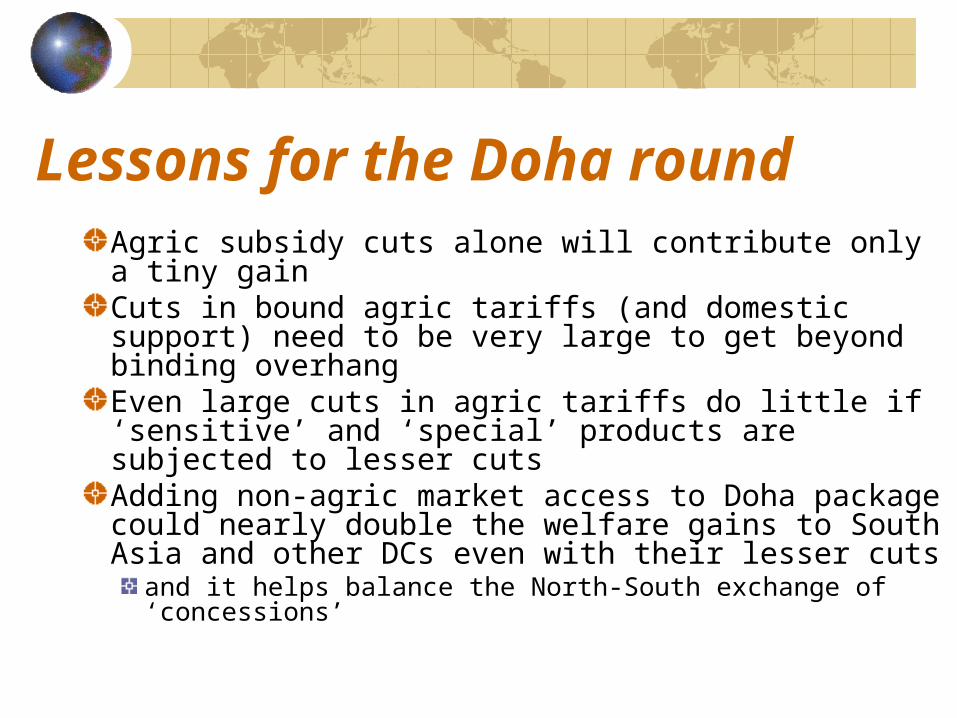
Lessons for the Doha round Agric subsidy cuts alone will contribute only a tiny gainCuts in bound agric tariffs (and domestic support) need to be very large to get beyond binding overhangEven large cuts in agric tariffs do little if ‘sensitive’ and ‘special’ products are subjected to lesser cutsAdding non-agric market access to Doha package could nearly double the welfare gains to South Asia and other DCs even with their lesser cuts
and it helps balance the North-South exchange of ‘concessions’
This and all chapters from our book are now available at: www.worldbank.org/trade/wto