
WSO2Con USA 2017: Driving Insights for Your Digital Business With Analytics
40
Driving Insights for Your Digital Business With Analytics Srinath Perera (@srinath_perera) VP – Research, WSO2 Member, Apache Foundation
-
Upload
wso2-inc -
Category
Technology
-
view
62 -
download
0
Transcript of WSO2Con USA 2017: Driving Insights for Your Digital Business With Analytics

Driving Insights for Your Digital Business With Analytics
Srinath Perera (@srinath_perera)VP – Research, WSO2 Member, Apache Foundation
Let’s do“Analytics”?
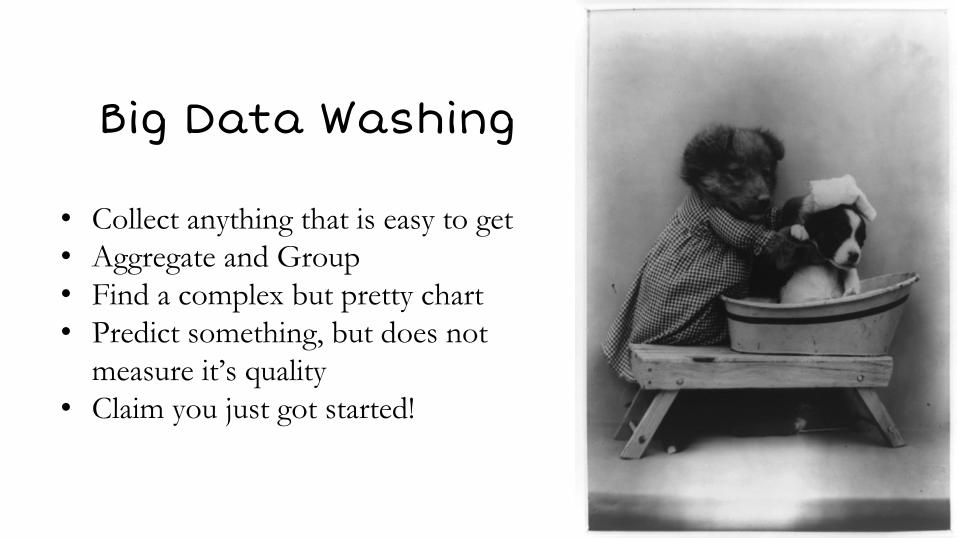
Big Data Washing
• Collect anything that is easy to get• Aggregate and Group • Find a complex but pretty chart • Predict something, but does not
measure it’s quality • Claim you just got started!

Uber
• A company worth XX• A taxi company that does not have cars or drivers
A Taxi company
without cars or drivers
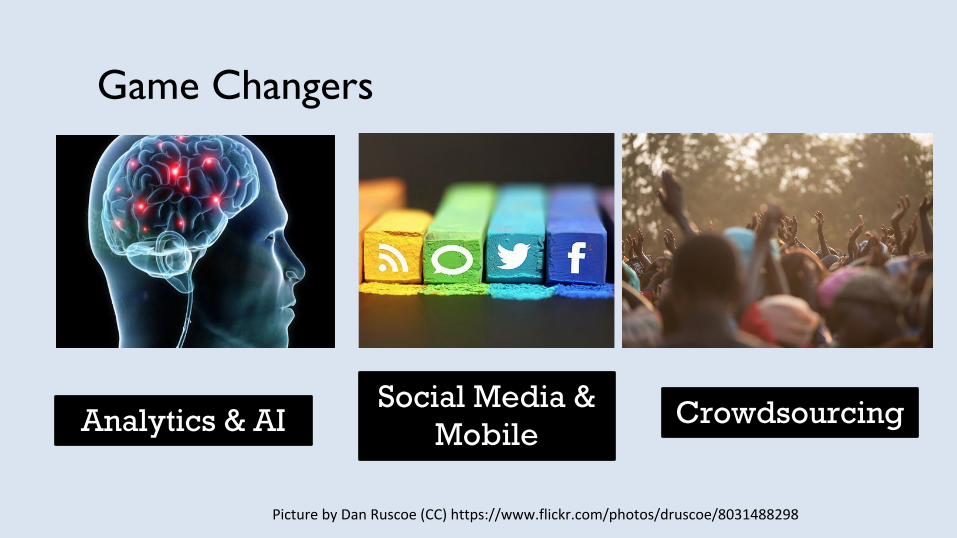
Picture by Dan Ruscoe (CC) https://www.flickr.com/photos/druscoe/8031488298
Game Changers
Analytics & AISocial Media &
Mobile Crowdsourcing
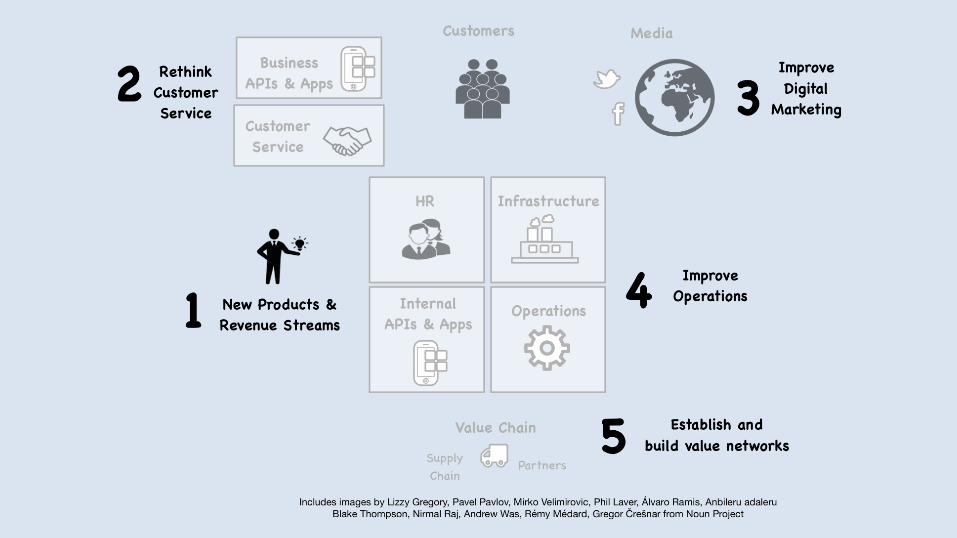
New Digital inspired Products and Revenue
Streams• New way to do business (e.g.
Uber, Amazon Go)• Product as a Service (e.g. IoT
Jack hammer, Light as a service)• Progressive Insurance Gadget • Sell insights ( Telcos knows
where people are, credit card companies know what people buy and their demographics, navigation apps know traffic)
Get Close to your Customers
• Use analytics to optimize the experience
• Predict issues and proactively handle them ( e.g. reschedule automatically when flight has missed)
• Predict churn and act • Track the brand and manage it • Target your marketing
Optimizations
• Reduce Fraud • Logistics, day to day operations • Analytics for hiring and
Performance appraisal• Predictive maintenance • Sales analytics, demand
prediction • Security and surveillance

Making this real
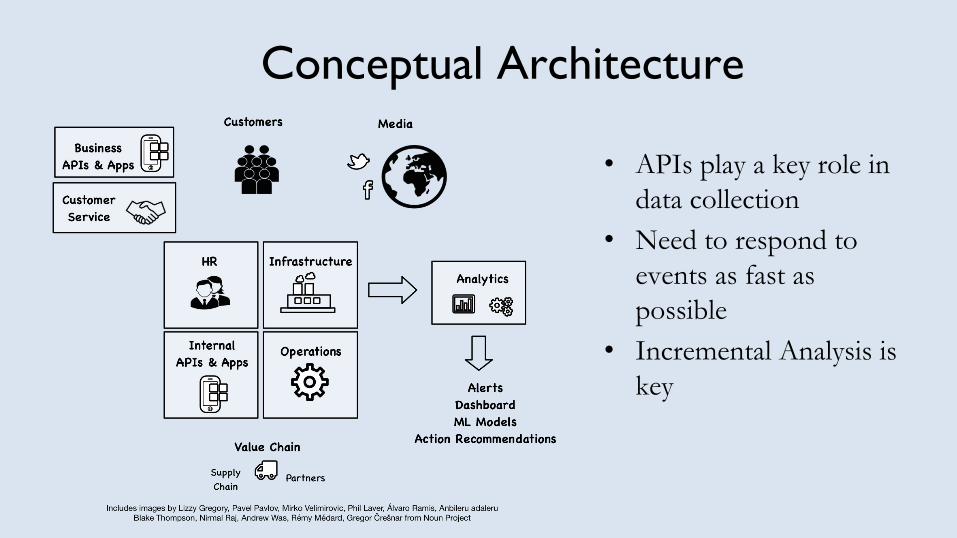
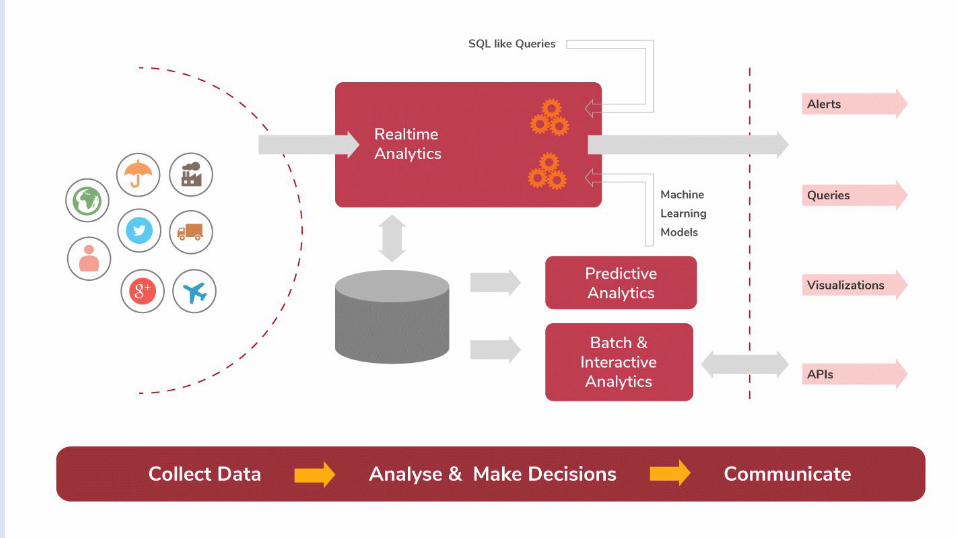
Conceptual Architecture
• APIs play a key role in data collection
• Need to respond to events as fast as possible
• Incremental Analysis is key
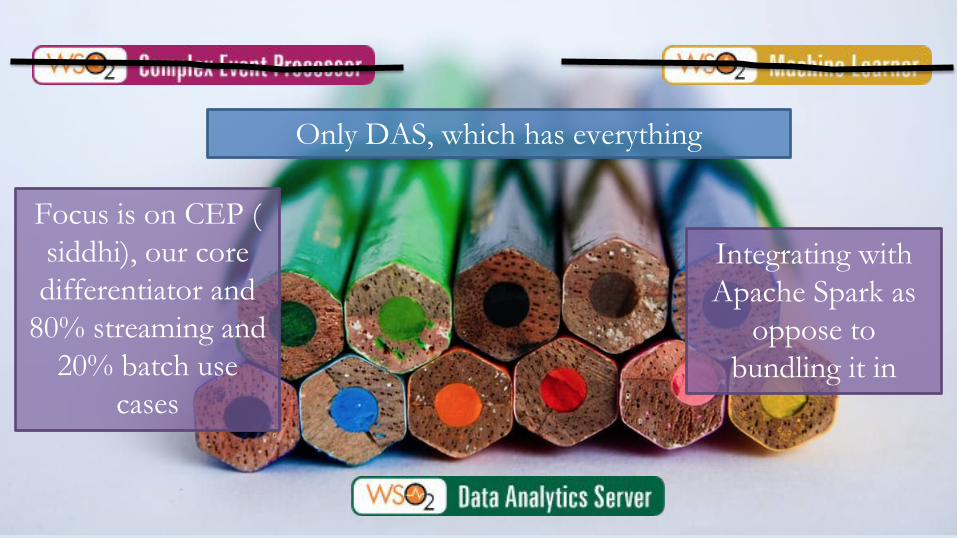
Only DAS, which has everything
Focus is on CEP ( siddhi), our core differentiator and
80% streaming and 20% batch use
cases
Integrating with Apache Spark as
oppose to bundling it in
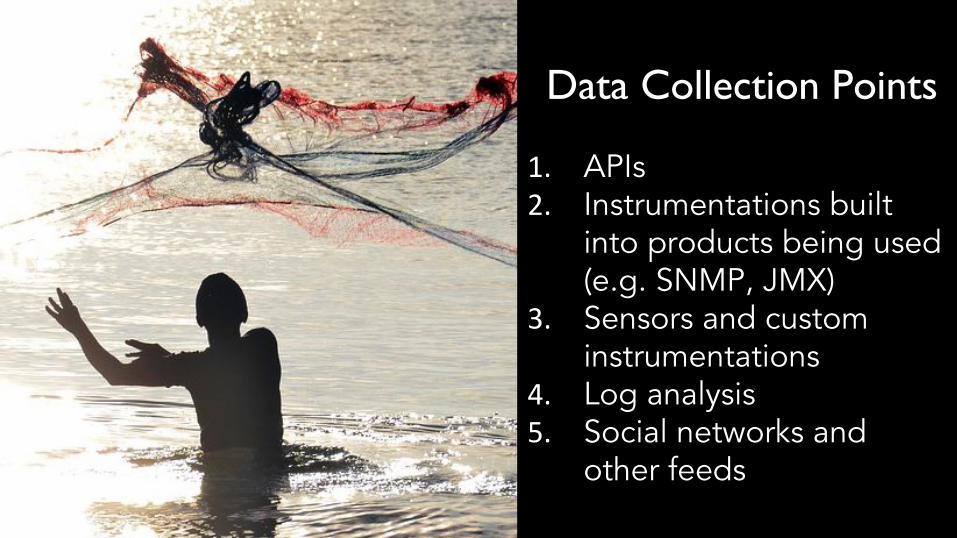
Data Collection Points
1. APIs2. Instrumentations built
into products being used (e.g. SNMP, JMX)
3. Sensors and custom instrumentations
4. Log analysis 5. Social networks and
other feeds
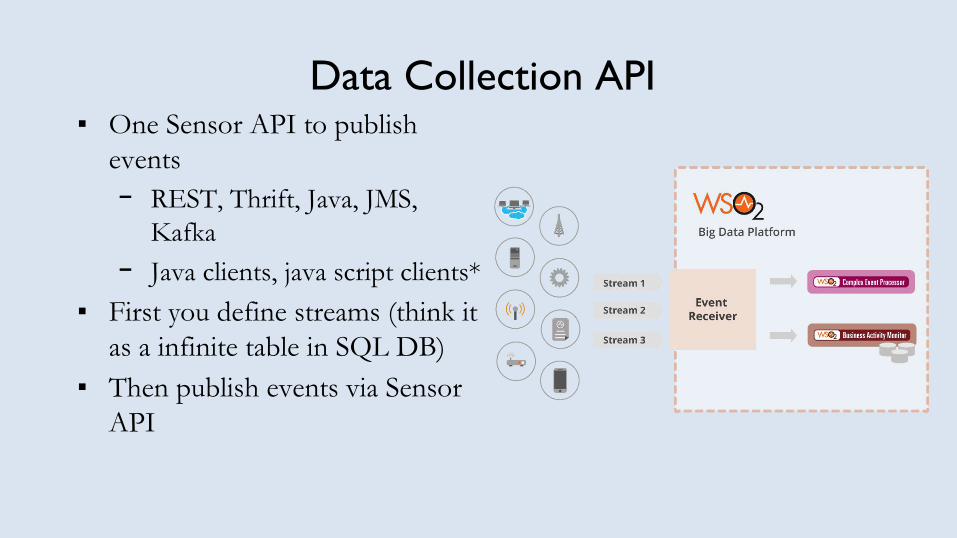
Data Collection API▪ One Sensor API to publish
events - REST, Thrift, Java, JMS,
Kafka- Java clients, java script clients*
▪ First you define streams (think it as a infinite table in SQL DB)
▪ Then publish events via Sensor API
“Publish once, analyze anyway you like”
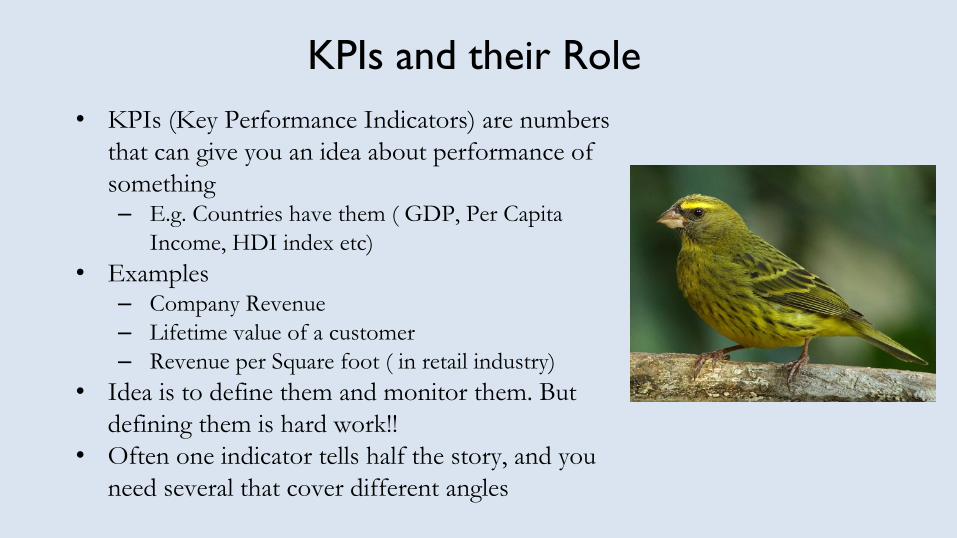
KPIs and their Role• KPIs (Key Performance Indicators) are numbers
that can give you an idea about performance of something – E.g. Countries have them ( GDP, Per Capita
Income, HDI index etc) • Examples
– Company Revenue – Lifetime value of a customer – Revenue per Square foot ( in retail industry)
• Idea is to define them and monitor them. But defining them is hard work!!
• Often one indicator tells half the story, and you need several that cover different angles
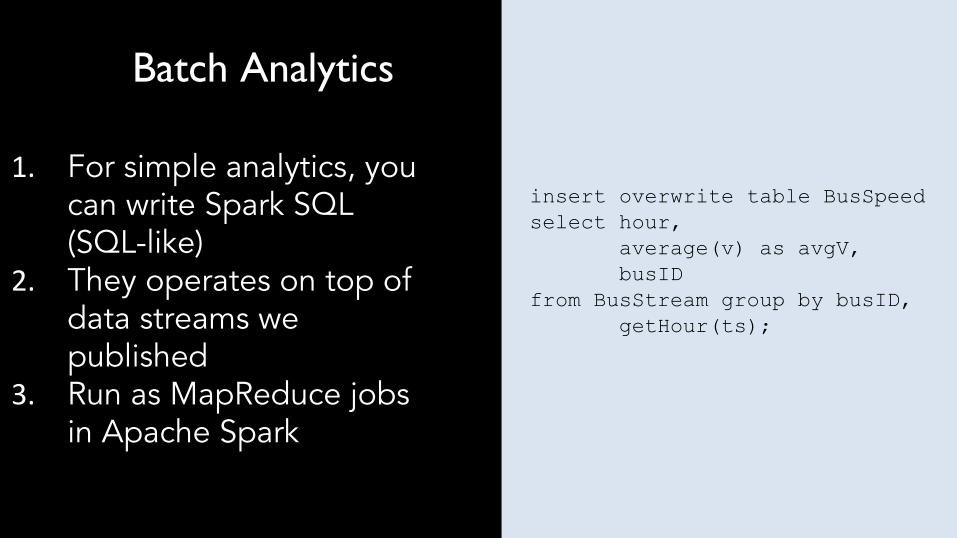
insert overwrite table BusSpeedselect hour, average(v) as avgV, busID from BusStream group by busID, getHour(ts);
Batch Analytics
1. For simple analytics, you can write Spark SQL (SQL-like)
2. They operates on top of data streams we published
3. Run as MapReduce jobs in Apache Spark
Picture by Dan Ruscoe (CC) https://www.flickr.com/photos/druscoe/8031488298
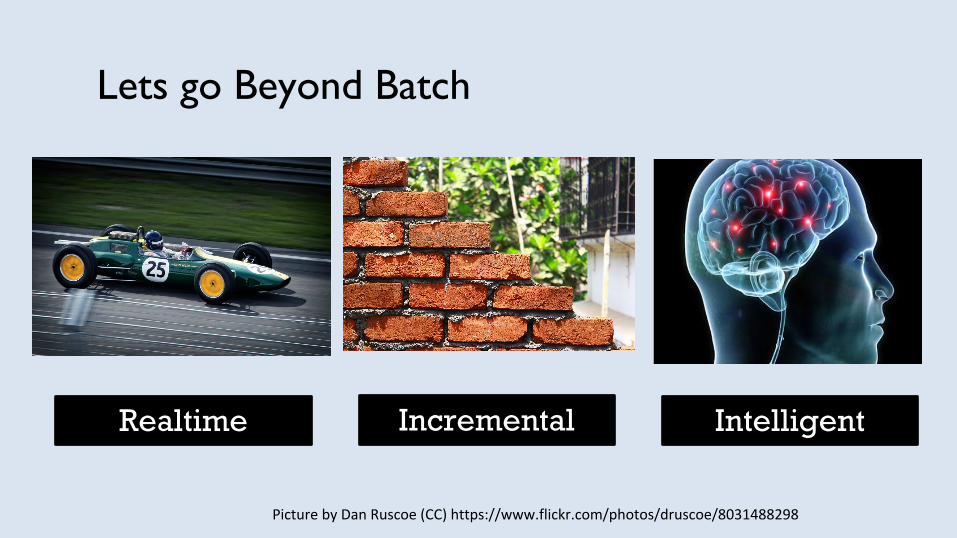
Lets go Beyond Batch
Realtime Incremental Intelligent
Incremental Analytics
• Most “Digital business” use cases are incremental ( data keeps coming, and results should be updated)
• Can do just with batch, but slow and lot of work
• DAS includes set of incremental operators, works just with streaming in most cases.
• Incremental ML is not included yet

Real-time: Value of some Insights degrade Fast!
1. Stock Markets 2. Fraud3. Surveillance4. Patient Monitoring 5. Traffic
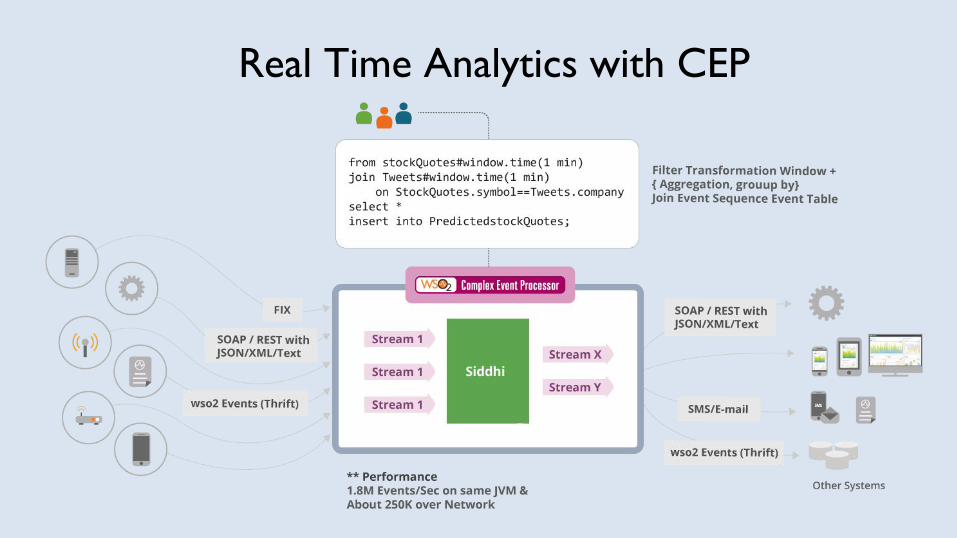
Real Time Analytics with CEP
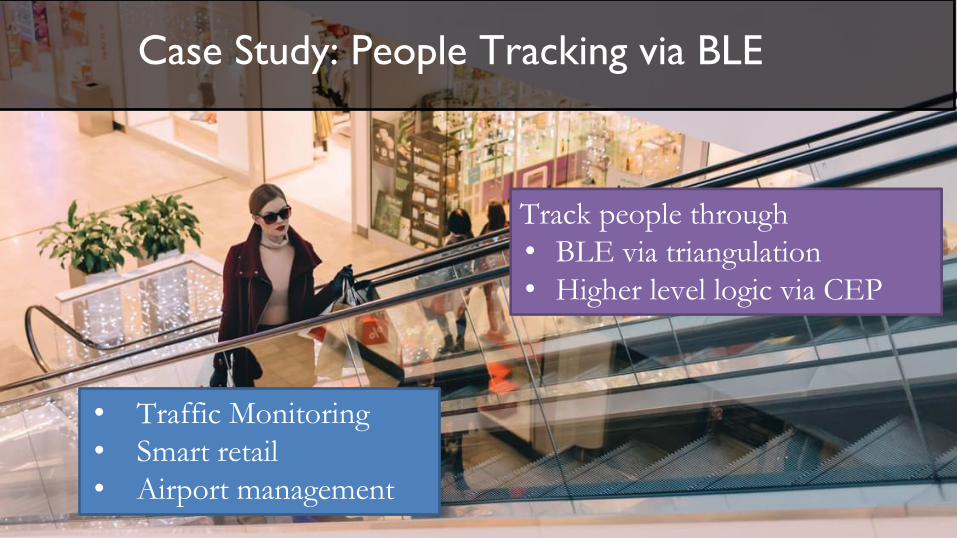
Case Study: People Tracking via BLE
• Traffic Monitoring • Smart retail • Airport management
Track people through • BLE via triangulation• Higher level logic via CEP
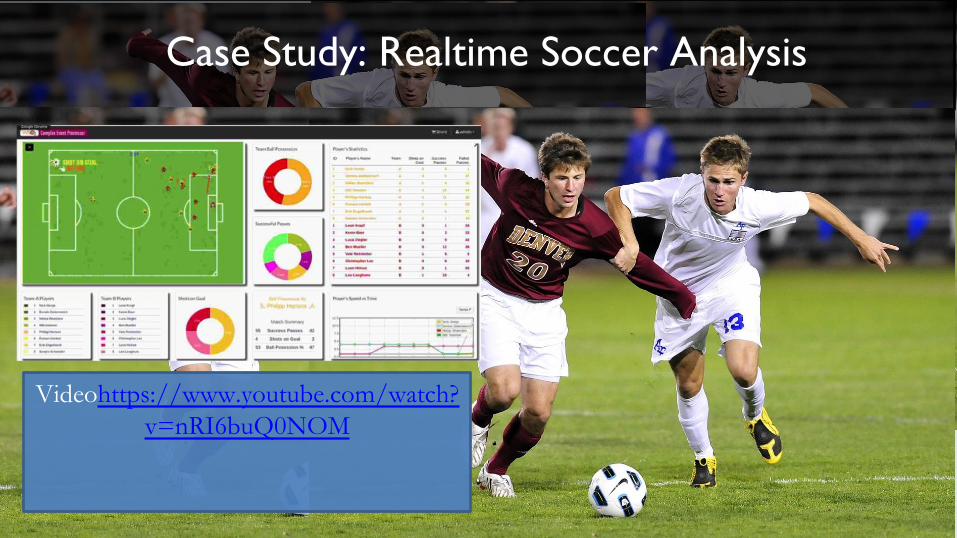
Case Study: Realtime Soccer Analysis
Videohttps://www.youtube.com/watch?v=nRI6buQ0NOM
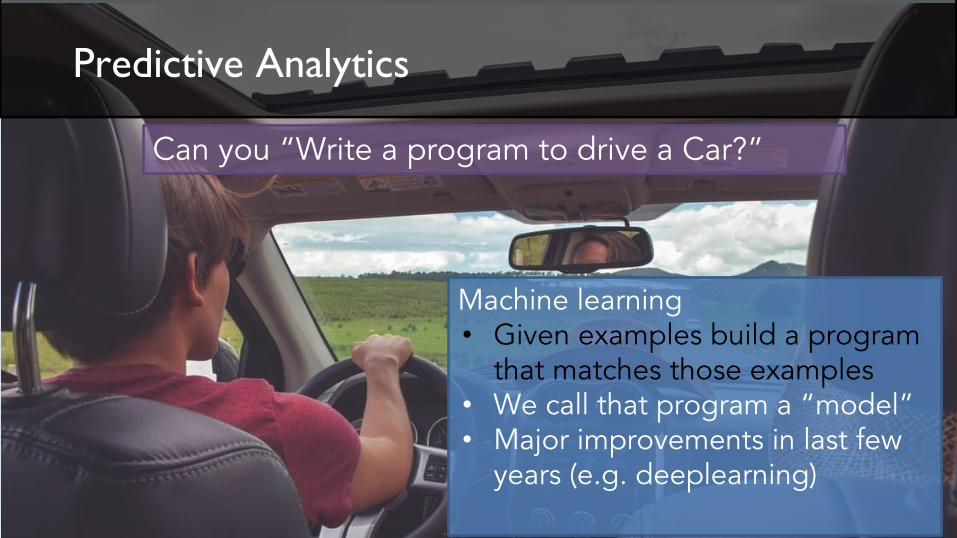
Machine learning • Given examples build a program
that matches those examples• We call that program a “model”• Major improvements in last few
years (e.g. deeplearning)
Can you “Write a program to drive a Car?”
Predictive Analytics
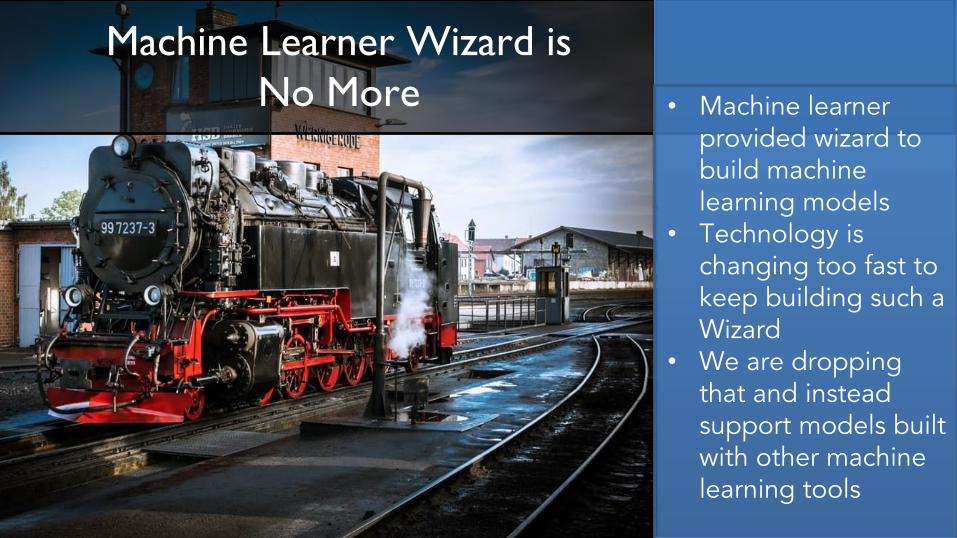
Machine Learner Wizard is No More • Machine learner
provided wizard to build machine learning models
• Technology is changing too fast to keep building such a Wizard
• We are dropping that and instead support models built with other machine learning tools

Using ML Models• We support models built with
following tools• PMML• Spark
• We recommend PySpark as default ( works with DAS)
• Models can be used them with both WSO2 CEP and ESB
• Tensorflow, H20 models are coming ( can do already by writing an extension)
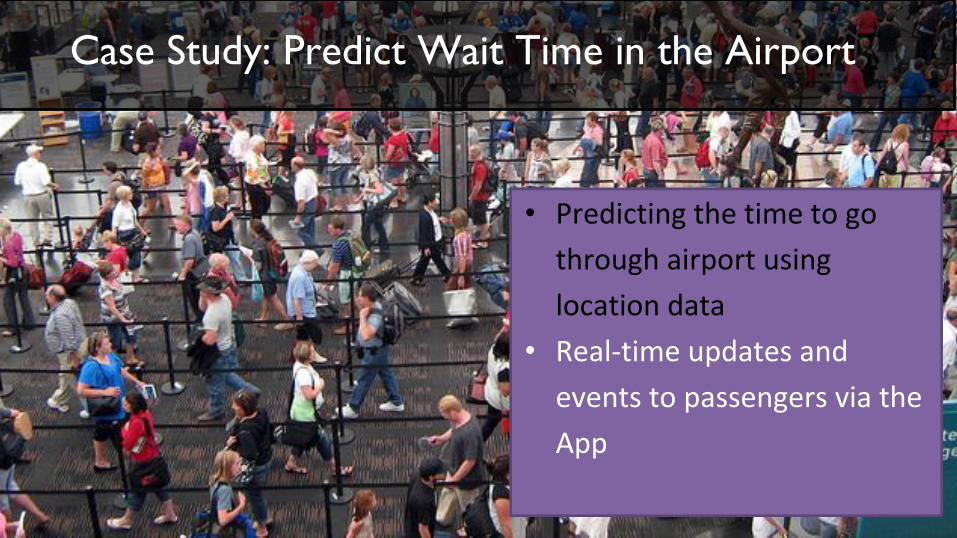
Case Study: Predict Wait Time in the Airport
• Predicting the time to go
through airport using
location data
• Real-time updates and
events to passengers via the
App

Anomaly Detection• Find the Odd one out
• Anomalies by value though “Clustering”
• Anomalies through time using Markov Chains
• Detect Problems are drill in to find details
• Available as a solution
White paper: Fraud Detection and Prevention: A Data
Analytics ApproachImage "Reading" by Creative Stall (cc), Noun Project

Communicate
Dashboard Alerts APIs
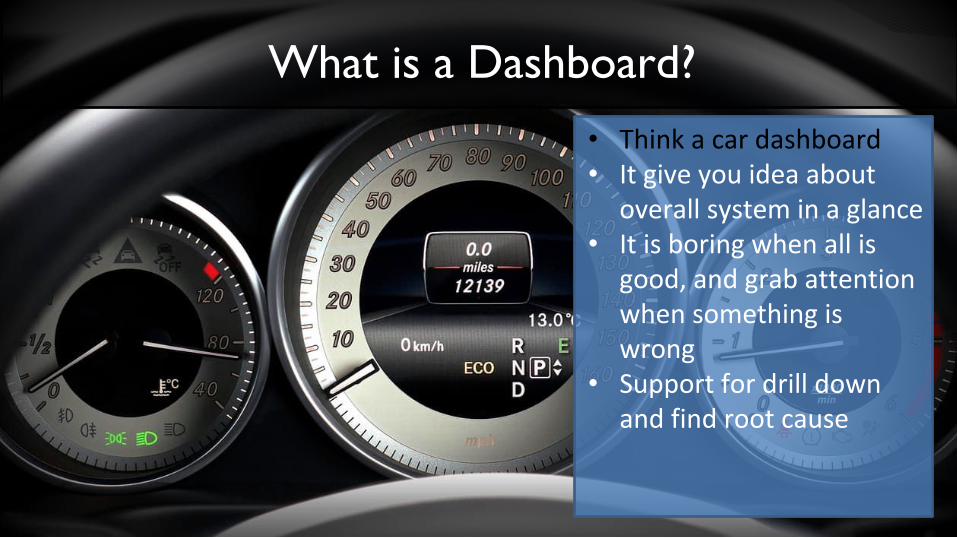
What is a Dashboard?• Think a car dashboard • It give you idea about
overall system in a glance • It is boring when all is
good, and grab attention when something is wrong
• Support for drill down and find root cause
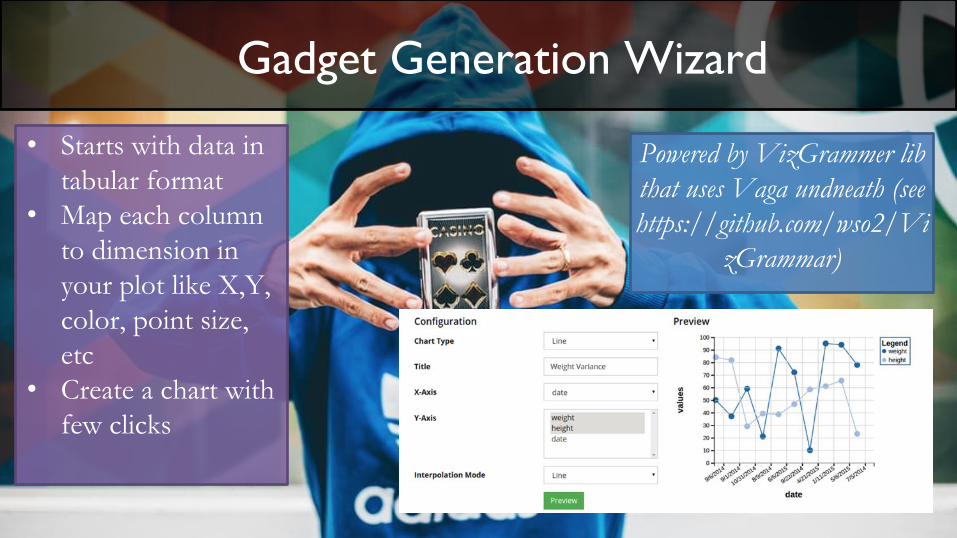
• Starts with data in tabular format
• Map each column to dimension in your plot like X,Y, color, point size, etc
• Create a chart with few clicks
Powered by VizGrammer lib that uses Vaga undneath (see https://github.com/wso2/Vi
zGrammar)
Gadget Generation Wizard

• When data cross security domains, there are security and management concerns
• APIs ( e.g. WSO2 APIM) solve these problems
Often data are accessed through the network
– Mobile Apps– Query interfaces– Data integration – As a Subscription
Expose data through API
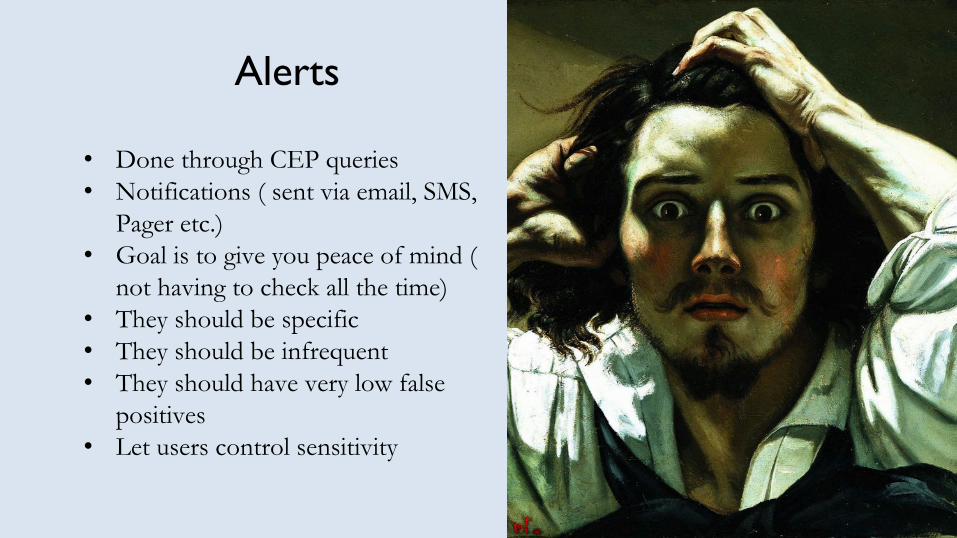
Alerts
• Done through CEP queries• Notifications ( sent via email, SMS,
Pager etc.) • Goal is to give you peace of mind (
not having to check all the time) • They should be specific • They should be infrequent • They should have very low false
positives • Let users control sensitivity

Take the time to Understand!!
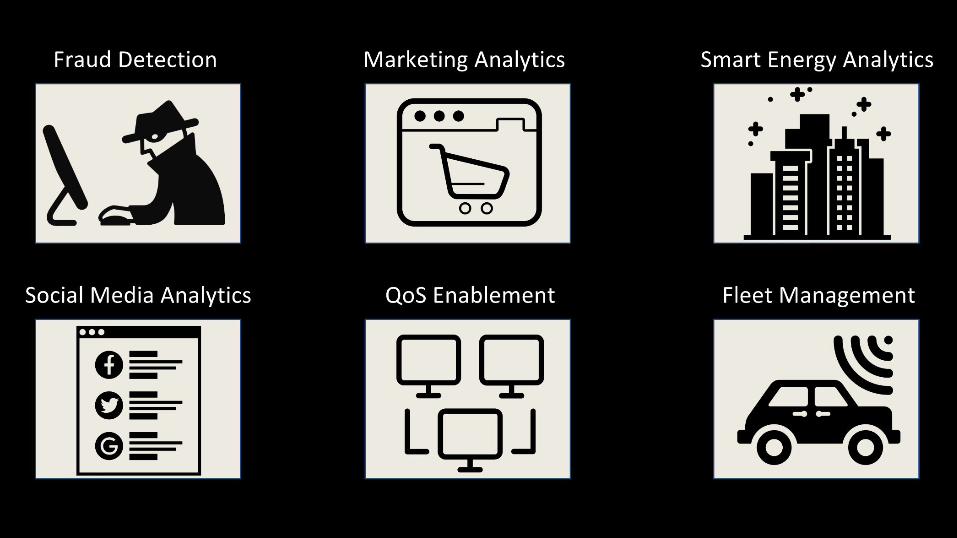
Solutions
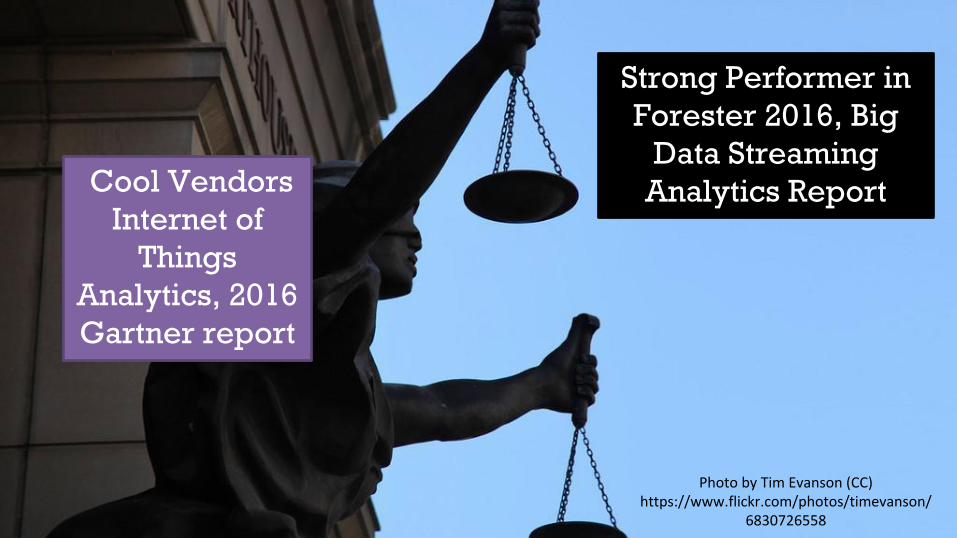
Cool Vendors Internet of
Things Analytics, 2016 Gartner report
Strong Performer in Forester 2016, Big
Data Streaming Analytics Report
Photo by Tim Evanson (CC) https://www.flickr.com/photos/timevanson/
6830726558
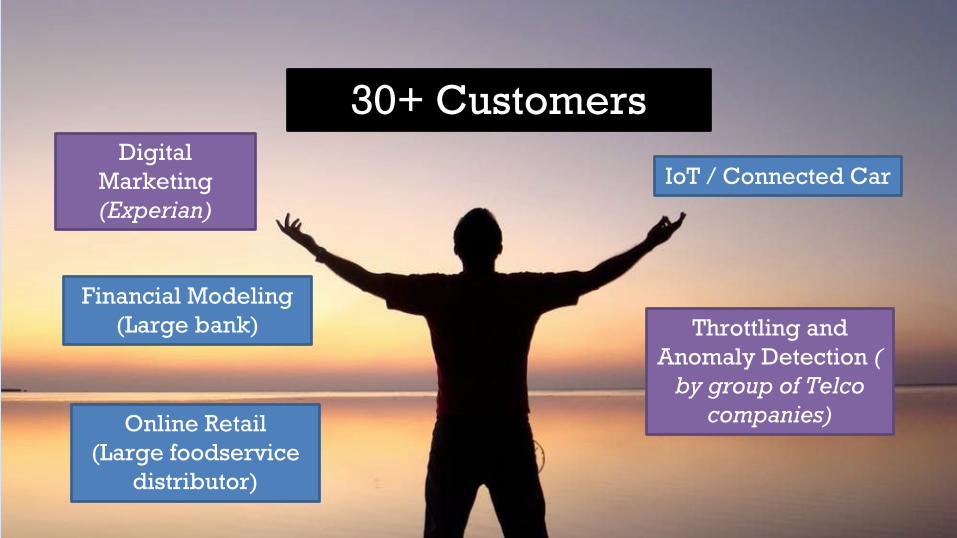
Throttling and Anomaly Detection (
by group of Telco companies)
Digital Marketing(Experian)
Financial Modeling(Large bank)
30+ CustomersIoT / Connected Car
Online Retail(Large foodservice
distributor)
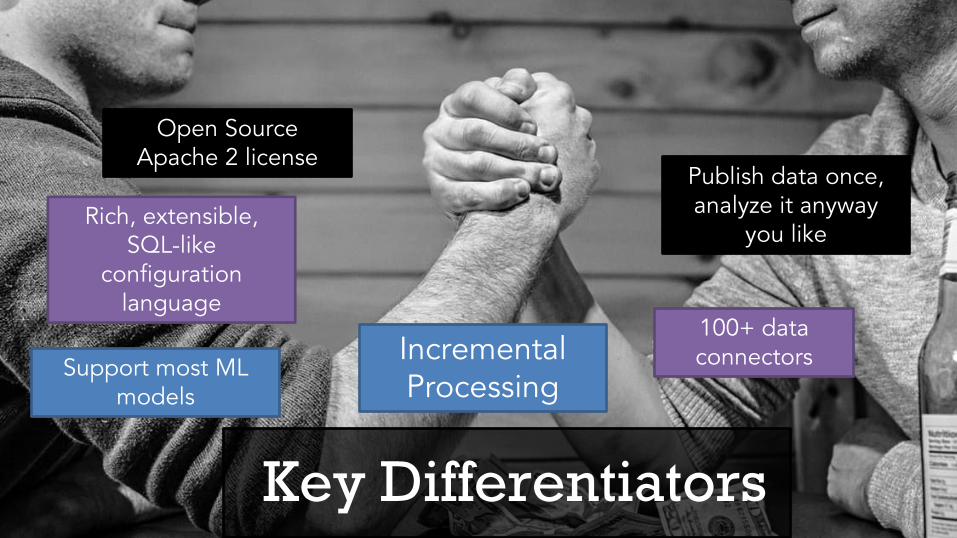
Open SourceApache 2 license
Publish data once, analyze it anyway
you like Rich, extensible,
SQL-like configuration
language100+ data connectorsSupport most ML
models
Incremental Processing
Key Differentiators

Thank You!Questions?