

Writing Results Payam Kabiri, MD. PhD. Epidemiologist Isfahan University of Medical Sciences.
42
Writing Results Payam Kabiri, MD. PhD. Epidemiologist Isfahan University of Medical Sciences
-
Upload
ariel-fields -
Category
Documents
-
view
217 -
download
3
Transcript of Writing Results Payam Kabiri, MD. PhD. Epidemiologist Isfahan University of Medical Sciences.
Writing Results
Payam Kabiri, MD. PhD.
Epidemiologist
Isfahan University of Medical Sciences
Results
Simple complex
Describe the population Start with positive findings Establish how comparable your groups were Use a mixture of text, tables and figures Mention units of measurement Mention what numbers, brackets, etc. refer to
9+4, 854 (12.3) Bring and explain P values
Results
Provide only enough interpretation to lead the reader from one experiment to the other Avoid lengthy analysis and comparison to the
work of others
No need to follow chronology of study Rather, provide a logical progression and tell a
story
Results
“Stand alone” tables Make sure totals add to 100% Do not repeat the Tables and Figures in text
Summarize: e.g., there were no significant associations…
Describe: e.g. there was a three fold increase in the risk of ..
5
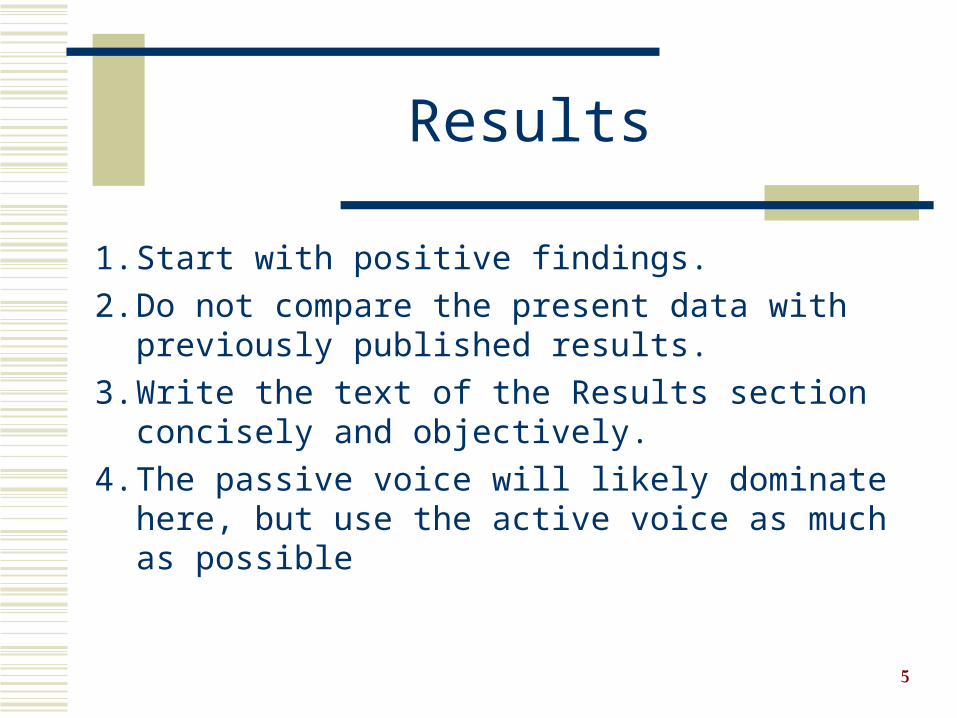
1. Start with positive findings.
2. Do not compare the present data with previously published results.
3. Write the text of the Results section concisely and objectively.
4. The passive voice will likely dominate here, but use the active voice as much as possible
Results
6
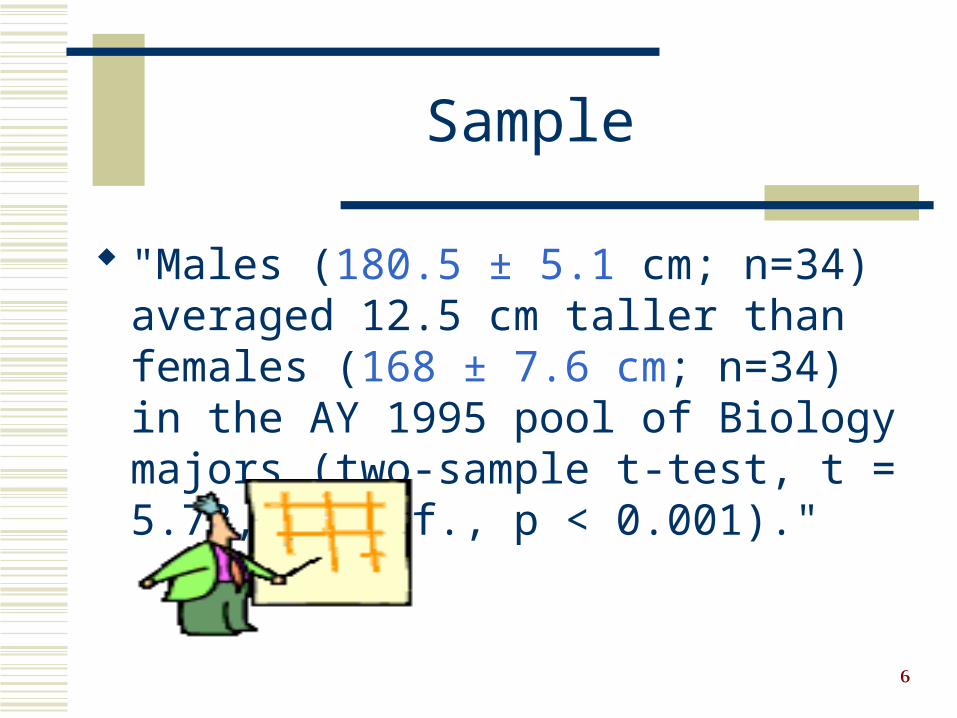
"Males (180.5 ± 5.1 cm; n=34) averaged 12.5 cm taller than females (168 ± 7.6 cm; n=34) in the AY 1995 pool of Biology majors (two-sample t-test, t = 5.78, 33 d.f., p < 0.001)."
Sample
7
Tables and Figures
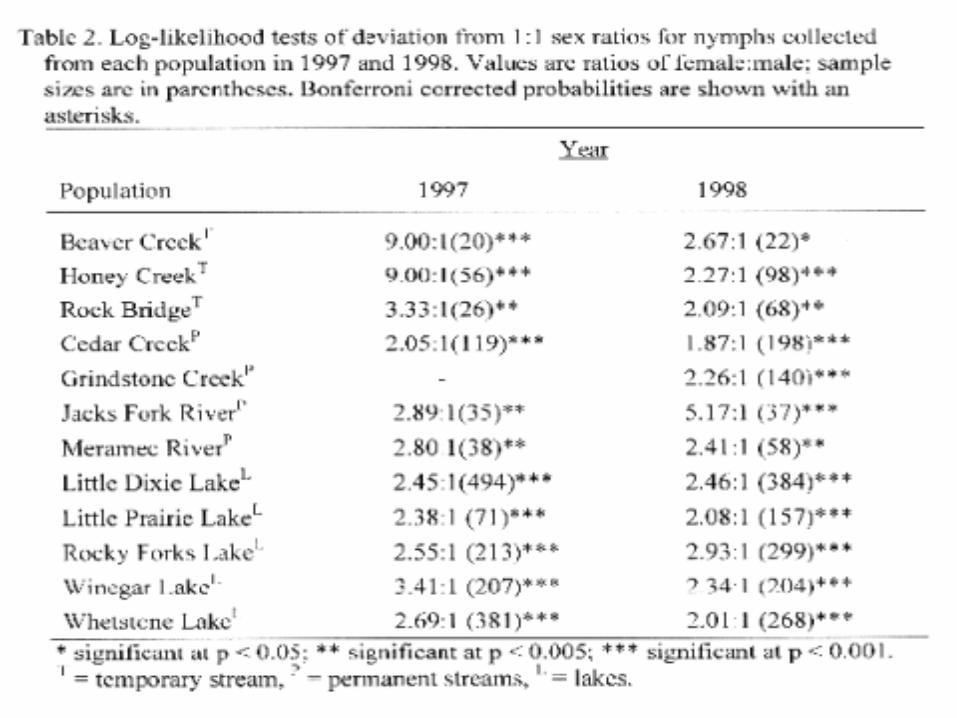
Consider using a table to present large amounts of data/results. Must refer to all tables in text.
Use figures to graphically represent significant results.
8
Tables and Figures are assigned numbers separately and in the sequence that you will refer to them from the text. The first Table you refer to is Table 1, the next
Table 2 and so forth. Similarly, the first Figure is Figure 1, the next
Figure 2, etc.
Tables and Figures
9
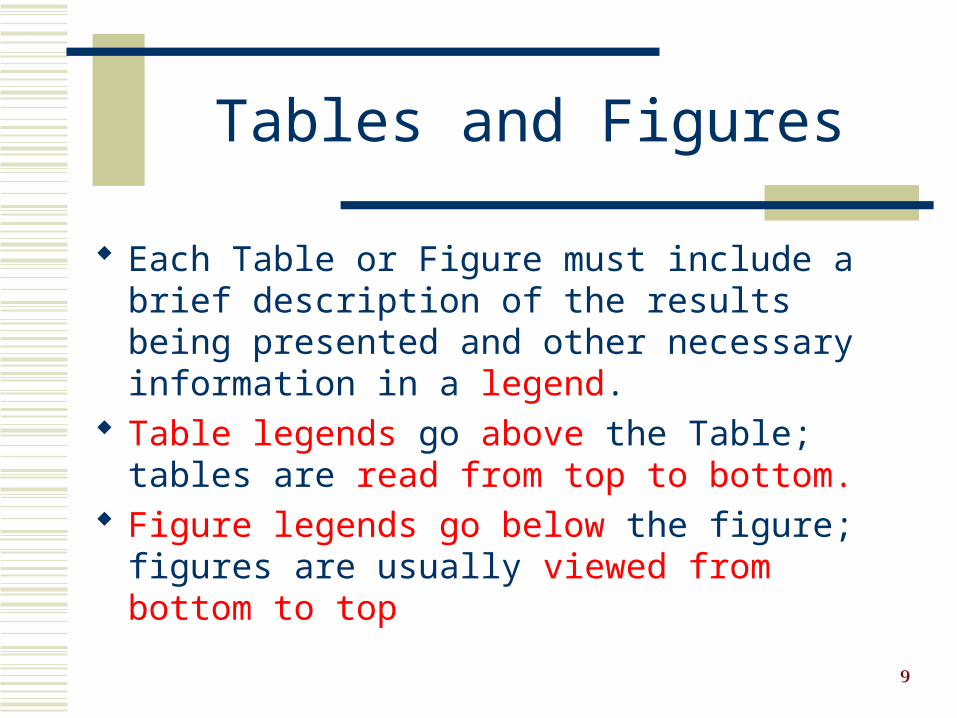
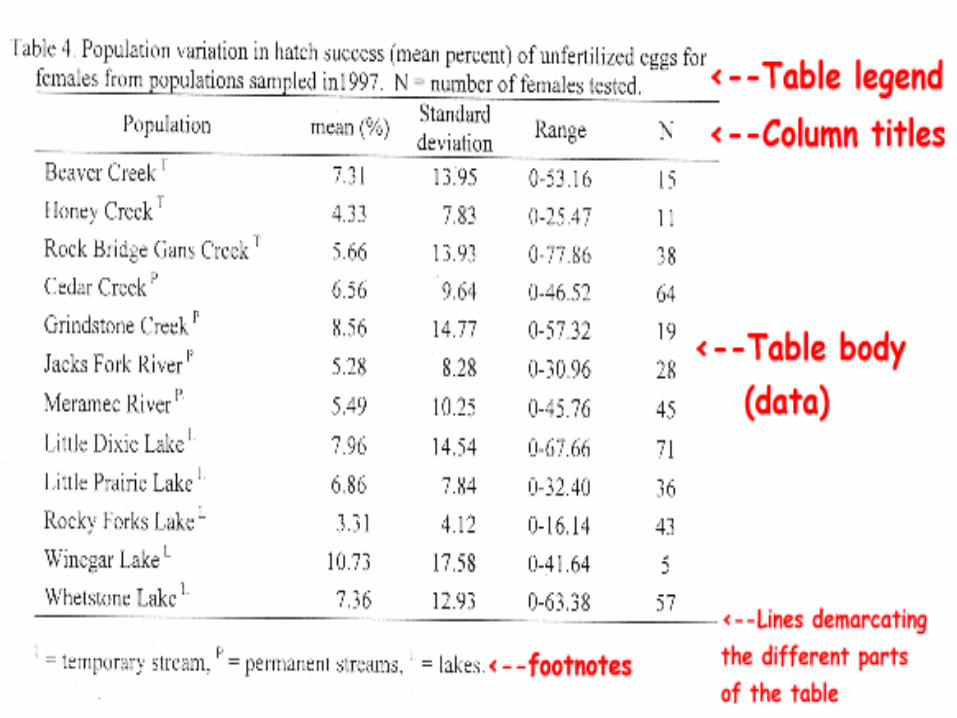
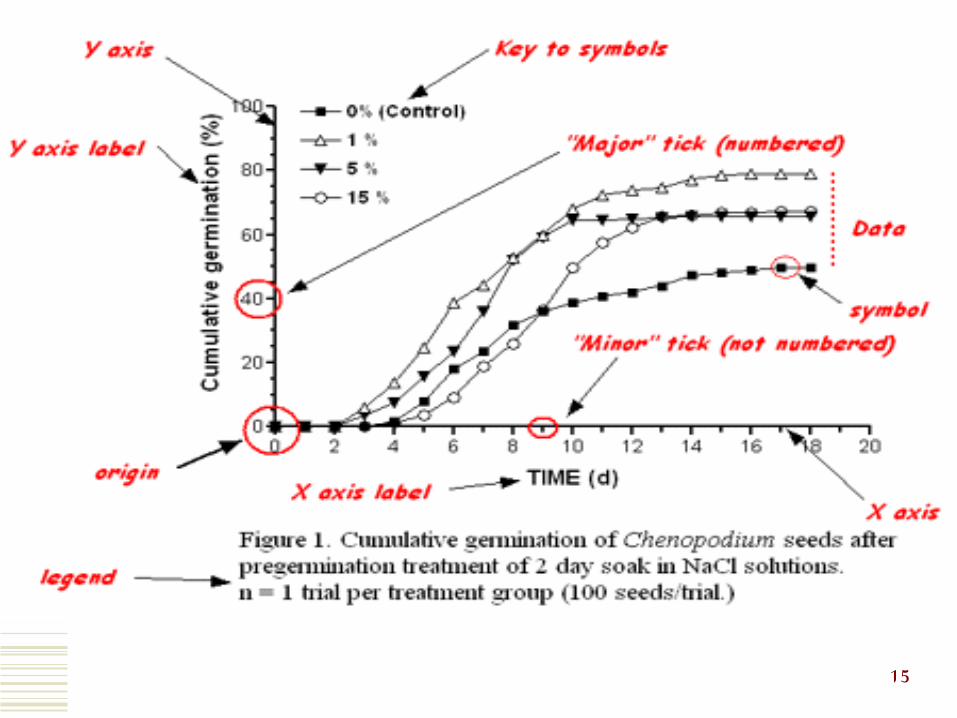
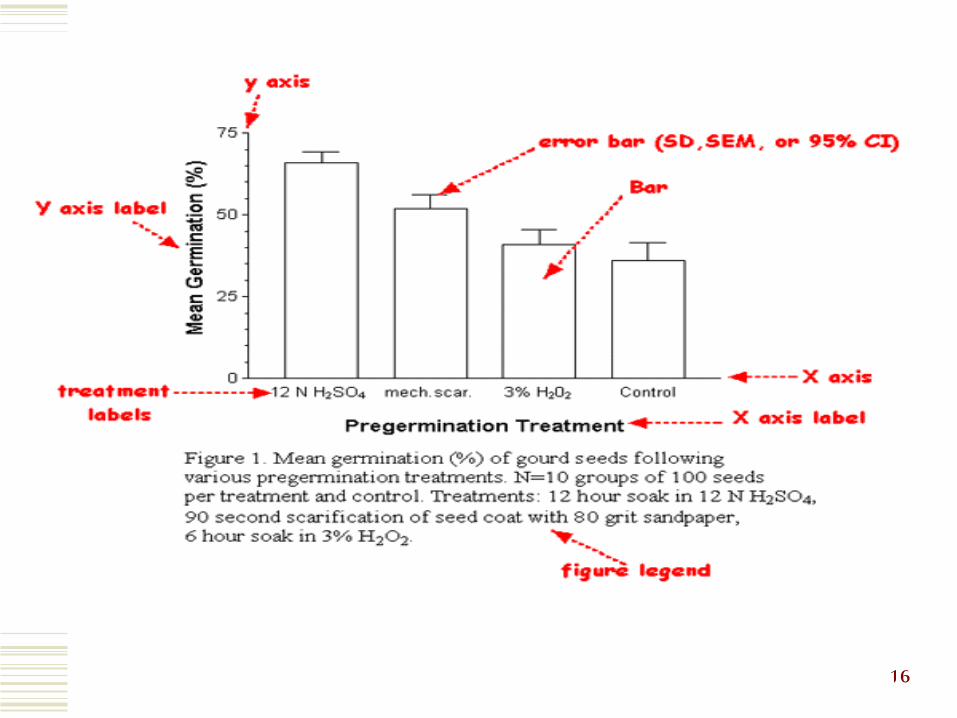
Each Table or Figure must include a brief description of the results being presented and other necessary information in a legend.
Table legends go above the Table; tables are read from top to bottom.
Figure legends go below the figure; figures are usually viewed from bottom to top
Tables and Figures
10
Example 1: Courtesy of Shelley Ball.
Example 2: Courtesy of Shelley Ball.
11
12
When refeering to a table from the text, "Figure" is abbreviated as Fig.,e.g., Fig. 1.
Table is never abbreviated, e.g., Table 1.
Tables and Figures
13
Figures are visual presentations of results, including graphs, diagrams, photos, drawings, schematics, maps, etc.
Graphs are the most common type of figure. Graphs show trends or patterns of
relationship.
Figures
14
Avoid clutter (too many numbers or symbols) Should provide a clear statistical messageVertical (“Y”) axis: outcome/dependent variableHorizontal (“X”) axis: exposure/independent var.
Figures
15
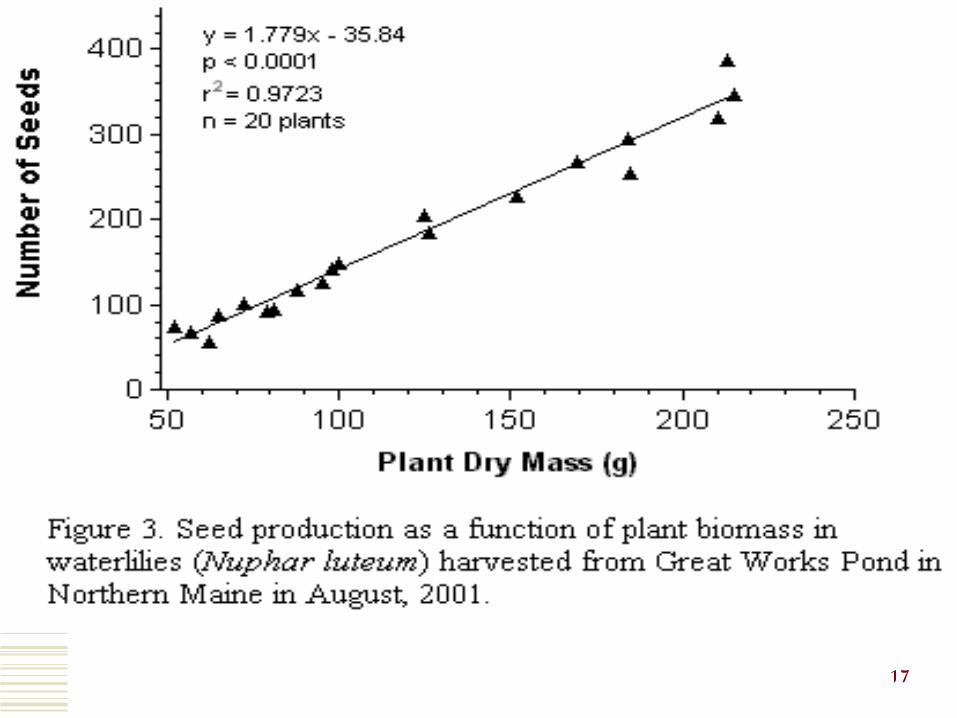
16
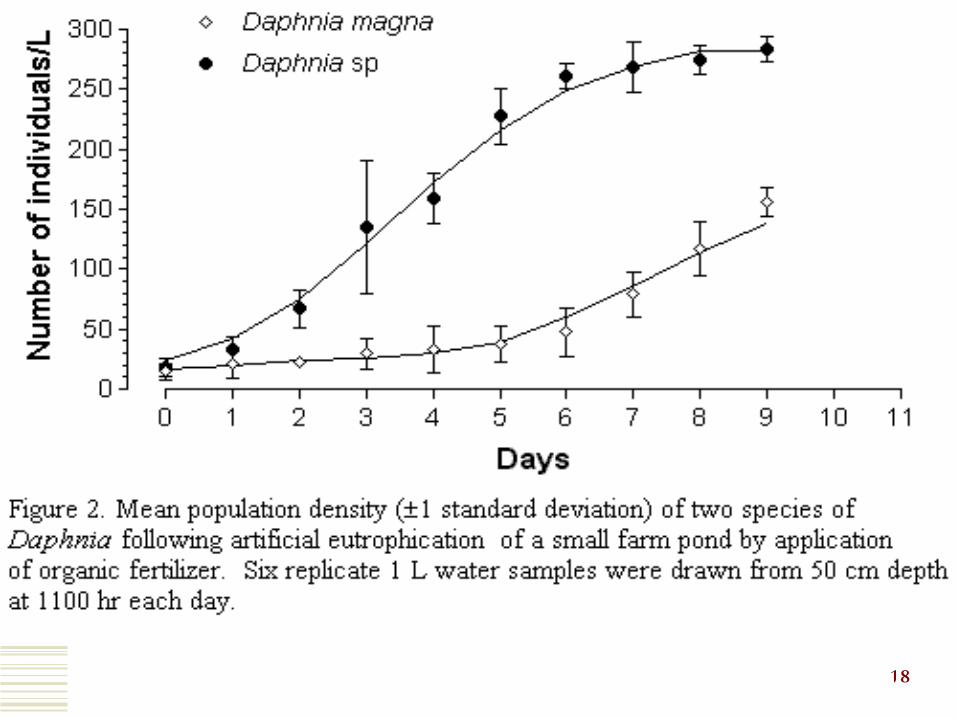
17
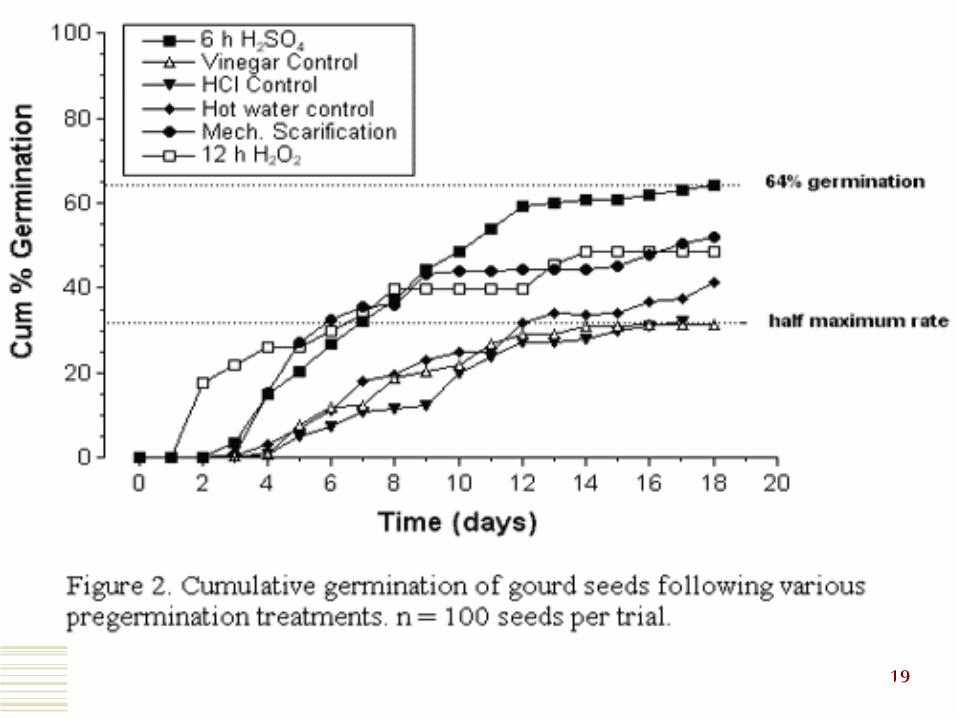
18
19
20
Some things to avoid
Do not present the same data in both a Table and Figure - this is considered redundant and a waste of space and energy.
Decide which format best shows the result and go through it.
Do not report raw data values when they can be summarized as means, percents, etc.
21
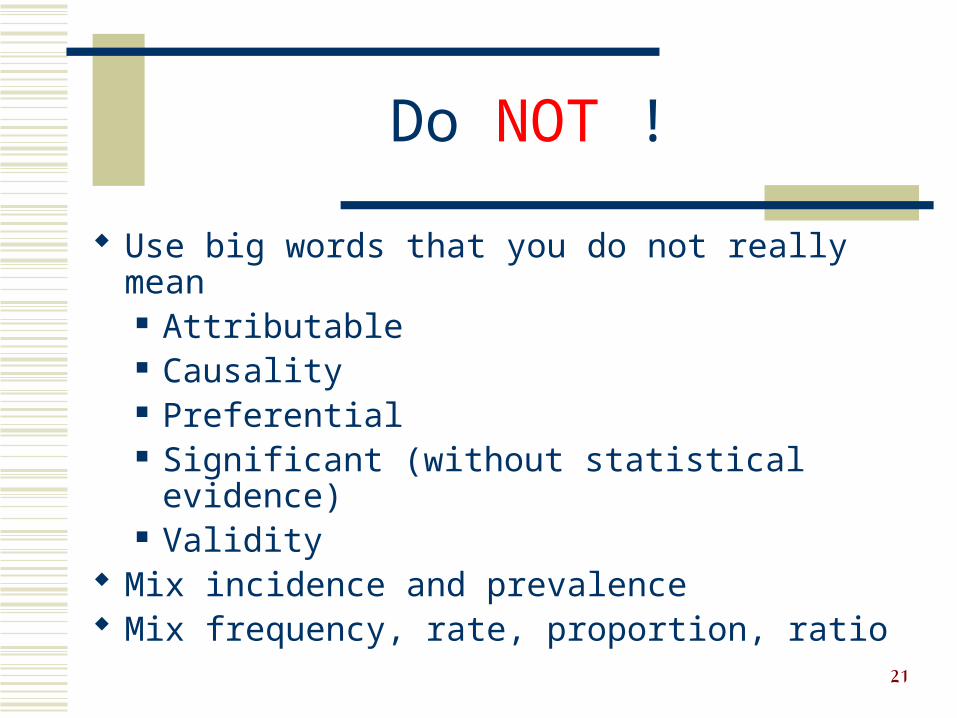
Do NOT !
Use big words that you do not really mean Attributable Causality Preferential Significant (without statistical evidence) Validity
Mix incidence and prevalence Mix frequency, rate, proportion, ratio
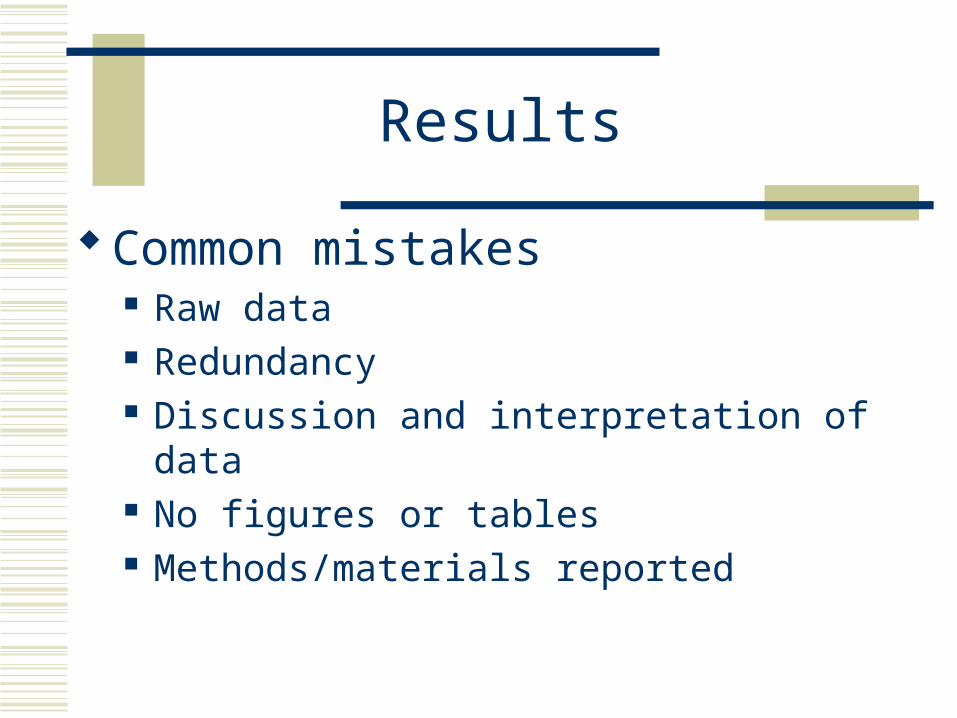
Results
Common mistakes Raw data Redundancy Discussion and interpretation of data No figures or tables Methods/materials reported
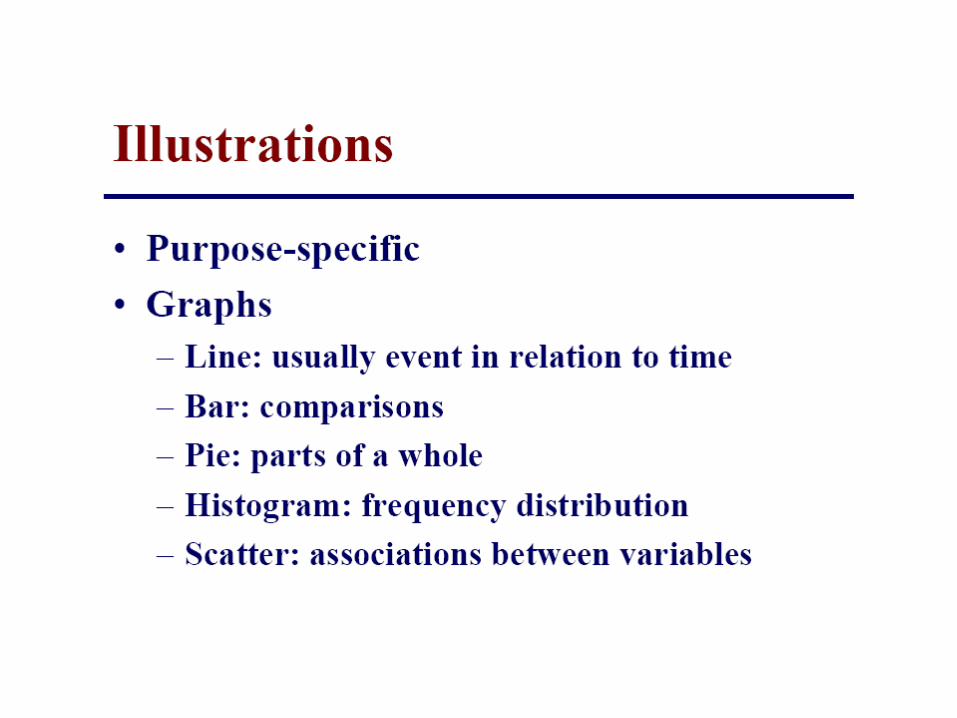
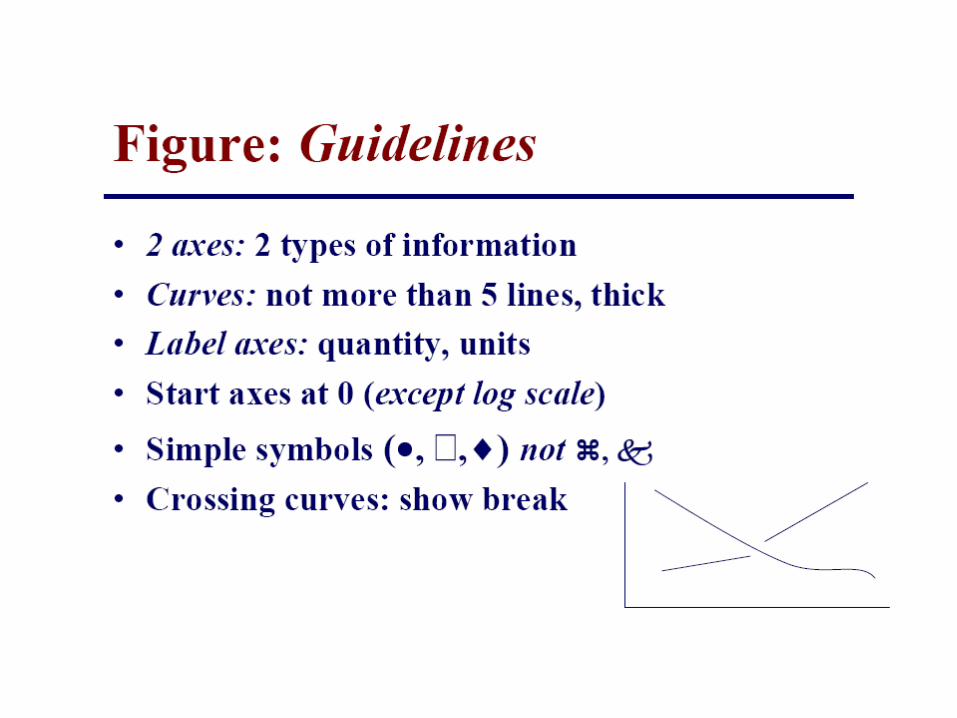
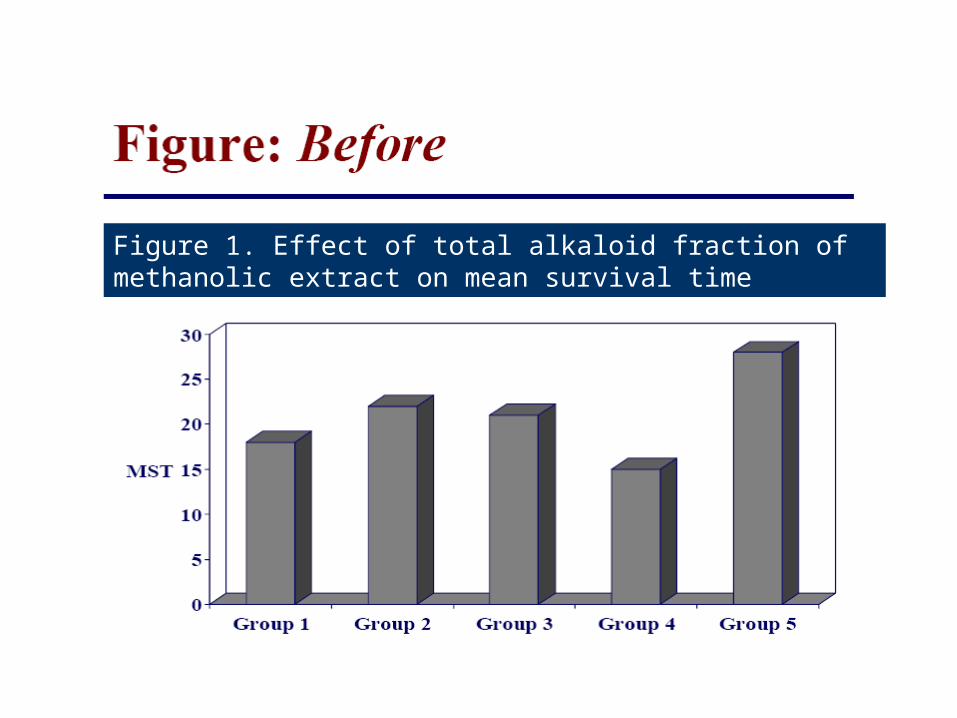
Figure 1. Effect of total alkaloid fraction of methanolic extract on mean survival time
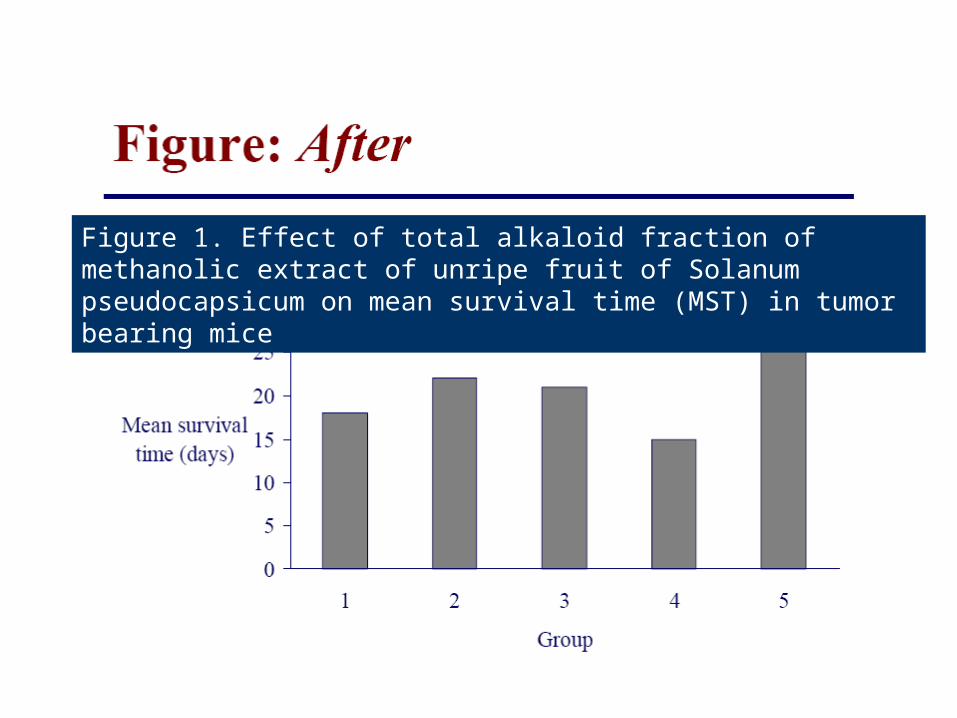
Figure 1. Effect of total alkaloid fraction of methanolic extract of unripe fruit of Solanum pseudocapsicum on mean survival time (MST) in tumor bearing mice


گزارش نتايج آماري
نوشتن تعداد فراواني همراه با درصدها وقتي تعداد نمونه اندكاست.
ها عدم نياز به نوشتن فرمولنوشتن شاخص آزمون و مقدار آن همراه با درجه آزادي و
p-value اند مانند ميانگين, نسبت يا كه آزمون شدهپارامترهايی ارائه
دار نشده ها معني درصد, ضريب همبستگي, حتي اگر آزمونباشند.
رود كار ميه ب دار تعريف كردن عالئمي كه براي نتايج معني كار بردن عالئم مشابهه (مانند ستاره) و ب

نوشتن مقداردقيقp-valueدار هاي معني براي آزمون(تا دو رقم اعشار) دار وغيرمعني
نوشتن اعداد به صورت گرد شده با درنظرگرفتن دقتداده هاي اوليه (ميانگين تا يك رقم اعشار و انحراف
معيار وخطاي معيار تا دو رقم اعشار بيشتر از داده هاي خام)
درج درصدها تا يك رقم اعشار (گاهي حتي نياز بهارقام اعشاري هم نيست).
نوشتن شاخص هايي مانندt ,r تا دو رقم اعشار
گزارش نتايج آماري
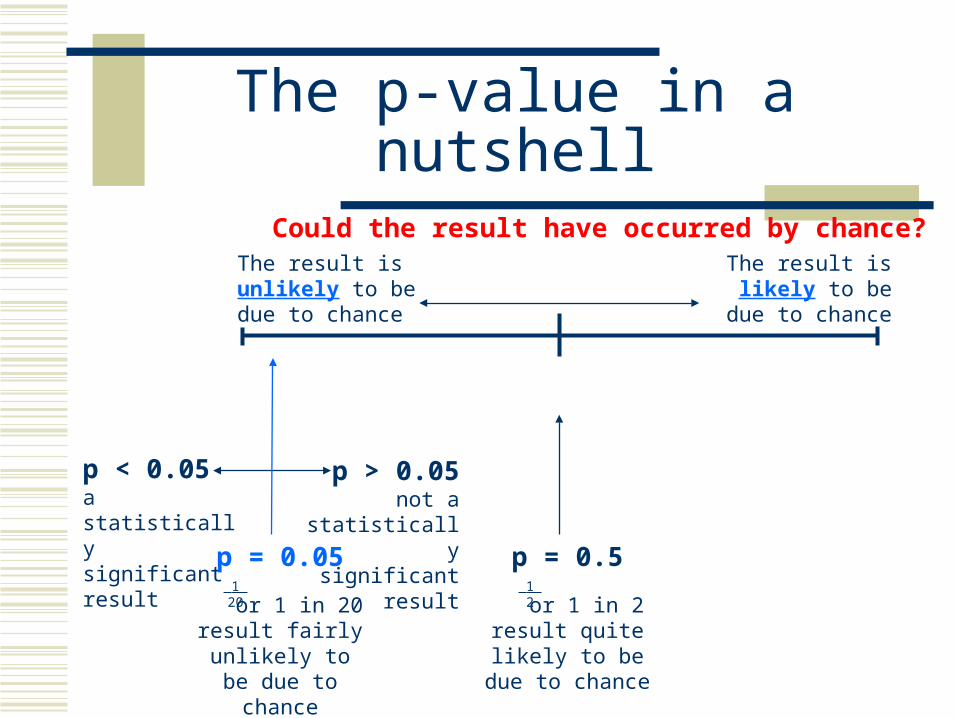
The p-value in a nutshell
p < 0.05a statistically significant result p = 0.05
or 1 in 20result fairly
unlikely to be due to chance
0 1
Could the result have occurred by chance?The result is unlikely to be due to chance
The result is likely to be
due to chance
1 20
p > 0.05not a
statistically significant
resultp = 0.5
or 1 in 2result quite
likely to be due to chance
1 2
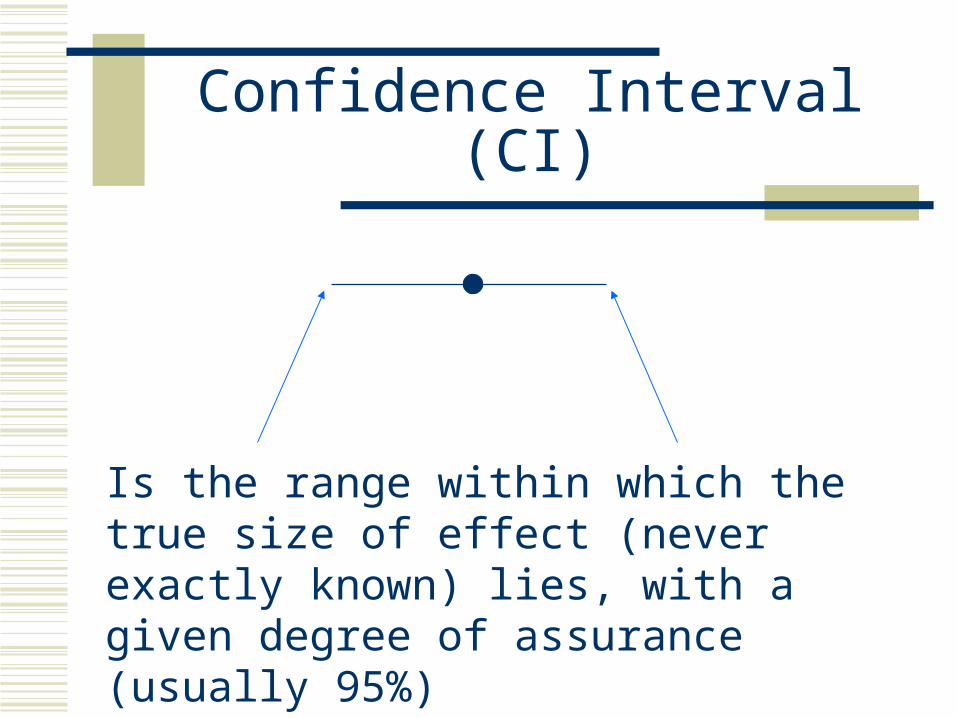
Confidence Interval (CI)
Is the range within which the true size of effect (never exactly known) lies, with a given degree of assurance (usually 95%)
Check list for Results
Baseline data provided? Primary and other endpoints clear and
complete? Does the text complement figures and tables? Are measures of uncertainty mentioned?
(SD, SE, CI)
Mechanics of Writing-Results
Tell a story Use the most logical sequence to present the
data (not necessarily the order in which you did the experiments)
Just report the data - do not include interpretation or comparison to literature
No duplication of data
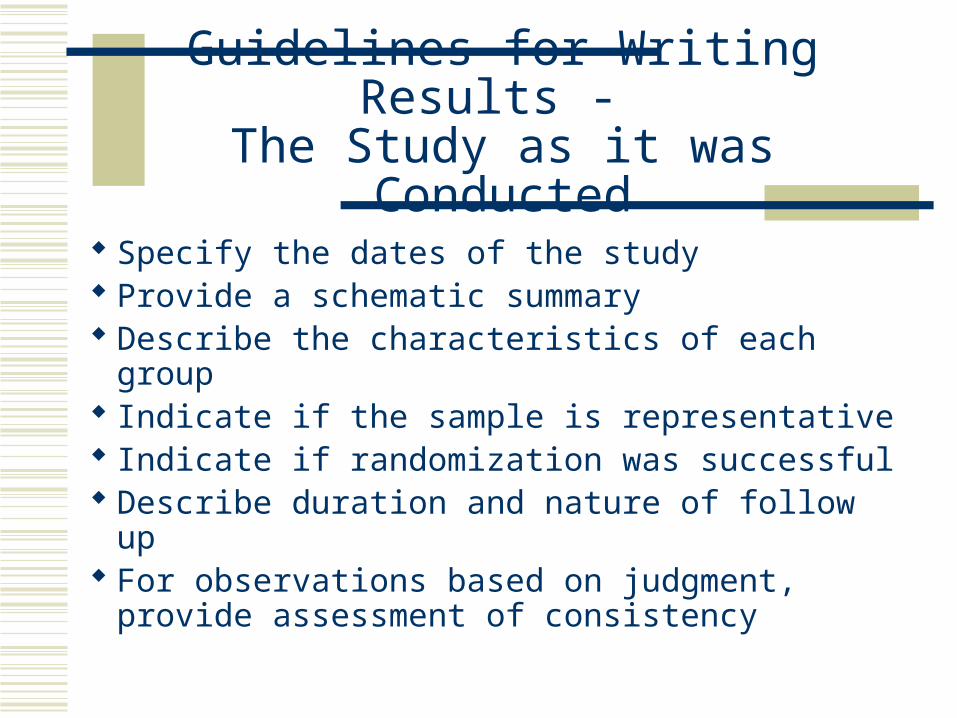
Guidelines for Writing Results - The Study as it was Conducted
Specify the dates of the study Provide a schematic summary Describe the characteristics of each group Indicate if the sample is representative Indicate if randomization was successful Describe duration and nature of follow up For observations based on judgment, provide
assessment of consistency
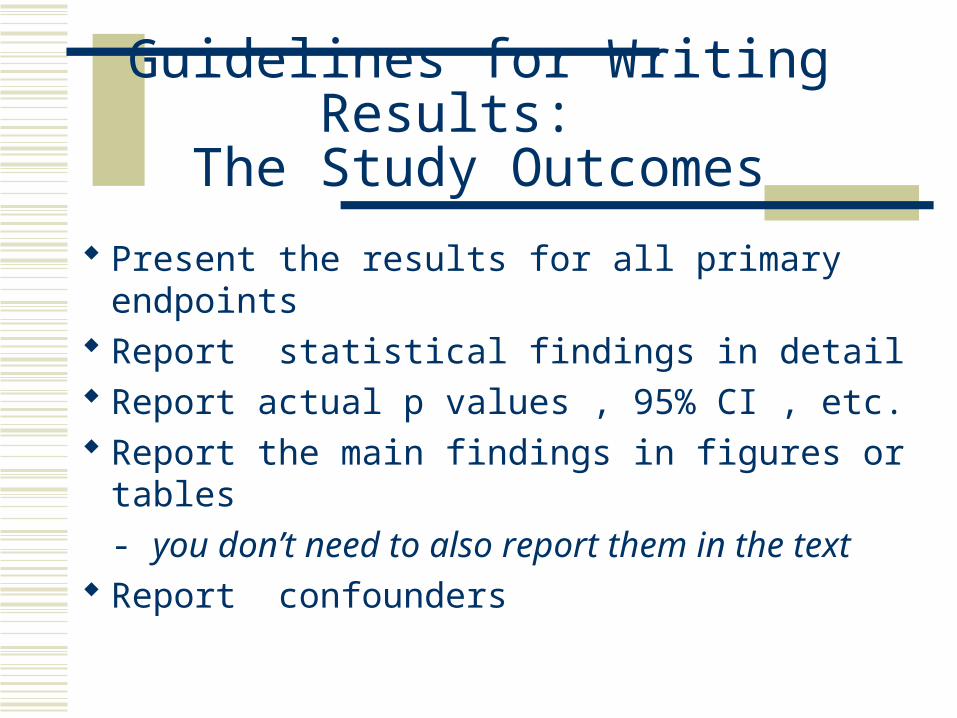
Guidelines for Writing Results: The Study Outcomes
Present the results for all primary endpoints Report statistical findings in detail Report actual p values , 95% CI , etc. Report the main findings in figures or tables
- you don’t need to also report them in the text
Report confounders
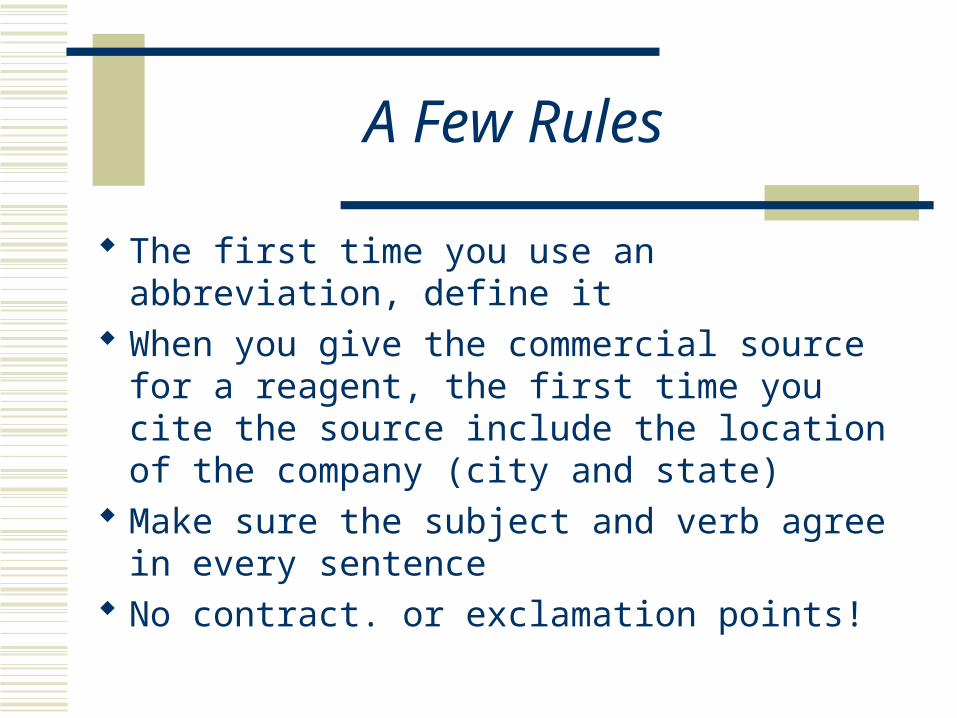
A Few Rules
The first time you use an abbreviation, define it When you give the commercial source for a
reagent, the first time you cite the source include the location of the company (city and state)
Make sure the subject and verb agree in every sentence
No contract. or exclamation points!
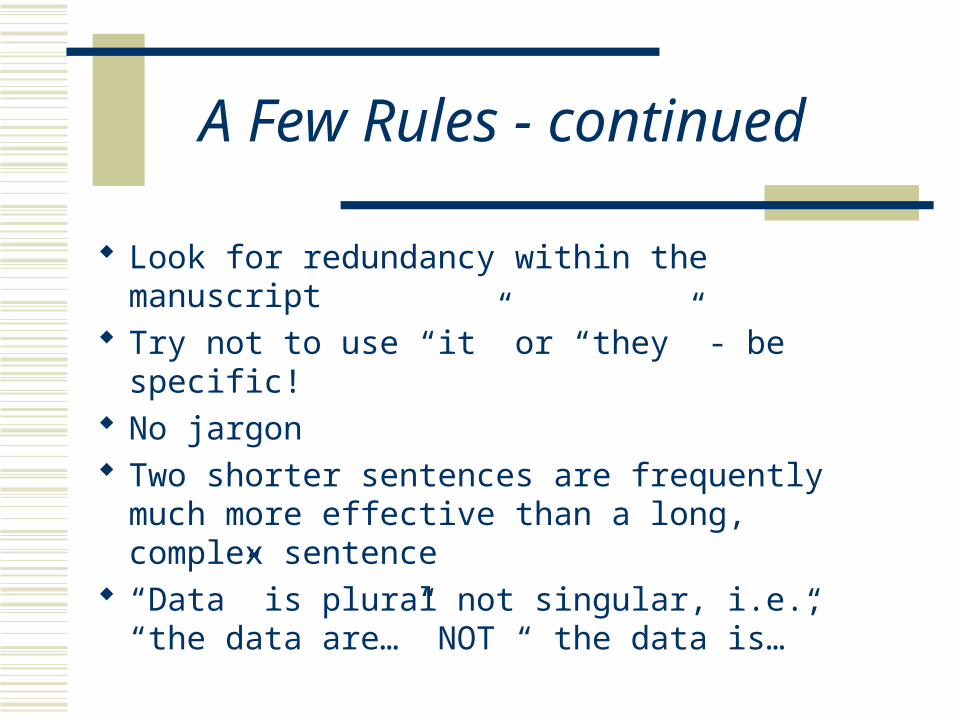
A Few Rules - continued
Look for redundancy within the manuscript Try not to use “it” or “they” - be specific! No jargon Two shorter sentences are frequently much more
effective than a long, complex sentence “Data” is plural not singular, i.e., “the data are…”
NOT “ the data is…”
A Few Rules - continued
Capitalize people’s names, i.e., Golgi apparatus
Never, ever plagiarize! (even from yourself!) Use numbers when expressing
measurements, except when the number would begin a sentence

Questions