Write Off-Loading: Practical Power Management for ... · Write Off-Loading: Practical Power...
15
Write Off-Loading: Practical Power Management for Enterprise Storage Dushyanth Narayanan Austin Donnelly Microsoft Research Ltd. {dnarayan,austind,antr}@microsoft.com Antony Rowstron Abstract In enterprise data centers power usage is a problem im- pacting server density and the total cost of ownership. Storage uses a significant fraction of the power budget and there are no widely deployed power-saving solutions for enterprise storage systems. The traditional view is that enterprise workloads make spinning disks down in- effective because idle periods are too short. We ana- lyzed block-level traces from 36 volumes in an enter- prise data center for one week and concluded that signif- icant idle periods exist, and that they can be further in- creased by modifying the read/write patterns using write off-loading. Write off-loading allows write requests on spun-down disks to be temporarily redirected to persis- tent storage elsewhere in the data center. The key challenge is doing this transparently and ef- ficiently at the block level, without sacrificing consis- tency or failure resilience. We describe our write off- loading design and implementation that achieves these goals. We evaluate it by replaying portions of our traces on a rack-based testbed. Results show that just spinning disks down when idle saves 28–36% of energy, and write off-loading further increases the savings to 45–60%. 1 Introduction Power consumption is a major problem for enterprise data centers, impacting the density of servers and the to- tal cost of ownership. This is causing changes in data center configuration and management. Some compo- nents already support power management features: for example, server CPUs can use low-power states and dy- namic clock and voltage scaling to reduce power con- sumption significantly during idle periods. Enterprise storage subsystems do not have such advanced power management and consume a significant amount of power in the data center [32]. An enterprise grade disk such as the Seagate Cheetah 15K.4 consumes 12 W even when idle [26], whereas a dual-core Intel Xeon processor con- sumes 24 W when idle [14]. Thus, an idle machine with one dual-core processor and two disks already spends as much power on disks as processors. For comparison, the 13 core servers in our building’s data center have a total of 179 disks, more than 13 disks per machine on average. Saving power in storage systems is difficult. Simply buying fewer disks is usually not an option, since this would reduce peak performance and/or capacity. The al- ternative is to spin down disks when they are not in use. The traditional view is that idle periods in server work- loads are too short for this to be effective [5, 13, 32]. In this paper we present an analysis of block-level traces of storage volumes in an enterprise data center, which only partially supports this view. The traces are gathered from servers providing typical enterprise services, such as file servers, web servers, web caches, etc. Previous work has suggested that main-memory caches are effective at absorbing reads but not writes [4]. Thus we would expect at the storage level to see peri- ods where all the traffic is write traffic. Our analysis shows that this is indeed true, and that the request stream is write-dominated for a substantial fraction of time. This analysis motivated a technique that we call write off-loading, which allows blocks written to one volume to be redirected to other storage elsewhere in the data center. During periods which are write-dominated, the disks are spun down and the writes are redirected, caus- ing some of the volume’s blocks to be off-loaded. Blocks are off-loaded temporarily, for a few minutes up to a few hours, and are reclaimed lazily in the background after the home volume’s disks are spun up. Write off-loading modifies the per-volume access pat- terns, creating idle periods during which all the volume’s disks can be spun down. For our traces this causes vol- umes to be idle for 79% of the time on average. The cost of doing this is that when a read occurs for a non- off-loaded block, it incurs a significant latency while the disks spin up. However, our results show that this is rare. FAST ’08: 6th USENIX Conference on File and Storage Technologies USENIX Association 253
Transcript of Write Off-Loading: Practical Power Management for ... · Write Off-Loading: Practical Power...

Write Off-Loading: Practical Power Management for Enterprise Storage
Dushyanth Narayanan Austin DonnellyMicrosoft Research Ltd.
{dnarayan,austind,antr}@microsoft.com
Antony Rowstron
AbstractIn enterprise data centers power usage is a problem im-pacting server density and the total cost of ownership.Storage uses a significant fraction of the power budgetand there are no widely deployed power-saving solutionsfor enterprise storage systems. The traditional view isthat enterprise workloads make spinning disks down in-effective because idle periods are too short. We ana-lyzed block-level traces from 36 volumes in an enter-prise data center for one week and concluded that signif-icant idle periods exist, and that they can be further in-creased by modifying the read/write patterns using writeoff-loading. Write off-loading allows write requests onspun-down disks to be temporarily redirected to persis-tent storage elsewhere in the data center.
The key challenge is doing this transparently and ef-ficiently at the block level, without sacrificing consis-tency or failure resilience. We describe our write off-loading design and implementation that achieves thesegoals. We evaluate it by replaying portions of our traceson a rack-based testbed. Results show that just spinningdisks down when idle saves 28–36% of energy, and writeoff-loading further increases the savings to 45–60%.
1 Introduction
Power consumption is a major problem for enterprisedata centers, impacting the density of servers and the to-tal cost of ownership. This is causing changes in datacenter configuration and management. Some compo-nents already support power management features: forexample, server CPUs can use low-power states and dy-namic clock and voltage scaling to reduce power con-sumption significantly during idle periods. Enterprisestorage subsystems do not have such advanced powermanagement and consume a significant amount of powerin the data center [32]. An enterprise grade disk such asthe Seagate Cheetah 15K.4 consumes 12 W even when
idle [26], whereas a dual-core Intel Xeon processor con-sumes 24 W when idle [14]. Thus, an idle machine withone dual-core processor and two disks already spends asmuch power on disks as processors. For comparison, the13 core servers in our building’s data center have a totalof 179 disks, more than 13 disks per machine on average.
Saving power in storage systems is difficult. Simplybuying fewer disks is usually not an option, since thiswould reduce peak performance and/or capacity. The al-ternative is to spin down disks when they are not in use.The traditional view is that idle periods in server work-loads are too short for this to be effective [5, 13, 32]. Inthis paper we present an analysis of block-level traces ofstorage volumes in an enterprise data center, which onlypartially supports this view. The traces are gathered fromservers providing typical enterprise services, such as fileservers, web servers, web caches, etc.
Previous work has suggested that main-memorycaches are effective at absorbing reads but not writes [4].Thus we would expect at the storage level to see peri-ods where all the traffic is write traffic. Our analysisshows that this is indeed true, and that the request streamis write-dominated for a substantial fraction of time.
This analysis motivated a technique that we call writeoff-loading, which allows blocks written to one volumeto be redirected to other storage elsewhere in the datacenter. During periods which are write-dominated, thedisks are spun down and the writes are redirected, caus-ing some of the volume’s blocks to be off-loaded. Blocksare off-loaded temporarily, for a few minutes up to a fewhours, and are reclaimed lazily in the background afterthe home volume’s disks are spun up.
Write off-loading modifies the per-volume access pat-terns, creating idle periods during which all the volume’sdisks can be spun down. For our traces this causes vol-umes to be idle for 79% of the time on average. Thecost of doing this is that when a read occurs for a non-off-loaded block, it incurs a significant latency while thedisks spin up. However, our results show that this is rare.
FAST ’08: 6th USENIX Conference on File and Storage TechnologiesUSENIX Association 253

Write off-loading is implemented at the block leveland is transparent to file systems and applications run-ning on the servers. Blocks can be off-loaded from anyvolume to any available persistent storage in the data cen-ter, either on the same machine or on a different one. Thestorage could be based on disks, NVRAM, or solid-statememory such as flash. Our current hardware does nothave flash or other solid-state devices and hence we useda small partition at the end of each existing volume tohost blocks off-loaded from other volumes.
Write off-loading is also applicable to a variety of stor-age architectures. Our trace analysis and evaluation arebased on a Direct Attached Storage (DAS) model, whereeach server is attached directly to a set of disks, typicallyconfigured as one or more RAID arrays. DAS is typi-cal for small data centers such as those serving a singleoffice building. However, write off-loading can also beapplied to network attached storage (NAS) and storagearea networks (SANs).
A major challenge when off-loading writes is to en-sure consistency. Each write request to any volume canbe off-loaded to one of several other locations dependingon a number of criteria, including the power state andthe current load on the destination. This per-operationload balancing improves performance, but it means thatsuccessive writes of the same logical block could be off-loaded to different destinations. It is imperative that theconsistency of the original volume is maintained even inthe presence of failures. We achieve this by persistingsufficient metadata with each off-loaded write to recon-struct the latest version of each block after a failure.
This paper makes two main contributions. First, weshow that contrary to conventional wisdom and currentpractice, idle periods in enterprise workloads can be ex-ploited by spinning disks down, for power savings of 28–36%. Second, we present write off-loading as a genericand practical approach that allows further reduction ofpower consumption in storage systems and also elimi-nates the spin-up penalty for write requests. In our trace-based evaluation on a rack-mounted testbed, write off-loading enabled energy savings of 45–60%. The perfor-mance of all write requests, and 99% of read requests,was equivalent to that when not spinning disks down.
The rest of the paper is organized as follows. Sec-tion 2 presents an analysis of block-level traces from anenterprise data center, which motivates write off-loading.Section 3 describes the design and implementation of thewrite off-loading infrastructure. Section 4 presents anevaluation of write off-loading on a rack-based hardwaretestbed. Section 5 discusses related work, and Sections 6and 7 conclude the paper.
Server Function #volumesusr User home directories 3proj Project directories 5prn Print server 2hm Hardware monitoring 2rsrch Research projects 3prxy Firewall/web proxy 2src1 Source control 3src2 Source control 3stg Web staging 2ts Terminal server 1web Web/SQL server 4mds Media server 2wdev Test web server 4
Table 1: Data center servers traced (13 servers, 36 vol-umes, 179 disks)
2 Volume Access Patterns
The traditional view is that spinning disks down doesnot work well for server workloads [5, 13, 32]. Guru-murthi et al. [13] show that for disk traffic patterns gen-erated by the TPC-C and TPC-H benchmarks, spinningdown disks is ineffectual: the periods of idleness aretoo short. Zhu et al. [32] also use the cello block-levelvolume traces [22] collected from a single file/computeserver at HP Labs. These are not necessarily represen-tative of all server workloads in enterprise data centers.Many enterprise servers are less I/O intensive than TPCbenchmarks, which are specifically designed to stress thesystem under test. Enterprise workloads also show sig-nificant variation in usage over time, for example due todiurnal patterns.
In order to understand better the I/O patterns generatedby standard data center servers, we instrumented the coreservers in our building’s data center to generate per vol-ume block-level traces for one week. Table 1 describesthe servers that we traced: most of these are typical ofany enterprise data center. In total, we traced 36 volumescontaining 179 disks on 13 servers.
The data center is air-conditioned and the servers arehigh-end rack-mounted machines. The default config-uration is for each server to have two internal physicaldisks configured as a RAID-1 array, which is used as theboot volume. Each server is additionally configured withone or more RAID-5 arrays as data volumes: the stor-age for these is provided using rack-mounted co-locatedDAS. All the servers run the Windows Server 2003 SP2operating system. Data on the volumes is stored throughthe NTFS file system and accessed by clients through avariety of interfaces including CIFS and HTTP.
We believe that the servers, data volumes, and theiraccess patterns are representative of a large number of
FAST ’08: 6th USENIX Conference on File and Storage Technologies USENIX Association254

(a) Mean request rate (b) Peak request rate
Figure 1: Mean and peak request rates per volume over 7 days
0
6
12
18
24
30
36
0 20 40 60 80 100
Num
ber
of v
olum
es
% of time volume active
14% 80%
Read-onlyRead/Write
Figure 2: CDF of active time per volume
small to medium size enterprise data centers. Althoughaccess patterns for system volumes may be dependent on,for example, the server’s operating system, we believethat for data volumes these differences will be small.
The traces are gathered per-volume below the file sys-tem cache and capture all block-level reads and writesperformed on the 36 volumes traced. The traced pe-riod was 168 hours (1 week) starting from 5PM GMTon the 22nd February 2007. The traces are collected us-ing Event Tracing For Windows (ETW) [17], and eachevent describes an I/O request seen by a Windows diskdevice (i.e., volume), including a timestamp, the disknumber, the start logical block number, the number ofblocks transferred, and the type (read or write). ETW hasvery low overhead, and the traces were written to a sepa-rate server not included in the trace: hence we do not be-lieve that the tracing activity perturbed the traced accesspatterns. The total number of requests traced was 434million, of which 70% were reads; the total size of thetraces was 29 GB. A total of 8.5 TB was read and 2.3 TBwritten by the traced volumes during the trace period.
Figure 1(a) shows the average read and write request
0
5
10
15
20
25
30
35
Thu22/02
Fri23/02
Sat24/02
Sun25/02
Mon26/02
Tue27/02
Wed28/02
Thu01/03
Fri02/03
Num
ber
of v
olum
es a
ctiv
e
Time
Rea
d/W
rite
Rea
d-on
ly
Figure 3: Number of active volumes over time
rate over the entire week for each of the volumes. Thereis significant variation across volumes, with volumes forthe file servers, the source version control servers, andthe web proxy all having significant read load. However,many of the volumes such as the research projects serverand the test web server have low read and write load. Fig-ure 1(b) shows the peak read and write rates, measured ata 60-second granularity for the 36 volumes. Peak loadsare generally much higher than the mean load, indicatingthat while volumes may be provisioned for a high peakload, most of the bandwidth is unused most of the time.
Overall, the workload is read-dominated: the ratio ofread to write requests is 2.37. However, 19 of the 36 vol-umes have read/write ratios below 1.0; for these volumesthe overall read-write ratio is only 0.18. Further analysisshows that for most of the volumes, the read workload isbursty. Hence, intuitively, removing the writes from theworkload could potentially yield significant idle periods.
Figure 2 confirms this intuition. It shows a cumula-tive distribution function across volumes of the numberof volumes versus the percentage of time that the volumeis active over the course of a week. We show the distribu-
FAST ’08: 6th USENIX Conference on File and Storage TechnologiesUSENIX Association 255

Mean Median 99th pctile MaxRead/ 21.7 22 27 31write (60%) (61%) (75%) (86%)Read- 7.6 7 15 22only (21%) (19%) (42%) (61%)
Table 2: Number of concurrently active volumes: num-bers in parentheses show the number of active volumesas a percentage of the total number of volumes (36)
tion both for the original trace (read/write) as well as thetrace with the writes removed. In both cases we considerthe volume to be idle (i.e., not active) when 60 secondshave elapsed since the last request.
Figure 2 shows that even without removing the writes,there is significant idle time for the volumes. As ex-pected, the write workload has a large impact on thelength of the idle periods. When the write load is re-moved, the mean amount of time a volume is active isonly 21%. By contrast, the volume active time in theread/write case is 60% on average. Similarly, the medianamount of time a volume is active drops from 80% to14% when the write load is removed.
Finally, we measure the potential benefit in reduc-ing the peak power consumption of the data center stor-age by examining the temporal relationship between vol-umes. Figure 3 shows the number of volumes active overtime through the week. We see that removing the writesfrom the trace significantly reduces the number of con-currently active volumes.
Table 2 shows the mean, median, 99th percentile, andmaximum number of volumes concurrently active dur-ing the week. These results indicate that simply spinningdown when idle can reduce the peak power of the storagesubsystem, and that creating longer idle periods by off-loading writes can reduce it even further. Note that theset of active volumes changes over time, and a rarely-active volume might still store a large amount of data orexperience a high peak load. Thus we cannot simply saveenergy by using fewer disks per volume, since we muststill provision the volumes for capacity and peak load.
This analysis indicates that there are significant po-tential power savings in spinning down enterprise datacenter disks when idle. Further, it shows that efficientlyredirecting writes creates even longer periods of idlenessleading to substantially higher power savings. This mo-tivated the design of our write off-loading mechanisms.
3 Write Off-Loading
The goal of write off-loading is to utilize periods ofwrite-dominated load to spin disks down and off-loadwrite requests, reverting to normal operation during peri-
ods of read-dominated load. When writes are being off-loaded the aim is to achieve comparable write responsetimes and throughput to using the local volume.
Each volume supporting off-loading has a dedicatedmanager. The manager is entirely responsible for thevolume, which we refer to as its home volume: it decideswhen to spin the physical disks up or down, and alsowhen and where to off-load writes. Off-loaded blocksare only temporarily off-loaded and the manager is alsoresponsible for reclaiming blocks previously off-loaded.To achieve all these tasks, the manager needs to interceptall read and write requests to its home volume.
When a manager decides to off-load a block, it selectsone or more loggers to store it temporarily. Each log-ger instance requires a small area of persistent storage,which is used exclusively to store off-loaded blocks andmetadata until they are reclaimed by a manager or nolonger required. The persistent storage could be a disk,NVRAM or solid-state memory such as flash, depend-ing on what is available on each server; the logger’s datalayout should be optimized for the particular type of stor-age. Our current implementation uses only disk-basedloggers.
The set of loggers that a manager uses is configurable.It is important that the loggers used by a manager of-fer the same or better failure properties as the home vol-ume. It is also possible to configure the manager so that itwill only off-load blocks to loggers residing on the sameserver as itself, in the same rack, or across the entire datacenter. We have evaluated write off-loading at both aserver and rack granularity. Current off-the-shelf giga-bit networking makes the rack granularity feasible, withlow network overhead and good performance. Server-granularity off-loading is feasible at any network speedsince off-load traffic does not go over the network.
In the rest of this paper, we refer to a volume as beingactive if its disks are spinning and I/O operations are be-ing performed on it. If the disks are spinning but no I/Ooperations are being performed, we refer to the volumeas being idle: in this state the disk spindles continue touse energy even though they are doing no work. Finally,if the volume’s disks are spun down, we refer to the vol-ume as being in the standby state. We assume that all thedisks belonging to a volume are always in the same state,since all the power management strategies considered inthis paper operate on entire volumes at a time.
When we refer to a manager or logger component be-ing in standby, we mean that the volume used by thatcomponent has transitioned to the standby state. When amanager goes into standby, it will force loggers sharingthe same physical disks to go into the standby state. Themanager will then off-load writes to loggers that are notin the standby state. Note that loggers using solid-statememory or NVRAM would never enter the standby state.
FAST ’08: 6th USENIX Conference on File and Storage Technologies USENIX Association256

3.1 Detailed Design
Loggers. Conceptually the logger’s role is simple: ittemporarily stores blocks. Loggers support the follow-ing remote operations: write, read, invalidate, and re-claim. A write consists of persisting the provided blocksand metadata. The metadata consists of the source man-ager identity, a range of logical block numbers (LBNs),and a version number. A read returns the latest storedversions of the requested blocks. An invalidate requestspecifies a set of blocks and versions that are no longerrequired. To ensure consistency, the invalidate requestexplicitly includes version information, and the loggermarks the corresponding versions as invalid. The loggercan then lazily garbage collect the space used to store theinvalidated data and metadata. A reclaim request is likea read, except that no block range is specified: the log-ger can return any valid block range it is holding for therequesting manager. Invalidates and reclaims are non-latency-critical operations; reads and writes are latency-critical but reads are expected to be rare. Hence loggersare optimized for the performance of writes.
Our current implementation uses a log-based on-disklayout. This means that writes have good locality; bothdata and metadata are written with a single I/O to the cur-rent head of the log. Log compaction and other mainte-nance tasks are done in the background with low priority.Metadata about the valid blocks stored for each manager,their versions, and their location in the log are cached inmain memory for fast access.
Each logger uses a small partition at the end of an ex-isting volume to persist data and metadata. This avoidsthe need to dedicate additional storage for off-loading.The remainder of the volume functions as before, andcould have an associated manager to enable off-loading.In general a volume might host zero or more managersand zero or more loggers, on distinct partitions but onthe same set of physical disks. In our evaluation we runwith a typical configuration for a data volume: one man-ager and one logger with the latter using a small partitionat the end.
Managers. The manager controls the off-loading ofblocks, deciding when to off-load blocks and when toreclaim them. It is also responsible for ensuring consis-tency and performing failure recovery. To achieve this,each manager maintains persistently the identities of aset of loggers with which it interacts, referred to as thelogger view. It also maintains two in-memory data struc-tures, as shown in Figure 4. The redirect cache stores,for each block off-loaded, the block’s LBN, the identityof the logger storing the current data for the block andthe corresponding version number. Version numbers areunique monotonically increasing 64-bit quantities, which
�����������
�
�
������� ���
���� ���
��
���� ���
����� ����
�� ����
�����������������
���� ���
���� ���
���� ���
���������
������
��
������
����� ������
�� ����������� ���
���� ���
���� ���
�������������
�� ����
Figure 4: Manager data structures.
ensure that the manager can identify the last written ver-sion of any block during failure recovery. The garbagecache stores the location of old versions of blocks. In thebackground, the manager sends invalidation requests forthese versions; when these are committed by the loggerthey are removed from the garbage cache.
The manager intercepts all read and write requests sentto the home volume. For a read request, it first checksthe redirect cache for existing logged versions. If noneis found, the read is serviced locally from the home vol-ume, causing it to transition from standby to active if nec-essary. Otherwise the request is dispatched to the loggeridentified as having the latest version of the block. Multi-block reads are split as required, to fetch data from thehome volume and/or one or more loggers.
For a write request, the manager off-loads the write toa logger if the home volume is in standby. It also off-loads the write if there are currently logged versions ofany of the blocks, to ensure that the new version is per-sistently recorded as the latest version. Writes that arenot off-loaded are sent directly to the home volume.
To off-load a write, the manager probes the loggersin its logger view: this is currently done using subnetbroadcast for efficiency. Each logger replies with a set ofmetrics including the power state of the logger’s volume,its queue length, the amount of available space, etc. Themanager ranks the loggers using these metrics and selectsone to off-load the write to. When the write is committedand acknowledged by the logger, the manager updatesits redirect cache with the latest version and moves anyolder versions to the garbage cache.
When the home volume is idle, the manager reclaimsoff-loaded blocks from loggers in the background andwrites them to the home volume. After the reclaimedblocks are written to disk, the manager sends invalida-tion requests to the appropriate loggers. To ensure cor-rect failure recovery, the latest version of a block is inval-idated only after all older versions have been invalidated.The background reclaim and invalidation ensure that allblocks will eventually be restored to the home volumeand that logger space will eventually be freed.
Finally, the manager controls state transitions to andfrom standby for the home volume. The manager mon-itors the elapsed time since the last read and the lastwrite; if both of these have passed a certain threshold,
FAST ’08: 6th USENIX Conference on File and Storage TechnologiesUSENIX Association 257
it spins the volume down and off-loads all subsequentwrites. The volume spins up again when there is a readon a non-off-loaded block, or when the number of off-loaded blocks reaches a limit (to avoid off-loading verylarge amounts of data). Before putting the volume intostandby, the manager first ensures that there is at leastone logger in its logger view that is using a set of disksdifferent from its own and that is not currently in standby.This ensures that any future writes to the home volumecan be off-loaded by the manager without waiting fordisks to spin up. If there are no such loggers, then themanager does not spin down, but periodically probes itslogger set for any change in their status.
This design is optimized for the common case: dur-ing periods of intense activity, the home volumes will bein the active state, and all I/Os will be local, except fora small number of requests on blocks that are currentlyoff-loaded. During periods of low, write-dominated load,we expect that the home volume will be in standby andwrites will be successfully off-loaded to a logger.
Uncommon cases are handled through fall-back strate-gies. For example, if the manager cannot find any avail-able loggers, it spins up the home volume in the back-ground, and retries the request until a logger is foundor the home volume is spun up. If a volume needs tobe taken off-line (say for maintenance) then the managerspins it up, as well as all volumes that it depends on orthat depend on it. It then forces blocks to be reclaimeduntil the volume has all its own blocks and none of anyother’s, i.e., its state is restored as if no off-loading hadoccurred.
Write off-loading can mask the performance impact ofspinning up disks for write requests. For read requests onspun-down disks we cannot mask the spin-up delay. Forsome applications this large delay (10–15 seconds) willbe unacceptable even if rare: write off-loading should notbe enabled on the volumes that these applications use.
3.2 Failure Resilience
Enterprise storage is expected to provide consistency anddurability despite transient failures such as reboots aswell as single-disk permanent failures. At the volumelevel, the failure resilience with off-loading is the sameas that without. However, off-loading can create failuredependencies between managers and loggers. With off-loading at the rack or data center level, a manager on ma-chine A could off-load blocks to a logger on machine B:if machine B suffers a failure, then the off-loaded blockswould become unavailable on machine A until machineB was brought on-line again.
This problem can be solved by off-loading each blockto multiple independent loggers. With k-way logging, amanager can tolerate up to k − 1 failures in its logger
Figure 5: Consistency across loggers example
view. Given the high availability and reliability of enter-prise servers, we do not think k-way logging would berequired in most cases.
Write off-loading guarantees both consistency anddurability across failures. We achieve durability by ac-knowledging writes only when both data and metadatahave been reliably persisted, i.e., we do not employwrite-back caching of any form. Consistency is achievedby using versioned metadata to mark the latest versionof a block. When a read is performed for a range ofblocks, it is quite possible that the required blocks aredistributed over multiple loggers as well as the home vol-ume, as shown in Figure 5. The manager uses the versioninformation to ensure that the applications using the vol-ume see a consistent view of the stored data. We also adda checksum to the metadata to ensure that partial writesare correctly detected on failure recovery.
If one or more machines reboot due to, say, a powerfailure, all the loggers recover concurrently by scanningtheir persistent logs to reconstruct their soft state. Eachmanager can be brought on-line when all the loggersin its logger view are on-line. A manager recovers itssoft state (the redirect cache and garbage cache) by re-questing information about all blocks stored for it fromeach logger in its logger view. To optimize the commoncase of a clean shutdown/reboot of a server, the managerwrites the soft state to a small metadata partition duringshutdown; this allows managers to restart after a cleanshutdown without any network communication.
It is important that a manager’s logger view be re-stricted to loggers which have the same or higher fail-ure resilience as the home volume. Otherwise, whenblocks are off-loaded, they will not have the same fail-ure resilience as non-off-loaded blocks. If the storageuses standard solutions such as RAID-1 or RAID-5 forall volumes, then this property will be ensured, and off-loading will provide the same resilience to single diskfailures as standard RAID solutions.
When a logger experiences a single-disk failure, itpushes all off-loaded blocks to other loggers or the ap-propriate manager, which should typically take secondsto minutes. This reduces the risk of losing off-loadedblocks due to multiple disk failures; the risk can be fur-ther reduced if desired by using k-way logging.
FAST ’08: 6th USENIX Conference on File and Storage Technologies USENIX Association258

4 Evaluation
Section 2 presented a trace-driven analysis showing thepotential benefits of write off-loading. This analysiswas based on block-level traces of enterprise data centerworkloads. In this section we evaluate write off-loadingusing a real testbed and these workload traces.
4.1 Experimental Setup
The experiments were all run using a testbed consistingof four standard HP servers, each with a dual-core IntelXeon processor and an HP SmartArray 6400 controllerconnected to a rack-mounted disk enclosure with a SCSIbackplane. All the servers were running Windows Server2003 SP2. For the purposes of trace replay, data volumeswere accessed as raw block devices rather than as filesystems, since our traces are at the block level.
The disk enclosures were populated with 56 SeagateCheetah 15,000 RPM disks: 28 of size 36 GB and 28 ofsize 146 GB. The servers were connected via a switched1 Gbps Ethernet. The device driver for the SmartArray6400 does not support physical spin-down and spin-up ofthe disks, highlighting the fact that disk spin-down is notstandard practice in enterprise storage systems today. Wedid not have access to the driver source code and hencewere forced to emulate the power state of each volumein a software layer. This layer delays requests on a spun-down volume until the volume is spun up; it also modelsthe power consumed by each volume based on the num-ber and type of disks and the emulated spin state.
The parameters for emulating the power state of thedisks used in the testbed are shown in Table 3. These pa-rameters were derived manually from the voltage/currentprofiles given in the Seagate Cheetah 15K.4 SCSI prod-uct manual [26] (Section 6, Figures 4 and 5). The steady-state power consumption when spun up is based on thecurrent draw of both the 12 V input line (which powersthe motor) and the 5 V line (which powers the electron-ics); the power consumption when spun down is basedon the 5 V current only. The energy cost of spinningup is defined as the difference between the total energyused while the disk was spinning up, and that used if thedisk were idle and spinning for that duration. We do notmodel the energy cost of doing I/O over and above thatof keeping the disk electronics powered and the platterspinning; in general, this is difficult to model for an arbi-trary workload and is also relatively small.
To drive the experiments we used real-time replay ofthe data center traces that we analyzed in Section 2. Us-ing all the trace data would have required one week perexperimental run. To make this tractable, each trace wassplit into seven one-day (24-hour) traces. These traceswere statically analyzed to find the “least idle” and the
Time to spin up (36 GB disk) 10 sTime to spin up (146 GB disk) 15 sEnergy cost of spinning up 20 JPower when spun up 12 WPower when spun down 2.6 W
Table 3: Energy parameters for Seagate Cheetah 15K.4
Rack Server Function #volumes1 usr User files 3
mds Media server 2prn Print server 2hm H/w monitoring 2
2 src2 Source control 3proj Project files 5wdev Test web server 4
3 rsrch Research projects 3prxy Firewall/web proxy 1src1 Source control 2stg Web staging 2ts Terminal server 1web Web/SQL server 4
Table 4: Servers grouped by rack
“most idle” days. Averaged across all volumes, the leastidle day provides the smallest potential amount of idletime for write off-loading, whereas the most idle day pro-vides the largest. The least idle day ran from midnight onMonday 26th February 2007 to midnight on the followingday; it had 35 million requests with 73% reads. The mostidle day ran from midnight on Sunday 25th February tomidnight on the following day; it had 21 million requestswith 70% reads. These two days represent the worst andthe best case for energy savings using write off-loading,and hence our evaluation is based on them.
To emulate the traced data center volumes, sets of vol-umes were mapped on to the testbed. The entire testbed’sdisk capacity is much smaller than the original tracedservers. Therefore the traced servers were divided intothree sets or “racks” (Table 4). Experiments were run foreach rack independently; all the volumes in a single rackwere simultaneously emulated on the testbed. two of the36 volumes (prxy/1 and src1/0) could not be accommo-dated on the testbed with enough disks to sustain the of-fered load, so they were omitted. Due to the physicallimitations of the testbed, the mapping does not keep vol-umes from the same original server on the same testbedserver, or vice versa. However, our results show that thepeak network load imposed by write off-loading is lessthan 7% of the network capacity: hence remapping doesnot significantly affect the system’s performance. Eachvolume was mapped to a RAID-1 or RAID-5 array withsufficient capacity to replay the volume trace.
FAST ’08: 6th USENIX Conference on File and Storage TechnologiesUSENIX Association 259

0
5
10
15
20
25
30
0 10 20 30 40 50 60 70 80 90 100
Num
ber
of v
olum
es
Energy consumption (% of baseline)
Rack-level off-loadMachine-level off-loadVanilla
(a) Least idle day
0
5
10
15
20
25
30
0 10 20 30 40 50 60 70 80 90 100
Num
ber
of v
olum
es
Energy consumption (% of baseline)
Rack-level off-loadMachine-level off-loadVanilla
(b) Most idle day
Figure 6: CDF of energy consumed as a percentage of baseline
A per-server trace replay component was used to re-play the traces and gather performance metrics. The startof trace replay was synchronized across all servers. Eachtrace event was then converted to an I/O request sent tothe corresponding emulated volume at the time specifiedby the timestamp: i.e., the traces were replayed “open-loop” in real time. This is necessary because the block-level traces do not capture higher-level dependencies be-tween requests. However, requests which accessed over-lapping block ranges were serialized, under the assump-tion that such requests would not be issued concurrently.
When configured for write off-loading each emulatedvolume was assigned both a manager and a logger. Thelogger used a 4 GB partition at the end of the volume;on hardware with flash or other solid-state devices thelogger would run on the solid-state component instead.All manager and logger components on each server werelinked together into a single user-level process along withthe trace replay component. This component openedeach server volume as a raw Windows block device; traceI/Os were then converted into read and write requests onthese devices. Communication between managers andloggers is in-process if on the same physical server; oth-erwise we use UDP for broadcast and TCP for unicast.
In the experiments we evaluated four configurations:• baseline: Volumes are never spun down. This gives
no energy savings and no performance overhead.• vanilla: Volumes spin down when idle, and spin up
again on the next request, whether read or write.• machine-level off-load: Write off-loading is enabled
but managers can only off-load writes to loggersrunning on the same server: here the “server” is theoriginal traced server, not the testbed replay server.
• rack-level off-load: Managers can off-load writes toany logger in the rack.
The configurations which place volumes in standbyrequire an idle period before initiating standby. In the
vanilla configuration we use an idle period of 60 seconds.For the two off-load configurations, a volume is placed instandby after 60 seconds of no reads and 10 seconds ofno writes. Each off-load manager also limits the amountof off-loaded data to 1 GB: on reaching this limit, themanager spins up the volume in the background.
In the remainder of this section we present the sum-marized results of our experimental runs. Each resultis presented both for the “most idle” day and the “leastidle” day, and for each of the four configurations. Fora given day and configuration, results are aggregatedacross racks; although the experiments were run sequen-tially, this emulates all three racks running concurrentlywith off-loading (if enabled) happening at the rack or ma-chine level depending on the configuration.
4.2 Energy SavingsFigures 6(a) and 6(b) show the CDFs of energy con-sumed per volume for the least idle day and most idleday, respectively. Obviously, in the baseline case, alldisks would always be spun up, and volumes would al-ways be at their maximum power level. Hence we nor-malize the power consumption of each volume in theother three configurations by the corresponding baselinevalue. All three configurations on both days save signifi-cant amounts of energy compared to the baseline, as seenby the number of volumes that use 50% or lower energycompared to baseline. Figure 7 summarizes these resultsshowing the mean and peak power consumption acrossall volumes, again as a percentage of the baseline value.
For the least idle day, of the three non-baseline config-urations, the vanilla configuration consumes the most en-ergy: 72% of baseline. This is because it does not utilizewrite off-loading to lengthen the idle periods. Machine-level off-loading is able to do this, and hence uses less en-ergy: 64% of the baseline. However, the energy savings
FAST ’08: 6th USENIX Conference on File and Storage Technologies USENIX Association260

(a) Least idle day (b) Most idle day
Figure 7: Total power consumption as percentage of baseline
are limited by the need to keep one volume spinning permachine to absorb the off-loaded writes. This means thatat all times at least 13 of 34 volumes were kept spinning.Rack-level off-loading uses the least energy of all (55%of baseline) since it does not suffer from the limitationsof the other two approaches. With rack-level off-loading,potentially a single spun-up volume could absorb the off-loads for the entire rack.
For the most idle day, all three non-baseline con-figurations improve their energy savings by exploitingthe increased amount of idleness. As on the least idleday, vanilla uses significantly less energy (64%) thanbaseline; machine-level off-load does better (51%) thanvanilla; and rack-level off-load does even better (40%).
The peak power results in Figure 7 show that vanillareduces peak power to 87–89% of the baseline; machine-level off-load to 83–84%, and rack-level off-load to 80%.Unlike the mean power usage these results show thatthere is not a significant difference between the most andleast idle days. This is because the power usage variesconsiderably over the time scale of minutes, as shown inFigure 3, and hence even on a day with a low mean powerusage, the peak could be quite high. However, there isstill a significant difference between the off-loading andnon-off-loading configurations.
4.3 Performance ImpactWe now evaluate the performance impact of spinningdisks down, both with and without off-loading. We mea-sured the response time of each read and write requestin each configuration, on each of the test days. Fig-ure 8 shows the response time distributions for reads andwrites, for the two days, aggregated over all volumes.Since most requests have the same response time in allconfigurations, we put the y-axis on a log scale to high-light the differences between the configurations. The x-axis is also on a log scale, since response times vary from
tens of milliseconds in the common case to over 15 sec-onds in the worst case. For example, the baseline curvein Figure 8(a) shows that 0.01 (1%) of the read requestsin the baseline configuration on the least idle day had aresponse time of more than 100 ms.
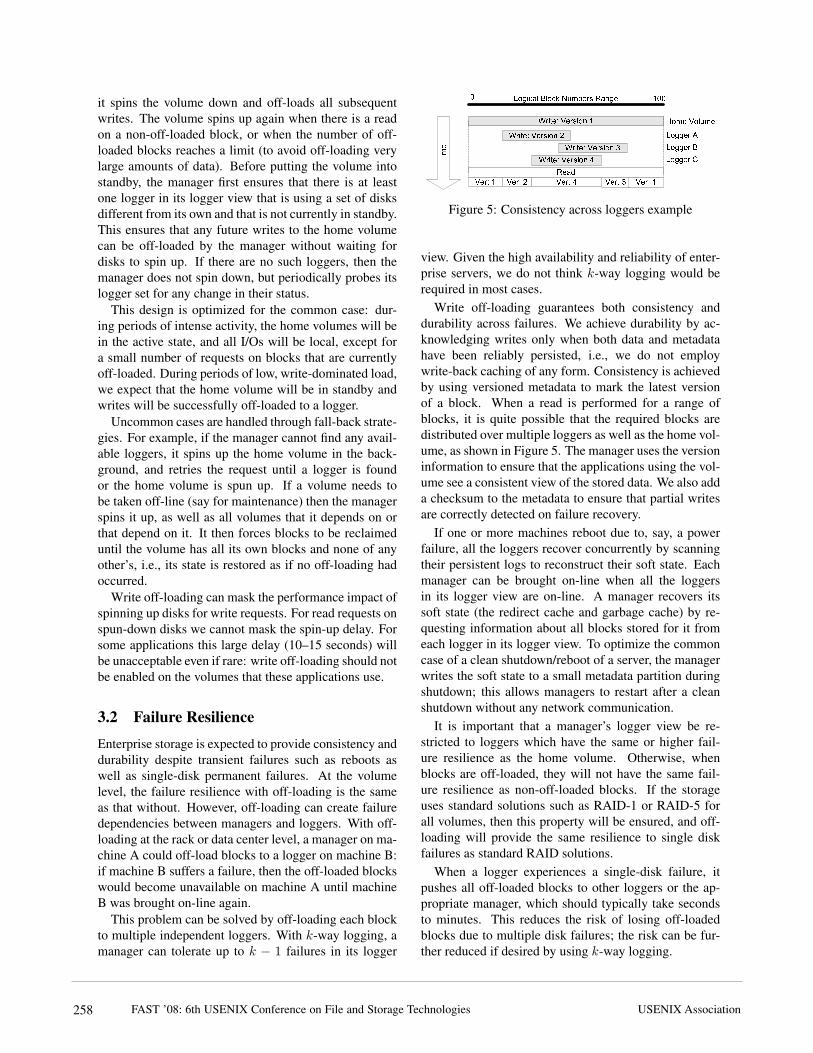
We see that for the majority of requests, the perfor-mance was identical in all configurations. For a smallfraction of the requests, we see a long tail in some cases,going out to over 10 seconds. This tail represents re-quests that needed to wait for a disk to spin up. In thevanilla configuration both reads and writes are impactedby this effect. For the machine-level and rack-level off-load only reads are affected: for write requests they trackbaseline performance up to and beyond the 0.0001 point,i.e., for 99.99% or more of the requests. For a very smallnumber of requests (fewer than 0.01%) on the least idleday, the machine-level off-load does worse than the base-line or rack-level off-load; this is because in the case ofa heavy burst of write requests, the machine-level off-load cannot spread the load across loggers on multipleservers, whereas the rack-level off-load can do this.
These results confirm our expectation that spinningdisks down causes a large penalty for a small number ofrequests. This penalty occurs for both reads and writes ifwe do not off-load writes, and only for reads if we do. Itis worth noting that both the length and thickness of thistail are increased by an artifact of our experimental setup.Since we replay the traces open-loop, all requests that ar-rive while a disk is spinning up will be queued, and si-multaneously released to the disk when it spins up. Sincethe spin-up period is relatively long (10–15 seconds), alarge number of requests could arrive during this period,which cause an additional large queuing delay even afterthe disk is spun up. For example, the tail for the vanillaconfiguration in Figure 8(c) goes out to 56 seconds: thisis due to a single episode in which 5,000 requests werequeued while waiting for a volume to spin up, and 22 ofthese requests suffered extremely high delays as a result.
FAST ’08: 6th USENIX Conference on File and Storage TechnologiesUSENIX Association 261
1e-08
1e-07
1e-06
1e-05
0.0001
0.001
0.01
0.1
1
1 10 100 1000 10000 100000
Pro
b[re
ques
t res
pons
e tim
e >
x]
Request response time (ms)
Rack-level off-loadMachine-level off-loadVanillaBaseline
(a) Least Idle/Read
1e-08
1e-07
1e-06
1e-05
0.0001
0.001
0.01
0.1
1
1 10 100 1000 10000 100000
Pro
b[re
ques
t res
pons
e tim
e >
x]
Request response time (ms)
Rack-level off-loadMachine-level off-loadVanillaBaseline
(b) Most Idle/Read
1e-08
1e-07
1e-06
1e-05
0.0001
0.001
0.01
0.1
1
1 10 100 1000 10000 100000
Pro
b[re
ques
t res
pons
e tim
e >
x]
Request response time (ms)
VanillaMachine-level off-loadRack-level off-loadBaseline
(c) Least Idle/Write
1e-08
1e-07
1e-06
1e-05
0.0001
0.001
0.01
0.1
1
1 10 100 1000 10000 100000
Pro
b[re
ques
t res
pons
e tim
e >
x]
Request response time (ms)
VanillaBaselineMachine-level off-loadRack-level off-load
(d) Most Idle/Write
Figure 8: Response time distributions: the x-axis shows response times on a log scale, and the y-axis shows thefraction (also on a log scale) of requests with response times higher than some value
In reality, many of the requests in a single such burstwould have been issued by the application in a closedloop, i.e., serialized one after another. Hence, delayingthe first request would have prevented additional requestsfrom being issued, avoiding the large queues and queu-ing delay. Further, if the request burst was created bya non-interactive application, for example a backup, thenan initial delay of 10–15 seconds is acceptable. For inter-active applications, of course, this first-byte delay will bevisible to the user; if a volume supports interactive appli-cations that cannot tolerate this delay even infrequently,then write off-loading or indeed any kind of spin-downshould not be enabled for that volume.
We now present some summary statistics on the re-sponse time distributions. Figure 9(a) shows the me-dian response time; as expected, there is no penalty forspinning disks down or off-loading. Figure 9(b) showsthe mean response time. Here we see the effect of theskewed response time distribution, i.e., the long thin tail,which causes a small number of requests to increase themean significantly. For reads, all the non-baseline con-figurations have a high mean response time. The off-
load configurations do worse than vanilla, because theyspin down more often (and save more energy): hence aburst of read requests is more likely to hit a spun-downvolume in these cases. For the same reason the rack-level off-load has a higher mean response time than themachine-level off-load.
In the case of writes, the mean is high for vanilla,but the off-load configurations do slightly better than thebaseline case, with the rack-level off-load having the bestperformance of all. This is because logger writes havegood locality, since they use a log structure, even if theoriginal access pattern does not have good locality. Fur-ther, during bursts of high write load, rack-level off-loadis able to load-balance across multiple loggers on multi-ple servers, and hence delivers the best performance.
Figure 10 shows the percentage of requests incurring aspin-up delay in each case. Obviously, the baseline con-figuration has no spin-up delays, and the off-load con-figurations do not have spin-up delays on write requests.Reads for rack-level/machine-level off-load, and all re-quests for vanilla, have significant (up to 1.2%) numbersof spin-up delays, which skews the mean response time
FAST ’08: 6th USENIX Conference on File and Storage Technologies USENIX Association262

(a) Median response time (b) Mean response time
Figure 9: Median and mean response times
Figure 10: Percentage of requests incurring spin-up de-lays
for these cases. However, as remarked previously, someof this effect is an artifact of open-loop replay.
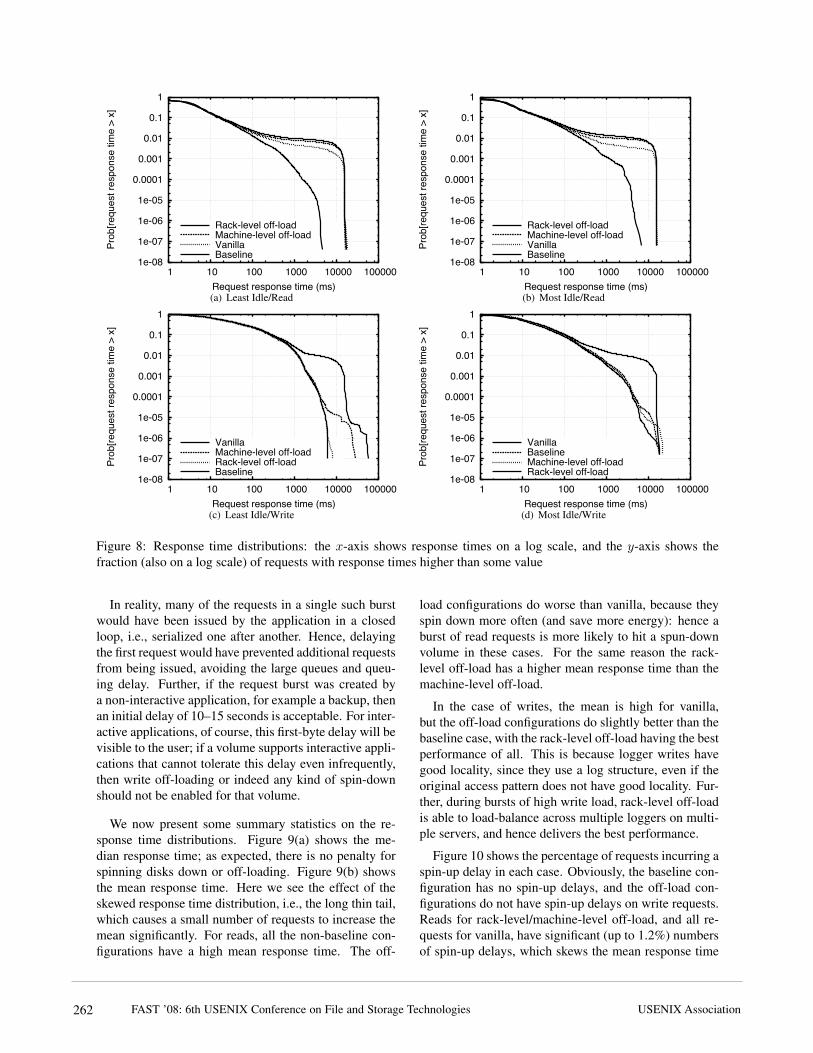
Figure 11(a) shows the 95th percentile response timesrespectively for the different cases. There are only minordifferences between the different configurations, sincemuch fewer than 5% of requests see spin-up delays inany configurations. Finally, Figure 11(b) shows the max-imum response time for each case. For reads, the non-baseline configurations have similar worst-case perfor-mance to each other, although worse than the baseline:this is due to spin-up delays. For writes, all configu-rations have similar performance on the most idle day.On the least idle day, there is a large penalty for vanilladue to a combination of spin-up delay and queuing delayfor a large write burst as previously discussed. Machine-level off-load also has a significant though lower penalty,due to the lack of load balancing on a heavy write burst.Rack-level off-load is able to load-balance such burstsand hence has a much better worst-case performance.
In summary, all configurations have comparable per-formance to the baseline case for a majority of requests;however, reads in the off-load configurations and bothreads and writes in the vanilla configuration have a long
thin tail, which is unavoidable. Finally, rack-level off-load consistently outperforms machine-level off-load onboth energy savings and write performance, but hasworse read performance and adds network traffic to thesystem. Administrators can configure the logger viewson a per-manager basis to provide the appropriate trade-off between these metrics.
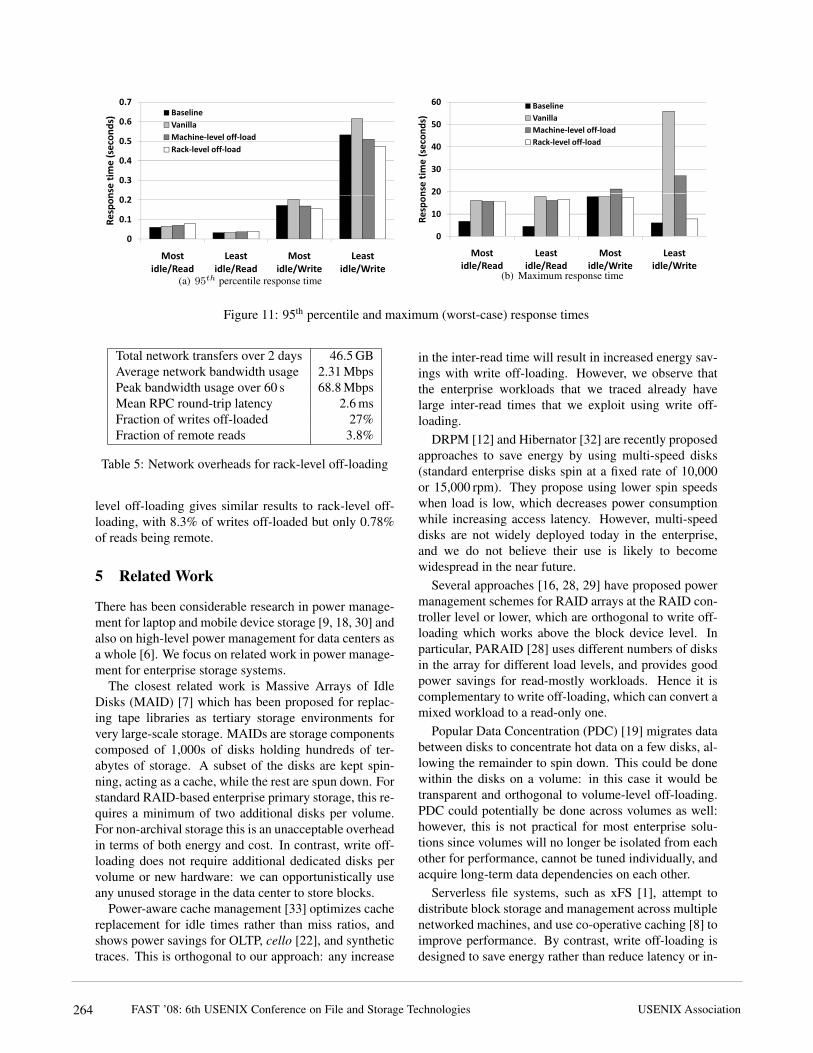
4.4 Network UsageWe also measured the network overheads of rack-leveloff-loading across both test days combined. These aresummarized in Table 5. Note that the bandwidth usageis based on communications between managers and log-gers that belong to different servers in the original trace.In other words, this measures the network overheads ifwrite off-loading had been run on the original tracedservers rather than the testbed servers. Thus there areno network overheads for machine-level off-load and ofcourse none for the baseline or vanilla configurations.
The average bandwidth usage is low compared to thebandwidth available in a typical data center. The peakbandwidth usage can easily be supported by gigabit net-works, which are widespread in enterprise data centers.The mean RPC round-trip latency is the amount of ad-ditional latency incurred by requests due to manager-logger communication.
The last two entries in Table 5 show that a substan-tial fraction of write requests were off-loaded, but onlya very small fraction of reads were remote. A remoteread is one that required the manager to interact with alogger because some or all of the requested blocks hadbeen off-loaded. This is the expected behavior: due tomain-memory buffer caches, very few recently-writtenblocks are read back from the storage layer. In otherwords, most off-loaded blocks will be overwritten or re-claimed before they are read again. The small fractionof remote reads also justifies our decision to optimizethe loggers for write rather than read requests. Machine-
FAST ’08: 6th USENIX Conference on File and Storage TechnologiesUSENIX Association 263
(a) 95th percentile response time (b) Maximum response time
Figure 11: 95th percentile and maximum (worst-case) response times
Total network transfers over 2 days 46.5 GBAverage network bandwidth usage 2.31 MbpsPeak bandwidth usage over 60 s 68.8 MbpsMean RPC round-trip latency 2.6 msFraction of writes off-loaded 27%Fraction of remote reads 3.8%
Table 5: Network overheads for rack-level off-loading
level off-loading gives similar results to rack-level off-loading, with 8.3% of writes off-loaded but only 0.78%of reads being remote.
5 Related Work
There has been considerable research in power manage-ment for laptop and mobile device storage [9, 18, 30] andalso on high-level power management for data centers asa whole [6]. We focus on related work in power manage-ment for enterprise storage systems.
The closest related work is Massive Arrays of IdleDisks (MAID) [7] which has been proposed for replac-ing tape libraries as tertiary storage environments forvery large-scale storage. MAIDs are storage componentscomposed of 1,000s of disks holding hundreds of ter-abytes of storage. A subset of the disks are kept spin-ning, acting as a cache, while the rest are spun down. Forstandard RAID-based enterprise primary storage, this re-quires a minimum of two additional disks per volume.For non-archival storage this is an unacceptable overheadin terms of both energy and cost. In contrast, write off-loading does not require additional dedicated disks pervolume or new hardware: we can opportunistically useany unused storage in the data center to store blocks.
Power-aware cache management [33] optimizes cachereplacement for idle times rather than miss ratios, andshows power savings for OLTP, cello [22], and synthetictraces. This is orthogonal to our approach: any increase
in the inter-read time will result in increased energy sav-ings with write off-loading. However, we observe thatthe enterprise workloads that we traced already havelarge inter-read times that we exploit using write off-loading.
DRPM [12] and Hibernator [32] are recently proposedapproaches to save energy by using multi-speed disks(standard enterprise disks spin at a fixed rate of 10,000or 15,000 rpm). They propose using lower spin speedswhen load is low, which decreases power consumptionwhile increasing access latency. However, multi-speeddisks are not widely deployed today in the enterprise,and we do not believe their use is likely to becomewidespread in the near future.
Several approaches [16, 28, 29] have proposed powermanagement schemes for RAID arrays at the RAID con-troller level or lower, which are orthogonal to write off-loading which works above the block device level. Inparticular, PARAID [28] uses different numbers of disksin the array for different load levels, and provides goodpower savings for read-mostly workloads. Hence it iscomplementary to write off-loading, which can convert amixed workload to a read-only one.
Popular Data Concentration (PDC) [19] migrates databetween disks to concentrate hot data on a few disks, al-lowing the remainder to spin down. This could be donewithin the disks on a volume: in this case it would betransparent and orthogonal to volume-level off-loading.PDC could potentially be done across volumes as well:however, this is not practical for most enterprise solu-tions since volumes will no longer be isolated from eachother for performance, cannot be tuned individually, andacquire long-term data dependencies on each other.
Serverless file systems, such as xFS [1], attempt todistribute block storage and management across multiplenetworked machines, and use co-operative caching [8] toimprove performance. By contrast, write off-loading isdesigned to save energy rather than reduce latency or in-
FAST ’08: 6th USENIX Conference on File and Storage Technologies USENIX Association264

crease throughput. It also works at the block level, andrather than storing data remotely for days or weeks, a rel-atively small number of blocks are temporarily hosted onremote machines.
The log structure used to store off-loaded data andmeta data is similar to those used in log-structured filesystems [11, 21, 27]. However, log-structured file sys-tems store all written data for the long term, whereas ourlogs store only off-loaded data, and temporarily.
Finally, various approaches to storage workload trac-ing and trace replay have been proposed in the researchliterature [2, 10, 15, 31]. We decided to use ETWfor tracing since it is already supported on our tracedservers, and it provides the functionality we needed (trac-ing block-level I/O requests) with low overhead.
6 Discussion
Hardware trends. Recently, there has been consider-able interest in solid-state drives (SSD) for mobile de-vices and laptops [23, 24]. These drives currently vary insize from 4–32 GB, and use less power than disks. WhileSSD-based storage is likely to become widely used inlaptops over the next 2–3 years, it is unlikely to replacedisks in the enterprise in the foreseeable future due to thehigh per-GB costs and performance characteristics.
However, it is likely that solid-state memory (flash)will become common, either in hybrid drives or asa small generic block-level storage device on mother-boards. Hybrid drives include a small amount of flashwithin the disk. This allows the drive to spin the physicaldisk down and use the flash as a persistent buffer cache.This is very similar to the idea of using battery-backedNVRAM as a buffer cache to reduce disk traffic [3].
Thus, if and when enterprise storage becomes fullySSD-based, write off-loading will offer few advantages.However, for the next decade or so we expect that serversystems will continue to have disk-based systems, in-creasingly augmented with solid-state memory: by run-ning loggers on the solid-state devices and using them forwrite off-loading, the power savings of write off-loadingcan be further increased.
Traditionally, spinning a disk up and down is viewedas increasing the stress on the drive and reducing themean time to failure (MTTF). For the state-of-the-art en-terprise class Seagate Cheetah 15K.4 SCSI drives, theMTTF calculations assume 200 power cycles per year.Recent research has re-examined some of the assump-tions about factors that impact disk lifetime [20, 25] buthas not examined the effect of spinning disks down: wesee it as an open question what impact spinning up anddown will have on enterprise disks.
Configuration and management. Write off-loadingrequires some level of administrator configuration andmanagement. For example, an administrator might wishto disable write off-loading for some period of time onsome set of disks, say a RAID array, hosting both man-agers and loggers. When this is desired, all data on log-gers hosted on those disks must be reclaimed by theirhome volumes. Similarly, all data off-loaded by man-agers on those disks must be reclaimed and invalidatedon the loggers that were storing them. This would be theprocedure, for example, for decommissioning a volumethat currently has write off-loading enabled.
System boot volumes typically should not have an off-load manager enabled (although they can certainly sup-port a logger). This avoids off-loading blocks that arerequired for the system to boot.
7 Conclusion
In this paper we propose a technique called write off-loading to save energy in enterprise storage. It allowsblocks written to one volume to be temporarily redirectedto persistent storage elsewhere in an enterprise data cen-ter. This alters the I/O access pattern to the volume,generating significant idle periods during which the vol-ume’s disks can be spun down, thereby saving energy.
We analyzed the potential savings using real-worldtraces gathered for a week from the 13 servers in ourbuilding’s data center. Our analysis shows that sim-ply spinning disks down when idle saves significant en-ergy. Further, write off-loading enables potentially muchlarger savings by creating longer idle periods. To vali-date the analysis we implemented write off-loading andmeasured its performance on a hardware testbed. Theevaluation confirms the analysis results: just spinningdisks down when idle reduces their energy consumptionby 28–36%, and write off-loading increases the savingsto 45–60%.
We believe that write off-loading is a viable techniquefor saving energy in enterprise storage. In order to usewrite off-loading, a system administrator needs to man-age the trade-off between energy and performance. Weare designing tools to help administrators decide how tosave the most energy with the least performance impact.
Acknowledgements
We would like to thank our IT support staff at MicrosoftResearch Cambridge, particularly Nathan Jones for help-ing us to trace our data center servers. We would also liketo thank our anonymous reviewers and our shepherd ErezZadok.
FAST ’08: 6th USENIX Conference on File and Storage TechnologiesUSENIX Association 265

References
[1] T. E. Anderson, M. D. Dahlin, J. M. Neefe, D. A.Patterson, D. S. Roselli, and R. Y. Wang. Serverlessnetwork file systems. In Proc. ACM Symposium onOperating Systems Principles (SOSP’95), CopperMountain, CO, Dec. 1995.
[2] A. Aranya, C. P. Wright, and E. Zadok. Tracefs:A file system to trace them all. In Proc. USENIXConference on File and Storage Technologies(FAST’04), San Francisco, CA, Mar.–Apr. 2004.
[3] M. Baker, S. Asami, E. Deprit, J. Ousterhout, andM. Seltzer. Non-volatile memory for fast, reli-able file systems. In Proc. International Confer-ence on Architectural Support for ProgrammingLanguages and Operating Systems (ASPLOS’92),Boston, MA, Oct. 1992.
[4] M. G. Baker, J. H. Hartman, M. D. Kupfer, K. W.Shirriff, and J. K. Ousterhout. Measurements ofa distributed file system. In Proc. ACM Sympo-sium on Operating Systems Principles (SOSP’91),Pacific Grove, CA, Oct. 1991.
[5] E. V. Carrera, E. Pinheiro, and R. Bianchini. Con-serving disk energy in network servers. In Proc.ACM International Conference on Supercomputing(ICS’03), San Francisco, CA, June 2003.
[6] J. S. Chase, D. C. Anderson, P. N. Thakar, A. M.Vahdat, and R. P. Doyle. Managing energy andserver resources in hosting centers. In Proc.ACM Symposium on Operating Systems Principles(SOSP’01), Chateau Lake Louise, Banff, Canada,Oct. 2001.
[7] D. Colarelli and D. Grunwald. Massive arrays ofidle disks for storage archives. In Proc. ACM/IEEEConference on Supercomputing, Baltimore, MD,Nov. 2002.
[8] M. Dahlin, R. Wang, T. Anderson, and D. Patter-son. Cooperative caching: Using remote clientmemory to improve file system performance. InProc. Symposium on Operating Systems Designand Implementation (OSDI’94), Monterey, CA,Nov. 1994.
[9] F. Douglis, P. Krishnan, and B. Marsh. Thwart-ing the power-hungry disk. In Proc. USENIX Win-ter 1994 Technical Conference, San Francisco, CA,Jan. 1994.
[10] D. Ellard, J. Ledlie, P. Malkani, and M. I. Seltzer.Passive NFS tracing of email and research work-loads. In Proc. USENIX Conference on File and
Storage Technologies (FAST’03), San Francisco,CA, Mar. 2003.
[11] L. Ganesh, H. Weatherspoon, M. Balakrishnan, andK. Birman. Optimizing power consumption inlarge scale storage systems. In Proc. Workshop onHot Topics in Operating Systems (HotOS’07), SanDiego, CA, May 2007.
[12] S. Gurumurthi, A. Sivasubramaniam, M. Kan-demir, and H. Franke. DRPM: Dynamic speed con-trol for power management in server class disks.In Proc. International Symposium on Computer Ar-chitecture (ISCA’03), San Diego, CA, June 2003.
[13] S. Gurumurthi, J. Zhang, A. Sivasubramaniam,M. Kandemir, H. Franke, N. Vijaykrishnan, andM. Irwin. Interplay of energy and performance fordisk arrays running transaction processing work-loads. In Proc. International Symposium on Per-formance Analysis of Systems and Software (IS-PASS’03), Austin, TX, Mar. 2003.
[14] Intel Corporation. Dual-Core Intel R© Xeon R© Pro-cessor 5100 Series Datasheet, Nov. 2006. Refer-ence Number: 313355-002.
[15] N. Joukov, T. Wong, and E. Zadok. Accurate andefficient replaying of file system traces. In Proc.USENIX Conference on File and Storage Technolo-gies (FAST’05), San Francisco, CA, Dec. 2005.
[16] D. Li and J. Wang. EERAID: Energy efficientredundant and inexpensive disk arrays. In Proc.11th ACM SIGOPS European Workshop (SIGOPS-EW’04), Leuven, Belgium, Sept. 2004.
[17] Microsoft. Event tracing. http://msdn.microsoft.com/library/, 2002. PlatformSDK: Performance Monitoring, Event Tracing.
[18] E. B. Nightingale and J. Flinn. Energy-efficiencyand storage flexibility in the Blue file system. InProc. Symposium on Operating System Design andImplementation (OSDI’04), San Francisco, CA,Dec. 2004.
[19] E. Pinheiro and R. Bianchini. Energy conservationtechniques for disk array-based servers. In Proc.Annual International Conference on Supercomput-ing (ICS’04), June 2004.
[20] E. Pinheiro, W.-D. Weber, and L. A. Barroso. Fail-ure trends in a large disk drive population. In Proc.USENIX Conference on File and Storage Technolo-gies (FAST’07), San Jose, CA, Feb. 2007.
FAST ’08: 6th USENIX Conference on File and Storage Technologies USENIX Association266

[21] M. Rosenblum and J. Ousterhout. The design andimplementation of a log-structured file system. InProc. ACM Symposium on Operating Systems Prin-ciples (SOSP’91), Pacific Grove, CA, Oct. 1991.
[22] C. Ruemmler and J. Wilkes. UNIX disk accesspatterns. In Proc. USENIX Winter 1993 TechnicalConference, San Diego, CA, Jan. 1993.
[23] Samsung. NAND flash-based solid state disk prod-uct data sheet, Jan. 2007.
[24] SanDisk. SSD UATA 5000 1.8” data sheet. Docu-ment No. 80-11-00001, Feb. 2007.
[25] B. Schroeder and G. A. Gibson. Disk failures inthe real world: What does an MTTF of 1,000,000hours mean to you? In Proc. USENIX Conferenceon File and Storage Technologies (FAST’07), SanJose, CA, Feb. 2007.
[26] Seagate Technology LLC, 920 Disc Drive, ScottsValley, CA 95066-4544, USA. Cheetah 15K.4 SCSIProduct Manual, Rev. D edition, May 2005. Publi-cation number: 100220456.
[27] M. I. Seltzer, K. Bostic, M. K. McKusick, andC. Staelin. An implementation of a log-structuredfile system for UNIX. In Proc. USENIX Winter1993 Conference, San Diego, CA, Jan. 1993.
[28] C. Weddle, M. Oldham, J. Qian, A.-I. A. Wang,P. Reiher, and G. Kuenning. PARAID: The gear-
shifting power-aware RAID. In Proc. USENIXConference on File and Storage Technologies(FAST’07), San Jose, CA, Feb. 2007.
[29] X. Yao and J. Wang. Rimac: A novel redundancy-based hierarchical cache architecture for energy ef-ficient, high performance storage systems. In Proc.EuroSys Conference, Leuven, Belgium, Apr. 2006.
[30] J. Zedlewski, S. Sobti, N. Garg, F. Zheng, A. Kr-ishnamurthy, and R. Wang. Modeling hard-diskpower consumption. In Proc. USENIX Conferenceon File and Storage Technologies (FAST’03), SanFrancisco, CA, Mar. 2003.
[31] N. Zhu, J. Chen, and T. Chiueh. TBBT: Scalableand accurate trace replay for file server evaluation.In Proc. USENIX Conference on File and StorageTechnologies (FAST’05), San Francisco, CA, Dec.2005.
[32] Q. Zhu, Z. Chen, L. Tan, Y. Zhou, K. Keeton,and J. Wilkes. Hibernator: Helping disk arrayssleep through the winter. In Proc. ACM Sympo-sium on Operating Systems Principles (SOSP’05),Brighton, United Kingdom, Oct. 2005.
[33] Q. Zhu and Y. Zhou. Power-aware storage cachemanagement. IEEE Trans. Computers, 54(5):587–602, 2005.
FAST ’08: 6th USENIX Conference on File and Storage TechnologiesUSENIX Association 267