$WPRVSKHULF QHZ SDUWLFOH IRUPDWLRQ LQ ,QGLD …
29
Atmospheric new particle formation in India: Current understanding and knowledge gaps Vijay P. Kanawade Centre for Earth, Ocean, and Atmospheric Sciences, University of Hyderabad, Hyderabad, Atmospheric new particle formation (NPF) refers to the formation of secondary aerosols from gaseous vapours that undergo gas-to-particle (GTP) conversion. NPF is the largest source of aerosol numbers to the terrestrial atmosphere. It produces more than half of the present-day cloud condensation nuclei (CCN), thus influencing cloud properties and Earth’s energy budget. But, very little is known on the physio-chemical processes leading to NPF and airborne production of aerosol mass in India. The first-ever evidence of atmospheric NPF in India was reported in 2005. To date, there are only 22 published papers based on independent field campaigns and long-term field observations in India. These studies mainly reported the key NPF characteristics such as NPF frequency, particle formation rate, growth rate and atmospheric conditions influencing NPF. The chemical mechanisms responsible for NPF are yet to be explored in India because field observations using state-of-the-art instruments (e.g., Cluster-CIMS, APi-ToF, etc.) are not available for real-time identification and quantification of gas-phase and particle-phase compounds in the air. In this talk, I will present a synthesis of the observed characteristics of NPF in different environments of India and present critical knowledge gaps for future NPF studies in India.
Transcript of $WPRVSKHULF QHZ SDUWLFOH IRUPDWLRQ LQ ,QGLD …

Atmospheric new particle formation in India: Current understanding and
knowledge gaps
Vijay P. Kanawade
Centre for Earth, Ocean, and Atmospheric Sciences, University of Hyderabad, Hyderabad,
Atmospheric new particle formation (NPF) refers to the formation of secondary aerosols from
gaseous vapours that undergo gas-to-particle (GTP) conversion. NPF is the largest source of
aerosol numbers to the terrestrial atmosphere. It produces more than half of the present-day
cloud condensation nuclei (CCN), thus influencing cloud properties and Earth’s energy
budget. But, very little is known on the physio-chemical processes leading to NPF and
airborne production of aerosol mass in India. The first-ever evidence of atmospheric NPF in
India was reported in 2005. To date, there are only 22 published papers based on independent
field campaigns and long-term field observations in India. These studies mainly reported the
key NPF characteristics such as NPF frequency, particle formation rate, growth rate and
atmospheric conditions influencing NPF. The chemical mechanisms responsible for NPF are
yet to be explored in India because field observations using state-of-the-art instruments (e.g.,
Cluster-CIMS, APi-ToF, etc.) are not available for real-time identification and quantification
of gas-phase and particle-phase compounds in the air. In this talk, I will present a synthesis of
the observed characteristics of NPF in different environments of India and present critical
knowledge gaps for future NPF studies in India.

Bioactive trace metal composition and their fractional solubility in
aerosols from the Arabian Sea during the Southwest Monsoon
P. P. Panda 1, Aditya Peketi1, Ashwini Kumar*1
1CSIR-National Institute of Oceanography, Dona Paula, Goa, India
[email protected]; [email protected]; [email protected]*
Atmospheric dust deposition supplies significant amount of macro and micro (trace metals)
nutrients to surface ocean water, thus, plays vital role in modulating phytoplankton growth.
Here we report, soluble and total bioactive trace metals (Fe, Mn and Cu) along with aeoilan
dust concentration measured in aerosol samples collected over wide area of the Arabian Sea
during southwest monsoon month in two consecutive years (2017 and 2018). Relatively
higher mineral dust concentrations were observed during the campaign period compared to
those reported in the Arabian Sea, highlighting emission and transport of dust from
surrounding active sources. A large spatial variability (similar to mineral dust) in total (30.6-
2830.4 ng m-3) and soluble Fe (3.6 - 32.8 ng m-3) concentration were observed in contrast to
Mn and Cu. However, the operational fractional solubility (defined as fraction of soluble
metal leached using Milli-Q water out of total metal) is relatively low (less than 3.5 %) for
Fe as compared to Mn (range: 3.6 - 94.6 %) and Cu (3.6 - 97.9 %). Insignificant contribution
of the anthropogenic Fe and Mn is seen during the study period which is evident form their
enrichment factor (EF less than 10 w.r.t. continental crustal ratio). However, relatively higher
EF for Cu is found in majority of samples, indicating partial contribution from anthropogenic
emissions. An inverse hyperbolic relationship between fractional solubility and total metal is
observed for Fe (similar to previous observations) however, no such association found in case
of Mn and Cu. The dry deposition fluxes of Fe, Mn and Cu to the surface water of the Arabian
Sea are estimated as 720.6, 38.1 and 1.4 g m-2 day-1, respectively. These fluxes are
relatively on higher side compared to those reported from other oceanic region over the
Globe.
Keywords: Aerosols; Trace metals; Mineral dust; Deposition Flux; Arabian Sea

Air chemistry in a tropical urban environment of India: A modeling perspective
Meghna Soni1,2,a and Narendra Ojha1,b
1Physical Research Laboratory, Ahmedabad, India2Indian Institute of Technology, Gandhinagar, Gujarat, India
[email protected]@prl.res.in
Air chemistry over tropical India has pronounced impacts on the air quality and climate;
nevertheless, studies dealing with detailed composition remain few in this region. In this regard, we
combined a suite of in situ and remote sensing measurements with a photochemical box model
(NCAR Master Mechanism) to simulate the chemistry and quantify effects of meteorological
changes over Ahmedabad. Several trace gases of natural and anthropogenic origin have been
included in the model under prescribed environmental conditions of this region. Model results show
strong ozone (O3) build-up with levels exceeding 100 ppbv before a gradual decrease in the
downwind of Ahmedabad. The ozone-rich air masses are seem to circulate across the rural areas and
thereafter enter the marine boundary layer of the Arabian sea. Besides O3, significant amounts of
secondary chemical species e.g. ketones ( 11 ppbv) are produced in the outflow. Model∼11 ppbv) are produced in the outflow. Model
successfully reproduced a dramatic impact of the variation in aerosol optical depth (AOD) on O3,
i.e. when AOD is enhanced from 0.1 to 1.5 in the model, the noontime O3 is reduced by about 40
ppbv. Additionally, the model unravelled a remarkable impact of meteorological transition (by
16%) in enhancing O∼11 ppbv) are produced in the outflow. Model 3 besides due to the unprecedented reduction in anthropogenic emissions (by
25%) during the COVID-19 lockdown. Our simulation results would be valuable to design∼11 ppbv) are produced in the outflow. Model
adequate strategies towards cleaner air and climate mitigation in the region.

Green Technology to Mitigate Air Pollution – Real Time Data Based Analysis
Dr. Ramya C Balan, Radhica Kanniganti, Kiran Shinde, Rohit Kantikar and Dr. Srikanth Sola
Devic Earth Pvt. Ltd., Whitefield – Hoskote Road, Bangalure – 67, Karnataka
Aerosols are tiny particles that have a significant impact on the atmosphere. Its effects are both
direct and indirect. The most serious consequence of aerosols that has a direct impact on human
health is air pollution caused by particulate matter emissions from various industries. Every
year, poor air quality kills 7 million people prematurely and causes serious lung and heart
disease in more than half of the population. Pure Skies technology is a novel technology that
uses pulsed radio frequency waves to reduce particulate pollution. The radio frequency waves
are transmitted using a custom-made omnidirectional antenna. The technology is used to reduce
particle pollution levels, particularly PM10 and PM2.5. The complete unit consists of antenna,
signal source, power source, internet of things (IoT) hardware for communication from the
laboratory to the unit, an uninterrupted power supply (UPS), and miscellaneous hardware for
electrical safety and security.
Pure Skies technology suggest that the posited mechanism of action of the pulsed radio wave
technology is to accelerate the process of dry deposition of particles less than 20-30 microns in
diameter. The working hypothesis is that the pulsed radio wave technology takes advantage of
the dielectric effect created under the influence of a spatially non-uniform electric field. The
radio wave energy which is broadcasted in a pulsed manner is likely to generate a non-uniform
electric field with the strength of the field varying with distance from the antenna which
accelerates dry deposition by inducing charge on particulate pollutants.
The presentation provides an overview of various case studies involving pulsed radio waves to
mitigate particulate pollution in various sectors, as well as a few experimental and modelling
results obtained from the studies carried out IIT Kanpur.
The first case studies were conducted at the thermal power plant's outdoor and indoor locations,
where the 24-hour average PM2.5 and PM10 levels were reduced by 54% and 41%,
respectively.
The second case study was conducted in the cement industry, where PM2.5 levels were reduced
by 48% and PM10 levels were reduced by 50%.
The entire set of results along with the working principle will be presented at the conference.
Reference
1. Davidson, C.I., Phalen, R.F. and Solomon, P.A., 2005. Airborne particulate matter and human
health: a review. Aerosol Science and Technology, 39(8), pp.737-749.

2. Manisalidis, I., Stavropoulou, E., Stavropoulos, A. and Bezirtzoglou, E., 2020.
Environmental and health impacts of air pollution: a review. Frontiers in public health, 8.
3. Kumar, R., Jilte, R., Nikam, K.C. and Ahmadi, M.H., 2019. Status of carbon capture and
storage in India’s coal fired power plants: A critical review. Environmental Technology &
Innovation, 13, pp.94-103.

Are fireworks a significant episodic source of brown carbon?
Prashant Rawat1, Bijay Sharma1,2, Supriya Dey1, Archita Rana1, Arya Mukherjee3, Anuraag J.
Polana1, Jingying Mao4, Shiguo Jia5,6, Amit K. Yadav7, Pandit. S. Khillare7, Sayantan Sarkar1,2*
1Department of Earth Sciences, Indian Institute of Science Education and Research (IISER)
Kolkata, Mohanpur741246, Nadia, India.
2School of Engineering, Indian Institute of Technology (IIT) Mandi, Kamand, Himachal Pradesh
175075, India.
3Department of Chemical Sciences, Indian Institute of Science Education and Research (IISER)
Kolkata, Mohanpur741246, Nadia, India.
4Institute for Environmental and Climate Research, Jinan University, Guangzhou 510632, PR
China
5Guangdong Province Key Laboratory for Climate Change and Natural Disaster Studies, Sun Yat-
sen University, Guangzhou 510275, PR China.
6School of Atmospheric Sciences, Sun Yat-sen University, Guangzhou, 510275, PR China.
7School of Environmental Sciences, Jawaharlal Nehru University, New Delhi 110067, India.
*Corresponding author at: A11-05-06, Indian Institute of Technology (IIT) Mandi, Kamand,
Himachal Pradesh 175075, India; Phone: +91-1905-267829; Email: [email protected]

Abstract
We hypothesize that firework events involving combustion of charcoal fuel, organic binders, metal
salts and cellulose-based wrapping material could be significant transient sources of aerosol brown
carbon (BrC). To test this, we couple high time-resolution (1 min) measurements of black carbon
(BC) and BrC absorption from a 7-wavelength Aethalometer with time-integrated (12-24 h)
measurements of filter extracts, i.e., UV-Visible, fluorescence and Fourier-transformed infrared
(FT-IR) signatures of BrC, total and water-soluble organic carbon (OC and WSOC), ionic species,
and firework tracer metals during a sampling campaign covering the Diwali fireworks episode in
India. In sharp contrast to BC, BrC absorption shows a distinct and considerable rise of 2-4 times
during the Diwali period (Figure 1), especially during the hours of peak firework activity, as
compared to the background. Fluorescence profiles (Figure 2a) suggest enrichment of humic-like
substances (HULIS) in the firework plume while the enhancement of BrC absorption showed
(Figure 2b) the 400-500 nm range suggests presence of nitroaromatic compounds (NACs).
Considerable contributions of WSOC and secondary organics to OC (44.1% and 31.2%,
respectively) and of the water-soluble fraction of BrC to total BrC absorption (71.0%) during the
Diwali period point toward an atmospherically-processed, polar signature of firework-related BrC
(Figure 3), which is further confirmed by FT-IR profiles. This aqueous BrC exerts a short-lived
but strong effect on atmospheric forcing (12.0% vis-à-vis BC in the UV spectrum), could affect
tropospheric chemistry via UV attenuation, and lead to a stabilization of the post-Diwali
atmosphere resulting in enhanced pollutant build-up and exposure.

Fig. 1. Contour maps showing the hourly variation of (a) BC (µg m-3), and (b) babs_BrC (Mm-1)
derived from the Aethalometer for the study period. The Diwali night is marked with a black
rectangle.

Fig. 2. Characteristics of BrCaq for the pre-Diwali, Diwali and post-Diwali periods, and on Diwali
night in terms of UV-Vis absorption coefficients (a), and fluorescence emission (λexcitation = 280
nm) (b).

Fig. 3. Wavelength-dependent variation of babs_aq/babs_me and water insoluble chromophores for
the Diwali period (a) and relative radiative forcing of BrCaq and BrCme for the Diwali period (b).
The x-axis in (b) shows wavelength ranges in nm (300-400, and 300-2500).

AEROSOL PHYSICAL-CHEMICAL PROPERTIES AND ITS ASSOCIATION
WITH CLOUD CONDENSATION NUCLEI ACTIVATION OVER A TROPICAL
COASTAL LOCATION
Ajith,T C 1,2, Sobhan Kumar Kompalli1, Vijayakumar S Nair1 and S. Suresh Babu1
1 Space Physics Laboratory, Vikram Sarabhai Space Centre, Thiruvananthapuram, India
2 Department of Physics, University of Kerala, Thiruvananthapuram, India.
Contact details
Ajith T C ([email protected], Sobhan Kumar Kompalli ([email protected]),
Vijayakumar S Nair ([email protected]), S Suresh Babu ([email protected])
Abstract
One of the largest uncertainties in the present understanding of climate change is the inability to
accurately represent aerosol-cloud interactions and associated feedback processes. Cloud
condensation nuclei (CCN) are the subset of atmospheric aerosols which activate in to cloud
droplets under sufficient atmospheric conditions, and accurate estimation of CCN number
concentration is essential to incorporate aerosol-cloud interaction in the climate models. Dry
particle size, chemical composition (hygroscopicity) and the way in which each chemical species
are mixed in the population (mixing state) are the major parameters deciding the CCN activation
ability of aerosols. Among these parameters, relative importance of chemical composition and
mixing state on CCN activation are still under debate and is one of the widely investigated
topics. Recent studies show, organics, which are the dominant component in the sub-micron
aerosols, have significant influence on the CCN activation. Due to thousands of internal
molecular components and various atmospheric processes acting on them, exact knowledge
about hygroscopicity and quantified impact of organics on CCN activation is not yet achieved.
The lack of availability of high resolution chemical composition data from organics dominated
sites worsens this situation. In this regard, high resolution measurements of aerosol physical-
chemical properties were carried out from a tropical coastal location Thumba during winter
(2017-20). Being a coastal location, the site experiences contrasting air masses owing to
mesoscale land-sea breeze circulation which provides a unique opportunity to study the CCN
properties under contrasting conditions. The results revealed larger variability in the aerosol
number concentration, chemical composition and CCN activation (0.3-0.6) within a day.
Interestingly aerosol number size distributions were nearly similar (change in mode diameter

~9nm). Additionally, Positive matrix factorization (PMF) analysis was applied on the organics
data collected with mass spectrometer and found secondary organics as the major component in
the bulk organics.The dominance of sulfate and secondary organics during daytime resulted in
highly hygroscopic CCN active system; whereas hydrophobic organics severely reduced its
activation efficiency during night time. Köhler theory with various mixing state assumptions was
used to estimate CCN number concentrations and the results were compared with the measured
values (CCN closure studies). It is found that mixing state assumptions have least role in CCN
activation compared to the organics hygroscopicity. More results will be presented.

Understanding the variation of particulate matter over Ahmedabad city
Bhargav Prajapati1 , Tejas Turakhia1,3, Akhil S. Nair1,4, Rajesh Iyer1 , Mehul R. Pandya2 ,
Deepak H. Gadani4
1St. Xavier’s College (Autonomous), Ahmedabad-380009, Gujarat, India 2Space Applications Centre, ISRO, Ahmedabad- 380015, Gujarat, India
3Department of Instrumentation and Control Engineering, Gujarat Technological University,
Ahmedabad – 382424, Gujarat, India 4Department of Physics, Electronics & Space Sciences, University School of Sciences,
Gujarat
University, Ahmedabad, Gujarat, India
Email: [email protected] , [email protected],3
,[email protected],4 [email protected] , [email protected] ,
ABSTRACT
Experimental studies around the world have shown the significant of concentration of
particulate matter for human health. Fine particulate matter (PM 2.5, PM10 & PM0.1) causes a
risk to human health due to the efficiency of penetrating deep in to lungs and other
cardiovascular effect. The purpose of present study is to observe the concentration of PM2.5 in
Ahmedabad (urban Industrial region) from 2015 to 2020. Observation indicates variation of
PM2.5 concentration from 87.41466964 µg/m³ to 46.56682929 µg/m³ for the period of 2015 to
2020. The highest PM2.5 concentration was in 2017 which was 91.6589132 µg/m³ and the lowest
was in year-2020 due to global pandemic imposed lockdown. Yearly variation was like in the
year of 2016 the concentration of PM2.5 was decreased as compared to 2015, whereas it
increased in the year of 2017, in 2017 the concentration of PM2.5 was on its peak, and then it is
constantly decreasing from the year 2017 to 2020.
In most of the years the concentration of PM2.5 between June to September was at its lowest
point due to monsoon. While during post monsoon the concentration of PM2.5 was at its peak
in November due to Festivals time.

References:
[1] Gang Lin, Jingying Fu, Dong Jiang, Jianhua Wang, Qiao Wang, Donglin Dong,“Spatial
Variation of the Relationship between PM2.5 Concentrations and Meteorological Parameters
in China”.
[2] Yanling Xu, Wenbo Xue 2, Yu Lei 2, Yang Zhao, Shuiyuan Cheng, Zhenhai Ren, Qing
Huang, “Article Impact of Meteorological Conditions on PM2.5 Pollution in China during
Winter”.
[3] Ground data acquired from - https://app.cpcbccr.com/ccr/#/caaqm-dashboard-all/caaqm-
landing/data
87.4146696481.14965128
91.6589132
74.57233028
61.84154976
46.56682929
0
20
40
60
80
100
2014 2015 2016 2017 2018 2019 2020 2021
Concentration of PM2.5 / Year
0
50
100
150
200
jan feb march april may june july aug sept oct nov dec
Concentration of PM2.5 / Month
2015 2016 2017 2018 2019 2020
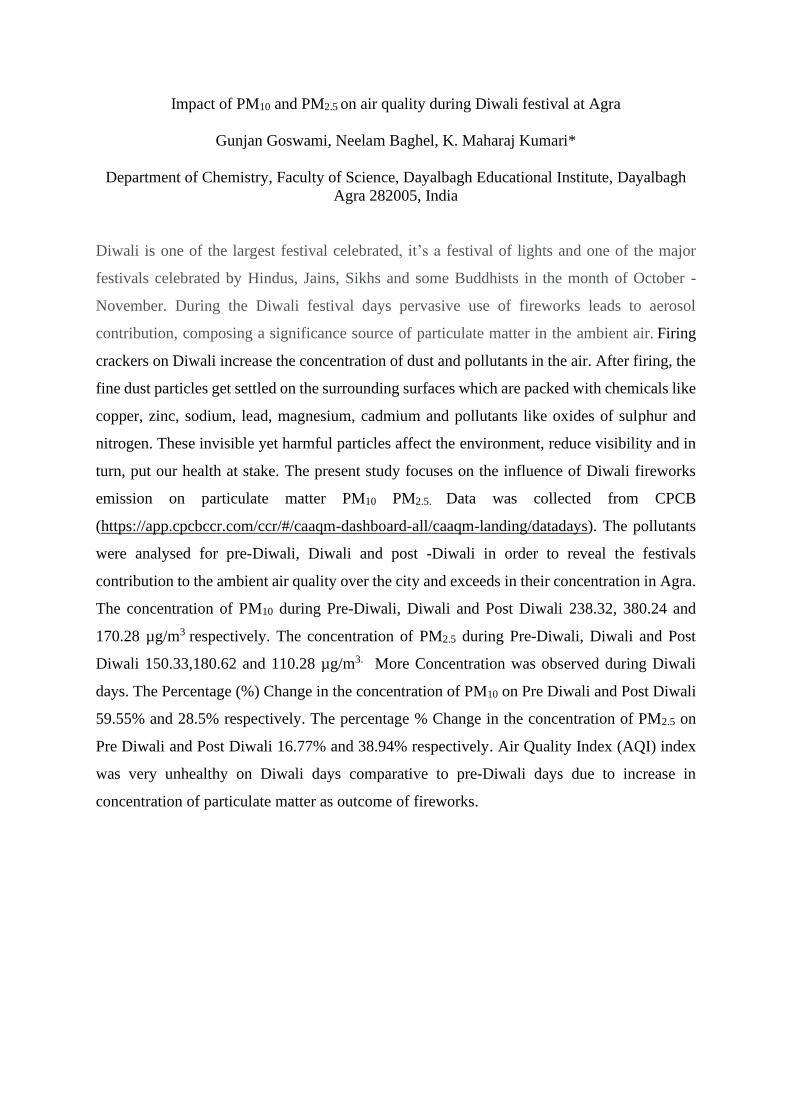
Impact of PM10 and PM2.5 on air quality during Diwali festival at Agra
Gunjan Goswami, Neelam Baghel, K. Maharaj Kumari*
Department of Chemistry, Faculty of Science, Dayalbagh Educational Institute, Dayalbagh
Agra 282005, India
Diwali is one of the largest festival celebrated, it’s a festival of lights and one of the major
festivals celebrated by Hindus, Jains, Sikhs and some Buddhists in the month of October -
November. During the Diwali festival days pervasive use of fireworks leads to aerosol
contribution, composing a significance source of particulate matter in the ambient air. Firing
crackers on Diwali increase the concentration of dust and pollutants in the air. After firing, the
fine dust particles get settled on the surrounding surfaces which are packed with chemicals like
copper, zinc, sodium, lead, magnesium, cadmium and pollutants like oxides of sulphur and
nitrogen. These invisible yet harmful particles affect the environment, reduce visibility and in
turn, put our health at stake. The present study focuses on the influence of Diwali fireworks
emission on particulate matter PM10 PM2.5. Data was collected from CPCB
(https://app.cpcbccr.com/ccr/#/caaqm-dashboard-all/caaqm-landing/datadays). The pollutants
were analysed for pre-Diwali, Diwali and post -Diwali in order to reveal the festivals
contribution to the ambient air quality over the city and exceeds in their concentration in Agra.
The concentration of PM10 during Pre-Diwali, Diwali and Post Diwali 238.32, 380.24 and
170.28 µg/m3 respectively. The concentration of PM2.5 during Pre-Diwali, Diwali and Post
Diwali 150.33,180.62 and 110.28 µg/m3. More Concentration was observed during Diwali
days. The Percentage (%) Change in the concentration of PM10 on Pre Diwali and Post Diwali
59.55% and 28.5% respectively. The percentage % Change in the concentration of PM2.5 on
Pre Diwali and Post Diwali 16.77% and 38.94% respectively. Air Quality Index (AQI) index
was very unhealthy on Diwali days comparative to pre-Diwali days due to increase in
concentration of particulate matter as outcome of fireworks.

COMPARATIVE STUDY OF PM2.5 DIMINUTION AND HAZE EVENTS OVER DELHI AND AGRA
DURING THE COVID-19 LOCKDOWN PERIOD
Isha Goyal, Kandikonda Maharaj Kumari and Anita Lakhani*
Department of Chemistry, Dayalbagh Educational Institute, Dayalbagh, Agra (UP), 282005
E-mail address: [email protected], [email protected]
Agra, a UNESCO World Heritage site and Delhi-NCR, a tropical Indian megacity,
experience severe air pollution in the world, linked with diverse anthropogenic and biomass
burning emissions. First phase of COVID-19 lockdown in India, implemented during 25
March to 14 April 2020 resulted in a dramatic near-zeroing of various activities (e.g. traffic,
industries, constructions), except the “essential services”. In this study, variations in the fine
particulate matter (PM2.5) over the Agra-Delhi-NCR region were studied. Results concludes
that 27% increase in PM2.5 and a 65% increase in PM10 compared to the first two weeks of
the lockdown (25 March to 6 April) was observed in the second week of April (7 April to 15
April). However, PM2.5 levels were still lower by 39% than pre-lockdown concentrations in
Dehli-NCR region. This may primarily be attributed to change in meteorological conditions.
Measurements revealed large reductions in PM2.5 during the first week of lockdown (25–31
March 2020) as compared to the pre-lockdown conditions in Agra. However, O3 pollution
remained high during the lockdown due to non-linear chemistry and dynamics under low
aerosol loading. Due to the onset of summers, temperature has started to increase with a
minimum and maximum temperature of 12.6 ºC and 27 ºC on 16th March 2020 to 24 ºC and
40ºC on 15th April 2020, leading to dry and dusty conditions. Notably, it was reported that a
mild dust storm from western part of the country and the gulf regions hit Delhi on 14- 15th
April, thus rapidly increasing the PM levels in Agra-Delhi-NCR region. The study highlights
a highly complex chemistry between the baseline pollution and meteorology leading to
enhancements in pollution, besides an overall improvement in air quality during the COVID-
19 lockdown in this part of the world.
Keywords: Covid-19, meteorology, PM2.5, Agra-Delhi-NCR region
References
1. Central Pollution Control Board (CPCB), 2020. Impact of Lockdown on Air Quality
8–9.
2. Dhaka, S.K., Chetna, Kumar, V., Panwar, V., Dimri, A.P., Singh, N., Patra, P.K.,

Matsumi, Y., Takigawa, M., Nakayama, T., Yamaji, K., Kajino, M., Misra, P.,
Hayashida, S., 2020. PM2.5 diminution and haze events over Delhi during the
COVID-19 lockdown period: an interplay between the baseline pollution and
meteorology. Sci. Rep. 10, 1–8. https://doi.org/10.1038/s41598-020-70179-8

FINDING AND ANALYZING THE SOURCE FOR THE PRODUCTION OF
CARBON MONOXIDE OVER INDIA USING SATELLITE DATA.
Khushali Tank1, Tejas Turakhia1, 3, Akhil S. Nair1, 4, Rajesh Iyer1, Mehul R. Pandya2
1St. Xavier’s College (Autonomous), Ahmedabad-380009, Gujarat, India
2Space Applications Centre, ISRO, Ahmedabad- 380015, Gujarat, India
3Department of Instrumentation and Control Engineering, Gujarat Technological University,
Ahmedabad – 382424, Gujarat, India
4Department of Physics, Electronics & Space Sciences, University School of Sciences,
Gujarat University, Ahmedabad, Gujarat, India
Email: [email protected], [email protected],3, [email protected],4,
[email protected], [email protected]
ABSTRACT
Nowadays, dealing with global warming and climate variability is one of the utmost
challenges. This paper investigates one of the trace gases, i.e., carbon monoxide and presents
a source contribution for the concentration of carbon monoxide and identify the hotspot area
on India over the year 2019 and 2020. The work has undergone using the TROPOMI
instrument, on-board Sentinel-5 Precursor. It is observed that Orrisa, West Bengal, and
Jharkhand are considered to be the hotspot area with concentrations (≥50000) µmol/m2. The
key contribution to carbon monoxide concentration is anthropogenic activities and biomass
burning in India. Besides, CO over the Bay of Bengal was much higher compared to the
Arabian Sea. The above situation explains the fact that proximity of land directly affects CO
levels. All in all, other factors like Industrial activities, Vehicles emission also contribute to
the concentration (≥40000) µmol/m2 of carbon monoxide in the zone like Bihar, Delhi, Indo-
Gangetic Plain, etc., are deliberated in this paper.
References:
[1] C. Ramprasad 2020. “The Effect of COVID-19 on the Atmospheric Parameters over the
Indian Subcontinent”, Nature Environment and Pollution Technology, Vol. 20 pp. 713-719
2021. https://neptjournal.com/upload-images/(30)B-3740.pdf
[2] Satellite data - Sentinel-5 - Missions - Sentinel Online - Sentinel Online (esa.int)

Impact of Covid-19 pandemic on the variation of Black carbon over an urban city Delhi
Kush Ghetia1, Tejas Turakhia1,3, Akhil S. Nair1,4, Rajesh Iyer1, Mehul R. Pandya2,
Deepak H. Gadani4
1St. Xavier’s College(Autonomous), Ahmedabad-380009, Gujarat, India,
2Space Applications Center, ISRO, Ahmedabad-380015, Gujarat, India
3Department of Instrumentation and Control Engineering, Gujarat Technological University,
Ahmedabad-382424, Gujarat, India
4Department of Physics, Electronics and Space Sciences, University School Sciences, Gujarat
University, Ahmedabad, Gujarat, India
Email: [email protected], [email protected],3 , [email protected],4 ,
[email protected], [email protected], [email protected]
ABSTRACT
This work is aimed to the study the impact of Covid-19 lockdown on Black carbon
concentrations in the atmosphere of an urban city Delhi. For this purpose, we have acquired the
data from three continuous monitoring stations in Delhi operated by The Centre of Pollution
Control Board for the years 2019, 2020, 2021. The concentration of black carbon levels is plotted
against the respective months of the three years and against the period of phases of lockdown.
For the year 2020, it is observed that the pre lockdown black carbon levels were in the range 2.9
to 5.5 µg/m3, after which with the onset of lockdown the values fell sharply by 70% to 80% and
were in the range 0.2 to 1.0 µg/m3 for the first four lockdown phases. The values started
increasing gradually from June or Phase Unlock 1. Black carbon levels rose to at least 50% of its
pre lockdown value and the range was 0.3 to 2.2 µg/m3 by August or Phase Unlock 3. Overall it

was observed that the black carbon aerosol levels decreased substantially with lockdown
restrictions, and this decrease can be attributed to the decrease in anthropogenic activities which
are major contributors to the black carbon concentration such as industrial and vehicular
emissions. The gradual increase after June is in correlation with the increase in anthropogenic
activities as the restrictions were gradually lifted.
1)Lodhi Road
2) Pusa

3)Aya Nagar
Keywords: Black Carbon (BC), Covid-19 lockdown
References:
[1] Jyotishree Nath, subhasmita Panda, Satya S. Patra, Boopathy Ramasamy and Trupti Das –
“Variation of black carbon and particulate matter in Bhubaneshwar during the pre-monsoon:
possible impact of metereology and COVID-19 lockdown”

A three-year record of chemical composition and 87Sr/86Sr in rainwater over
Bhopal, the second cleanest city of India
Nafees Ahmad ([email protected]) and Satinder Pal Singh ([email protected])
Department of Earth and Environmental Sciences,
Indian Institute of Science Education and Research, Bhopal 462066, Madhya Pradesh, India
Rainwater chemistry is a useful indicator for determining the regional air quality [1, 2]. In
the present study, chemical and Sr isotope compositions of monsoonal rainwater (133 individual
showers) collected outskirts of Bhopal, Central India in three successive years (2016–2018) have
been measured to quantify various solute contributions. The pH of rainwater covers a range of ~3.8–
8.01 with an average value of 6.11, indicating the alkaline nature. The Ca and NH4 are major species
neutralizing the rainwater acidity. Considering Cl as a marine index, non-marine proportions of K,
Ca, Mg, SO4, and Sr are found significant in the rainwater. The scatter plots of (a) Ca/Na versus
Mg/Na and (b) Ca/Sr versus 87Sr/86Sr reveal that atmospheric dust from the Deccan Basalt lithology
is the major contributor of base cations to the regional rainwater. This inference is also supported by
the 5-days air parcel back trajectories showing the predominance of westerly monsoonal winds from
the Arabian Sea.
References:
1. Rastogi N, Sarin MM. Long-term characterization of ionic species in aerosols from urban
and high-altitude sites in western India: Role of mineral dust and anthropogenic sources.
Atmospheric Environment 2005; 39: 5541–5554.
2. Chatterjee J, Singh SK. 87Sr/86Sr and major ion composition of rainwater of Ahmedabad,
India: Sources of base cations. Atmospheric Environment 2012; 63: 60–67.

THE IMPACT OF LOCKDOWN ON AIR POLLUTION LEVELS AND CHANGE IN
AIR QUALITY AT SUB-URBAN SITE DAYALBAGH, AGRA
Neealam Baghel, Sonal Kumari, Anita Lakhani and K. Maharaj Kumari*
Department of Chemistry, Faculty of Science, Dayalbagh Educational Institute, Dayalbagh,
Agra 282005, India
The nationwide lockdown in India announced from March 25-May 31, 2020 in different phases
to prevent the rapid spread of pandemic COVID-19 has resulted in the reduction of
anthropogenic emission sources (vehicular and industries mainly) to a great extent. Present
study reports change in air quality during the lockdown period at Dayalbagh, Agra, a semi-
urban site in Northern India. Present study reports change in air quality during the lockdown
period at Dayalbagh, Agra, a semi-urban site in Northern India. The data showed a remarkable
reduction in the mean pollutant levels influenced by traffic emissions like Nitric oxide (NO)
reduced by 54.1%, Nitrogen Dioxide (NO2) by 86.7% - (64.6% (NOx) and PM2.5 by 28.7%
during lockdown over same period in the previous year. Comparatively, a lower reduction of
Carbon monoxide (CO) 8.6% may be attributed to the dominance of natural atmospheric
chemical regulation, biogenic sources in addition to anthropogenic contributions and long-life
span. An enhancement of secondary pollutant - Ozone (O3) 5.1% was observed during
lockdown over same period in the previous year (2019). O3 showed same diurnal pattern during
lockdown phase as in other phases, while the bi-modal peaks of NO, NO2 (NOx), PM2.5 were
supressed due to less vehicular emission and other anthropogenic activities, however CO
showed prominent bi-modal peaks during lockdown. The concentration of NO, NO2, NOx,
PM2.5 and CO reduced by 38.0%, 71.9%, 48.6%, 40.2% and 34.83% respectively during
lockdown period in comparison to pre-lockdown period (2020), in contrast O3 concentration
increased by 24.5%; while, concentrations of NO, NO2, NOx, PM2.5 and CO increased by
44.4%, 79.7%, 72.02%, 34.6% and 3.5% respectively as the country unlocked in comparison
to lockdown period, while O3 concentration decreased by 16.2%. Air Quality Index (AQI) was
very unhealthy during the pre-lockdown periods but during the lockdown periods almost all
anthropogenic sources were reduced so AQI so may be said to be better than pre-lockdown
periods but still unhealthy for sensitive groups during the lockdown period.

Variation of Nitrogen Dioxide (NO2) over metropolitan areas of India
Vaibhav Trivedi1, Tejas Turakhia1,3, Akhil S. Nair1,4, Rajesh Iyer1, Mehul R. Pandya2,
Deepak H. Gadani4 1St. Xavier’s College (Autonomous), Ahmedabad-380009, Gujarat, India 2Space Applications Center, ISRO, Ahmedabad- 380015, Gujarat, India
3Department of Instrumentation and Control Engineering, Gujarat Technological University,
Ahmedabad – 382424, Gujarat, India 4Department of Physics, Electronics & Space Sciences, University School of Sciences, Gujarat
University, Ahmedabad, Gujarat, India
Email: [email protected], [email protected],3 ,[email protected],4
[email protected], [email protected] , [email protected]
ABSTRACT
The continuous monitoring of pollutants like Nitrogen Dioxide (NO2) is a mandatory step towards
the understanding of the air quality of the region and public health. In this study, we analyzed the
variation of Nitrogen Dioxide (NO2) over all the metropolitan areas of India which are given in
table-1. We have done our analysis over the years 2019 and 2020. For this study, we used data
derived from ESA’s Sentinel-5P satellite. To understand the seasonal variation of NO2
concentrations over the years 2019 and 2020, The mean of daily data is carried out for monthly
mean NO2 concentration to understand the seasonal variation. This COVID-19 pandemic in the
year 2020 led us to a lockdown period. To quantify the effect of lockdown the same process is
done over the lockdown period (LP) and compared with the Before and After lockdown period. In
Table-2, the average seasonal value of NO2 concentrations is given for the years 2019 and 2020.
We can see the effect of lockdown brought by the COVID-19 pandemic in results. On an average
overall region, NO2 concentration reduced about -20.14% due to lockdown. After the lockdown,
with resuming of daily life the concentrations were raised to 17.25% overall regions as assumed.
The average fall in seasonal trend over all areas was about -7.57% in 2020 as compared to 2019
over all areas. This fall in seasonal trend can be explained by the lockdown effect of the COVID-
19 pandemic.

Ahmedabad Kolkata Hyderabad Kochi Madurai Bangalore Chennai
Coimbatore Delhi Jaipur Jodhpur Kanpur Kozhikode Mumbai
Nagpur Patna Pune Salem Surat Thiruvananthapuram Vishakhapatnam
Table-1: List of metropolitan areas of India
Seasonal value of NO2 concentration (mol/m2)
Metropolitan area 2019 2020
Seasons
Win Sum Pre
mon
Post
mon
Win Sum Pre
mon
Post
mon
Ahmedabad 138.38 134.79 102.42 106.33 137.35 98.45 88.44 111.01
Kolkata 130.23 114.50 100.31 94.36 125.97 99.70 90.52 88.56
Hyderabad 86.35 111.20 82.75 66.71 81.39 84.63 69.81 74.16
Kochi 71.80 67.79 53.28 52.90 68.16 58.85 51.69 51.60
Madurai 53.99 74.14 65.33 54.53 52.33 61.44 60.30 60.25
Bangalore 89.65 117.54 65.68 63.49 83.76 77.82 58.77 62.57
Chennai 82.29 85.08 88.03 76.48 77.35 65.72 70.24 81.79
Coimbatore 61.62 80.96 59.46 53.57 60.22 63.76 55.50 54.82
Delhi 178.87 137.77 126.33 117.69 148.86 105.30 105.95 114.39
Jaipur 100.38 101.11 88.78 84.24 96.87 83.80 82.28 85.44
Jodhpur 81.70 87.56 79.36 77.72 87.55 71.94 76.65 77.09
Kanpur 101.56 100.85 93.21 83.08 93.27 86.38 84.43 86.58
Kozhikode 55.89 60.342 50.62 45.91 54.77 51.74 47.31 47.34
Mumbai 175.76 129.77 82.39 93.16 158.51 93.22 71.43 100.11
Nagpur 138.09 148.9 92.89 92.43 127.27 96.82 76.93 121.98
Patna 95.42 105.19 99.96 86.89 93.52 87.68 85.32 87.47
Pune 104.71 120.51 71.80 67.11 98.17 84.89 60.43 72.32
Salem 56.90 81.34 66.72 52.18 55.54 67.20 62.77 58.47
Surat 117.85 116.96 79.73 80.10 118.07 94.56 70.47 92.64
Thiruvananthapuram 51.04 56.22 47.29 44.85 50.09 48.76 45.46 45.53
Vishakhapatnam 79.92 96.84 89.56 73.51 81.14 84.83 74.12 74.36
Table-2: Metropolitan area wise seasonal value of NO2 concentration for year 2019 and 2020
Keywords: Nitrogen Dioxide (NO2), Seasonal trend, Sentinel-5P, COVID-19 lockdown

References:
[1] M. Virghileanu, I. savulescu, B. Mihai, C. Nishor, R. Dobre – “Nitrogen Dioxide (NO2)
Pollution Monitoring with Sentinel-5P Satellite Imagery over Europe during the Coronavirus
Pandemic Outbreak” , MDPI – Remote sensing 12, no. 21:3575, October 2020 Available:
https://doi.org/10.3390/rs12213575
[2] C. Kendrick, P. Koonce, L. George, “Diurnal and seasonal variations of NO, NO2 and PM2.5
mass as a function of traffic volumes alongside an urban arterial”, ELSVIER - Atmospheric
Environment, Volume 122, December 2015, pp. 133-141 Available:
https://doi.org/10.1016/j.atmosenv.2015.09.019
[3] Satellite data acquired from - https://sentinel.esa.int/web/sentinel/missions/sentinel-5

Mixing ratios and stable isotopes in CO2 and N2O in a coastal station of a western pacific island: quantification of influences from regional and long range transported sources
Abstract
Stable isotope ratios are widely used to understand the sources of greenhouse gases such as CO2 , CH4 and N2O. Here we analysed stable isotope ratios of CO2 and N2O (δ15N and δ18O of N2O and δ13C of CO2) collected at Fugue Cape, a coastal station located at the northern tip of Taiwan during 2018 -2020 to understand the sources of greenhouse gases in the region. Using Hybrid Single-Particle Lagrangian Integrated Trajectory (HYSPLIT) model, we identified the sources of high and low CO2 and N2O in the study region. It is observed that the higher CO2 concentration and relatively lower δ13C values are associated with the wind coming from the eastern industrial belt of China while the air mass originated from the oceanic region has lower CO2 concentration and higher δ13C values. The wind reaching to the study region from the South Pacific Ocean the variation in the concentration and δ15N value of N2O is caused by oceanic upwelling. Again as the wind from the Trajectory is seen coming from the Eastern Chinese industrial belt, it can be inferred that the variation in δ15N of N2O or δ13C of CO2 was caused by the anthropogenic emissions from the belts. The data is taken for a time span of two year (2018 to 2020) and the inference was drawn denoting the variation in the stable isotopes
References:-
Amzad H. Laskar , Jr-Chuan Huang, Shih-Chieh Hsu, Sourendra K. Bhattacharya, Chung-Ho Wang ,Mao-Chang Liang, 2014, Stable isotopic composition of near surface atmospheric water vapour and rain–vapour interaction in Taipei, Taiwan, Journal of Hydrogeology 519 (2014) 2091-2100
Ravi Rangarajan , Amzad H. Laskar , Sourendra K. Bhattacharya , Chuan-Chou Shen ,Mao-Chang Liang, 2017, An insight into the western Pacific wintertime moisture sources using dual water vapour isotopes, Journal of Hydrogeology 547 (2017) 111-123
Sakae Toyoda, Osamu Yoshida, Hiroaki Yamagishi, Ayako Fujii, Naohiro Yoshida & Shuichi Watanabe, 2019, Identifying the origin of nitrous oxide dissolved in deep ocean by concentration and isotopocule analyses, Scientific Reports, 24th May
Amzad H. Laskar, Li-Ching Lin, Xun Jiang, and Mao-Chang Liang, 2018, Distribution of CO2 in Western Pacific, Studied Using Isotope Data Made in Taiwan, OCO-2 Satellite Retrievals, and CarbonTracker Products, Earth and Space Science, 29th November 2018
D. E. Pataki, D. R. Bowling, and J. R. Ehleringer, 2003, Seasonal cycle of carbon dioxide and its isotopic composition in an urban atmosphere: Anthropogenic and biogenic effects,
([email protected]) AMZAD H LASKAR ([email protected])UDDALAK CHAKRABORTY([email protected]), ALOK KUMAR

JOURNAL OF GEOPHYSICAL RESEARCH, VOL. 108, NO. D23, 4735, doi:10.1029/2003JD003865, 2003

Impact of the COVID-19 Lockdown on Air Pollution Levels in Jalandhar, Punjab Mayank Pathak1, Manik Bhandari1, Agrima Shukla2, Rajiv kumar3, Mahesh Patel1, Ravi Pratap
Singh4
1Department of Civil Engineering, Dr. B.R. Ambedkar National Institute of Technology (NIT) Jalandhar,
Punjab, India, [email protected], [email protected], [email protected]
2Department of Chemical Engineering, Dr. B.R. Ambedkar National Institute of Technology (NIT)
Jalandhar, Punjab, India, [email protected]
3Flexible Pavement Division, CSIR-Central Road Research Institute New Delhi, India,
4Department of Industrial and Production Engineering, Dr. B.R. Ambedkar National Institute of
Technology (NIT) Jalandhar, Punjab, India, [email protected]
Abstract
This disease, which was determined to be a new type of corona virus, began to break out in
Wuhan, China in December 2019, and was later called COVID-19. The virus has been spreading
all over the world. Subsequently, the World Health Organization (WHO) declared it an epidemic.
In order to reduce the impact of this virus, almost all countries in the world have closed their
countries and implemented blockades. The closure of the city has had a significant impact on the
degree of environmental pollution, and since there was no human activity in a short period of
time, the quality of air and water has also been improved. The current research scientifically
analyses the available data of Jalandhar major air pollutants, such as PM2.5, NO, NO2, O3 and SO2.
The analysis is based on air quality data before lock-in (February 25th to March 24th, 2020) and
the lock-in month (March 25th to April 24th, 2020). Through this study, it was found that the air
pollution in Jalandhar during the month of closure has been greatly improved.

![*XLGDQFH ,QIRUPDWLRQ RQ 5HTXLUHPHQW IRU )RRG … · wduwud]lqh eulooldqw eoxh )&) (pxovlilhu ru vwdelolvhu (pxovlilhuv dlg wkh irupdwlrq ri glvshuvlrq ri ru pruh lpplvfleoh vxevwdqfhv](https://static.fdocuments.us/doc/165x107/5e58f42c1fc70b088974f898/xlgdqfh-qirupdwlrq-rq-5htxluhphqw-iru-rrg-wduwudlqh-eulooldqw-eoxh-pxovlilhu.jpg)


![Info Edge ppt Q3 19-20 FY(12.02.2020) FINALo ] u 7KLVSUHVHQWDWLRQKDVEHHQSUHSDUHGE\,QIR(GJH ,QGLD /LPLWHG WKH³&RPSDQ\´ VROHO\IRULQIRUPDWLRQSXUSRVHVZLWKRXWDQ\UHJDUGWRDQ\VSHFLILFREMHFWLYHV](https://static.fdocuments.us/doc/165x107/5f28e887630a8a6190546e43/info-edge-ppt-q3-19-20-fy12022020-o-u-7klvsuhvhqwdwlrqkdvehhqsuhsduhgeqirgjh.jpg)