WP InfoVista Backbone Capacity Planning€¦ · data that is used for troubleshooting can be used...
8
An InfoVista White Paper Bringing Science to the Art of Backbone Capacity Planning Implementing a Flow-Based Process to Eliminate Guesswork
-
Upload
duongnguyet -
Category
Documents
-
view
215 -
download
0
Transcript of WP InfoVista Backbone Capacity Planning€¦ · data that is used for troubleshooting can be used...

An InfoVista White Paper
Bringing Science to the Art of Backbone Capacity Planning
Implementing a Flow-Based Process to Eliminate Guesswork

There are two viable approaches: either service providers invest capital in increased capacity in anticipation of the projections and/or they exploit current capacity more astutely to accommodate future growth. Whether a single or combined approach is used, a capacity planning strategy will be required. Given that data and signaling traffic together contribute over 60% of the network delivery costs per subscriber, it is imperative that service providers maximize their investments by intimately understanding traffic patterns and volumes. With most service providers carefully watching their bottom lines, investment in new or additional capacity is more difficult than ever without substantial supporting data. Therefore, service providers must identify the applications, users, plans and data traffic that are driving growth. Capacity planning can provide this supporting data to ensure that expansion plans are addressing future growth requirements on their core networks at the lowest possible impact to their bottom line.
This whitepaper discusses a built-in capability that most service providers can enable for backbone capacity planning as it leverages components and information that are already in place – specifically flow-based analysis.
Copyright 2012 InfoVista S.A. All Rights Reserved
Is Your Network Prepared for Growth?
Bringing Science to the Art of Backbone Capacity Planning
Mobile data traffic growth on service provider networks is exploding. In fact, recent analysis has
shown that global mobile data traffic grew two hundred to three hundred percent in 2011, more than
doubling for the fourth year in a row 1. Beyond 2011, mobile traffic growth shows continuing strength.
Unanticipated traffic growth can also impact existing service-level agreements (SLAs) and customer
quality of experience (QoE). This leaves service providers with a number of factors to consider.
How do they accurately analyze current traffic, extrapolate the capacity needed to ensure SLA
conformance as well as end user QoE, while minimizing the investment required to achieve these
goals?
Global Internet Traffic Growth (Fixed) Global Mobile Data Traffic Growth
1997 178% 2009 140%
1998 124% 2010 159%
1999 128% 2011 133%
2000 195% 2012 (estimate) 110%
2001 133% 2013 (estimate) 90%
2002 103% 2014 (estimate) 78%
Global Mobile Data Growth Today is Similar to Global Internet Growth in the Late 1990s (Source—Cisco VNI Mobile, 2012)
1 Cisco Visual Networking Index: Global Mobile Data Traffic Forecast Update, 2011–2016 Dated: 02/14/2012
Copyright 2012 InfoVista S.A. All Rights Reserved
The Capacity Problem is Not Going Away
Bringing Science to the Art of Backbone Capacity Planning
With exponential growth rates of mobile and business data traffic expected over the next five years, service providers must understand how, when and where traffic flows through their network.
As a network engineer for a service provider, you know that no matter the size of your organization, your network is not a static entity. Rather, it is constantly evolving – new POPs are being added, new services are being offered, new customers with stringent SLA’s are being serviced, smart phones are roaming in and out of the region, you are expanding into new regions and mergers and acquisitions are occurring. All of these changes can contribute to unforeseen traffic loads on the network. Whether owned or leased, it is a perennial struggle for the IP backbone team to ensure that the network will continue to support the growth of the business while also meeting the constantly changing usage, demands and QoE needs of a diverse customer base.
In addition to addressing the capacity demands of your own customers, you also need be concerned with transiting traffic to and from peered networks, which can add another layer of complexity to the management of network capacity.
Historically, service provider engineering staffs have used a manual process to gather and analyze data as part of the capacity planning process. Part of this is due to the fact that capacity planning was viewed as a “nice-to-have” rather than a necessity. With data traffic growing at an ever increasing rate, capacity planning has now become an increasingly important facet of network engineering. Effective capacity planning requires that network engineers be able to:
z Extract, classify and analyze signaling, voice, IT and mobile data traffic
z Quantify the impact of best effort and transit traffic on carrier serviced traffic with distinct quality of service (QoS) and QoE requirements
z Gain an understanding of traffic origination and destination points
z Assess the impact of new services, business customers, cloud, business and mobile applications, hardware (smartphones and tablets), Web and social media on traffic
z Measure the effectiveness of traffic engineering in the converged IP/MPLS core
z Provide metrics that establish a valid backbone performance baseline
Many service providers have been hesitant to enable flow-based measurement in their core networks as the generation of flow information by routers and switches can potentially impact CPU and memory utilization and therefore packet forwarding performance. Some manufacturers have addressed this performance hit by implementing flow measurement in hardware rather than software. Using software-based flow services will have some measurable effect on forwarding and routing performance. To minimize the impact on CPU utilization and consequently the forwarding plane, many of the equipment manufacturers recommend implementing flow sampling when collecting flow data. On the other hand, core routers like the Cisco® ASR and the CRS have NetFlow implemented on a hardware application-specific integrated circuit (ASIC), so they can generate NetFlow records at or near line rate. In addition, because all this occurs in hardware, there is no performance penalty on the CPU of the line card 2.
2 Cisco Technical White Paper: NetFlow Performance Analysis Dated 05/2007
A Better Way: Flow-Based Capacity Planning
Bringing Science to the Art of Backbone Capacity Planning
Currently, most capacity planning efforts are a manual process requiring extensive data gathering. This process requires intimate knowledge of the end-to-end network topology and BGP AS peering with other service providers at Network Access Points or NAPs. Information required for capacity planning is usually extracted from different sources, including:
z SNMP-generated utilization statistics on monitored interfaces
z Operational data from EMS, billing and OSS solutions
z Hardware-based packet capture for protocol information and deep packet inspection
z Configurations of edge routers, core routers for configuration information
z Configurations of GGSNs and mobile backhaul switches
While SNMP data is useful to understand utilization trends and QoS for individual interfaces, it does not provide an understanding of the site-to-site traffic matrix. In this key area, SNMP-based capacity planning is insufficient. In addition, correlation and analysis of data from different sources can be difficult and might result in subtle but important indicators becoming lost in a sea of information. For example, the amount of transit traffic across the backbone or data that shows VoIP traffic is impacting an SLA. Any of the aforementioned indicators that are missed could result in an inability of the network to support the roll-out of a new data plan, an opportunity to improve SLA compliance with enterprise customers or the revision of routing parameters to reduce the impact of peering transit traffic on the backbone. It would be very difficult to accomplish these and other goals without the deep knowledge available through flow-based analysis.
Why use flow-enabled capacity planning? Since it is already implemented in most backbone routers, the upfront investment of flow-enabled capacity planning is minimal as compared to using network probes for DPI. Network probes are expensive and limited in their capability to handle large amount of traffic. Using flow data, it is possible to gather information about any traffic that flows through the entire network. For example, using the information provided by flow data, the IP backbone team can now answer the following questions:
z How much traffic of a given service (voice, GPRS, corporate or ToS) is transferred between two sites?
z Which protocols or services are using the most bandwidth?
z Is VoIP traffic impacting traffic with specific QoS or QoE requirements?
z When are peak mobile data traffic volumes occurring? Mornings, after school or after dinner?
z What is the average traffic volume for the past week, month or year?
z What percentage of total backbone traffic is peer-to-peer transit?
z How much traffic is there between two remote GGSNs?
z How much traffic is there between GGSN1 and the Internet?
z How much traffic is generated between two customer and two corporate sites?
Copyright 2012 InfoVista S.A. All Rights Reserved
Copyright 2012 InfoVista S.A. All Rights Reserved
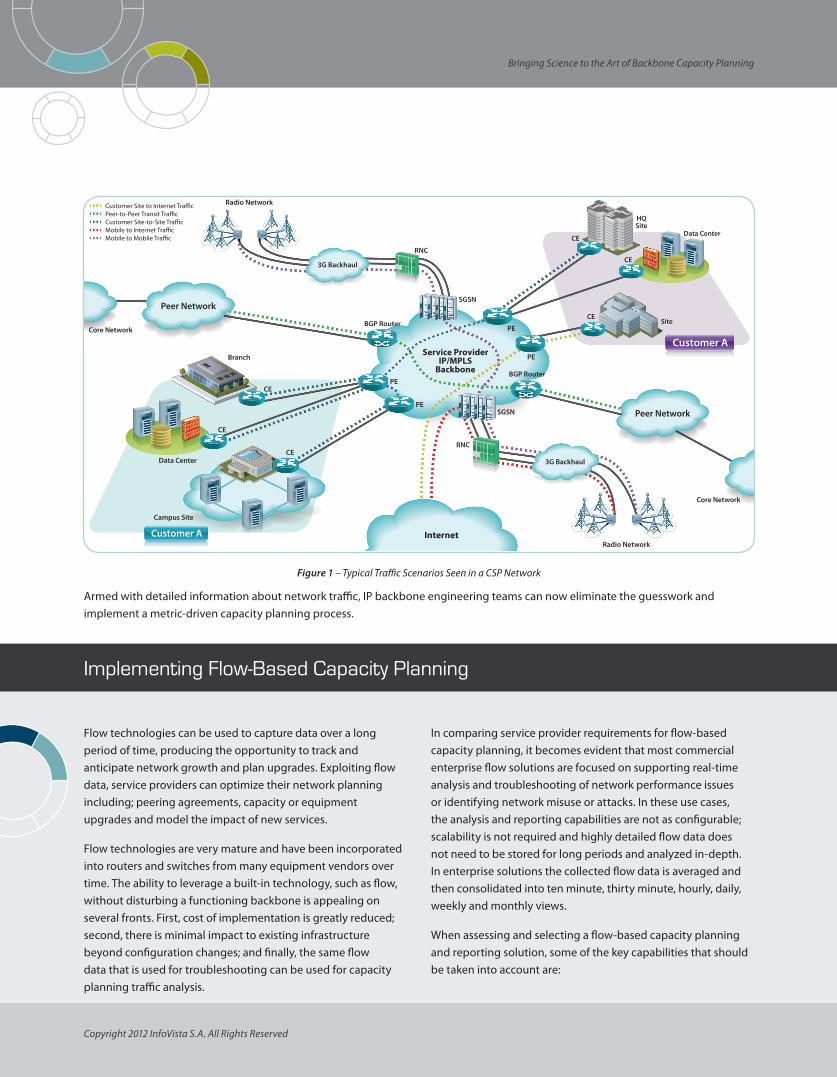
Armed with detailed information about network traffic, IP backbone engineering teams can now eliminate the guesswork and implement a metric-driven capacity planning process.
Bringing Science to the Art of Backbone Capacity Planning
Figure 1 – Typical Traffic Scenarios Seen in a CSP Network
Flow technologies can be used to capture data over a long period of time, producing the opportunity to track and anticipate network growth and plan upgrades. Exploiting flow data, service providers can optimize their network planning including; peering agreements, capacity or equipment upgrades and model the impact of new services.
Flow technologies are very mature and have been incorporated into routers and switches from many equipment vendors over time. The ability to leverage a built-in technology, such as flow, without disturbing a functioning backbone is appealing on several fronts. First, cost of implementation is greatly reduced; second, there is minimal impact to existing infrastructure beyond configuration changes; and finally, the same flow data that is used for troubleshooting can be used for capacity planning traffic analysis.
In comparing service provider requirements for flow-based capacity planning, it becomes evident that most commercial enterprise flow solutions are focused on supporting real-time analysis and troubleshooting of network performance issues or identifying network misuse or attacks. In these use cases, the analysis and reporting capabilities are not as configurable; scalability is not required and highly detailed flow data does not need to be stored for long periods and analyzed in-depth. In enterprise solutions the collected flow data is averaged and then consolidated into ten minute, thirty minute, hourly, daily, weekly and monthly views.
When assessing and selecting a flow-based capacity planning and reporting solution, some of the key capabilities that should be taken into account are:
Implementing Flow-Based Capacity Planning
Service ProviderIP/MPLS
Backbone
Data Center
Branch
CE
CEPE
PE
PE
Campus Site
Radio Network
SGSN
3G Backhaul
RNCCE
PE
Radio Network
SGSN
3G Backhaul
BGP Router
RNC
BGP Router
Internet
Peer Network
Peer Network
Core Network
Core Network
SiteCE
HQSite
CEData Center
CE
Customer A
Customer A
Customer Site to Internet Tra�cPeer-to-Peer Transit Tra�cCustomer Site-to-Site Tra�cMobile to Internet Tra�cMobile to Mobile Tra�c
Copyright 2012 InfoVista S.A. All Rights Reserved
Bringing Science to the Art of Backbone Capacity Planning
Capacity Planning Analysis and Reporting: z Service Modeling – The solution needs to be able to allow
classifi cation and grouping of applications per service, as diff erent customers and regions could have diff erent classifi cation requirements.
z Multi-dimensional Analysis – While standard OOB reports are essential for any capacity planning solution, it is critical that these solutions allow users to view the data from any given dimension. For example, if the solution does not allow users to view reports by country, region or offi ce, chances are that a critical aspect of the data is likely to be missed.
z Data Mining Capability – The solution needs to be able to mine the large amount of fl ow data that will be created by a service provider network, and therefore needs to use technology such as OLAP, which is well known for its ability to allow mining of large data sets.
z Customizable Reporting – As a necessary adjunct to multi-dimensional analysis, the solution needs to allow the user to visualize the data in any format. For example, when looking at site-to-site reports, it is important to have matrix reports.
z Dedicated Capacity Planning Solution – Many commercial tools provide adequate reporting and analysis capabilities for troubleshooting and security use cases. However, capacity planning requires a dedicated set of reports and views that can be used out of the box or customized.
z Comprehensive Coverage – The solution needs to provide reporting capabilities that include both executive level reports as well as detailed fl ow-by-fl ow reports across all dimensions.
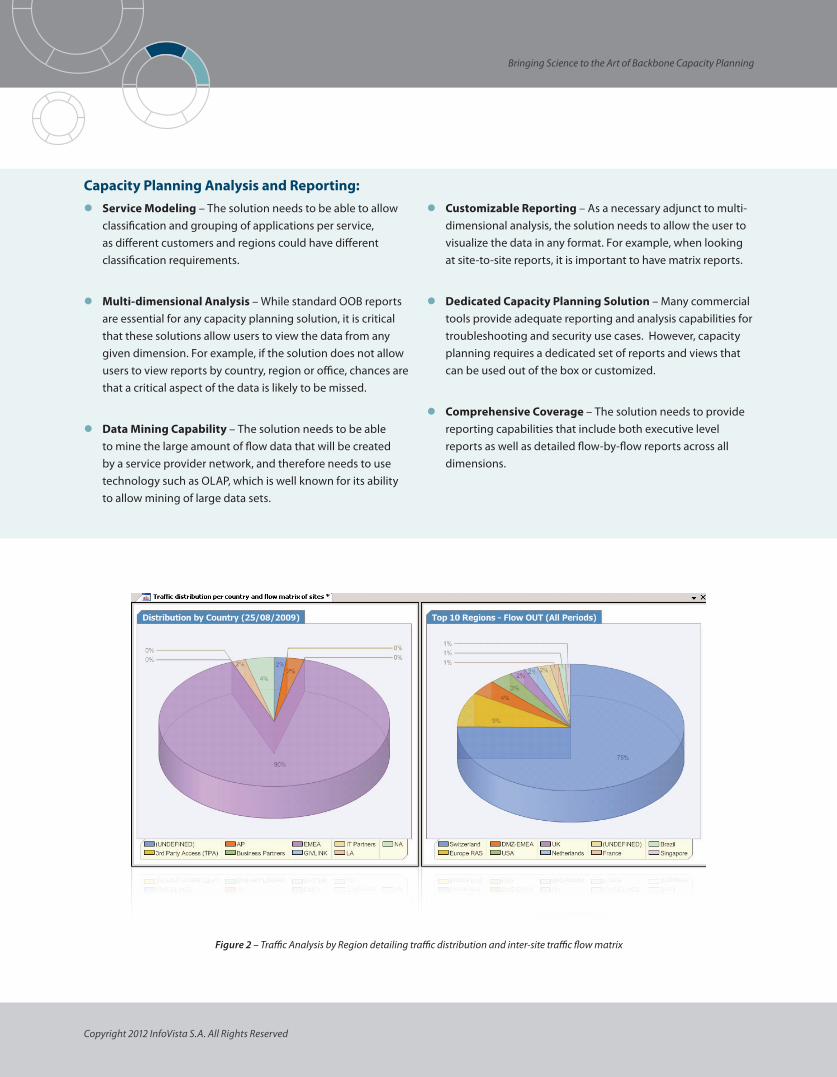
Figure 2 – Traffi c Analysis by Region detailing traffi c distribution and inter-site traffi c fl ow matrix
Copyright 2012 InfoVista S.A. All Rights Reserved
Bringing Science to the Art of Backbone Capacity Planning
Flow Collection and Processing: z Intelligent Processing – Flow technology is unidirectional.
The solution needs to be able to intelligently assemble the multiple fl ows that make up an IP conversation, a process called fl ow-stitching, and identify the end-points involved in the conversation using the fl ow data.
z De-duplication – Due to the nature of fl ow technology, it is true that in some cases, it is impossible to avoid getting data for the same fl ow from multiple sources. To ensure the accuracy of the data, it is critical that the solution provides de-duplication of fl ow data across probes.
z Optimized Storage – To provide the most accurate long term data and forecasting, the solution should be able to store terabytes of fl ow data in a compact and optimized form.
z Data Granularity – In many cases, temporal roll ups tend to dilute the accuracy of the data. Moreover, for CSPs, it is critical to take time zones into consideration, so that data can be segmented and viewed as appropriate to each time zone. To enable this, and to have access to the information from every fl ow, the solution must maintain 15 minute data.
z Multi-Vendor – Networks are heterogeneous, so the solution needs to support diff erent fl ow technologies such as NetFlow v5-v9, cFlow, jFlow, sFlow and IPFIX.
z Scalability – To handle fl ow data from a tier 1 service provider network, the solution needs to be able to process a high number of fl ows per second.
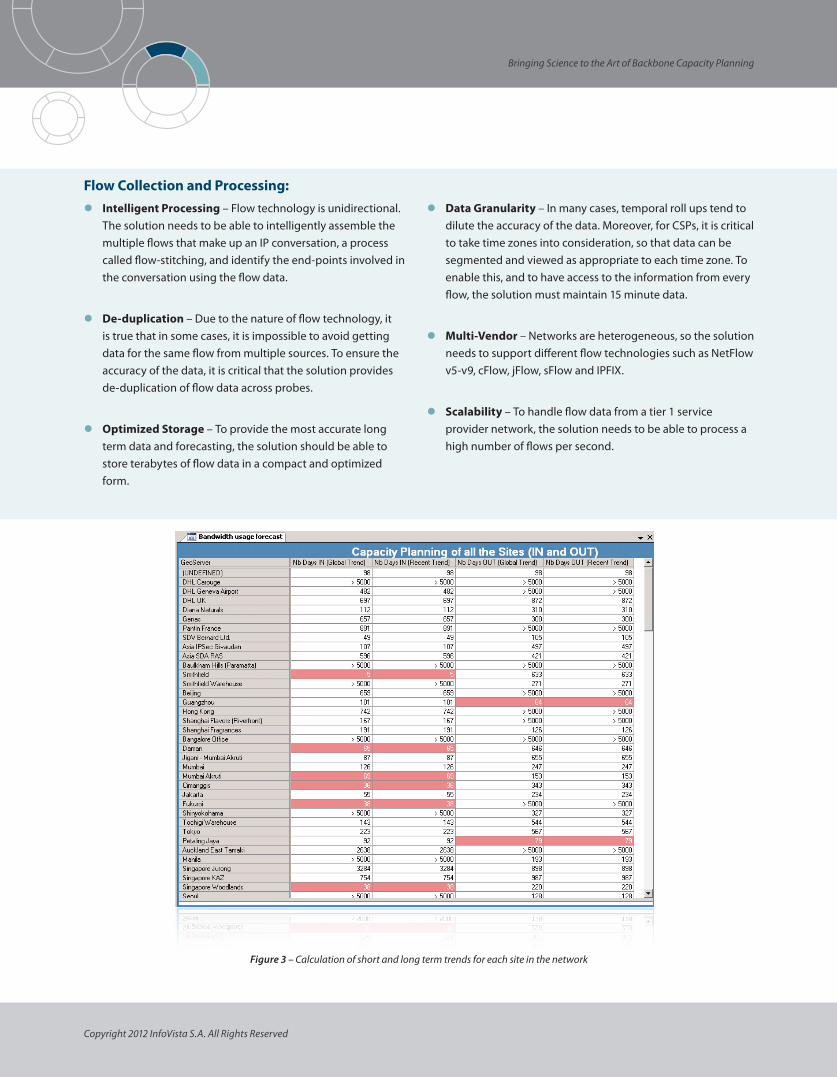
Figure 3 – Calculation of short and long term trends for each site in the network
About InfoVistaInfoVista is the leading provider of service performance assurance software solutions for IP-based network and application services. We empower communication service providers and large IT enterprise organizations to transform their IT infrastructure into a distinctive asset for revenue generation, customer loyalty and business agility by adopting a quality centric approach to expedite the launch of differentiated and performing services ahead of the competition. InfoVista’s unified network and application performance management platform equips 80% of the world’s largest operators and a roster of global enterprises. Our solutions provide them with the actionable visibility they need to ensure a high-quality user experience end-to-end, by effectively assuring the performance and quality of their converged network and IT services, while keeping operational costs as low as possible. InfoVista can be found online at www.infovista.com.
For backbone capacity planning to be successful, service providers need the ability to slice and dice network traffic data in multiple dimensions and levels. They must be able to easily visualize trends, track service delivery and identify where potential issues may occur as new capabilities, devices, customers and plans are added to the their product portfolio.
A backbone engineer running a capacity planning exercise has to be able to isolate specific traffic down to the protocol, source or destination, user, application (IM, GPRS, HTTP or video, etc.), BGP AS peering information and transiting traffic to understand where potential issues may arise.
Key benefits that flow-based analysis provides for capacity planning for backbone IP networks include:
Summary
Bringing Science to the Art of Backbone Capacity Planning
World and European Headquarters InfoVista S.A. 6, rue de la Terre de Feu 91952 Courtaboeuf Cedex Les Ulis, France Tel +33 (0) 1 64 86 79 00 Fax +33 (0) 1 64 86 79 79
Americas Headquarters InfoVista Corporation 12950 Worldgate Drive Suite 250 Herndon, VA 20170 United States Tel +1 703 435 2435 Fax +1 703 435 5122
Asia-Pacific Headquarters InfoVista (Asia-Pacific) Pte Ltd Block 750C, #03-16/17 Chai Chee Road TechnoPark @ Chai Chee Singapore 469003 Tel +65 6449 7641 Fax +65 6449 3054
For more information, please visit www.infovista.com For sales inquiries please email: [email protected]
Copyright 2012 InfoVista S.A. All rights reserved.
Increased Visibility z Establish which sources, destinations,
devices, customers, applications, protocols, service plans and peering agreements are generating traffic
z Understand the impact of all traffic on bandwidth, SLAs, QoE and QoS and priority
z Identify the demands of individual devices and the effect of changes on the infrastructure
Improved Service Availability z Accurately assess the impact of new
services and plans on the backbone with service modeling and what-if analysis
z Measure and analyze backbone metrics to establish a baseline and traffic flow patterns
z Prevent performance issues and service degradation through proactive trend analysis
Enhanced Operational Efficiency z Spend less time gathering data and
more time on regular measurement and analysis
z Identify where saturation of specific links or regions could occur as the network is in a constant state of flux and evolution
z Make incremental adjustments to capacity over time to improve resource management
Armed with the information provided by a flow-based capacity planning solution, service providers can quickly identify tactical issues and address them before customers are impacted. Modeling the impact of new services on available bandwidth before they are deployed, service providers can decrease risk, increase revenue potential and ensure that problematic issues are addressed before rollout. All strategic investments in infrastructure can be supported by factual data rather than educated guesses.


![28121-Ds Infovista Mentum Planet[1]](https://static.fdocuments.us/doc/165x107/55cf85d3550346484b91bbbd/28121-ds-infovista-mentum-planet1.jpg)