WP 2009-16 April 2009 - ageconsearch.umn.eduageconsearch.umn.edu/bitstream/51143/2/WP...
26
WP 2009-16 April 2009 Working Paper Department of Applied Economics and Management Cornell University, Ithaca, New York 14853-7801 USA Detecting Technological Heterogeneity in New York Dairy Farms Julio del Corral, Antonio Alvarez and Loren Tauer
Transcript of WP 2009-16 April 2009 - ageconsearch.umn.eduageconsearch.umn.edu/bitstream/51143/2/WP...

WP 2009-16 April 2009
Working Paper Department of Applied Economics and Management Cornell University, Ithaca, New York 14853-7801 USA
Detecting Technological Heterogeneity in New York Dairy Farms
Julio del Corral, Antonio Alvarez and Loren Tauer

It is the policy of Cornell University actively to support equality of educational
and employment opportunity. No person shall be denied admission to any
educational program or activity or be denied employment on the basis of any
legally prohibited discrimination involving, but not limited to, such factors as
race, color, creed, religion, national or ethnic origin, sex, age or handicap.
The University is committed to the maintenance of affirmative action
programs which will assure the continuation of such equality of opportunity.

Detecting Technological Heterogeneity in New York Dairy Farms
Julio del Corral PhD candidate
Department of Economics University of Oviedo
Oviedo, Spain
Antonio Alvarez Professor
Department of Economics University of Oviedo
Oviedo, Spain
Loren Tauer Professor
Department of Applied Economics and Management Cornell University Ithaca, New York
Selected paper prepared for presentation at the Agricultural and Applied Economics
Association Annual Meeting, Milwaukee, Wisconsin, July 26-28, 2009
This is also a Department of Applied Economics and Management, Cornell University Working Paper No. wp0916.
Abstract
Agricultural studies have often differentiated and estimated different technologies within a sample of farms. The common approach is to use observable farm characteristics to split the sample into several groups and subsequently estimate different functions for each group. Alternatively, unique technologies can be determined by econometric procedures such as latent class models. This paper compares the results of a latent class model with the use of a priori information to split the sample using dairy farm data in the application. Latent class separation appears to be a superior method of separating heterogeneous technologies. Keywords: parlor milking system, stanchion milking system, latent class model, stochastic frontier _______________________ Copyright 2009 by Julio del Corral, Antonio Alvarez, and Loren Tauer. All rights reserved. Readers may make verbatim copies of this document for non-commercial purposes by any means, provided that this copyright notice appears on all such copies.
1

Introduction
The issue of technological heterogeneity is of enormous relevance in studies of
agricultural production since the agricultural sector is characterized by the presence of
different technologies. For this reason, studies that use agricultural micro data often
control for the possibility of technological heterogeneity. This has been traditionally done
by selecting one main characteristic of the production process and dividing the sample
based on this characteristic and subsequently estimating a different function for each
group. Some of the characteristics that have been used in agricultural studies are: type of
seed (Xiaosong and Scott); variety (Balcombe et al.); land type (Fuwa, Edmonds and
Banik); or full-time versus part-time farms (Bagi).
Technological heterogeneity is also present in dairy farming where different
production systems may be utilized. In empirical analysis this poses the problem of
correctly identifying the groups of farms that operate under different technologies. As
stated above, a common way to tackle this problem is to use observable farm
characteristics to separate the sample into several groups and subsequently estimate a
different function for each group. This approach has been used in previous dairy farm
studies. For example, Hoch split a sample of Minnesota dairy farms into two groups
based on location; Bravo-Ureta classified a sample of New England dairy farms based on
the breed of the herd; Tauer (1998) estimated different cost curves for stanchion and
parlor dairy farms; and Newman and Mathews estimated different output distance
functions for specialist and non-specialist dairy farms.
However, the use of a single characteristic is probably an incomplete proxy for
the characterization of a technology. The characteristics outlined above may not exhaust
2

all technology differences that exist between farms. Feeding system usually varies across
farms and may be an important descriptor of the technology. Additionally, there are
unobserved (not measured) factors that may affect technologies. For example, one of
these unobserved factors can be the genetic potential of the herds.
Alternatively, different technologies within a sample can be determined by
statistical procedures. For example, groups of farms can be formed using cluster
algorithms (Alvarez et al.). Econometric techniques, such as random coefficient models
(Hildreth and Houck) and latent class models, (Lazarsfeld) can also be used to estimate
different technologies within a sample. Random coefficient models assume that each
observation is derived from a unique technology, and thus farm-specific coefficients are
estimated. In contrast, latent class models, often referred to as mixture models, assume
there are a finite number of groups underlying the data and estimate a different function
for each of these groups. Since we believe that a discrete number of farm groups better
describes the dairy sector we will elect to utilize latent class models.
The purpose of this paper is to compare the results of latent class models with the
use of a priori information to split the sample. For a sample of New York dairy farms we
use two milking systems, namely, stanchion and parlor, as the observed characteristic that
will allow us to split the data. Stanchion farms use conventional stall housing for dairy
cows, where cows are milked and often housed in individual stalls with the farmer
moving from stall to stall in a stooped position to milk the cows, while in parlor farms
cows enter a raised platform for milking and leave once they are milked. These are
distinct milking systems, and it would be expected that production characteristics would
3

differ between these two systems as measured by output elasticities, returns to scale,
input substitutability and efficiency.1
Our basic model is a production function that we implement in the framework of a
stochastic frontier model (Aigner, Lovell and Schmidt). Stochastic frontiers are widely
used to estimate production functions where individual observations are constrained to be
below the stochastic frontier (with sampling error). Several authors have estimated latent
class models in a stochastic frontier framework (e.g., Orea and Kumbhakar; Greene,
2005). Comparison between the stochastic frontiers of the two milking systems and a
stochastic frontier latent class model allows us to determine whether the milking system
is a relevant factor in determining technology class.
The remainder of this paper is organized as follows. The following section
presents the data used. Next, the methodology is explained. This is followed by the
empirical model and results. Finally, the paper ends with concluding remarks.
Data
The data used in this study were taken from the annual New York State Dairy
Farms Business Summary (NYDFBS), which are farm level data collected on a voluntary
basis from 1993 through 2004 (Knoblauch, Putnam and Karszes). The sample of 817
unique farms does not necessarily represent the population of New York dairy farms2.
The number of farms participating varies each year, producing an unbalanced panel data
set of 3,304 observations.
In order to estimate the production function we specify one output and six inputs.
We specify only one output since these farms are highly specialized in milk production;
4

milk must constitute at least 85 percent of the revenue for a farm to be included in the
data set, and much of the remaining revenue are cull cow sales, a necessary by-product of
dairy production (Knoblauch, Putnam and Karszes). None-the-less miscellaneous items
are sold from these farms and these items require inputs to produce. Therefore, we add all
non-milk output items to our single output by converting each item into equivalent
pounds of milk by dividing revenue by the price of milk. The inputs are COWS (average
number of cows), FEED (accrual purchased feed measured in US $3), CAPITAL (service
flow from land and buildings estimated as five percent of market value plus accrual
machinery hire expenses, accrual machinery repair expenses and machinery
depreciation), LABOR (total worker equivalents used on the farm), CROP (fertilizer,
seeds, spray and fuel accrual expenses) and OTHER (veterinary and medications,
breeding, electricity and milk marketing accrual expenses). Table 1 displays the
descriptive statistics of these variables, the single input productivity measures of milk
production per cow, milk per acre and cows per acre of cropland as well as a dummy
variable named DPARLOR that takes the value of one if the farm uses a parlor milking
system and 0 if the farm uses a stanchion system.
5

Table 1. Summary statistics on New York Dairy Farm Business Summary data (1993-2004)
Mean Standard Deviation Minimum Maximum
Milk (lbs.) 4,270,430 5,650,650 173,868 44,407,600 OUTPUT (lbs. equiv.) 4,911,670 6,484,540 194,779 53,100,000 COWS (number) 203 242 19 2,172 FEED (U.S. $) 157,487 228,524 3,061 2,483,210 CAPITAL (U.S. $) 94,353 113,827 5,197 969,906 LABOR (annual workers) 5.25 4.82 0.73 36.14 CROP (U.S. $) 40,375 53,135 365.672 596,442 OTHER (U.S. $) 62,239 83,451 2,011 672,933 Milk per cow (lbs.) 19,203 3,560 5,796 28,895 Milk per acre (lbs.) 7,179 8,849 700.608 269,578 Cows per acre 0.36 0.41 0.07 13.17 DPARLOR 0.57 0.50 0.00 1.00 Number of observations 3,304
Methodology
We use the stochastic frontier approach which came into prominence in the late
1970s as a result of the work of Aigner, Lovell and Schmidt.4 A stochastic frontier
production function may be written as:
( )εexp)( ⋅= xfy ; uv −=ε ( 1 )
where y represents the output of each farm, x is a vector of inputs, f(x) represents the
technology, and ε is a composed error term. The component v captures statistical noise
and is assumed to follow a normal distribution centered at zero, while u is a non-negative
term that reflects the distance between the observation and the frontier (i.e., technical
inefficiency) and is assumed to follow a one-sided distribution (half-normal in our case).
These models are usually estimated using maximum likelihood techniques.
6

We estimate two different stochastic frontier models. First we estimate a model
for both the parlor and stanchion farms that uses the Battese and Coelli (1992)
specification of the inefficiency term:
;)(ln ititit xfy ε+= ititit uv −=ε ( ) iit uTu ⋅−−= )(exp τη ( 2 )
where subscript i denotes farm, t indicates time, τ is the actual period, T is the total
number of periods in the sample and η is a parameter to be estimated. If η is positive
(negative) implies that efficiency increases (decreases) over time.
Our second model is a stochastic frontier latent class model (Greene, 2005), which
is specified as:
;)(lnjitjitit xfy ε+= ;
jitjitjit uv −=ε ( )jijjit uTu ⋅−−= )(exp τη ( 3 )
where j represents the different classes (groups). The vertical bar means that there is a
different model for each class j. It is important to note that the model assumes that each
farm belongs to the same group over the sample period. The likelihood function (LF) for
each farm i at time t for group j is (Greene, 2005):
( ) ( )( ) ⎟
⎟⎠
⎞⎜⎜⎝
⎛⋅⋅
Φ
⋅Φ==
j
jit
j
jjitjjjjititijt xyfLF
σ
εφ
σ
σελλσβ 1
0
/,,, ( 4 )
where itjitjit xy βε ′−= ln , [ ] 2122
vjujj σσσ += , vjujj σσλ = , and φ and Φ denote the
standard normal density and cumulative distribution function respectively.
The likelihood function for farm i in group j is obtained as the product of the
likelihood functions in each period.
7
∏=
=T
tijtij LFLF
1
( 5 )
The likelihood function for each farm is obtained as a weighted average of its
likelihood function for each group j, using as weights the prior probabilities of class j
membership. The prior probabilities of class membership can be sharpened using
separating variables but as Orea and Kumbhakar stated, a latent class model classifies the
sample into several groups even when sample-separating information is not available. In
this case, the latent class structure uses the goodness of fit of each estimated frontier as
additional information to identify groups.
∑=
=J
jijiji LFPLF
1 ( 6 )
The overall log-likelihood function is obtained as the sum of the individual log-
likelihood functions:
∑ ∑ ∏∑= = ==
==N
i
J
j
T
tijtij
N
ii LFPLFLF
1 1 11logloglog ( 7 )
The log-likelihood function can be maximized with respect to the parameter set
θj=(βj, σj, λj, δj, ηj) using conventional optimization methods (Greene, 2005). Furthermore,
the estimated parameters can be used to estimate the posterior probabilities of class
membership using Bayes Theorem:
∑=
= J
jijij
ijij
LFP
LFPijP
1
)/( ( 8 )
8

Empirical model and results
The empirical specification of the production function is translog. The dependent
variable is milk production plus other revenue converted into equivalent pounds of milk.
Six inputs are defined in the Data section and include: COWS (cows), FEED (purchased
feed), CAPITAL (capital flow), LABOR (total workers), CROP (crop expenses) and
OTHER (veterinary and medications, breeding, electricity and milk marketing expenses).
The input variables were divided by their geometric means so that the estimated first
order coefficients from the translog can be interpreted as the production elasticities
evaluated at the sample geometric means. Additionally, a time trend plus a squared time
trend are introduced to account for technological and other changes. In order to control
for different regional conditions we use a set of dummy variables (DSOUTH,
DNORTHWEST, DEAST and DNORTHEAST)5. The omitted category is the Northeast.
Finally, we control for Bovine Somatotropin (bST) usage by means of three dummy
variables. BST1 takes the value of one if 25 percent or fewer of the cows were treated
with bST sometime during their lactation; BST2 takes the value of one if between 25 to
75 percent of the cows were treated with bST; and BST3 takes the value of one if over 75
percent of the cows in the herd were treated. The reference then is for farms not using
bST during the year.
The production functions to be estimated for parlor and stanchion farms are:
( ) )(exp ;
lnln21lnln
3
1
3
1
2
1 1 10
iititit
h
hhith
z
zziz
ttt
L
l
L
l
L
kkitlitlklitlit
uTuuvDBSTDLOC
ttxxxy
⋅−⋅−=−+⋅+⋅
+⋅+⋅+++=
∑∑
∑ ∑∑=
=
=
=
= = =
τηαγ
λλβββ ( 9 )
where t is a time trend, and DLOC are the regional dummies.
9

The equation of the latent class model is then represented as:
( ) )(exp ;
lnln21lnln
3
1
3
1
2
1 1 10
jijjitjitjit
h
hhitjh
z
zzijz
jttjt
L
l
L
lkitlit
L
kjlklitjljit
uTuuvDBSTDLOC
ttxxxy
⋅−−=−+++
⋅+⋅+++=
∑∑
∑ ∑∑=
=
=
=
= = =
τηαγ
λλβββ (10)
In the latent class model the researcher specifies the number of groups a priori
since the number of groups is not a parameter to be estimated. To choose the number of
groups, Information Criteria such as AIC and SBIC are typically used6 (e.g., Orea and
Kumbhakar). Using these criteria, the model with two groups is the preferred one for
these data.
Table 2 reports the estimation results of equations 9 and 10.7 All the first order
coefficients are positive and significant in all models. As expected, the Bovine
Somatotropin dummies indicate that a higher use of this growth hormone increases
production ceteris paribus. Moreover, farms located in the East are the least productive
farms, with the farms in the Northeast the most productive. The Northeast, often referred
to as the North Country, is primarily a dairy region with few other commodities
produced. Dairy farms have a comparative advantage in this region. The soils are
generally poorer quality than in the valley regions of the other regions, and the growing
season is shorter. Yet, farmers in the Northeast are able to obtain good feed rations using
produced forage augmented with grain purchases. The South and East regions consist of
hill and valley farms, with many of the hill farms disappearing, since those are situated
on poorer soils. In contrast the Northwest generally has the most consistent good quality
soils and is the region where many of the larger farms have developed. The Northwest is
the second most productive region after the Northeast.
10

Table 2. Stochastic frontier translog production function estímates
Milking system Latent class model Parlor Stanchion Group 1 Group 2 CONSTANT 15.506*** 14.191*** 14.895*** 14.954*** COWS 0.643*** 0.621*** 0.763*** 0.398*** FEED 0.126*** 0.126*** 0.065*** 0.209*** CAPITAL 0.050*** 0.057*** 0.026*** 0.074*** LABOR 0.087*** 0.054*** 0.071*** 0.085*** CROP 0.021*** 0.036*** 0.028*** 0.040*** OTHER 0.145*** 0.196*** 0.103*** 0.306*** 0.5· COWS· COWS -0.353*** -0.134 -0.291*** 0.065 0.5· FEED· FEED 0.034* 0.067** -0.055* 0.183*** 0.5· CAPITAL· CAPITAL -0.031 0.001 -0.062*** 0.057 0.5· LABOR· LABOR -0.205*** -0.020 -0.093** 0.024 0.5· CROP· CROP -0.015 0.029 0.008 0.017 0.5· OTHER· OTHER 0.039 0.097*** -0.017 0.298*** COWS· FEED 0.097*** -0.008 0.090** -0.026 COWS· CAPITAL 0.056* 0.105** 0.091*** 0.032 COWS· LABOR 0.230*** -0.021 0.085** 0.095 COWS· CROP -0.006 0.005 0.095*** -0.037 COWS· OTHER 0.001 0.008 -0.060** -0.118* FEED· CAPITAL -0.045** -0.043** -0.022 -0.040* FEED· LABOR -0.082*** 0.040 -0.004 -0.003 FEED· CROP 0.005 -0.035* -0.059*** -0.013 FEED· OTHER -0.023 -0.042 0.074*** -0.126*** CAPITAL· LABOR -0.015 -0.056** -0.029 -0.035 CAPITAL· CROP 0.011 -0.039** 0.003 -0.031 CAPITAL· OTHER 0.006 -0.011 0.009 -0.017 LABOR· CROP 0.047** 0.043* -0.010 0.085*** LABOR· OTHER -0.009 -0.050 0.010 -0.101** CROP· OTHER -0.025 -0.007 -0.033** 0.008 TIME TREND -0.001 -0.005* 0.007*** -0.020*** SQUARED TIME TREND -0.001*** 0.000** -0.001*** 0.000 DSOUTH -0.085*** -0.016 -0.028*** -0.084*** DNORTHWEST -0.075*** 0.024 -0.026*** 0.009 DEAST -0.091*** -0.042*** -0.057*** -0.064*** DBST1: Less than 25% 0.015** 0.033*** 0.024*** 0.009 DBST2: 25-75% 0.061*** 0.044*** 0.051*** 0.063*** DBST3: Higher than 75% 0.088*** 0.060*** 0.068*** 0.125*** η -0.019*** -0.026*** -0.019*** -0.005 σ = [σv
2 + σu2]1/2 0.169*** 0.239*** 0.910*** 0.843***
λ = σu / σv 2.802*** 3.746*** 0.028 0.034 Observations 1,886 1,418 3,304 Log. LF 2,189 1,409 3,724 Note: *,**,*** indicate significance at the 10%, 5% and 1% levels, respectively.
11

Table 3 shows the averages of some representative variables for the two groups
obtained in the latent class model as well as for both milking systems. There are large
differences between parlor and stanchion farms and between the two groups identified in
the latent class model, labeled ‘group 1’ and ‘group 2’. In particular, parlor farms and
group 1 farms are larger in size and have higher input average productivities than
stanchion farms and group 2 farms respectively. On the other hand, group 1 of the latent
class model is formed mainly by parlor farms, while in group 2 there are relatively more
stanchion farms than parlor farms. Yet, there are significant differences among those
groups (i.e., parlor vs. group 1 and stanchion vs. group 2) especially in size. Therefore,
although parlor and stanchion milking appear to differentiate our sample into unique
technologies, other characteristics than simply the milking system appears important to
differentiate the sample farms. A closer investigation of the estimated results of the
production functions may provide insights.
Table 3. Characteristics of dairy farm production systems (sample averages)
Milking system Latent class model Parlor Stanchion Group 1 Group 2 Number of observations 1,886 1,418 2,307 997 DPARLOR 1 0 0.60 0.50 Milk (lbs.) 6,492,910 1,314,450 5,140,050 2,258,190Cows 301 73 238 123 Labor (annual workers) 7.21 2.64 5.96 3.62 Land (acres) 729 307 598 434 Yield per cow (lbs.) 20,308 17,734 20,181 16,940 Milk per acre (lbs.) 8,713 5,137 8,107 5,031 Milk per worker (lbs.) 808,569 505,947 728,057 564,460 Purchased feed ($) per cow 739 613 710 627 Cows per acre 0.42 0.28 0.39 0.29 Technical efficiency 0.89 0.85 0.89 0.88
12

Output elasticities from parlor and stanchion farms are very similar. The null
hypothesis that both milking systems are characterized by the same output elasticities at
the sample means was tested using a t-test for each input and it was rejected only for
OTHER at the 99% confidence level and for LABOR at the 95% confidence level.
LABOR is much more productive on the parlor milking farms as shown later in Figure 2.
On the other hand, the estimation of the latent class model found two technologies
that seem very different from each other. In this case the tests of equal output elasticities
between groups indicate that the output elasticities are different for COWS, FEED,
CAPITAL and OTHER, but not LABOR. It appears that the latent models are
differentiating based upon minute technology differences which may include cow
genetics, feeding system, amount of capital utilized (including parlors), and
miscellaneous inputs.
Marginal products of the inputs can be calculated as:
it
itlitl x
yMP
⋅=ε
(11)
where εl is the weighted averaged of the output elasticity using as weights the posterior
probabilities in the latent class model and the output elasticity in the geometric means in
the milking system estimates. Figure 1 shows the kernel distributions of the marginal
products for all groups. These distributions show that for most inputs the distribution of
the marginal products of the stanchion and parlor farms are rather similar except for
labor, but that the distribution of the marginal products of the latent class models groups
are clearly differentiated for all inputs except labor. Especially telling is the marginal
product of the cow input, which is measured simply as the number of cows. Cows are
13

slightly more productive in parlor farms than in stanchion farms, but the differential is
most striking between the latent groups, with the MP of latent group 2 being much lower.
Apparently, farms with low producing cows, due to inferior genetics, disease, poor
feeding and other poor management practices are being differentiated from farms with
higher productive cows. Milk per cow has always been a bellwether indicator of good
management. Size may simply be associated with management.
In contrast, the MP of purchased feed which is measured in dollars of
expenditures is much higher in latent group 2 compared to latent group 1, possibly
reflecting the fact that the farms in latent group 2 are not using enough feed, since they
use on average only $627 per cow compared to $710 for latent group 1. With capital,
although the distribution of MPs of parlor and stanchion are essentially identical, the MP
of latent group 1 is much lower than latent group 2. Yet, as indicated earlier, the MP of
labor is almost identical between the two latent groups, which is not the case for parlors
and stanchions, with the MP of labor in stanchion farms being much lower. With the crop
input, it appears that stanchion farms are similar to latent group 2, while parlor farms are
similar to latent group 1.
14

Den
sity
2500 5000 7500 10000 12500 15000 17500 20000Lbs.
StanchionParlorLCM1LCM2
Kernel of the COWS marginal productD
ensi
ty
0 5 10 15 20Lbs.
StanchionParlorLCM1LCM2
Kernel of the FEED marginal product
15

Den
sity
0 2 4 6 8Lbs.
StanchionParlorLCM1LCM2
Kernel of the CAPITAL marginal productD
ensi
ty
0 40000 80000 120000 160000Lbs.
StanchionParlorLCM1LCM2
Kernel of the LABOR marginal product
16

Den
sity
0 5 10 15 20Lbs.
StanchionParlorLCM1LCM2
Kernel of the CROP marginal productD
ensi
ty
0 10 20 30 40Lbs.
StanchionParlorLCM1LCM2
Kernel of the OTHER marginal product
Figure 1. Kernel distributions of the marginal products for all groups
17

Differences in Technical Efficiency
Technical efficiency (TE) reflects the ability of a farm to produce the maximum
level of output from a given set of inputs. A technical efficiency index can be calculated
using the following expression (the dependent variable must be in natural logs):
)ˆexp( uTE −= ( 12 )
where the inefficiency term, u, is separated from the other error component using the
formula developed by Jondrow et al.
Stanchion farms are less efficient on average than parlor farms. Although these
stanchion barns are functionally operational, many are obsolete. Stanchion milking is
labor intensive, and physically demanding. These milking systems also generally lack the
monitoring equipment found in most parlors. The parameter η is negative and statistically
significant for stanchion farms and group1 from the latent class model, implying that
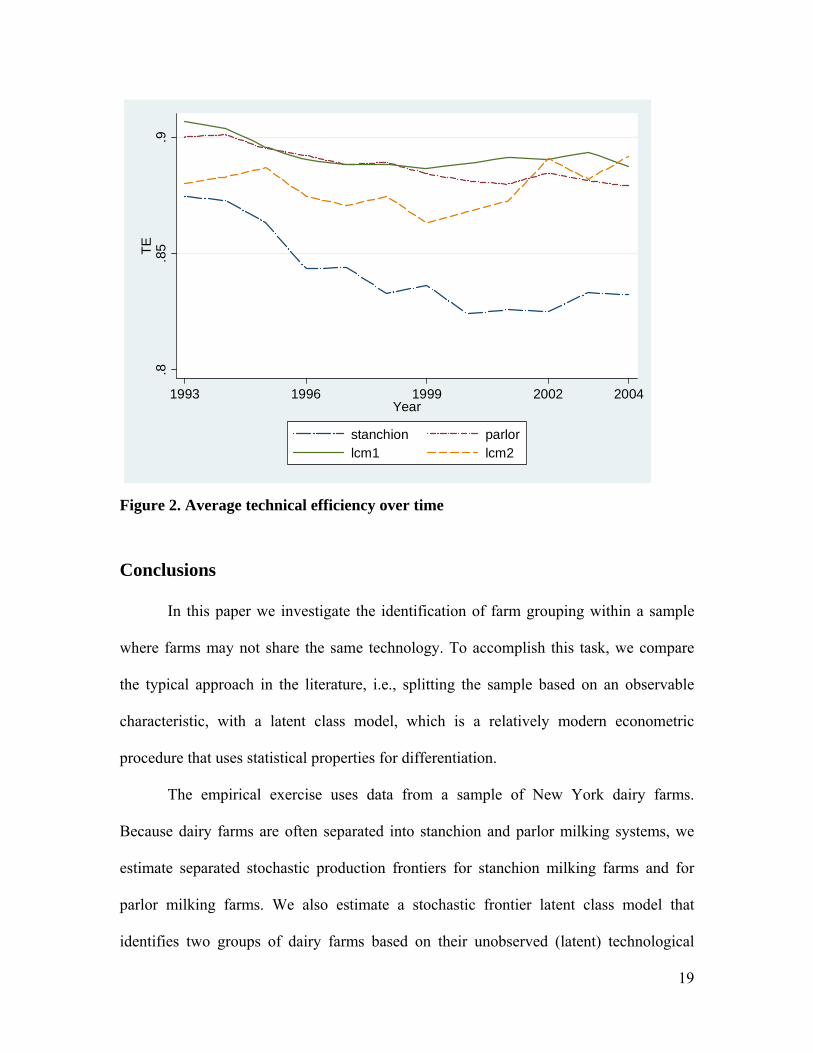
technical efficiency decreases over time for these two groups.8 Figure 2 shows the
evolution of these average technical efficiency levels. Efficiency declines over time for
parlors as well, but the decline is greater for the stanchion farms. These stanchion farms
continue to depreciate in efficiency as parlor milking systems dominate the industry.
Similarly, farms which belong to group 1 are more efficient than farms belonging to
group 2 in the latent class model. However, due to the decreasing pattern in group 1 and
the increasing pattern of group 2, technical efficiency is higher for the group 2 than group
1 in the last years of the sample.
18
.8.8
5.9
TE
1993 1996 1999 2002 2004Year
stanchion parlorlcm1 lcm2
Figure 2. Average technical efficiency over time
Conclusions
In this paper we investigate the identification of farm grouping within a sample
where farms may not share the same technology. To accomplish this task, we compare
the typical approach in the literature, i.e., splitting the sample based on an observable
characteristic, with a latent class model, which is a relatively modern econometric
procedure that uses statistical properties for differentiation.
The empirical exercise uses data from a sample of New York dairy farms.
Because dairy farms are often separated into stanchion and parlor milking systems, we
estimate separated stochastic production frontiers for stanchion milking farms and for
parlor milking farms. We also estimate a stochastic frontier latent class model that
identifies two groups of dairy farms based on their unobserved (latent) technological
19

20
differences. Comparison of the results from the two approaches implies that milking
system is only a partial determining factor of technology differences.
The latent class model was able to classify the farms into two groups that showed
much higher technological differences than those obtained by splitting the sample using
milking system as the separation criterion. Therefore, from a methodological point of
view if researchers suspect that farms in the sample do not share the same technological
characteristics, we suggest that they use latent class models to control for heterogeneity.
mnJLFSBICmJLFAIC ⋅+
1 Controlling for differences in milking system is rather common in studies of dairy production. See, for
example, El-Osta and Morehart, Kompas and Che and Tauer (1993, 1998).
2 Using dairy farm sample based on voluntary participation is usual in the literature. For instance, Ahmad
and Bravo-Ureta, and Newman and Matthews, to name just a few.
3 All the monetary variables are expressed in 2004 US$. The US CPI index was used to deflate the
variables.
4 See Kumbhakar and Lovell or Greene (2008) for good overviews.
5 The composition of these variables is shown in the appendix.
6 The statistics can be written as: ⋅−=⋅+⋅−= )log()(log2 ;2)(log2 , where
LF(J) is the value that the likelihood function takes for J groups, m is the number of parameters used in the
model and n is the number of observations. The preferred model will be that for which the value of the
statistic is lowest.
7 All models were estimated using Limdep 9.0
8 However, it increases for some periods. The model implies that TE is a monotonic function of time, so
this aberration occurs because the panel is unbalanced and the computations are based upon individual
observations.

References
Ahmad, M. and Bravo-Ureta, B., 1995. An econometric decomposition of dairy output growth.
Am. J. of Agric. Econ. 77, 914-921.
Aigner, D.J., Lovell, C.A.K., Schmidt, P., 1977. Formulation and estimation of stochastic
frontier production function models. J. of Econometd. 6, 21– 37.
Alvarez, A., del Corral, J., Solís, D. and Pérez, J.A., 2008. Does intensification improve the
economic efficiency of dairy farms? J. of Dairy Science 91, 3693-3698.
Bagi, F., 1984. Stochastic frontier production function and farm-level technical efficiency of full-
time and part-time farm in West Tennessee. North Central J. of Agric. Econ. 6, 48-55.
Balcombe, K., Fraser, I., Rahman, M. and Smith, L., 2007. Examining the technical efficiency of
rice producers in Bangladesh. J. of Int. Development 19, 1-16.
Battese, G. and Coelli, T., 1992. Frontier production functions, technical efficiency and panel
data with application to paddy farmers in India. J. Productiv. Anal. 3, 153-169.
Bravo-Ureta, B., 1986. Technical efficiency measures for dairy farms based on a probabilistic
frontier function model. Canadian J. of Agric. Econ. 34, 399-415.
El-Osta, H. and Morehart, M., 2000. Adoption and its impact on production performance of dairy
operations. Rev. of Agric. Econ. 22, 477-498.
Fuwa, N., Edmonds, C. and Banik, P., 2007. Are small-scale rice farmers in Eastern India really
inefficient? Examining the effects of microtopography on technical efficiency estimates.
Agric. Econ. 36, 335-346.
Greene, W., 2005. Reconsidering heterogeneity in panel data estimators of the stochastic frontier
model. J. of Econometd. 126, 269-303.
21

Greene, W., 2008. The Econometric Approach to Efficiency Analysis, in H. Fried, C.A.K.
Lovell, and S. Schmidt. The Measurement of Productive Efficiency and Productivity
Growth, Oxford University Press, New York, Oxford.
Hildreth, C. and Houck, J.P., 1968. Some estimators for a linear model with random coefficients.
J. of the Am. Statistical Association 63, 584-595.
Hoch, I., 1962. Estimation of production function parameters combining time-series and cross-
section data. Econometrica 30, 34-53.
Jondrow, J., Lovell, C.A.K., Materov, I. and Schmidt, P., 1982. On the estimation of technical
inefficiency in the stochastic frontier production function model. J. of Econometd. 19, 233-
238.
Knoblauch, W. A., Putnam, L. D. and Karszes, J., 2005. Dairy Farm Management Business
Summary New York State 2004. Department of Applied Econonomics and Management.
Research Bulletin 2005-03, Cornell University.
Kompas, T. and Che, T., 2006. Technology choice and efficiency on Australian dairy farms. The
Australian J. of Agric. and Resource Econ. 50, 65–83.
Kumbhakar, S. and Lovell, C.A.K., 2000. Stochastic Frontier Analysis. Cambridge University
Press.
Lazarsfeld, P., 1950. The Logical and Mathematical Foundation of Latent Structure Analysis, in
S. Stouffer, L. Guttman, E. Sachman, P. Lazarsfeld, S. Star and J. Clausen (eds).
Measurement and Prediction. Princeton University Press, Princeton.
Newman, C. and Matthews, A., 2006. The productivity performance of Irish dairy farms 1984-
2000: a multiple output distance function approach. J. Productiv. Anal. 26, 191-205.
22

Orea, L. and Kumbhakar, S., 2004. Efficiency measurement using a stochastic frontier latent
class model. Empirical Econ. 29, 169-183.
Tauer, L.W., 1993. Short-run and long-run efficiencies of New York dairy farms. Agric. and
Resource Econ. Rev. 22, 1-9.
Tauer, L.W., 1998. Cost of production for stanchion versus parlor milking in New York. J. of
Dairy Science 81, 567-569.
Xiasong, X. and Scott, J.R., 1998. Efficiency and technical progress in traditional and modern
agriculture: Evidence from rice production in China. Agric. Econ. 18, 157-165.
23

24
Appendix
Counties of New York in each region
DSOUTH: Allegany, Cattaraugus, Chautauqua, Chemung, Columbia, Cortland, Delaware,
Schuyler, Steuben, Sullivan, Tioga, Tompkins.
DNORTHWEST: Cayuga, Erie, Genesee, Livingston, Niagara, Ontario, Orleans, Seneca,
Wayne, Wyoming, Yates.
DEAST: Albany, Chenango, Herkimer, Madison, Montgomery, Oneida, Onondaga, Otsego,
Rensselaer, Saratoga, Schenectady, Schoharie, Washington.
DNORTHEAST: Clinton, Franklin, Jefferson, Lewis, Saint Lawrence.