World Tuberculosis Day 2014 The TB situation in 2012: Findings from the joint TB surveillance and...
20
World Tuberculosis Day 2014 The TB situation in 2012: Findings from the joint TB surveillance and monitoring report by ECDC and the WHO Regional Office for Europe ECDC TB Team European Centre for Disease Prevention and Control Stockholm, 24 March 2014
-
Upload
samson-byrd -
Category
Documents
-
view
213 -
download
0
Transcript of World Tuberculosis Day 2014 The TB situation in 2012: Findings from the joint TB surveillance and...

World Tuberculosis Day 2014
The TB situation in 2012: Findings from the joint TB surveillance and monitoring report by ECDC and the WHO Regional Office for Europe
ECDC TB TeamEuropean Centre for Disease Prevention and ControlStockholm, 24 March 2014

TB notifications by countryIn 2012, 68 423 TB cases were reported in the EU/EEA.The notification rate was 13.5 per 100 000 population(range 3.4–85.2).
2
Not included or not reporting
50 to 99 per 100 000
20 to 49 per 100 000
10 to 19 per 100 000
< 10 per 100 000
Figure 1: TB notification rate per 100 000 population by country, EU/EEA, 2012

EU definition: Confirmed TB cases*
3
Figure 2: Percentage of laboratory-confirmed TB cases by country, EU/EEA, 2012
70 to 79%
≥ 80%
60 to 69%
< 60%
Not included or not reporting
* Confirmed by culture or by both a positive sputum microscopy result and Mycobacterium tuberculosis nucleic acid identified in nucleic acid amplification test.
Overall, 61.9% (range 21.5–91.4%) of TB cases reported in the EU/EEA were laboratory confirmed.
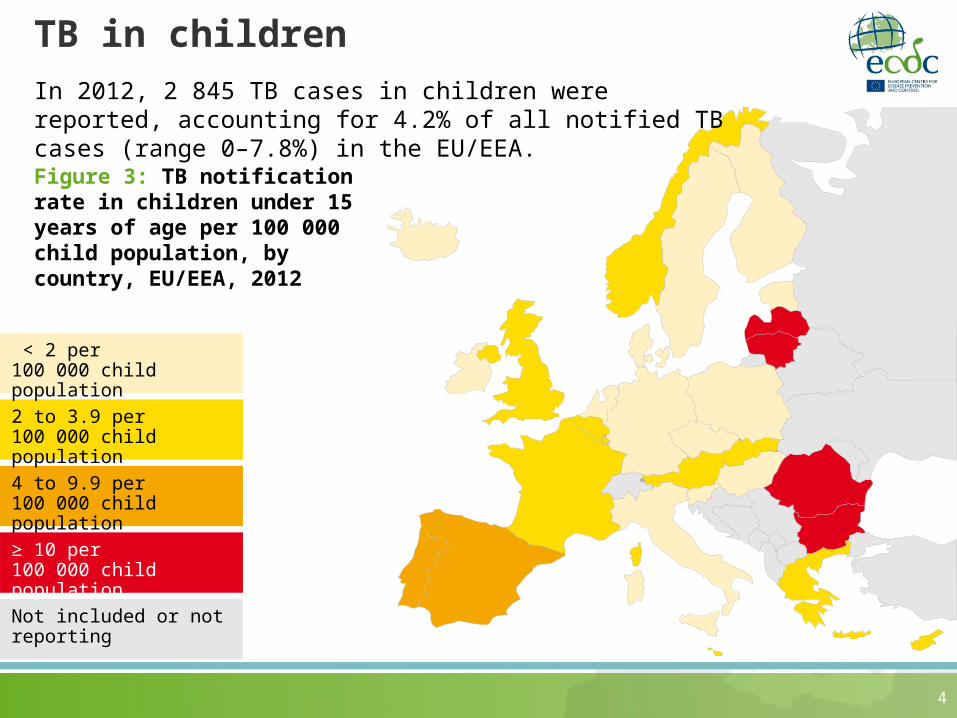
TB in children
4
Figure 3: TB notification rate in children under 15 years of age per 100 000 child population, by country, EU/EEA, 2012
Not included or not reporting
4 to 9.9 per 100 000 child population
2 to 3.9 per 100 000 child population
≥ 10 per 100 000 child population
< 2 per 100 000 child population
In 2012, 2 845 TB cases in children were reported, accounting for 4.2% of all notified TB cases (range 0–7.8%) in the EU/EEA.

TB cases of foreign origin
5
In 2012, the overall proportion of TB cases of foreign origin in the EU/EEA was 26.8% (range 0.2–85.4%).Figure 4: Percentage of TB cases of foreign origin by country, EU/EEA, 2012
25 to 49.9%
≥ 75%
1 to 24.9%
50 to 74.9%
< 1%
Not included or not reporting

Extrapulmonary TB cases
6
In 2012, the overall proportion of extrapulmonary TB cases in the EU/EEA was 23.0% (range 2.9–48.6%).Figure 5: Percentage of extrapulmonary TB cases by country, EU/EEA, 2012
20 to 29.9%
≥ 40%
10 to 19.9%
30 to 39.9%
< 10%
Not included or not reporting
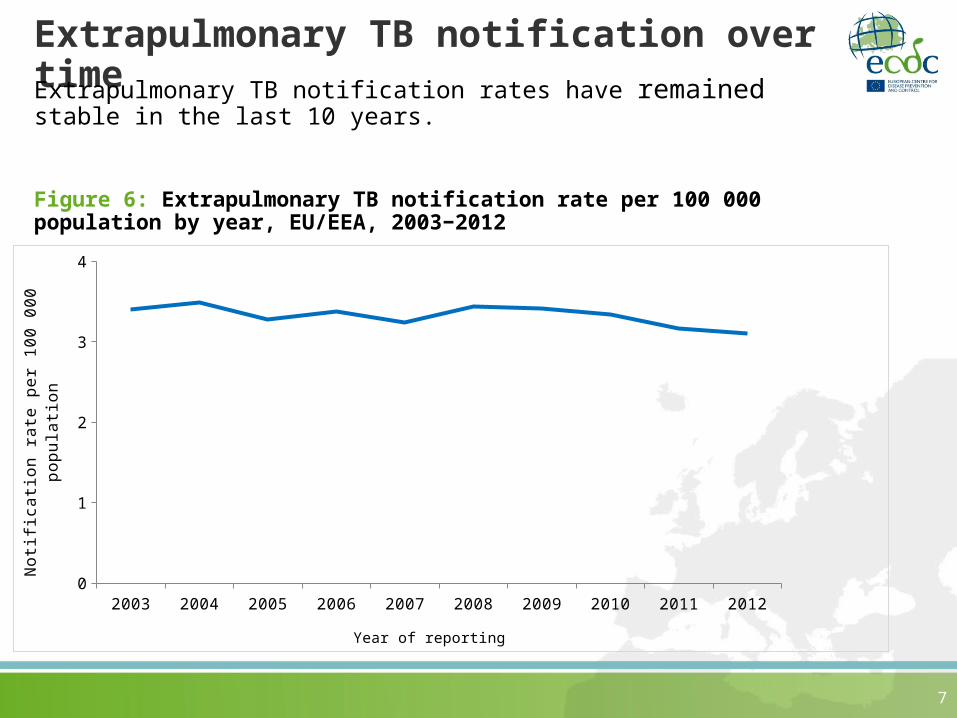
Extrapulmonary TB notification over timeExtrapulmonary TB notification rates have remained stable in the last 10 years.
7
Figure 6: Extrapulmonary TB notification rate per 100 000 population by year, EU/EEA, 2003−2012
2003 2004 2005 2006 2007 2008 2009 2010 2011 20120
1
2
3
4
Year of reporting
Notifica
tion r
ate
per
100 0
00 p
opula
tion

Multidrug-resistant TB
8
In 2012, the overall proportion of TB cases with multi-drug resistance in the EU/EEA was 4.6% (range 0–25.5%).
Figure 7: Percentage of multidrug resistance among all confirmed TB cases by country, EU/EEA, 2012
2 to 4.9%
≥ 10%
1 to 1.9%
5 to 9.9%
< 1%
Not included or not reporting
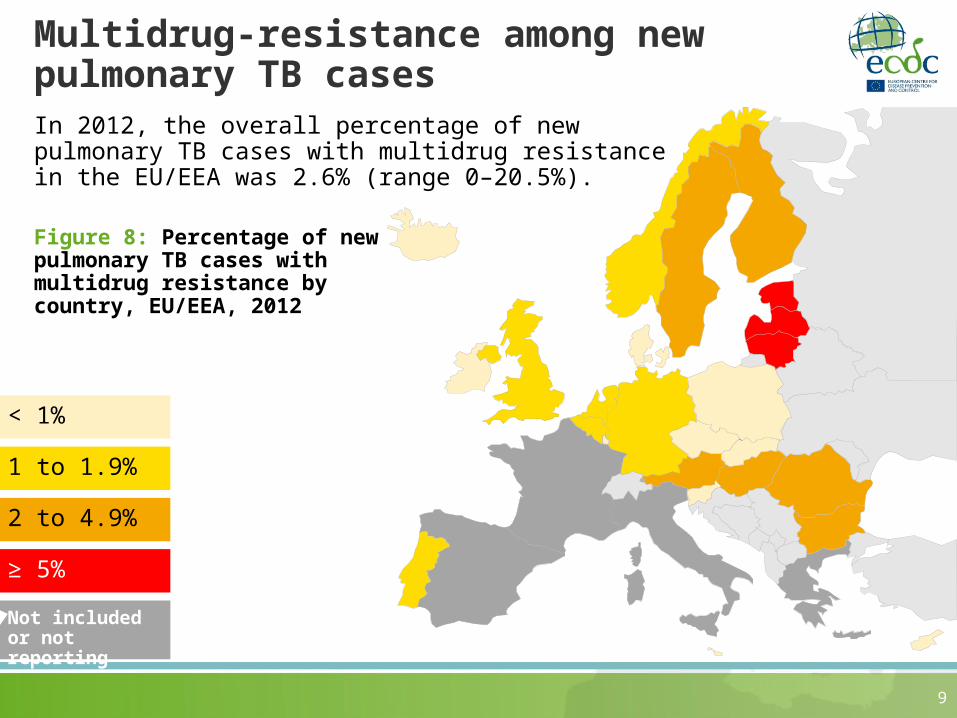
Multidrug-resistance among new pulmonary TB cases
9
Figure 8: Percentage of new pulmonary TB cases with multidrug resistance by country, EU/EEA, 2012
2 to 4.9%
1 to 1.9%
≥ 5%
< 1%
Not included or not reporting
In 2012, the overall percentage of new pulmonary TB cases with multidrug resistance in the EU/EEA was 2.6% (range 0–20.5%).

Multidrug-resistance among previously treated pulmonary TB cases
10
In 2012, the overall proportion of previously treated pulmonary TB cases with multidrug resistance in the EU/EEA was 18.8% (range 0–50.0%).
Figure 9: Percentage of previously treated pulmonary TB cases with multidrug resistance by country, EU/EEA, 2012
10 to 19.9%
≥ 20%
1 to 9.9%
< 1%
Not included or not reporting

Extensively drug-resistant TB
11
In 2012, the proportion of extensively drug-resistant TB cases among multidrug-resistant cases in EU/EEA was 13.7% (range 0–50.0%).
Figure 10: Percentage of extensively drug-resistant TB cases among multidrug-resistant TB cases tested for second-line drug susceptibility, by country, EU/EEA, 2012
10 to 19.9%
1 to 9.9%
≥20%
< 1%
Not included or not reporting

TB/HIV co-infection
12
In 2012, the overall proportion HIV positive among TB cases with known HIV status in EU/EEA was 5.5% (range 0–16.5%).
Figure 11: Percentage of HIV-positive cases among TB cases with known HIV status, by country, EU/EEA, 2012
5 to 9.9%
2 to 4.9%
≥ 10%
< 1%
Not included or not reporting

Treatment success in new pulmonary TB cases over timeThe treatment success rate in new culture-confirmed pulmonary TB cases notified between 2007 and 2011 has slightly decreased from 79.2% in 2007 to 76.5% in 2011.
13
Figure 12: 12-month treatment success rate in new culture-confirmed pulmonary TB cases by year of initial case reporting, EU/EEA, 2007–2011
2007 2008 2009 2010 20110
20
40
60
80
100
79.2 79.4 79.0 77.0 76.5
Year of initial reporting
Tre
atm
ent s
ucce
ss (
%)

Treatment success in new pulmonary TB casesTreatment success rate for culture-confirmed new pulmonary TB cases notified in 2011 was 76.5% (range: 0–91.3%).
14
Figure 13: Treatment success rate in culture-confirmed new pulmonary TB cases notified in 2011, by country, EU/EEA, 2012
* Iceland and Malta reported zero new TB cases in 2011. Three EU/EEA Member States did not report treatment outcome data
EU/E
EA
Austria
Belgiu
m
Bulgar
ia
Cypru
s
Czech
Rep
ublic
Denm
ark
Esto
nia
Finla
nd
Germ
any
Hungary
Ireland
Latv
ia
Lithuan
ia
Malta
Nether
lands
Norway
Poland
Portu
gal
Roman
ia
Slova
kia
Slove
nia
Spain
Sweden
United K
ingdom
0
20
40
60
80
100
Tre
atm
en
t su
ccess
(%
)

Treatment success in previously treated pulmonary TB casesThe treatment success rate for previously treated culture-confirmed pulmonary TB cases notified in 2011 was 55.2% (range 25.0–100.0%).
15
Figure 14: Treatment success rate in previously treated culture-confirmed pulmonary TB cases notified in 2011, by country, EU/EEA
* Iceland and Malta reported zero previously treated TB cases in 2011. Three EU/EEA Member States did not report treatment outcome data stratified by treatment history
Subt
otal
EU/E
EA
Austri
a
Belgi
um
Bulga
ria
Cypru
s
Czech
Rep
ublic
Denm
ark
Esto
nia
Finla
nd
Germ
any
Hunga
ry
Irela
nd
Latv
ia
Lithu
ania
Nethe
rland
s
Norway
Pola
nd
Portu
gal
Roman
ia
Slov
akia
Slov
enia
Spai
n
Swed
en
Unite
d Kin
gdom
0
20
40
60
80
100
%
Tre
atm
ent
succ
ess
(%
)

Treatment success rate in confirmed pulmonary TB cases*The treatment success rate for all confirmed pulmonary TB cases notified in 2011 was 72.4% (range 0–90.4%).
16
Figure 15: Treatment success rate in laboratory confirmed pulmonary TB cases notified in 2011, by country, EU/EEA, 2012
* Four EU/EEA Member States did not report treatment outcome data
EU/E
EA
Austria
Belgiu
m
Bulgar
ia
Cypru
s
Czech
Rep
ublic
Denm
ark
Esto
nia
Finla
nd
Germ
any
Hungary
Ireland
Latv
ia
Lithuan
ia
Luxe
mbou
rg
Malta
Nether
lands
Norway
Poland
Portu
gal
Roman
ia
Slova
kia
Slove
nia
Spain
Sweden
United K
in...
0
20
40
60
80
100
Tre
atm
ent
succ
ess
(%
)

Treatment success rate in extrapulmonary TB*The treatment success rate in extrapulmonary TB cases notified in 2011 was 82.2% (range 59.0–100%).
17
Figure 16: Treatment success rate in extrapulmonary TB cases notified in 2011, by country, EU/EEA, 2012
* Five Member States did not report stratified treatment outcome data
EU/E
EA
Austria
Belgiu
m
Bulgar
ia
Cypru
s
Czech
Rep
ublic
Denm
ark
Esto
nia
Germ
any
Hungary
Iceland
Ireland
Latv
ia
Lithuan
ia
Malta
Nether
lands
Norway
Poland
Portu
gal
Roman
ia
Slova
kia
Slove
nia
Spain
Sweden
United K
in...
0
20
40
60
80
100
Tre
atm
ent
succ
ess
(%
)
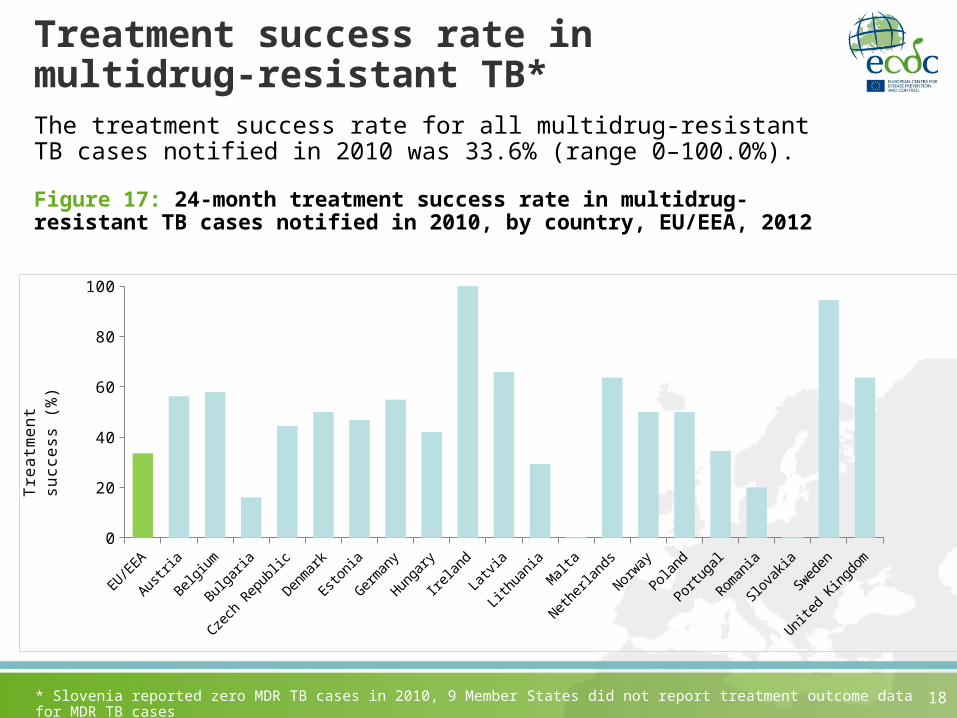
Treatment success rate in multidrug-resistant TB*The treatment success rate for all multidrug-resistant TB cases notified in 2010 was 33.6% (range 0–100.0%).
18
Figure 17: 24-month treatment success rate in multidrug-resistant TB cases notified in 2010, by country, EU/EEA, 2012
* Slovenia reported zero MDR TB cases in 2010, 9 Member States did not report treatment outcome data for MDR TB cases
EU/E
EA
Austri
a
Belgi
um
Bulga
ria
Czech
Rep
ublic
Denm
ark
Esto
nia
Germ
any
Hunga
ry
Irela
nd
Latv
ia
Lith
uani
a
Mal
ta
Nethe
rland
s
Norway
Pola
nd
Portu
gal
Roman
ia
Slov
akia
Swed
en
Unite
d Ki
ngdo
m
0
20
40
60
80
100
Tre
atm
ent
succ
ess
(%
)

Treatment outcome in multidrug-resistant TB over timeTreatment outcomes for multidrug-resistant TB cases improved slightly between the 2008 and 2010 cohort, EU/EEA.
19
Figure 18: 24-month treatment outcome in multidrug-resistant TB cases notified from 2008 to 2010, by year of initial case reporting, EU/EEA, 2012
Success Died Failed Defaulted Still on treatment
Transferred or unknown
0
10
20
30
40
cohort 2008
cohort 2009
cohort 2010
Tre
atm
ent
succ
ess
(%
)

20
Treatment success in extensively drug-resistant TB*The treatment success rate in extensively drug-resistant TB cases notified in 2009 was 25.0% (range 0–66.7%).
20
Figure 19: 36-month treatment success rate in extensively drug-resistant TB cases notified in 2009, by country, EU/EEA, 2012
* Cyprus, Denmark, Iceland, Malta, Slovakia, Slovenia and Sweden reported zero XDR TB cases in 2009, 12 countries did not report SLD DST results or stratified treatment outcome data
EU/EEA Austria Belgium Bulgaria Czech Republic
Estonia Latvia Lithuania Norway Poland Romania United Kingdom
0
20
40
60
80
Treatm
ent
succ
ess
(%
)