World Transport Policy & Practice - Eco Logica
46
[1] World Transport Policy & Practice Contents Volume 4, Number 1, 1998 2 Abstracts & keywords 3 Editorial 4 Dutch Transport Policy: From Rhetoric to Reality Gary Haq and MachielBolhuis 9 Urban Transport and Equity: thecase ofSão Paulo Eduardo A. Vasconcellos 21 SustainableTransport: Some challenges forIsrael and Palestine Yaakov Garb 30 CanDemandManagement Tame theAutomobileinaMetropolitanRegion? Spenser W. Havlick & Peter W. G. Newman 36 The Impact ofTransportationon HouseholdEnergy Consumption Rick Browning, Michele Helou & Paul A. Larocque 40 From Curitibato Quito: Reserved traffic lanes for public transport as an ecological, economic and social policy for cities Benoît Lambert ©1998 Eco-Logica Ltd ISSN 1352-7614 Editor John Whitelegg, Professor of Environmental Studies, Liverpool John Moores University, Clarence Street, Liverpool, L3 5UG, U.K. Editorial Board Eric Britton, Managing Director, EcoPlan International, The Centre for Technology & Systems Studies, 10 rue Joseph Bara, 75006 Paris, France. Paul Tranter , Senior Lecturer, School of Geography and Oceanography, University College, Australian Defence Force Academy, Canberra ACT 2600, Australia. John Howe, Professor of Transportation Engineering and Head of Infrastructural Engineering and Physical Planning, International Institute for Infrastructural, Hydraulic and Environmental Engineering, Delft, The Netherlands. Mikel Murga , Leber Planificacion e Ingenieria S.A., Apartado 79, 48930-Las Arenas, Bizkaia, Spain. Publisher Eco-Logica Ltd., 53 Derwent Road, Lancaster, LA1 3ES, U.K. Telephone +44 1524 63175 Fax +44 1524 848340 E-mail: Editorial [email protected] Subscriptions [email protected] Production Team Pascal Desmond (Subscriptions, Administration), Mark Johnston (Production). Please contact Pascal Desmond for sample copies, orders and subscriptions, reprints and copyright permissions. WorldTransportPolicy&Practice 4/1[1998]
Transcript of World Transport Policy & Practice - Eco Logica

[ 1 ]
World Transport Policy & Practice
Con t en t s Volume 4, Number 1, 1998
2 Abstracts & keywords
3 Editorial
4 Dutch Transport Policy: From Rhetoric to RealityGary Haq and Machiel Bolhuis
9 Urban Transport and Equity: the case of São PauloEduardo A. Vasconcellos
21 Sustainable Transport: Some challenges for Israel and PalestineYaakov Garb
30 Can Demand Management Tame the Automobile in a Metropolitan Region?Spenser W. Havlick & Peter W. G. Newman
36 The Impact of Transportation on Household Energy ConsumptionRick Browning, Michele Helou & Paul A. Larocque
40 From Curitiba to Quito: Reserved traffic lanes for public transportas an ecological, economic and social policy for citiesBenoît Lambert
©1998 Eco-Logica Ltd ISSN 1352-7614
Edi torJohn Whitelegg, Professor of Environmental Studies, Liverpool John Moores University,Clarence Street, Liverpool, L3 5UG, U.K.
Editorial Board
Eric Britton, Managing Director, EcoPlan International, The Centre for Technology & SystemsStudies, 10 rue Joseph Bara, 75006 Paris, France.
Paul Tranter, Senior Lecturer, School of Geography and Oceanography, University College,Australian Defence Force Academy, Canberra ACT 2600, Australia.
John Howe, Professor of Transportation Engineering and Head of Infrastructural Engineeringand Physical Planning, International Institute for Infrastructural, Hydraulic andEnvironmental Engineering, Delft, The Netherlands.
Mikel Murga, Leber Planificacion e Ingenieria S.A., Apartado 79, 48930-Las Arenas, Bizkaia,Spain.
P ubl i s her
Eco-Logica Ltd., 53 Derwent Road, Lancaster, LA1 3ES, U.K.Telephone +44 1524 63175 Fax +44 1524 848340E-mail: Editorial [email protected] Subscriptions [email protected]
Product ion Team
Pascal Desmond (Subscriptions, Administration), Mark Johnston (Production). Please contactPascal Desmond for sample copies, orders and subscriptions, reprints and copyright permissions.
World Transport Policy & Practice4/1 [1998]

[ 2 ]
Abstracts and keywords
effective tool in taming the automobile. Theapproaches to demand management in fourEuropean cities; Zurich, Freiburg, Stockholmand Copenhagen; and Boulder, Colorado isinvest igated.
The Impact o f Transportat ion onHousehold Energy Consumpt ion
Rick Browning, Michele Helou & Paul A.LarocqueKeywords: Energy, Houses, Modal choice.This paper examines transportation energycosts as an integral part of total householdenergy consumption. A typical suburbanhousehold is found to expend more than halfits total annual energy budget on operation ofhousehold motor vehicles. In contrast,households located in traditional, pedestrian-oriented neighbourhoods are found to use farless energy on t ransportation. For aninstructive contrast, two household budgetswere generated using a standard computerprogram and then compared. Withtransportation energies included, ahousehold living in an 88 year old ‘energyhog’ house located in a traditional pedestrianfriendly neighbourhood is shown to expendless total annual energy than a suburbanhousehold living in a highly energy efficientmodern house. Studies and statisticsdeveloped in the Pacific Northwest are usedas documentation for travel-relatedbehaviour.
From Curit iba to Quito: Reservedtraf f ic lanes for public transport as aneco logical, economic and socialpolicy for c it ies
Benoît LambertKeywords: Trolleybus, urban transport,Curitiba, Quito.Quito’s new trolleybus is a great success. It isbeing expanded already. Consisting of aknow-how transfer from a Latin Americancity, Curitiba (Brazil), to another LatinAmerican city, Quito (Ecuador), these twoexperiences display a new and originaldevelopment model. By occupying urbanspace, and therefore limiting the presence ofthe car, too often promoted withoutconsidering environmental and ecologicalconsequences, the ‘reserved structuring axes’for public transport allow high mobility atlow cost. The advantages of this model arenumerous and could profit many other cities.Today, more and more questions oftechnological choices are part of the politicaland ecological debate. Transport is no longera secondary issue.
Dutch Transport Po licy : From Rhetoricto Reality
Gary Haq and Machiel BolhuisKeywords: Accessibility, environmentalprotection, freight, mobility, Netherlands,targetsThe Dutch have gained an internationalreputation for developing coherent policyplans for transport, environment andphysical planning. This paper examines therhetoric of Dutch transport policy andassesses what is actually being achieved inpractice. Progress made in achieving themain targets on mobility, accessibility andenvironmental protection are discussed. Thegrowth in vehicle kilometres of the freightsector is identified as an important problemthat the Dutch will need to deal with in orderto achieve all the targets adopted in transportand environmental policy.
Urban Transport and Equity: the caseof São Paulo
Eduardo A. VasconcellosKeywords: São Paulo, access, mobility,equity.Urban transport provision, accident rates andaccessibility in São Paulo variestremendously with income, gender and age.Sustainable transport modes are marginalisedand high externalities are borne by society. Acomplete overhaul and reassessment ofpriorities is required to achieve equity intransport.
Sustainable Tra nsport : Somechallenges for Israel and Pal est ine
Yaakov GarbKeywords: Israel, Palestine, sustainability,peaceWITH the establishment of Palestine and thecontinuing peace, there is a need to appraisethe transport infrastructure and policies ofboth countries. In particular, will Palestinefollow Israel along the road to massmotorisation or will it choose the path tosustainability? Will Israel realise the folly ofproviding for private transport and seize thisunique opportunity?
Can Demand Management Tame theAutomobile in a Metropolitan Region?
Spenser W. Havlick & Peter W. G. NewmanKeywords: Demand Management, alternativemodes, land use.Demand management strategies can be an

[ 3 ]
Editoria l
World Transport Policy & Practice4/1 [1998]
THERE is something very positive andencouraging about having detaileddiscussions with lively people from morethan a dozen countries about transportissues. In March this year 25 people sattogether for the best part of a week in IHEDelft (the Netherlands) and sharedexperiences of dealing with traffic and itsimpacts in most parts of the world. Theluxury of having direct contact with Cuba,Mexico, Sudan, Surinam, Pakistan,Indonesia, Vietnam, Egypt, Kenya, Turkey,Bangladesh, the Philippines, Thailand,Nigeria, Ghana, China and the Netherlandscannot be exaggerated. Everyone wasconcerned about the escalation of carownership and use, and its ef fects onsituations as different as Khartoum, MexicoCity and Bangkok.
Individual contributions were full ofinsight. Delegates from West Africa werekeen to emphasise the importance of statusand prestige and its links with carownership. Public transport may be wellused and may be important but no-one whois ambitious or successful will want to beseen taking a bus. The politics is also crucial.Senior politicians in most countries areinfluenced more easily by the arguments ofthe car makers and the road builders than bythe advocates of buses and bicycles.Professionals are more likely to see theircareer development progress through largeinfrastructure projects than throughpedestrian priority schemes in Nairobi or carfree areas in Katmandu. These are substantialcultural obstacles to the development of newtransport policies and these culturalobstacles are not being addressed.
Much discussion focussed on theexperience of rapidly developing andmotorising cities in coping with that growth.The UK and Dutch experiences with traffic
reduction, integrated transport policies andmodal shift were much admired but therewas uncertainty about how to progress thosesame ideas in Africa or Asia. There was nodoubt, however, that the ideas have to bepursued with vigour.
The week vividly illustrated the stronglypositive aspects of the world transportsituation. The majority of the participantswere young transport professionals at thestart of their careers. They were enthusiasticand aware and they will have an impact ontheir own countries pursuing policies basedon social and environmental justice andbased on local determination of local needs.They will have problems. They will meetwith opposition particularly from their owngovernments who will all too readily acceptthe mythology of road building, jobs,increased auto-dependency and progress.This is a classic historic struggle betweentwo ideologies. The presence in the debate ofeducated, aware professionals is a great leapforward, and the international linkagesforged during such an intensive period oflively discussion is a major tool for furtherprogress.
Perhaps more importantly still the week inDelft demonstrated that there is a freshnessand a potential for internationalcollaboration from the grass roots. This groupof people have far more to say about globaldevelopment as it matters to real people thando the large contingents of diplomats andconsultants dragging their baggage from Rioto Kyoto via Istanbul.
John Whitelegg, Editor
(For information about similar short courses inDelft please contact Jan Koster at IHE, Delft,The Netherlands, fax + 31 15 21 22 921).

[ 4 ]
the growth in vehicle kilometres and theassociated environmental impacts. TheDutch, on paper at least, seem to have madeconsiderable progress within the area oftransport and the environment. This paperevaluates the extent to which the Dutch havemet the main targets for transport in the threeareas of mobility, accessibility andenvironmental protection.
The t ransport sector
The Netherlands is promoted as adistribution country and as the ‘Gateway toEurope’; with Schiphol airport and the portof Rotterdam being important centres ofeconomic activity and major transport nodesof European significance. The transportsector plays an important role in the nationaleconomy and accounts for about 7-8% of theDutch Gross National Product. The Dutchexpect a 70% increase in car use by 2010compared to 1986: from 75 to 120 billionvehicle kilometres. The number of cars in theNetherlands is expected to increase from 5million to 6-7 million by 2010 together witha 70-80% increase in goods traffic on roads(Ministry of Environment, 1990).
Table 1 compares the modal split of theNetherlands to four other Europeancountries. The figures for car use, based onpassenger kilometres, do not vary widelybetween the four countries. However car useis lowest in the Netherlands (83.4%) andhighest in the United Kingdom (87.8%). TheNetherlands also has the highest amount ofpassenger kilometres travelled by rail (8.4%)compared to 5.1% in Belgium.
With regard to freight transport, Table 2shows that the Netherlands transports thelowest amount of f reight by road (63.7%) andthe highest amount of freight by inlandnavigation (33.8%) compared to the otherfour European countries. However, the Dutchtransport the lowest amount of freight by rail(2.5%). The adoption by the DutchGovernment of Dutch Railways’ Rail 21 andCargo 21 plans has provided the impetus to
Dutch Transport Policy: From Rhetoric to Reality
Abs t r a ct
The Dutch have gained an internationalreputation for developing coherent policyplans for transport, environment andphysical planning. This paper examines therhetoric of Dutch transport policy andassesses what is actually being achieved inpractice. Progress made in achieving themain targets on mobility, accessibility andenvironmental protection are discussed. Thegrowth in vehicle kilometres of the freightsector is identified as an important problemthat the Dutch will need to deal with in orderto achieve all the targets adopted in transportand environmental policy.
K e yw ord s
Accessibility, environmental protection,freight, mobility, Netherlands, targets
Intr oduct i on
THE DUTCH have gained an internationalreputation for developing coherent plans ontransport, environment and physicalplanning. With the increased attention givento environmental protection and the need fora more sustainable transport system, theDutch policy approach has been held up asan example of ‘best practice’. Dutch transportpolicy has been integrated and co-ordinatedwith physical planning and environmentalpolicy. The objectives of these policies areexplicitly stated and specific end-points areidentified in the form of targets (Haq, 1997).
In 1988 the Dutch Government publishedthe Second Transport Structure plan (TweedeStructuurschema Verkeer en Vervoer (SVV2))which set out the policy requirements toachieve a compromise between mobility,accessibility and environmental protection.The transport plan, together with theNational Environmental Policy Plan Plus(Nationaal Milieubeleidsplan (NMP+)) andthe Fourth Report on Physical Planning Extra(Vierde Nota Ruimtelijke Ordening (VINEX))provide an integrated strategy to deal with
Haq & Bolhuis: Dutch TransportPolicy: From Rhetoric to Reality.World Transport Policy & Practice4/1 [1998] 4 - 8
Gary HaqResearch Associate, Stockholm Environment Institute at York University, UK
Machiel BolhuisMinisterie van Verkeer en Waterstaat, Netherlands.

[ 5 ]
transport; improving accessibility andimproving environmental quality. In total, 38main targets have been set which coverdifferent aspects of the three main themes ofthe plan: mobility, accessibility andenvironmental protection (Ministry ofTransport, 1992a).
Evaluat ion o f Dutch t ransport policy
In September 1992, the Ministry ofTransport, Public Works and WaterManagement published its first annualevaluation of the Second Transport StructurePlan, which was subsequently updated in1993, 1994 and 1995. The reports cover fourmain themes of the Transport Plan: mobility;accessibility; environmental protection andsupport measures. Based on the SVV2, theMinistry has developed a set of indicators tomeasure the progress towards the attainmentof traffic and transport targets and to outlinefuture scenarios. With time, availability ofdata and the improvement of indicators, amore accurate understanding of progresstowards the attainment of policy targets andthe effectiveness of policy instruments can begained (Ministry of Transport, 1996b).
MobilityThe Dutch have set a target to limit theexpected growth of a 70% increase in vehiclekilometres to 35% by 2010 compared to1986. To measure progress towards thistarget the total number of personal vehiclekilometres were calculated for working days.During the period 1988-1991 there has been alimited growth in the number of personalvehicle kilometres, which is in line withSVV2 policy. The 1994 intermediate target(index 125) has more or less been met.However, it is expected that the intermediatetarget for the year 2000 (index 130) will notbe met. For the use of the bicycle, an increaseof 30% has been set for the year 2010compared to 1986. The number of kilometrestravelled by bicycle since 1989 have beenstable and a rise is expected in the future.The implementation of the Bicycle MasterPlan (Ministry of Transport, 1992b), toincrease the number of kilometres travelledby bicycle, and the promotion of car freecities and towns, will enable the long-termtarget to be met.
Acc ess ibili tyFor main strategic roads a norm of a 2%chance of the probability of congestion perjourney has been set, with a 5% norm for allother roads. This means that no more than
develop and encourage greater use of railwithin the Netherlands for both passengerand freight transport. The Dutch RailwaysRail 21 plan aims to double transport volumecapacity and improve the quality of railtravel while the Cargo 21 plan aims toincrease the amount of f reight transported byrail to 65 million tonnes by 2010.
The Dutch transport plan is based on theattainment of a sustainable society, whichrequires meeting the needs of the presentwithout compromising future generations tomeet their own needs. The main features ofthe plan include reducing total mobility;increasing the share of rail; promoting public
Table 2: Modal spilt for freight transport, based on weight carried (1992)*
Country Road Rail Inland navigation
Belgium 70.0% 10.9% 19.1%France 87.8% 8.5% 3.7%Germany 78.7% 11.0% 10.3%The Netherlands 63.7% 2.5% 33.8%United Kingdom 91.7% 8.0% 0.3%
*National and international transport, excluding transit.Source: Ministry of Transport, 1996a
Table 1: Modal split for passenger transport, based on passenger kilometres (1992)*
Country Car/van Bus/tram/metro Rail
Belgium1 86.8% 8.1% 5.1%France 86.5% 5.7% 7.8%Germany 84.0% 9.4% 6.6%The Netherlands 83.4% 8.2% 8.4%United Kingdom 87.8% 6.5% 5.7%
1 1991 estimates. *Excluding cycling and walking within national borders. Source: Ministry of Transport, 1996a
Haq & Bolhuis: Dutch TransportPolicy: From Rhetoric to Reality.
World Transport Policy & Practice4/1 [1998] 4 - 8
[ 6 ]
2% of all vehicles on a particular road duringa working day should be subject to delays intraffic. Delays are defined as slow drivingtraffic or traffic where there is littlemovement. The indicators used to measureprogress towards these targets are that part ofthe main road where the chance ofcongestion is more than 2% and 5%. Thesenorms are not being achieved on a largenumber of roads and at present the SVV2target will not be met.
For public transport the price differentialbetween public transport and the (private)motor vehicle should be in favour of publictransport. The cost of public transport ispresently higher than the cost of usingprivate transport and it is unclear whetherthe price differential in the future can beimproved to the advantage of publictransport.
Environmental protectionEnvironmental targets include a 20%reduction in emissions of Nitrogen oxides(NOx) and hydrocarbon (HCs) from roadtransport by 1995 and a 75% reduction by2010, compared to 1986. The target forCarbon dioxide (CO 2) emissions from roadtraffic is to stabilise emissions at 1989/90levels by 1995 and reduce emissions by 10%by 2010.
Provisional figures for NOx emissions fromroad traffic suggest that the 1995 target of a20% reduction will not be met. In fact, anincrease of 10 index points past this target isexpected. The main contribution to thereduction of NO x emissions has been theincrease in the use of catalytic converters.However, any benefits derived from thistechnical fix have been offset by an increasein the number of kilometres travelled. Whilethe NO x emissions from passenger transporthave been decreasing, the growth in vehiclekilometres within the freight sector hasincreased NOx emissions.
A fall in the emissions of hydrocarbonshas enabled the 1995 target to be met earlierthan expected, in 1991. The maincontribution to the reduction in theemissions of hydrocarbons has occurred forboth passenger and freight transport with thegreatest reduction seen in passengertransport.
After an initial stabilisation, Carbondioxide emissions from motor vehicles havebegun to rise. The 1995 target has not beenmet and a further 10% rise past this target isexpected.
Freight transport has been responsible fora large proportion of the increase in Carbon
dioxide emissions when compared topassenger transport. The emission of CO 2
from freight transport has increased by 39%in the period 1986-1993 compared to anincrease of 15.6% from personal cartransport.
The target for noise emissions is tomaintain the number of main roads withnoise levels more that 50 dB(A) at 1986levels. There has been a 9% increase in thenumber of roads exposed to noise levels ofmore than 50 dB(A). However, since 1992 thenumber has stabilised. It is expected,therefore, that progress is being made in thedirection of this target.
Freight t ransport
A number of targets have been directed atfreight transport and have dealt with theefficiency and the movement of freight byroad and water. One target aims to limit thegrowth in freight kilometres by road to 40%by the year 2010. Although progress has bemade towards this target, it is expected thatwith an increase in economic growth inEurope, more freight kilometres will betravelled and existing policy will not enablethe target to be reached.
The development of railways in theNetherlands is being implemented asenvisaged. By 2010 freight by rail is expectedto rise to 50 billion tonnes per year. Asignificant rise in the amount of freighttransported by rail occurred in 1994 and thiscontinued into 1995. This increase in railfreight will enable the intermediate target, totransport 20 million tonnes by rail by theyear 2000, to be reached after a re-organisation of the Dutch Railways CargoCompany. However, it is still unclearwhether the 2010 target will be met.
The target for freight transport is toincrease inland navigation to 370 milliontonnes by 2010. Since 1990 the amount offreight transported by inland navigation hasdeclined and a return to 1986 levels can onlybe reached in 1998. It is expected that thistarget will not be achieved.
From rhetoric to reality
The rhetoric of Dutch transport policy forsome factors has become reality. Theevaluation of Dutch transport policy hasshown that out of the total 36 targets, 18targets will be or are being met, 9 will not beor are not being met and for 7 targets it is notclear whether the target will be met or not.For 2 targets data are lacking and therefore it
Haq & Bolhuis: Dutch TransportPolicy: From Rhetoric to Reality.
World Transport Policy & Practice4/1 [1998] 4 - 8

[ 7 ]
is not possible to come to a conclusion(Ministry of Transport, 1996b).
The extent to which all the targets will bereached and maintained will be dependenton the implementation of policy measures,monitoring programmes and the annualevaluation reports. Targets which have beenmet or will be met inc lude the target toreduce emissions of hydrocarbons and thenoise impact from roads, and the targets toincrease the use of bicycles and publictransport. Among those not expected to bemet are the targets to reduce the emissions ofNOx and CO2, and the targets to reduce thegrowth of vehicle kilometres travelled by carand freight transport.
The setting of national targets for trafficand transport seem not to have restricted theDutch continuing with infrastructuredevelopments such as the extension ofSchiphol airport and the planned expansionof the A2 in the Amsterdam-Utrecht corridor.Table 3 shows that after France, theNetherlands had one of the highest increasesin road length over the period 1985-1993.This type of infrastructural expansionaccommodates and encourages greatermobility which ultimately leads to greateremissions of pollutants.
The freight sector plays an important role
out by the plan as it considered that thiswould jeopardise the competitive position ofthe Dutch freight sector. Any action to reducethe volume of freight traffic would need to betaken at a European level in order to avoidforeign freight vehicles replacing Dutchvehicles. The NMP2 outlined the need totake a pro-active role within the EuropeanUnion to promote greater integration ofenvironmental, transport, planning,industrial and technology policies. At thenational level the Government will work incollaboration with the freight sector to makea greater effort to achieve a more efficient,cleaner and quieter vehicle fleet; to changethe model spilt in favour of rail and inlandwaterways; to increase transport efficiencyand to improve driver behaviour (Ministry ofEnvironment, 1994).
Concl u s i on
The Dutch have outlined their commitmentto developing a more sustainabletransportation system in a number of keynational policy documents. These haveincluded a range of measures to reduce theimpact of transport on the environment andto achieve a more balanced modal split. Adistinct policy framework has beendeveloped where transport, environmentaland physical planning policies have been co-ordinated and integrated. These policies haveattempted to address each aspect of thetransport problem with measures to reducemobility, e.g. via physical planning policy,improving accessibility and maintainingenvironmental quality. The setting of explicitobjectives has given a clear direction topolicy, with commitment being further statedin specific targets. The annual evaluationreport of the transport plan shows that forsome policy areas the rhetoric and policy hasbecome reality, for targets have been met orprogress is being made in the direction of thetargets.
The evaluation report highlights theproblems in achieving targets related tofreight transport and the need to take furtheraction. The main problem that the Dutch faceconcerns maintaining their position as atransport and distribution country andprotecting the quality of the environment.The development of the Single EuropeanMarket is predicted to increase thetransportation of f reight over wide distances(European Commission, 1990) and, if presenttrends continue, growth in freight transportwill pose significant problems for the Dutchenvironment. The growth in freight vehicle
Haq & Bolhuis: Dutch TransportPolicy: From Rhetoric to Reality.
World Transport Policy & Practice4/1 [1998] 4 - 8
Table 3: Total increase in road length (1985-1993)
Country Increase
Belgium +5.7%France +17.1%Germany1 +2.7%The Netherlands +8.9%United Kingdom +4.2%
1 Only the federal states in former West Germany. Source: Ministry of Transport, 1996a
in the Dutch economy and it is this sectorwhere further action needs to be taken aseconomic activity increases within the SingleEuropean Market. The target to reduce freighttransportation by road will not be met withexisting policy. Although there has been anincrease in the amount of freight transportedby rail, the amount of freight by inlandnavigation has declined. The freight sector isresponsible for the increasing amounts ofNitrogen oxide and Carbon dioxideemissions.
The Second National EnvironmentalPolicy Plan (NMP2) was published in 1994.The plan highlighted the difficulties whichwere being encountered in achieving thetargets for the freight sector with existingpolicy. The tightening of existing policy tocontrol the volume of freight traffic was ruled

[ 8 ]
kilometres means that air quality targets forCarbon dioxide and Nitrogen oxide emissionswill not be met. The Dutch will therefore berequired to implement stricter measures,which may mean more fundamental changesif all 36 targets are to be met. Theintroduction of stricter measures may requirecertain transport developments (which haveeconomic benefits) to be abandoned. The
Haq & Bolhuis: Dutch TransportPolicy: From Rhetoric to Reality.
World Transport Policy & Practice4/1 [1998] 4 - 8
freight sector is an area in which the Dutchwill need to prove their true commitment tothe environment. The extent to which theDutch will be willing to achieve all policytargets will depend on the extent to whichthey are willing to put environmentalinterests above economic interests, in orderto achieve a sustainable transport system.
Commission of the European Communities (1990)1992 , th e E nvironmental Dimension Task ForceReport on the E nvironment and the InternalMarket. CEC, Brussels.
Haq, G. (1997) Towards Sustainable T ransportPlanning: A comparison between B ritain and theNether lands. Avebury Press, Aldershot.
Ministry of Housing, Spatial Planning and theEnvironment (1989) The National EnvironmentalPolicy Plan. The Hague, Netherlands.
Ministry of Housing, Spatial Planning and theEnvironment (1990) The National EnvironmentalPolicy Plan Plus. The Hague.
Ministry of Housing, Spatial Planning andEnvironment (1994) The Second National
Environmental Policy Plan. The Hague.Ministry of Transport, Public Works and Water
Management (1992a ) The Second TransportStructure Plan. The Hague.
Ministry of Transport, Public Works and WaterManagement (1992b) Bicycles Firs t: The BicycleMaster Plan. The Hague.
Ministry of Transport, Public Works and WaterManagement (1996a) An InternationalComparative Study on Infrastructure. SduPublishers, The Hague.
Ministry of Transport, Public Works and WaterManagement (1996b) Beleidse f fectmeting Verkeeren Vervoer : B eleidsef fectrapportage 1995 . TheHague.
R e fe r e n ce s

[ 9 ]
by a person in a certain period of time.Accessibility can therefore be seen assomething broader than mobility itself(Moseley et al., 1977), as the mobility to haveaccess to desired destinations (Portugalli,1980) .
Efficiency relates to the ease to usetransport modes and can be translated bysome conditions as the time to have access tothe vehicle and the speed of travelling. Thequality of the overall travelling conditionwill also be a part of the accessibility quality.
Safety refers to the probability of gettinginvolved in a accident and the nature of itsconsequences. Safety depends on people(age, experience) and vehicle characteristics(size, weight, body structure) as well asuser’s behaviour (path, speed), highwayconditions (pavement, signing) andenvironmental conditions (pattern ofconflicts ).
Environmental quality relates mainly tothe quality of air and to the circulationenvironment. It depends on the level ofconcentration of pollutants such as carbonmonoxide and particulate matter, and also onthe quality of the living space, as translatedby the compatibility between passing trafficand the use of the streets by residents andworkers.
The distribution of these fivecharacteristics among people is highlyskewed in urban areas of developingcountries. Social and economic, individualand family conditions, along withcharacteristics of land use and transportsupply lead to different forms of using thespace, which in turn lead to differentpatterns of transport quality. Actualconditions can then be related to individualcharacteristics and behaviour, to policydecisions concerning urban and transportinfrastructure and to social and economiccharacteristics of every society.
A subsequent question relates to transportexternalities. Externalities can be broadlydefined as those effects impacting on otherswithout compensation. In a more rigorous
Urban Transport and Equity: the case of São Paulo
Eduardo A. VasconcellosAssociação Nacional dos Transportes Públicos - ANTPRua Augusta 1626, 01304-902 São Paulo, BrazilFax: 55 11 2538095 Email: [email protected]
The currency used is th eU.S.$ Abs t r a ct
Urban transport provision, accident rates andaccessibility in São Paulo variestremendously with income, gender and age.Sustainable transport modes are marginalisedand high externalities are borne by society. Acomplete overhaul and reassessment ofpriorities is required to achieve equity intransport.
K e yw ord s
São Paulo, access, mobility, equity.
Intr oduct i on
TRANSPORT conditions vary remarkablyamong people from different social groupsand classes, depending on several social,cultural, economic and politicalcharacteristics. In developing countries,profound differences among people maketransport conditions even more disparate.
Urban transport conditions may beanalysed in many ways. I propose that thebest way to approach the problem is askingkey questions about equity and transport:• how accessibility is distributed in space?• how people, social groups and classes may
use the city?• which are the relative conditions
concerning efficiency, safety andenvironmental quality?
• who produces and who suffers the effectsof transport externalities?
The understanding of accessibility requiresfirst an analysis of personal mobility. By thestrict technical point of view, mobility isrepresented by the quantity of trips made bya person, which is related to characteristicssuch as gender, age and income. Althoughrelevant, it is insufficient, once it does nottake into account the spatial and timeconstraints of activities (Hägerstrand, 1987).In this respect, the broader concept ofaccessibility can be used, as the quantity anddiversity of destinations that can be reached
Vasconcellos: Urban Transportand Equity: the case of São PauloWorld Transport Policy & Practice4/1 [1998] 9 - 20
[ 10 ]
definition, external effects can be said tooccur when an actor or receptor utilityfunction “contains a real variable whoseactual value depends on the behaviour ofanother actor (the supplier), who does nottake these effects of his behaviour intoaccount in his decision making process”(Verhoef, 1994, pp. 274). Most studies dealwith three main externalities - congestion,pollution and accidents - and some includeother social, less tangible effects. In the caseof congestion, the direct effect is extra traveltime, as caused by automobile drivers withrespect to other drivers, between them andbuses and between motorised vehicles andpedestrians. In the case of developingcountries - as will be analysed ahead - one ofthe most severe effects is that caused by theautomobiles on bus travel times. Withaccidents, the main effect is injury, sufferingand/or death. Main externalities occurbetween motorised vehicles and pedestrians -especially between automobiles andpedestrians - with consequences varyingaccording to the composition of traffic andaverage speed of vehicles. With pollution,the main effect is health damage to people.Externalities occur between those conductingmotorised vehicles and all people using thetraffic system.
Less tangible effects can also be analysed,as with the organisation of the circulationspace and its correspondent impacts onsocial relations. Traffic can deeply affectthem, as people are forced to change theirbehaviour to adapt to new conditions(Appleyard, 1981). For practical reasons, thepaper considers only travel time, pollutionand accidents.
The task is to analyse transport and trafficdata to verify how these conditions aredistributed and relate conclusions tosociety’s characteristics. One of the best waysof making such analysis is to studyhousehold surveys, explore socialcharacteristics, and examine travel and spacebudget figures. The technique intends toreplace or complement the availablemethodologies for trip behaviour, basedsolely on the analysis of individual trips,according to the traditional four-stepmodelling process. Few studies are availablefor developing countries’ conditions (Rothand Zahavi, 1981; Dimitriou and Banjo,1983) and this analysis of São Paulo intendsto fulfil part of the gap in the availableinformation. The study also intends tocontribute to a sociological and geographicalapproach to the urban transport problem, as atheoretical development in the field of
activity analysis (Fox, 1995). It exploresgeneral travel patterns and has no statisticalpurposes.
Social analysi s o f t ransportcond i t i ons
The use of household survey data for socialpurposes requires the adoption of indicatorsother than the traditional ones. Theseindicators reveal some important features oftransportation, especially in relation to thesocial and economic characteristics of usersand the distribution of accessibility. This isvery important in developing countries,where transport conditions vary widelyamong social groups. Several indicatorswhich may be derived from householdsurvey data are proposed below:• Mobility: refers to the number of trips
made by a person, which is related topersonal (age, gender, income, level ofscholarship, placement in the job market)and family characteristics (number ofpeople, income, number of automobiles);the corresponding (opposite) indicator isimmobility, expressed as the percentage ofpeople not making trips and their relevantcharacteristics.
• Accessibility: the possibility of arriving atdesired destinations, which is related totheir spatial and time characteristics (e.g.,hours of operation). Accessibility may alsobe represented by total travel timebetween origin and destination, usingsimple or generalised cost concepts oftravel time.
• Diversity: the quality of destinations thatmay be reached in a period of time;reflects the lifestyle as well as actualaccessibility in the face of economic andspatial constraints.
• Productivity: the number of activities/destinations that may be reached in aperiod of time, ref lecting the averagespeed of movement.
• Cost: monetary and/or time costs impliedin using transport modes.
• Space consumption: space used by aperson while travelling, reflecting theconsumption of a public asset (street).
• Safety: relative danger while using streets,according to the role played in traffic.
• Environmental quality: exposure (andcontribution) to air pollution whiletravelling.
• Comfort: average space available insidethe vehicles used to travel.
Vasconcellos: Urban Transportand Equity: the case of São Paulo
World Transport Policy & Practice4/1 [1998] 9 - 20
[ 11 ]
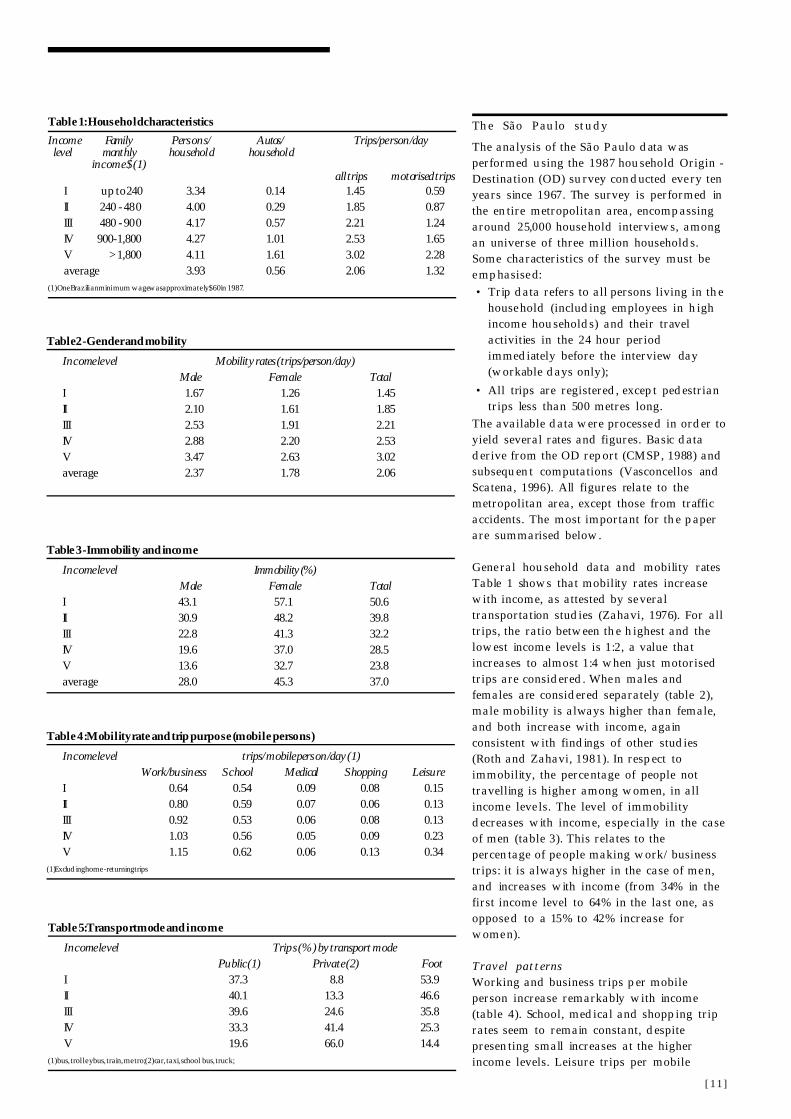
Table 1: Household characteristics
Income Family Persons/ Autos/ Trips/person/daylevel monthly household household
income $ (1)all trips motorised trips
I up to 240 3.34 0.14 1.45 0.59II 240 - 480 4.00 0.29 1.85 0.87III 480 - 900 4.17 0.57 2.21 1.24IV 900-1,800 4.27 1.01 2.53 1.65V > 1,800 4.11 1.61 3.02 2.28average 3.93 0.56 2.06 1.32
(1) One Brazilian minimum wage was approximately $60 in 1987.
Table 5: Transport mode and income
Income level Trips (%) by transport modePublic (1) Private (2) Foot
I 37.3 8.8 53.9II 40.1 13.3 46.6III 39.6 24.6 35.8IV 33.3 41.4 25.3V 19.6 66.0 14.4
(1) bus, trolleybus, train, metro; (2) car, taxi, school bus, truck;
The São Paulo study
The analysis of the São Paulo data wasperformed using the 1987 household Origin -Destination (OD) survey conducted every tenyears since 1967. The survey is performed inthe entire metropolitan area, encompassingaround 25,000 household interviews, amongan universe of three million households.Some characteristics of the survey must beemphasised:• Trip data refers to all persons living in the
household (including employees in highincome households) and their travelactivities in the 24 hour periodimmediately before the interview day(workable days only);
• All trips are registered, except pedestriantrips less than 500 metres long.
The available data were processed in order toyield several rates and figures. Basic dataderive from the OD report (CMSP, 1988) andsubsequent computations (Vasconcellos andScatena, 1996). All figures relate to themetropolitan area, except those from trafficaccidents. The most important for the paperare summarised below.
General household data and mobility ratesTable 1 shows that mobility rates increasewith income, as attested by severaltransportation studies (Zahavi, 1976). For alltrips, the ratio between the highest and thelowest income levels is 1:2, a value thatincreases to almost 1:4 when just motorisedtrips are considered. When males andfemales are considered separately (table 2),male mobility is always higher than female,and both increase with income, againconsistent with findings of other studies(Roth and Zahavi, 1981). In respect toimmobility, the percentage of people nottravelling is higher among women, in allincome levels. The level of immobilitydecreases with income, especially in the caseof men (table 3). This relates to thepercentage of people making work/businesstrips: it is always higher in the case of men,and increases with income (from 34% in thefirst income level to 64% in the last one, asopposed to a 15% to 42% increase forwomen).
Travel pat ternsWorking and business trips per mobileperson increase remarkably with income(table 4). School, medical and shopping triprates seem to remain constant, despitepresenting small increases at the higherincome levels. Leisure trips per mobile
Table 4 : Mobility rate and trip purpose (mobile persons)
Income level trips/mobile person/day (1)Work/business School Medical Shopping Leisure
I 0.64 0.54 0.09 0.08 0.15II 0.80 0.59 0.07 0.06 0.13III 0.92 0.53 0.06 0.08 0.13IV 1.03 0.56 0.05 0.09 0.23V 1.15 0.62 0.06 0.13 0.34
(1) Excluding home-returning trips
Table 3 - Immobility and income
Income level Immobility (%)Male Female Total
I 43.1 57.1 50.6II 30.9 48.2 39.8III 22.8 41.3 32.2IV 19.6 37.0 28.5V 13.6 32.7 23.8average 28.0 45.3 37.0
Table 2 - Gender and mobility
Income level Mobility rates (trips/person/day)Male Female Total
I 1.67 1.26 1.45II 2.10 1.61 1.85III 2.53 1.91 2.21IV 2.88 2.20 2.53V 3.47 2.63 3.02average 2.37 1.78 2.06

[ 12 ]
person increase sharply in the two upperincome levels.
Trip modeTrip mode varies remarkably with income, asstressed in many transportation studies.Public transport and foot trips are dominantin low income households, while privatetransport dominates in level IV and V. Inaddition, motorised trips (public and private)are dominant in all levels but level I (table 5).
Time and space budgetsTime consumed travelling is shown in table6. Total average time per person varies withincome, which is different from other studies(Zahavi, 1976; Goodwin, 1981). Total traveltime per mobile person presents instead lowvariability.
In respect to space budgets, as the ODsurvey did not include distances, figures formotorised trips were estimated usingcoordinates, as areal values between zonecentroids. For pedestrians trips, distanceswere estimated using declared walking timesand considering an average pedestrian speedof 4 km/h. Table 7 shows first that spaceconsumed by a household presents markedchanges with income. Part of these changescould be explained by the different numberof persons per household (it is higher at thehigher income levels - see table 1), but it isalso explained by a higher activity level:space consumed per person increasessteadily with income. Space consumed bymobile people presents less pronouncedincreases. Finally, space consumed per tripseems to be invariant, around 5 km per trip.However, when just motorised trips areconsidered, distances decrease as incomeincreases, as figures are influenced by thehigh proportion of pedestrian trips in thelowest income levels.
Space consumption by mode wascomputed for public transport, privatetransport and foot. In the first two cases,distances consumed inside the vehicle wereestimated by subtracting estimated walkingdistances from the areal total distances.Space consumption by mode presents similarpatterns with respect to trip modedistribution (see table 5) - public modes andfoot trips being dominant in low incomelevels - but with different weights, related tothe introduction of distance as a measure ofconsumption (table 8). Hence, in level I,76.4% of the space is consumed throughmotorised public transport modes, while inlevel V, 68.8% of the space consumption ismade by private transport modes. Foot trips
correspond to short distances in all incomelevels, however average values decrease asincome increases.
A very important observation is that spaceconsumption with public means ceases to bedominant somewhere between levels IV andV. Therefore, roughly speaking, levels IV andV are the social sectors for whom automobiletransport is essential.
Travel speedsTotal travel time between origin anddestination varies markedly among motorisedmodes; the automobile being the fastestmode, due both to its higher speed andlonger distances corresponding to part ofpublic transport trips. Access time tovehicles also shows remarkable differences,due to the availability of parking space forautomobiles and the need to walk longerdistances to get to transit stops (table 9).
By combining the figures for space andtime consumption rates for mobile persons,one can arrive at the average daily speeds.The computation shows that while peoplefrom the lowest income level travels at 7.5km/h (including time walking and waiting),people from the highest income level achievespeeds of 11.4 km/h, a value 53% higher.Despite this large difference, door-to-doorspeed of auto users is still low, due to thetime consumed parking and walking. That iswhy Ivan Illich (Illich, 1974) reminded usthat today’s automotive technology is nobetter than the bicycle!
The same pattern holds when just work/business trips are considered, that is, higherincome people travel much faster than lowincome people (table 10). In this case, it hasto be emphasised that correspondingdistances decrease with income, withmaximum differences around 20%. Whenpublic transport is considered separately,income also plays an important role: peoplefrom the poorest households spend 50%more time walking to the transit stop thanthose from the wealthier households. Thefinal effect of all transport-related difficultiesfor captive public transport users is that along journey outside home is inevitable. Thisis aggravated in peripheral areas: in 1985, inthe São Paulo eastern zone, 78% of peoplespent more than 12 hours outside home tocope with work and travel times (Pacheco,1985) .
ComfortTo this inferior initial condition regardingoverall accessibility, one has to add the busloading conditions, which often hinders
Vasconcellos: Urban Transportand Equity: the case of São Paulo
World Transport Policy & Practice4/1 [1998] 9 - 20

[ 13 ]
people from boarding at the desired time andimposes extremely uncomfortable trips.Overcrowded vehicles are a daily reality inalmost every developing country (Dimitriou,1990; U.N., 1989). In São Paulo, as in otherlarge Brazilian cities, bus services areplanned assuming an occupancy rate of 7passengers/m2 in the peak hour, whichfrequently leads to highly uncomfortableconditions: all private companies providingbus transport in 1984 had a large percentageof people travelling under unacceptableconditions in the peak hour. Somecompanies had up to 84% of the passengersin this condition. Average conditions havenot changed too much so far.
Travel costsThe number of daily trips for every mode, inevery income level, was multiplied by thefare of that mode. For simplifying purposes,public transport trips were taken as if allwere made by bus (the dominant mode).Daily expenses were converted to monthlyfigures considering that there are 26equivalent days in the month (22 days at100% expense, 4 days - Saturdays - at the70% expense-level and 4 days - Sundays - atthe 30% expense-level). For cars, a $0.25 costper kilometre was assumed, considering thatthe average car travels 20,000 km per year,gasoline price is $0.80 per litre, energyperformance is 7 km/litre, depreciation is$120 per month and maintenance is $75 permonth. In this case, it is important toremember that figures reflect just the urbancosts of using the automobile and not thoserelated to inter-city travel which maycontribute to a large portion of total costs. Itis important to note that figures reflect 1987costs. These differ significantly from currentconditions which followed long lastinginflationary processes, the implementation ofseveral economic plans and considerablechanges to relative prices in the economy.
The net amount of money increasesremarkably with income, especially when theautomobile becomes an important mode oftransportation (table 11). However, theparticipation of total expenses with respectto income shows an opposite tendency.Among those mostly dependent on publictransport, expenses with this mode average23% of monthly income at the lower incomelevel and 16% at the second level up. Thesepercentages are much higher than the 6%limit established by Brazilian lawsconcerning the ‘travel voucher’ (a specialpublic transport ticket purchased by theemployer and delivered to the employee: the
Table 6 - Time budget by mode and income
Income level Time budget (minutes/person/day) Mobile personsPublic Private Foot Total total
I 35.6 3.5 12.9 52.0 105.3II 46.9 6.3 13.1 66.2 110.0III 52.0 12.8 11.3 76.1 112.2IV 46.5 24.2 8.4 79.2 110.7V 29.0 46.5 5.4 80.9 106.1
Table 11: Expenses with transportation as percentage of household income.
Income level Monthly costs/house ($) % of house monthly incomepublic private total public private total
I 14.0 14.0 28.0 11.7 11.7 23.4II 23.1 33.3 56.4 6.4 9.3 15.7III 28.6 75.9 104.5 4.1 11.0 15.1IV 28.1 150.0 178.1 2.1 11.1 13.3V 19.0 283.7 302.7 0.8 12.1 12.9
Table 7: Space budgets and average trip distances
Income level General rateskm/house km/person km/mobile person km/trip
all motorI 20.7 6.5 13.1 4.3 8.4II 34.0 8.8 14.7 4.5 8.1III 45.8 11.2 16.6 5.0 7.4IV 54.3 12.8 18.0 5.0 6.5V 62.7 17.2 20.2 5.1 5.8average 38.9 10.1 16.1 4.8 7.1
Table 8: Space consumption by mode (all persons)
Income level Space consumption (km/person/day)Public Private Foot Total
km % km % km % km
I 5.0 76.4 0.6 10.3 0.9 13.3 6.5II 6.6 75.6 1.3 14.5 0.9 9.9 8.8III 7.6 68.3 2.8 24.9 0.8 6.8 11.2IV 6.8 53.5 5.4 42.1 0.6 4.4 12.8V 5.0 28.9 11.8 68.8 0.4 2.3 17.2
Table 9: Access time and travel conditions for motorised transportation
Mode Access time (1) in minutes Travel time (2) in minutes
auto 2.7 24metro 15.5 33bus 12.8 57train 14.5 85
(1) walking (one-way); (2) from origin to destination;
Table 10: Average travel time to work/business trips.
Income level Travel time (1) in minutes
I 49.4II 45.7III 41.2IV 36.3V 29.0
1) one-way

[ 14 ]
em ployer is allowed to discount the costfrom the em ployee’s salary, up to a lim it of6%) .
Use of spaceThe collective use of space was estim atedusing actual distances by m ode - public,private and foot. The m otorised portion ofpublic transport and autom obile trips wereestim ated by subtracting the pedestrianisedportion of the trip, according to the traveltim e declared by respondents (andconsidering a walking speed of 4 km /h).
Table 12 shows that circulation space isappropriated m ainly through publictransport m odes (63%). Autom obiles areresponsible for about 30% of theconsum ption, while walking accounts for7%. This latter figure is underestim ated,because walking trips less than 500 m etrelong are not com puted.
As with other studies, the use of cars ishighly related to incom e (table 13). Table 13shows that the two upper incom e levelsaccount for 24.5% of population and 58% ofautom obile-consum ed space.
Finally, the use of space taking account ofthe area occupied by people m ay be derivedfrom the data. When linear distances aretranslated into physical areas occupied perperson, differences in space consum ptionappear clearly. Considering that autom obilespresent an occupancy rate of 1.5 and occupyabout 7 m 2, average consum ption is 4.6 m 2
per person. The sam e com putation for buspassengers yield an average daily value of 1.0m 2 per person (average daily bus occupancyof 30 people and static area of 30 m 2) and apeak-hour value of 0.6 m 2 per person(occupancy of 50 people). When distancesare taken into account, differences in spaceconsum ption are high (table 14).
In addition, space consum ption occursalso for parked autom obiles. Am ong the daily4.7 m illion parking operations in the city in1987, 1.5 m illion were free kerbside parking ,representing a direct consum ption of 11m illion m 2 (7 m 2 per vehicle). I f we considera conservative figure of an average two-hourparking tim e, the final free consum ptionreaches the 22 m illion m 2 x hour level.
Safety and environm ental issuesBrazil presents som e of the highest trafficaccident figures in the developing world(Vasconcellos, 1996). São Paulo is noexception, where m ore than 2,500 people dieeach year in traffic, m ost of them pedestrians(table 15). When total distances are takeninto account, relative accident risks appear
Table 12: Circulation space according to income and mode.
Income level Population (million) Space used by mode (million km/day)Public Private Foot Total
I 2.98 14.5 2.0 2.5 19.0II 4.05 26.7 5.3 3.5 35.5III 3.72 28.1 10.7 2.8 41.6IV 2.42 16.4 13.5 1.3 31.2V 1.07 4.7 11.6 0.4 16.7Total 14.24 90.4 43.1 10.5 144.0% 62.8 29.9 7.3 100.0
Table 13: Use of space by automobiles according to income.
Income level Population (%) Space used (%) with automobile
I 20.9 4.6II 28.4 12.2III 26.1 24.8IV 17.0 31.2V 7.5 26.9Total 100.0 100.0
Table 16: Use of transport modes and relative accident risk, RMSP, 1987.
Transport mode km/day (%) fatalities(%)1
Private 30 39Public2 63 1Foot3 7 60
1 assumes that values for the city of São Paulo may be appli ed to th e metropolitan area.2 bus occupant fatalities are not indicated by current statistics but are known to be very rare.3 considers only pedestrian trips longer than 500 metres.Source: CET (1992).
Table 15: Traffic accidents in São Paulo, 1991.
Type Vehicle occupants Pedestrians Total
Fatalities 1,094 1,621 2,715All injuries 44,591 15,102 59,693ratio (1) 1:41 1:9 1:22
(1) Fatalities/injured (severity rate). Source: CET (1992).
Table 14: Personal space consumption according to income and mode.
Income level km x m 2/person/day, per modepublic private total
I 2.9 3.2 6.1II 4.0 6.0 10.0III 4.6 13.3 17.9IV 4.0 25.8 29.8V 2.6 50.1 52.7
Table 17: Relative emissions of carbon monoxide per person, 1987.
Income level grams of CO/person/daytransport mode public transport private transport total
I 2.9 11.7 14.6II 4.0 21.7 25.7III 4.6 48.4 53.0IV 4.1 93.5 97.6V 2.6 182.0 184.6

[ 15 ]
very different according to the transportmode used: despite corresponding to 7% ofdaily kilometres, pedestrians account for60% of traffic fatalities (table 16).
When carbon monoxide emissions arecomputed for bus and automobile use,aggregate emissions present sharp differencesamong income levels (table 17).
Summary o f data
MobilityAs with most studies, there is a positiverelationship between income and mobility,with higher income levels presenting highermobility per person. Differences are veryhigh, despite social and economicdiscrepancies among social strata. Inaddition, males are more mobile thanfemales, and this is related to differentemployment rates according to gender and tothe division of tasks in the household.
Trip Purposes and ModesThere is a positive relationship betweenincome and diversity of trips, with highincome levels being involved in moreactivities other than work/schooling (e.g.leisure). Public transport use decreases, andprivate transport use increases remarkablywith income. Walking trips are present in allincome levels, more noticeably in lowerlevels. All conclusions are again consistentwith the previously mentioned studies.
Individual and Household Consumption ofTime and SpaceDaily travel time per person varies from 52minutes to 81 minutes, however they seem toremain constant around 75 to 80 minutes forincome classes III to V, when the use of theautomobile is already very important.Corresponding values per mobile personappears to be constant (about 110 minutes).
Space consumed daily by householdsincreases remarkably with income, from aminimum of 21 km to a maximum of 63 km(200% increase). Corresponding figures perperson present the same pattern, despitebeing less pronounced (165% increase).Figures per mobile person also increase withincome, but much less steadily, from aminimum of 13 km to a maximum of 20 km(54% increase). These sharp differencesreveal distinct strategies to use space,according to specific social and economicconditions faced by people. They can beassumed to reflect the profound socialdifferences inside Brazilian society.
Average distance per trip presents lowvariation, however when walking trips areexcluded, distances decrease as incomeincreases. Travel time for working tripsdecreases remarkably as income increases.
Hence, upper income people consumemuch more space than lower income people:while very poor households consume 6.5 kmper day per person (76% by publictransport), very rich households consume17.2 km per day per person (69% by car).This raises important equity concerns relatedto who pays and who benefits from roadinvestments.
Considering the use of the automobile toconsume space, levels IV and V are those forwhom most of the space is consumedprimarily by using cars. On a metropolitanscale, they account for almost 25% of people,which means that 75% of households stillrely mainly on public transport and walkingto consume most of the space.
Consequently, implicit overall speeds(door to door) also vary remarkably amongincome levels: while upper income sectors gofrom origins to destinations at an overallaverage speed around 11 km/h, lower incomesectors do so at 7.5 km/h.
CostsMonthly expenses with urban trips increasesharply with income, as a result both ofhigher mobility levels and the use of moreexpensive modes such as the automobile.However, the proportion of travel expensesin relation to household income decreases asincome increases (from 24% to 13%). At thetwo lowest income levels, for whom publictransport is essential, expenses with publicmodes far exceed the 6% limit implied inBrazilian laws concerning the provision oftravel vouchers by employers. This is relatedalso to the use of public modes byunemployed people and by people workingat the informal labour market (where suchlaws do not apply), and to travel purposesother than working.
Collective Use of SpaceThe circulation space is primarily consumed(linear distances) by using public transportmodes (63%). Automobile-consumed spaceaccounts for 30% of total consumption whilespace consumed by walking represents just7%. In a city where pedestrians account for60% of traffic fatalities (CET, 1992), thislatter figure attests the implicit violence inusing road space. When linear distances aretranslated into physical areas occupied perperson, sharp differences appear: high
Vasconcellos: Urban Transportand Equity: the case of São Paulo
World Transport Policy & Practice4/1 [1998] 9 - 20

[ 16 ]
income people use 8 times more street spacethan low income people, implying importantequity concerns.
Transport Conditions of the PoorWhen all data are taken into account, it ispossible to assess transport conditions facedby poor people in São Paulo. For thepurposes of this paper, the two lowestincome groups described in the above tables(income up to $480 in 1987) are considered‘poor’, (this corresponds to 49% of totalpopulation).
• Mobility: lower income people make halfthe number of trips compared to highincome people (all trips), and from four tothree times less if only motorised trips areconsidered. Males are more mobile (ashappens in all income groups);
• Immobility: persons not making outsidetrips correspond to more than 50% in thelowest income level (57% of the femalepopulation), as opposed to 24% in thehighest (33% of the female population);
• Travel purposes: the lower mobility of thepoor translates mainly into less work/business, shopping and leisure trips thanthose of the higher income strata;
• Transport modes: people from the pooresthouseholds use much more publictransport (with corresponding walkingtrips) than wealthier people;
• Time budgets: time devoted to travelamong the poor who make outside trips issimilar to that of all other people;however, when all persons in thehousehold are considered, correspondingtravel times are much lower than that ofhigher income groups, reflecting lessactivity and less people making outsidetrips;
• Speeds: people using public transportspend much more time getting to thevehicle and travelling through the streets.For work trips, people from the pooresthouseholds spend 70% more timetravelling than those of the higher incomehouseholds;
• Space budgets: people in lower incomehouseholds travel three times less lineardistances per day than those in higherincome households. Daily distances permobile person are 35% lower between thetwo income extremes. When average in-vehicle space is considered (according tothe specific t ransport mode used), the totaldaily roadway area consumed by thepoorest households is more than eighttimes smaller than that of the richest
households;• Distances and transport mode: distances
per motorised trip are 45% higher for thepoor, reflecting higher distances betweenhome and final destinations (mostly worksites). The poorest travel 76% of thedistances using public transport, while therichest travel 69% of the distances usingautomobiles;
• Expenses with transport: the poorestspend 23.4% of their income ontransportation, as opposed to 12.9% forthe richest;
• Safety: more than 60% of traffic fatalitiesare pedestrians. Considering that lowincome people walk much more than highincome people, it is possible to say thatthe minority using cars affect the majoritynot using them;
• Pollution: poor households throw into theatmosphere twelve times less carbonmonoxide per day than high incomehouseholds;
• Comfort: poor people face mostlyuncomfortable conditions, due to frequentovercrowding of buses and suburbantrains.
How current condit ions were created
Current conditions were created by theconjunction of policy and individualdecisions. The way the space is organisedand the conditions offered to use transportmodes influence individual choices. Forthose pertaining to low income groups,public transport becomes the single option.For those with better economic conditions,the decision to use automobiles intensivelyoccurs as a consequence of the relative easeof access to it, coupled to the relativedisadvantages of using public transport.
In developing countries in general - and inBrazil in particular - transport and trafficpolicies, coupled to economic and socialpolicies, have crystallised remarkabledifferences between those with and withoutaccess to private transport. Most decisionshad a common objective: to adapt space tothe use of the automobile for selected socialgroups. The incentive to the automobile,coupled to the maintenance of poorconditions for public transport, rendered theautomobile irreplaceable for middle classsectors (Vasconcellos, 1997a). Class divisionswere reinforced in the streets, as society wasdivided into two separate groups - thoserelying on public transport and thoseproviding for their private transport.
Current inequitable conditions were
Vasconcellos: Urban Transportand Equity: the case of São Paulo
World Transport Policy & Practice4/1 [1998] 9 - 20

[ 17 ]
generated through a series of policydecisions:
Infrastructure ProvisionThe dominance of the automobile wassupported by the myth that road investmentsare made in the public interest. Largeeconomic resources were applied in roadwayexpansion based on the myth that roadswould be evenly shared by all. However, themere provision of streets does not mean thatpeople will be transported: if publictransport is not made accessible for all, thenstreets are just private means of consumptionawarded to selected groups, but constructedand maintained with public resources. Thisis dramatically shown by the sharpdifferences in space consumption accordingto income (see tables 8 and 14). Often, themyth of roads as public assets isaccompanied by explicit condemnation oftransit subsidies as heretical and bycontinuous pressure to make public transportsystems survive on their own - which oftenimplies overcrowded buses and lowfrequency services - while the hiddensubsidies to automobiles remain untouched.
Access to Public TransportThe persistent poverty of most people,coupled to an often rigid market approach tothe supply of public transport, generated apermanent conflict between accessibility,fare level and business profitability. As aconsequence, supply is permanently subjectto instability (White, 1990; Figueroa, 1991)and spatial and time coverage are oftenlimited by the need to ensure profitableoperation, leading to long walking andwaiting times. Another effect is the tendencyto dilapidation of the fleet, with directimpacts on passenger comfort and safety aswell as on the availability of vehicles fordaily operation.
Access to Private TransportPrivate transport was made accessible toselected sectors - the new middle classescreated by the income concentration processwhich characterised Brazilian economicdevelopment. Access was facilitated throughbank credit and the organisation of vehicleconsortia, where people belonging to a grouppaid monthly instalments in order to have acar. The possession and use of theautomobile was also facilitated by extremelylow license and insurance taxes (about $100a year), plenty of free parking space onstreets and often low gasoline prices(currently, about $0.80 a litre). (Auto owners
also pay an annual property fee which variesregionally. In the state of São Paulo, thewealthiest in the country, the fee is about$300. Annual costs (for those who do pay thetaxes) can then reach the $400 level, which isabout 3% of the vehicle’s market value.)
Travel TimeAbusive consumption of street space byautomobile users was facilitated followingthe liberal concept of indiscriminate use ofprivate property. The mere possession of avehicle gave owners the right to use streets atwill, without any consideration about socialcosts and externalities. This overconsumptionoccurred both dynamically (circulating) andstatically (parked on public space) and wasdirectly supported by large resourcesdirected to improve overall traffic conditionsin the city (Vasconcellos 1997b). Meanwhile,few effective priority measures were appliedto bus operations, even though most kerbsidebus lanes implemented in the 1980s hadlittle effect on average speeds (CET, 1982).Even important bus corridors - like the SantoAmaro/9 de Julho convoy system - wereprogressively abandoned, losing most of theinitial benefits. Large resources were appliedto increase road capacity for automobiles,while leaving buses to their own fate,struggling for road space. As a consequence,buses continued to lose any reputation ofreliability, and their patronage.
AccidentsIn developing countries, contrary towidespread beliefs, accidents do not resultprimarily from lack of education, generaliseddisorder or bad vehicle maintenance. Theyresult mostly from the inherently dangerousenvironment which was generated by theappropriation of space to the needs ofautomobile users. The paving or creation ofgrid-pattern, wide streets and roads crossingdensely used pedestrian spaces, coupled todeep political differences among socialgroups and classes (which translates intodifferent was of using space) and to theabsence of ef fective enforcement and justice,rendered space in developing countries avery efficient accident-productionenvironment. As stated previously, mostfatalities are pedestrians. This is aggravatedby the contradiction between formal trafficeducation and actual conditions on streets,once disrespect for traffic laws and lack ofpunishment are the rule.
Air PollutionAs a result of both excessive use of
Vasconcellos: Urban Transportand Equity: the case of São Paulo
World Transport Policy & Practice4/1 [1998] 9 - 20

[ 18 ]
automobiles and automobile-generatedcongestion, emissions of air pollutants arehigh. In addition, automobile emissions for along time were uncontrolled, although legallimits introduced just ten years ago arestarting to produce results. Finally, control ofon-street emissions remains nonexistent,except for diesel trucks and buses (Cetesb,1994) which, because they emit the mostvisible pollution, easily attract public andmedia attention.
Policy Disco-ordinationMost agencies in charge of policiesinfluencing transport conditions actindependently, with loose hierarchical orlegal linkages. The problem is especiallysevere with respect to land use and itsimpacts on transport demand, and withrespect to the relationship between agenciesin charge of public transport and traffic. Inthe case of São Paulo, the disconnectionbetween these agencies helped to keep bustraffic at very low levels of service. At themetropolitan scale the problem is evenworse, once state and local authoritiesconflict on how to manage commondecisions.
The Crisis of the StateIn addition to these factors, the urbantransport problem has been aggravatedrecently by the state’s economic difficultiesand the corresponding attempt to eitherderegulate or privatise transport services. Atthe institutional side, the state seems to beleaving aside its primary planning role,relying on the supposed capability of theprivate sector to assume financial risks andplanning tasks. There is an implicitassumption that the market and the privatesector can replace the state in ensuringadequate transport services. On the economicside, the fiscal crisis hinders support toefficient public transport systems and todistributive social policies. Large transportinfrastructures, which rely on publicinvestment, are becoming less feasible andsubsidies to special groups are subjected toincreasing opposition. The crisis is alsorelated to the continued poverty of most ofthe population, which prevents people fromhaving access to convenient public transport.Both problems are sustaining an ongoingcrisis in the supply of adequate publictransport modes and consequently have beensupporting transport deregulation andprivatisation proposals. However, transportconditions continue to be inadequate.
Alternat ive actions
Although some problems lie beyond thescope of transport policies (e.g., persistentpoverty), many actions can support thecreation of a more equitable and efficientspace. The inequities and externalities whichoccur in São Paulo, as well as in most largecities of the developing world, can be alteredonly if the use of space is politicallycontested and hence urban, transport andtraffic policies are changed fundamentally.Despite the persistence of unbalanced powerrelations within society, there is a clearemergence of movements intended topromote real changes, mostly based on theexpectation about improving quality of life.
The reorganisation of urban transport hasto be pursued to ensure a more equitable,safe, convenient and comfortableappropriation of space. The basis to redefinethe use of the street shall be the commitmentto preserve safety, improve quality of life andensure proper operating conditions for publicand non-motorised transport modes. Thecentral point for this reorganisation is thequestioning of abuse by the automobile andthe consequent imposition of new criteria fordividing public space. This does not mean toabolish automobile technology but rather tocontrol it within acceptable limits related toconcerns about equity and quality of life.
Within the large set of alternative actions,the most important are those that wouldreorganise space in order to respect the rightsof the majority, as follows:
Infrastructure ProvisionPublic resources have to be used to providecirculation space for the majority. Thisrequires priority allocation to publictransport and pedestrian traffic. All-purposemajor roads are often needed in fast growingenvironments like those of developingcountries. However they should be providedas part of comprehensive road planningefforts that respect the needs of the majorityto efficient transport, especially public andnon-motorised transportation. Allinvestments on roads should be carefullyanalysed to determine the real beneficiaries.Part of the resources that seem to be lackingfor public transport will appear if roadinvestments are scrutinised.
The Use of the StreetThe highway and street systems arecollective assets, to be shared by all. No onehas the right to circulate at will, regardless ofothers’ needs and interests. No one can be
Vasconcellos: Urban Transportand Equity: the case of São Paulo
World Transport Policy & Practice4/1 [1998] 9 - 20

[ 19 ]
allowed to misuse this collective asset,simply because of an alleged need to haveaccess to motorised transportation. The useof these systems shall therefore be definedaccording to priorities given to the mostnumerous and vulnerable roles, which indeveloping countries are indisputably thepedestrian, the cyclist and the publictransport passenger. This need not entaileliminating private transport, but will requiresubmitting it to other’s needs and interests.Direct restrictions can be raised throughtraffic management measures and indirectrestrictions may be raised by compensatingcosts and externalities imposed byautomobile owners to society througheconomic or f iscal measures, as in the case ofparking fees, license taxes and road pricing.However, it has to be acknowledged thatthese restrictions, if properly applied, willinevitably have dramatic consequences forthose relying on private transport.
Priority to Public TransportTransport provision should be altered toensure physical and operational conditionsso that public transport systems can providehigh levels of accessibility and achieve theirmaximum potential (e.g., maximum 5minutes walking and waiting times, and busspeeds about 20 km/h across the entirenetwork). This requires reorganisation oflines and bus stops, elimination of physicalbarriers, provision of special signs andsignals and tough restrictions on illegalparking and loading and unloading activities.Public transport and traffic departmentsshould be united and daily traffic operationshould be organised around pedestrian andpublic transport needs, rather than solelyprivate transport needs.
SafetyThe complexity of the problem requires thatthe issue receive priority attention, as themost important environmentally relatedaspect of transport in developing countries(Vasconcellos, 1997c). A series of measuresmay be adopted (Goldsmith andVasconcellos, 1995):• reorganising enforcement by training a
specialised force, changing theenforcement logistics and providingappropriate equipment. Enforcementactions should be directed mainly toaggressions to pedestrians, speeding,drinking and driving, and poormaintenance of vehicles;
• reorganising the judicial system to ensurethe punishment of grave traffic offences by
speeding up sentencing procedures;• reorganising traffic education to supersede
the contradiction between theory andpractice which renders educationnonsensical. Education will be sociallyvaluable only when the circulation spaceis capable of mirroring the priority givenin the law to the most vulnerable roles.Education will be effective andmeaningful only when people feel thatproper behaviour will be rewarded andimproper behaviour will be punished;
• protect pedestrians from automobilesthrough a series of physical andoperational measures, mainly those minorphysical adaptations to increase overallsafety conditions: the building andenlargement of sidewalks, the narrowingof intersection approaches close topedestrian areas, the lighting of pedestriancrosswalks, the building of intermediateislands in large crosswalks, etc.;
• protect collective living areas from unduetraffic by reorganising circulation. Thiscan be accomplished initially at theneighbourhood level through circulationplans discussed with local communities.These plans may be highly successful ifthey manage to profit from the recent,strong commitment to quality of lifeamong the middle class;
• control automobile speed in the entirestreet system, either through directenforcement or physical barriers andspeed deterrents.
Air PollutionAir pollution problems can be minimised byreducing total automobile emissions,increasing the share of public transport ontotal trips and reducing the need formotorised transport. In the first case, majorefforts have to be made to control vehicleemissions, through legal and technologicalmeasures and the organisation of periodicvehicle inspections. In the second and thirdcases, improvements may be made bycombining several measures described above.
Concl u s i on
The analysis of distributive and equity issuesin urban ground transportation requires aproper understanding of actual transportconditions faced by people and especially ofthe differences found among them. Thesedifferences are related primarily toindividual characteristics, such as age,income, gender and level of formaleducation. However, they also derive from
Vasconcellos: Urban Transportand Equity: the case of São Paulo
World Transport Policy & Practice4/1 [1998] 9 - 20

[ 20 ]
the way urban and transport policies aredesigned and implemented.
The analysis of current conditions indeveloping countries show that accessibilityis deeply biased towards those with access toprivate transport (who enjoy access to amuch larger diversity of destinations andactivities), as compared to low incomepeople. Conditions to use space are alsohighly biased, while safety, comfort andconvenience vary remarkably between thosewith and without access to private transport.
Three important conclusions arise:• First, poor transportation conditions are
mostly class-based: few people withaccess to cars impose grave impacts onothers, such as delay to transit users, fataltraffic accidents and air pollution.
• Second, these effects are not compensatedand remain as externalities created by theunrestricted use of the automobile basedon the supposed right to mobility andfreedom.
• Third, current conditions also derive from
two related approaches to transportationinfrastructure supply: while automobileuse is supported by the myth of roadinvestment as a public interest, transitsubsidies are considered unacceptable.
Therefore, the actual possibilities of changerely on taking new approaches to equity anddistributive aspects of transportation supply.• First, a radical change in financing
transport infrastructures must be pursued:road investments should considerprimarily broad equity issues on who ispaying and who is benefiting from them.
• Second, the use of the street should beradically transformed, to ensure priority tothe most numerous and vulnerable roles.In developing countries, this meansprotecting pedestrians, cyclists and transitusers, while restricting automobile use.
• Third, major efforts are required toimprove safety for the most vulnerableroles and new legal and technologicalmeasures are needed to improveenvironmental quality.
Appleyard, D. (1981) Livable Streets University of CaliforniaPress, Berkeley, U.S.A.
Banjo, A.G. and Brown, P.J.B. (1983) “Time expenditure andtravel time variation in Nigeria: some empirical findings andhypothesis” in Carpenter and Jones, Recent advances in traveldemand analysis Gower, Aldershot, U.K., 192-211 .
Cia de Engenharia de Tráfego (1982) “Análise antes-depois defaixas exclusivas de ônibus” (internal report), CET, São Paulo.
____ (1985), “Avaliação do sistema de ônibus” (internal report),CET, São Paulo..
____ (1992) Acidentes de trânsito CET, São Paulo.Cetesb, (1994), Relatório da qualidade do ar no Estado de São
Paulo Cetesb, São Paulo.Cia do Metropolitano de São Paulo (1988) Pesquisa Origem -
Destino 1987 CMSP, São Paulo.Dimitriou, H.T. and Banjo, G.A. (eds.) (1990) Transport planning
for Third world cities Routledge, USA.Figueroa, O. (1991) “La crise de court terme des transports en
commun: l’experience de San Jose du Costa Rica” RechercheTransports Securite 31, 47-56.
Fox, M. (1995) “Transport planning and the human activityapproach” Journal of Transport Geography 3(2):105-116 .
Goldsmith, W. and Vasconcellos, E.A. (1995) “Distributive andequity issues and privatisation in ground transportation”Working paper 152, City and Regional Planning Department,Cornell University.
Goodwin, P.B. (1981) :The usefulness of travel budgets:Transportation Research A vol. 15, 97 -106.
Hägerstrand, T. (1987) “Human interaction and spatial mobility:retrospect and prospect” in Nijkamp, P. and Reichman S. (eds.),Transportation Planning in a changing world Gower/EuropeanScience Foundation, Netherlands.
Illich, I. (1974) Energy and equity Harper and Row, USA.
Moseley, M.J., Harman, R.G., Coles, O.B. and Spencer, M.B. (1977)Rural Transport and Accessibil ity University of East Anglia, UK.
Pacheco, R. (1985) “L’offre et l’utilization des transports collectifsa la peripherie de São Paulo” (unpublished thesis) Institutd’urbanisme de Paris, Universite de Paris XII.
Portugalli, J. (1980) “Distribution, Allocation, Social Structure andspatial form: elements of planning theory” Progress in Planning14(3 ).
Roth, G.J. and Zahavi, J. (1981) “Travel time budgets inDeveloping Countries” Transportation Research A vol. 15 , 87-95 .
United Nations (1989) Urban transport development, withparticular re ference to the developing countries U.N., New York.
Vasconcellos, E.A. (1996) “Reassessing traffic accidents indeveloping countries” Transport Policy 2(4) 263-269.
____ (1997a) “The demand for cars in developing countries”Transportation Research A 31(3), 245-258 .
____ (1997b) “The making of the middle class city: transportationpolicy in São Paulo” Environment and Planning A 29, 293-310.
____ (1997c) “Transport and environment in developing countries:comparing air pollution and traffic accidents as policypriorities” Habitat International 21(1), 79-89.
Vasconcellos, E.A. and Scatena, J.C. (1996) “The use of the spacein São Paulo: comparing household travel strategies” paperpresented at the CODATU Conference, New Delhi.
Verhoef, E. (1994) “External effects and social costs of roadtransport” Transportation Research A 28(4), 273-287 .
White, P.R. (1990) “Inadequacies of Urban Public TransportSupply” in Dimitriou, H.T. and Banjo, G.A. (eds.) TransportPlanning for Third World Cities Routledge, USA.
Zahavi, J. (1976 ) “Travel characteristics in cities of developed anddeveloping countries” World Bank Staff Working paper no. 52,Washington, U.S.A.
R e fe r e n ce s
Vasconcellos: Urban Transportand Equity: the case of São Paulo
World Transport Policy & Practice4/1 [1998] 9 - 20
[ 21 ]
Sustainable Transport:Some Challenges for Israel and Palestine
The terminology used inthis article ref lects thecurrent pol itical f lux anddif f iculties. Some of th eArabs who came underIsraeli rule in 1948 preferto be cal led P alestinians,rather than Israel i Arabs,thus high lighting the irhistorical and culturalaf fi liation. Yet, as th el ikel ihood of a Pales tinianstate nears, ‘Palestinian’ islike ly to carry nationalconnotations wh ich mayconfl ict with thesecultural/his tor ical ones .For this reason, the authorret ains the admitted lyproblematic usage of‘Israeli Arabs ’ for thosewithin the Green Lines,and Pales tinians for thosewho came under Israe l irule in 1967.
The comments of Je sseRoemer, Ben Isgur, Ph il ipWarburg , Rassem Hamaise,and Gidon Bromberg onthis essay are gratefullyackno w ledged .
Yaakov GarbLady Davis post-doctoral Fellow, Geography Department, Hebrew University ofJerusalem. and researcher for the Floersheimer Institute for Policy Studies.Address for Correspondence: Floersheimer Institute for Policy Studies, 9a DiskinStreet, Jerusalem 90440, Israel. Email: [email protected]
Garb: Sustainable Transport: Somechallenges for Israel and PalestineWorld Transport Policy & Practice4/1 [1998] 21 - 29
Abs t r a ct
With the establishment of Palestine and thecontinuing peace, there is a need to appraisethe transport infrastructure and policies ofboth countries. In particular, will Palestinefollow Israel along the road to massmotorisation or will it choose the path tosustainability? Will Israel realise the folly ofproviding for private transport and seize thisunique opportunity?
K e yw ord s
Israel, Palestine, sustainability, peace
Intr oduct i on
PLANNING for environmentally soundtransport in Israel and Palestine faces majoruncertainty and challenges. As income levelsand expectations rise, will planners be ableto learn from - rather than replicate - the pasttransport mistakes of other parts of theworld? How will global transport trends playout in the region’s unique spatial anddemographic circumstances? Can Arabcommunities in Israel overcome their relativelack of resources to cater for theirpopulation’s special needs andcircumstances through forward-lookingplanning, or will their struggle for equality bean attempt to join the general Israeli rushtoward mass motorisation and car-dependentlifestyles? What kind of physicalconfiguration, political constraints, andpopulation are Palestinian transport plannersto plan for? Will the region continue toapproximate an island in transport terms, orwill borders open, and with what transportimplications?
This essay reviews some of thesequestions with two emphases. First, throughall the sectors I examine runs the theme oftechnological leapfrogging: the opportunitiesfor societies with still low car ownershiprates to learn from rather than repeat themistakes of heavily motorised countries.
Second, I focus on the relatively under-studied questions above. Thus, whilechallenges for sustainable transport withinJewish Israel are massive and fascinatingthey have already received considerabletreatment elsewhere (See for example: Gur,Cohen, and Zaaga, 1996; Solomon, Gur andFeitelson, 1996; Fletcher and Garb, 1998;Hashimshoni, 1998). My discussion of themis therefore briefer than that of less examinedchallenges (the Arab sector within Israel, theemerging Palestinian state, bilateral andregional transport issues).
Israeli t ransport at a crossroad
Israel is at a transportation crossroad. Overthe last decade or so, the country has beenembracing the kind of mass-motorisationtrends that other advanced countries are,belatedly, coming to regret and attempt toreverse (Whitelegg, 1993; Wegener, 1997).The number of vehicles on the country’sroads is growing at 6-7 percent per year,while use of public transport (primarilydiesel bus) is rapidly declining with erodingprospects of rail taking up a substantialportion of this decline in the short tomedium term. Land use is increasinglycatering to and generating car-dependentlifestyles, in which travel to work, shopping,and recreation involves large amounts ofprivate car travel. Thus an increasing portionof transport is based on environmentallyinefficient modes, with attempts to cleanthese up (through cleaner fuels and catalyticconverters) hampered by lack of enforcementand maintenance, and swamped by othertrends such as a wildfire shift to diesel carsand an ever-growing fleet.
All these trends fly in the face of theaspirations of the emerging generation ofsustainable transport planning. This aims toreduce the total amount of travel required forsatisfying lifestyles, to ensure that as much ofthis travel as possible is conducted on moreenvironmentally-efficient modes (rather thanprivate cars), and to make sure that all modes

[ 22 ]
Garb: Sustainable Transport: Somechallenges for Israel and Palestine
World Transport Policy & Practice4/1 [1998] 21 - 29
are as environmentally efficient as possible.Even as the government subsidises car traveland road building, and underfundsalternative infrastructure, many governmentofficials and planners plea their inability tostem the growing ‘need’ for the car travelwhich these policy measures create.
This lack of policy vision is particularlyworrying in a small, hyper-dense countrylike Israel, where even today’s relatively lowmotorisation rates (cars per thousand people)translate into exceptionally highmotorisation impacts (cars per squarekilometre).
Israel’s ‘lag’ in motorisation is a goldenopportunity to leapfrog over outmodedtechnologies, a gift rapidly being squandered.Instead of continuing to direct transportinfrastructure investments to stop-gap road-building, they must be redirected to themuch talked about but little implementedmeasures that can increase sustainability.These include the management of traveldemand, raised fuel taxes, congestionpricing, parking restrictions in city centres,and the provision of light rail and improvedbus service (routing, frequency, reliability,dedicated lanes in key places) in order togive public transport a genuine competitiveadvantage. A central priority is providingalternatives to single occupancy vehiclecommuting.
Because car-based transport competeswith more sustainable alternatives for funds,passengers and land use patterns,investments made over the next five yearswill shape Israel’s transport future for ageneration or more. The country can littleafford a ‘realism’ that throws up its hands inthe face of increasing car use; these trendsare anachronistic and unsustainable, andinternational experience has shown that theycan be slowed and reversed with imaginativeand bold policies and planning (Fletcher andGarb, 1998).
Arab communit ies within Israel:aiming for more than just a fair shareof car-dependency
In Israel, Jews and Arabs live spatially apart.Ninety percent of the country’s Arabs livewithin separate towns and villages, withmany of the remainder living in separateneighbourhoods within mixed Arab-Jewishcities (Gonen, 1995). Arab communitieswithin Israel have different motorisation andland use patterns, less access to resourcesand planning facilities, and different travelneeds, so that their transport future deservesseparate discussion (Fletcher and Garb, 1998;Khaimaisi, 1995). Currently, the number ofcars per 1000 people in Arab communities is35% that of Israel as a whole (due in part tolarger-than-average family sizes), though therate of motorisation is growing twice as fast.
Most Arab settlements have a village-likestructure. This is due, in part, to the fact thatthe 1948 emptying or near emptying of thelarger Arab towns now within the Green Linetruncated the upper end of the settlement-size spectrum. And because many of thesettlements that have reached the size ofurban municipalities have done so throughoutward spreading of a village as theimposition of military administration from1948 to 1966 reduced rural-urban and inter-urban migration to a minimum (Gonen andKhaimaisi, 1993). These settlements arecharacterised by low to medium density(single or double storey homes on relativelylarge plots). Many of these villages are stillusually connected to the outside world witha single large road (often bisecting thevillage). Smaller windy streets feed into thiswith little hierarchical ordering of size.Central residential quarters and markets arehistorically designed for pedestrian andanimal traffic, not motor vehicles. BecauseIsrael imposes severe restrictions ongeographical expansion, a variety ofworkshop industries metallurgy, painting,car shops, food processing and packaging)tend to be intermingled with residentialhousing, sometimes posing considerableenvironmental hazards.
With the decline of agriculture and therelative prosperity of Jewish urban centres,and especially since the lifting of movementrestrictions when the military administrationwas abolished in 1966, Arab settlementsbecame increasingly based on a commutingeconomy to nearby Jewish cities(Gonen,1995). Many of the transportchallenges of Israel’s Arab communities areshaped by these basic circumstances of extra-Sources: U.N. statistics & Rae, The Road and Car in American Life
Egypt Gaza Jordan West Bank Israel Holland United States
Figure 1: Current motorisation rates in selected countries (bars) compared to U.S.
historical motorisation (line) (Private cars per 1000 population).

[ 23 ]
Garb: Sustainable Transport: Somechallenges for Israel and Palestine
World Transport Policy & Practice4/1 [1998] 21 - 29
urban settlements that are structurallyvillages but function as working classcommuting suburbs with respect to largeJewish urban areas.
The increasing number of cars moving andparking in these villages is incompatible withtheir traditional layout. Congestion hasbecome a major problem, and withpedestrians ill-separated from traffic,accident rates are high. Widening andstraightening of these roads invariablyinfringes heavily on private property, leadingto conflict, and in some cases destroying thecharacter of a towns’ historic core. Throughtraffic often has no alternative but to passthrough the town centre. As villages andtowns expand in size (under considerableconstraint and often in a poorly plannedmanner), they become increasingly car-dependent, especially in the absence ofadequate public transport.
In response to these problems and a legacyof under-investment, some plannersemphasise greater investment in the roadsystem to relieve the growing transportationstresses in Arab villages: constructing ahierarchical system of straight, wide roadsaccording to national standards, multipleroad entries into villages, and ring roadsaround them. ‘The solution for thetransportation problems in thesesettlements’, claims one of the few overviewsof the topic, ‘demands a correct planning,similar to that which is done for Israel’s largecities’ (Khaimaisi, 1995).
No doubt in some cases there is a need fornew roads to serve new centres arising frommuch needed investment in Arab economicgrowth, and to divert traffic that is ruiningtown centres. But should catching up andlevelling standards of road capacity be theprimary emphasis? The challenge is notsimply to attain a fair share of thedevelopment pie, but to use this share for atransport system that is forward-looking andsuited to inhabitants’ needs, not justmimicking of prevailing trends.
Thus, portions of some Arab villagesretain the kind of pedestrian livability thatcontemporary transportation planners arestruggling to achieve, and these will bethreatened by mass motorisation trends.Israel’s car-dependent suburbs are hardly amodel for emulation. Can Arab villages andtowns take advantage of their ‘lag’ inmotorisation levels to build more sustainabletransport planning? The priorities wouldseem to be the following: town planning thatlessens the need for travel (retaining andstrengthening mixed use zoning and
opportunities for local work while removinghazardous economic activities away fromresidential and commercial areas);accommodating and encouraging pedestrianand bicycle access for daily needs, especiallyin town centres; and building a solid publictransport system while the potentialridership is still very high.
Currently, intra- and inter-urban publictransport serving Arab sectors is hamperedby lack of access to national resources andco-ordination, and by orientation of the largenational public transport carriers to Jewishneeds. Buses are often limited to a serviceleaving the village to Jewish populationcentres in the morning, and returning afterwork (a pattern particularly restrictive forArab women). In many cases a single bus linewill pass through many villages, makingtravel slow. There is little radial connectionbetween villages and buses are often oldmodels that have been phased out of thefleets that serve Jewish cities.
Not only has there been a legacy ofproportional under-investment within Arabcommunities, but it is doubtful whether asufficient portion of Israel’s plannedtransport investments over the coming yearsare designed to serve the special needs of thefifth of the country’s population that is Arab.The proposed Trans-Israel Highway, Israel’slargest ever transport infrastructureinvestment, to run the length of the countryfrom the border with Lebanon to south ofBeer-Sheva, has been much debated becauseof great cost, its land use and environmentalimpacts, and its questionable priority withrespect to other urgently-needed transportinvestments. There are those who argue thatthe massive uncertainty as to these requiresthat the project be frozen pending thecomprehensive analysis that was never done(Garb, 1997). The question of the project’svalue and priority is even more pointed withrespect to Israel’s Arab community, both inthe central 70 km that are on the verge ofconstruction, and the planned northernportions of the road through the Galilee.
While land for the road will beappropriated from both Jewish and non-Jewish settlements, the consequences forArab villages may be particularly severe asthey have suffered a series of expropriationsover decades, and have less access to otherland (mostly owned by the government andgranted almost entirely to Jewish settlements)and to non-agricultural forms of income. Inaddition, Arab villages were far less involvedin the project’s conception, routing, and inplanning to take advantage of development

[ 24 ]
Garb: Sustainable Transport: Somechallenges for Israel and Palestine
World Transport Policy & Practice4/1 [1998] 21 - 29
along the right-of-way, especially that whichtook place at less-than-formal levels. Unlesssomething changes, Jewish kibbutzim andmoshavim may be in a better position to planaround and utilise the road’s consequencesto their benefit, through the construction ofshopping and business areas alongside(Khaimaisi, 1998).
Transport for Palest ine: occupat ion,uncertainty, and the need for planningca p a ci ty
Compared to Israel, which occupied theseareas in 1967, the transport system in theWest Bank and Gaza has been shaped bydecades of poverty, neglect, and constraint.Planning for its future is hampered bymassive uncertainty and lack of institutionaland material resources. GDP per capita in theterritories is around around $1,600 (1996),average monthly wages are around $350, andare significantly higher ($530) forPalestinians employed in Israeli-controlledareas. Unemployment now runs at 28% andabout one-fifth of the population livesbeneath the poverty line of $650 annually(United Nations, 1997; Hass, 1998).
While a high quality road system has beenbuilt since 1967 to serve Israeli securityneeds and to link Jewish settlements withIsrael, the road network serving thePalestinian population is more or less theone inherited from Jordan in 1967, and nowof a quality lower than one would expecteven in developing countries of similarincome levels. Maintenance of the latter is sopoor that 40% of these roads are regarded bythe World Bank as requiring immediaterehabilitation if they are not to be lost (WorldBank, 1993).
Vehicle ownership has been increasing ata rate of 10% annually over the last twodecades, though levels are still far belowIsraeli levels, themselves lower thandeveloped counties. More than half of thefleet is over a decade old resulting in highpollution levels in urban centres.
Public transport is entirely road-based(buses, vans, and shared taxis) as all railservice ceased in 1948. These services areentirely in the hands of a multitude ofprivate operators; the bus fleet of about 780vehicles, for example, is owned by some 100private enterprises, 70 of which own only asingle bus. They are under great financialpressures: new buses and spare parts forthem are very expensive; credit is limited;competition from cars and vans providingunlicensed passenger services is fierce; and
comprehensive and internal closures havedisrupted travel of people and goods onalmost 30% of potential annual working daysin the last couple of years (United Nations,1997). Trucking of freight faces similarproblems. While Israeli bus lines link Jewishsettlements to Israel they provide littleservice to the Palestinian population.
The only port in the Palestinian areas isGaza. Serving small boats at the turn of thecentury, the port became increasinglymarginal after Haifa became the main portduring the British Mandate, and the Gazastrip’s isolation after 1948. Though modernport facilities with spare capacity exist alongthe Israeli coast at Ashdod (30 km north ofGaza) and Haifa, as well as at Eilat andAquaba, a deep-water port is planned forGaza on grounds of national sovereignty.This would have major environmentalimpacts. It would be inserted into an openbeach near one of the world’s most crowdedcities, and would entail transport of goodsthrough a densely populated area. And, byblocking transport of the northward flow ofNile sands, which now replenish thoseconstantly eroded from Gazan and Israelibeaches, the port would strip these down tobare rock in a decade or so (Watzman, 1995).While international financing is likely to beavailable for the port’s construction, there arestill no commitments to the million dollarsneeded annually to pump sand around theport obstruction.
The only active airport in the OccupiedTerritories is now operated by Israel atQalandia, between Jerusalem and Ramallah.The World Bank has urged the rehabilitationof this airport (at an estimated cost of $250million dollars) to serve international trafficto the Palestinian Authority, whetherthrough transfer of the airport to theAuthority or some shared arrangementresulting from Israeli-Palestinian agreement(World Bank, 1993). However, the veryreasons cited for the site being a ‘highlysuitable’ location for such development - itscentrality, within a 15 kilometre radius of20% of the total Palestinian population -would become a real problem once air trafficexpands beyond the few daily flightscurrently using the airport.
The construction of an airport in southernGaza, near Dahania, is currently a major itemin negotiations; the Palestinian Authority isdemanding autonomous air traffic, and Israelis concerned about the security implicationsof unmonitored passengers and cargoentering Gaza by air. If built, this airportwould expand Palestinian freedom of

[ 25 ]
Garb: Sustainable Transport: Somechallenges for Israel and Palestine
World Transport Policy & Practice4/1 [1998] 21 - 29
movement, but for only a tiny elite. MostGazans will remain confined in the tiny Gazastrip until arrangements are made for ‘safepassage’ between Gaza and the West Bank.The latter is one of many instances where‘security’ or geostrategic considerationsswamp sound planning principles in theregion. Although Gaza and the West Bank arealready connected by roads, the perceivedneed for an isolated passage for Palestiniansthrough Israel has generated a range ofschemes, including those of questionableenvironmental merit, most recentlyexemplified by a proposal for a sixtykilometre-long raised bridge.
Repeatedly, transport planning forPalestine comes up against the fact that acornerstone of the Israeli occupation,especially over recent years, has been thesevere management of Palestinian mobilitycoupled with the preservation of freedom ofmovement for Israelis within the Territories.Transport plans cannot, therefore beseparated from issues demanding politicalresolution, and planners must work withuncertainty regarding critical questions: willthe transport-related components of thePeace Accords (safe passage between theWest Bank and Gaza, a port, an airport) beimplemented fully? Will Palestinians havecontrol over their ability to travel betweenthe currently fragmented pieces of their owncountry, and will they be able to travel intoIsrael? Will the extensive new high qualityroads designed to allow settlers to live in theTerritories without encountering Palestinianresidents, continue to operate, and what willtheir relation be to the old, inconvenient andpoorly-maintained road system that servesPalestinians?
Given this uncertainty, and theinstitutional capacities that wereimpoverished over decades of Israeli militaryand civil administration, the World Bank’sproposed short term strategy seems wise: toproduce transport planning capacity, ratherthan a transportation plan (Khamaisi, 1994).Similarly, its emphasis on attending initiallyto municipal transport needs in areas underPalestinian control makes sense. However, itis important that this training and capacity-building, initial municipal-level work, andlonger term planning be founded onprinciples of sustainable transport.
Without this sustainable emphasis andtraining, it is likely that transportimprovements will focus on improving theextent and quality of the road system(accommodating and encouraging privateuse) and on autonomy-giving port and
airports, at the expense of less obvious andlonger-term measures. The former is theprincipal emphasis in the few existingplanning documents, which predict thatpolitical independence will bring a drasticrise in income levels, car ownership and use,and volumes of traffic (See, for example, the‘Transport and Communications’ chapter ofMaster Planning for the State of Palestine:Suggested Guidelines for ComprehensiveDevelopment Center for Engineering andPlanning, Ramallah, 1992). Measures of equalor greater importance - such as public andnon-motorised transport, and the design ofpedestrian-friendly city centres and mixeduse neighbourhoods that reduce the demandfor travel - receive far less attention.
One can imagine a scenario of continuedhigh population growth rates, increasedincomes and social stratification, and theeasing of Israeli restrictions on building andtravel, together contributing in short order toa wave of unregulated and car-dependentsprawl that will precede and soon pre-emptmore sustainable alternatives. Such planningissues would challenge any society, so withscarce resources, high uncertainty, andmassive external constraints, Palestiniantransport planners have their work cut out.
Yet, precisely because it is starting late,this fledgling state can avoid buildingyesterday’s transport problems into its future.In doing so, it will reduce the long termliabilities of mass motorisation, which havebecome clear over recent decades. Lessenedcar dependency would reduce travel relatedhealth costs, slow the destruction of openareas and communities through roadbuilding, free up salaries for investmentrather than car purchase and maintenance,and avoid building into the economy aconstant drain of foreign currency for thepurchase of cars and fuel. An increasingnumber of examples from around the worldshow that progress and motorisation neednot be equated (Hook, 1996).
In Gaza, these issues are especiallypointed. With astonishing populationdensities, any rise in motorisation rates willmake life there even more hellish, especiallysince these vehicles are and will most likelycontinue to be older and more polluting,acquired second-hand from Israel. Gaza isflat, with reasonable weather, low incomes inthe foreseeable future, and very highpopulation densities: an ideal site for non-motorised and public transport. But unlessthe demand for sustainable transport arisesfrom within Gaza itself, and is recognised ascutting edge and compatible with raised

[ 26 ]
Garb: Sustainable Transport: Somechallenges for Israel and Palestine
World Transport Policy & Practice4/1 [1998] 21 - 29
standards of living, any talk of animal andhuman-powered transport may be rejected asan external attempt to preserve‘backwardness’.
Co-ordinat ing Israeli and Pales t inianT r ans p or t
A looming yet largely unconsidered transportchallenge - also characterised by cripplinglevels of uncertainty - is the co-ordination ofIsraeli and Palestinian transport plans.Though these two tiny countries, withsegregated populations, markedly differentwage rates, and dissimilar levels ofenvironmental legislation, monitoring, andenforcement share long often porous borders.Yet there is little co-ordination of thetransport-related consequences of theconsiderable flows of workers, vehicles,pollutants, and land use influences crossacross these.
Even with the stringent restrictions ontravel to work within Israel currently inforce, close to 100,000 workers cross intoIsrael for work daily, and truck traffic (notincluding Israeli vehicles) is about 900vehicles a day (Israel Foreign Ministry,1998). The structural conditions underlyingthis daily flow of people and goods areunlikely to change soon. Not only is thecurrent and future daily labour migrationfraught with social and equity challenges, butthere is little systematic thought about itsimplications for sustainable transport in bothcountries, and almost no collaborativeplanning for it.
Open borders between an independentPalestinian state and Jordan might decreasethe dependence on Israel somewhat, butbarring barely conceivable physical ormilitary barriers, overall volumes can onlyincrease as Palestinian and Israelipopulations grow. Recent estimates carriedout by the U.S. Census Bureau and thePalestine Central Bureau of Statistics showthe Palestinian population in the West Bank(including East Jerusalem) at around 1.5million, with 900,000 in Gaza. The combinedpopulation is expected to reach 3.2 millionby 2012 through natural increase, with anadditional 415,000 possible due toimmigration in the wake of substantialdevelopments in the peace process (Zureik,1996). The resultant daily commute may bemassive - one estimate for the year 2020yields 40,000 people an hour from Gazanorthward during peaks, 25,000 along theHebron-Jerusalem-Nablus-Jenin axis, andlarge numbers from all the major West Bank
cities to the border with Israel (Hashimshoni,1998). The impacts of motorisation in Israel’scrowded coastal plain are beginning to be feltin the adjacent Palestinian areas. By the timethe nitrogen oxides and gas-phasehydrocarbons emitted by vehicles in the TelAviv region have undergone a series ofatmospheric chemical reactions thatproduces ozone, they are tens of km inland,over the Jerusalem area, Palestinian areas,and even Jordan, with potentially serioushealth consequences (Luria et al., 1994).Other imminent trans-boundary effectsrequiring collaborative planning are thepollution and land use impact of theproposed Trans-Israel Highway. This road isplanned to run just a few km west of theGreen Line between Israel and the West Bankfor a good deal of its central portion.Anticipated to carry 100,000 vehicles a dayin its central stretches, construction isplanned to begin within a year. While projectproponents have argued the merit of drawingpolluting traffic eastwards, out of the TelAviv Metropolitan area, there have been noevaluations of the effect of this shift for areaseast of the Green Line. And, just as the roadis likely to be a massive magnet fordevelopment to its west, on the Israeli side, itcould do the same to its east, within adjacentPalestinian areas. Yet the extent to which theproject is being incorporated into PalestinianAuthority planning is unclear.
Roads to peace?
While the political developments of the lastfew years are rendering such talkincreasingly premature, the transportationconsequences of future peace and theopening of borders must be thought aboutwith social equity and sustainability in mind.These criteria figured little in the headymixture of enthusiasm, mythology, andunreflective developmentalism that havecharacterised the visions of forward-lookingpoliticians and planning committees thus far.On the whole, peace has been equated withstability and open borders for businessinterests, and with economic growth asclassically defined. Its infrastructuralcorrelates have tended toward grand circum-Mediterranean highways, and ‘peace roads’linking regional capitals (Ecopeace Forum,1997) .
Shimon Peres, for example, is famous forhis development-driven technocratic, free-market ‘New Middle East’, for whichuntrammelled car-mobility became oneobvious metaphor (Peres, 1993). [However, in

[ 27 ]
Garb: Sustainable Transport: Somechallenges for Israel and Palestine
World Transport Policy & Practice4/1 [1998] 21 - 29
a recent (18th March 1998) interview sessionwith students from the Arava Institute forEnvironmental Studies, Peres declared hehad abandoned his long-held ideal of makingIsrael the infrastructural and transportationhub of the Middle East. A small and denselypopulated country, he claims, cannot affordthese projects - regional highways should runthrough Jordan, not Israel!] Israel’s currentPrime-Ministerial candidate, Ehud Barak,when he held the position of ForeignMinister, defended his party’s negotiationswith Syria by painting a picture of ‘fullnormalisation’, in which ‘tourists can travelfrom Israel to … Turkey and to Europe intheir own cars’, while a popular progressivecolumnist ended his plea for peace withSyria saying, ‘What more do we need inorder to be convinced that peace is a gooddeal? To give every Israeli a free lifetimesupply of gas for trips via Damascus?’
Some of the grander regional road projectsinitially proposed will, no doubt, evaporateas soon as more careful feasibility studies aredone. They are based, in part, on an image ofIsrael as ‘the cross-roads of the Middle East’,destined to become a regional transport hub.This image may be a largely mythicalholdover from the past. Before motorisedtransport, when trade was far less global thantoday, foot and animal traffic relied on theland route through Israel with itsunambiguous terrain and frequent waterstops (See Hashimshoni, 1998). Today,however, the volume of trade between Arabcountries is relatively small (only 2% ofEgypt’s imports are from other Arabcountries, for example), and they havedeveloped a transport network quite capableof handling traffic between them despite thepost-1948 closure of the traditional routethrough Israel. Even the connection betweenAfrica (Egypt and to some degree Libya) andArab countries to the east is now madethrough the Sinai-Aquaba ferry. If anything,the ‘desert route’ of Jordan is more likely tobecome the regional transport avenue.
Thus the motivations for sweeping ‘peaceroads’ proposals may be located not so muchin real transportation demand as ininternational donor enthusiasm for projectsthat link the region’s countries - especiallyIsrael with its Arab neighbours (On theseselection pressures see Cohn, 1997). Thislack of real demand, combined with thestalled peace process, mean that the massiveproposed regional network of peace roads isnot an imminent danger.
Other issues are of more immediateconcern: the acceleration of the already rapid
growth in air traffic in the region, likely tooccur if direct flights between countriesbecome easier; the environmental impacts ofroad traffic at a few key crossing points; andthe social implications of industrialrelocation from Israel to take advantage oflower wages rates in neighbouring countries.
Because of it’s unique characteristics andlocation, the pressures of regional transportdevelopments will probably first be felt inthe Eilat/Aquaba region, and it is here thatanticipatory planning for greater cross-bordermovement is most advanced. This is anecologically sensitive area and major touristattraction at a point where Jordan, Egypt, andIsrael are in close proximity. The uniquecoral reefs in the Red Sea Gulf are alreadyunder stress by shipping, there are plans forairport expansion and/or relocation, and twolarge road projects are proposed to facilitatetrucking between Jordan and Egypt via Israel.The first is associated with the expansion ofthe Ein-Netafim checkpoint between Israeland Egypt, and the second with theconstruction of an Eilat Bypass ‘PeaceHighway’ (Isgur, 1997). The latter would easethe impacts of traffic through Eilat, but at thepossible cost of increased local air pollution,runoff from road surfaces into the Gulf,severance of wildlife movement, and scenicintrusion. A second pressure point maydevelop if significant volumes of shippingare redirected from Aquaba to theMediterranean along routes within Israel toHaifa. Estimates suggest that this couldinitially comprise between 70 and 200 trucksa day (Hashimshoni, 1998).
Given wage disparities between Israel andsurrounding countries, eased travel couldincrease firm efficiency, but also overalltravel volumes and labour exploitation. Ascurrent processes in the textile industryindicate, Israeli firms may choose to relocatelabour-intensive portions of their productioncycle in Jordan and Egypt, leaving knowledgeand technology-intensive portions in Israel,increasing the overall haulage volumes, thebulk of which is likely to be road-based. (Forreflection on the environmental implicationsof European Union transport integration, seeWhitelegg, 1993.) While such levels ofintegration lie far in the future for the MiddleEast, the patterns described there aresuggestive.
Environmentalists and labour activistsmust work to ensure that their criteria arebuilt into visions of a New Middle East,raising questions that are still barely heard.Can we ensure that the pricing of freighthaulage reflects the full social and

[ 28 ]
Garb: Sustainable Transport: Somechallenges for Israel and Palestine
World Transport Policy & Practice4/1 [1998] 21 - 29
environmental costs of transport, so thatdecisions of local production versus importare rationalised? Can rail and sea transport(with the kind of inter-modal container-transfer now being developed) provide moreefficient long-distance haulage in the longterm than trucks along some routes? Howwill emission standards of heavy commercialvehicles, which will contribute the majorityof pollution from cross-border travel, be co-ordinated among the region’s nations? Canwe ensure that increased mobility is notsimply achieving flexibility for corporationsat the expense of people and places?
Conclusion: Realisi ng the Benef it s o fL a te comi n g
In a region so troubled, environmentalcriteria and careful planning have often beensecondary to more ‘pressing’ agenda. Yet indifferent ways, each of the sectors mentioned(Israel, the emerging Palestine, Arabcommunities within Israel, and the region asa whole) will need precisely this kind oflong-term systemic thinking if they are to notwaste the moment of opportunity offered by
still low motorisation levels. Israel began the1990s with car ownership levelsapproximating those of the U.S. duringWorld War 2, and levels in Jordan and theOccupied Territories were closer to those ofWorld War 1. Can transport planning incountries utilise any of the things we’velearnt about transport since then?
Without imagination, each sector candeclare it impossible to argue with theinevitably rising demand for car travel, andso scramble to build the infrastructure thatwill meet and thus encourage this demand;each can regret not having the luxury to putlong-term livability ahead of more urgentthings.
With imagination and boldness, on theother hand, policy levers and wiseinvestments might shape demand, ratherthan merely (and unsuccessfully) follow it;examples of successful and often less costlyalternative practices can be emulated fromaround the world - including those in placesgrappling with their own constraints andemergencies. ‘Lags’ can be turned into gifts:relatively clean slates from which to build adifferent kind of future.

[ 29 ]
Garb: Sustainable Transport: Somechallenges for Israel and Palestine
World Transport Policy & Practice4/1 [1998] 21 - 29
Cohn, I. (1997) “Environmental Evaluation ofRegional Transportation Projects: the case of theMiddle East” unpublished manuscript, April 19.
Ecopeace Middle East Environmental NGO Forum(1997) “An Updated Inventory of NewDevelopment Projects, Compiled from ReportsPresented by the PNA, Hashemite Kingdom ofJordan, State of Israel, and Republic of Egypt tothe Casablanca, Amman and Cairo Middle EastNorth Africa Economic Summit” (EcopeaceForum, East Jerusalem, March).
Fletcher, E. and Garb, Y. (1998 ) “Transport,Environment, Equity: Trends, Prospects andPolicy” Adva Institute, Tel Aviv.
Garb, Y. (1997 ) The Trans-Israel Highway: Do WeKnow Enough to Proceed? Working Paper No. 5,Floersheimer Institute for Policy Studies,Jerusalem. Available from [email protected]
Gonen, A. (1995) Between City and Suburb: UrbanResidential Patterns and P rocesses in IsraelAldershot: Avebury [In particular, see Chapter13, ‘Arab and Jews: Living Nearby butSeparately’].
Gonen, A. and Khaimaisi, R. (1993) “Toward aPolicy of Urbanisation Poles for the ArabPopulation in Israel” Floersheimer Institute forPolicy Studies, Jerusalem. [in Hebrew].
Gur, Y., Cohen, S. and Zaaga, M. (1996) “IsraeliUrban Transport in the 21st Century: Trends andDegrees of Freedom, 2020 Master Plan for Israel,Transport Team, Report 18, Stage three” [InHebrew].
Hashimshoni, G. (1995) “The Implications of Peacefor the Regional Land Transport System - Israelas a Bridge Between Continents” paper presentedto the Israel Institute of Transportation Planningand Research, Tel Aviv, July 23.
Hashimshoni, G. (1998) “Surface TransportDevelopment Policy for the State of Israel” reportsubmitted to the Ministry of Transport, January.
Hass, A. (1998) “One Fifth of the Population in theAreas Lives Under the Poverty Line:Unemployment rate-28%” Haaretz, March 17, p7A.
Hook, W. (1996) “Ten Myths About theRelationship Between Transportation andEconomic Development”. Prepared for theSecond U.N. Conference on Human Settlements,Istanbul, Turkey (New York: Institute forTransportation and Development Policy, 1996).
Hook, W. (n.d.) “Role of Non-motorisedTransportation and Public Transport in Japan’sEconomic Success” Transportation ResearchRecord 1441 : 108 -115.
Isgur, B. (1997) “Analysis of TransportationProjects in the Eilat/Eilot Regional Plan”unpublished research paper, Arava Institute forEnvironmental Studies, Jerusalem, December.
Israel Foreign Ministry Information Division(1998) “Economic relations Between Israel andthe Palestinian Authority” Background Paper,February.
Khamaisi, R. (1994) “Planning and Development ofLocalities in the Emerging Palestinian Entity”Floersheimer Institute for Policy Studies,Jerusalem.
Khaimaisi, R. (1995 ) “The Development ofTransportation Infrastructure in Arab Localitiesin Israel” Floersheimer Institute for PolicyStudies, Jerusalem.
Khaimaisi, R. (forthcoming) “The Implications ofthe Trans-Israel Highway for Arab localities:Burden or Catalyst for Development”Floersheimer Institute for Policy Studies,Jerusalem.
Luria, M. et al., (1994) “The Formation of O3 overIsrael: A Growing Concern and a PotentialInternational Issue” in Preservation of Our Worldin the Wake of Change ISEEQS, Vol. VI.
Peleg, A. M., Luria, M., Setter, I., Perner, D. andRussell, P. (1994) “Ozone Levels in CentralIsrael” Israel Journal of Chemistry 34, 375-386.
Peres, S. (1993) The New Middle East Henry Holt,New York.
Solomon, I., Gur, Y. and Feitelson, E. (1996) “LandTransportation Planning - Israel 2020: Statementof Policy” [In Hebrew].
United Nations Office of the Special Coordinatorin the Occupied Territories (1997) “Economicand Social Conditions in the West Bank and GazaStrip” in Quarterly report United Nations, NewYork.
Watzman, H. (1995) “Port Plan Threatens to StripGaza’s Coastline” New Scientist July 22.
Wegener, M. (1997) “Issues for a European-American Research Programme on the Future ofTransport” Journal of Transport Geography vol.5, no. 1.
Whitelegg, J. (1993) Transport for a SustainableFuture: The case for Europe Belhaven, New York.
World Bank (1993) “Transportation” in Developingthe Occupied T err itories: An Investment in Peace- Vol. 5: Infrastructure Washington D.C.: TheWorld Bank.
Zureik, E. (1996 ) “Palestinian Refugees and thePeace Process” Institute for Palestine Studies,Washington, D.C.
R e fe r e n ce s

[ 30 ]
Abs t r a ct
Demand management strategies can be aneffective tool in taming the automobile. Theapproaches to demand management in fourEuropean cities; Zurich, Freiburg, Stockholmand Copenhagen; and Boulder, Colorado isinvest igated.
K e yw ord s
Demand Management, alternative modes,land use.
Intr oduct i on
THE AUTOMOBILE continues to grow in itsuse and impact on cities around the world.For most American cities the dominantstrategy to cope with traffic has been toincrease the road capacity or shift traffic toless sensitive areas. This supply managementapproach has been criticised increasinglybecause, not surprisingly, it increasesdemand.
The alternative approach is to createoptions which manage demand. Data fromdifferent cities around the world show verydifferent levels of automobile use and theseare related quite clearly to the level of
infrastructure provided for the automobile, tocar dependent land use patterns and toeconomic factors (Newman and Kenworthy,1989; Kenworthy et al., 1998). These studiessuggest that demand management should befeasible. Governments and internationalagencies are hence suggesting demandmanagement as a major strategy formunicipalities (OECD/ECMT, 1996).
In regional science discussions economicfactors are usually taken to be the mostsignificant with the assumption that asincomes rise there will be an inevitableincrease in the growth in automobile use (e.g.Gordon, Kumar and Richardson, 1989).Hence there is little point in developingdemand management strategies based onlimiting infrastructure for the automobile oreven economic penalties as the income effectwill overwhelm all attempts to constrain thecar. Love (1992) even goes as far as claimingthat the automobile is ‘unstoppable’ as it isan ‘irresistible force’.
There is thus a conflict between these twoapproaches: the first suggests that publicpolicy can be effective in managing demand,the second that consumer preferences forcars is far too powerful for any public policyaimed at curbing this insatiable demand.However, demand management can be aneffective tool in taming the automobile. Fivecities, four in Europe; Zurich, Freiburg,Stockholm and Copenhagen; and Boulder,Colorado have direct experience of demandmanagement and all have been committed topolicies aimed at achieving this for a numberof years.
Demand Management St rategies
There are a range of automobile demandmanagement techniques or approaches thathave been suggested, and these have beensummarised into four categories as set out inTable 1 opposite.
These approaches will be used as the basisof examining the five case studies in thispaper.
Can Demand Management Tame theAutomobile in a Metropolitan Region?
Prepared for presentationat the 37th Annual Meetingof the Western RegionalScience Association,Monterey, Cali fornia.February 18-22, 1998
Spenser W. HavlickProfessor of Environmental Design,College of Architecture and Planning, University of Colorado,Boulder, CO 80309-0314, U.S.A. Email: [email protected]
Peter W. G. NewmanProfessor of City Policy,Institute for Science and Technology Policy, Murdoch University,Murdoch, WA 6150, AUSTRALIA Email: [email protected]
Table 1: A summary of automobile demand management strategies.
Traffic Calming: Slowing traffic with physical devices and narrowingroadsSlowing traffic with slow speed zonesSlowing traffic with strong policing
Favouring Alternate Modes: Increasing infrastructure for bikes, pedestrians andtransitDecreasing parking and road capacitySocial support for alternative modes, e.g. transit passes
Economic Penalties: Paying more of full costs of car use through fuel tax orregistrationCongestion pricing on SOV’s at peak timeHigh parking fees
Non Auto Dependent Land Uses: Growth management to prevent sprawlUrban villages around transit stopsMixed land use
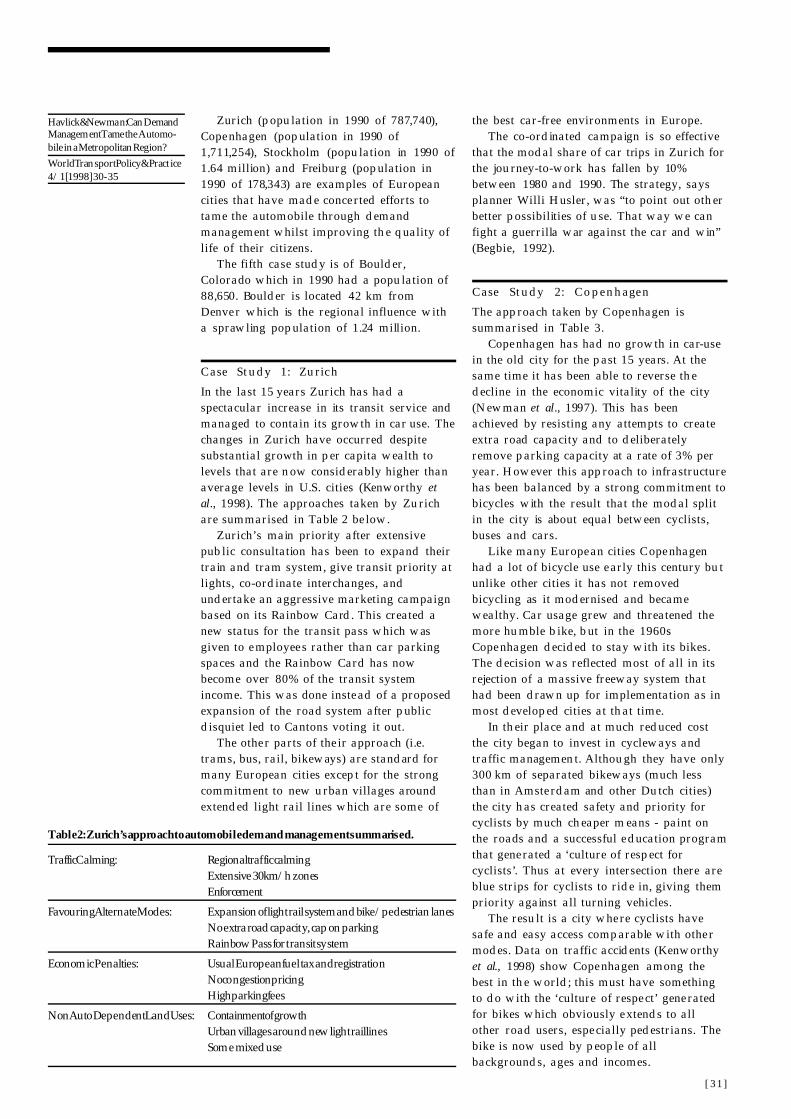
[ 31 ]
Zurich (population in 1990 of 787,740),Copenhagen (population in 1990 of1,711,254), Stockholm (population in 1990 of1.64 million) and Freiburg (population in1990 of 178,343) are examples of Europeancities that have made concerted efforts totame the automobile through demandmanagement whilst improving the quality oflife of their citizens.
The fifth case study is of Boulder,Colorado which in 1990 had a population of88,650. Boulder is located 42 km fromDenver which is the regional influence witha sprawling population of 1.24 million.
Case Study 1: Zurich
In the last 15 years Zurich has had aspectacular increase in its transit service andmanaged to contain its growth in car use. Thechanges in Zurich have occurred despitesubstantial growth in per capita wealth tolevels that are now considerably higher thanaverage levels in U.S. cities (Kenworthy etal., 1998). The approaches taken by Zurichare summarised in Table 2 below.
Zurich’s main priority after extensivepublic consultation has been to expand theirtrain and tram system, give transit priority atlights, co-ordinate interchanges, andundertake an aggressive marketing campaignbased on its Rainbow Card. This created anew status for the transit pass which wasgiven to employees rather than car parkingspaces and the Rainbow Card has nowbecome over 80% of the transit systemincome. This was done instead of a proposedexpansion of the road system after publicdisquiet led to Cantons voting it out.
The other parts of their approach (i.e.trams, bus, rail, bikeways) are standard formany European cities except for the strongcommitment to new urban villages aroundextended light rail lines which are some of
the best car-free environments in Europe.The co-ordinated campaign is so effective
that the modal share of car trips in Zurich forthe journey-to-work has fallen by 10%between 1980 and 1990. The strategy, saysplanner Willi Husler, was “to point out otherbetter possibilities of use. That way we canfight a guerrilla war against the car and win”(Begbie, 1992).
Case Study 2: Copenhagen
The approach taken by Copenhagen issummarised in Table 3.
Copenhagen has had no growth in car-usein the old city for the past 15 years. At thesame time it has been able to reverse thedecline in the economic vitality of the city(Newman et al., 1997). This has beenachieved by resisting any attempts to createextra road capacity and to deliberatelyremove parking capacity at a rate of 3% peryear. However this approach to infrastructurehas been balanced by a strong commitment tobicycles with the result that the modal splitin the city is about equal between cyclists,buses and cars.
Like many European cities Copenhagenhad a lot of bicycle use early this century butunlike other cities it has not removedbicycling as it modernised and becamewealthy. Car usage grew and threatened themore humble b ike, but in the 1960sCopenhagen decided to stay with its bikes.The decision was reflected most of all in itsrejection of a massive freeway system thathad been drawn up for implementation as inmost developed cities at that time.
In their place and at much reduced costthe city began to invest in cycleways andtraffic management. Although they have only300 km of separated bikeways (much lessthan in Amsterdam and other Dutch cities)the city has created safety and priority forcyclists by much cheaper means - paint onthe roads and a successful education programthat generated a ‘culture of respect forcyclists’. Thus at every intersection there areblue strips for cyclists to ride in, giving thempriority against all turning vehicles.
The result is a city where cyclists havesafe and easy access comparable with othermodes. Data on traffic accidents (Kenworthyet al., 1998) show Copenhagen among thebest in the world; this must have somethingto do with the ‘culture of respect’ generatedfor bikes which obviously extends to allother road users, especially pedestrians. Thebike is now used by people of allbackgrounds, ages and incomes.
Havlick & Newman: Can DemandManagement Tame the Automo-bile in a Metropolitan Region?World Transport Policy & Practice4/1 [1998] 30 - 35
Table 2: Zurich’s approach to automobile demand management summarised.
Traffic Calming: Regional traffic calmingExtensive 30 km/h zonesEnforcement
Favouring Alternate Modes: Expansion of light rail system and bike/pedestrian lanesNo extra road capacity, cap on parkingRainbow Pass for transit system
Economic Penalties: Usual European fuel tax and registrationNo congestion pricingHigh parking fees
Non Auto Dependent Land Uses: Containment of growthUrban villages around new light rail linesSome mixed use

[ 32 ]
The latest innovation in Copenhagen isthe City Bike program where colourful bikesare provided free (after a deposit is placed inthe bike-holder like an airport baggagetrolley). These bikes are paid for bycommercial advertising and are maintainedby the City of Copenhagen with assistancefrom the Prison system who collect andrepair damaged bikes overnight. It is hard tofind a free bike from among the present 2,500bikes which are available but as theoriginator of the scheme, city administratorSoren Jensen, says: “When there are 10,000bikes in a few years it will be a normal thingfor anyone downtown to just jump on a citybike to move around the inner city”.
But Copenhagen’s contribution to demandmanagement would not be understood unlessit was seen as a part of an innovative socialplanning approach designed to make the citymore attractive to pedestrians. Professor JanGehl describes the process by whichCopenhagen began to win back its city over a20 year period:
“By the 60s American values had begun tocatch on - separate isolated homes andeveryone driving. The city was sufferingso how could we reverse these patterns?We decided to make the public realm soattractive it would drag people back intothe streets, whilst making itsimultaneously difficult to go there bycar” (Gehl, 1992).
As Copenhagen reduced central area parking
by 3% each year they pedestrianised morestreets and public squares. Each year theyalso built or refurbished inner city housingso people could make use of the new walkingareas easily. They introduced into the streetsall kinds of attractive landscaping,sculptures, and seating (including 3000 seatsalong footpath cafés). And each year, theyintroduced more buskers, markets and otherstreet life and festivals that became more andmore popular. As Jan Gehl said, “the citybecame like a good party”.
The result has been not only a reductionin the traffic but growth in the vitality of thecity area. Social and recreational activity hastripled in Copenhagen’s major streets (Gehland Gemsoe, 1996). And this despite pleasthat: “Denmark has never had a strong urbanculture”, “Danes will never get out of theircars”, “Danes do not promenade likeItalians”. Such pleas are heard around theworld whenever a program to manageautomobile demand is planned, but not allcities capitulate to it. Copenhagen is a livingexample that car culture is not inevitable orirresistible.
Case Study 3: Stockholm
Stockholm, which is one of the richest citiesin the world, showed an absolute decline incar use in the 1980s in the global survey ofcities conducted by Kenworthy et al., (1998).Stockholm’s aggressive traffic taming policiesand actions actually produced a reduction incar trips by 229 km per capita. This cutbackor reduction in car driving distance and caruse was associated with a growth in transitfrom 46 trips per person. The data forStockholm in comparison to 10 U.S. citiesare given in Table 4. The approaches takenby Stockholm, are given in Table 5.
In examining how Stockholm managed tomake such an impressive step towardstaming the automobile it is hard to go beyondits strong commitment to land use planningwith a transit-led development approach.The regulations which shape its planningmean that everyone lives within a short walkor a fast rail service to work.
The city is strongly contained in itsgrowth patterns and has an emphasis on re-urbanisation which has a big effect on travelpatterns. Data on population between 1980and 1990 show an increase in the density ofthe central city, the inner city and the outersuburbs (Kenworthy et al., 1998). This theyachieved by building urban villages aroundtheir rail system in the inner city (e.g. SouthStation) and in new outer suburbs (e.g.
Table 4: Trends in Stockholm and U.S. cities transport, 1980 to 1990.
Car use (VKT) per person Transit Use trips per person
Year 1980 1990 1980 1990U.S. Cities 8,806 10,870 74 66Stockholm 4,867 4,638 304 348
Source: Kenworthy et al., 1998
Havlick & Newman: Can DemandManagement Tame the Automo-bile in a Metropolitan Region?World Transport Policy & Practice4/1 [1998] 30 - 35
Table 3: Copenhagen’s automobile demand management strategy summarised.
Traffic Calming: Regional traffic calming but extensively pedestrian incity centreExtensive 30 km/h zonesEnforcement
Favouring Alternate Modes: Emphasis on bikelanes and pedestrianisationNo extra road capacity, reduction of parking by 3% p.a.for 15 yearsCulture of respect for bicyclists
Economic Penalties: Usual European fuel tax but very high vehicleregistrationNo congestion pricingHigh parking fees
Non Auto Dependent Land Uses: Corridors of growthUrban villages around rail linesMixed use in centres

[ 33 ]
Skarpnak). These new developments are alldense, mixed use areas with a careful eye forthe kind of design characteristics found inthe old inner city of Stockholm. But mostimportantly of all they are built around aquality rail service that links up the wholecity. They have been popular as places to liveand work and have some of the highesttransit levels found in the world.
Case Study 4: Freiburg
Another city which has shown that it isindeed practical to stop the growth of caruse, even when car ownership is growing isFreiburg, Germany. Pucher and Clorer (1992)
provide data which show how Freiburg’s carownership has risen from 113 per 1000people in 1960 to 422 per 1000 in 1990, onlya little under the average for the Zurichagglomeration, and only 14% less than thenational average for Germany (481 per 1000).But as Table 6 below shows, despite thisgrowth in availability of cars, car use hasremained virtually constant since 1976.Transit passengers have increased by 53%and bicycle trips have risen by 96% between1976 and 1991.
Freiburg’s growth in car trips in 15 yearswas only 1.3%, yet total trips increased 30%.Freiburg’s growth in mobility was suppliedprincipally by increased use of publictransport and bicycling. In fact, the share oftrips by car reduced over the 15 years from60% to 47%. Pucher and Clorer also showhow the growth in car ownership has alsobegun to slow down (Freiburg had previouslybeen higher in car ownership than WestGermany as a whole, whereas now it is less).
The summary of Freiburg’s demandmanagement approach is given below inTable 7.
Pucher and Clorer attribute Freiburg’ssuccess at ‘taming the automobile’ to acombination of transportation and physicalplanning strategies:
“First, it has sharply restricted auto use inthe city. Second it has providedaffordable, convenient, and safealternatives to auto use. Finally, it hasstrictly regulated development to ensure acompact land use pattern that isconducive to public transportation,bicycling and walking” (p. 386).
Freiburg has restricted auto use throughmechanisms such as pedestrianisation of thecity centre, area-wide traffic calmingschemes (citywide speed limit of 30 km/h inresidential areas) and more difficult,expensive parking. Freiburg’s improvementsto transit have focussed on extending andupgrading its light rail system as opposed tobuses. Buses are used as feeders to the lightrail system. Land use regulations are similarto many other parts of Europe and haveinvolved limiting the overall amount of landavailable to development and strictly zoningland for agriculture, forests, wildlife reservesor undeveloped open space.
Pucher and Clorer stress the importantautomobile use savings of the more compacturban patterns that have resulted from theselatter policies. It is also worth noting thatafter the Second World War it was decided torebuild Freiburg, totally destroyed by thewar, on the old model, not on an automobile
Havlick & Newman: Can DemandManagement Tame the Automo-bile in a Metropolitan Region?World Transport Policy & Practice4/1 [1998] 30 - 35
Table 7: Freiburg’s automobile demand management strategy summarised.
Traffic Calming: Regional traffic calming but extensively pedestrian incity centreExtensive 30 km/h zonesEnforcement
Favouring Alternate Modes: Strong commitment to transit and bicycle infrastructureLittle extra road capacityTransit pass
Economic Penalties: Usual European fuel tax and vehicle registrationNo congestion pricingHigh parking fees
Non Auto Dependent Land Uses: Corridors of transit-oriented development and no othergrowthUrban villages around rail stopsMixed use in centres
Table 6: Transportation trends in Freiburg, Germany, 1976-1991
Transportation Factor 1976 1991 % Increase 1976-1991Total daily trips 385,000 502,000 + 30.4%Total daily auto trips 231,000 234,000 + 1.3%Auto’s share of non-pedestrian trips 60% 47% n.a.Bicycle’s share of non-pedestrian trips 18% 27% n.a.Source: Pucher and Clorer (1993)
Table 5: Stockholm’s automobile demand management strategy summarised.
Traffic Calming: Regional traffic calming but extensively pedestrianaround each rail stationExtensive 30 km/h zonesEnforcement
Favouring Alternate Modes: Strong commitment to transitLittle extra road capacityTransit culture
Economic Penalties: Usual European fuel tax and vehicle registrationNo congestion pricingHigh parking fees
Non Auto Dependent Land Uses: Corridors of transit-oriented development (TOD) and noother growthUrban villages around new rail stopsMixed use in centres

[ 34 ]
dependent model. Pucher and Clorer notethat even in the post-1960s period, asFreiburg expanded on f latter land to thewest, the resulting development “ … is at amuch higher density than outlying portionsof American metropolitan areas”, as well asbeing within easy reach of publictransportation and well-served by bikeways.
Case Study 5: Boulder, Colorado .
Data on car usage in Boulder show thatdemand management efforts shifted 42% offormer car users who travelled to downtownBoulder to other transportation options. Thismodal shift from the car to alternative formsof transportation took place over a four yearperiod and included downtown employeesand other individuals who lived in Boulderand made trips to the central businessdistrict to their place of employment and/orfor shopping, eating, business transactions,recreation, or to simply watch other people,especially along the 1 km pedestrianisedPearl Street Mall. The alternative modes usedinclude bus, bicycle, walking, car pooling,and shuttle service from outlying parkingareas (park and ride).
In 1993 the Boulder City Councilmandated that nearly 20% of the city’stransportation department annual budget bereallocated away from car-relatedexpenditures such as road widening, doubleturn lanes, more car parking, more stoplights, and better signalling to alternativemode functions. Over a fifteen year periodthis 20% budget reallocation will be
dedicated to non-car alternatives such assmaller buses with bicycle racks, improvedpedestrian crossings and footpaths, anexpanded network of off-roadway bike pathsfor commuters, user friendly bus passes (theEco-pass) for university students, employees,and entire neighbourhoods. A separatedivision called GO BOULDER was formedwith a twelve person staff within theTransportation Department. GO BOULDERstaff members carry out marketingcampaigns, co-ordinate alternate modeinnovations and work on regional trafficdemand management schemes. Other citiesthroughout the Denver Metropolitan Areaconsult frequently with GO BOULDER staffin efforts to reduce Single OccupancyVehicle (SOV) uses. Experiments areunderway to implement peak pricing orcongestion pricing of SOV during rush hour.Programs are in place to reduce traffic andspeeding in neighbourhoods withroundabouts, speed bumps, photo radar, newsmall buses and private shuttle servicesusing main transit corridors.
Specific car disincentive programs havebeen implemented such as doubling rates forcar parking to more c losely reflect car parkland values, doubling parking fines, creatingneighbourhood parking permits for residentsonly, and reducing the number of car spacesrequired in new residential and commercialdevelopment.
The encouragement of telecommuting, acitywide bicycle network, 300 free bicyclesin the Central Business District (Spokes forFolks), Bike to Work weeks, and bicycle-mounted police officers are part of thedemand management strategy to encouragenon-car mobility.
The impact of Boulder’s initiatives at theregional level comes as an unexpectedsurprise. The Denver RegionalTransportation District (RTD) has installedbike racks on all 1400 buses. Bike paths arebeing designed with regional inter-cityconnections. Boulder is being included inplans for passenger rail connections becauseof the proven demand for alternativetransportation modes. Other towns and citiesin Boulder County and the Denver RegionalCouncil of Government jurisdiction are eitherduplicating Boulder’s car tamingexperiments or asking that they beconsidered. Traffic calming or carelimination is an integral part of land useregulation and zoning in Boulder’scomprehensive plan. Mixed use development(work-live proximity), neighbourhood marketcentres, and rezoning of commercial land to
Havlick & Newman: Can DemandManagement Tame the Automo-bile in a Metropolitan Region?World Transport Policy & Practice4/1 [1998] 30 - 35
Table 8 Summary of Boulder’s automobile demand management strategy.
Traffic Calming: Extensive traffic calming including pedestrianisation ofthe city centreSlow zones (30 km/h in most residentialneighbourhoods)Enforcement including digital speed displays, doublefines in slow zones
Favouring Alternate Modes: Strong commitment to bicycle infrastructureHop, Skip and Jump bus system, new rail link,telecommuting, shuttles for kidsLittle extra road capacity allowed, cap on parking withassistance to park on CBD edgeEco-pass, free bikes, bus passes, computerised carpooling, flextime, four day week
Economic Penalties: Usual European fuel tax and vehicle registrationCongestion pricing for SOV’s Double parking fees andfinesPreferential parking fees for HOV’s
Non Auto Dependent Land Uses: Growth management and green beltNoise barriers and open land buffersUrban villages around rail stopsMixed use in centres

[ 35 ]
reduce car journeys and work-related tripsbegan in 1997. Building permits which showno or little need for SOV use are givenpriority under the one percent per annumgrowth management scheme for Boulder(Havlick, 1997).
Even though the average length of car tripshas increased in Boulder over the last fiveyears, as it has in most Australian and someEuropean cities, it is encouraging to realisepublic transport can capture car trips at thelocal level, and provide a potential model forchange at a regional scale.
Boulder has had a policy to try and tamethe automobile for the past ten years. It hasdone this through a range of strategies whichare set out in Table 8. The HOP, SKIP, andJUMP bus system mentioned above in Table8 is an example of metropolitan regional co-operation with the major mass transitprovider in the Denver metro area. The large,diesel burning Rapid Transit District (RTD)bus service was very much underutilised inBoulder. They were seen as intruders and outof place in the streets of Boulder. They wereseen not only as noisy, polluting andinefficient (most were empty) but also asanti-social. The staff of GO BOULDER andthe Boulder City Council recognised this andbegan to work out an arrangement wherebythe City of Boulder would help finance acolourful, fleet of small (24 passenger)circulator buses called the HOP in co-operation with the RTD. It was a verysuccessful 18-month experiment whichcarried 1.5 million passengers.
As a follow up to the present HOPcirculator buses, a major north-south RTDlarge bus route was replaced (again with cityand University of Colorado student funding)by 15 small size buses called the SKIP,complete with bike racks and circulating on a10 minute interval. The SKIP service beganin August 1997. The third phase is called the
JUMP which is planned to connect othernearby cities with direct express services toBoulder.
C oncl u s i ons
The idea that automobile demandmanagement is a lost cause due to consumerpreferences, that inevitably mean increasedautomobility, is not supported by the casestudies presented in this paper. Consumerpreferences are obviously a powerful forcebut in transport terms they are not inevitablyjust directed towards cars. The examplespresented here show that people willrespond given some realistic and suitableoptions. They are also going to respond topublic policy which gives them options to bemore environmentally responsible, e.g. theEco-Pass and other similar initiatives inBoulder. These results would suggest thatgovernments can be much more conf ident inproposing their automobile demandmanagement strategies, particularly if theyhave a strong element of facilitating thecommon good.
In these case studies there is an importantmessage for regional institutions, regionalcouncils of governments, and even nationalgovernments which wish to show a reversalin the consumption of fossil fuels. TheMontreal Accords on Chlorofluorocarbons(CFCs) and other ozone-related gases, and theconcerns of the 1997 Kyoto Climate ChangeConference can be mitigated, in part, withthe encouragement and greater application ofthe case studies in this report. With the hopedemonstrated in our exemplary cities listedabove, and the potential spill-over effects ineach of their large metropolitan regions, theprospect of regional sustainability is givenencouragement. At the very least, thepragmatism of transport demandmanagement is attracting serious attention inseveral metropolitan areas around the world.
Havlick & Newman: Can DemandManagement Tame the Automo-bile in a Metropolitan Region?World Transport Policy & Practice4/1 [1998] 30 - 35
R e fe r e n ce s
Gehl, J. (1992) “The Challenge of Making a Human Quality in theCity” in Perth Beyond 2000 Proceedings of the City ChallengeConference, Perth, September.
Gehl, J. and Gemsoe, L. (1996) Public Life and Public Spaces,Royal Danish Academy of Fine Arts, Copenhagen.
Gordon, P., Kumar, A. and Richardson, H.W. (1989) “TheInfluence of Metropolitan Spatia l Structure on CommutingTimes” Journal of Urban Economics , 26, 138-149.
Havlick, S.W., (1997) “Great Cities for the 21st Century” Presentedat UNEP Regional Workshop for Asia/Pacific: Adopting,Applying and Operating Environmentally Sound Technologiesfor Urban Management, Session 18.
Kenworthy, J.R., et al. (1998) Cities and Automobile Dependence
II: An International Databook. In Preparation.Love, C. (1992) “Cars and Demographics” Access , 1: 4 -11 Berkeley
Transportation Center.Newman, P.W.G. and Kenworthy, J.R. (1989) Cities and
Automobile Dependence: A n International Sourcebook. Gower,Aldershot, U.K.
Newman, P.W.G., Kenworthy, J.R. and Laube, F. (1997) “TheGlobal City and Sustainability” Fifth International Workshop onTechnology and Urban Form, Jakarta, June.
OECD/E CMT, (1996) Urban Trave l and Sustainable DevelopmentOECD, Paris
Pucher, J. and Clorer, S. (1992) “Taming the Automobile inGermany” Transportation Quarterly 46:3:383-395 .

[ 36 ]
Land use patterns that reinforce travel insingle occupancy vehicles (SOV) areincreasingly the Pacific Northwest’s, andAmerica’s, preferred context for single-familyresidential development (Figure 1). As wouldbe expected, vehicle k ilometres travelled(VKT) per capita have also been steadilygrowing during this period of suburbanexpansion (Figure 2).
To document what fraction of a typicalannual household energy budget is currentlydevoted to transportation, both automobileand household operating budgets have beenconverted to common units - Joules.Calculations included the energy lost aswaste heat during the process of generatingand delivering smaller quantities of usefulenergy. Thus, the energy consumed by anautomobile is estimated by multiplying thenumber of litres of gasoline consumed by theentire average energy content per litre (36MJ). In a similar way the energy lost when
The Impact of Transportation onHousehold Energy Consumption
Rick Browning, AIABrowning•Shono Architects, 2701 NW Vaughn, Suite 437, Portland, Oregon 97210,U.S.A. [email protected]
Michele HelouChurch & Merrill Architects, Portland, Oregon, U.S.A. [email protected]
Paul A. LarocqueCarleton Hart Architecture, Portland, Oregon, U.S.A.
The authors computed th evalues in this paper inBritish thermal units (Btu).These have been convertedinto in Joules andMegaJoules.1 Btu = 1055.06 J = 252calor ies1 MJ = 947.81 Btu = 238.85k ca l
Abs t r a ct
This paper examines transportation energycosts as an integral part of total householdenergy consumption. A typical suburbanhousehold is found to expend more than halfits total annual energy budget on operation ofhousehold motor vehicles. In contrast,households located in traditional, pedestrian-oriented neighbourhoods are found to use farless energy on t ransportation. For aninstructive contrast, two household budgetswere generated using a standard computerprogram and then compared. Withtransportation energies included, ahousehold living in an 88 year old ‘energyhog’ house located in a traditional pedestrianfriendly neighbourhood is shown to expendless total annual energy than a suburbanhousehold living in a highly energy efficientmodern house. Studies and statisticsdeveloped in the Pacific Northwest are usedas documentation for travel-relatedbehaviour.
K e yw ord s
Energy, Houses, Modal choice.
Background and G eneral Approach
AT A TIME when home-buyers’ andarchitects’ interest in energy-savingtechnology and design strategies is onceagain on the increase, residentialneighbourhood typology and its profoundimpact on levels of household energy useand pollution ironically remains an almostnegligible concern for many ‘green’practitioners and consumers. The intent ofthis paper is to examine annualtransportation energy use as an integral partof total household energy budgets and tosuggest certain changes as a result of ourfindings. Statistics and climatic conditionsfor the Pacific Northwest have been used, butthe conclusions of the paper are applicable toall regions of the U.S.A.
Figure 2: Daily distance driven per capita in Idaho,
Oregon & Washington, 1957-95 (From FHWA Highway Statistics)
Fig. 2: Daily Distance Driven per CapitaIdaho, Oregon and Washington,1957-'95From FHWA Highway Statistics
0
5
10
15
20
25
1960 1965 1970 1975 1980 1985 1990 19951957
30
1950 1960 1970 1980 19900
10
20
30
40
50%
Suburbs
Cities
Fig. 1: Shares of Population of Idaho, Oregon, and Washington Living in Cities and Suburbs Areas,1950-'90 From US Bureau of the Census Publications
Figure 1: Populations of Idaho, Oregon & Wasghingtonliving in cities and suburbs areas, 1950-90 (From US Census)
Browning, Helou & Larocque: TheImpact of Transportation onHousehold Energy ConsumptionWorld Transport Policy & Practice4/1 [1998] 36 - 39
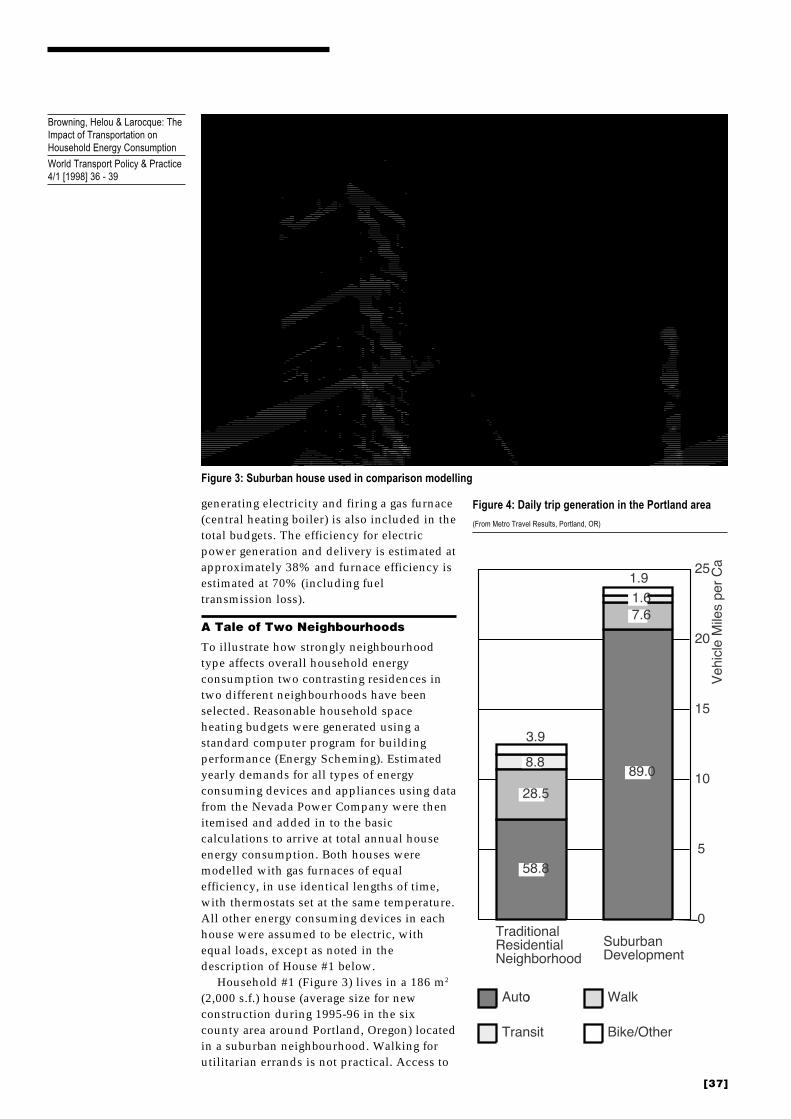
[37]
Browning, Helou & Larocque: TheImpact of Transportation onHousehold Energy Consumption
World Transport Policy & Practice4/1 [1998] 36 - 39
generating electricity and firing a gas furnace(central heating boiler) is also included in thetotal budgets. The efficiency for electricpower generation and delivery is estimated atapproximately 38% and furnace efficiency isestimated at 70% (including fueltransmission loss).
A Tale of Two Neighbourhoods
To illustrate how strongly neighbourhoodtype affects overall household energyconsumption two contrasting residences intwo different neighbourhoods have beenselected. Reasonable household spaceheating budgets were generated using astandard computer program for buildingperformance (Energy Scheming). Estimatedyearly demands for all types of energyconsuming devices and appliances using datafrom the Nevada Power Company were thenitemised and added in to the basiccalculations to arrive at total annual houseenergy consumption. Both houses weremodelled with gas furnaces of equalefficiency, in use identical lengths of time,with thermostats set at the same temperature.All other energy consuming devices in eachhouse were assumed to be electric, withequal loads, except as noted in thedescription of House #1 below.
Household #1 (Figure 3) lives in a 186 m2
(2,000 s.f.) house (average size for newconstruction during 1995-96 in the sixcounty area around Portland, Oregon) locatedin a suburban neighbourhood. Walking forutilitarian errands is not practical. Access to
Figure 4: Daily trip generation in the Portland area
(From Metro Travel Results, Portland, OR)
0
5
10
15
20
25
58.8
8.8
3.9
28.5
89.0
1.9
7.6 1.6
Traditional Residential Neighborhood
Suburban Development
Auto
Transit
Auto
Bike/Other
Walk
Veh
icle
Mile
s pe
r C
a
Figure 3: Suburban house used in comparison modelling

[ 38 ]
mass transit is inconvenient and use of abicycle for transportation is intimidating.Based on averages from recent studies ofaggregate odometer readings in this type ofnew suburban neighbourhood, householdautomobile usage is assumed to be 48,000 km(30,000 miles) per annum (Calthorpe, 1993).
The Bonneville Power Administration’s‘Super Good Cents’ buildingrecommendations were followed in House# 1, taking performance considerably beyondbasic code minima, with a calculated spaceheating budget for northwestern Oregon of44,210 MJ per annum. In comparison toHousehold # 2, a slight but measurablygreater desire for comfort has been assumedas regards the choice and use of householdappliances. For example, Household # 1 has aquick recovery water heater, whileHousehold # 2 does not. Household # 1 has a566 litre (20 cu. ft.) frost-free refrigerator,while Household # 2 has a 453 litre (16 cu.ft.) manual defrost model. House # 1, with allenergy-using devices combined consumes atotal 167,120 MJ per annum.
Household # 2 lives in an 88 year old 130m2 (1,400 s.f.) frame house located in atraditional, inner city neighbourhood ofPortland, Oregon. A wide range of retailshops and basic services are located within afew blocks of House # 2, accessible by footalong pleasant, tree-lined streets. Mass transitis nearby and convenient. A typical trip tothe regional centre of downtown Portlandtakes about 10 minutes by bicycle or bus. Anin-depth travel survey conducted in 1996 byMetro, the Portland area’s regional planningauthority, used thousands of detailed ‘traveldiaries’ to document individualtransportation choices. Results showed thatresidents in Household # 2’s type oftraditional, pedestrian-friendlyneighbourhood not only drive less, but make
substantially more daily trips without a carthan their suburban counterparts (Figure 4).Automobile usage is assumed to be 24,000km (15,000 miles) per annum for Household# 2 (Calthorpe, 1993).
House # 2 is an early 20th century ‘energyhog’ with no insulation, single-panewindows, poor south orientation and a largeamount of infiltration coming in throughalmost 90 years worth of cracks and gaps inthe exterior envelope. With the exceptionnoted in the description for Household # 1,the family of Household # 2 owns all thesame types of appliances, lights and climatecontrol devices as Household # 1 and usesthem with equal frequency.
Household #2 has a calculated spaceheating budget of 141,380 MJ per annum, andthe house, with all other appliances, etc.added in, consumes a total 248,570 MJ perannum. House # 1 is therefore 149% moreefficient than House # 2 while also being143% larger.
Under the assumption (currently beingresearched by the authors) that familiesfacing increased driving demands, especiallythose with children, tend to choosesomewhat larger, more commodious vehicles,Household # 1 is assigned cars with fuelratings in the current range of sport utilityvehicles and family vans - about 11 litres/100km (21 mpg). Household # 2 is assigned thecurrent normal passenger car average of 8.3litres/100 km (28 mpg).
Household # 1’s car energy budget is190,080 MJ per annum, making a total (car +house) energy consumption for Household # 1of 357,200 MJ per annum. Car energyconsumption is therefore more than 50% ofthe total. Household #2’s car energy budget is71,712 MJ per annum, making a total energyconsumption for Household # 2 of 320,282 MJper annum. The comparison of these
Browning, Helou & Larocque: TheImpact of Transportation onHousehold Energy ConsumptionWorld Transport Policy & Practice4/1 [1998] 36 - 39
Table 1: Amalgamation of the various calculations for the two households
household #1 off grid household #2 upgraded reduced car usesize (m2) 186 186 130 130 130total for house 167120 0 248570 138110 138110
CARdistance travelled 48000 48000 24000 24000 17393l/100km 11 11 8.3 8.3 8.3fuel used (litres) 5280 5280 1992 1992 1443.6energy MJ/l 36 36 36 36 36energy consumed 190080 190080 71712 71712 51970.3
total for house 167120 0 248570 138110 138110plus the car 190080 190080 71712 71712 51970.3
Grand Total 357200 190080 320282 209822 190080.3

[ 39 ]
household totals shows that the household inthe traditional neighbourhood (Household# 2), living with uninsulated walls, single-pane windows, etc., still uses approximately10% less energy per annum than the ‘SuperGood Cents’ suburban house, despite its R26walls, R38 ceilings, U-0.30 windows, etc.Automobile use makes the difference,comprising 53% of the suburban household’stotal annual energy budget, but only 22% ofthe inner city household’s budget.
If, through extraordinary measures, thesuburban house goes off-line entirely,becoming a self-reliant ‘earthship’, while thetraditional neighbourhood household merelyupgrades to current Oregon energy codeminima, calculations indicate that thesuburban household can turn the tables ontheir traditional neighbourhood counterparts.In this scenario the suburban earthshiphousehold will have an energy budget of190,080 MJ per annum, (car alone). Afterupgrading to energy code minima thetraditional neighbourhood house energyconsumption would be reduced to 138,110MJ per annum, making a total (car + house)of 209,822 MJ per annum - just 11% morethan the off-grid suburban earthship. Byreducing VKT per annum by 6607 km, orabout 27.53% of their annual total, thetraditional neighbourhood household could,in conjunction with the aforementionedupgrades, equal the energy performance ofthe suburban earthship household.
Back to the Future - Tomorrow’shouse and yesterday’s t radit ionalnei ghbour hood
From these results we therefore concludethat for America’s foreseeable futureinfluencing household transportation choicesoffers the greatest opportunity for householdenergy conservation rather thanimplementing additional energy-savingarchitectural design features. Attempts toaffect transportation behaviour are oftendismissed as ‘social engineering’ and thusoutside the proper realm of planners andarchitects. However, a growing amount ofhard data, including the studies cited in thispaper, document how the built environmentin the form of neighbourhood typologyinfluences travel behaviour. A singleexample is telling - according to the Metrotravel survey walking comprises 7.6% of alltrips in Portland’s suburbs and 28.5% inmixed-use traditional neighbourhoods.Residents of this particular neighbourhoodtype are thus four times more likely to go byfoot on a given daily errand than are their
Browning, Helou & Larocque: TheImpact of Transportation onHousehold Energy ConsumptionWorld Transport Policy & Practice4/1 [1998] 36 - 39
suburban counterparts.Design and construction professionals
concerned with reducing our profligate rateof energy use must begin to take a moreproactive stance in favour of mixed use,pedestrian-oriented development. Althoughpollution and other adverse environmentalimpacts stemming from overuse of privateautomobiles have not been addressed by thispaper, when these impacts are alsoconsidered, increased emphasis onpedestrian-oriented neighbourhoods becomeseven more imperative for a sustainablefuture.
While design professionals are limited inwhat they can control, it is suggested that afirst step towards promoting greaterhousehold energy efficiency should be toinclude estimated energy consumption bymotor vehicles in presentations to clients andpeers on the efficiency of specific designcommissions. Information presented in thispaper begins to show how averagetransportation costs could be estimated basedon neighbourhood typology and thenconverted to units compatible with otherexpressions of residential energyconsumption. In this way the ‘invisible’, buthuge, energy cost of personal vehicles innon-urban environments would be mademore generally apparent; those projects inpedestrian-friendly urban environmentscould likewise receive greater credit for theirnow often unrecognised role in energyconservation.
Many clients have a sincere desire to buildin a sustainable fashion. However, expandingthe consciousness of these clients to think ofsustainable design not just in terms ofbuilding materials and operating costs is ofvital importance. In many cases they may nothave thought through the full impacts oftransportation and how such energy costscan be incorporated into the design process.Architects and design professionals of alldescriptions should be looking beyond thetechnics of construction and the propertylines of a specific project site. We must begineducating our clients that where we buildultimately has more impact on ouroverburdened environment than what webuild.
R e fe r e n ce sCalthorpe, P. (1993) The Next American
Metropolis Princeton Arch. Press, Princeton.Daily Journal of Commerce (1996) “Metro Travel
Survey Results” Portland, Oregon, Dec. 30.Nevada Power Company (n.d.) Conservation With
Household Appliances 6-90/5M/BOW, Las Vegas,Nevada.

[ 40 ]
Abs t r a ct
Quito’s new trolleybus is a great success. It isbeing expanded already. Consisting of aknow-how transfer from a Latin Americancity, Curitiba (Brazil), to another LatinAmerican city, Quito (Ecuador), these twoexperiences display a new and originaldevelopment model. By occupying urbanspace, and therefore limiting the presence ofthe car, too often promoted withoutconsidering environmental and ecologicalconsequences, the ‘reserved structuring axes’for public transport allow high mobility atlow cost. The advantages of this model arenumerous and could profit many other cities.Today, more and more questions oftechnological choices are part of the politicaland ecological debate. Transport is no longera secondary issue.
K e yw ord s
Trolleybus, urban transport, Curitiba, Quito.
Intr oduct i on
DO RESERVED traffic lanes for publictransport augur a re-humanisation of cities?That is what the new trolleybus in Quitoseems to demonstrate. All the newspapers inEcuador write about it. A city with aconservative reputation, decision centre of anold landlord oligarchy today losing some ofits influence, Quito’s trolleybus gives theEcuadorian capital a refreshingly modernlook. With 1.2 million inhabitants, the cityspreads in a valley measuring 44 kilometresby 6; a modern centre with shantytownsstretching at its northern and southern endsfor 10 kilometres. And of course, growingtransport problems, apparently unavoidable.Yet, traffic jams are not a law of nature andMr. Jamil Mahuad, the youthful, newlyelected mayor of Quito, had the intention toend a ‘laissez-faire’ policy. Anchor point ofhis strategy: the construction of an 11 kmlong trolleybus route across town, officially
inaugurated in April 1996.Its conception is inspired by a model
praised by more than one observer - thetransport system in Curitiba which, besidesmobility, integrates social objectives.Applying the conclusions of long termresearch, adapting these to limited economicresources, the transport network of Curitibais part of a development strategy integratingland use by giving priority to mobility ratherthan to a particular transport mode. Indeed,too often the car or the underground railwayare presented as the panacea as soon as a cityreaches one million inhabitants. Curitibashows, in a spectacular way, to which extentthese are erroneous views. According to anew concept, planning does not only mean tofulfil demand; it aims at pulling up thequality of life of a whole community.
Now, is Quito a case where a country fromthe so-called South transfers to anothercountry from the South its understandingand, to make this occurrence even moreinteresting, a know-how that goes towardssustainable development? This is what theconstruction of Quito’s trolleybus seems toreveal. With advice from the United NationsDevelopment Programme, Quito appears asone of the first cities to take advantage of thisnew approach.
A remake of Curitiba’s experience inEcuador’s capital could confirm thestructuring effect, from an urban as well asfrom an economic viewpoint, of aninnovative development policy integratingland planning with transport policies. As itis, Curitiba brings the proof that a transportsystem with reserved surface lanes, offers aquality service that can be compared to anunderground railway but at a much lowercost. By its occupation of the space normallyattributed to the private car, reserved surfacetraffic lanes avoid the numerous dictatesimposed by the ‘cars-only’ society. This way,a response is given to people’s mobilityneeds, thus integrating the constraints ofglobal ecology, the new player ininternational relations. Before presenting
From Curitiba to Quito:Reserved traffic lanes for public transport as anecological, economic and social policy for cities
The currency used is theU.S.$
Benoî t LambertAssistant, Faculté de Droit, Université de GenèveDépartment d’histoire du droit et des doctrines juridiques et politiques,102 boulevard Carl-Vogt, CH-1211 Genève 4, Switzerland.Email:[email protected]
Lambert: From Curitiba to Quito:Reserved traffic lanes for publictransport as an ecologically, eco-nomic and social policy for cities.World Transport Policy & Practice4/1 [1998] 40 - 46
[ 41 ]
Quito’s experience, let us f irst see whatmakes the success of Curitiba’s model.
Curitiba - more than an example - amod e l
In 1992, while experts and politicians meetby the thousands at the Earth Summit in Riode Janeiro to elaborate a Charter to save theplanet, a Brazilian mayor tours his modelcity with his guests. To the world, heexplains what as been done to avoid trafficjams and pollution, to offer citizensbreathable air, clean sidewalks and greenparks. Politicians from major cities listenedand learned that a megalopolis can becomeliveable without putting its public financesin peril. Traffic is surprisingly fluid, thanksmainly to efficient public transport, anincitement for city dwellers to leave their carat home. Buses have priority and drive athigh speed on avenues, thanks to doublereserved central corridors: 2000 busestransport 1.3 million commuters every day.The success of the Paraná State capital(population 2 million) is unique: it breakswith more than one myth on the necessity ofmassive investment (not to say pharaonic), inpublic transportation. While in Europe,Copenhagen (population 1 million) is one ofthe major cities to have seriously limited itsaccess to cars, Curitiba has succeeded inencouraging an important modal orientationtowards the bus. A study by Kaufmann andGuidez (1996) of Bern, Geneva and Lausannein Switzerland; and Besançon, Grenoble andToulouse in France shows how difficult thisexercise is.
Mr. Jaime Lerner, three times mayor of thecity before being elected as State governor in1995, has been a key actor in this success. Anarchitect and town planner, he had been thesecond director (1968-69) of the CuritibaResearch and Urban Planning Institute. Firsta theoretician, he became the competentprime contractor of the urban developmentstrategy of Curitiba around ‘five mainstructuring axes’. Each of these central roadscontains two express bus lanes flanked bylocal roads; one block away to either side runhigh-capacity one-way streets heading intoand out of the city centre. But what makesthe originality and the strength of theCuritiba model is its successful integration ofland-use legislation with transport policy.
Integration of land-use and transport policyIn the area adjacent to each axis, the land-uselegislation encourages high densityoccupation, while the construction of
buildings six floors high are allowed on thestructuring axes themselves. This density co-efficient is reduced the further you go frompublic transport. This legislation that orientsplanning in the centre, encourages thedevelopment of new commercial andresidential zones along the structuring axes.Pollution and noise problems, excessiveconcentration of commercial activities in thecentre, and its domination by banking,financial and service activities are thereforelimited. This policy has allowed the creationof a convivial and vibrant city centre, dayand night. Today, 49 blocks linking parksand bus terminals are pedestrian and for 1square meter of green space per capita in1970, the city had 50 in 1992. Curitiba hasalso reached an equilibrium between highdensity commercial and residential zonesand the public transport offer. The municipalauthority itself acquired land along thestructuring axes to build housing for lowerincome earners - close to public transport,those people are better located to integrateinto economic activity.
For a single, low fare, good on the entirenetwork, Curitiba’s public transport isorganised as a ‘surface subway’ withterminals in which the traveller can circulateand shop, later changing route withouthaving to pay for a new journey. Theterminals are attractive; beautified byflowers, trees and a pleasant architecture. Inthis, one of the central ideas of the transportsystem is the ease with which people cantransfer from a local bus to an express one,and later take another local service, all this ina pleasant environment. The new stations,with ‘boarding tubes’ equipped withplatforms reaching the height of the busfloor, greatly reduce the time necessary forpassengers to get on and off the buses.Thanks to these boarding tubes, it is possibleto double the number of passengers per hour.Compared with traditional buses operatingon a road where cars are allowed, these busestransport three times as many passengers. Asit is, the reserved lanes make the systemprofitable. The boarding tube imagined inCuritiba, eliminates the need for ticketcontrol on buses because the fare is paidbefore getting on the boarding platform. Also,motorised equipment is f ixed to the platform,allowing access for handicapped. Finally,Curitiba’s buses are painted according totheir function allowing for easyidentification: express services are red, greenbuses travel between neighbourhoods, thosecoming to town from suburbs are yellow.
Lambert: From Curitiba to Quito:Reserved traffic lanes for publictransport as an ecologically, eco-nomic and social policy for cities.
World Transport Policy & Practice4/1 [1998] 40 - 46

[ 42 ]
Privatise transport without privatising thecityAccording to Jonas Rabinovitch, the formerdirector of foreign relations for Curitiba andtoday employed by the United NationsDevelopment Program, the ‘express buses onreserved lanes’, at $0.2 million per km, areconsiderably less expensive to develop thana surface light rail system ($20 million perkm) or an underground subway, typically$60-100 million per km (Rabinovitch andLeitman, 1996). It represents an affordablesolution in a country with limited financialresources. This price differential needs aclarification: in Curitiba it includes thefinancing and construction of boarding tubes,reserved lanes and terminals by the city; itdoes not include the acquisition of buses, aninvestment done by private companies, thusexplaining the extraordinary low cost. Butthis gap is not necessarily overestimated - thecost of the underground subway in Rio deJaneiro reaches an extraordinary $200million per km on some sections. Quito’strolleybus which receives no privatefinancing cost $65 million for 11 km, that is$5.91 million per km, including vehicleacquisition.
Rabinovitch admits that these areestimates as construction costs vary greatlyfrom city to city. Still, the numbers speak forthemselves: buses or trolleybuses are tens oftimes cheaper than subways.
“By putting concrete and asphalt above theground instead of excavating to place steelrails underneath it, the city managed toachieve most of the goals that subways strivefor at less than 5% of the initial cost.”(Rabinovitch and Leitman, 1996, p. 30)
With the money saved, Curitiba endeavoursto respond to the people’s needs, including avery successful program in environmentaleducation for children from favelas. Also, thebuses are free for certain citizens or Stateemployees: people aged more than 65, thepolice, school children in uniform, andfiremen and postmen in uniform.
The integrated bus transport system withreserved lanes built since 1974 is therefore amixed enterprise: it is formed byUrbanisação de Curitiba, a municipalinstitution, and 10 private companies underthe eye of the Curitiba Research and UrbanPlanning Institute. 2000 buses, owned bythose companies, operate on routesauthorised by the municipality in response topublic demand. They are obliged to followcertain requirements established by the cityand are paid a fee per kilometre served asspecified in the route permit. Authorisations
may be withdrawn if the agreement is notrespected, but would of course be precededby warnings or financial sanctions. Adding totheir payment per km served, every companygets a monthly rate of return on the capitalinvested in the bus fleet of 1% and a yearly3% return on administrative costs forequipment and infrastructure. Furthermore,the municipality often buys the old buses atthe end of their useful lifecycle, to use themas mobile schools or for cultural activities,etc. According to Urbanisação de Curitiba,75% of the population uses public transport,thus explaining its good financial heathdespite the absence of direct subsidies. Thefares paid by the users are put in a city fundand the private companies are paid every tendays. In short, a private-public partnership,but without the influence of purely financialinterests on urban planning.
Modal orientationDespite its 500,000 cars, 250 per 1000inhabitants, more per capita than any othercity in Brazil (see Box 1), Curitiba doesn’thave a traffic problem. According to theBonilha Institute based in the region, 28% ofbus users in Curitiba would use their car ifthe bus priority measures did not exist, thusresulting in gasoline consumption which is25% lower than in other similar Braziliancities (Rabinovitch and Leitman, 1996). Inthis, the public transport system is directlyresponsible for the relatively low pollutionlevel registered in Curitiba despite the use ofbuses running with diesel motors. Besidesthe health benefits of this strategy, thesavings this transport policy allows for thepopulation is one of its very positive effects -on average, they spend only 10% of theirincome on transport (Newman, 1996), a ratiothat is low for this part of the world wherethe poor easily can spend up to 25% of ameagre income on transport (World Bank,1994). The attractiveness of the publictransport network invites inhabitants tomove more than they would do otherwise:they make 202 trips a year against 158 in SãoPaulo.
The boarding tubes, the automatic farecollection, bus priority at traffic lights (usingtransponders); these are among technicalimprovements progressively introduced forthe optimisation of the transport system anda low operating cost. New measures areconstantly studied by the Curitiba Researchand Urban Planning Institute which plays acentral role in this success. For example,buses with a double articulation, unique inthe world, are built by Volvo for Curitiba. In
Lambert: From Curitiba to Quito:Reserved traffic lanes for publictransport as an ecologically, eco-nomic and social policy for cities.
World Transport Policy & Practice4/1 [1998] 40 - 46

[ 43 ]
Box 1: A Note on Numbers
Data appearing in publications on transport can be far from data presented in theoriginal source, as terms used for car ownership are sometimes misunderstood orcalculations lack accuracy. In An Urbanizing World Passenger Cars is evaluated at 15for Ecuador (p. 275); but ‘Motor Cars’, in the Statistical Annex (p. 524), at 36.9. Brazilgoes from 83 to 88, etc. Quite relevant is a note which explains that “motor cars … referto passenger cars and commercial vehicles. Special purpose vehicle such asmotorcycles, trams, ambulances … are excluded”. Figures on “passenger, motor orprivate cars” often suffer from the absence of such a definition.
Clearly, for the moment, passenger cars in Ecuador are much less numerous than motorcars as defined here above. At the Office for Statistics in Quito, I found that total vehicleownership went from 299,866 in 1984 to 463,289 in 1994, including automobiles whichare up from 85,717 to 156,756. This last figure corresponds to passenger cars doublingas mentioned on page 275 of An Urbanizing World, even if the year of reference (1985or latest year) lacks precision.
Most, if not all major research centres, e.g. World Watch Institute, World ResourcesInstitute, etc. - take the World Motor Vehicle Data, published by the AmericanAutomobile Manufactures Association, as source for their figures. In this publication,registrations are presented in two columns: passenger cars and commercial vehicles. Asit also gives the population for every country, car ownership and commercial vehiclesper 1000 inhabitants can be calculated. Population per car and per vehicle is given.According to World Motor Vehicle Data (1998) with data from 1996, global passengercar ownership is 486 millions (from 480 in 1994), commercial vehicles 185 millions (from150 in 1994) giving a total of 671 million registrations (from 629 in 1994). This is one carfor every twelve human beings or a four wheel (or more) motor vehicle for every 9people. The World Motor Vehicle Data appear as the prime source for data on vehicleregistration. In fact, since the International Road Transport Union and the United NationsDevelopment Programme are no longer producing this information, it may now be theonly source available on a regular basis.
The total of motor cars for Japan in An Urbanising World is certainly a mistake. Inaddition, we may wonder if the reduction of passenger cars in Brazil is real - or just achange of definition - while the total goes up and commercial vehicles are multiplied byfour! Also worth noting is the amazing reduction of passenger cars and the increase ofcommercial vehicle ownership in the U.S.A., or this may reflect the explosion in ‘jeep’ or‘recreational vehicle’ (RV) ownership. Whether criteria defining ‘Commercial Vehicles’have changed or more Americans are driving RVs, ‘Passenger Car’ ownership in theU.S.A. has changed from 147 millions in 1991 to 130 millions in 1996 and CommercialVehicle ownership has risen from 48 millions in 1991 to 77 millions in 1996.
use since 1992, they have a capacity for 270passengers, against 170 for buses with asingle articulation. For a 59% increase in itscapacity, the fuel consumption increase isjust 16%. The development of a local marketfor this kind of bus - 33 buses with bi-articulation sold at $450,000 each - promptedVolvo to open a plant in the city.
Again and again, the example of Curitibarefutes the contemporary belief that costlytechnical solutions are the panacea to urbanproblems. Many planners have said in thepast that cities with a population of morethan one million must build a subway toavoid traffic congestion. The dominantdogma also says that cities producing morethan 1000 tons of solid waste per day, needexpensive plant to separate garbagemechanically. Curitiba has neither withresults that could surprise quite a few‘experts’. Exemplary without having solvedall problems of a Southern city, will theCuritiba model be emulated? The interest ofQuito’s trolleybus project is precisely that itseems to announce the appearance of a newdevelopment logic. It can be hoped that itwill not be limited to transport.
Quito : the t ro lleybus conquers theheart o f the public
Will the success of Curitiba be repeated inQuito? Since the opening of the trolleybus inQuito at the beginning of 1996, criticism hasbecome rare. Before the advent of thetrolleybus it took up to two hours to coverthe route between Villa Flora station, in theSouth of the capital, and the Y station, in theNorth. Today, the journey time has beenhalved. The trolleybuses have replaced theold, polluting, noisy, uncomfortable buseswith their irregular routes and schedules. Ata rate of one trolleybus every two minutes,hooked to the electric cable that feeds itsmotor, it runs on private lanes. Inspired bythose built in Curitiba, the 40 stops (oneevery 400 meters), are real boardingplatforms alike those in a modern trainstation. Access to the trolleybus is eased by amobile steel plate that comes down in frontof the three doors when they open, givingaccess to the buses at floor level.
The trolleybus carries not less than170,000 passengers each day, a popularitymuch higher than initially expected. As aresult, its frequency during peak demandperiods will be doubled. After six months ofservice, out of one thousand peoplequestioned, 75% were in favour of thetrolleybus, with only 2% dissatisfaction. The
Table 1: Car and commercial vehicles ownership in selected countries (per
1000 people)
Source: An Urbanizing World,World Motor Vehicle Data 1998Cars Others Total Cars Others Total
(p. 275) (pp. 522-525)
Brazil * 83 5 88 78 20 98Ecuador 15 22 37 22 36 58France 382 105 487 436 90 526Indonesia 6 11 17 11 10 21UK 313 100 413 424 62 486U.S.A. * 588 167 755 484 286 770Japan * 303 ? 209 373 174 547Denmark 295 78 373 331 66 397Notes: * Data for Brazil, U.S.A. and Japan in An Urbanizing World are from the World Resources Report 1996-97 of the World Resources Institute quoting the World Motor Vehicle Data 1993 (data for 1991). Other datain An Urbanis ing World come from Table 29 of United Nations (1988 ) Compendium of Social Statistics andIndicators .

[ 44 ]
others qualify it as acceptable, regular inSpanish. ‘People love the trolley and theyrespect it,’ confirms engineer RaúlMaldonada, director of the operation unit ofthe trolleybus system. The new equipmentoffers security, regularity and speed tocommuters, who used to lose a lot of time intheir everyday transport (El Comercio,August 9, 1996). The building of a subwayline or a fast tram on rails was withdrawnbecause of the weakness of buildings in theold historical centre, classified a worldheritage site by UNESCO in 1978.Consequently, in January 1994, the CityCouncil took the decision, to build anelectric bus in reserved lanes with access byelevated boarding platforms and purchase inadvance tickets, inspired from the Curitibamodel.
A financial health allowing project extensionOf the $65 million that Quito’s trolleybus hascost, $50 million have been borrowed; halffrom a Spanish development fund at aninterest rate almost nil (0.3%), withrepayment beginning after ten years; theother half borrowed from OECD at 8% p.a.for 12 years, with two years interest-free.Instant success on its initial phase, Quito’strolley extension and the increase offrequencies for the existing section shouldbegin in a few months. Twelve additionalkilometres will be built - adding to theexisting 11 km - making the trolleybus crossQuito on half its length. The newinvestments reach $110 million for 59 newvehicles. This development will be done intwo trenches of $55 million, the first oneplanned to end in March 1999. Let us notethat in this first phase, $2.4 million will go toexpanding a radio transponder system givingpriority to the trolleybuses at traffic lights asis the case in the Curitiba. It is expected thatonce the trolleybus is completed, it willtransport 300,000 Quiteños daily. At themoment the fare for a trip is approximately$0.28, with the possibility to buy books oftickets (10 trips for $2, 50 for approximately$7) and $0.20 for students, children andelders.
If those fares seem low to the mostfavoured of the world economy, they are highfor many inhabitants of the Ecuadoriancapital. This is why, inspired once again byCuritiba’s experience, a single fare policy isapplied: either the traveller is taking one bus,many buses, many buses plus the trolleybusor just the trolleybus. As in Curitiba, therevenues are collected centrally, short tripsare the same price as longer ones done by
people coming from distant poor suburbs(wealthier neighbourhoods are locatedmainly in the centre). That way, a certainamount of wealth redistribution occurs. It isvital that the transport service is affordableon the one hand to those on low income, andattractive and safe on the other to attractwealthier commuters who would otherwisebe tempted to commute by car and whosemodal choice could negate any publictransport fluidity. We may wonder if thiskind of solidarity by sharing the mobilitycost would have been possible in the case ofa major investment, like a subway?
Operating the feeder buses ‘busesalimentadores’ making the link withtrolleybuses, are offered as contracts to theprivate sector and the entrepreneur is paidper kilometre served. The municipalitymanages this common fund and covers thedeficit on certain routes by its gains on otherlines, including the trolleybus line. While inCuritiba the service on the entire network isprovided by the private sector, the operationin Quito is carried out by the municipality(trolleybuses) and, for the other part, bysmall private entrepreneurs, some of themowning only one feeder bus. Those smallentrepreneurs have to respect certain norms.The maximum bus age has been reducedfrom 27 years to 20 as a first step to reducepollution - vehicles achieving EuropeanUnion standards are becoming more commonsince the Transport Planning andManagement Unit of Quito began managingthe sector, supervised by the police in thepast. Finally, it is noteworthy that, as hasbeen the case in France for the building oftram lines in Grenoble, Lille, Strasbourg andNantes, the inauguration of Quito’strolleybus has been the topic of animatedpolitical debate and the re-election of Mr.Mahuad as mayor is associated by mostobservers with this event.
Towards sus tainable societ ies in thetwenty-f irst century
According to official statistics, the number ofcars would have doubled in Ecuador between1984 and 1994. At the present rate, theEarth’s car population will reach a billionwithin twenty-five years, this means adoubling of cars now on the road. (Tunali,1996) Will the ‘Autosphere’ destroy theBiosphere in which we live and on which wedepend? Climate change, biodiversitydestruction, pollution of seas: the threat isreal. What is at stake with traffic calminggoes well beyond the quality of life in c ities
Lambert: From Curitiba to Quito:Reserved traffic lanes for publictransport as an ecologically, eco-nomic and social policy for cities.
World Transport Policy & Practice4/1 [1998] 40 - 46

[ 45 ]
(Lambert, 1998).In Ecuador, as in other developing
countries, car manufacturers invest inpromoting new roads. (Let us not forget thatin the 1930s, Los Angeles had the largeststreetcar network in the world. Tounderstand how it has been dismantled (as inalmost every other American city) by GeneralMotors, Ford and Chrysler with help fromother multinationals, see Snell, 1974. ThePBS network (U.S.A.) film Taken for a Ride(1996), describes how the automobile andpetroleum industries orchestrated acampaign to dismantle public transport andcultivated a dependency on privatemotorisation.) General Motors will openshortly a new assembly plant in Quito. Yet,negative effects of the car are well known -urban sprawl, pollution, road accidents,anonymity of cities framed by and for the car.Their destructive impacts have been knownin cities like Mexico where, it is said, somechildren have never seen a star… smog beingpermanent. Road infrastructures often crosspoor suburbs where inhabitants have littlemeans to oppose mega-projects undertakenwith the blessing and the financial support ofbig international organisations. Barelymotorised, they are the victims, more thanthe beneficiaries, of those projects.
Walter Hook from the Institute forTransport and Development Policy (ITDP) inNew York, blames the World Bank, for usingand recommending to its clients a computerprogram, Highway Design MaintenanceStandards Model Version III (HDM) preciselyignoring pedestrians and other non-motorised people.
“The economic benefits and costs offundamentally different approaches tomeeting the same mobility needs are notcompared. Only once a project has alreadybeen determined to be a road or rail orsubway project are these economicimpacts assessed.” (Hook, 1994, p. 8)
This absence of a multi-criteria approach thatgoes beyond economic abstracts, is notexclusive to the World Bank. But the series ofgood intentions announced in SustainableTransport, a document in which the bankannounces its new priorities ‘to limit the
consequences of a rapid motorisation in theworld’, in particular the uncontrolleddevelopment of the private car, will bejudged on facts by all those concerned withthe issue (World Bank, 1996, p.3).
Meanwhile, in Europe many cities such asAmsterdam, Copenhagen, Bern, Zurich,Basel, Grenoble and Strasbourg, are trying towin back control of their streets and publicspaces by developing public transport,cycling paths and walking zones. LikeCuritiba in Latin America, Copenhagen isreally a model in Europe - as early as 1962,the Danish capital developed cycling lanes(by progressively getting rid of parkingspaces along the streets) and an exemplarypublic transport system. Today, there are10% less cars in the city than in 1970; 33%of trips are done by bicycle (thanks to afavourable topography, and despitechangeable and sometimes difficult weather),a proportion that equals that of publictransport and the automobile.
It has been said that Latin American citiesare built more like European c ities thanNorth American megalopolises. Thischaracter is of course threatened by urbansprawl which cannot be dissociated from caruse. Recently, Eduardo Galeano has criticisedthe attitude of his compatriots towards thecar and the consuming society:
“Kidnapping of the ends by the means: thesupermarket buys you, the televisionwatches you, the automobile drives you…We Latin Americans have swallowed thepill that the hell of Los Angeles is the onlypossible model of modernisation: avertiginous superhighway that scornspublic transport, practices velocity as aform of violence, and drives people out.We’ve been taught to drink poison, andwell pay any price as long as it comes in ashiny bottle.” (Galeano, 1995, p. 20)
Thanks to people like Galeano, to modelslike Curitiba, mistakes made in the Northcould be avoided.
Concl u s i on
The criteria favouring choice for publictransport are numerous, but one fact isobvious in almost every city - too oftendecisions are taken giving absolute surfacepriority to the deified car. But this monopolyof the urban space, the fruit of a narrowvision of mobility, is well contested today bypublic transport, pedestrians, cyclists andother non-motorised people (skaters). Inalmost all occidental cities, smallassociations defend the use of the bicycle as
Lambert: From Curitiba to Quito:Reserved traffic lanes for publictransport as an ecologically, eco-nomic and social policy for cities.
World Transport Policy & Practice4/1 [1998] 40 - 46
Table 2: Four positive aspects of indirect wealth redistribution coming with publictransport access.
•Social equity is the best warranty for a dynamic, crime-free society•Economic many work in the centre•Practical solving urban transport problems needs the involvement of all social
classes•Environmental reductions in air pollution have an immediate knock-on effect on
health and quality of life

[ 46 ]
a mode of transport and are promoting aradically different approach of mobility andurban planning (Lambert, 1995). On August1st 1997 a cyclist protest in San Franciscoended with the arrest of 250. The newspaperUSA Today printed ‘Bike riders becoming amajor political force’ as a headline. Indeed,isn’t their message going far beyond thesimple defence of non-motorised two wheelsusers?
Despite the unceasing ‘economic growth =solution to all our problems’ of traditionaleconomic rhetoric, with the appointment inFrance of Mme. Dominique Voynet (Green) asTerritory Planning and Environment Ministerof M. Lionel Jospin’s (Socialist) government,technological choices in transport will beguided by a new reality: political ecology. Letus remember here that the transition fromscientific ecology to political ecology wasprompted by the publication in 1962 ofSilent Spring by Rachel Carson. Highlightingthe abuse of numerous pesticides inagriculture; from chemicals like chlorinatedhydrocarbons (DDT), now forbidden inoccidental countries, to organophosphates,
some of which have been used as weapons;Carson’s book triggered an amazingcontroversy of which she herself was avictim (insults, threats, Time magazineScience section wrote about ‘her emotionaland inaccurate outburst’…). But in the end,Carson shook up the powerful chemicalindustry which perpetuates and perpetratesbiocide.
Nuclear electricity, greenhouse effect,anthropogenic leeway, ozone layerdestruction, landscape and quality of lifedeterioration - scientific controversy fortechnological choices are today a field ofpolitical discourse. Transportation is nolonger a secondary issue. In an interviewwith L’Événement du jeudi (in June 1997),Mme. Voynet declared her intention to“Transform buses in real ‘surface subways’ toremedy their slow pace by the creation ofreserved lanes so that they avoid trafficjams”. In Curitiba and in Quito this hasalready been understood… by developingbuses or trolleybuses as ‘surface subways’, itis an ecological, economic and social policyfor the city which is at stake.
American Automobile Manufactures Association (1998) WorldMotor Vehicle Data 1998 AAMA, Detroit, Michigan.
Galeano, E. (1995) “Autocracy: An Invisible Dictatorship” NorthAmerican Congress on Latin America Report on the Americasvol. XXVIII, no 4.
Graham Jr., F. (1970) Since Silent Spring Fawcett World Library,New York.
Hook, W. (1994) Counting on Cars, Counting out People - ACritique of the World B anks Economic Assessment P roceduresfor the Transport Sector and their Environmental ImplicationsInstitute for Transportation and Development Policy, New York,Paper no. I-0194.
Kaufmann, V. and Guidez, J.-M. (1996) Les citadins face àl ’automobili té - Les déterminants du choix modal PublicTransport Union, Paris
Lambert, B. (1995) “Les cyclistes en milieu urbain et le nouveaumouvement d’opposition au tout-voiture en ville” Recherche ,Transports, Sécurité Institut national français de recherche surles transports et leur sécurité (INRETS), Paris, no. 47 , pp. 51-58.
____ (1998) “Le retour de la bicyclette”, The UNESCO Courier(January edition) UNESCO, Paris, pp. 30 - 32.
L’Événement du jeudi (June 12 - 18 1997) “Les transports en communcréent plus d’emplois que l’automobile” Paris, no. 658, p. 86.
Menezes, C.L. (1996 ) Desenvolv imento urbano e meio ambientePapirus Editora, São Paulo.
R e fe r e n ce s
Newman, P. (1996) “Reducing automobile dependence”Environment and Urbanization, vol. 8, no 1.
Rabinovitch, J. (1992) “Curitiba: towards sustainable urbandevelopment” Environment and Urbanization, vol. 4, no 2.
Rabinovitch, J. and Hoehn, J. (1995) “A Sustainable UrbanTransportation System: the ‘Surface Metro’ in Curitiba, Brazil”Department of Agricultural Economics, Michigan StateUniversity.
Rabinovitch, J. and Leitman, J. (1996) “Urban Planning inCuritiba” Scienti fic American.
Snell, B.C. (1974) American Ground Transport - A proposal forRestructuring the Automobile , Truck, Bus, and Rail IndustriesUnited States Senate, Washington, US Government PrintingOffice, 1974.
United Nations Centre for Human Settlements (1996) AnUrbanizing World: G lobal Report on Human Settlementsprepared for the HABITAT II conference in Istanbul, OxfordUniversity Press, Oxford.
Tunali, O. (Jan. - Feb. 1996) “A Billion Cars: The Road Ahead”,World Watch vol. 9, no. 1, World Watch Institute, Washington,D.C.
World Bank / Banque Mondiale (1994) Banque mondialeactualités World Bank, Washington, D.C, vol. XIII, no. XX, p. 1.
____ (1996) Sustainable Transport - Prioritie s for Policy ReformWorld Bank, Washington, D.C.
Lambert: From Curitiba to Quito:Reserved traffic lanes for publictransport as an ecologically, eco-nomic and social policy for cities.
World Transport Policy & Practice4/1 [1998] 40 - 46