World Steel in Figures82c70b4f-bd94-48cb-8539... · page 2 The largest steel producing companies,...
24
I NTERNATIONAL I RON AND S TEEL I NSTITUTE 2003 Edition World Steel in Figures
Transcript of World Steel in Figures82c70b4f-bd94-48cb-8539... · page 2 The largest steel producing companies,...

I N T E R N A T I O N A L
I R O N A N D
S T E E L
I N S T I T U T E
s
2 0 0 3 E d i t i o n
World Steelin Figures
34T203_cover 07-10-2004 09:38 Pagina 23

Contents
Page
World Crude Steel Production, 1950 - 2002 1
The Largest Steel-Producing Companies, 2001 and 2002 2
The Major Steel-Producing Countries, 2001 and 2002 3
Monthly Crude Steel Production,64 Reporting Countries, 1999 - 2002 4,5
Crude Steel Production by Process, 2002 6
Continuously-Cast Steel Output, 2000 - 2002 7
Steel Production and Consumption:Geographical Distribution, 1992 8
Steel Production and Consumption:Geographical Distribution, 2002 9
World Steel Trade by Area, 2001 10
The Major Importers and Exporters of Steel, 2001 11
World Steel Exports, Analysis by Product, 1997 - 2001 12
World Trade in Steel Products, 1975 - 2001 13
World Volume of Trade, 1990 - 2001 13
Iron Ore, 2001 14
World Iron Ore Trade by Area, 2001 15
Scrap: Consumption, Trade,and Apparent Domestic Supply, 2001 16
Pig Iron, 2001 and 2002 17
Production of Direct Reduced Iron, 1996 - 2002 18
Employment in the Steel Industry, 1975 - 2002 19
Crude Steel Production per Employee 20
Apparent Steel Consumption, 1996 - 2002 21
Copyright - © - International Iron and Steel Institute, 2003URL: http://www.worldsteel.org - E-mail: [email protected]
34T203_cover 07-10-2004 09:38 Pagina 2

page 1
World crude steel production,1950 to 2002million metric tons
900
800
700
600
500
400
300
200
100
0
1950 1960 1970 1980 1990 2000
Year World
1970 595
1975 644
1980 716
1985 719
1990 770
1995 752
1996 750
1997 799
1998 777
1999 788
2000 848
2001 850
2002 902
Average growth rates
% per annum
Years World
1970-75 1.6
1975-80 2.2
1980-85 0.1
1985-90 1.4
1990-95 -0.5
1995-00 2.4
2000-02 3.2
34T203_brohure 07-10-2004 09:39 Pagina 1

page 2
The largest steel producing companies,2001 and 2002million metric tons crude steel output
2002 2001 2002 20011 44.0 1 43.2 Arcelor 41 5.0 58 3.6 Panzhihua2 34.8 4 19.2 LNM Group 42 4.9 49 4.1 Hualin3 29.8 3 26.2 Nippon Steel 43 4.9 39 4.8 CST4 28.1 2 27.8 POSCO 44 4.8 46 4.2 Baotou5 19.5 5 19.1 Shanghai Baosteel 45 4.7 41 4.7 Azovstal6 16.8 6 18.1 Corus 46 4.7 45 4.5 Stelco7 16.4 7 16.2 Thyssen Krupp 47 4.6 42 4.6 USIMINAS8 15.2 9 14.8 NKK 48 4.6 43 4.5 Erdemir Group9 15.0 8 15.0 Riva 49 4.5 61 3.4 Handan10 14.4 11 12.8 US Steel 50 4.5 44 4.5 Techint11 13.7 10 13.3 Kawasaki 51 4.4 48 4.1 Dofasco12 12.4 13 11.2 Nucor 52 4.2 47 4.2 Rautaruukki13 11.8 12 11.7 Sumitomo 53 3.9 64 3.2 Jinan14 11.5 22 7.2 Gerdau 54 3.9 57 3.7 TISCO15 11.4 14 10.8 SAIL 55 3.9 51 4.0 Zaporozstahl16 11.0 15 10.3 Magnitogorsk 56 3.9 53 3.8 SSAB17 10.5 16 10.3 China Steel 57 3.9 78 2.5 COSIPA18 10.1 17 8.8 Anshan 58 3.9 55 3.8 Chelyabinsk (Mechel)19 9.6 19 8.1 Severstal 59 3.9 62 3.2 Duferco Group20 8.6 21 7.9 Novolipetsk 60 3.8 54 3.8 Nisshin Steel21 8.2 18 8.2 Shougang 61 3.8 63 3.2 Tokyo Steel22 8.1 20 8.0 Bethlehem Steel 62 3.7 56 3.8 Lucchini23 7.6 23 7.1 Wuhan 63 3.7 65 3.2 SIDOR24 7.3 24 6.9 NISCO 64 3.6 75 2.5 Sugang25 7.3 27 6.6 INI Steel 65 3.6 60 3.4 Hadeed26 6.9 25 6.9 Krivorozstal 66 3.4 72 2.7 Anyang27 6.6 26 6.7 Kobe Steel 67 3.3 67 3.0 RINL28 6.4 28 6.0 BHP Steel 68 3.2 97 1.9 Nangang29 6.2 38 4.9 Benxi 69 3.2 68 2.9 Alchevsk30 6.1 31 5.8 Mariupol (Ilyich) 70 3.1 69 2.8 Taiyuan31 5.9 30 5.8 Polskie Huty Stali 71 3.0 91 2.0 EZZ32 5.8 34 5.3 voestalpine 72 2.9 66 3.0 AHMSA33 5.7 32 5.6 Zapsib 73 2.9 79 2.4 Laiwu34 5.4 40 4.8 Maanshan 74 2.9 87 2.1 Nosta35 5.3 35 5.2 Nizhny Tagil 75 2.9 96 1.9 Lion Group36 5.3 36 5.2 AK Steel 76 2.8 76 2.5 Nová Hut Kuncice37 5.2 33 5.4 National Steel 77 2.8 71 2.8 Celsa38 5.1 37 5.1 Salzgitter 78 2.8 83 2.2 Hylsamex39 5.1 50 4.0 CSN 79 2.8 74 2.6 Rouge Steel40 5.1 52 3.9 Tangshan 80 2.8 81 2.3 Petrovka
34T203_brohure 07-10-2004 09:39 Pagina 2

page 3
The major steel-producing countries,2001 and 2002million metric tons crude steel production
Country 2002 2001Rank Tonnage Rank Tonnage
China 1 181.6 1 150.9Japan 2 107.7 2 102.9United States 3 92.2 3 90.1Russia 4 59.8 4 59.0South Korea 5 45.4 6 43.9FR Germany 6 45.0 5 44.8Ukraine 7 33.4 7 33.1Brazil 8 29.6 9 26.7India 9 28.8 8 27.3Italy 10 26.1 10 26.5France 11 20.3 11 19.3Taiwan, China 12 18.2 12 17.3Turkey 13 16.5 15 15.0Spain 14 16.4 13 16.5Canada 15 16.0 14 15.3Mexico 16 14.1 17 13.3United Kingdom 17 11.7 16 13.5Belgium 18 11.3 18 10.8South Africa 19 9.1 19 8.8Poland 20 8.4 20 8.8Australia 21 7.5 21 7.0Iran 22 7.3 22 6.9Czech Republic 23 6.5 23 6.3Austria 24 6.2 25 5.9Netherlands 25 6.1 24 6.0Sweden 26 5.8 26 5.5Romania 27 5.5 27 4.9Kazakhstan 28 4.8 28 4.7Argentina 29 4.4 29 4.1Egypt 30 4.3 34 3.8Slovakia 31 4.3 31 4.0Venezuela 32 4.2 33 3.8Malaysia (e) 33 4.1 30 4.1Finland 34 4.0 32 3.9Saudi Arabia 35 3.6 35 3.4Indonesia (e) 36 2.8 36 2.8Luxembourg 37 2.7 37 2.7Thailand (e) 38 2.3 38 2.1Hungary 39 2.1 40 2.0
22.3 22.3World 902.2 850.3
34T203_brohure 07-10-2004 09:39 Pagina 3

page 4
Monthly crude steel production1999 to 2002million metric tons
The 64 Reporting CountriesArgentina; Australia; Austria; Belgium; Brazil; Bulgaria; Byelorussia;Canada; Chile; China; Colombia; Croatia; Cuba; Czech Republic;Denmark; Dominican Republic; Ecuador; Egypt; El Salvador;Finland; France; FR Germany; Greece; Guatemala; Hungary; India;Iran; Ireland; Italy; Japan; Kazakhstan; Libya; Luxembourg; Mexico;Moldova; Netherlands; New Zealand; Norway; Paraguay; Peru;Poland; Portugal; Qatar; Romania; Russia; Saudi Arabia; Serbia and Montenegro; Slovakia; Slovenia; South Africa; South Korea; Spain; Sweden; Taiwan, China; Trinidad and Tobago;Tunisia; Turkey; Ukraine; United Kingdom; United States; Uruguay;Uzbekistan; Venezuela and Zimbabwe.
In 2002 these 64 countries accounted for approximately 98% ofworld crude steel production.
55
65
75
85
1999 2000 2001 2002
Actual data Deseasonalised data
Total 64 reporting countries
1999 2000 2001 2002
Actual data Deseasonalised data9
11
13
15
European Union (15)
34T203_brohure 07-10-2004 09:39 Pagina 4

page 5
Monthly crude steel production1999 to 2002million metric tons
14
12
10
8
1999 2000 2001 2002
Actual data Deseasonalised data
NAFTA
10
8
6
41999 2000 2001 2002
Actual data Deseasonalised data
Japan
14
11
8
51999 2000 2001 2002
* — Actual data
China*
CIS (6)*
CIS (6) and China
34T203_brohure 07-10-2004 09:39 Pagina 5

page 6
Crude Steel Production by Process, 2002
Production Openmillion Oxygen Electric Hearth Other Total
metric tons % % % % %Austria 6.2 89.5 10.5 - - 100.0Belgium 11.3 75.0 25.0 - - 100.0Finland 4.0 76.3 23.8 - - 100.0France 20.3 61.1 38.9 - - 100.0FR Germany 45.0 70.7 29.3 - - 100.0Italy 26.1 35.8 64.2 - - 100.0Luxembourg 2.7 - 100.0 - - 100.0Netherlands 6.1 98.0 2.0 - - 100.0Spain 16.4 25.6 74.4 - - 100.0Sweden 5.8 66.3 33.7 - - 100.0United Kingdom 11.7 75.1 24.9 - - 100.0Other EU 3.0 - 100.0 - - 100.0European Union (15) 158.6 58.9 41.1 - - 100.0Czech Republic 6.5 91.9 8.1 - - 100.0Hungary 2.1 80.5 19.5 - - 100.0Poland 8.4 69.3 30.6 0.1 - 100.0Romania 5.5 52.7 47.3 - - 100.0Slovakia 4.3 93.0 7.0 - - 100.0Turkey 16.5 31.2 68.8 - - 100.0Others 4.9 39.0 60.9 - 0.1 100.0Other Europe 48.1 57.0 43.0 0.0 0.0 100.0Russia 59.8 61.4 14.9 23.7 - 100.0Ukraine 33.4 49.9 3.0 47.2 - 100.0Other former USSR 7.8 61.9 29.7 8.4 - 100.0former USSR 101.0 57.6 12.1 30.3 - 100.0Canada 16.0 59.7 40.3 - - 100.0Mexico 14.1 29.3 70.7 - - 100.0United States 92.2 49.3 50.7 - - 100.0NAFTA 122.3 48.3 51.7 - - 100.0Argentina 4.4 41.9 58.1 - - 100.0Brazil 29.6 79.8 20.2 - - 100.0Chile 1.3 79.2 20.8 - - 100.0Venezuela 4.2 - 100.0 - - 100.0Others 2.6 23.7 76.3 - - 100.0Central and 42.0 64.5 35.5 - - 100.0South AmericaEgypt 4.3 26.7 73.3 - - 100.0South Africa 9.1 54.6 45.4 - - 100.0Other Africa 2.3 20.2 79.8 - - 100.0Africa 15.7 43.5 56.5 - - 100.0Iran 7.3 29.8 70.2 - - 100.0Saudi Arabia 3.6 - 100.0 - - 100.0Other Middle East 1.3 - 100.0 - - 100.0Middle East 12.2 17.9 82.1 - - 100.0China 181.6 71.9 16.0 1.1 11.0 100.0India 28.8 50.3 42.7 6.9 - 100.0Japan 107.7 72.9 27.1 - - 100.0South Korea 45.4 54.8 45.2 - - 100.0Taiwan, China 18.2 57.3 42.7 - - 100.0Other Asia 10.7 - 100.0 - - 100.0Asia 392.4 66.0 27.8 1.0 5.1 100.0Australia 7.5 81.8 18.2 - - 100.0New Zealand 0.8 71.8 28.2 - - 100.0World 900.5 60.0 33.9 3.8 2.2 100.0
34T203_brohure 07-10-2004 09:39 Pagina 6

million metric tons % crude steel output
2000 2001 2002 2000 2001 2002Austria 5.5 5.7 6.0 96.2 96.4 96.9Belgium 11.6 10.7 11.3 99.8 99.8 99.8Finland 4.1 3.9 4.0 99.5 99.4 99.5France 19.9 18.3 19.5 95.0 94.7 96.5FR Germany 44.7 43.0 43.4 96.3 96.0 96.4Italy 25.8 25.5 25.1 96.3 96.0 96.3Luxembourg 2.5 2.6 2.7 97.5 97.2 98.6Netherlands 5.5 5.9 6.0 97.2 97.8 98.0Spain 15.3 15.9 15.9 96.5 96.5 96.8Sweden 4.6 4.9 5.1 87.2 89.1 88.8United Kingdom 14.5 13.0 11.2 95.5 96.2 95.8Other EU 3.3 2.9 3.0 99.0 99.2 99.2European Union (15) 157.2 152.4 153.2 96.2 96.2 96.6Czech Republic 5.4 5.5 5.8 87.1 87.1 89.0Hungary 1.9 2.0 2.0 100.0 100.0 99.8Poland 6.2 5.2 6.0 59.1 59.0 71.7Romania 3.1 3.2 3.6 65.3 65.5 65.9Slovakia 3.7 4.0 4.3 99.3 99.4 99.5Turkey 14.1 15.0 16.5 98.7 99.9 100.0Others 3.3 3.1 3.2 65.4 64.3 66.2Other Europe 37.8 38.0 41.3 81.3 82.8 86.3Russia 29.4 30.0 32.5 49.7 50.9 54.3Ukraine 6.2 6.6 6.6 19.6 19.8 19.9Other former USSR 3.3 3.4 2.9 40.6 41.7 37.7former USSR 38.9 39.9 42.1 39.3 39.9 41.7Canada 16.2 14.9 15.6 97.8 97.6 97.7Mexico 14.8 13.1 14.0 94.7 98.6 99.7United States 98.1 87.3 89.5 96.4 96.9 97.0NAFTA 129.1 115.3 119.1 96.4 97.2 97.4Argentina 4.4 4.0 4.3 98.1 97.9 98.0Brazil 25.1 24.5 27.4 90.2 91.6 92.6Venezuela 3.8 3.8 4.2 100.0 100.0 100.0Other Latin America 3.4 3.2 3.3 83.6 85.0 86.0Central and 36.7 35.5 39.2 91.3 92.5 93.3South AmericaEgypt 2.8 3.7 4.2 96.9 97.4 97.7South Africa 8.3 8.7 9.0 98.2 98.2 98.4Other Africa 1.5 1.1 1.1 94.9 87.9 91.1Africa 12.5 13.4 14.3 97.5 97.0 97.6Iran 6.6 6.9 7.3 100.0 100.0 100.0Saudi Arabia 3.0 3.4 3.6 100.0 100.0 100.0Other Middle East 1.0 1.2 1.3 100.0 100.0 100.0Middle East 10.6 11.5 12.2 100.0 100.0 100.0China 111.1 135.6 167.9 87.3 89.9 92.5India 16.4 17.3 18.8 60.9 63.3 65.2Japan 103.6 100.3 105.3 97.3 97.5 97.8South Korea 42.5 43.2 44.8 98.6 98.5 98.6Taiwan, China 16.8 17.2 18.1 99.4 99.5 99.5Other Asia 9.6 9.9 10.0 100.0 100.0 100.0Asia 300.0 323.5 365.0 90.8 91.9 93.2Australia 7.1 7.0 7.5 99.4 99.4 99.4New Zealand 0.8 0.8 0.8 108.9 100.0 100.0World 730.7 737.3 794.5 86.5 87.1 88.4
page 7
Continuously-Cast Steel Output,2000 to 2002
34T203_brohure 07-10-2004 09:39 Pagina 7

page 8
Steel production and consumption:geographical distribution, 1992World Total: 771 million metric tons crude steel
Production
Others comprise:Africa 1.7% Central and South America 4.4%Middle East 0.5% Australia and New Zealand 0.9%
Other Asia9.5%
Others8.4%
EU (15)19.9%
Other Europe6.46.4%6.4%
former USSR16.3%
NAFTA14.8%
China11.2%
Japan13.6%
Consumption (crude steel equivalent)
Others comprise:Africa 2.0% Central and South America 3.0%Middle East 1.6% Australia and New Zealand 0.9%
Other Asia13.9%
Others8.0% EU (15)
19.0%
Other Europe4.2%
former USSR12.8%
NAFTA16.8%
China11.9%
Japan13.4%
34T203_brohure 07-10-2004 09:39 Pagina 8

page 9
Steel production and consumption:geographical distribution, 2002World Total: 845 million metric tons crude steel
Production
Others comprise:Africa 1.5% Central and South America 4.5%Middle East 1.2% Australia and New Zealand 1.1%
Other Asia11.5%
Others8.7% EU (15)
17.6%
Other Europe5.3%
former USSR11.2%
NAFTA13.6%
China20.1%
Japan11.9%
Consumption (crude steel equivalent)
Others comprise:Africa 2.0% Central and South America 3.5%Middle East 2.0% Australia and New Zealand 0.9%
Other Asia15.9%
Others8.6% EU (15)
16.8%Other Europe
4.4%
former USSR3.7%
NAFTA16.0%
China25.8%
Japan8.8%
34T203_brohure 07-10-2004 09:39 Pagina 9

page 10
World steel trade by area,2001million metric tons
European Union (15)
Other Europe
former USSR
North America
Latin America
Africa
Middle East
China
Japan
Other Asia
Oceania
Total Exports
of which: extra-regional exports*
Net Exports(exports-imports)
Euro
pean
Uni
on (1
5)
Oth
er E
urop
e
form
er U
SSR
Nor
th A
mer
ica
Latin
Am
eric
a
Afric
a &
Mid
dle
East
Chin
a
Japa
n
Oth
er A
sia
Oce
ania
Tota
l Im
port
s
of w
hich
:ex
tra-
regi
onal
impo
rts*
75.5
13.0
2.4
6.3
1.6
2.6
1.9
0.7
0.1
2.6
0.2
106.3
31.3
3.6
13.7
4.0
2.3
1.9
0.8
1.4
3.0
0.5
0.0
1.1
0.0
28.6
24.6
3.7
7.7
7.1
4.3
2.4
3.1
4.6
8.5
9.0
0.1
10.0
0.0
56.7
52.4
47.6
0.2
0.0
0.0
7.9
1.8
0.1
0.1
0.0
0.0
0.3
0.0
10.5
2.6
-23.4
1.7
0.1
0.0
7.1
2.3
0.1
4.6
0.3
0.0
2.4
0.0
18.6
16.3
6.7
1.6
0.0
0.0
0.7
0.3
1.7
0.2
0.5
0.0
3.3
0.1
8.5
6.5
-23.7
0.4
0.1
0.0
1.0
0.1
0.1
0.2
-
0.3
5.0
0.1
7.2
7.2
-18.4
1.8
0.3
0.1
2.4
1.3
0.4
1.5
4.4
-
17.8
0.5
29.5
29.5
25.5
1.5
0.4
0.0
4.2
0.7
0.2
1.1
10.1
3.6
10.0
0.5
32.1
22.0
-20.8
0.1
0.0
0.0
0.1
0.1
0.1
0.0
0.0
0.0
0.3
0.3
1.0
0.7
-0.7
102.7
24.9
9.0
33.9
11.9
11.1
21.0
25.6
4.0
52.9
1.7
298.8
193.1
27.7
20.9
4.7
26.0
9.6
9.4
20.3
25.8
4.0
42.9
1.4
193.1
* - excluding intra-regional trade marked
Destination
ExportingRegion
34T203_brohure 07-10-2004 09:39 Pagina 10

page 11
The major importers and exporters of steel,2001million metric tons
Rank Total Exports Rank Total Imports
1 Japan 29.5 1 United States 27.82 Russia 25.6 2 China 25.63 Ukraine 24.4 3 FR Germany 19.04 FR Germany 23.9 4 Italy 17.25 Belgium-Luxembourg 20.5 5 France 16.16 France 16.9 6 Belgium-Luxembourg 11.57 South Korea 14.0 7 South Korea 10.78 Italy 11.8 8 Spain 10.09 Turkey 10.6 9 Taiwan, China 8.3
10 Brazil 9.3 10 Hong Kong 8.211 Taiwan, China 8.0 11 United Kingdom 8.112 China 7.5 12 Thailand 7.213 United Kingdom 6.9 13 Canada 6.314 Netherlands 6.2 14 Netherlands 5.615 Spain 5.9 15 Turkey 5.516 United States 5.7 16 Mexico 5.317 Austria 5.1 17 Iran 4.718 Canada 4.6 18 Malaysia 4.619 Czech Republic 4.4 19 Japan 4.120 South Africa 4.3 20 Vietnam 3.5
Net Exports Net ImportsRank (exports-imports) Rank (imports-exports)
1 Japan 25.4 1 United States 22.12 Ukraine 24.0 2 China 18.13 Russia 22.5 3 Hong Kong 5.84 Belgium-Luxembourg 9.1 4 Thailand 5.65 Brazil 8.2 5 Italy 5.46 Turkey 5.1 6 Iran 4.17 FR Germany 4.8 7 Spain 4.18 South Africa 4.0 8 Vietnam 3.59 South Korea 3.3 9 Philippines 2.8
10 Kazakhstan 2.9 10 Portugal 2.411 Austria 2.3 11 Singapore 2.312 Slovakia 2.2 12 United Arab Emirates 2.213 Czech Republic 1.5 13 Malaysia 2.114 India 1.4 14 Indonesia 2.115 Argentina 1.3 15 Greece 2.0
34T203_brohure 07-10-2004 09:39 Pagina 11
page 12
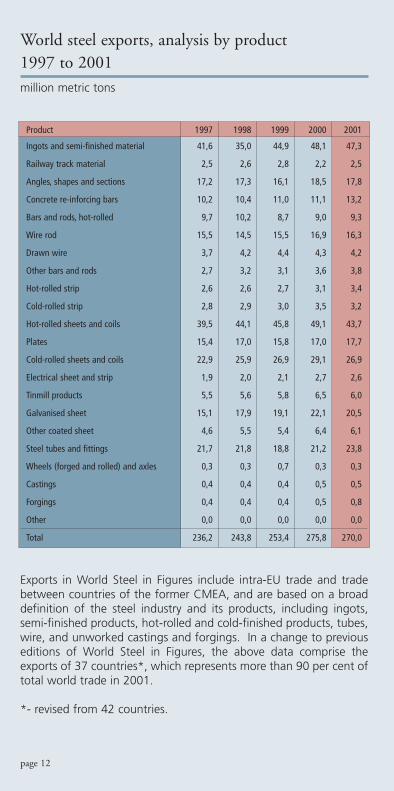
World steel exports, analysis by product1997 to 2001million metric tons
Product 1997 1998 1999 2000 2001
Ingots and semi-finished material 41,6 35,0 44,9 48,1 47,3
Railway track material 2,5 2,6 2,8 2,2 2,5
Angles, shapes and sections 17,2 17,3 16,1 18,5 17,8
Concrete re-inforcing bars 10,2 10,4 11,0 11,1 13,2
Bars and rods, hot-rolled 9,7 10,2 8,7 9,0 9,3
Wire rod 15,5 14,5 15,5 16,9 16,3
Drawn wire 3,7 4,2 4,4 4,3 4,2
Other bars and rods 2,7 3,2 3,1 3,6 3,8
Hot-rolled strip 2,6 2,6 2,7 3,1 3,4
Cold-rolled strip 2,8 2,9 3,0 3,5 3,2
Hot-rolled sheets and coils 39,5 44,1 45,8 49,1 43,7
Plates 15,4 17,0 15,8 17,0 17,7
Cold-rolled sheets and coils 22,9 25,9 26,9 29,1 26,9
Electrical sheet and strip 1,9 2,0 2,1 2,7 2,6
Tinmill products 5,5 5,6 5,8 6,5 6,0
Galvanised sheet 15,1 17,9 19,1 22,1 20,5
Other coated sheet 4,6 5,5 5,4 6,4 6,1
Steel tubes and fittings 21,7 21,8 18,8 21,2 23,8
Wheels (forged and rolled) and axles 0,3 0,3 0,7 0,3 0,3
Castings 0,4 0,4 0,4 0,5 0,5
Forgings 0,4 0,4 0,4 0,5 0,8
Other 0,0 0,0 0,0 0,0 0,0
Total 236,2 243,8 253,4 275,8 270,0
Exports in World Steel in Figures include intra-EU trade and tradebetween countries of the former CMEA, and are based on a broaddefinition of the steel industry and its products, including ingots,semi-finished products, hot-rolled and cold-finished products, tubes,wire, and unworked castings and forgings. In a change to previouseditions of World Steel in Figures, the above data comprise theexports of 37 countries*, which represents more than 90 per cent oftotal world trade in 2001.
*- revised from 42 countries.
34T203_brohure 07-10-2004 09:39 Pagina 12

page 13
World trade in steel products,1975 to 2001million metric tons finished steel
Exports are of finished and semi-finished steel products. Productionof finished steel, where not available from national sources, is calcu-lated from crude steel production, taking into account the continu-ous casting ratio.
350
300
250
200
150
100
50
01975 1980 1985 1990 1995 2000
World volume of trade1990 to 2001Quantum indices 1990 = 100
Year Exports Production Exports %
1976 126.1 533.7 23.6
1977 127.9 536.5 23.8 1978 138.6 571.7 24.2 1979 143.1 598.7 23.9 1980 140.6 578.7 24.3
1981 142.8 574.3 24.9 1982 135.5 528.7 25.6 1983 145.3 546.5 26.6 1984 158.8 588.4 27.0 1985 171.0 599.0 28.5
1986 161.7 597.4 27.1 1987 162.3 615.5 26.4 1988 171.1 656.8 26.1 1989 171.2 664.4 25.8 1990 171.0 654.0 26.2
1991 177.1 634.6 27.9 1992 196.1 632.6 31.0 1993 222.5 639.3 34.8 1994 238.6 631.0 37.8 1995 246.7 658.5 37.5
1996 236.3 660.0 35.8 1997 267.9 701.4 38.2 1998 270.4 685.1 39.5 1999 281.0 696.5 40.3 2000 306.2 750.7 40.8
2001 299.9 753.7 39.8
manufactured goodssteelall commodities
220
190
160
130
10090 92 94 96 98 00
34T203_brohure 07-10-2004 09:39 Pagina 13

Fe ApparentContent (1) Production - Exports + Imports = Consumption
Austria (32) 1.9 0.0 3.1 5.0Belgium-Luxembourg .. - 0.0 11.2 11.2France (33) - 0.1 16.7 16.7FR Germany (28) - 0.0 40.1 40.1Italy .. - 0.0 15.4 15.4Netherlands .. - 0.0 8.3 8.2Spain (48) - 0.0 5.9 5.9Sweden (63) 19.5 13.3 0.1 6.3United Kingdom (27) - 0.0 15.4 15.4Other EU .. - 0.1 4.1 4.0European Union (15) 21.4 13.5 120.2 128.1former CSFR 0.4 - 13.8 14.2Norway (65) 0.5 0.4 0.3 0.4Poland - - 8.3 8.3Other Europe .. 4.6 0.6 13.0 16.9Europe 26.9 14.6 155.6 167.9former USSR (60) 152.0 50.0 21.4 123.4Canada (63) 27.9 22.0 5.7 11.7Mexico (65) 16.5 - 2.1 18.6United States (60) 45.8 5.7 10.6 50.8NAFTA 90.2 27.6 18.5 81.0Brazil (66) 208.7 155.7 0.0 53.0Chile (61) 8.0 6.0 0.0 2.0Peru (60) 4.5 4.1 0.0 0.4Venezuela (64) 19.0 6.9 0.0 12.1Other America .. 0.5 1.9 7.8 6.4Central and South America 240.7 174.6 7.8 73.8Mauritania (65) 10.3 10.1 - 0.2South Africa (65) 34.8 23.5 0.5 11.8Other Africa .. 4.6 0.1 5.4 9.9Africa 49.7 33.7 5.9 21.9Middle East 12.1 0.3 8.6 20.3China (28) 217.0 0.0 92.4 309.4India (61) 79.2 37.2 0.3 42.3Japan (57) - - 126.3 126.3South Korea .. 0.0 0.1 39.5 39.5Other Asia .. 1.8 3.3 21.6 20.1Asia 298.0 40.6 280.1 537.5Australia (65) 180.5 157.2 2.1 25.4New Zealand and .. 1.6 1.3 0.0 0.4Other OceaniaWorld 1,051.8 500.0 500.0 1,051.8
page 14
Iron ore,2001million metric tons actual weight
(1) of domestic production: percentage Fe of total weight.
34T203_brohure 07-10-2004 09:39 Pagina 14

page 15
World iron ore trade by area,2001million metric tons actual weight
European Union (15)
Other Europe
former USSR
NAFTA
Central andSouth America
Africa andMiddle East
China
Japan
Other Asia
Oceania
Total Exports
of which: extra-regional exports*
Net Exports(exports-imports)
Euro
pean
Uni
on (1
5)
Oth
er E
urop
e
form
er U
SSR
NAF
TA
Cent
ral a
nd S
outh
Am
eric
a
Afric
a &
Mid
dle
East
Asia
Oce
ania
Tota
l Im
port
s
of w
hich
:ex
tra-
regi
onal
impo
rts*
10.1
0.9
-
0.2
0.0
2.4
-
0.0
0.0
-
13.5
3.5
-106.7
0.9
-
-
0.0
-
-
-
-
0.1
-
1.0
1.0
-34.2
4.1
24.4
21.4
0.0
-
-
0.1
-
-
-
50.0
28.6
28.6
11.9
0.4
-
10.1
1.2
0.1
0.6
0.9
1.5
1.0
27.6
17.6
9.2
60.7
6.4
-
7.6
6.6
11.1
30.3
31.7
19.8
0.3
174.6
168.0
166.9
16.3
1.2
-
0.2
-
0.2
9.4
5.6
1.2
-
34.0
33.9
19.6
1.0
0.8
-
-
-
0.6
13.9
19.9
3.7
0.8
40.6
3.2
-20.8
15.2
1.4
-
0.4
-
-
38.0
68.3
35.2
0.0
158.5
158.5
156.4
120.2
35.4
21.4
18.5
7.8
14.5
92.4
126.3
61.4
2.1
500.0
414.2
110.2
35.4
0.0
8.4
1.2
14.3
78.5
106.4
57.7
2.1
414.2
* - excluding intra-regional trade marked
Destination
ExportingRegion
34T203_brohure 07-10-2004 09:39 Pagina 15

page 16
Scrap: consumption, trade, and apparentdomestic supply, 2001million metric tons
ApparentConsumption - Imports + Exports = Domestic
Supply
Austria 2.1 0.8 0.8 2.0
Belgium-Luxembourg 6.9 5.6 2.0 3.3
Finland 1.5 0.5 0.4 1.4
France 10.3 3.0 4.3 11.7
FR Germany 19.1 3.6 6.6 22.2
Italy 19.6 4.3 0.2 15.4
Netherlands 1.3 1.3 3.2 3.2
Spain 13.9 6.3 0.0 7.6
Sweden 2.6 0.4 0.6 2.8
United Kingdom 5.0 0.2 4.8 9.7
Other EU 3.1 1.3 1.1 3.0European Union (15) 85.5 27.2 23.9 82.2
Bulgaria 1.1 - - 1.1
Czech Republic 2.3 - - 2.3
Hungary 0.8 - - 0.8
Poland 4.3 - - 4.3
Romania 2.7 - - 2.7
Slovakia 1.5 - - 1.5
Turkey 13.2 5.1 - 8.2
Others 2.7 0.6 0.6 2.7Other Europe 28.5 5.6 0.6 23.5former U.S.S.R. 42.2 0.1 10.6 52.6
Canada 8.0 1.1 1.9 8.8
Mexico 6.2 1.5 0.2 4.8
United States 52.2 2.6 7.4 57.0NAFTA 66.4 5.3 9.6 70.7
Argentina 1.4 - - 1.4
Brazil 7.0 - - 7.0
Venezuela 1.3 - - 1.3
Other Central and South America 0.4 - - 0.4Central and South America 11.9 - - 11.9
South Africa 1.8 - - 1.8
China 49.5 9.8 0.0 39.7
Japan 40.8 0.2 6.2 46.8
South Korea 22.4 8.1 0.1 14.3
Taiwan, China 9.1 - - 9.1
Other Asia 12.9 1.1 - 11.8Asia 134.7 19.2 6.2 121.8
Australia 2.5 0.0 1.0 3.5World 373.4 57.4 51.9 368.0
34T203_brohure 07-10-2004 09:39 Pagina 16

page 17
Pig iron,2001 and 2002million metric tons
ApparentProduction Production - Exports + Imports = Consumption
2002 2001 2001 2001 2001
Austria 4.6 4.4 0.0 0.0 4.4Belgium-Luxembourg 8.0 7.7 0.1 0.2 7.8Finland 2.8 2.9 0.0 0.0 2.9France 13.5 12.3 0.0 0.2 12.5FR Germany 29.4 29.2 0.1 0.3 29.4Italy 9.8 11.2 0.0 1.3 12.5Netherlands 5.4 5.3 0.1 0.1 5.4Portugal 0 0.1 0.0 0.0 0.1Spain 4.0 4.2 0.0 0.3 4.5Sweden 3.7 3.6 0.0 0.0 3.6United Kingdom 8.6 9.9 0.0 0.2 10.0European Union (15) 89.8 90.8 0.4 2.9 93.3Bulgaria 1.1 1.2 - - 1.2Czech Republic 4.8 4.7 - - 4.7Hungary 1.3 1.2 - - 1.2Poland 5.3 5.4 - - 5.4Romania 2.5 3.1 - - 3.1Slovakia 3.5 3.3 - - 3.3Turkey 5.0 5.3 - - 5.3Others 0.6 0.6 0.0 0.1 0.7Other Europe 24.3 24.7 0.0 0.1 24.8Kazakhstan 3.9 3.9 - - 3.9Russia 46.2 44.9 5.8 0.0 39.2Ukraine 27.1 26.4 - - 26.4Other former USSR - - - - 0.0former USSR 77.2 75.2 5.8 0.0 69.4Canada 8.7 8.3 0.1 0.1 8.3Mexico 4.0 4.4 0.1 1.0 5.2United States 40.2 42.1 0.0 4.4 46.4NAFTA 52.9 54.8 0.3 5.4 59.9Argentina 2.2 1.9 - - 1.9Brazil 29.6 27.4 - 0.0 27.4Chile 1.0 0.9 - - 0.9Other Latin America 0.6 0.7 - - 0.7Central and 33.4 30.9 - 0.0 30.9South AmericaEgypt 1.7 1.4 - - 1.4South Africa 5.8 5.8 - - 5.8Other Africa 0.4 1.6 - - 1.6Africa 7.8 8.8 - - 8.8Iran 2.2 2.2 - - 2.2
China 170.7 147.1 0.7 0.5 146.9India 24.3 21.9 0.3 0.0 21.6Japan 81.0 78.8 0.5 0.2 78.5South Korea 26.6 25.9 0.0 1.4 27.3Taiwan, China 10.2 10.0 - - 10.0Other Asia 1.3 1.3 0.0 0.4 1.7Asia 314.1 285.0 1.5 2.5 286.0Australia 6.1 6.0 0.0 0.0 6.0New Zealand 0.6 0.6 - - 0.6World 608.4 579.0 8.0 10.9 582.0
34T203_brohure 07-10-2004 09:39 Pagina 17

page 18
Direct reduced iron production,1997 - 2002million metric tons
1997 1998 1999 2000 2001 2002
FR Germany 0.47 0.45 0.40 0.46 0.21 0.54
Sweden 0.13 0.12 0.12 0.13 0.11 0.11
European Union (15) 0.60 0.57 0.52 0.58 0.32 0.65
Russia 1.73 1.73 1.88 1.92 2.51 2.91
Canada 1.39 1.24 0.92 1.13 0.00 0.18
Mexico 4.44 5.58 6.07 5.59 3.67 4.57
United States 0.51 1.60 1.67 1.56 0.12 0.47
NAFTA 6.34 8.43 8.66 8.27 3.79 5.22
Argentina 1.50 1.54 0.99 1.42 1.28 1.48
Brazil 0.32 0.34 0.40 0.41 0.34 0.36
Peru 0.07 0.06 0.05 0.08 0.06 0.03
Trinidad and Tobago 1.14 1.02 1.38 1.52 2.03 2.32
Venezuela 5.61 5.42 5.07 6.41 5.47 3.61
Central and 8.64 8.38 7.88 9.85 9.19 7.79
South America
Egypt 1.19 1.61 1.67 2.11 2.37 2.53
Libya 1.01 1.00 1.30 1.49 1.06 1.16
Nigeria 0.00 - - - - -
South Africa 1.12 1.07 1.26 1.53 1.56 1.70
Africa 3.31 3.68 4.23 5.12 4.99 5.39
Iran 4.33 3.51 4.03 4.54 5.00 5.28
Qatar 0.56 0.71 0.67 0.62 0.73 0.75
Saudi Arabia 2.11 2.27 2.34 3.06 2.88 3.28
Middle East 7.00 6.48 7.04 8.22 8.61 9.31
China 0.07 0.08 0.11 0.05 0.11 0.22
India 5.12 5.12 5.29 5.50 5.72 5.73
Indonesia 1.53 1.57 1.74 1.74 1.49 1.50
Malaysia 1.49 0.88 0.95 1.24 1.02 1.08
Myanmar 0.04 0.04 0.03 0.04 0.04 0.04
Asia 8.25 7.69 8.12 8.56 8.38 8.57
Australia - - 0.32 0.33 1.37 1.02
World 35.87 36.96 38.65 42.85 39.16 40.87
34T203_brohure 07-10-2004 09:39 Pagina 18

page 19
Employment in the steel industry1975 - 2002thousand at end of year
1975 1980 1985 1990 1995 2000 2001 2002
Austria 42 39 34 21 13 12 12 12
Belgium 58 45 35 26 24 20 21 19
Denmark 3 2 2 1 1 1 1 1
Finland 14 15 10 10 7 9 9 9
France 156 105 76 46 39 37 37 37
FR Germany (1) 213 197 151 125 93 77 76 74
Greece 0 4 4 3 3 2 2 2
Ireland 0 1 1 1 0 0 0 0
Italy 96 100 67 56 42 39 38 37
Luxembourg 21 15 13 9 6 4 4 4
Netherlands 25 21 19 17 13 12 11 11
Portugal 5 7 6 4 3 2 1 1
Spain 91 81 54 36 25 22 22 23
Sweden 51 48 31 26 21 20 19 19
United Kingdom 184 112 59 51 38 27 26 21
European Union 958 792 561 434 328 284 280 269
Serbia and
Montenegro (2) 74 n/a 56 69 17 15 10 9
Canada 54 61 69 53 56 58 56 58
United States 457 399 238 204 171 151 140 124
Brazil 124 132 133 115 78 65 65 65
South Africa 71 70 65 54 39 24 20 19
Japan 447 380 349 305 252 197 186 176
South Korea n/a n/a n/a 67 67 57 57 57
Australia 38 n/a 30 30 22 21 20 19
Total of above 2 223 1 834 1 500 1 331 1 030 872 834 796
(1) - includes former German Democratic Republic after 1990.(2) - Yugoslavia 1975-1990Totals are rounded. United States figures are averages for 12 months. Various otherdifferences in coverage and definition exist, so that inter-country comparisons are ofdubious value.
34T203_brohure 07-10-2004 09:39 Pagina 19

page 20
Crude steel production per employee
metric tons
1970
1980
1990
2002
0 400 600 800
0 400 600 800200
1970
1980
1990
2002
0 400 600 800200
1970
1980
1990
2002
EU (15)
United States and Canada
Japan
34T203_brohure 07-10-2004 09:39 Pagina 20

page 21
Apparent Steel Consumption,1996 to 2002million metric tons finished steel products
1996 1997 1998 1999 2000 2001 2002Austria 2.8 3.5 3.9 3.8 4.2 3.9 4.3Belgium-Luxembourg 3.7 3.9 4.3 3.9 4.1 3.6 3.7France 14.0 15.5 16.6 16.5 18.0 16.5 16.3FR Germany 31.6 34.0 34.6 35.2 37.0 35.6 34.2Italy 23.3 27.5 29.3 29.6 30.6 30.1 29.1Netherlands 4.6 4.7 5.6 5.1 4.7 4.5 4.3Spain 11.6 13.7 15.6 17.5 17.4 18.9 19.3Sweden 2.9 3.1 3.5 3.5 3.6 3.1 3.1United Kingdom 13.1 14.0 14.5 13.5 13.1 13.3 12.6Other EU 8.3 9.7 10.2 9.8 11.2 10.8 11.0European Union (15) 115.8 129.6 138.1 138.3 144.0 140.3 137.9Czech Republic 3.2 3.7 3.7 3.3 3.9 4.0 4.1Poland 6.1 6.1 6.6 6.7 7.6 7.1 6.9Romania 3.5 3.3 2.8 2.1 2.6 2.7 2.8Turkey 10.1 11.9 12.1 11.0 12.7 11.0 13.2Others 8.6 9.0 9.3 8.5 8.6 8.8 9.1Other Europe 31.5 34.0 34.5 31.6 35.3 33.6 36.1Europe 147.3 163.6 172.6 169.9 179.3 173.9 174.0Russia 16.4 15.6 15.4 19.8 22.5 24.2 21.4Ukraine 5.4 4.1 3.0 2.4 2.1 2.7 2.7Other former USSR 4.9 6.1 3.5 3.6 5.7 6.1 6.0former USSR 26.7 25.8 21.9 25.8 30.3 33.0 30.1Canada 13.3 15.4 15.8 16.2 17.8 15.2 15.8Mexico 8.0 11.1 12.6 12.8 14.1 13.1 13.9United States 103.1 108.0 115.7 110.9 114.7 101.6 101.7NAFTA 124.4 134.5 144.1 139.9 146.6 129.9 131.4Argentina 3.2 3.7 3.8 3.1 3.0 2.6 1.8Brazil 13.0 15.3 14.5 14.1 15.8 16.7 16.5Venezuela 2.1 2.5 1.9 1.7 2.2 2.2 2.0Others 4.0 4.3 4.3 3.0 4.0 7.2 7.1Central and 22.3 25.8 24.5 21.9 24.9 28.7 27.5South AmericaEgypt 3.9 4.6 4.6 5.1 4.0 4.4 3.7South Africa 4.0 4.5 4.0 3.8 4.0 4.2 4.9Other Africa 5.4 6.0 7.7 6.0 7.1 7.4 7.4Africa 13.3 15.0 16.4 14.9 15.1 16.0 15.9Iran 5.7 6.9 5.7 6.1 7.8 6.9 7.2Other Middle East 8.5 9.0 10.1 10.2 9.9 11.8 12.5Middle East 14.2 15.9 15.8 16.2 17.7 18.7 19.7China 97.3 103.5 113.9 130.8 141.2 174.2 211.2India 22.8 22.9 23.2 25.1 26.3 27.1 29.5Japan 80.6 82.1 70.3 68.9 76.1 73.2 72.0South Korea 37.6 38.1 24.7 33.8 38.5 38.3 43.7Taiwan, China 18.0 21.0 20.2 20.4 21.1 17.7 20.4Other Asia 40.6 42.9 28.9 31.5 35.2 36.2 36.8Asia 296.9 310.5 281.3 310.5 338.5 366.6 413.6Australia and 6.5 6.5 6.6 6.6 6.3 6.2 7.0New ZealandWorld 651.6 697.6 683.2 705.7 758.7 773.0 819.2
34T203_cover 07-10-2004 09:38 Pagina 21

Complete booklet available on lineat http://www.worldsteel.org
Founded in 1967, the International Iron and Steel Institute (IISI) is a non-profit research organisation whose members are steel-producingcompanies, national or regional steel federations, and steel researchorganisations in more than 50 countries. Together the countries inwhich IISI steel-producing member companies are located account forover 70 percent of total world steel production.
IISI undertakes research into economic, financial, technological,environmental and promotional aspects of world steel and into variousraw materials and human resources matters on behalf of its members.It also collects, evaluates and disseminates world steel statistics.
INTERNATIONAL IRON AND STEEL INSTITUTE
Rue Colonel Bourg 120 - B-1140 Brussels - Belgium
34T203_cover 07-10-2004 09:38 Pagina 22